fundamentals of water well design, construction and testing 3rd engine… · fundamentals of water...
TRANSCRIPT

Fundamentals of Water Well Design, Construction and
Testing
Dan Matlock, Principal Hydrogeologist Pacific Groundwater Group ~ Seattle, WA
Discussion Overview
Planning for a New Supply Well Well Design Considerations Well Drilling Methods Well Screen Design and Development Well Testing
Planning for a New Supply Well
Determine location for supply opportunities (USGS & consultant reports, well logs, geologic maps, cross sections)
Assess aquifer properties (depth, thickness, SWL, available drawdown, transmissivity, well yield & specific capacity)
Review available water quality (Fe, Mn, organic content, Na, Cl, TDS, NO3, other contaminants)
Assess Design and Drilling Approaches
Develop generalize design (depth, potential well yield, diameter, seal locations, sand pack or natural design) Select drilling method based on soil
conditions, well depth, design, and costs Prepare cost estimates and replan as
necessary

WSD Example (Vancouver) Lack of planning compromised the yield of a
GWHP well system Wells installed with wrong drilling method Wells completed in wrong aquifer Well design did not allow corrective actions for
sand pumping problems Solution to problem was to install replacement
wells Cost to State was approximately $500K
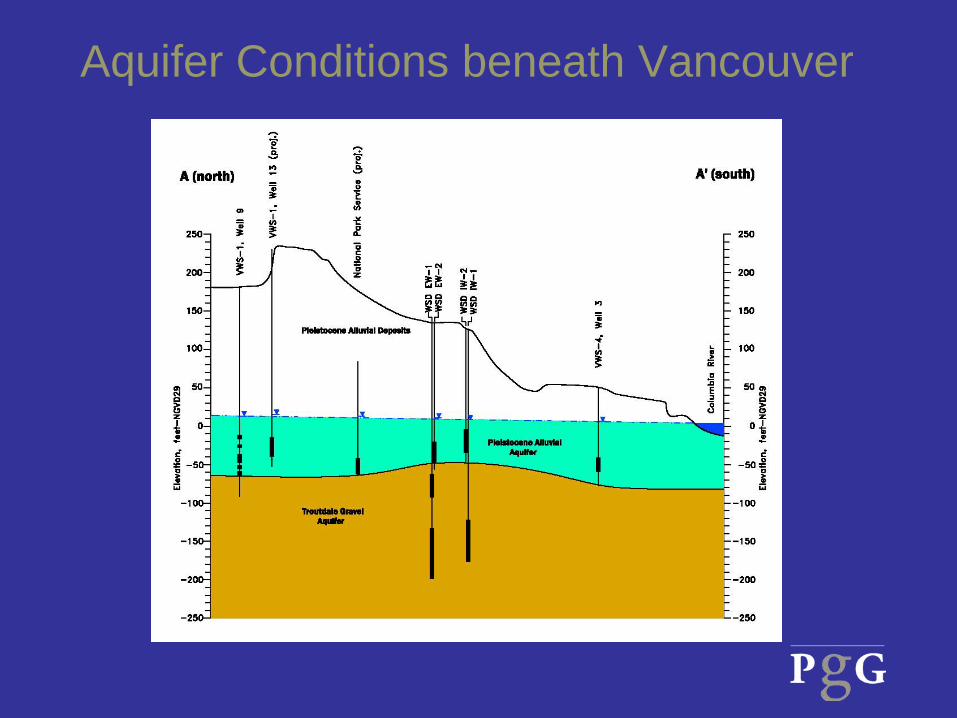
Aquifer Conditions beneath Vancouver
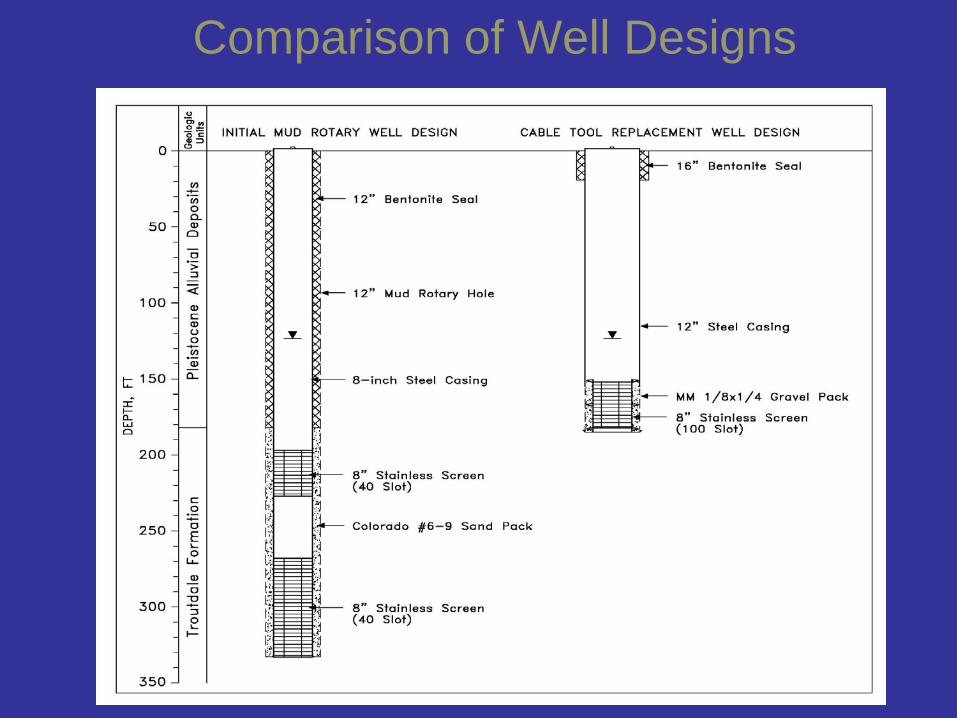
Comparison of Well Designs

Well Components
Well seals Casing/liner Drive shoe Well screen assembly Optional sand/gravel pack
Well Sealing
Minimum 18-foot sanitary seal seated into fine-grained unit Install deeper seals as necessary to avoid
interaquifer connections May need deep seal or several casing
reductions to avoid interaquifer connection Complete well in a single aquifer
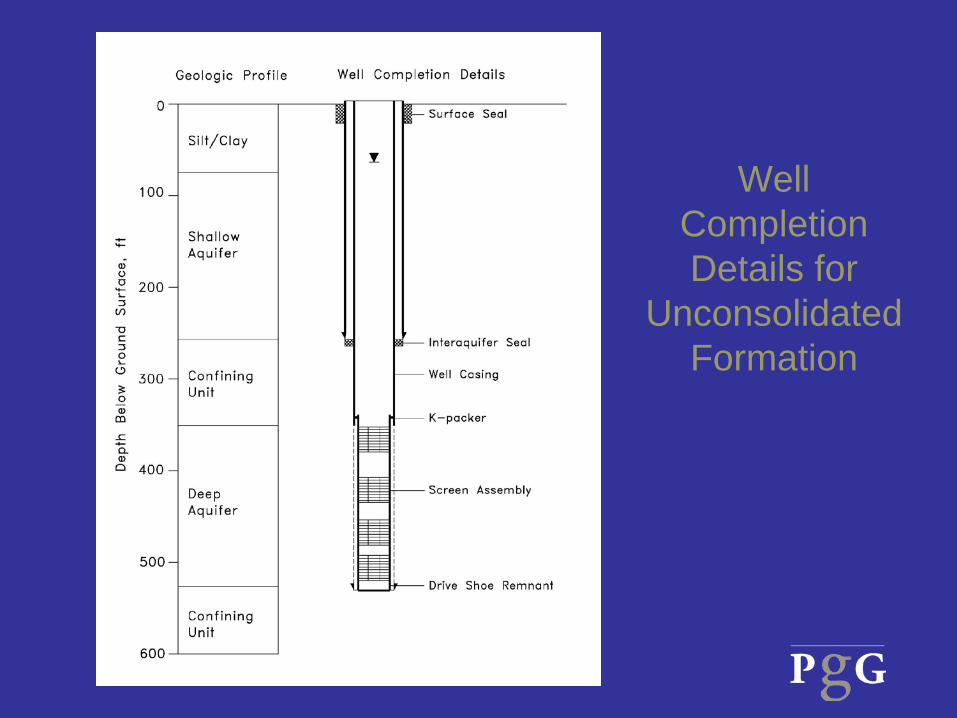
Well Completion Details for
Unconsolidated Formation

Well Completion Details for
Consolidated Formation

Water Well Drilling Methods
Cable tool Air rotary Mud rotary Flooded reverse circulation dual rotary
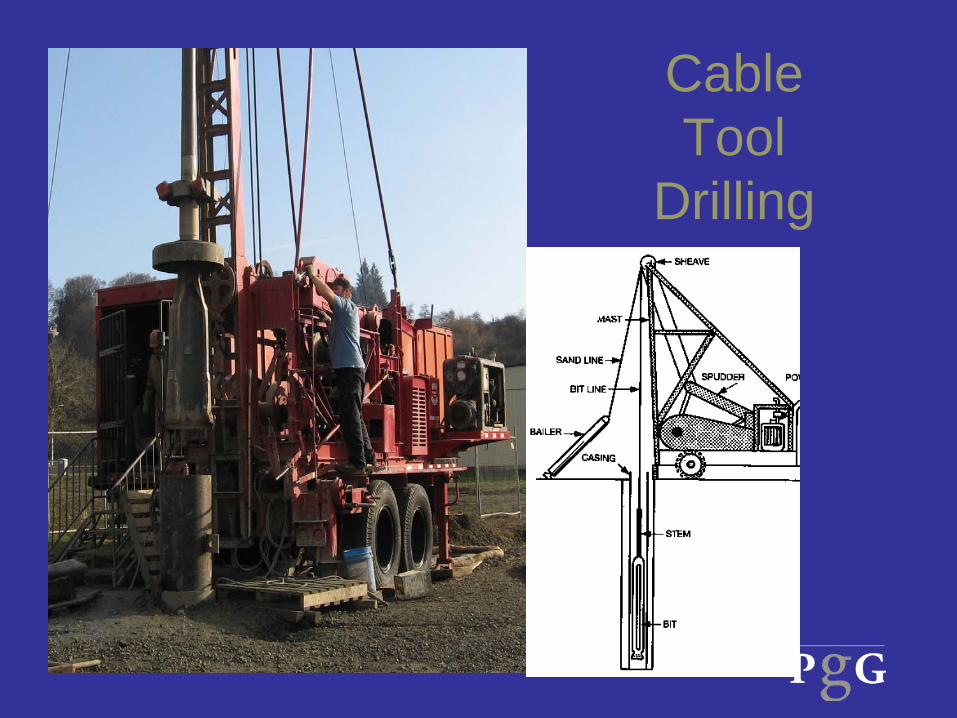
Cable Tool
Drilling
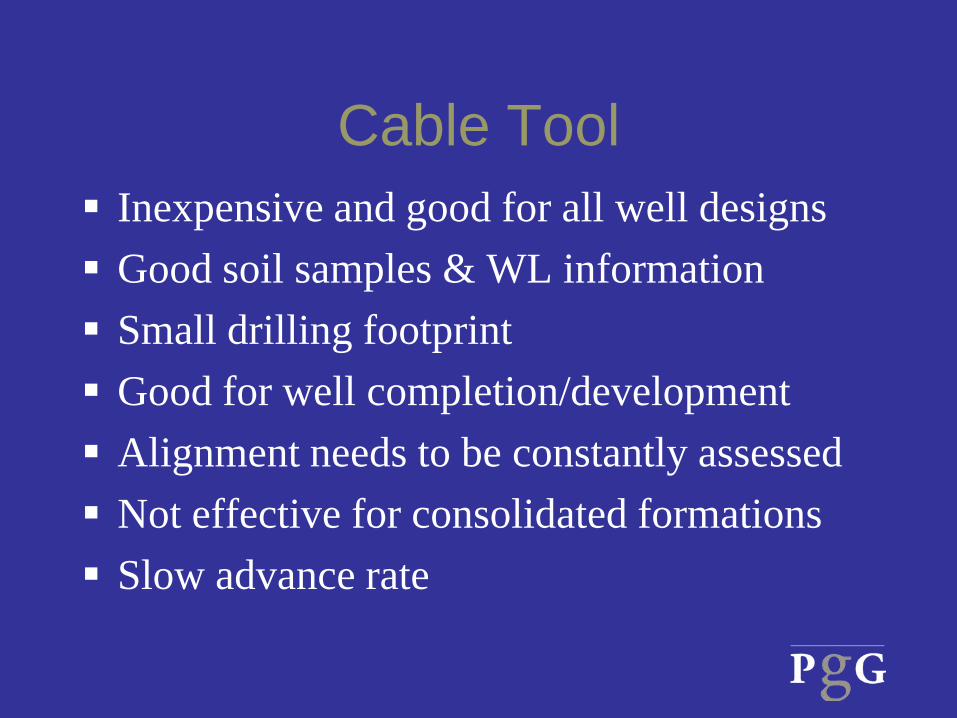
Cable Tool Inexpensive and good for all well designs Good soil samples & WL information Small drilling footprint Good for well completion/development Alignment needs to be constantly assessed Not effective for consolidated formations Slow advance rate
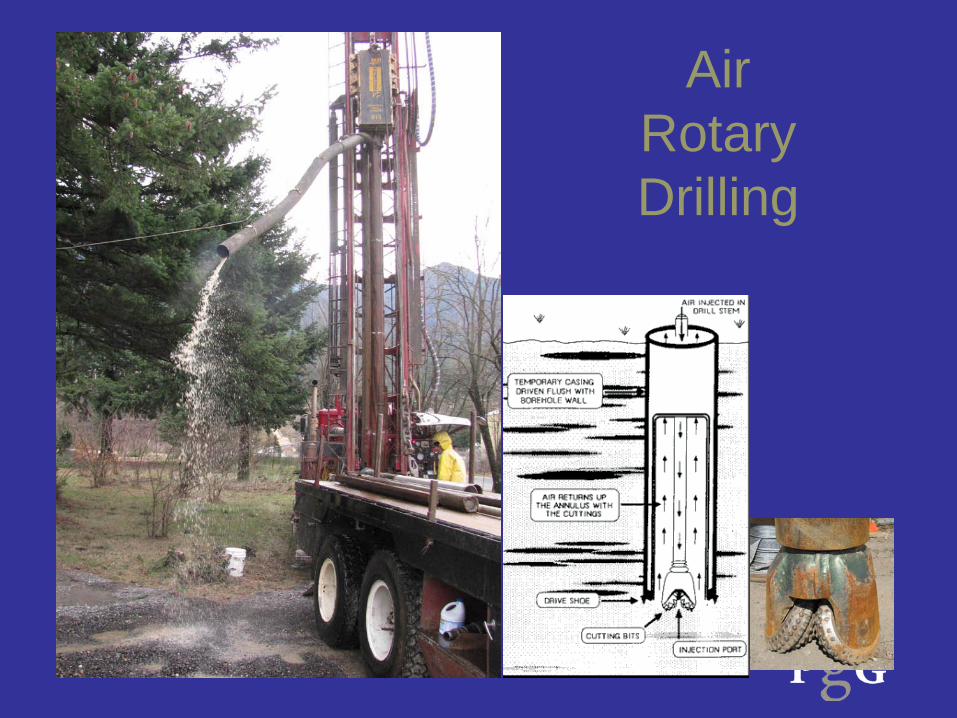
Air Rotary Drilling

Air Rotary
Cost effective for domestic wells Good WL entry information Good for consolidated formations Not effective for large diameter wells (> 12/16”) Poor sample recovery Fast advance rate
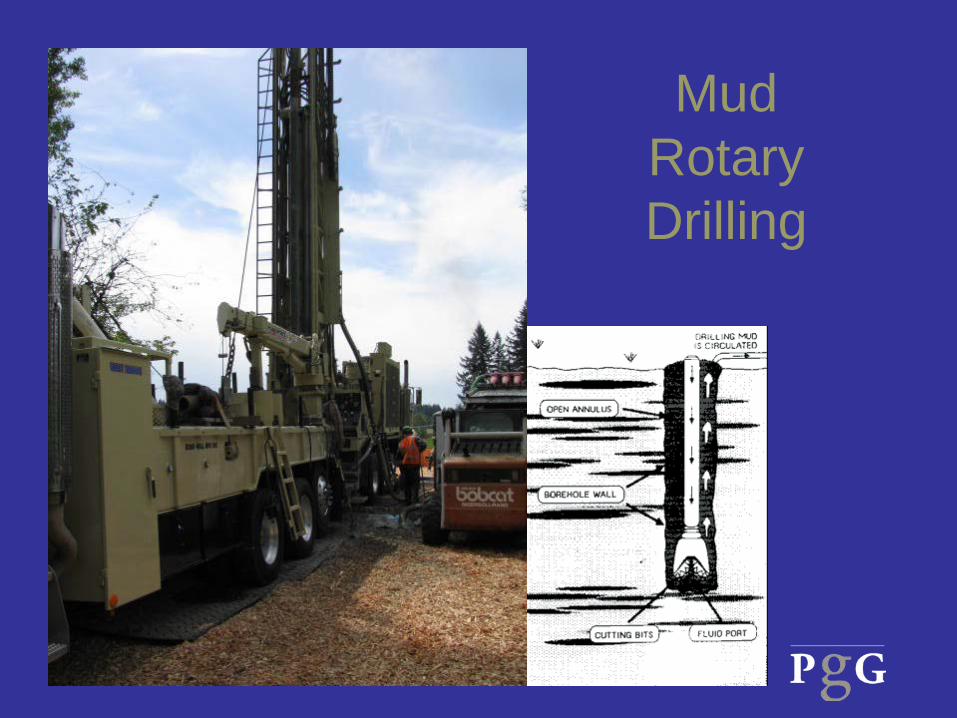
Mud Rotary Drilling
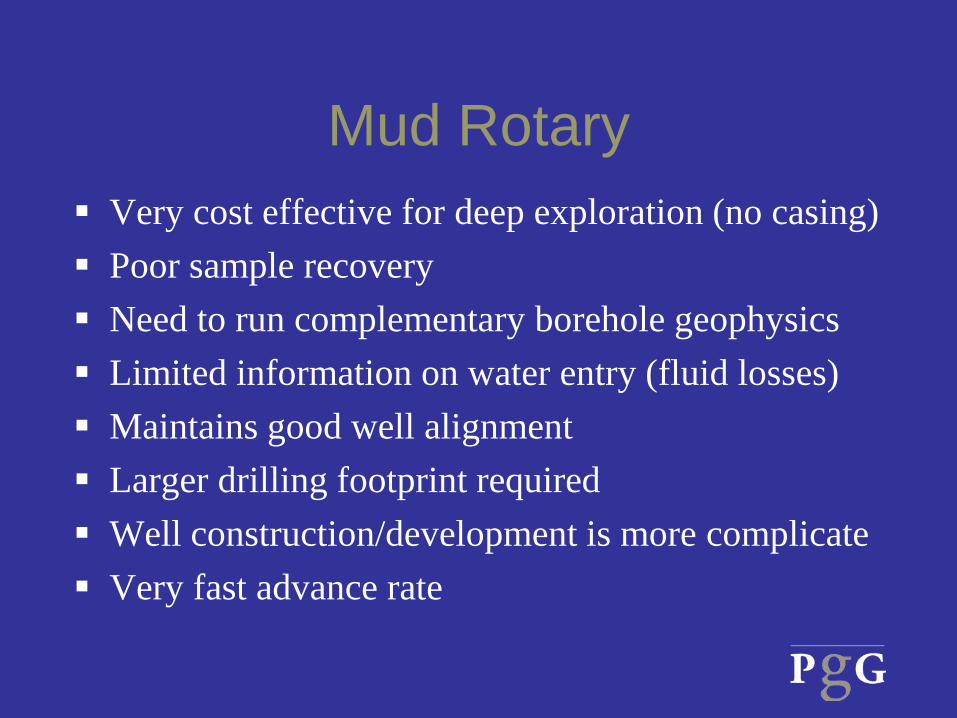
Mud Rotary Very cost effective for deep exploration (no casing) Poor sample recovery Need to run complementary borehole geophysics Limited information on water entry (fluid losses) Maintains good well alignment Larger drilling footprint required Well construction/development is more complicate Very fast advance rate
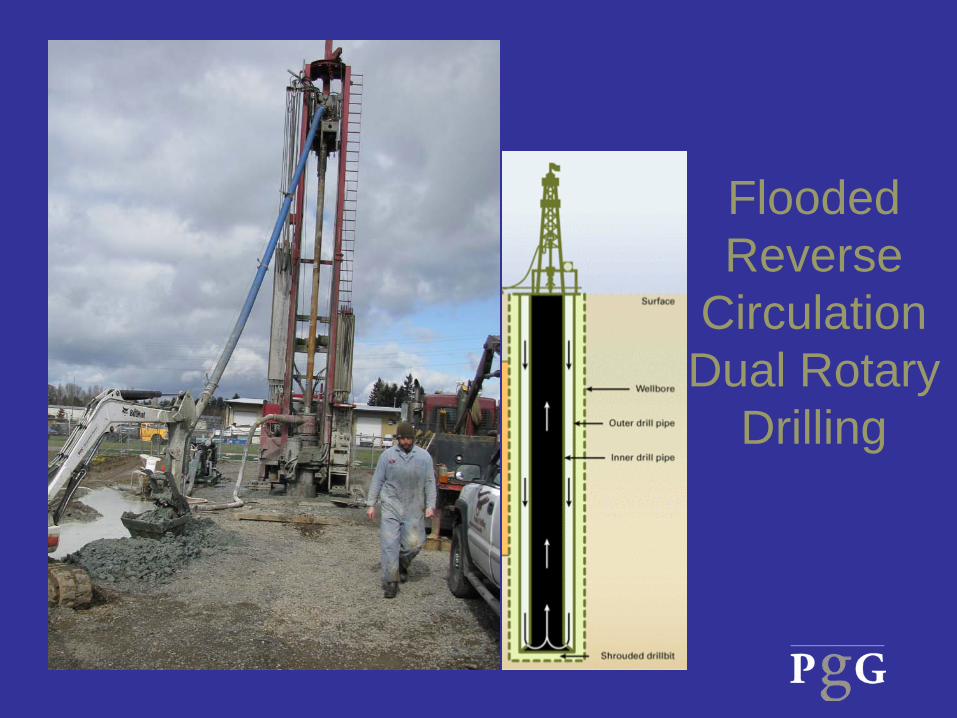
Flooded Reverse
Circulation Dual Rotary
Drilling
Flooded RC Dual Rotary Drilling
More expensive Good for large well designs Good for unconsolidated and consolidated
formations (versatile) Maintains good well alignment Inconsistent soil recovery Large drilling footprint required Fast advance rate

Well Screen Design
Sieve analysis of sand fraction to assess screen slot openings Avoid screening too close to fine sand
zones Use natural pack design to optimize well
efficiency Use sand/gravel pack design if fine sand is
problematic

Grain Size Evaluation for Design

Well Development Purpose of development Remove fines to enhance well
efficiency Stabilize formation & limit sand
production Development methods Surging with swabbing tool Air lift surging Water jetting Chemical additives for breakdown of
clay/silt (AquaClear PFD)

Natural vs Gravel Pack Completion
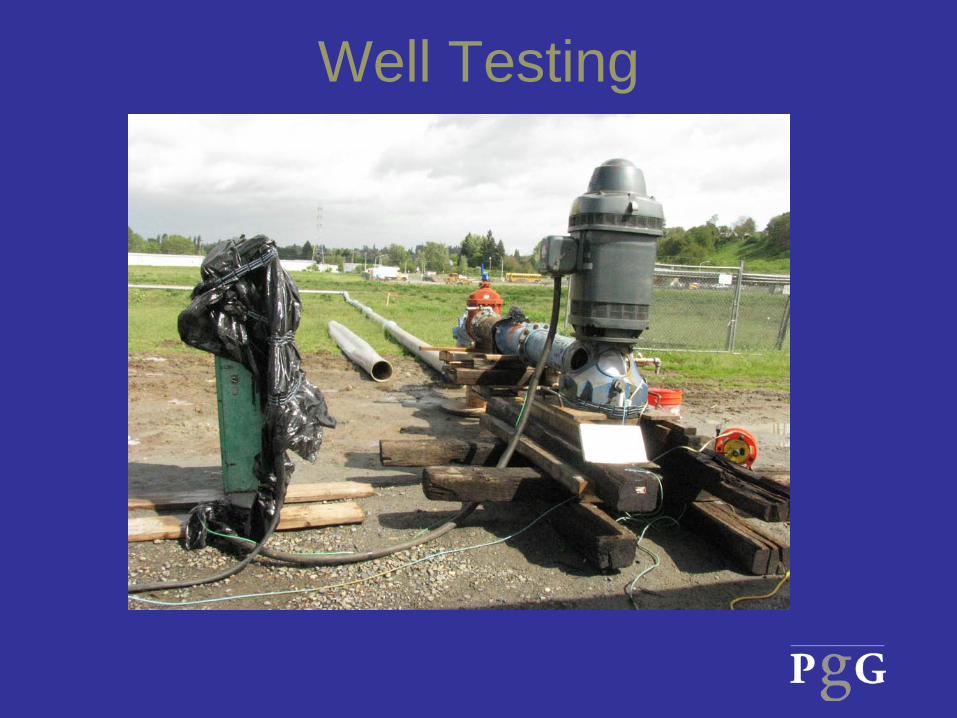
Well Testing
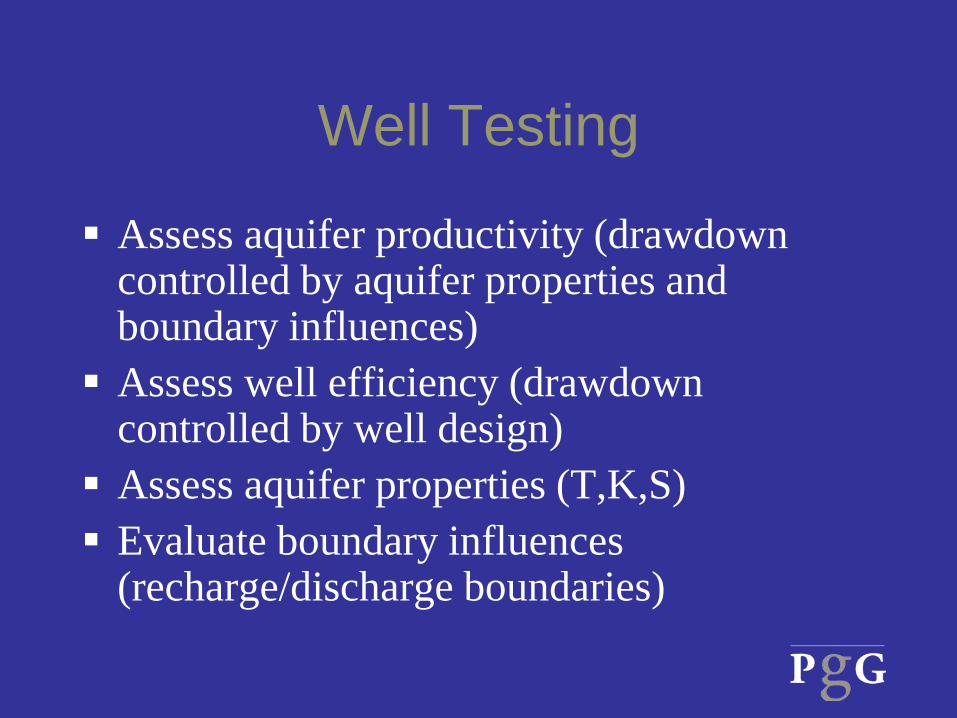
Well Testing
Assess aquifer productivity (drawdown controlled by aquifer properties and boundary influences) Assess well efficiency (drawdown
controlled by well design) Assess aquifer properties (T,K,S) Evaluate boundary influences
(recharge/discharge boundaries)
Types of Pumping Tests
Air lift tests (most common/mostly worthless except for domestic wells) Step-rate drawdown tests (well efficiency) Constant-rate tests (aquifer
properties/boundary influences)

Testing Considerations
Where to discharge water Accurate metering of pumping rate and
drawdown Desirable to have one or more obs. wells Pretest monitoring for baseline trends Other issues (noise, regulating valves, WQ
sampling, barometric corrections)

Assessing Drawdown Response
Thank You-Questions?
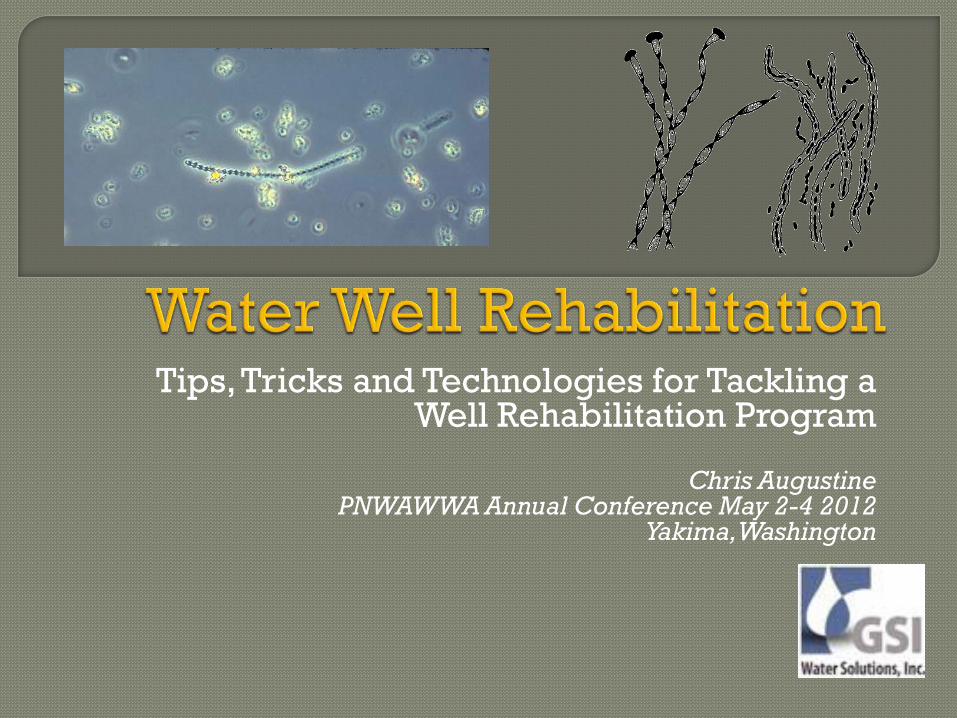
Tips, Tricks and Technologies for Tackling a
Well Rehabilitation Program
Chris Augustine PNWAWWA Annual Conference May 2-4 2012
Yakima, Washington
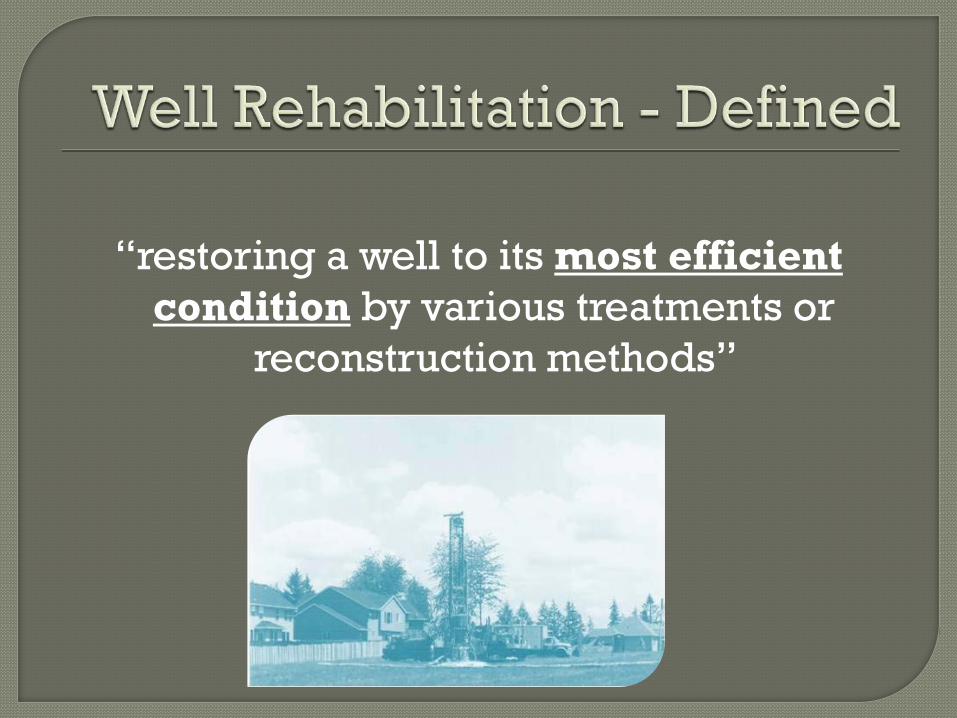
“restoring a well to its most efficient
condition by various treatments or reconstruction methods”
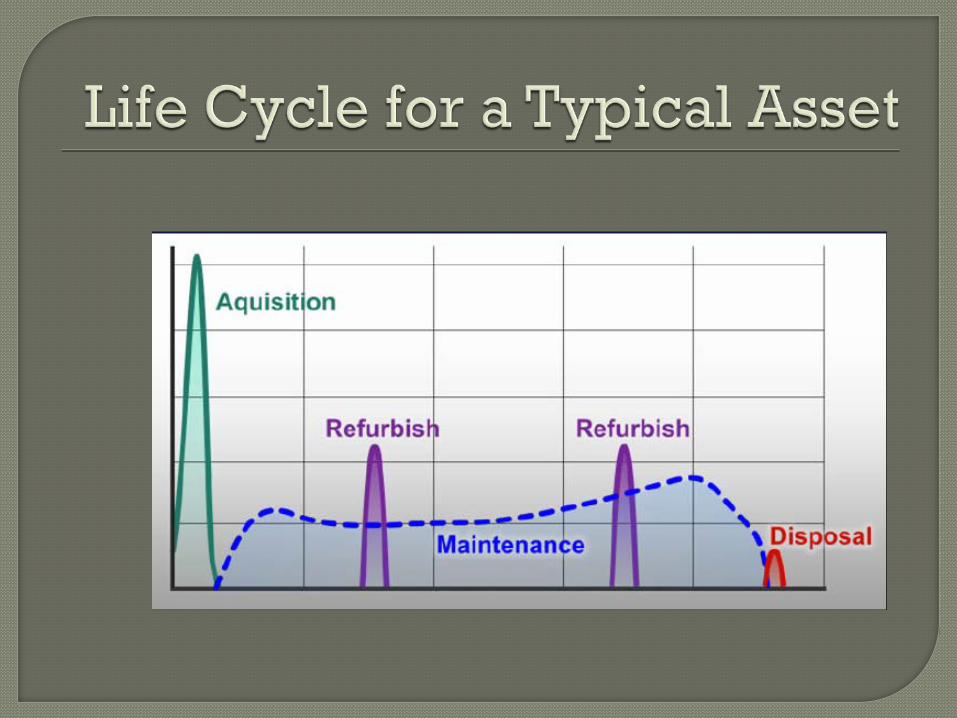
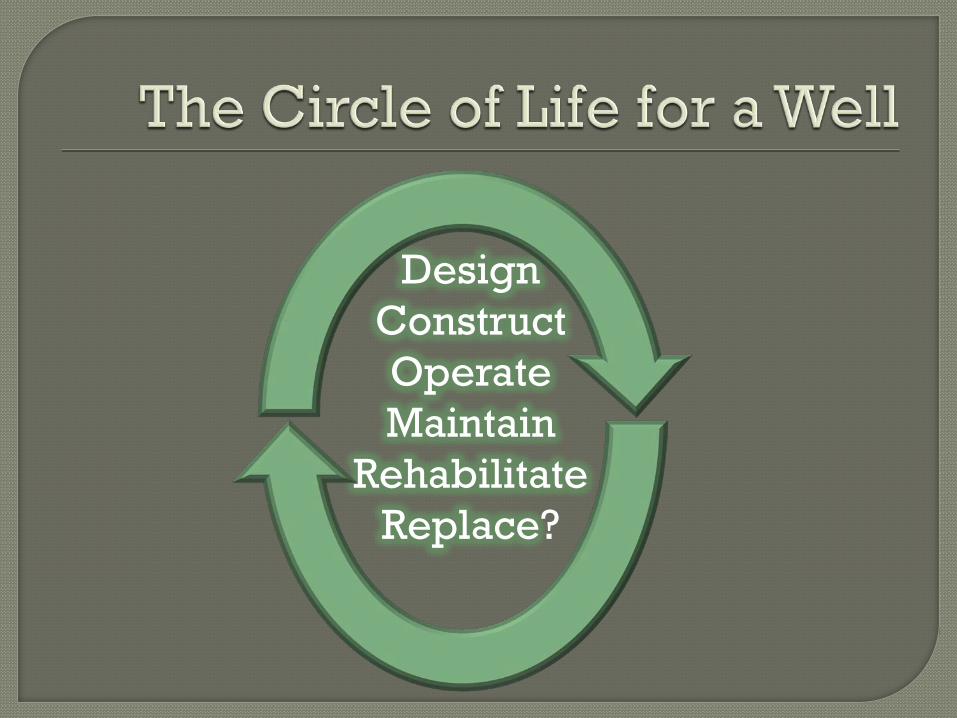
Design Construct Operate Maintain
Rehabilitate Replace?

“Expect the best, plan for the worst, and prepare to be surprised “
Tip No. 1 – Plan Ahead
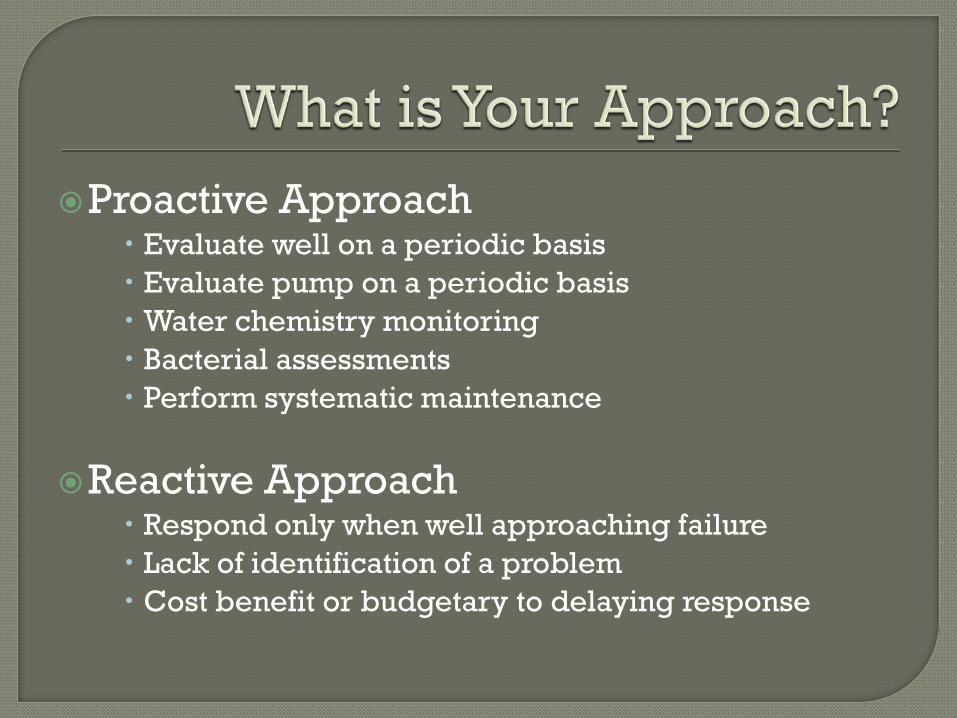
Proactive Approach Evaluate well on a periodic basis Evaluate pump on a periodic basis Water chemistry monitoring Bacterial assessments Perform systematic maintenance
Reactive Approach Respond only when well approaching failure Lack of identification of a problem Cost benefit or budgetary to delaying response
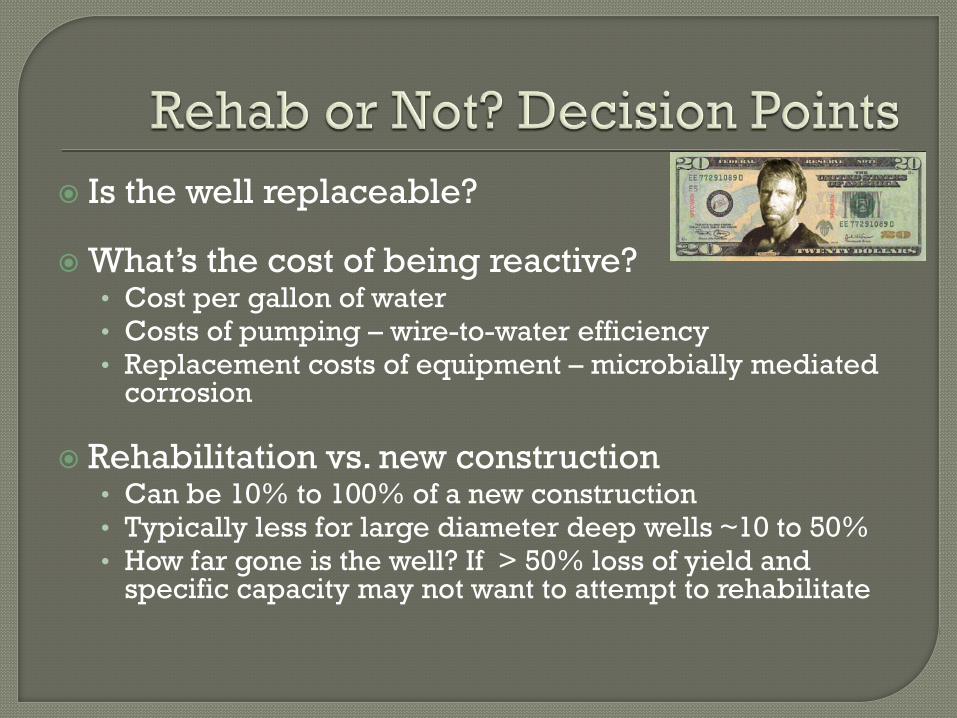
Is the well replaceable? What’s the cost of being reactive?
• Cost per gallon of water • Costs of pumping – wire-to-water efficiency • Replacement costs of equipment – microbially mediated
corrosion
Rehabilitation vs. new construction • Can be 10% to 100% of a new construction • Typically less for large diameter deep wells ~10 to 50% • How far gone is the well? If > 50% loss of yield and
specific capacity may not want to attempt to rehabilitate

“You Can’t Connect the Dots Looking Forward”
Tip No. 2 – Evaluate Performance as Part of Operation and Maintenance

Collect Well Performance Information (PLC or SCADA) • Pumping rate • Drawdown • System pressures
Collect Pump Performance Data
• Voltage, Amperage, Power Factor, VFD Frequency
Water Quality • Major Ion chemistry and nutrients – iron, manganese • Alkalinity, Hardness, pH and Redox conditions
Bacterial Assessment
• Heterotrophic Plate Counts (HPC) – 97% of all bacteria are not culturable using an agar media!

Visually • Surface clues – deposit/slimes • Downhole Camera
Chemically • Water quality testing – iron, manganese, biological
Mechanically • Evaluate Pump Performance and Energy Usage • Evaluate Changes in Flow or Pressure
Hydraulically • Well Performance – Well Yield or Specific Capacity
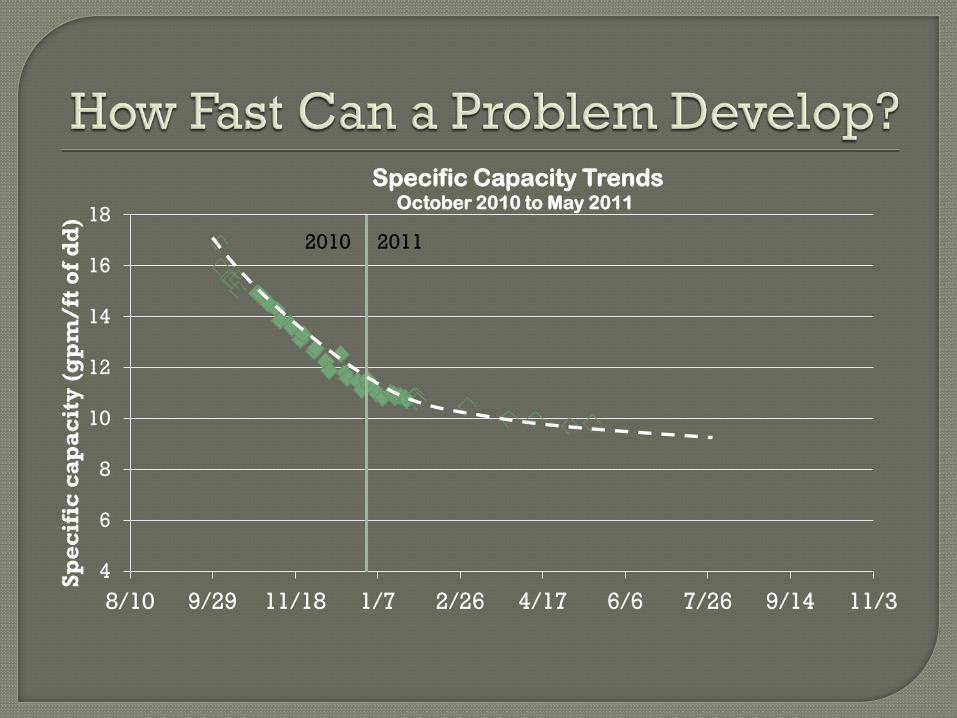
4
6
8
10
12
14
16
18
8/10 9/29 11/18 1/7 2/26 4/17 6/6 7/26 9/14 11/3
Spec
ific
cap
acit
y (g
pm
/ft o
f dd
)
Specific Capacity Trends October 2010 to May 2011
2010 2011

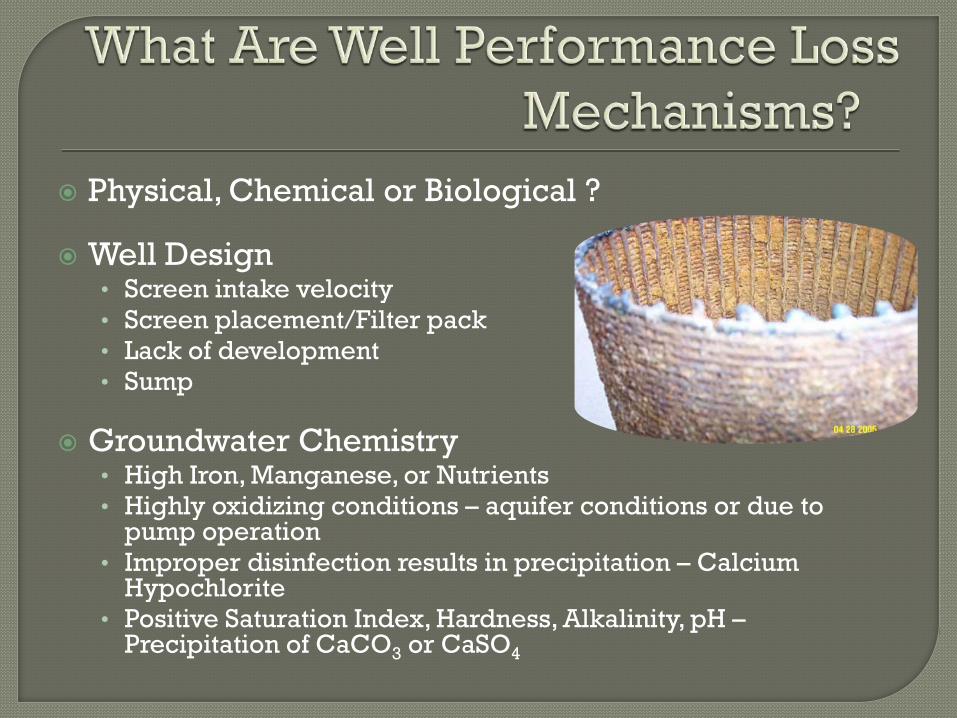
Physical, Chemical or Biological ?
Well Design • Screen intake velocity • Screen placement/Filter pack • Lack of development • Sump
Groundwater Chemistry
• High Iron, Manganese, or Nutrients • Highly oxidizing conditions – aquifer conditions or due to
pump operation • Improper disinfection results in precipitation – Calcium
Hypochlorite • Positive Saturation Index, Hardness, Alkalinity, pH –
Precipitation of CaCO3 or CaSO4
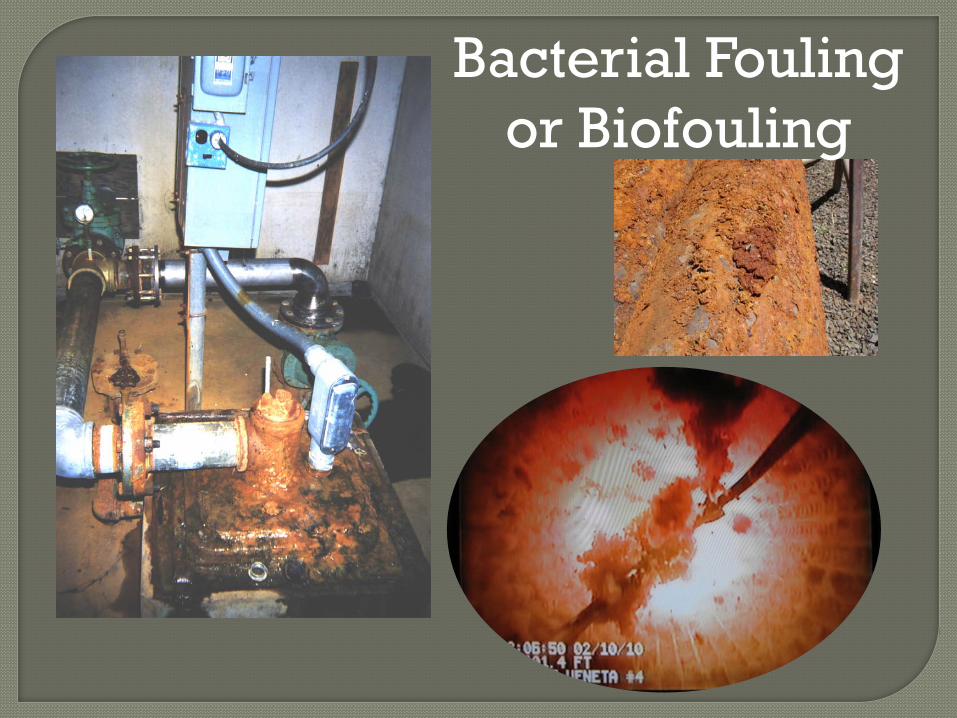
Bacterial Fouling or Biofouling
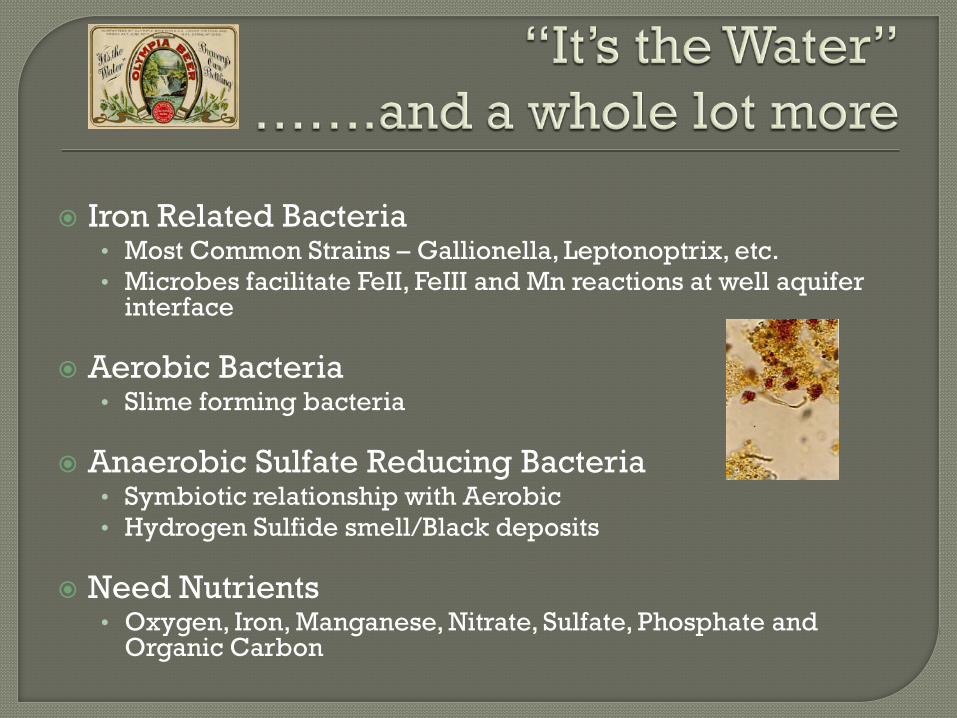
Iron Related Bacteria
• Most Common Strains – Gallionella, Leptonoptrix, etc. • Microbes facilitate FeII, FeIII and Mn reactions at well aquifer
interface
Aerobic Bacteria • Slime forming bacteria
Anaerobic Sulfate Reducing Bacteria
• Symbiotic relationship with Aerobic • Hydrogen Sulfide smell/Black deposits
Need Nutrients
• Oxygen, Iron, Manganese, Nitrate, Sulfate, Phosphate and Organic Carbon
Qualitative • BART testing – Bacteria specific tests • General Chemistry – Iron, Manganese, and Nutrients • Field testing of deposits on pump and piping HCL testing
Quantitative
• Analytical Specialty Lab Visual Identification of Bacteria ATP Count Nutrients – iron, manganese, nitrate, phosphate and sulfate Organic Carbon

“Any sufficiently advanced technology is indistinguishable from magic”
Technologies
What does it include? • Downhole Video Survey • Physical or Mechanical Development • Sonic or Fluid Impulse Generation Tools • Chemical Treatment • Thermal Treatments • Carbon Dioxide • Bacteriaphage Therapy • Whole Kitchen Sink? AKA – Blended Methods • Geophysics, Flowmeter or Flow profile
1. Remove the Pump 2. Video Survey 3. Brush, Surge and Bail 4. Mechanical Development – Fluid Impulse 5. Re-Test Well Performance 6. Chemical Treatment 7. Re-Test Well Performance 8. Mechanical Development 9. Video Survey 10. Re-install Pump

Open Hole Video Survey • Removal of Pump • Camera Operator • Rental Equipment
Pump in place video survey
• 2-Inch Access Tube
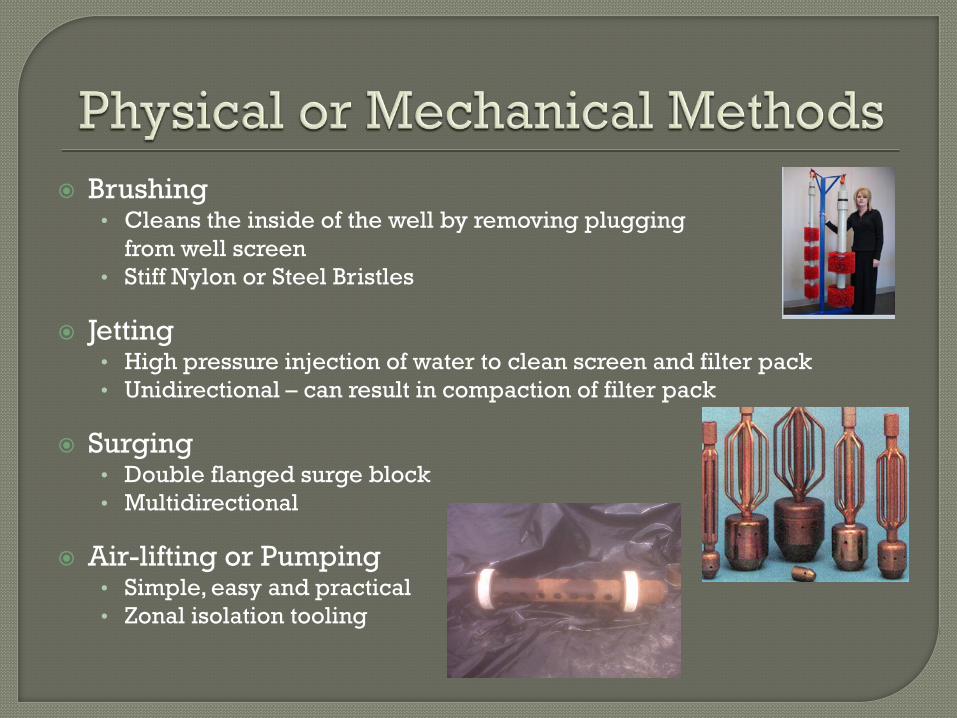
Brushing • Cleans the inside of the well by removing plugging from well screen • Stiff Nylon or Steel Bristles
Jetting
• High pressure injection of water to clean screen and filter pack • Unidirectional – can result in compaction of filter pack
Surging
• Double flanged surge block • Multidirectional
Air-lifting or Pumping
• Simple, easy and practical • Zonal isolation tooling

Goes by Proprietary Names • AirShock™ • AirBurst™ • Hydropulse™ • SonarJET™
What’s the Diff?
• Some are repetitive impulse generation • Some are single “shots”
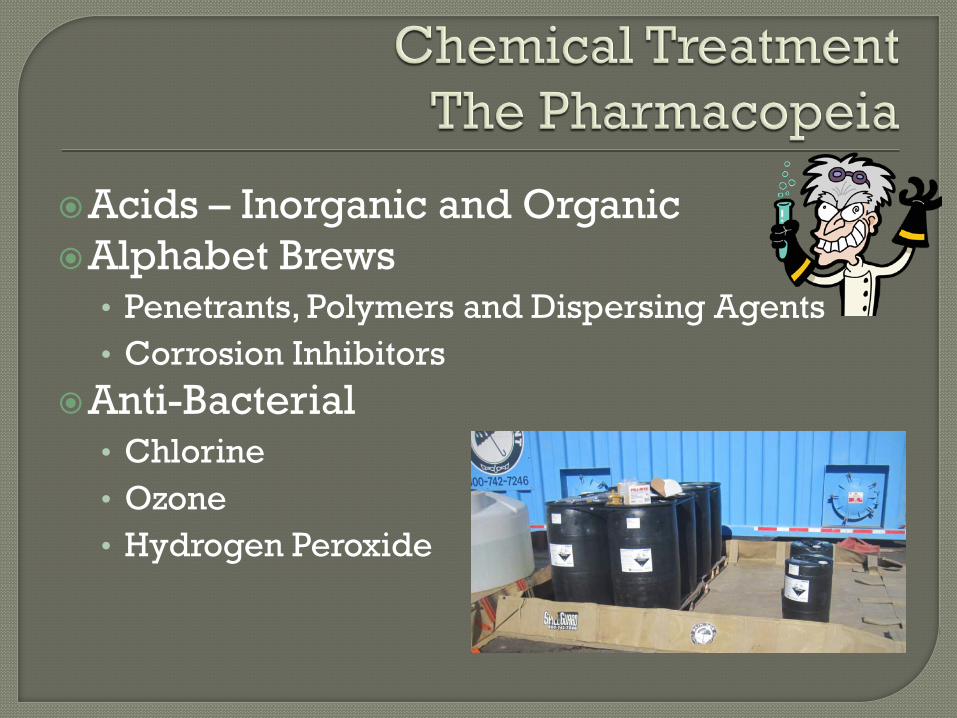
Acids – Inorganic and Organic Alphabet Brews
• Penetrants, Polymers and Dispersing Agents • Corrosion Inhibitors
Anti-Bacterial • Chlorine • Ozone • Hydrogen Peroxide

High degree of plugging from mineral encrustation or biofilm = good candidate
Good understanding of groundwater chemistry, hydrogeology and well hydraulics
Limitations • Cost per increases for regained capacity • Condition of the Well • Nearby groundwater users • Nearby surface waters • Chemical incompatibilities • Neutralization of recovered chemicals • Disposal of recovered chemical • Safety
Chlorination • AWWA suggest a 50 ppm chlorination solution
for routine disinfection
Shock or Super Chlorination • Used to be 500 to 1000 ppm – more is better
right? • Now the rule of thumb is 200 to 300 ppm
(maximum)

“People like to feel they are buying of their own good judgment as a result of the information the salesman has given them”
Tip No. 3 – Buyer Beware
No One Tool or Approach will be the Silver Bullet
Identify an Experienced Hydrogeologist or Engineer
Identify a Qualified Drilling or Well Rehabilitation Contractor
Talk to Water Well and Well Rehabilitation Suppliers • Water Well Suppliers – Johnson Screen • Chemical Suppliers – Cotey Chemical, Baroid

“Good judgment comes from experience, and a lot of that comes from bad judgment”
Tricks

Plan for Future Access to the Well
Optimize Screen Length • Available Drawdown • Entrance Velocities • Percent Open Area • Filter Pack
Allow for Declines in the Aquifer Water
Levels
Pump to Waste Capacity
Have a Well Defined Scope of Work
Outline the Sequence of Work
Desired Pump and Tool Specifications
Detailed Description of Methods
Chemical Volumes, Concentrations and Disposal
Pumping Rates and Recovery Rates Specified
Lump Sum/Unit Cost
Mob/Demob
Pumping Tests
Fluid Impulse Chemical Treatment (and
Recovery/Neutralization)
Superchlorination
Time and Materials
Brushing/bailing Mechanical
Development
Stand-by and Delay Time
Hourly work
Watch the Contractor Carefully During Execution • Specifications are just a suggestion to some • The field crew is likely disconnected from the decision making
– no specs on site, no MSDSs
Make sure contractor and any subcontractor(s) are on the same page • Time considerations • Sequencing of work • Equipment needed
Verify they have delivered the scope of work
Document what was done whether successful or not
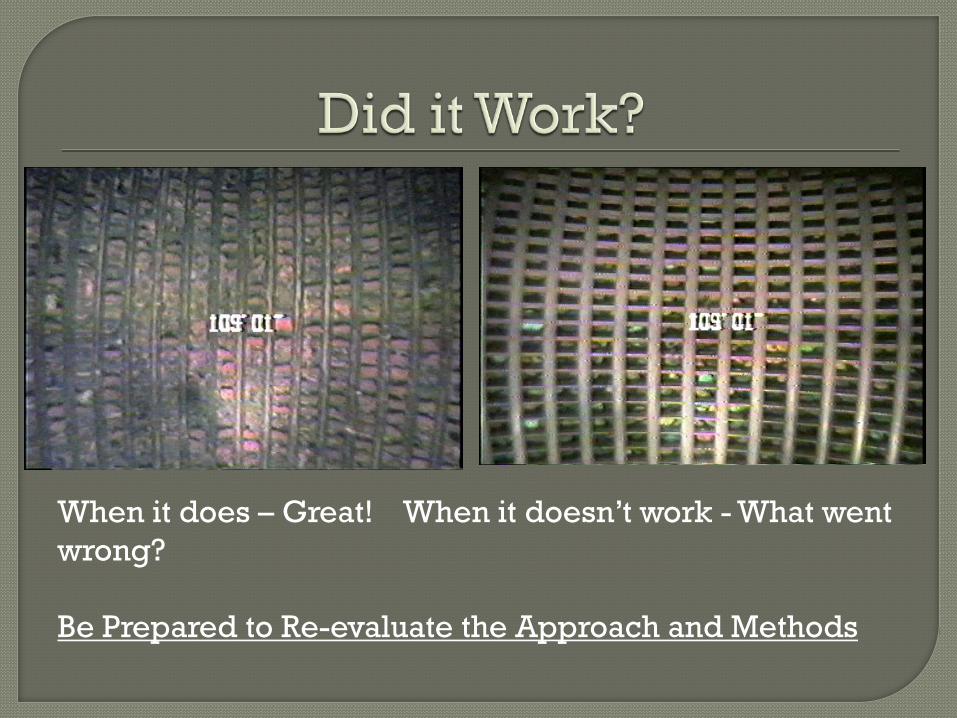
When it does – Great! When it doesn’t work - What went wrong? Be Prepared to Re-evaluate the Approach and Methods
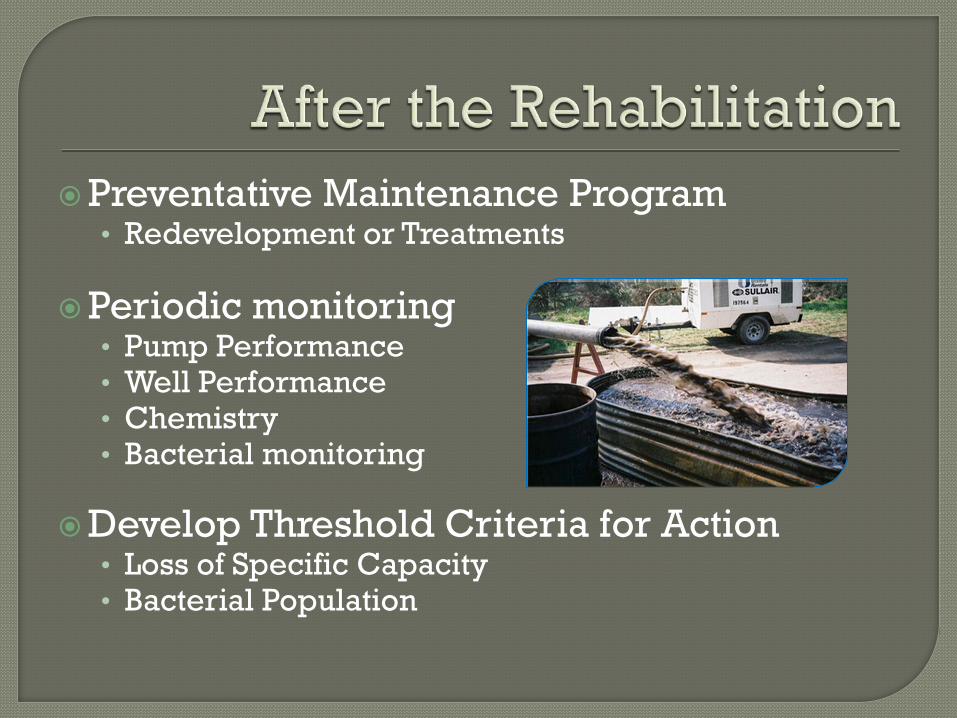
Preventative Maintenance Program • Redevelopment or Treatments
Periodic monitoring
• Pump Performance • Well Performance • Chemistry • Bacterial monitoring
Develop Threshold Criteria for Action • Loss of Specific Capacity • Bacterial Population
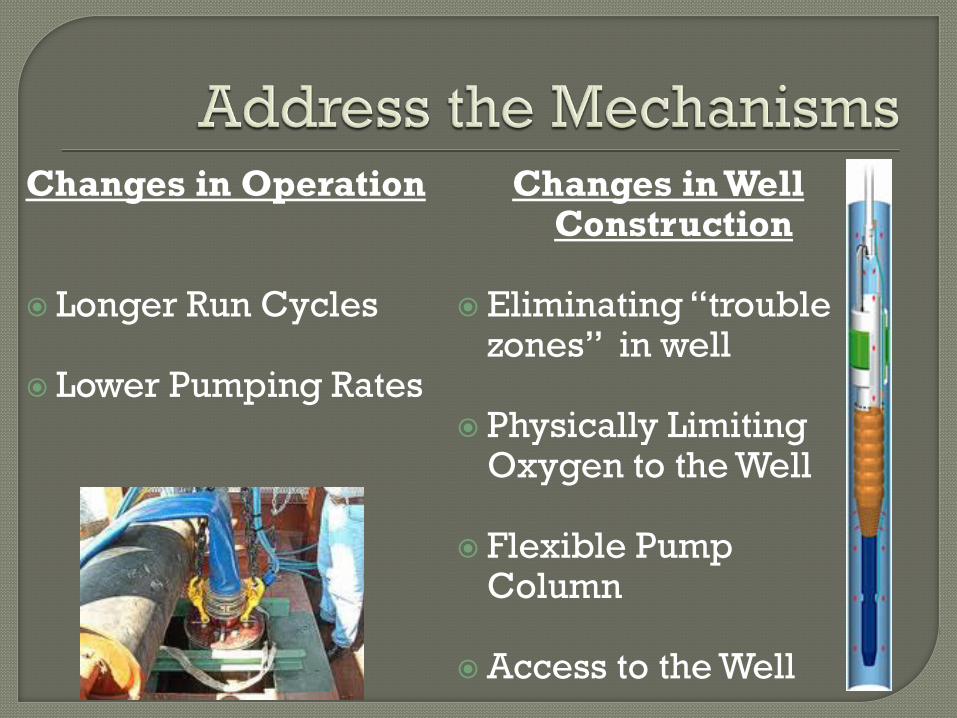
Changes in Operation
Longer Run Cycles
Lower Pumping Rates
Changes in Well Construction
Eliminating “trouble
zones” in well
Physically Limiting Oxygen to the Well
Flexible Pump Column
Access to the Well

Christopher Augustine, RG [email protected] www.gsiws.com

PumpTech Customer Education
Bellevue Moses Lake Canby
http://www.Pumptechnw.com
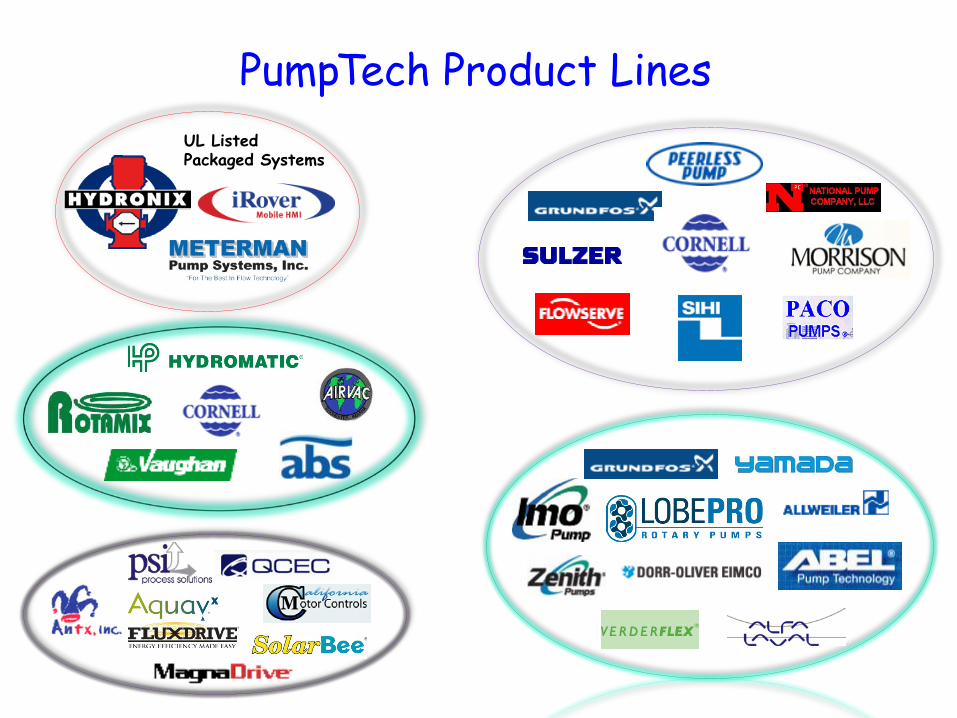
PumpTech Product Lines UL Listed Packaged Systems

Two full time Mechanical Engineers Licensed in OR, WA & ID SolidWorks & E-Drawings Viewer AutoCad Compatible Drawings All Systems UL QCZJ Listed Designed to HI Standards

Manufacturing Facility Canby, OR

Installation, Maintenance & Repair 9 Full Time Service Technicians 3 Full Service Shops 6 Service Trucks 23 Ton Crane Truck 8 Ton Crane Truck 3 Ton Crane Truck 2 Ton Flatbed & Trailer 1 Ton Flatbed & Trailer
Joe Evans, Ph.D
http://www.PumpEd101.com
http://www.Pumptechnw.com
Pump ED 101
Pump ED 101
Centrifugal Pump Training Series
Lineshafts Versus Submersibles
Approved for 0.3 CEU’s WA – WCS # A1883 WA – DOE # ECYS11-268 OR – OESAC # 2228 ID – IBOL # WWP11093466
Vertical Turbine Pumps
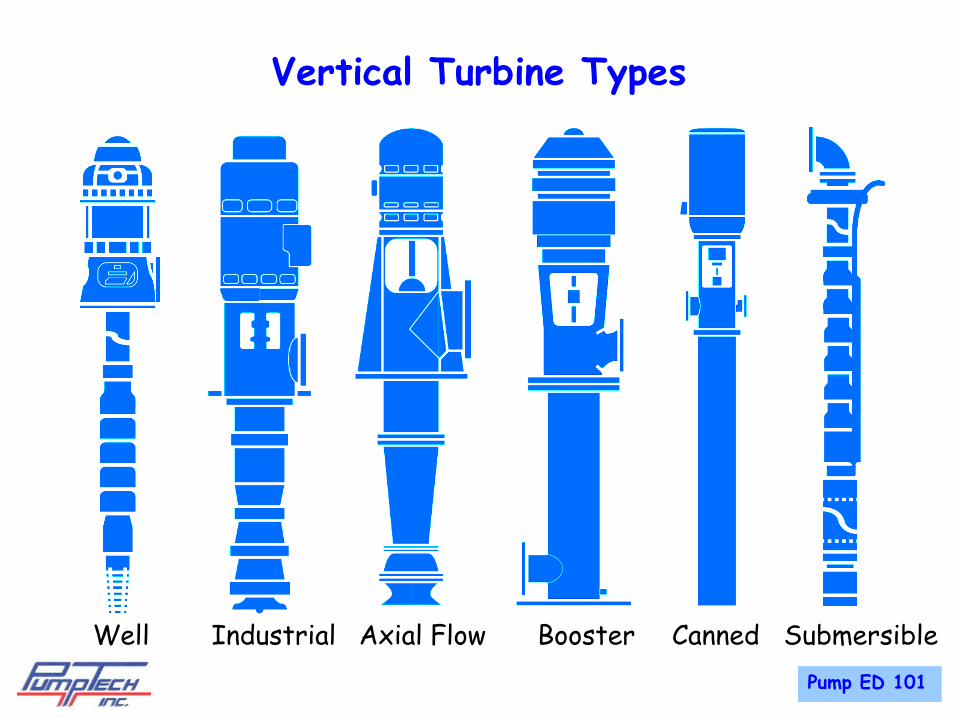
Vertical Turbine Types
Well Industrial Booster Canned Submersible Axial Flow Pump ED 101
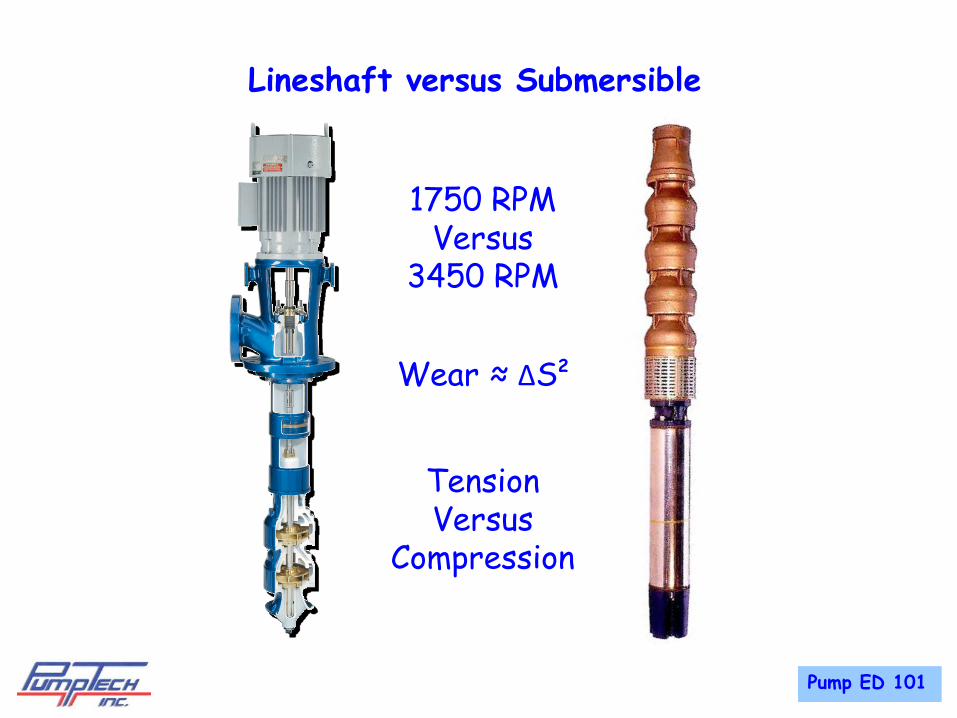
Lineshaft versus Submersible
Pump ED 101
1750 RPM Versus
3450 RPM
Tension Versus
Compression
Wear ≈ ΔS2

Lineshaft versus Submersible
When & Why Should You Choose a Submersible ?
Pump ED 101

Lineshaft versus Submersible
When & Why Should You Choose a Submersible
Small Well Installations Under 40 HP
When First Cost is the Only Factor
Extremely Deep Settings
Crooked Wells
Some Ag Irrigation Applications
Flooding
Noise
Pump ED 101
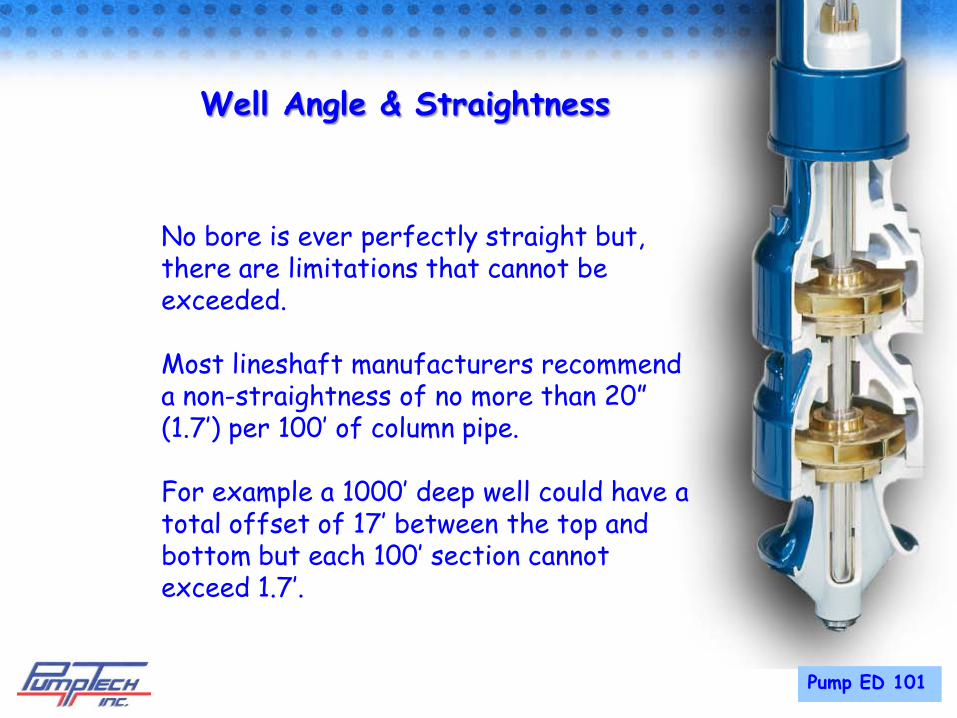
Well Angle & Straightness
No bore is ever perfectly straight but, there are limitations that cannot be exceeded. Most lineshaft manufacturers recommend a non-straightness of no more than 20” (1.7’) per 100’ of column pipe. For example a 1000’ deep well could have a total offset of 17’ between the top and bottom but each 100’ section cannot exceed 1.7’.
Pump ED 101

Well Angle & Straightness
Pump ED 101
Pump ED 101
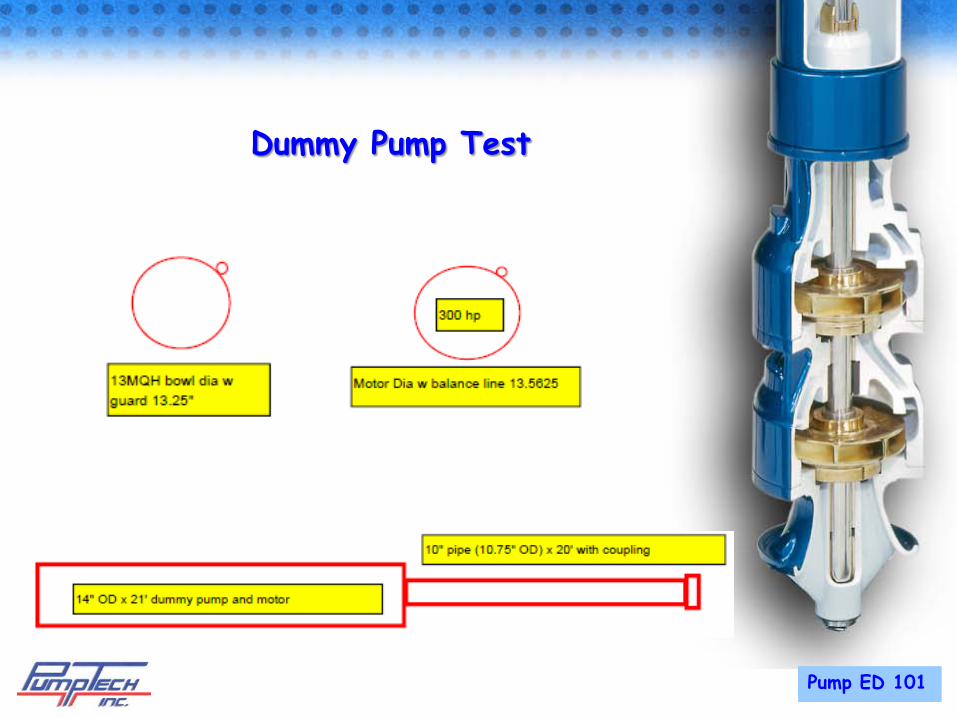
Dummy Pump Test

Well Development
The submersible pump lateral clearances must be adjusted prior to installation. If excessive amounts of sand is present after installation the pump can sand lock when it stops.
Pump ED 101
Sand Locking
Well development can be more critical for submersible pump installations.
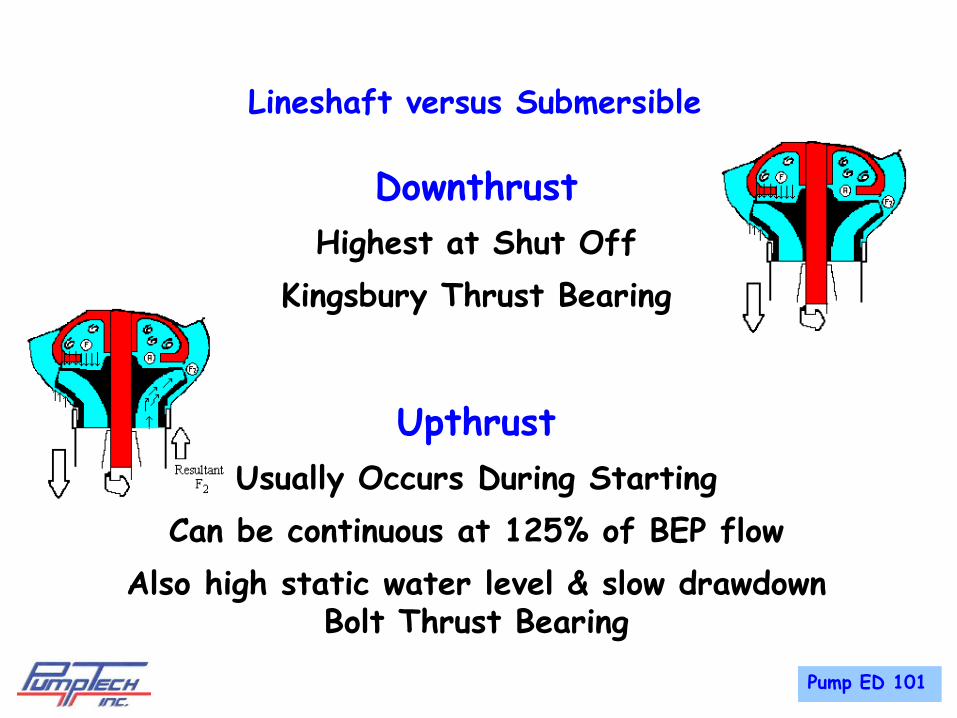
Lineshaft versus Submersible
Pump ED 101
Upthrust
Usually Occurs During Starting
Can be continuous at 125% of BEP flow
Also high static water level & slow drawdown Bolt Thrust Bearing
Downthrust
Highest at Shut Off
Kingsbury Thrust Bearing

Lineshaft versus Submersible Motors
Lineshaft Motors
Hollow or Solid Shaft 1750 RPM & Lower Premium Efficiency
Lower Cost Replaceable Thrust Bearings
Adjustable Impeller Clearances Lots of Options Shaft Losses
Pump ED 101
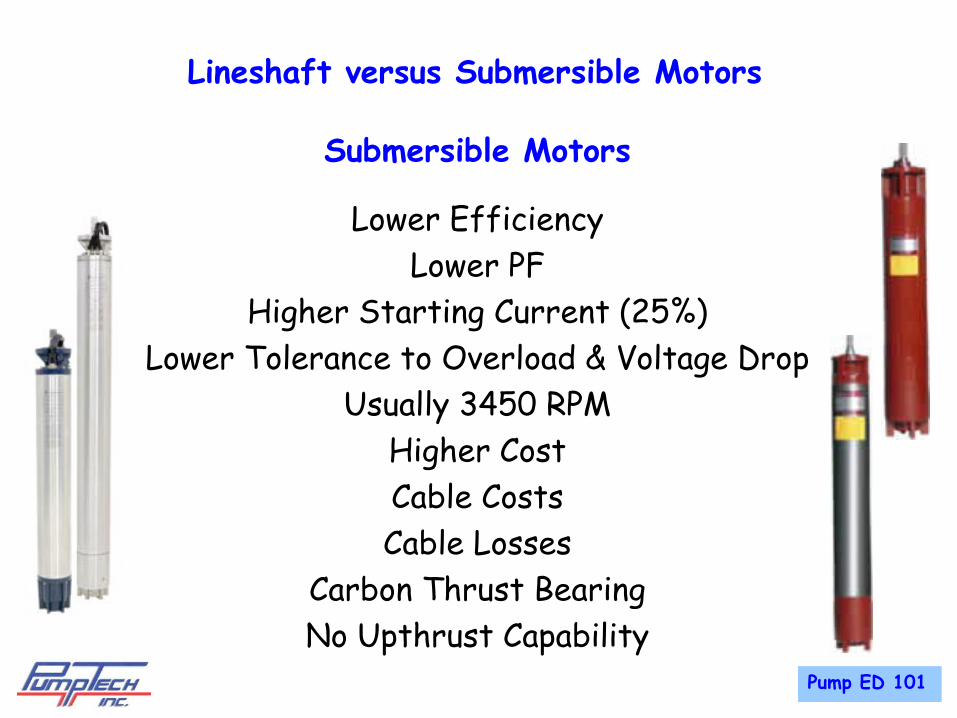
Lineshaft versus Submersible Motors
Submersible Motors
Lower Efficiency Lower PF
Higher Starting Current (25%) Lower Tolerance to Overload & Voltage Drop
Usually 3450 RPM Higher Cost Cable Costs Cable Losses
Carbon Thrust Bearing No Upthrust Capability
Pump ED 101

Lineshaft versus Submersible Motors
Pump ED 101

*
Motor & Pump Efficiency
Pump ED 101
Pump Efficiency = Fluid Power / Mechanical Power
Motor Efficiency = Mechanical Power / Electrical Power
Total Efficiency = Pump Efficiency X Motor Efficiency

*
Motor & Pump Efficiency
Pump ED 101
Total Efficiency = Pump Efficiency X Motor Efficiency
Motor Pump 10 Bags 9 Bags 7 Bags
90 % 70 % 78 %
0.90 X 0.78 = 0.70 = 70%
Total

*
Motor & Pump Efficiency
Pump ED 101 $ 2294.00 / Year

Joe Evans, Ph.D
http://www.PumpEd101.com
http://www.Pumptechnw.com
Pump ED 101
Centrifugal Pump Training Series
Lineshafts Versus Submersibles
Pump ED 101

Groundwater Treatment Technologies
Meeting regulatory, customer, and supply challenges

Groundwater Treatment Challenges
Treatment Technology is Evolving to Make Treatment for Cost Effective
Regulatory Customer Supply
Arsenic Volatile Organics
Perchlorate Hexavalent Chromium
Iron Manganese
Hydrogen Sulfide
Brackish Water Nitrate
Ammonia Very High Iron
Aquifer Recovery Advanced Water Treatment

Regulatory Treatment Challenges
Arsenic – MCL in 2001, new Health effects info Volatile Organics – CVOCs regulated as a contaminant Class Perchlorate - Regulatory determination expected this fall Hexavalent Chromium - Long way off, but in the news
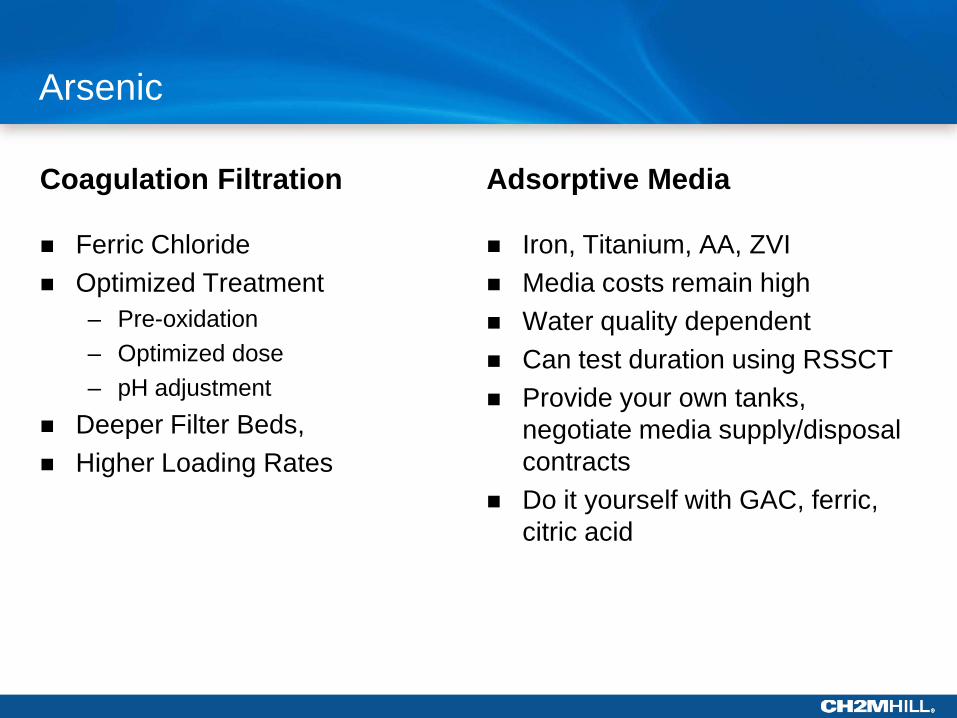
Arsenic
Coagulation Filtration
Ferric Chloride Optimized Treatment
– Pre-oxidation – Optimized dose – pH adjustment
Deeper Filter Beds, Higher Loading Rates
Adsorptive Media
Iron, Titanium, AA, ZVI Media costs remain high Water quality dependent Can test duration using RSSCT Provide your own tanks,
negotiate media supply/disposal contracts
Do it yourself with GAC, ferric, citric acid
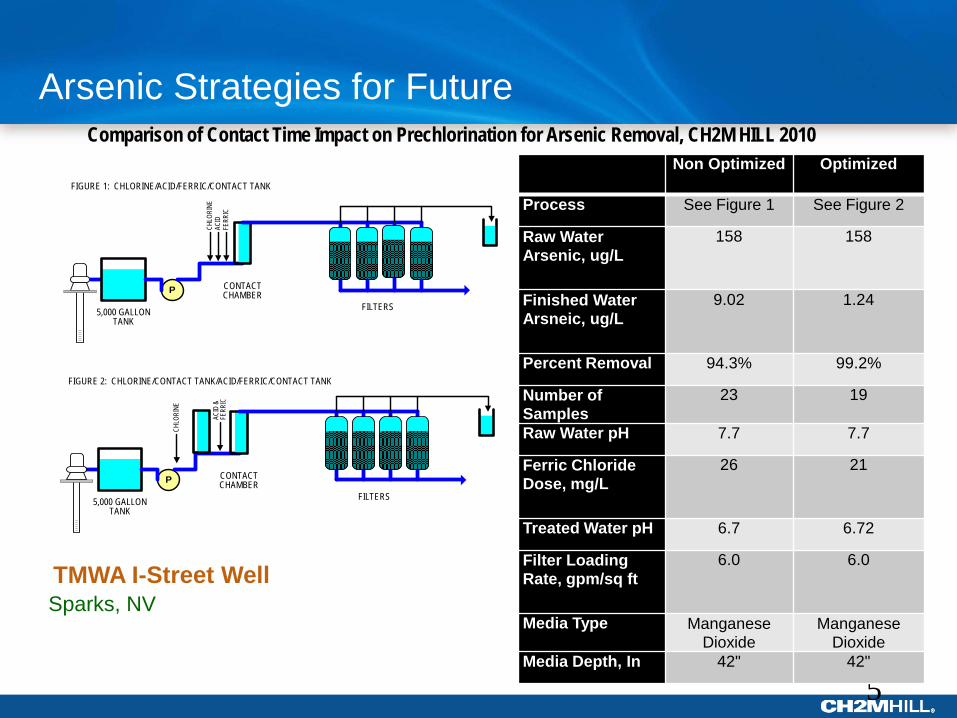
Arsenic Strategies for Future
5
Non Optimized Optimized
Process See Figure 1 See Figure 2
Raw Water Arsenic, ug/L
158 158
Finished Water Arsneic, ug/L
9.02 1.24
Percent Removal 94.3% 99.2%
Number of Samples
23 19
Raw Water pH 7.7 7.7
Ferric Chloride Dose, mg/L
26 21
Treated Water pH 6.7 6.72
Filter Loading Rate, gpm/sq ft
6.0 6.0
Media Type Manganese Dioxide
Manganese Dioxide
Media Depth, In 42" 42"
Sparks, NV TMWA I-Street Well
Comparison of Contact Time Impact on Prechlorination for Arsenic Removal, CH2M HILL 2010
P
5,000 GALLONTANK
CONTACT CHAMBER
FILTERS
FERR
IC
CHLO
RINE
ACID
P
5,000 GALLONTANK
CONTACT CHAMBER
FILTERS
CHLO
RINE
ACID
&
FERR
IC
FIGURE 2: CHLORINE/CONTACT TANK/ACID/FERRIC/CONTACT TANK
FIGURE 1: CHLORINE/ACID/FERRIC/CONTACT TANK

Arsenic Strategies for Future
6
Media
Initial
Arsenic,
µg/L
Water Source BV to 10
µg/L
mg As Absorbed
per g Media
g Iron per
g Media
Source
Iron–citric acid preloaded GAC 50–60 Rutland, Mass.
pH 6 150,000 4.96 0.0054 AwwaRF, 2007
Ferrichite (FeCl3 + chitosand) 3,580 Superfund
Tacoma, Wash. 700 1.1 0.61 Chen et al., 2000
Chemical coating onto absorption media G2 200 Spiked distilled
water 5,000 2 - Winchester et al., 2000
Granular ferric hydroxide; Wasserchemie 16 Wildeck, Germany 85,000–7
µg/L 0.82 0.58 Driehaus, 2000
Granular ferric hydroxide 21 Stadtoldentrof, Germany
75,000–7 µg/L 1.08 0.58 Jekel and Seith,
2000
Granular ferric oxide media; US Filter/Siemens 18 Stockton, Calif. 25,000 0.2 0.58 McAuley, 2004
Granular ferric oxide media; Severn Trent 18 Stockton, Calif. 25,000 0.2 0.63 McAuley, 2004
Granular ferric oxide media; Wasserchemie 8 Barkersfield, Calif. 80,000–4
µg/L 0.26 0.58 McAuley, 2004
Granular ferric oxide media; Severn Trent 8 Barkersfield, Calif. 80,000–4
µg/L 0.26 0.63 McAuley, 2004
Granular ferric oxide media; Wasserchemie and US Filter/Siemens
15 Deionized water spiked with As
60,000–7 µg/L 0.58 0.58 Bradruzzaman et al.,
2001
Zirconium-loaded activated carbon 500 Carbonate buffer
spiked with As 5,900 2.8 0.028 g Zr/g Daus et al., 2004
Absorptionsmittel 3 500 Carbonate buffer spiked with As 1,000 2 0.075 Daus et al., 2004
Iron hydroxide granules 500 Carbonate buffer spiked with As 13,100 2.3 0.323 Daus et al., 2004
Iron-impregnated polymer resin 50 Deionized water
with anions, pH 7.5 4,000 0.32 0.09–0.12 DeMarco et al., 2003
Iron oxide–impregnated
activated alumina 500
Deionized water
with As, pH 12
500–50
µg/L 0.29 0.066
Kuriakose et al.,
2004
Contract for Media Supply and Performance
Owner-Purchased Tanks
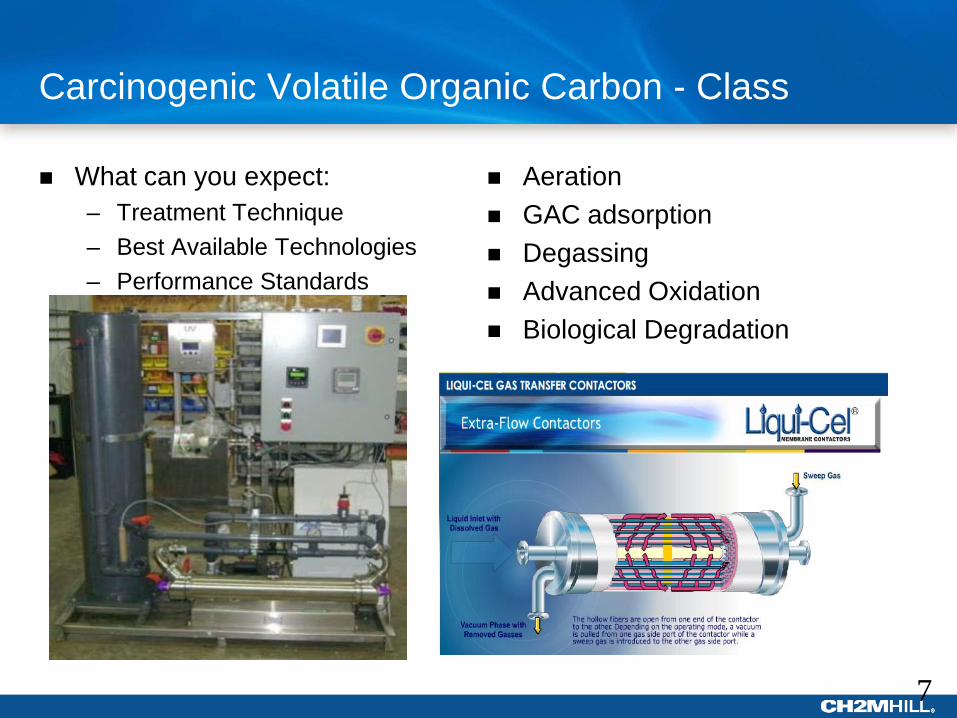
Carcinogenic Volatile Organic Carbon - Class
What can you expect: – Treatment Technique – Best Available Technologies – Performance Standards
Aeration GAC adsorption Degassing Advanced Oxidation Biological Degradation
7

Perchlorate
Membrane Processes – Reverse Osmosis – Nanofiltration
Ion Exchange – Perchlorate selective resins are
available Biological Degradation
– Anaerobic Reduction
Costs, Energy, pretreatment, fouling
Well understood
Could adopt commercial de-nitrification processes
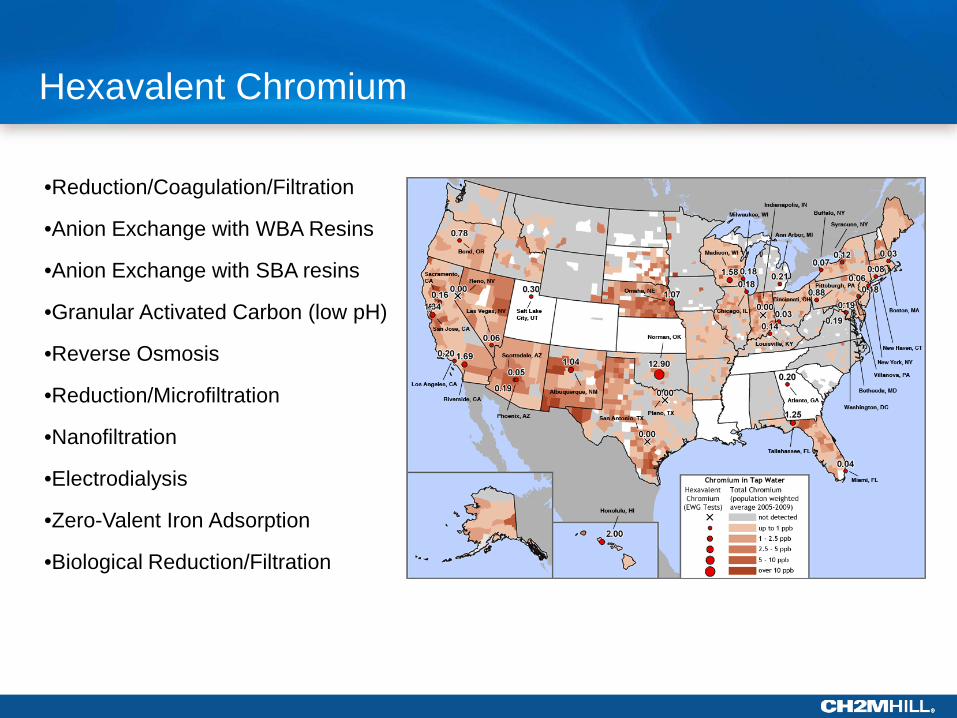
Hexavalent Chromium
Chrome III converts to Chrome VI in distributions systems with residual disinfectants
•Reduction/Coagulation/Filtration
•Anion Exchange with WBA Resins
•Anion Exchange with SBA resins
•Granular Activated Carbon (low pH)
•Reverse Osmosis
•Reduction/Microfiltration
•Nanofiltration
•Electrodialysis
•Zero-Valent Iron Adsorption
•Biological Reduction/Filtration

Customer Treatment Challenges
Iron, Manganese – Keeping costs low is a design philosophy Hydrogen Sulfide – Off tastes and odors challenging

Iron and Manganese Removal
High Rate Removal
Skid mounted systems Equipment supplier controls Eliminate Backwash Pumps Skid Mount Chemical Feed
Biological Removal
High iron concentrations One or two stage systems Commercially available systems
emerging
$0.3 to $0.8/ gallon of capacity
$0
$500,000
$1,000,000
0 1000 2000 3000
Cap
ital
Cos
ts
Facility Capacity (GPM)
Total Capital

High Rate Removal 10 MGD SouthLake Plant, $4.5 million
8 MGD Plant, Est $50 million
Vancouver, WA Clark Public Utilities
Biological Removal
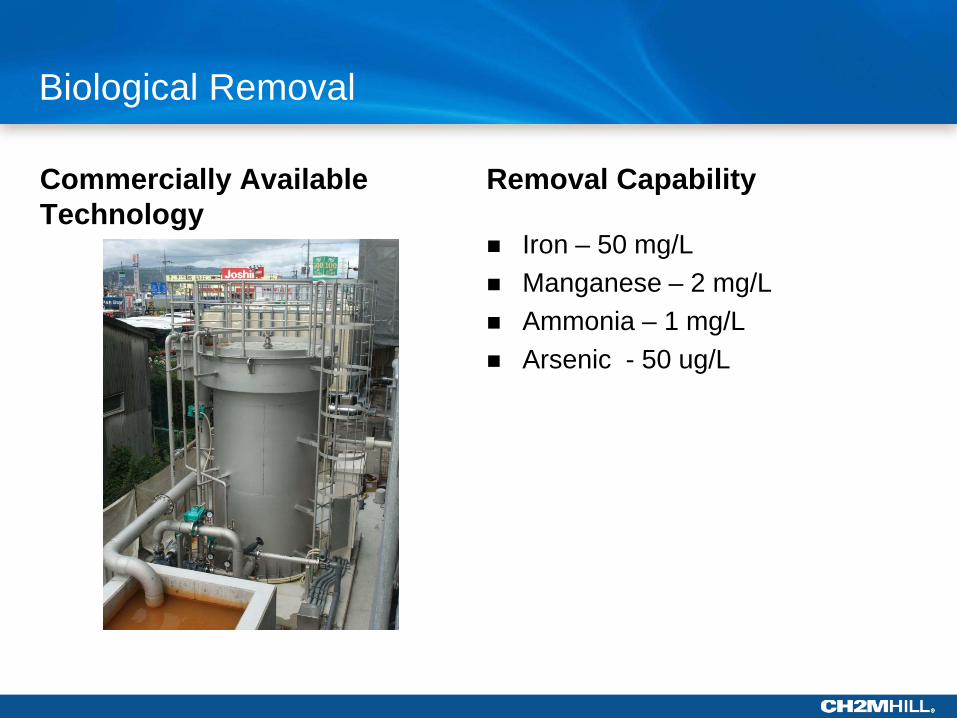
Commercially Available Technology
Removal Capability
Iron – 50 mg/L Manganese – 2 mg/L Ammonia – 1 mg/L Arsenic - 50 ug/L
Hydrogen Sulfide
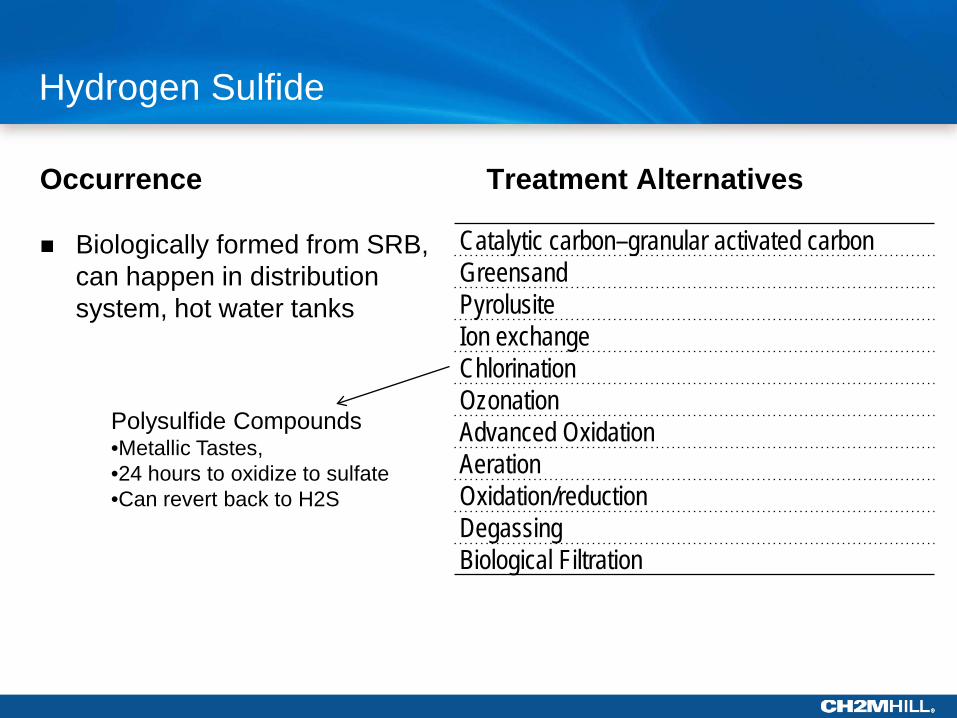
Occurrence
Biologically formed from SRB, can happen in distribution system, hot water tanks
Treatment Alternatives
Catalytic carbon–granular activated carbon Greensand Pyrolusite Ion exchange Chlorination Ozonation Advanced Oxidation Aeration Oxidation/reduction Degassing Biological Filtration
Polysulfide Compounds •Metallic Tastes, •24 hours to oxidize to sulfate •Can revert back to H2S
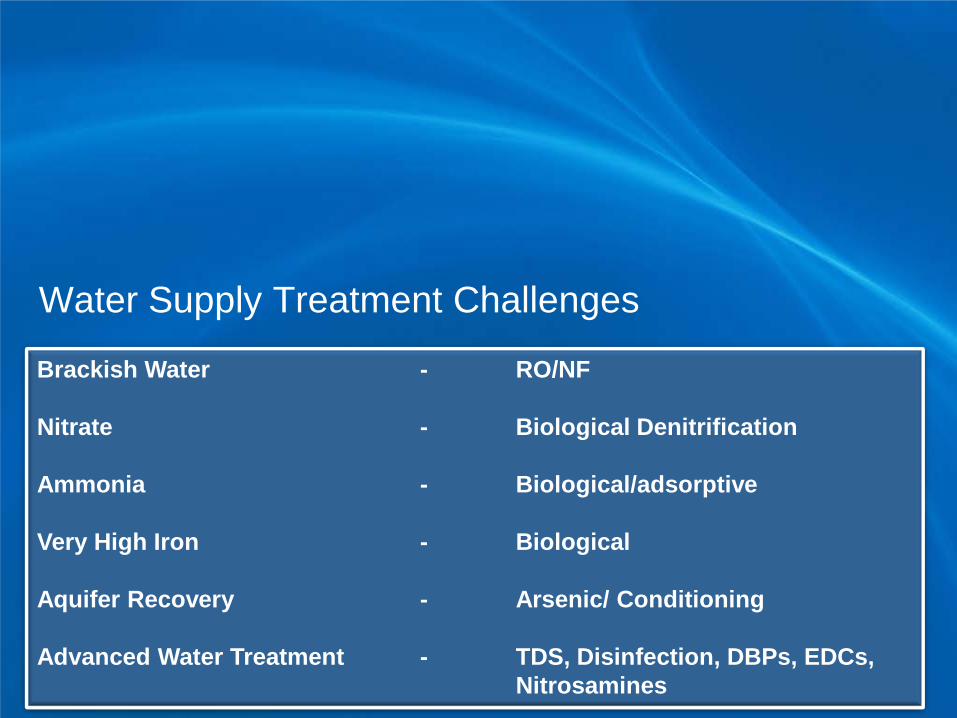
Water Supply Treatment Challenges
Brackish Water - RO/NF Nitrate - Biological Denitrification Ammonia - Biological/adsorptive Very High Iron - Biological Aquifer Recovery - Arsenic/ Conditioning Advanced Water Treatment - TDS, Disinfection, DBPs, EDCs, Nitrosamines

Brackish Water BWRO
Slime Formation in Strainers
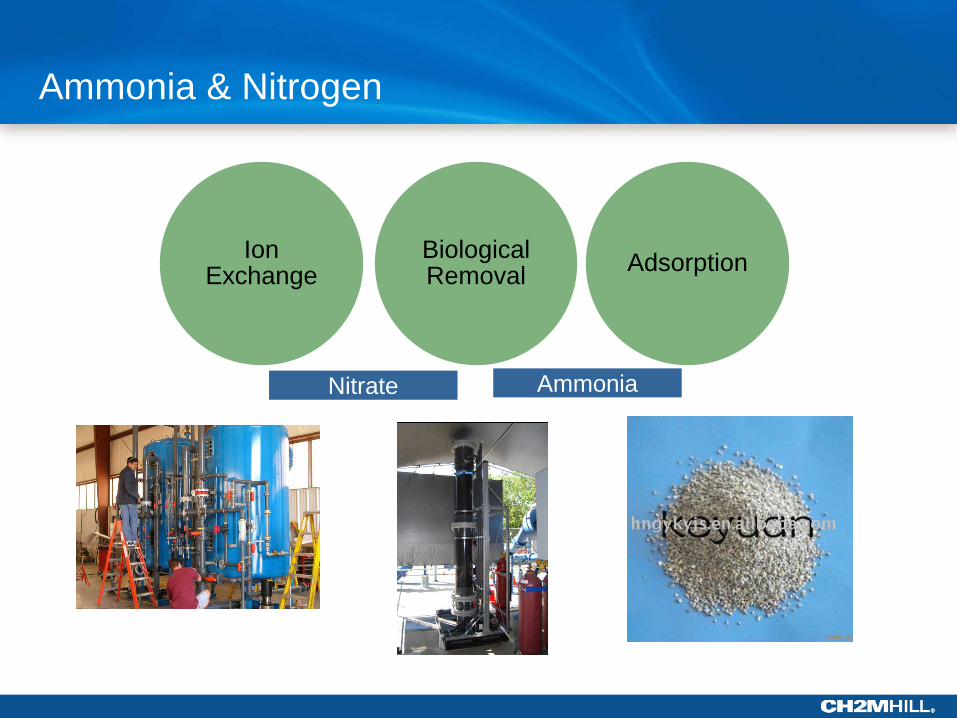
Ammonia & Nitrogen
Ion Exchange
Biological Removal Adsorption
Nitrate Ammonia
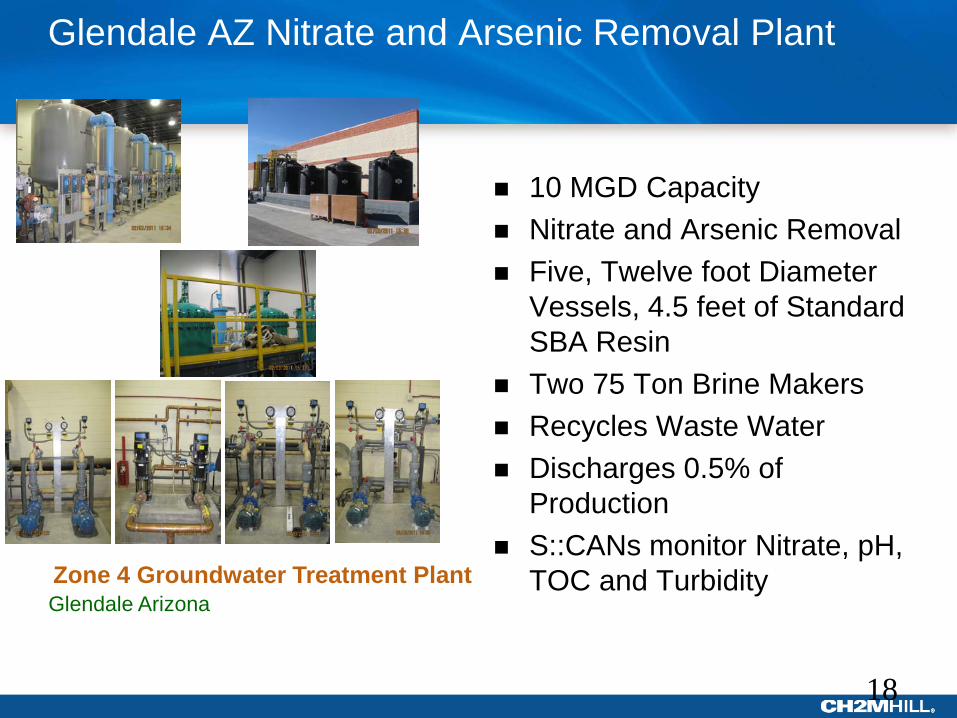
Glendale AZ Nitrate and Arsenic Removal Plant
18
10 MGD Capacity Nitrate and Arsenic Removal Five, Twelve foot Diameter
Vessels, 4.5 feet of Standard SBA Resin
Two 75 Ton Brine Makers Recycles Waste Water Discharges 0.5% of
Production S::CANs monitor Nitrate, pH,
TOC and Turbidity Glendale Arizona Zone 4 Groundwater Treatment Plant
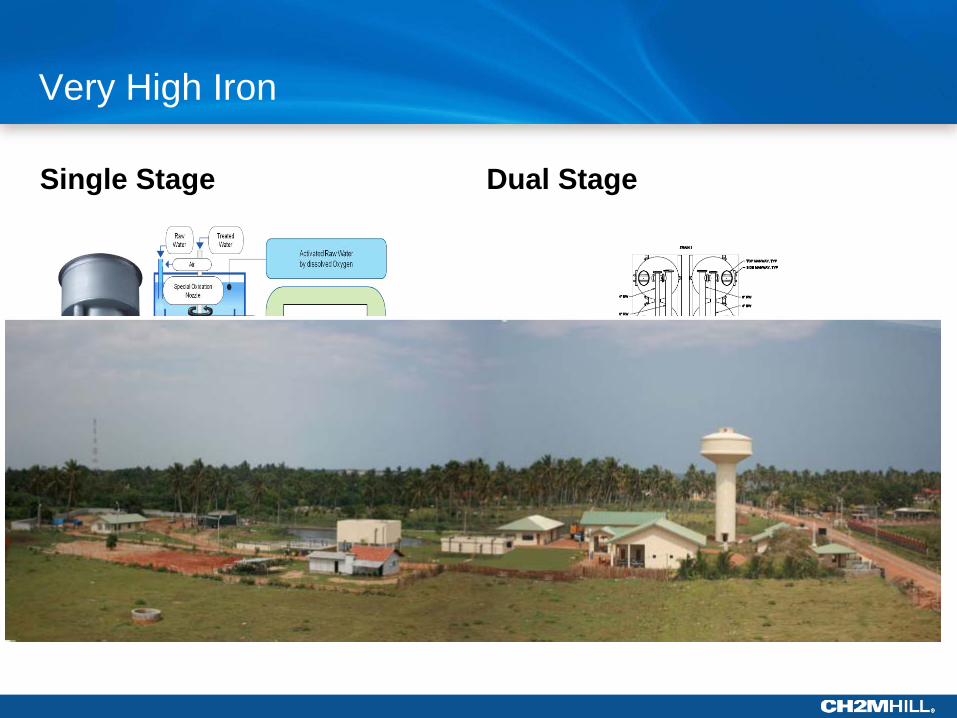
Very High Iron
Single Stage Dual Stage

Aquifer Recovery
Arsenic Aquifer Conditioning
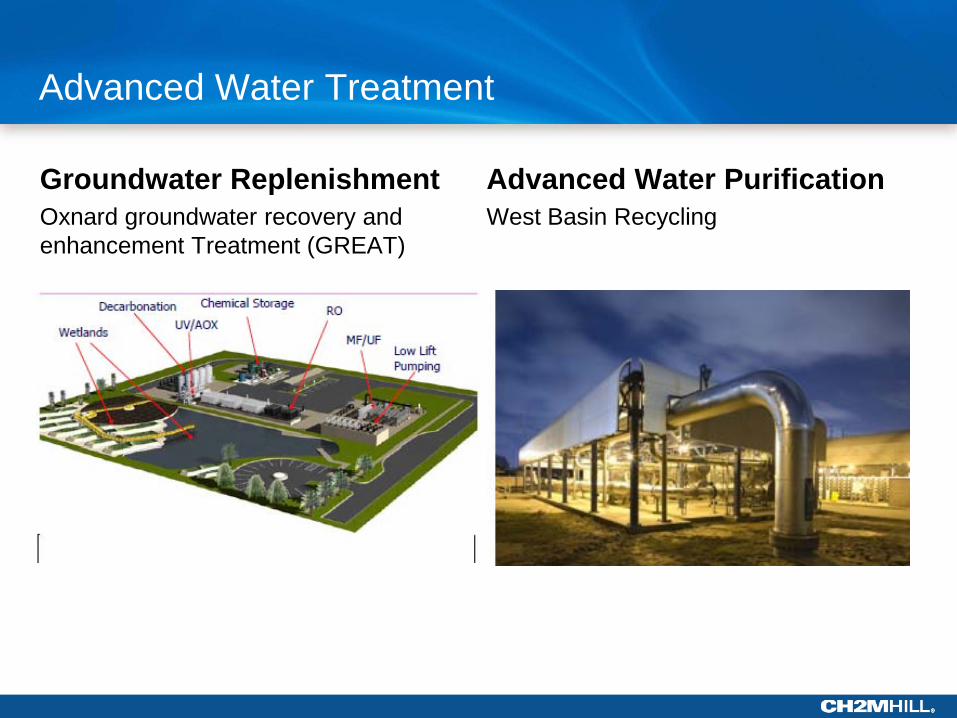
Advanced Water Treatment
Groundwater Replenishment Oxnard groundwater recovery and enhancement Treatment (GREAT)
Advanced Water Purification West Basin Recycling
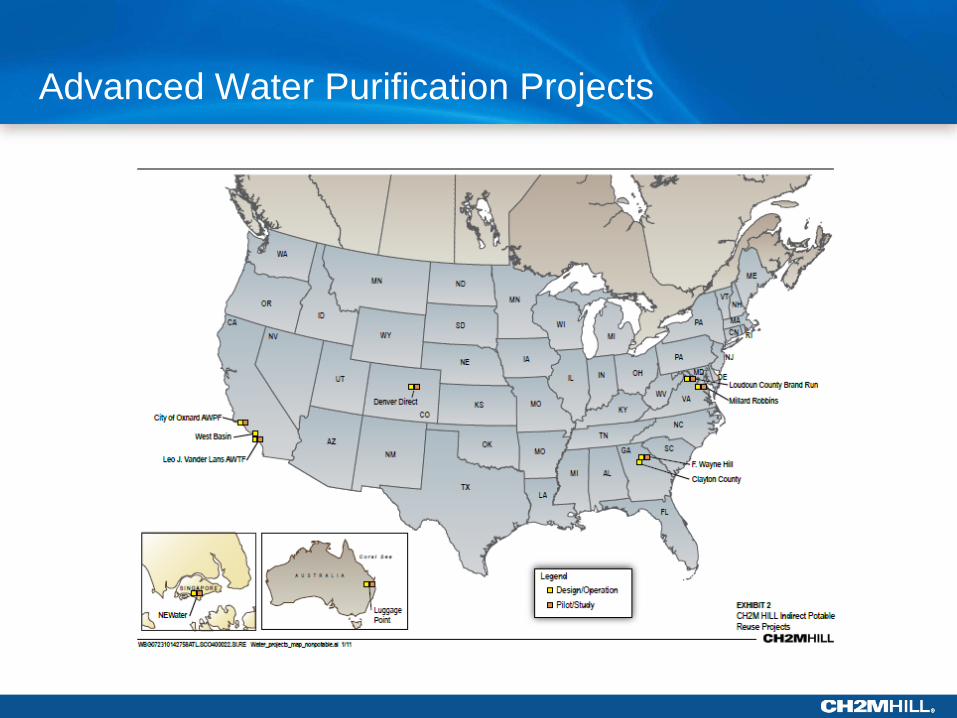
Advanced Water Purification Projects

Questions? Thank you! Lee Odell, PE Water Treatment Global Technology Lead CH2M HILL
Washington State Department of Health Environmental Public Health Division Office of Drinking Water
Groundwater Contaminants of Concern (or not) Samuel A. L. Perry
Water Treatment Engineer
Washington State Department of Health Environmental Public Health Division Office of Drinking Water
Public Health - Always Working for a Safer and Healthier Washington 2
Mission
To protect the health of the people of Washington State by ensuring safe and reliable drinking water.
Washington State Department of Health Environmental Public Health Division Office of Drinking Water
Public Health - Always Working for a Safer and Healthier Washington
Overview
General SDWA Regulatory Process Carcinogenic VOCs (Group) 8 Regulated (Benzene, PCE, TCE, etc...) 8 Unregulated (CCL3)
Hexavalent Chromium Perchlorate
3
4
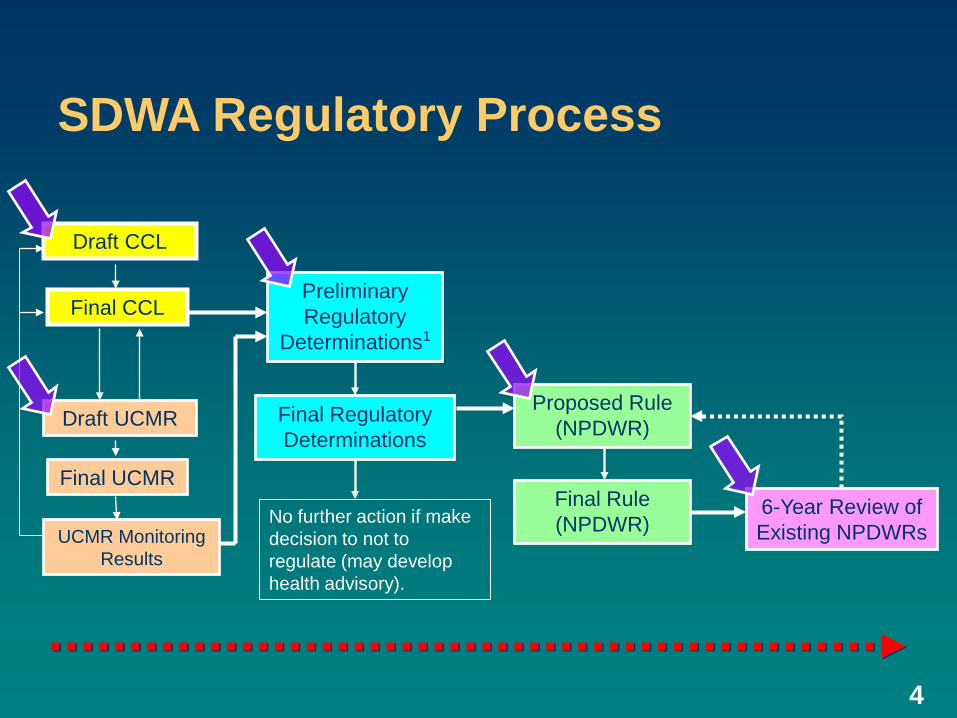
SDWA Regulatory Process
Draft CCL
Final CCL
Final Rule (NPDWR)
6-Year Review of Existing NPDWRs
No further action if make decision to not to regulate (may develop health advisory).
Preliminary Regulatory
Determinations1
Final Regulatory Determinations
Proposed Rule (NPDWR) Draft UCMR
Final UCMR
UCMR Monitoring Results

Washington State Department of Health Environmental Public Health Division Office of Drinking Water
Public Health - Always Working for a Safer and Healthier Washington 5
EPA is required to develop an MCLG and MCL for a contaminant if the Administrator determines that: 1. The contaminant may have an adverse
human health effect 2. The contaminant occurs or is likely to
occur in drinking water at a level of public health concern
3. Regulation of the contaminant presents a meaningful opportunity for health risk reduction
Three Criteria Used to Determine Whether or Not to Regulate
Washington State Department of Health Environmental Public Health Division Office of Drinking Water
Public Health - Always Working for a Safer and Healthier Washington 6
#1 - Carcinogenic VOCs (cVOCs)
Washington State Department of Health Environmental Public Health Division Office of Drinking Water
Public Health - Always Working for a Safer and Healthier Washington
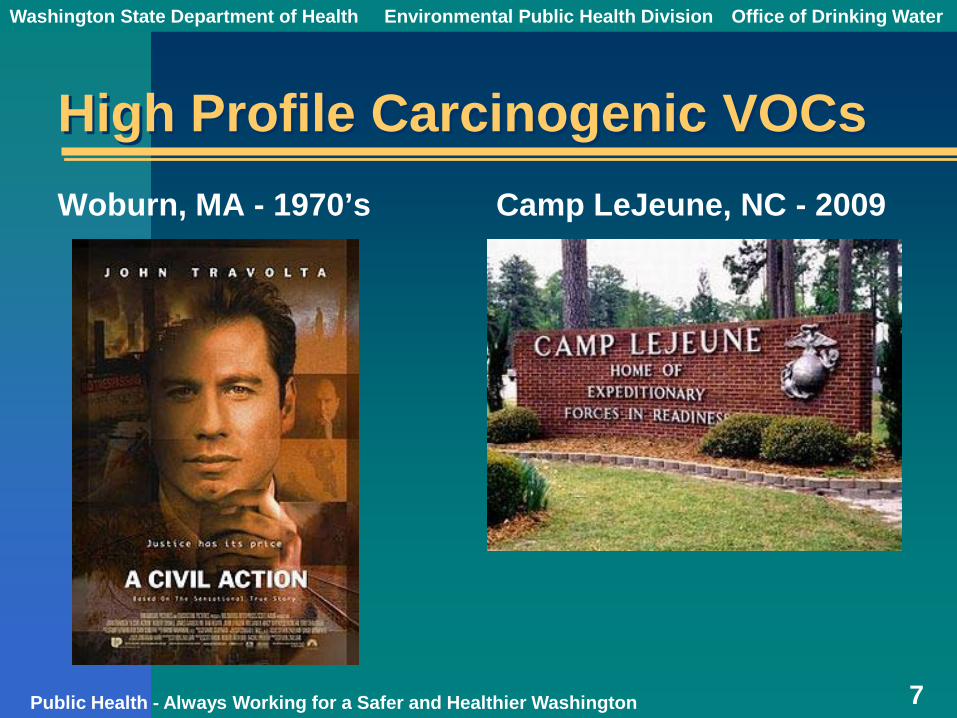
High Profile Carcinogenic VOCs Woburn, MA - 1970’s Camp LeJeune, NC - 2009
7

Washington State Department of Health Environmental Public Health Division Office of Drinking Water
Public Health - Always Working for a Safer and Healthier Washington 8
EPA’s New Drinking Water Strategy
March 22, 2010 – EPA Administrator Lisa Jackson outlines new approach for protecting drinking water and public health at AMWA meeting: 1. Address contaminants as groups rather than
one at a time 2. Foster development of new drinking water
technologies 3. Use the authority of multiple statutes to help
protect drinking water 4. Partner with States to share more complete
data from monitoring at public water systems

Washington State Department of Health Environmental Public Health Division Office of Drinking Water
Public Health - Always Working for a Safer and Healthier Washington
Groups for Potential Regulatory Development Near Term Carcinogenic VOCs
Nitrosamines
DBPs from Chlorination
Future Consideration Perfluorinated compounds (7)
Organophosphate pesticides (31)
Carbamate pesticides (11)
Triazine pesticides (6)
Chloroacetanilides (9)
Cyanotoxins (3)
9
Washington State Department of Health Environmental Public Health Division Office of Drinking Water
Public Health - Always Working for a Safer and Healthier Washington
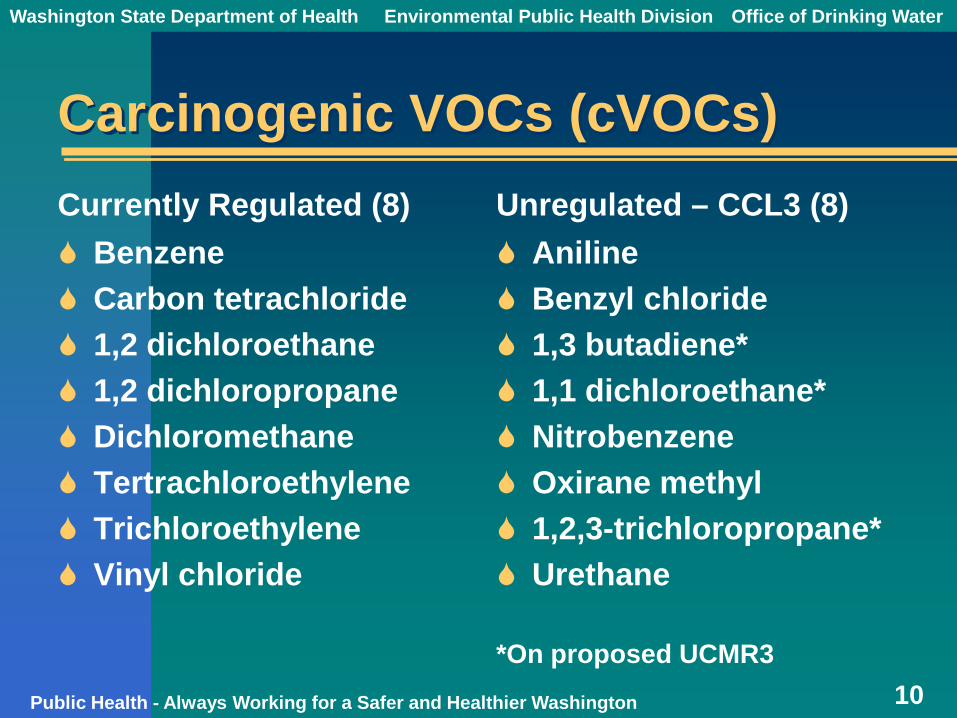
Carcinogenic VOCs (cVOCs) Currently Regulated (8) Benzene Carbon tetrachloride 1,2 dichloroethane 1,2 dichloropropane Dichloromethane Tertrachloroethylene Trichloroethylene Vinyl chloride
Unregulated – CCL3 (8) Aniline Benzyl chloride 1,3 butadiene* 1,1 dichloroethane* Nitrobenzene Oxirane methyl 1,2,3-trichloropropane* Urethane *On proposed UCMR3
10

Washington State Department of Health Environmental Public Health Division Office of Drinking Water
Public Health - Always Working for a Safer and Healthier Washington
Carcinogenic VOCs (cVOCs) Currently Regulated Benzene Carbon tetrachloride 1,2 dichloroethane 1,2 dichloropropane Dichloromethane Tertrachloroethylene Trichloroethylene Vinyl chloride
MCL 0.005 mg/L 0.005 mg/L 0.005 mg/L 0.005 mg/L 0.005 mg/L 0.005 mg/L 0.005 mg/L 0.002 mg/L
11
Washington State Department of Health Environmental Public Health Division Office of Drinking Water
Public Health - Always Working for a Safer and Healthier Washington
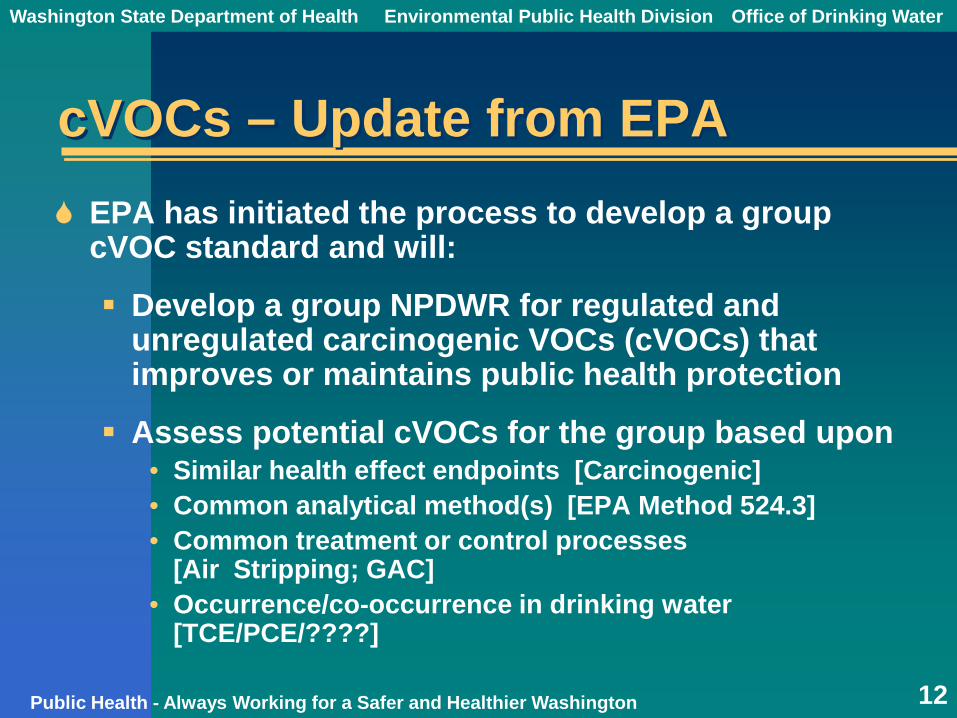
cVOCs – Update from EPA EPA has initiated the process to develop a group
cVOC standard and will:
Develop a group NPDWR for regulated and unregulated carcinogenic VOCs (cVOCs) that improves or maintains public health protection
Assess potential cVOCs for the group based upon • Similar health effect endpoints [Carcinogenic] • Common analytical method(s) [EPA Method 524.3] • Common treatment or control processes
[Air Stripping; GAC] • Occurrence/co-occurrence in drinking water
[TCE/PCE/????]
12
Washington State Department of Health Environmental Public Health Division Office of Drinking Water
Public Health - Always Working for a Safer and Healthier Washington
cVOCs – Update from EPA (cont.) EPA will also: Evaluate options for setting cVOC MCL(s) and
examine the feasibility of analytical methods and treatment technologies, and costs/benefits for the group
Hold consultations from June-December 2012: • Public stakeholder meeting • Science Advisory Board • National Drinking Water Advisory Council • Small Business Regulatory Enforcement Fairness Act • National Tribal Water Council
EPA expects to propose a regulation in Fall 2013
13 Ref. U.S. EPA 3/2012
Washington State Department of Health Environmental Public Health Division Office of Drinking Water
Public Health - Always Working for a Safer and Healthier Washington 14
#2 – Hexavalent Chromium
Washington State Department of Health Environmental Public Health Division Office of Drinking Water
Public Health - Always Working for a Safer and Healthier Washington
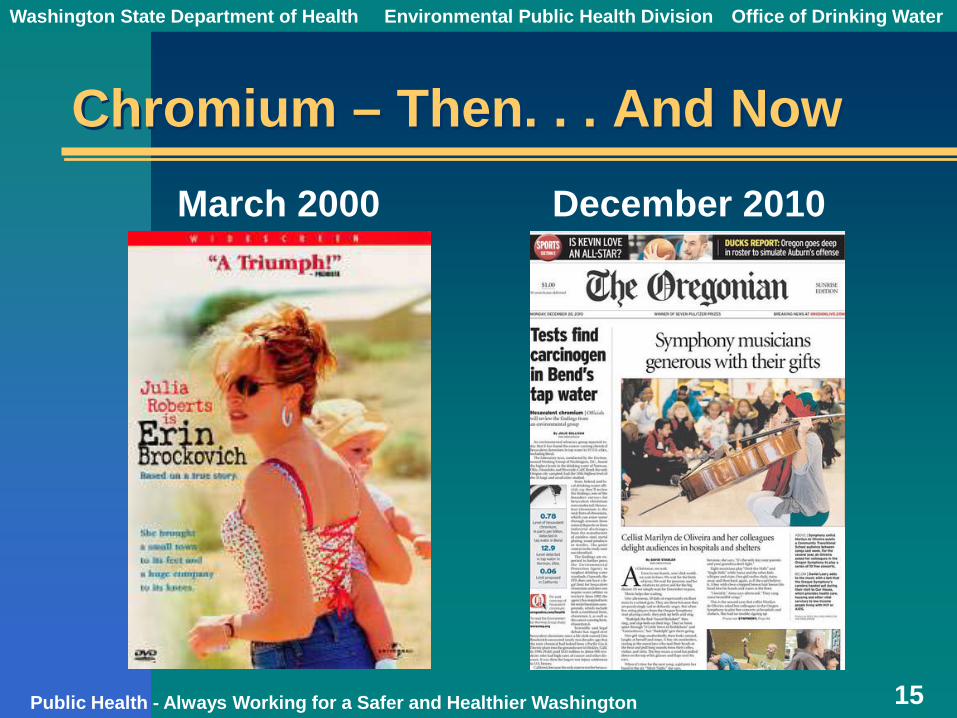
Chromium – Then. . . And Now
15
March 2000 December 2010
Washington State Department of Health Environmental Public Health Division Office of Drinking Water
Public Health - Always Working for a Safer and Healthier Washington
Chromium – Ancient History
1946 – USPHS standard of 50 ppb (measured as total chromium)
1975 – U.S. EPA reaffirms 50 ppb standard
1991 – U.S. EPA increases MCL to 100 ppb
… Meanwhile – WHO standard stay at 50 ppb
1999 – CA Public Health Goal of 2.5 ppb
16
Washington State Department of Health Environmental Public Health Division Office of Drinking Water
Public Health - Always Working for a Safer and Healthier Washington
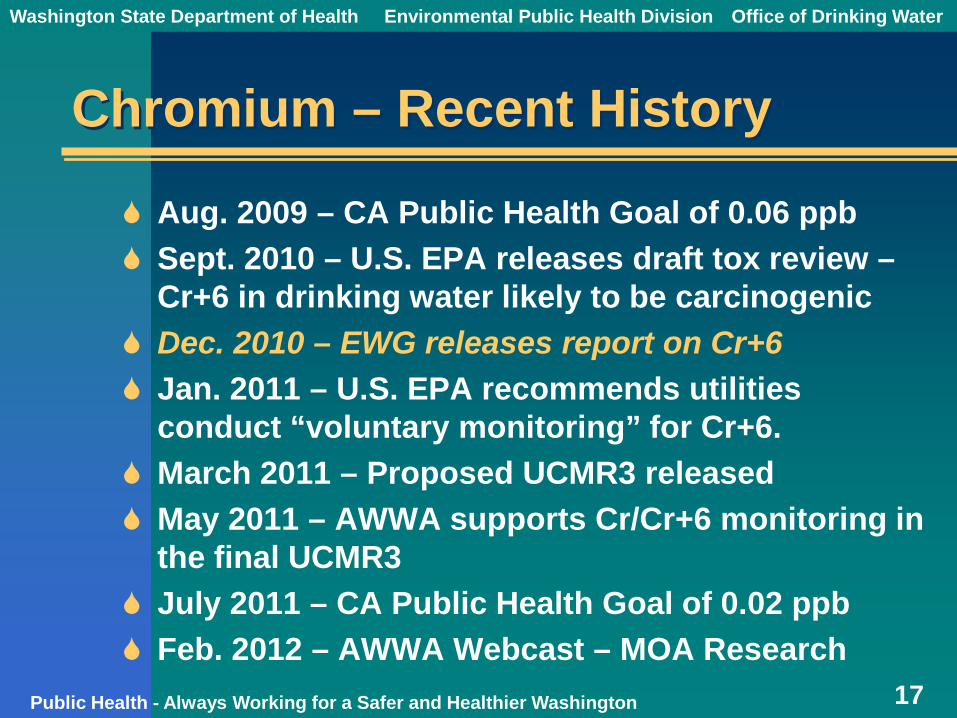
Chromium – Recent History
Aug. 2009 – CA Public Health Goal of 0.06 ppb Sept. 2010 – U.S. EPA releases draft tox review –
Cr+6 in drinking water likely to be carcinogenic Dec. 2010 – EWG releases report on Cr+6 Jan. 2011 – U.S. EPA recommends utilities
conduct “voluntary monitoring” for Cr+6. March 2011 – Proposed UCMR3 released May 2011 – AWWA supports Cr/Cr+6 monitoring in
the final UCMR3 July 2011 – CA Public Health Goal of 0.02 ppb Feb. 2012 – AWWA Webcast – MOA Research
17

Washington State Department of Health Environmental Public Health Division Office of Drinking Water
Public Health - Always Working for a Safer and Healthier Washington
Chromium – Occurrence
18
Concentration All Sources Groundwater Surface Water 0.2 ppb 39.0% 46.5% 23.9% 1.0 ppb 17.5% 25.4% 1.8% 3.0 ppb 8.8% 12.7% 0.9% 5.0 ppb 5.6% 7.9% 0.9%
10.0 ppb 1.5% 2.2% 0.0%
Percent of Systems with Source Waters Exceeding Cr(VI) Thresholds
Ref. Drinking Water Research (2011)
Washington State Department of Health Environmental Public Health Division Office of Drinking Water
Public Health - Always Working for a Safer and Healthier Washington
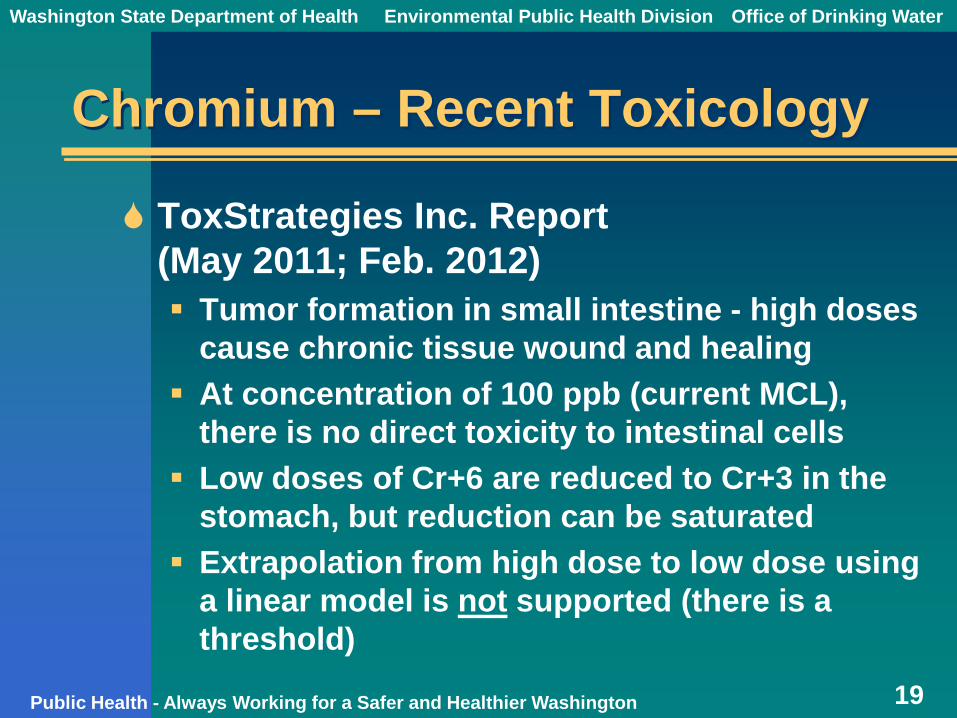
Chromium – Recent Toxicology
ToxStrategies Inc. Report (May 2011; Feb. 2012) Tumor formation in small intestine - high doses
cause chronic tissue wound and healing At concentration of 100 ppb (current MCL),
there is no direct toxicity to intestinal cells Low doses of Cr+6 are reduced to Cr+3 in the
stomach, but reduction can be saturated Extrapolation from high dose to low dose using
a linear model is not supported (there is a threshold)
19
Washington State Department of Health Environmental Public Health Division Office of Drinking Water
Public Health - Always Working for a Safer and Healthier Washington
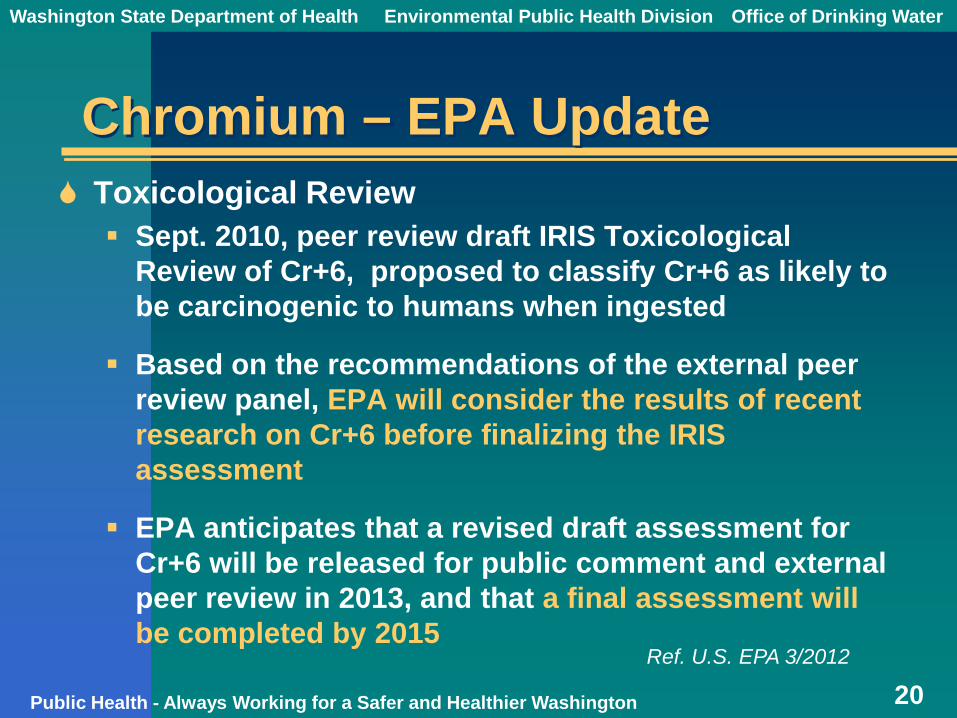
Chromium – EPA Update Toxicological Review Sept. 2010, peer review draft IRIS Toxicological
Review of Cr+6, proposed to classify Cr+6 as likely to be carcinogenic to humans when ingested
Based on the recommendations of the external peer review panel, EPA will consider the results of recent research on Cr+6 before finalizing the IRIS assessment
EPA anticipates that a revised draft assessment for Cr+6 will be released for public comment and external peer review in 2013, and that a final assessment will be completed by 2015
20 Ref. U.S. EPA 3/2012
Washington State Department of Health Environmental Public Health Division Office of Drinking Water
Public Health - Always Working for a Safer and Healthier Washington 21
#3 - Perchlorate
Washington State Department of Health Environmental Public Health Division Office of Drinking Water
Public Health - Always Working for a Safer and Healthier Washington
Washington State Department of Health Environmental Public Health Division Office of Drinking Water
Public Health - Always Working for a Safer and Healthier Washington 23
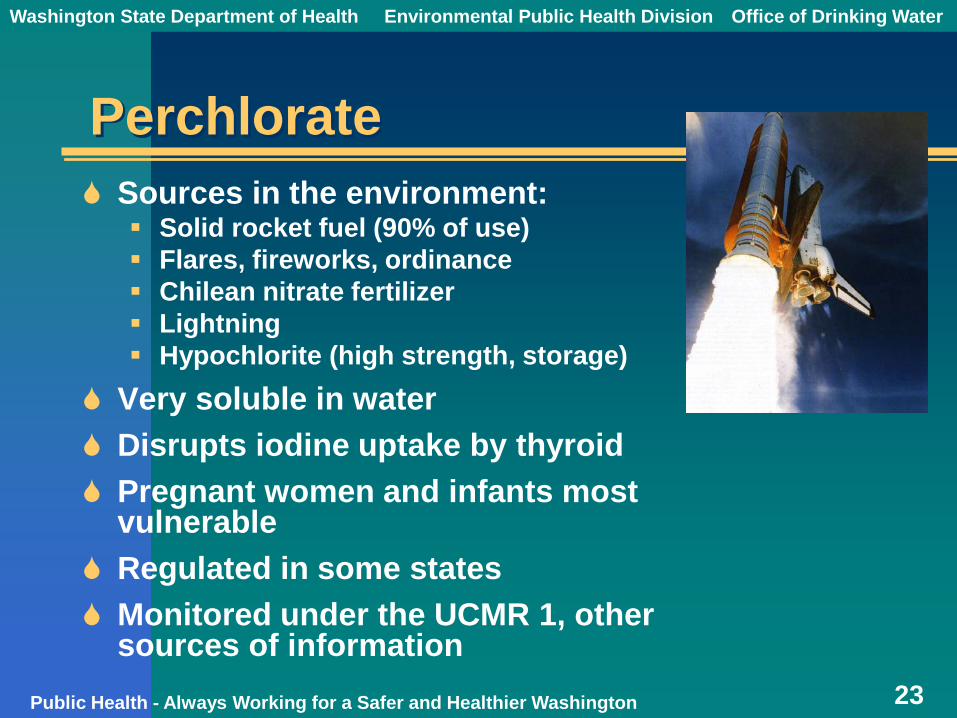
Perchlorate Sources in the environment:
Solid rocket fuel (90% of use) Flares, fireworks, ordinance Chilean nitrate fertilizer Lightning Hypochlorite (high strength, storage)
Very soluble in water Disrupts iodine uptake by thyroid Pregnant women and infants most
vulnerable Regulated in some states Monitored under the UCMR 1, other
sources of information
Washington State Department of Health Environmental Public Health Division Office of Drinking Water
Public Health - Always Working for a Safer and Healthier Washington
Perchlorate – Regulatory History
24
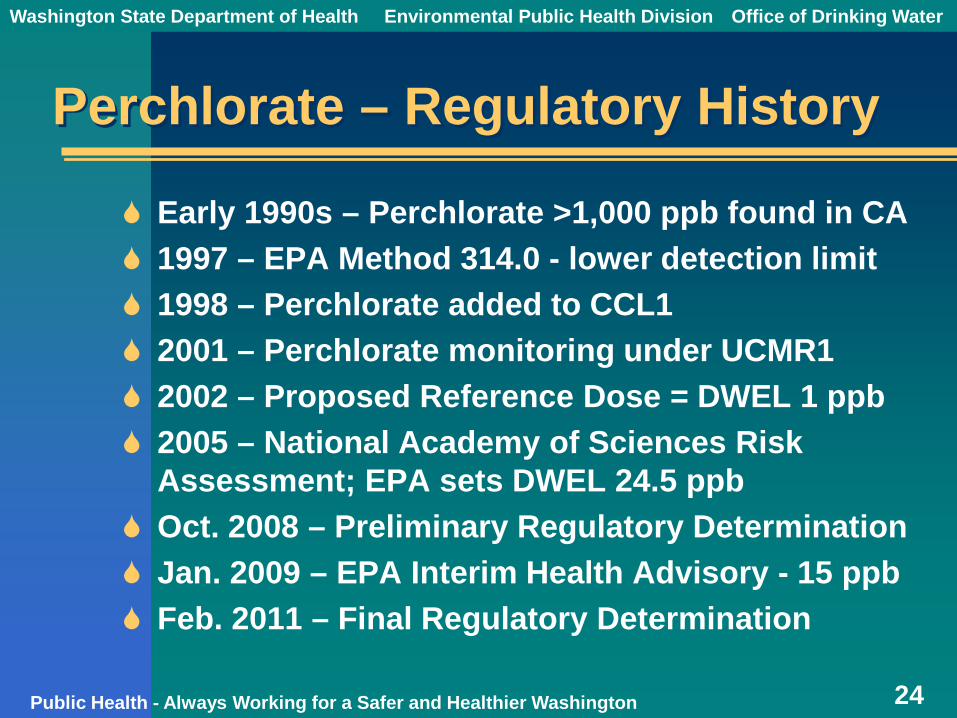
Early 1990s – Perchlorate >1,000 ppb found in CA 1997 – EPA Method 314.0 - lower detection limit 1998 – Perchlorate added to CCL1 2001 – Perchlorate monitoring under UCMR1 2002 – Proposed Reference Dose = DWEL 1 ppb 2005 – National Academy of Sciences Risk
Assessment; EPA sets DWEL 24.5 ppb Oct. 2008 – Preliminary Regulatory Determination Jan. 2009 – EPA Interim Health Advisory - 15 ppb Feb. 2011 – Final Regulatory Determination

Washington State Department of Health Environmental Public Health Division Office of Drinking Water
Public Health - Always Working for a Safer and Healthier Washington
Perchlorate – GAO Audit
GAO report released May 2011 Broadly critical of political
appointees involvement in the scientific process In 2008 preliminary regulatory
determination, “EPA used a process that … lacked transparency and limited the agency independence in developing scientific findings”.
“The Assistant Administrator directed staff to develop a determination not to regulate”
“The agency mischaracterized important scientific findings on the sensitivity of [infants] to perchlorate”
25

Washington State Department of Health Environmental Public Health Division Office of Drinking Water
Public Health - Always Working for a Safer and Healthier Washington
Perchlorate – UCMR Round 1
-40 80
120 160 200
Wat
er S
yste
ms
w/ D
etec
ts
26

Washington State Department of Health Environmental Public Health Division Office of Drinking Water
Public Health - Always Working for a Safer and Healthier Washington
Perchlorate – Occurrence
27
Concentration UCMR - 1 CA- DHS 2 ppb 4.1% 10.5% 4 ppb 2.6% 5.8% 6 ppb 1.6% 3.2%
10 ppb 0.9% 1.5% 20 ppb 0.2% 0.3%
Percent of Systems with Source Waters Exceeding Perchlorate Thresholds
Ref. Clark and Brandhuber (2005)
Washington State Department of Health Environmental Public Health Division Office of Drinking Water
Public Health - Always Working for a Safer and Healthier Washington
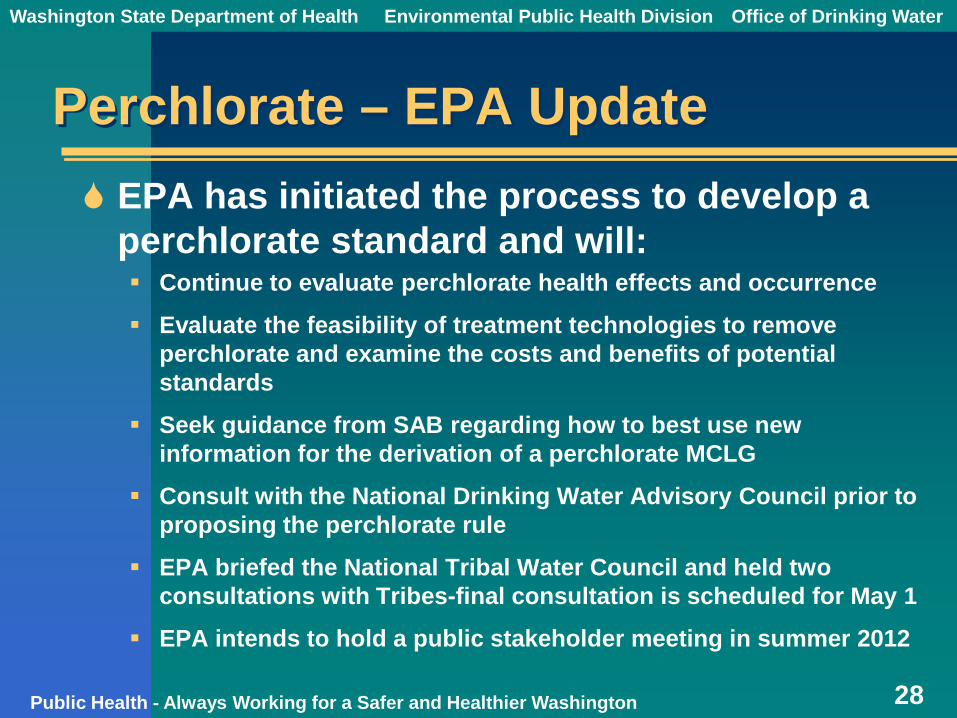
Perchlorate – EPA Update EPA has initiated the process to develop a
perchlorate standard and will: Continue to evaluate perchlorate health effects and occurrence
Evaluate the feasibility of treatment technologies to remove perchlorate and examine the costs and benefits of potential standards
Seek guidance from SAB regarding how to best use new information for the derivation of a perchlorate MCLG
Consult with the National Drinking Water Advisory Council prior to proposing the perchlorate rule
EPA briefed the National Tribal Water Council and held two consultations with Tribes-final consultation is scheduled for May 1
EPA intends to hold a public stakeholder meeting in summer 2012
28
Washington State Department of Health Environmental Public Health Division Office of Drinking Water
Public Health - Always Working for a Safer and Healthier Washington
Perchlorate – EPA Update (cont.)
The SDWA deadline to publish the proposed regulation for comment is February 2013
SDWA requires final regulation within 18 months of the proposal
29
Ref. U.S. EPA 3/2012

Washington State Department of Health Environmental Public Health Division Office of Drinking Water
Public Health - Always Working for a Safer and Healthier Washington
Conclusions
SDWA Regulatory Determination Process – No new chemical MCLs since 1996 cVOCs – Expect a proposed group
MCL in late 2013 Cr+6 – A revised MCL is questionable Perchlorate – Expect a proposed MCL
by early 2013
30

Washington State Department of Health Environmental Public Health Division Office of Drinking Water
Questions & Comments
31

Washington State Department of Health Environmental Public Health Division Office of Drinking Water
Public Health - Always Working for a Safer and Healthier Washington 32
For More Information
Sam Perry 253-395-6755 [email protected]

TIPS FOR SUCCESSFUL WATER RIGHT PERMITTING
Water Right Permitting 101

Let’s Talk About
• Ways to get your application processed • Understanding the actual work load • Why use Water Conservancy Boards • Understanding and making the most of Cost
Reimbursement process
The Obvious
• New water rights are hard to get but still possible
• Changes and transfers still a good option
• Investment in process can be considerable
• CRA’s and WCB’s predictable and timely

Basic Steps
• Filing Applications • Publishing Notice • Conduct Investigation
and Prepare ROE • Get Ecology’s Approval • Perfecting the right or
completing the change
Investigating Your Water Right Application Would it surprise you to learn that one of those steps is actually a black hole?
Investigation of a Change Application
• Attributes of your water rights • Legal standing - relinquishment • Quantification – Tentative determination • Role of other water rights • Public Interest • HG Considerations – same body/impairment • Impairment – and Mitigation
New Application
• 4-tests (Availability, Impairment, Beneficial Use and Public Interest)
• How are other rights affected? • How are surface water bodies affected? • Will mitigation address those effects?

Ways to Get Processed
• Direct “In house” Processing by Ecology
• Water Conservancy Boards (Changes)
• Cost Reimbursement Program (All)
Ecology “In house” Processing
• Two Lines • “Hillis” Rule Priorities
– Public Health and Safety – Substantial
Environmental Benefits – Public Water supply for
Regional Areas – Court ordered -
Adjudications
Conservancy Boards
• Work only on Change
Applications • Working in 21 Counties • Independent fee based • Recommendations made
to Ecology • Authority to review same
as Ecology

Cost Reimbursement
• Classic Pay-to-Play • Agreement between
Ecology and Applicant to pay for processing
• Can be used for Change Applications or New Applications
• Can be the only game in town
Cost Reimbursement
• Work done by pre-approved consultant roster • Consultants hired to conduct investigation • Consultants draft ROE and make
recommendations to Ecology

Who Benefits?
• Isolated Applications • Applications with built-in
mitigation • Water Budget Neutral
projects

Basic Steps
• Starts with a formal request • Phase 1 prepared that identifies other applicants • Applicant picks a consultant team • Consultant prepares a scope and budget • Consultant proceeds to draft ROE for Ecology
Standard CRA
• Usually a Single Applicant
• Contract between applicant and Ecology
• Contract between Ecology and Consultant

CRA Costs $$$$
• You will be paying four times! – Your own consultant – Ecology’s consultant – Ecology for Direct Costs – Ecology for Backfill

Questions?