fundamentals of soil mechanics for sedimentary and residual soils (wesley/fundamentals soil...
TRANSCRIPT

CHAPTER 15
SOIL COMPACTION
15.1 EARTHWORKS AND SOIL COMPACTION
Earthworks, which involve the excavation, transport, and recompaction ofsoil, are carried out for a variety of reasons, including reshaping of theground to make it more suitable for suburban or commercial use, the con-struction of embankments for highways or railways, and the construction ofearth dams. As mentioned in Chapter 8, the term compaction should not beconfused with consolidation. Compaction is a mechanical process in whichdynamic energy is used to make the soil more compact; it squeezes air outof the void spaces and thus pushes the soil particles closer together. It doesnot involve the removal of any water from the soil during the compactionprocess itself, although drying or wetting the soil may be done prior tocommencement of the compaction operation.
Compaction can be carried out using various devices. In the field, com-paction of clay can be done using various types of equipment, includingsmooth wheeled rollers, pneumatic-tyred rollers, “sheepsfoot” rollers, andgrid rollers. Compaction of granular materials is best done using vibrat-ing rollers, which are normally smooth wheeled. In the laboratory, soil isnormally compacted using falling-weight hammers (or rammers) of knowndimensions.
15.2 COMPACTION BEHAVIOR OF SOILS
The behavior of soils during the compaction process is best understood byconsidering the laboratory tests normally used to measure compaction char-acteristics. These tests are generally referred to as the standard Proctor test
391Fundamentals of Soil Mechanics for Sedimentary and Residual Soils Laurence D. WesleyCopyright © 2009 John Wiley & Sons, Inc. ISBN: 978-0-470-37626-3
392 SOIL COMPACTION
30 c
m
11.5
5 cm
10.5 cm
Hammer mass = 2.5 kg (for standard Proctor test)
Mold volume = 1000 cm3
Mold collar
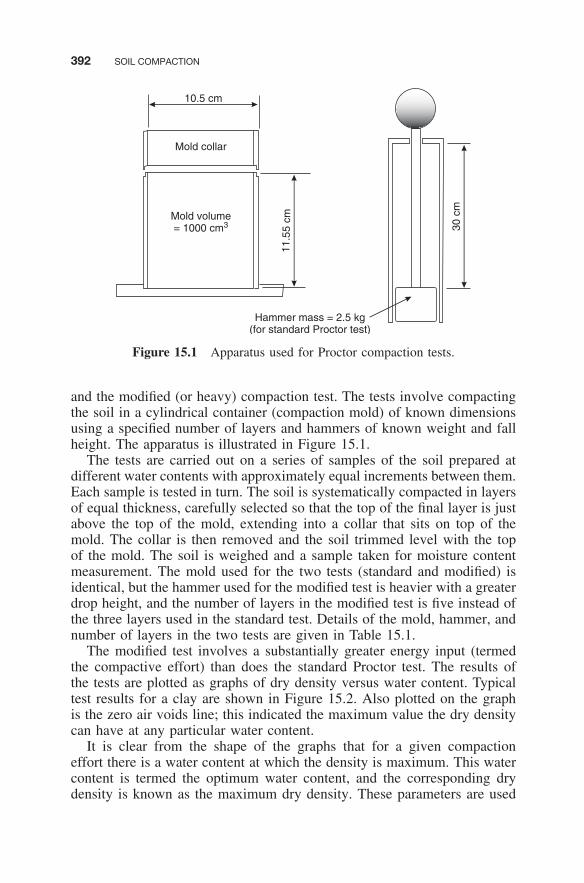
Figure 15.1 Apparatus used for Proctor compaction tests.
and the modified (or heavy) compaction test. The tests involve compactingthe soil in a cylindrical container (compaction mold) of known dimensionsusing a specified number of layers and hammers of known weight and fallheight. The apparatus is illustrated in Figure 15.1.
The tests are carried out on a series of samples of the soil prepared atdifferent water contents with approximately equal increments between them.Each sample is tested in turn. The soil is systematically compacted in layersof equal thickness, carefully selected so that the top of the final layer is justabove the top of the mold, extending into a collar that sits on top of themold. The collar is then removed and the soil trimmed level with the topof the mold. The soil is weighed and a sample taken for moisture contentmeasurement. The mold used for the two tests (standard and modified) isidentical, but the hammer used for the modified test is heavier with a greaterdrop height, and the number of layers in the modified test is five instead ofthe three layers used in the standard test. Details of the mold, hammer, andnumber of layers in the two tests are given in Table 15.1.
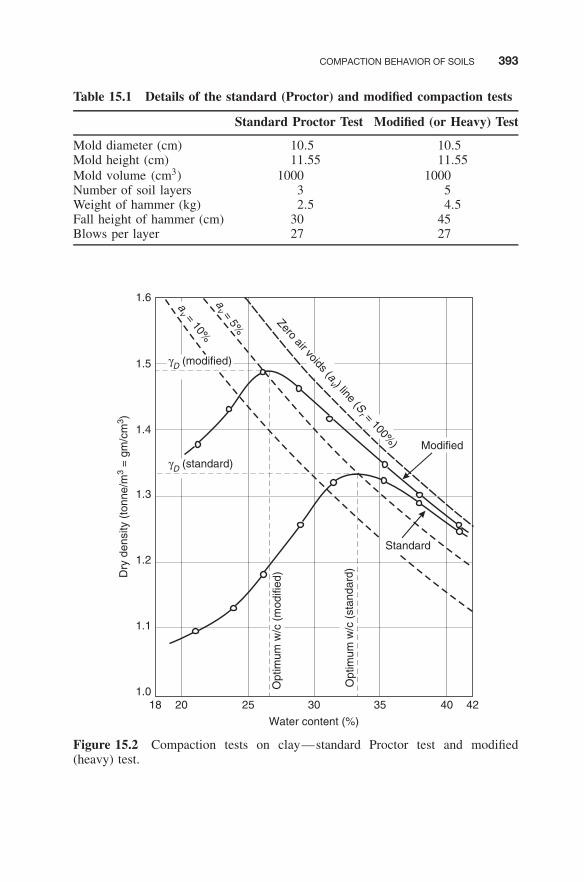
The modified test involves a substantially greater energy input (termedthe compactive effort) than does the standard Proctor test. The results ofthe tests are plotted as graphs of dry density versus water content. Typicaltest results for a clay are shown in Figure 15.2. Also plotted on the graphis the zero air voids line; this indicated the maximum value the dry densitycan have at any particular water content.
It is clear from the shape of the graphs that for a given compactioneffort there is a water content at which the density is maximum. This watercontent is termed the optimum water content, and the corresponding drydensity is known as the maximum dry density. These parameters are used
COMPACTION BEHAVIOR OF SOILS 393
Table 15.1 Details of the standard (Proctor) and modified compaction tests
Standard Proctor Test Modified (or Heavy) Test
Mold diameter (cm) 10.5 10.5Mold height (cm) 11.55 11.55Mold volume (cm3) 1000 1000Number of soil layers 3 5Weight of hammer (kg) 2.5 4.5Fall height of hammer (cm) 30 45Blows per layer 27 27
1.6
1.5
1.4
1.3
1.2
1.1
1.018 20 25 30 35 40 42
Water content (%)
Dry
den
sity
(to
nne/
m3
= g
m/c
m3 )
Zero air voids (av ) line (S
r = 100%) Modified
Standard
γD (standard)
γD (modified)O
ptim
um w
/c (
stan
dard
)
Opt
imum
w/c
(m
odifi
ed)
av = 5%
av = 10%
Figure 15.2 Compaction tests on clay—standard Proctor test and modified(heavy) test.

394 SOIL COMPACTION
in the traditional method for controlling the compaction of soil in the field(see Section 15.3). It should be clearly appreciated that the optimum watercontent is not a unique property of the soil; it is simply the preferredwater content at which to compact the soil using a particular method ofcompaction or particular compactive effort. The optimum water content ofthe soil is different for each compactive effort. For the soil in Figure 15.2,the optimum water content from the modified compaction test is about 8percent below that for the standard compaction test. This is normal formoderate- to high-plasticity clays. It is worth noting also that for moderate-to high-plasticity clays the optimum water content from the standard Proctorcompaction test is normally close to the plastic limit.
Before describing the traditional compaction control method based onthese compaction tests (and possible alternatives), there are other aspectsof compaction behavior that we need to be aware of. First, many soilsare extremely variable, and the results of compaction tests of the sortdescribed above on samples from these soils may produce a wide rangeof results. This is illustrated in Figure 15.3, whichs show the results ofcompaction tests from two construction sites in the Auckland region ofNew Zealand.
Both sites are relatively small, and the soil involved is of the samegeological origin. At the first site the soil consists of relatively recent sedi-mentary soils of Pleistocene origin, while the second site consists of mucholder soils weathered from a range of volcanic deposits, including basalticlava flows and ash layers. Despite the common origin of the materials andthe limited size of the sites, there is a very large variation in the type ofsoil, as reflected in the compaction curves shown in Figure 15.3.
Industrial site: Pleistocene deposits
Steel mill site: Weathered basalt and ashes
Zero air voids line
Zero air voids line
20 40 60 80 40 50 60 70
Water content (%) Water content (%)
1.8
1.4
1.0
0.8
1.3
1.2
1.1
1.0
0.9
Dry
den
sity
(gm
/cm
3 )
Figure 15.3 Standard compaction curves from two sites with widely varying soiltypes. (After Pickens, 1980.)

COMPACTION BEHAVIOR OF SOILS 395
Second, some unusual soils do not conform to the behavior illustrated inFigures 15.2 and 15.3. Their compaction curves do not show clear peaks ofdry density and thus do not indicate optimum values of water content. Onesuch soil is clay containing a high proportion of the clay mineral allophane.As mentioned in Chapter 1, allophane is a very unusual mineral and clayswith a high allophane content display some rather unique properties. Oneof their distinctive characteristics is the very flat nature of their compactioncurves. Figure 15.4 shows typical results of compaction tests on two samplesof allophane clay.
The tests have been carried out by progressively drying the soil fromits natural water content, which was 166 and 195 percent for samples Aand B, respectively. Fresh soil was used for each point on the compactioncurve. This procedure is essential as repeated compaction may progressivelysoften the soil, and excessive drying before testing can irreversably alterits properties (see Wesley, 2002). Standard compactive effort was used forthe tests. Sample A shows an optimum water content around 135 percent,although it is not well defined, and sample B does not show an optimumvalue at all. The highest dry density is achieved by progressively dryingthe soil to very low water contents, but such a procedure is unlikely to befeasible in practice.
Third, some soils become softer during the compaction process. As wehave seen, many soils, especially residual soils, are “structured,” and whenremolded this structure is broken down and the soil becomes softer. It isimportant to recognize that compaction of a soil can have two importantbut very different effects, one of which is not actually compaction at all.These effects are:
(a) “Densifying” the soil, that is, pushing the particles closer together andsqueezing out air entrapped between the particles.
20 40 60 80 100 120 140 160 180 200
0.8
0.6
0.4
0.2
Water content (%)
Dry
den
sity
g/c
m3
Zero a ir v oids
1.0
Sample A
Sample B
Nat
ural
wat
erco
nten
t = 1
95%
Nat
ural
wat
er
cont
ent =
166
%
Figure 15.4 Standard Proctor compaction test on an allophane clay.
396 SOIL COMPACTION
(b) Remolding the soil, causing it to soften. This is usually accompaniedby release of water trapped within or between the particles, adding tothe softening process.
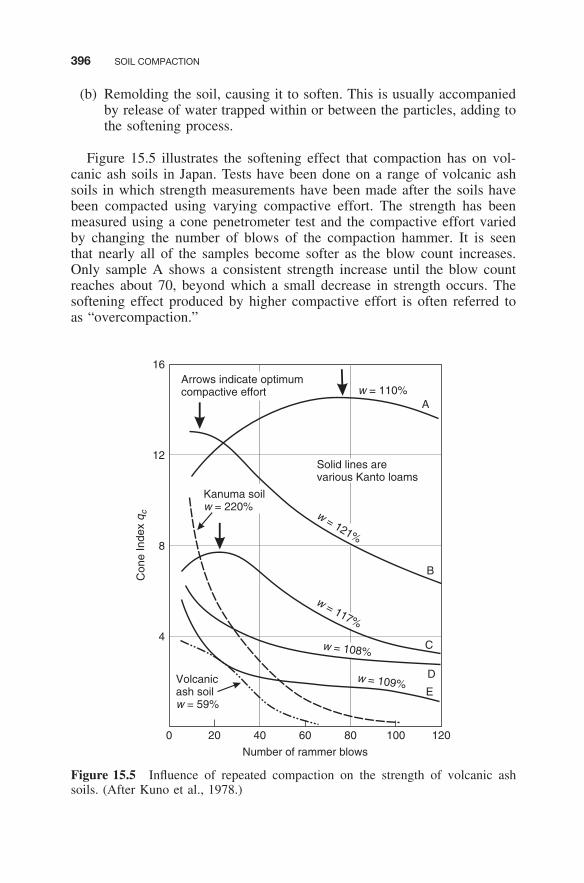
Figure 15.5 illustrates the softening effect that compaction has on vol-canic ash soils in Japan. Tests have been done on a range of volcanic ashsoils in which strength measurements have been made after the soils havebeen compacted using varying compactive effort. The strength has beenmeasured using a cone penetrometer test and the compactive effort variedby changing the number of blows of the compaction hammer. It is seenthat nearly all of the samples become softer as the blow count increases.Only sample A shows a consistent strength increase until the blow countreaches about 70, beyond which a small decrease in strength occurs. Thesoftening effect produced by higher compactive effort is often referred toas “overcompaction.”
16
12
8
4
0 20 40 60 80 100 120
Number of rammer blows
Con
e In
dex
q c
Kanuma soil w = 220%
Volcanic ash soil w = 59%
Solid lines are various Kanto loams
w = 121%
w = 117%
w = 108%
w = 109%
A
B
C
D
E
Arrows indicate optimum compactive effort w = 110%
Figure 15.5 Influence of repeated compaction on the strength of volcanic ashsoils. (After Kuno et al., 1978.)
CONTROL OF COMPACTION 397
15.3 CONTROL OF COMPACTION
15.3.1 Traditional Method of Compaction Control
The normal method for controlling compaction is to carry out a laboratorycompaction test, either the standard Proctor or the modified test, and use theresults to specify limits of water content and dry density. Common practicewould be to specify water content limits within several percentage pointson each side of the optimum water content and minimum dry density notless than 90 or 95 percent of maximum dry density. The choice betweenthe standard Proctor test and the modified test should be made taking intoconsideration the following factors:
(a) The purpose for which the soil is being compacted. If it is a rela-tively low embankment for a road, then a very high-quality materialis unlikely to be required and the standard Proctor test would be appro-priate. However, if the objective is a high earth dam, then a higherquality fill may be desirable, in which case the modified test wouldbe more appropriate.
(b) The equipment available for compaction in the field. If only lightequipment is available, then it would be unlikely that the densitycorresponding to the modified test could be achieved.
(c) The natural water content of the soil and the weather conditions atthe site. If the natural water content is high in relation to the optimumwater content from the standard Proctor test and climatic conditionsare such that drying of the soil may be difficult, then it would clearlybe impractical to adopt the modified optimum water content, whichwould require much more drying than the standard Proctor optimumvalue.
It will be apparent from the compaction characteristics described inSection 15.2 that the traditional method for controlling compaction is notalways easy to apply. In particular, when soil characteristics vary as muchas in Figure 15.3, use of the traditional method is simply not practical, andalternative methods are desirable. In the author’s experience, the methoddescribed in the following section is a very appropriate and practical alter-native. It was developed in New Zealand to cope with the rapid variationsthat occur in many local residual soils and is described in detail by Pickens(1980). An outline only of the method is given in the next section.
15.3.2 Alternative Compaction Control Based on Undrained ShearStrength and Air Voids
The principal objectives in compacting soil are normally to create a fill ofhigh strength and low compressibility and, in the case of water-retaining

398 SOIL COMPACTION
fills, of low permeability. It is also desirable that the fill will not signifi-cantly soften with time as a result of exposure to rainfall. In adopting thetraditional control method it is assumed that by aiming for maximum den-sity the above objectives will be achieved. This is not automatically true,and there is no reason why other parameters will not achieve the intendedobjectives equally well. Undrained shear strength and air voids appear to besuitable alternative parameters and are more directly related to the intendedproperties of the fill.
Figure 15.6 illustrates the basis for using undrained shear strength; itshows the results of a standard Proctor compaction test on clay, duringwhich measurements of undrained strength have been made, in addition todensity and water content. The measurements have been made using botha hand shear vane and unconfined compressive tests on samples of thecompacted soil. The two strength measurements give significantly differentresults.
It is seen that at the optimum water content the undrained shear strengthis about 150 kPa from the unconfined tests and about 230 kPa from the vanetests. Conventional specifications may allow water contents 2 or 3 percentgreater than optimum, in which case the comparable shear strength valueswould be about 120 and 180 kPa. Thus to obtain a fill with comparableproperties to those obtained with conventional control methods, specifyinga minimum undrained shear strength in the range of about 150–200 kPa
20 25 30 35 40
Water content (%)
1.5
0
100
200
300
1.6
1.4
1.3
1.7Vane testsUnconfined comp. tests
Dry
den
sity
gm
/cm
3
Und
rain
ed s
hear
str
engt
h (k
Pa)
Opt
imum
wat
er c
onte
nt
Figure 15.6 Standard Proctor compaction test on clay, including measurementsof undrained shear strength.

CONTROL OF COMPACTION 399
would be appropriate. This would put an upper limit on the water contentat which the soil could be compacted. Since the undrained shear strengthsteadily rises with decreasing water content, the required shear strengthcould be achieved by compacting the soil in a very dry state, which wouldgenerally be undesirable, as dry fills may soften and swell excessively whenexposed to rainfall. To prevent the soil from being too dry, a second param-eter is specified, namely the air voids in the soil.
Figure 15.2 indicates that at optimum water content the air void in thesoil is generally about 5 percent. If the soil is compacted 2–3 percent drierthan the optimum water content corresponding to the compaction effortbeing used, the air voids may be as much as 8 or 10 percent. Thus toprevent the soil from being compacted too dry an upper limit is placed onthe air voids, normally in the range of 8–10 percent. Figure 15.7 illustrateshow this method of controlling compaction relates to the traditional method.The zero-air-voids line is always the upper limit of the dry density for anyparticular water content and thus applies to both methods. The traditionalmethod involves an upper and lower limit on water content and a lowerlimit on dry density and thus encloses the area shown in the figure. Thealternative method involves an upper limit on water content, correspondingto the minimum shear strength, and a line parallel to the zero-air-voidsline representing the upper limit of air voids. There is no specific lowerlimit of water content, but the air voids limit prevents the soil from beingtoo dry.
Water content
Dry
den
sity
She
ar s
tren
gth
Zero air voids
Air voids limit
Shear strength
Shear strengthlimitDry density
limit
Water content limits from compaction test
Wat
er c
onte
nt li
mit
from
sh
ear
stre
ngth
crit
eria
Limits from water contentand dry density criteria
Limits from shear strength and air voids criteria
Figure 15.7 Compaction control using alternative specification parameters.
400 SOIL COMPACTION
Experience has shown that suitable limits for the two control parametersare as follows:
Undrained shear strength (hand vane values): Not less than 150 kPa (aver-age of 10 tests)
Minimum single value: 120 kPaAir voids (for “normal” soils): Not greater than 8 percent
These values have been found to be very satisfactory in producing firm,high-quality fills. The undrained shear strength can be measured in situ bya hand shear vane or by taking samples for unconfined compression tests.The hand shear vane is the much simpler of the two methods. The air voidscan only be determined by measuring the density and water content in theusual way. The author’s experience has been mainly in temperate or wettropical climates, where it is often the case that the soil is too wet and theundrained shear strength criterion is difficult to meet while the air voidsrequirement is easily achieved. This means that the quality control consistsessentially of checking the shear strength. With the hand shear vane thischecking can be done as the compaction operation proceeds.
While the criteria above are suitable for a wide range of compactionoperations, there are some situations where other properties may be impor-tant, and the criteria can be adjusted accordingly. For example, the core ofan earth dam built on compressible foundations or in a seismic zone mayneed to be plastic, or ductile, to allow for possible deformations in the dam.This can be achieved by adopting a lower undrained shear strength; a valuebetween about 70 and 90 kPa would produce a reasonably plastic material,assuming the clay is of moderate to high plasticity. For a clay embankmentbeing built for a new highway, it may be desirable that the layers closest tothe surface (on which the pavement itself will be constructed) have a higherstrength than those deeper down. This could be achieved by increasing therequired undrained shear strength to, say, 200 kPa.
It will be evident from the account given above that this method of com-paction control does not actually require compaction tests at all. However, itis still useful to carry out compaction tests to determine the degree of dryingor wetting needed to bring the soil to a state appropriate for compaction.
To summarize, the advantages of the shear strength and air voids controlmethod are as follows:
1. Large variations in soil properties present no difficulty in applyingthe method. The same specification limits apply regardless of thevariations.
2. Field control is more direct as the value of the undrained shear strengthis known as soon as the measurements are made.
3. The specification is easily varied to produce fills with particular prop-erties needed in special situations.
DIFFICULTIES IN COMPACTING CLAYS 401
15.4 DIFFICULTIES IN COMPACTING CLAYS
15.4.1 Soils Considerably Wetter Than Optimum Water Content
It is not infrequent that the natural water content of a soil is much greaterthan the value suitable for effective compaction, and considerable drying isneeded before compaction can commence. If the soil is of low plasticity,drying is not particularly difficult, but drying soils of high plasticity can bevery difficult. There are no easy ways to overcome this problem, but thefollowing are essential requirements:
• Adequate spells of fine sunny weather. This can be a very uncertainexpectation in some countries.
• Plenty of wide open space to spread out the soil for drying. Such aspace should be created or obtained so that it is exposed to maximumdirect sunlight and also to maximum wind.
• Good site management. This means organizing the whole operation tomaximize fine spells of weather for drying and also being ready to“seal” the surface of any uncompacted material or stockpiles if rainis approaching. This “sealing” can be done by shaping all exposedsurfaces so that rainfall cannot pond on them and rolling the surfacewith a smooth wheeled roller to create a tight impermeable surfacelayer.
15.4.2 Soils That Soften During Compaction
As we have seen, many residual soils are “structured”; that is, they havesome form of bonds or weak cementation between their particles. Whenremolded by the compaction process, this structure is broken down and thesoil becomes softer, as shown in Figure 15.5. When dealing with soils ofthis type, it is therefore important to understand their properties and planthe compaction criteria accordingly. It may be necessary to choose betweentwo options as follows:
1. Drying the soil to its optimum water content and using the normalcompactive effort to produce a high-quality fill
2. Accepting that substantial drying is not feasible because of weatherconditions and adopting a much lower compactive effort so that thesoil can be effectively compacted at (or close to) its natural watercontent
To determine the feasibility of the second option, it is desirable to con-duct trials involving the excavation, transport, and compaction of the soil.Excavation, transport, and spreading should be carried out in such a waythat disturbance and remolding of the soil is kept to a minimum. In other

402 SOIL COMPACTION
words the natural structure and strength of the soil should be retainedas much as practical. The compaction operation should similarly be con-ducted so that remolding the soil is minimized. Light, tracked, equipmentis likely to be most appropriate for this purpose, and the compaction pro-cess consists essentially of “squeezing” intact fragments of soil togetherto form a uniform fill. For this purpose only a few passes of the com-paction equipment is likely to be preferable to a large number of passes,which may progressively soften the soil and not make it more compact orstronger.
15.5 COMPACTION OF GRANULAR AND NONPLASTIC MATERIALS
Granular materials show rather different compaction characteristics to cohe-sive soils. Conventional Proctor compaction tests may or may not show clearmaximum dry densities and optimum water contents. Also, with clean gran-ular materials, water drains from the material rather rapidly and in manycases the water content is “arbitrary” and does not greatly influence the drydensity. Despite these factors, the test can be used to give a reasonable indi-cation of the density that ought to be achieved by conventional compactionmethods in the field. However, it may turn out that a considerably higherdensity can easily be achieved in the field. For this reason it is generallypreferable to carry out compaction trials to determine a reasonable “target”density to be specified for field compaction.
For controlling compaction of granular materials, it is generally prefer-able to use a strength test rather than a density measurement. This is easilydone using simple field penetrometers. These penetrometers are usuallyhand-operated dynamic cone penetrometers, and the parameter measuredis blows per distance penetrated. By conducting such tests on trial com-paction fills, appropriate values can be established for controlling the restof the project. Figure 15.8a shows the principle of such a penetrometer. Forcohesive fills it is also possible to gain an empirical measure of undrainedshear strength by using static cone penetrometers of the type also shownin Figure 15.8b. These are pushed into the soil at a steady rate and thecone resistance measured on the dial gauge. This can be correlated with theundrained shear strength of the soil.
Examples of the two types of penetrometers are the following:
Dynamic: Scala Penetrometer
Tip: 20 mm diameter, 30◦ point angle.Hammer weight: 9.0 kgHeight of fall: 51.0 cmParameter measured: S = number of blows/300 mm

COMPACTION OF GRANULAR AND NONPLASTIC MATERIALS 403
(a) DYNAMIC PENETROMETER (FALLING WEIGHT)
(b) STATIC PENETROMETER(DIRECT PUSH)
Graduated scale to measure penetration
Falling weight hammer
Fixed fall height
Proving ring tomeasure force
Handle to apply manual push
Figure 15.8 Hand penetrometers that can be used to control compaction.
This parameter can be correlated with other material properties of param-eters. The correlation with the SPT test is SPT N value = 1.5 times Nvalue from Scala penetrometer.
A common criterion used for compaction of granular fill with the Scalapenetrometer is the following:
The number of blows to drive the Scala penetrometer from a depth of50–150 mm below the compacted fill surface should not be less than10–12.
Static: U.S. Army Corps of Engineers Cone Penetrometer
Tip: 12.8 mm diameter, 30◦ point angleParameter measured: Force in units of 0.5 lb (= 1.102 kg). This was the
original parameter used by the Corps of Engineers for calibrations withCalifornian Bearing Ratio (CBR) values. For general use it wouldbe better to simply measure force so this could be converted to asimple cone resistance value (qc) in pressure units such as kg/cm2
or kPa.
404 SOIL COMPACTION
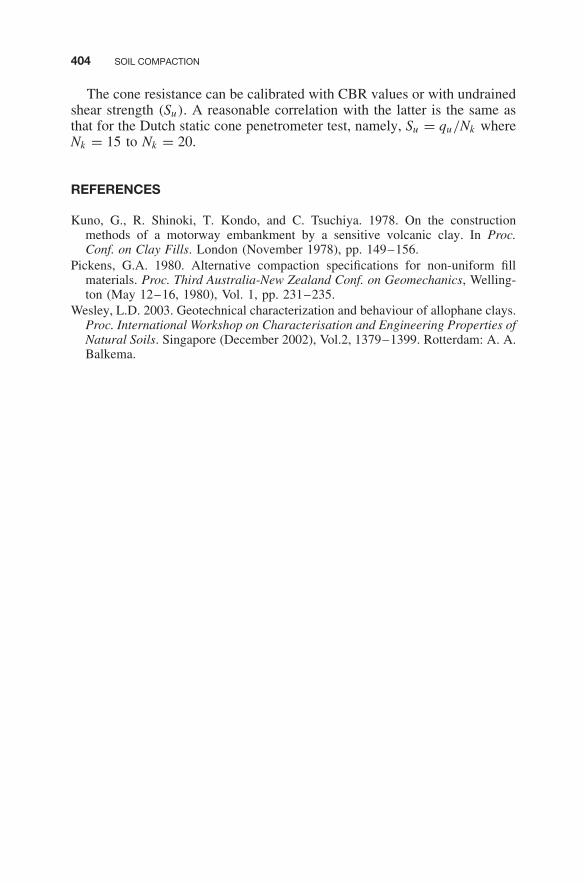
The cone resistance can be calibrated with CBR values or with undrainedshear strength (Su). A reasonable correlation with the latter is the same asthat for the Dutch static cone penetrometer test, namely, Su = qu/Nk whereNk = 15 to Nk = 20.
REFERENCES
Kuno, G., R. Shinoki, T. Kondo, and C. Tsuchiya. 1978. On the constructionmethods of a motorway embankment by a sensitive volcanic clay. In Proc.Conf. on Clay Fills. London (November 1978), pp. 149–156.
Pickens, G.A. 1980. Alternative compaction specifications for non-uniform fillmaterials. Proc. Third Australia-New Zealand Conf. on Geomechanics, Welling-ton (May 12–16, 1980), Vol. 1, pp. 231–235.
Wesley, L.D. 2003. Geotechnical characterization and behaviour of allophane clays.Proc. International Workshop on Characterisation and Engineering Properties ofNatural Soils. Singapore (December 2002), Vol.2, 1379–1399. Rotterdam: A. A.Balkema.