fundamentals of economic evaluation for public health
TRANSCRIPT

University of KentuckyUKnowledge
Health Management and Policy Presentations Health Management and Policy
8-10-2015
Fundamentals of Economic Evaluation for PublicHealthGlen P. MaysUniversity of Kentucky, [email protected]
Cezar MamarilUniversity of Kentucky, [email protected]
Click here to let us know how access to this document benefits you.
Follow this and additional works at: https://uknowledge.uky.edu/hsm_present
Part of the Health and Medical Administration Commons, Health Economics Commons, HealthPolicy Commons, and the Health Services Research Commons
This Presentation is brought to you for free and open access by the Health Management and Policy at UKnowledge. It has been accepted for inclusionin Health Management and Policy Presentations by an authorized administrator of UKnowledge. For more information, please [email protected].
Repository CitationMays, Glen P. and Mamaril, Cezar, "Fundamentals of Economic Evaluation for Public Health" (2015). Health Management and PolicyPresentations. 109.https://uknowledge.uky.edu/hsm_present/109

Fundamentals of Economic Evaluation for Public Health
Texas Department of State Health Services Workshop
Austin, Texas • August 10-11, 2015
Glen Mays, PhD, MPH Cezar Mamaril, PhD, MS
Today’s Agenda I. Fundamentals of economic evaluation II. Tools for economic evaluation in public health III. Examples of public health economic studies IV. Group exercise: applying economic evaluation principles to programs V. DSHS specific economic evaluations VI. Interpretation, applications, limitations & caveats

I. Fundamentals of economic evaluation

Why economics in public health?
Do outcomes achieved by public health interventions justify their costs?
Where should new investments be directed to achieve their greatest impact?

Related questions of value…
How much health can we produce through public health investments? Can public health investments help “bend the curve” to contain medical costs or costs incurred by other stakeholders?

Uncertainty and Controversy
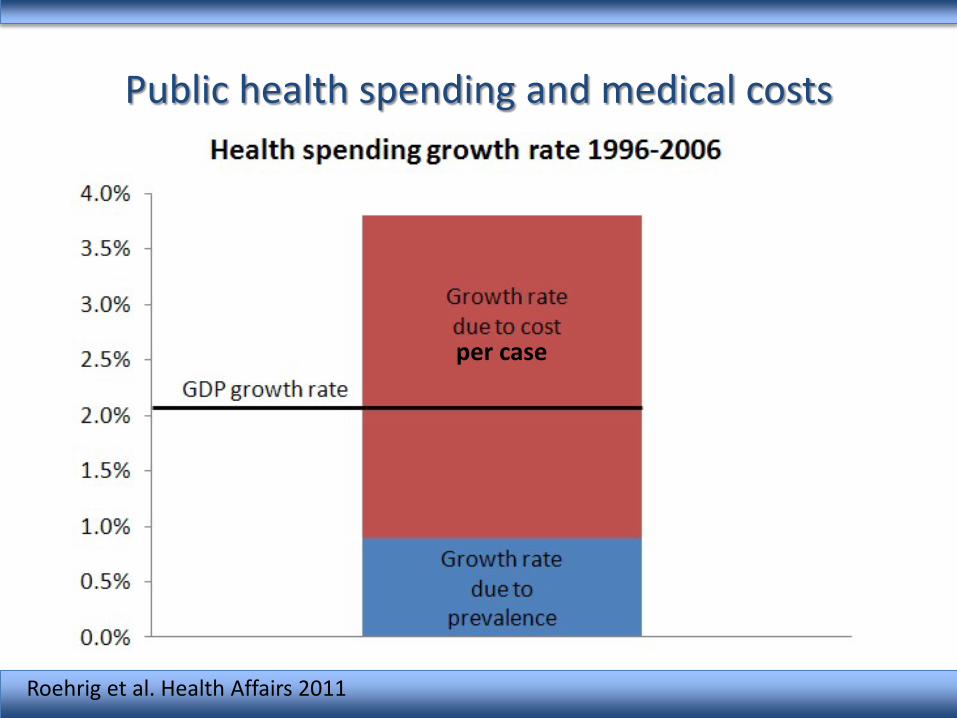
Public health spending and medical costs
per case
Roehrig et al. Health Affairs 2011

Challenges in demonstrating economic value in public health
Time lag between costs and benefits Distribution of costs and benefits: concentrated costs but diffuse benefits Measurement of costs and benefits requires good information systems Attribution of benefits: the counterfactual

Key ingredients Investments
Costs of implementing public health interventions Who pays: sources? Over what time frames?
Benefits/Returns Valuation of the outputs and outcomes attributable to public health interventions Who realizes returns? Over what time frames? Compared to what?

Setting and managing expectations
Cost savings – a high bar Cost effectiveness – value for dollars spent – Compared to status quo – Compared to other possible investments – Compared to doing nothing …Key concept: opportunity costs
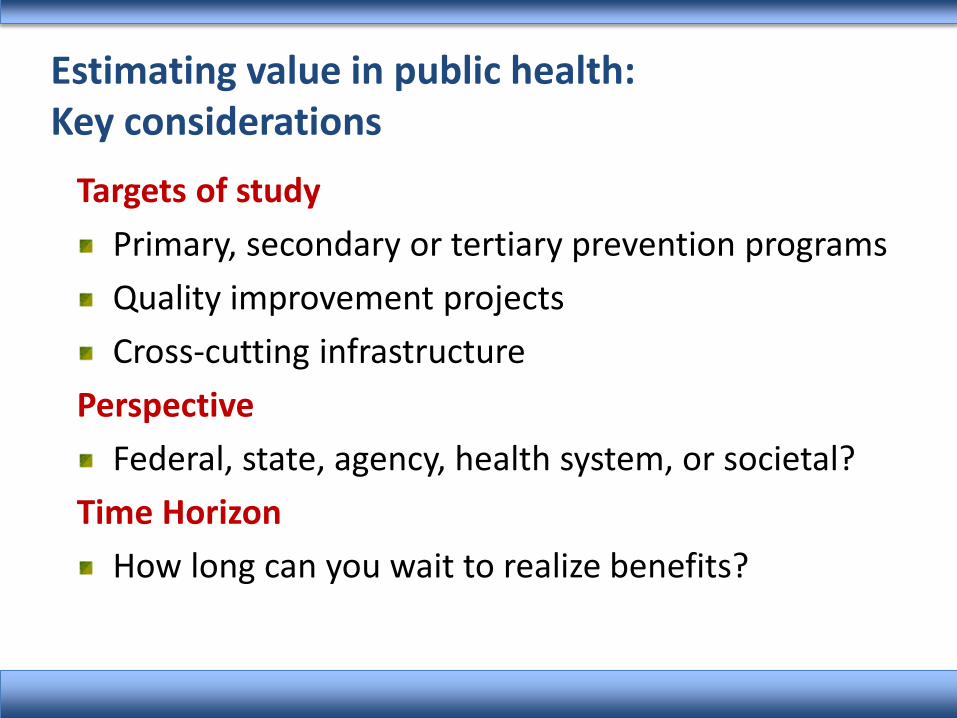
Estimating value in public health: Key considerations
Targets of study Primary, secondary or tertiary prevention programs Quality improvement projects Cross-cutting infrastructure
Perspective Federal, state, agency, health system, or societal?
Time Horizon How long can you wait to realize benefits?

Estimating value in public health: Key considerations - Costs
Direct costs Cost of implementing intervention/infrastructure Cost savings attributable to the intervention
Indirect costs Economic value of productivity gains/losses or time savings/costs attributable to the intervention
Intangibles Quality of life, satisfaction, self-efficacy, social capital

Estimating value in public health: Key considerations - Benefits
Efficiency gains (captured in cost measures) Reduced labor costs Reduced material costs
Productivity gains (captured in output measures) Services delivered Cases detected
Revenue gains (captured in financial measures) Health gains (captured in outcome measures)
Deaths averted Cases prevented Quality-adjusted life years gained
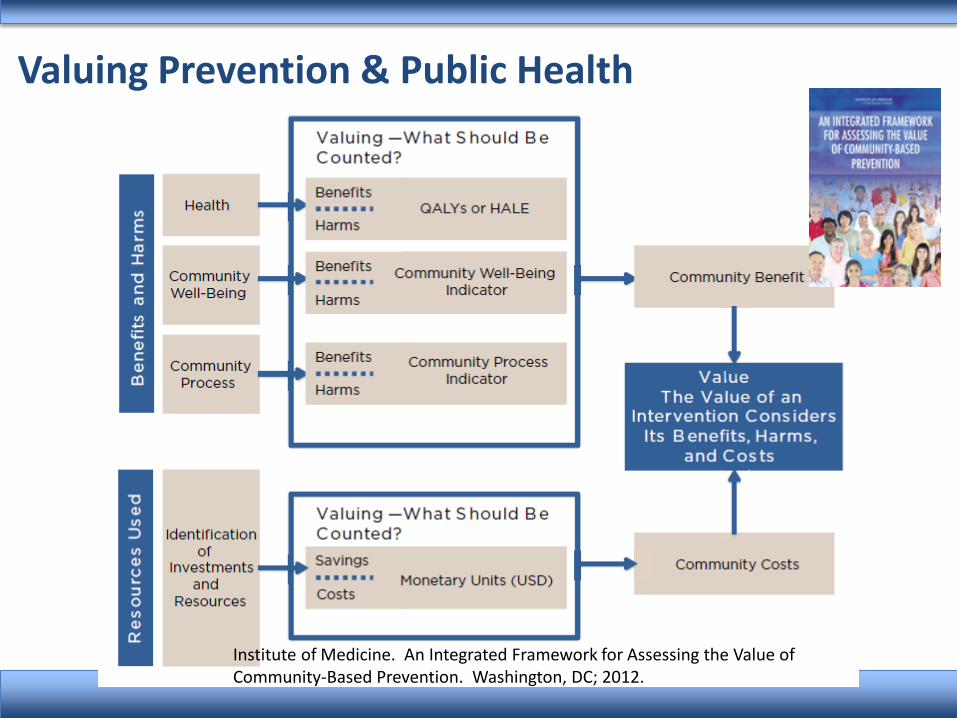
Institute of Medicine. An Integrated Framework for Assessing the Value of Community-Based Prevention. Washington, DC; 2012.
Valuing Prevention & Public Health
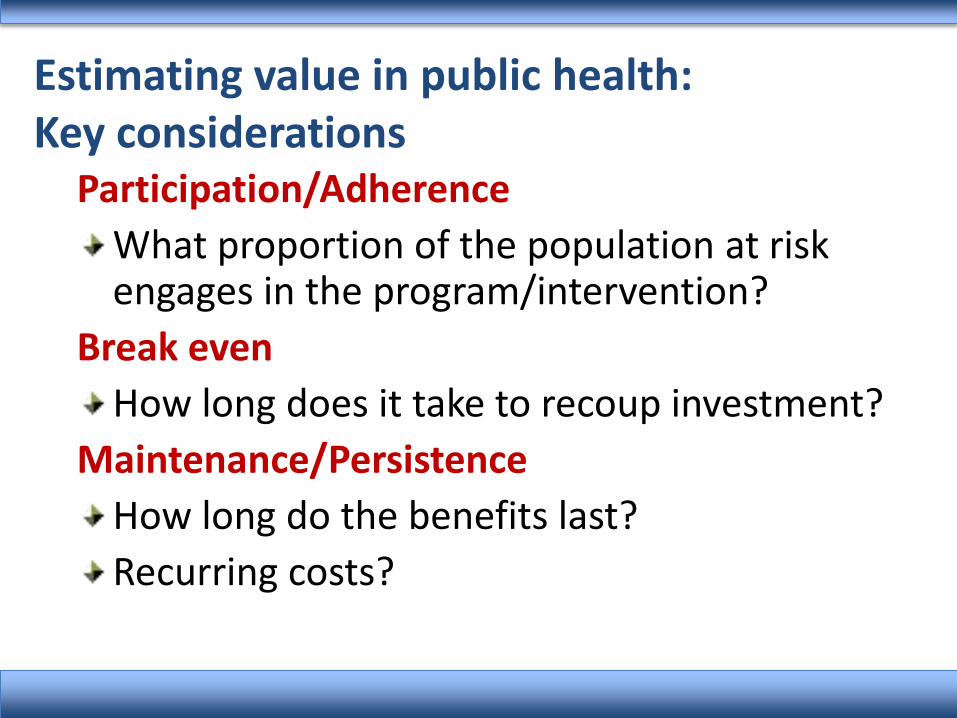
Estimating value in public health: Key considerations
Participation/Adherence What proportion of the population at risk engages in the program/intervention?
Break even How long does it take to recoup investment?
Maintenance/Persistence How long do the benefits last? Recurring costs?
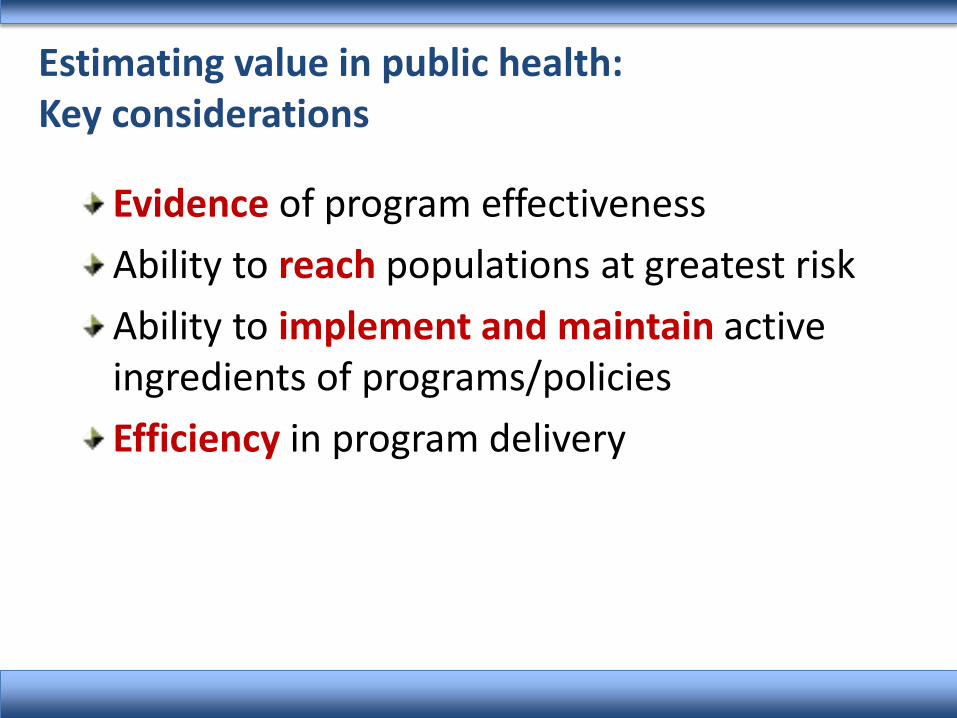
Evidence of program effectiveness Ability to reach populations at greatest risk Ability to implement and maintain active ingredients of programs/policies Efficiency in program delivery
Estimating value in public health: Key considerations
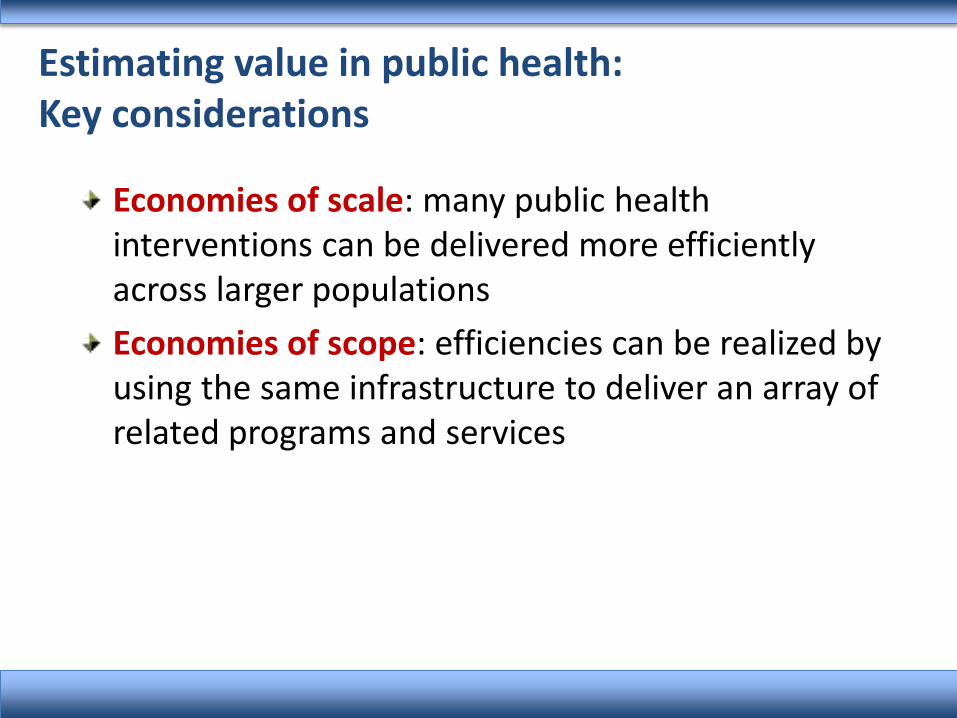
Estimating value in public health: Key considerations
Economies of scale: many public health interventions can be delivered more efficiently across larger populations Economies of scope: efficiencies can be realized by using the same infrastructure to deliver an array of related programs and services
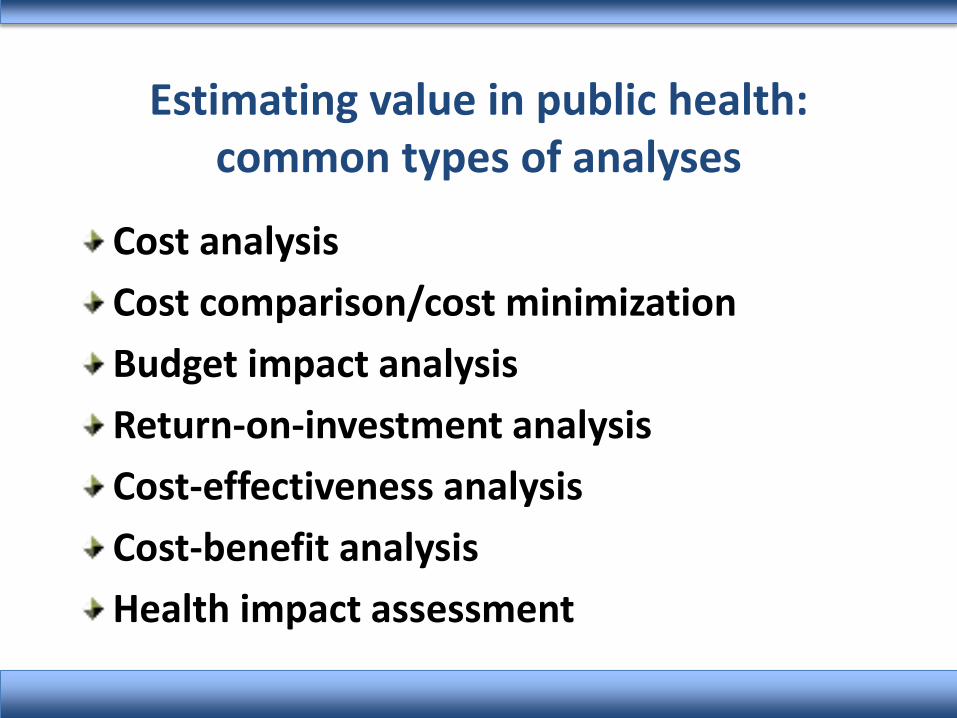
Estimating value in public health: common types of analyses
Cost analysis Cost comparison/cost minimization Budget impact analysis Return-on-investment analysis Cost-effectiveness analysis Cost-benefit analysis Health impact assessment
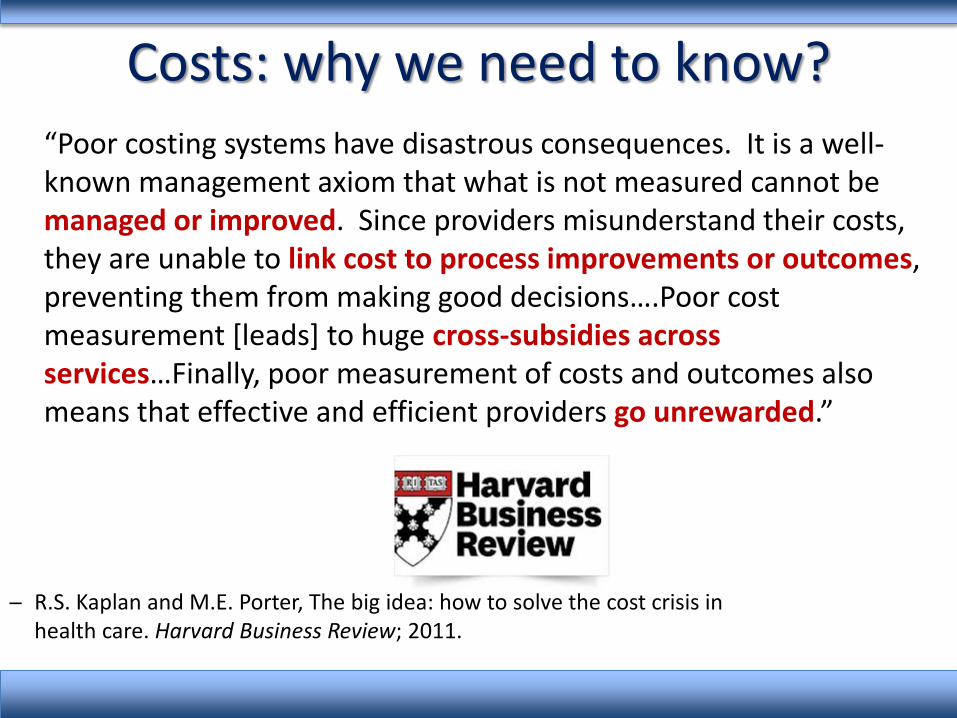
Costs: why we need to know? “Poor costing systems have disastrous consequences. It is a well-known management axiom that what is not measured cannot be managed or improved. Since providers misunderstand their costs, they are unable to link cost to process improvements or outcomes, preventing them from making good decisions….Poor cost measurement [leads] to huge cross-subsidies across services…Finally, poor measurement of costs and outcomes also means that effective and efficient providers go unrewarded.”
─ R.S. Kaplan and M.E. Porter, The big idea: how to solve the cost crisis in health care. Harvard Business Review; 2011.

Toward a deeper understanding of costs in public health 2012 Institute of Medicine Recommendations
Identify the components and costs of a minimum package of public health services – Foundational capabilities – Basic programs
Implement a national chart of accounts for tracking spending and flow of funds Expand research on costs and effects of public health delivery
Institute of Medicine. For the Public’s Health: Investing in a Healthier Future. Washington, DC: National Academies Press; 2012.

Tools of the trade Prospective “expected cost” methods (micro-costing) - Vignettes - Surveys with staff and/or administrators - Delphi group processes
Concurrent “implementation cost” methods (micro-costing) - Time studies with staff - Activity logs with staff - Direct observation
Retrospective “cost accounting” methods (micro-costing or gross-costing) - Administrative records, financial reports, billing data - Decomposition, allocation or modeling - Surveys with staff and/or administrators
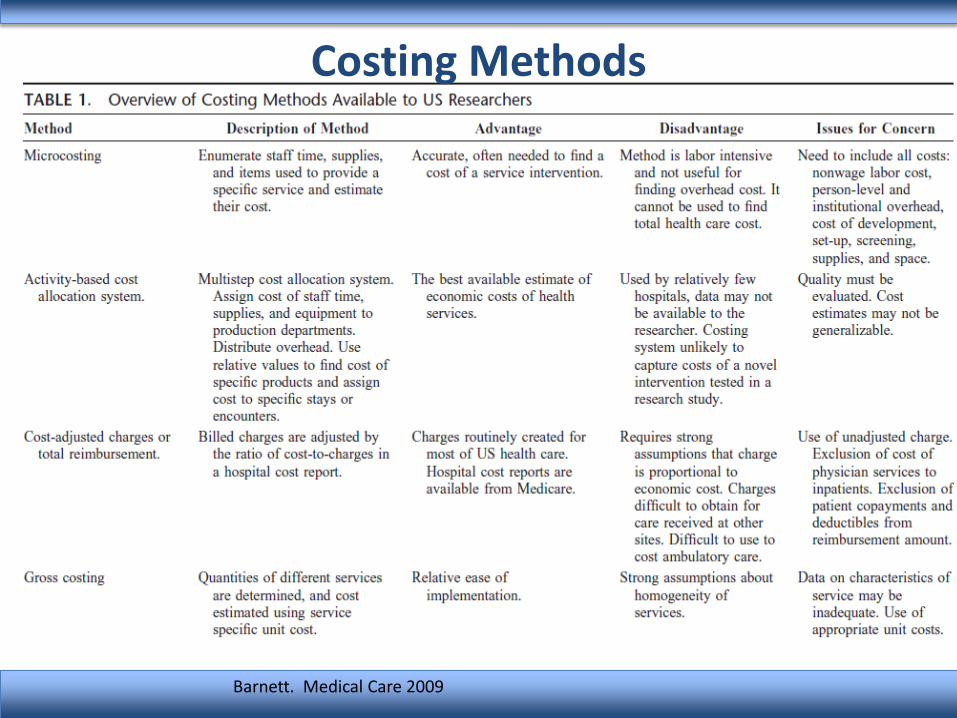
Costing Methods
Barnett. Medical Care 2009

CDC’s Public Health Model for Prevention
First Principles
Estimating total economic costs of an activity Costs = value of resources used to produce activity Resources = people, facilities, equipment, supplies …Key concept: opportunity costs
Financial Costs
Expenditures for resources to implement the activity – based on market prices Often reflected in expenditure reports, invoices Convenient, sometimes incomplete, measures Examples: Salaries for project personnel Supply costs Computer purchases Cost of curriculum materials
Economic Costs
Value of the lost benefit because the resource is not available for its next best use Examples: Volunteer time Donated space
Shadow prices may be used when market price does not accurately reflect the value of the resource
Developing a cost classification system Perspective: who incurs cost Timeframe: over what period Type of resource Labor, equipment, supplies, facilities, etc
Activity domains/areas Training, curriculum development, surveillance,
recruitment, screening, administration Pre-implementation vs. post-implementation
“Direct” vs. “indirect” activities Capital vs. operating costs (& depreciation)
Developing a cost classification system Common resource categories Noncontract labor Contract services Materials/supplies Building/facilities Donated labor and resources Other resources not funded directly
Developing a cost classification system Don’t overlook...
Resources that are hard to measure or value Resources used in small amounts Resources procured without money Volunteer time Parent/caregiver time Intervention recipient time In-kind contributions/donated materials Existing resources

Developing a cost classification system Include measures of units of activity Unit costs
Fixed vs. variable costs Variable costs vary with activity level Fixed costs are constant despite volume of activity Long term, all costs are variable

Developing a cost classification system Handling resources that are shared by multiple programs, activities, or organizations Cost allocation methods Time Intensity of use

Conducting a cost study
Solicitation of experts
Instrument Pilot Test/Validation
Cost Analysis
Conducting a cost study: focus Program/intervention Cross-cutting infrastructure (e.g. PHAB stds) Assessment Surveillance Planning Policy development
Organization Industry/enterprise

Cost data collection methods Direct observation methods Time studies and time-and-motion methods
random moment time sampling
Activity logs Analysis of administrative records Surveys
Program delivery staff Program managers/directors
Group process methods with vignettes

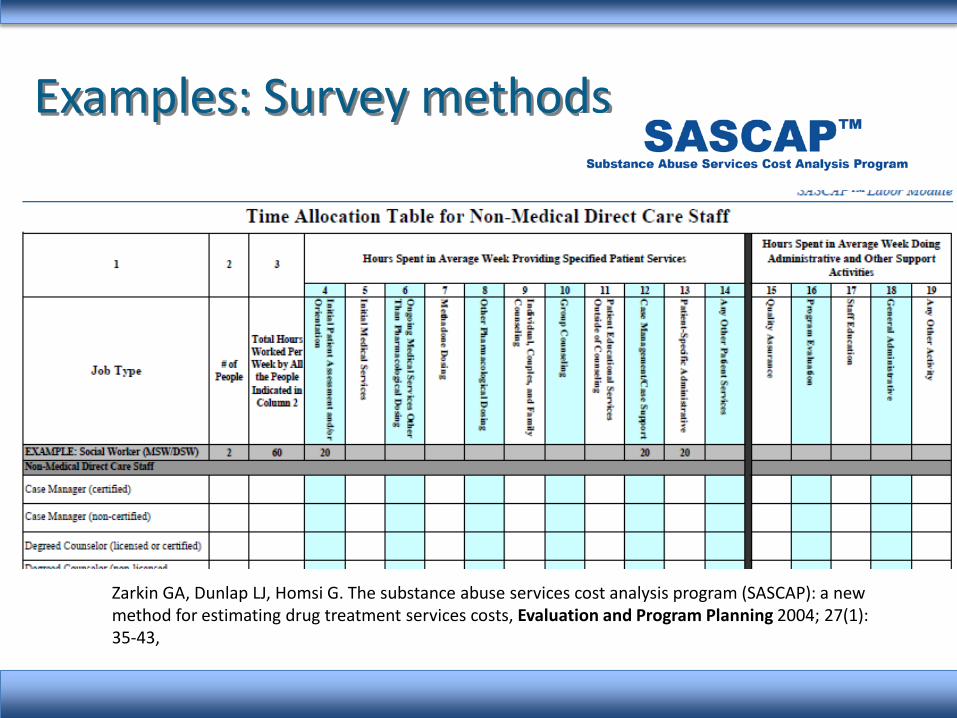
Examples: Survey methods
Three dimensions of work: Mental effort and judgment Technical skill and physical effort Stress

Examples: Survey methods

Examples: Survey methods
Zarkin GA, Dunlap LJ, Homsi G. The substance abuse services cost analysis program (SASCAP): a new method for estimating drug treatment services costs, Evaluation and Program Planning 2004; 27(1): 35-43,
Surveys program managers Refers to expenditure records (not budgets) Explicit allocation of resources across multiple programs Available at:
http://www.rti.org/page.cfm?objectid=7E6095C8-AE6E-4568-874839C81FAD414B
Examples: Survey methods
Zarkin GA, Dunlap LJ, Homsi G. The substance abuse services cost analysis program (SASCAP): a new method for estimating drug treatment services costs, Evaluation and Program Planning 2004; 27(1): 35-43,
Analyzing costs Average vs. marginal costs? Compared to what? Doing nothing Status quo Other settings, implementation strategies Other activities/interventions
Quantifying variation in costs Scale and scope Context

Analyzing costs: example
Analyzing costs Identifying determinants of costs
cost function estimation Examining cost heterogeneity and efficiency
Stochastic frontier analysis Data envelopment analysis

Analyzing costs

Resources USDHHS Assistant Secretary for Planning and Evaluation. Guide to Analyzing the Cost-Effectiveness of Community Public Health Prevention Approaches. www.aspe.hhs.gov/health/reports/06/cphpa/report.pdf Haddix AC et al (CDC). Prevention Effectiveness: A Guide to Decision Analysis and Economic Evaluation. Oxford University Press. RTI. Substance Abuse Services Cost Analysis Program. http://www.rti.org/page.cfm?objectid=7E6095C8-AE6E-4568-874839C81FAD414B

Cost-effectiveness analyses: prevention vs treatment

Source: Katherine Baicker, David Cutler, and Zirui Song. Health Affairs 2010; 29(2):1-13.
ROI analyses: worksite health promotion
Estimating value in public health: levels of analyses
Macro-level analysis Infrastructure-level analysis Intervention-level analysis Process-level analysis

Example: Macro-level Analysis
Source: Trust for America’s Health, 2009
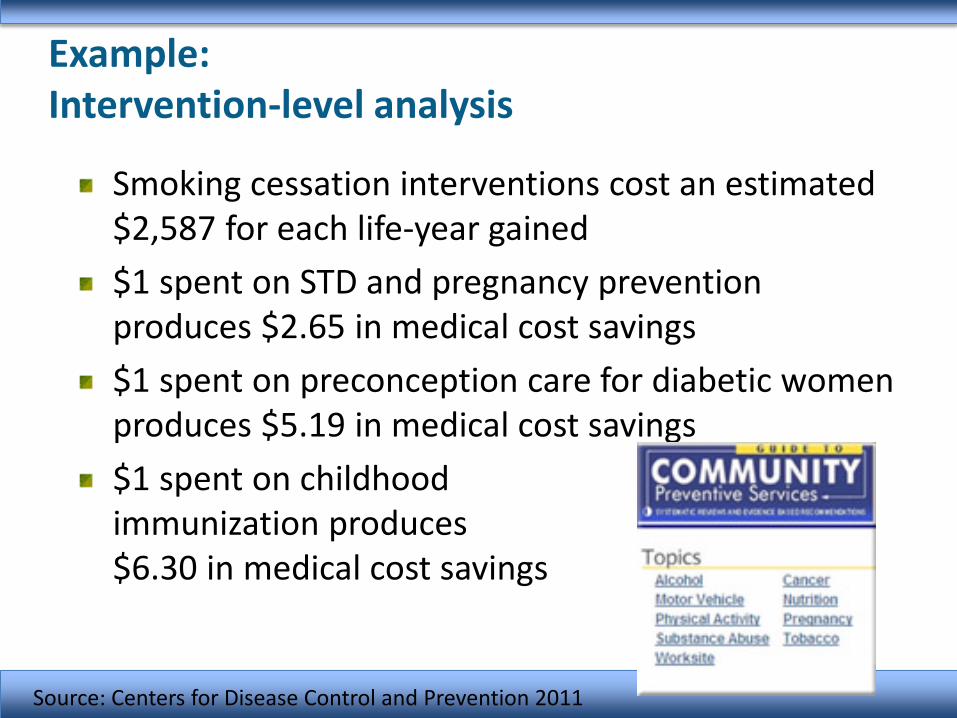
Example: Intervention-level analysis
Smoking cessation interventions cost an estimated $2,587 for each life-year gained $1 spent on STD and pregnancy prevention produces $2.65 in medical cost savings $1 spent on preconception care for diabetic women produces $5.19 in medical cost savings $1 spent on childhood immunization produces $6.30 in medical cost savings
Source: Centers for Disease Control and Prevention 2011
II. Tools for economic evaluation in public health
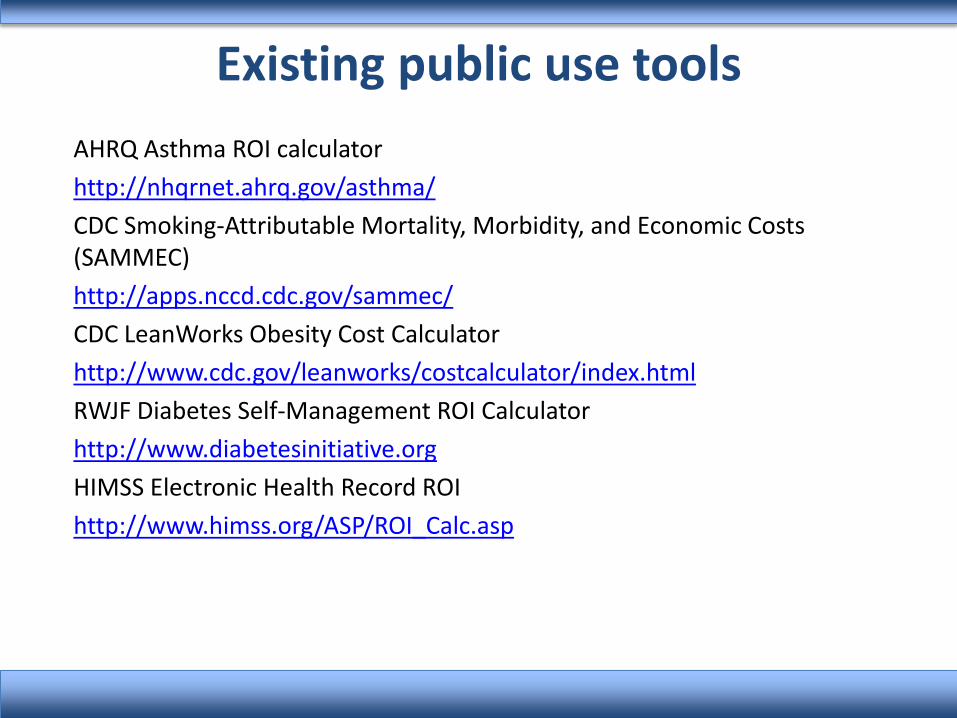
Existing public use tools AHRQ Asthma ROI calculator http://nhqrnet.ahrq.gov/asthma/ CDC Smoking-Attributable Mortality, Morbidity, and Economic Costs (SAMMEC) http://apps.nccd.cdc.gov/sammec/ CDC LeanWorks Obesity Cost Calculator http://www.cdc.gov/leanworks/costcalculator/index.html RWJF Diabetes Self-Management ROI Calculator http://www.diabetesinitiative.org HIMSS Electronic Health Record ROI http://www.himss.org/ASP/ROI_Calc.asp
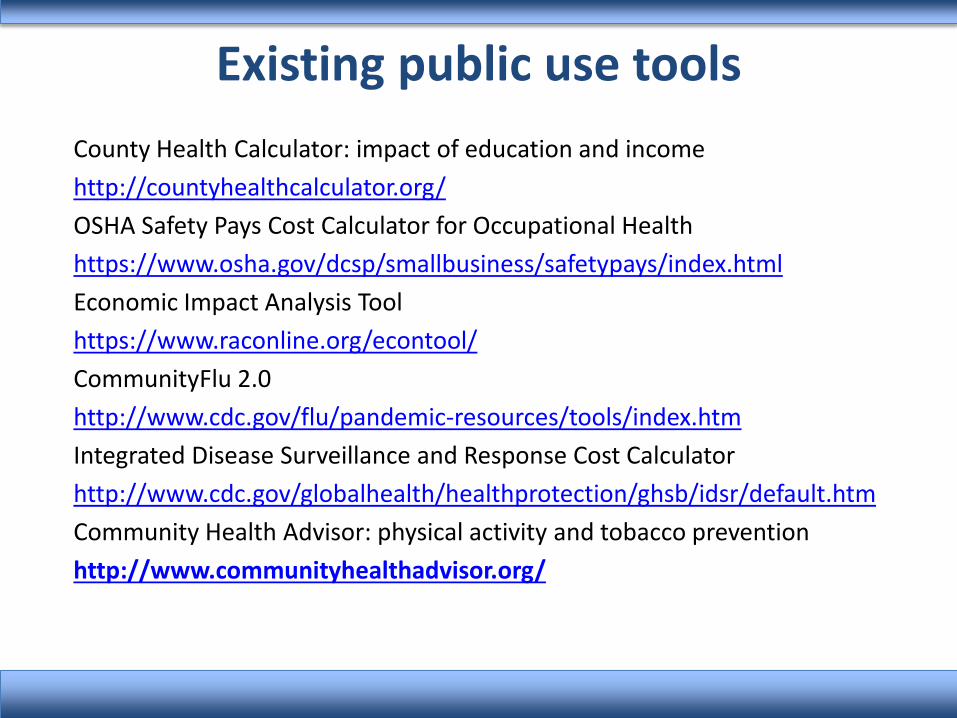
Existing public use tools County Health Calculator: impact of education and income http://countyhealthcalculator.org/ OSHA Safety Pays Cost Calculator for Occupational Health https://www.osha.gov/dcsp/smallbusiness/safetypays/index.html Economic Impact Analysis Tool https://www.raconline.org/econtool/ CommunityFlu 2.0 http://www.cdc.gov/flu/pandemic-resources/tools/index.htm Integrated Disease Surveillance and Response Cost Calculator http://www.cdc.gov/globalhealth/healthprotection/ghsb/idsr/default.htm Community Health Advisor: physical activity and tobacco prevention http://www.communityhealthadvisor.org/

Estimating value in public health: National Public Health Improvement Initiative
Goal: Develop approaches to assess value of improvements in public health capacity, infrastructure, administrative processes Near-term: capture effects on labor costs, time costs, productivity Longer-term: capture effects on program delivery (reach, effectiveness), population health
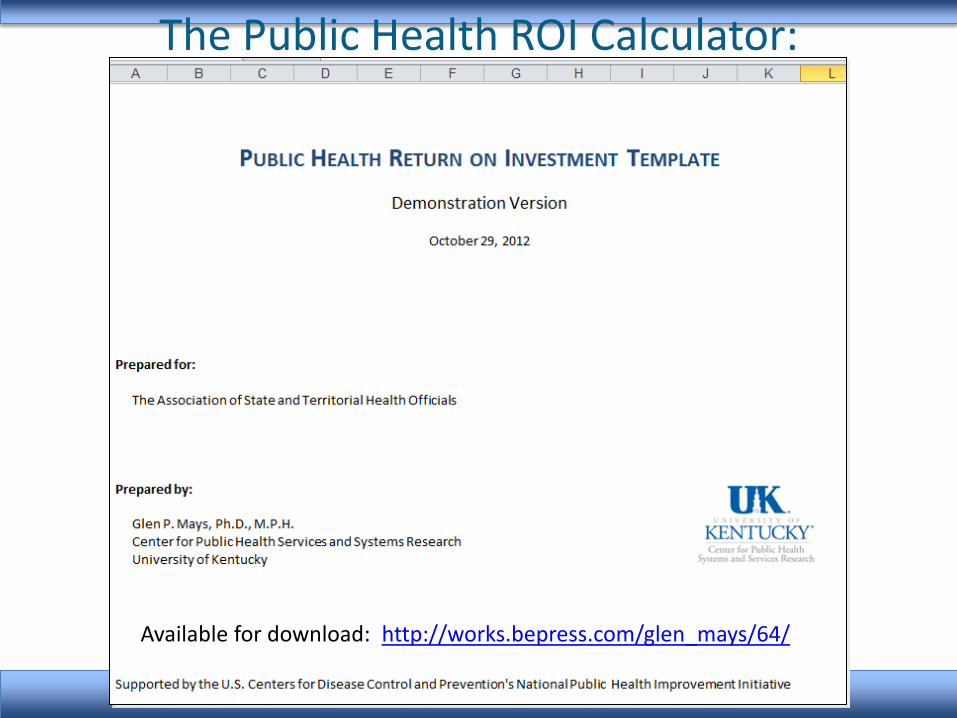
The Public Health ROI Calculator: Demonstration Version
Available for download: http://works.bepress.com/glen_mays/64/

The Public Health ROI Calculator: Demonstration Version
Requires data on: – Operating costs before and after implementation of your
public health strategy
– Revenues (if any) before and after implementation of your public health strategy
– Measures of outputs/services before and after
– Measures of health and economic outcomes (if available) before and after
Available for download: http://works.bepress.com/glen_mays/64/

Pathways to Realizing ROI for QI Reductions in standard operating
costs • Greater efficiencies realized
Revenue enhancements • Increased cost reimbursement
Increased productivity of agency functions
• Increased service encounters
Decreased time to produce outputs • Reduced cycle time process
Available for download: http://works.bepress.com/glen_mays/64/
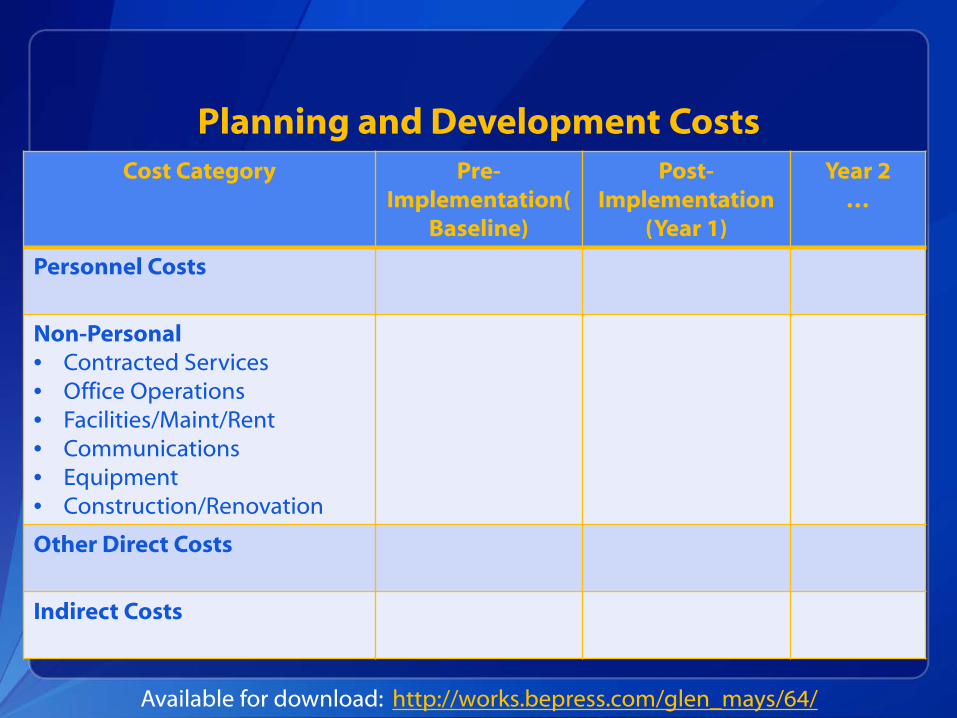
Cost Category Pre-Implementation(
Baseline)
Post-Implementation
(Year 1)
Year 2 …
Personnel Costs
Non-Personal • Contracted Services • Office Operations • Facilities/Maint/Rent • Communications • Equipment • Construction/Renovation
Other Direct Costs
Indirect Costs
Planning and Development Costs
Available for download: http://works.bepress.com/glen_mays/64/
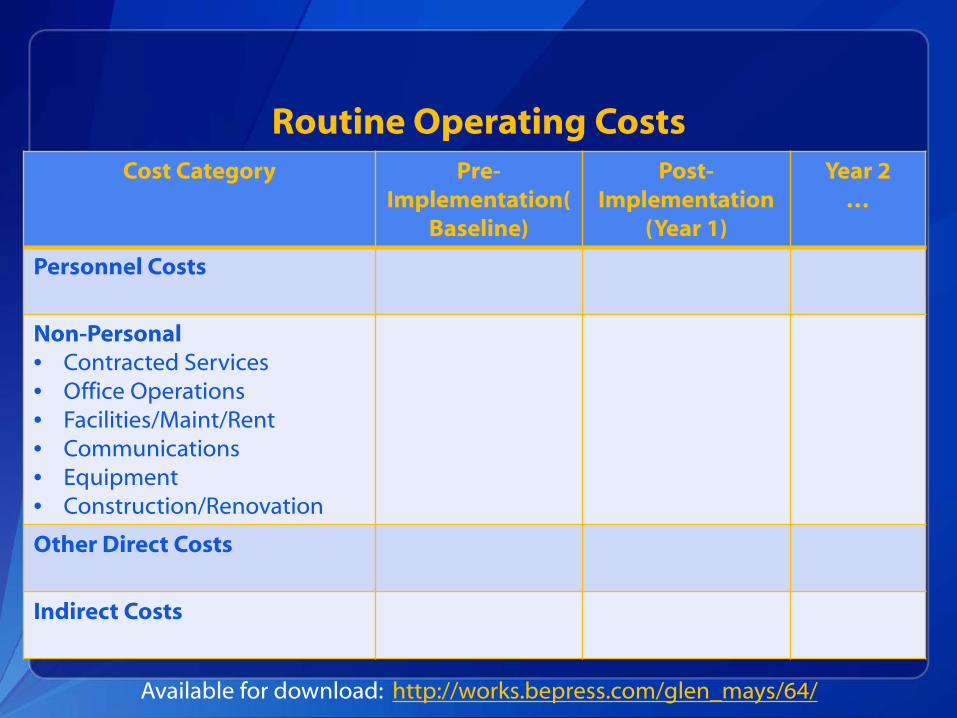
Cost Category Pre-Implementation(
Baseline)
Post-Implementation
(Year 1)
Year 2 …
Personnel Costs
Non-Personal • Contracted Services • Office Operations • Facilities/Maint/Rent • Communications • Equipment • Construction/Renovation
Other Direct Costs
Indirect Costs
Routine Operating Costs
Available for download: http://works.bepress.com/glen_mays/64/

Outcomes/Outputs
Cost Category Pre-Implementation
Post-Implementation
(Year 1)
Year 2 …
Service Units Delivered
Required Production Time
Target Population Reach
Other Outcomes/Outputs
Available for download: http://works.bepress.com/glen_mays/64/
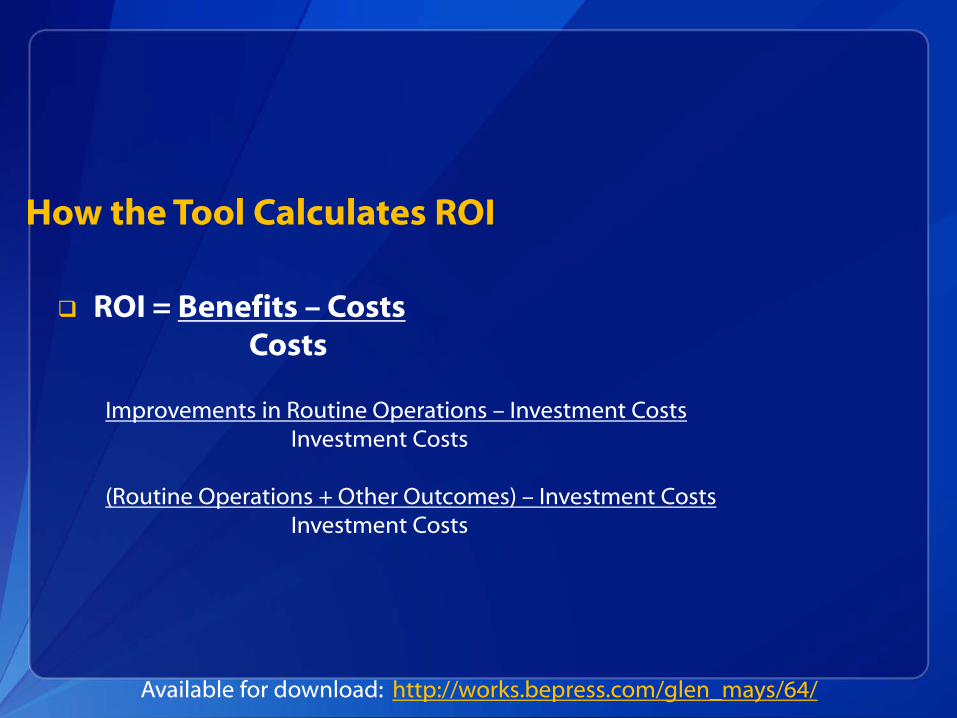
How the Tool Calculates ROI
ROI = Benefits – Costs Costs
Improvements in Routine Operations – Investment Costs Investment Costs
(Routine Operations + Other Outcomes) – Investment Costs Investment Costs
Available for download: http://works.bepress.com/glen_mays/64/
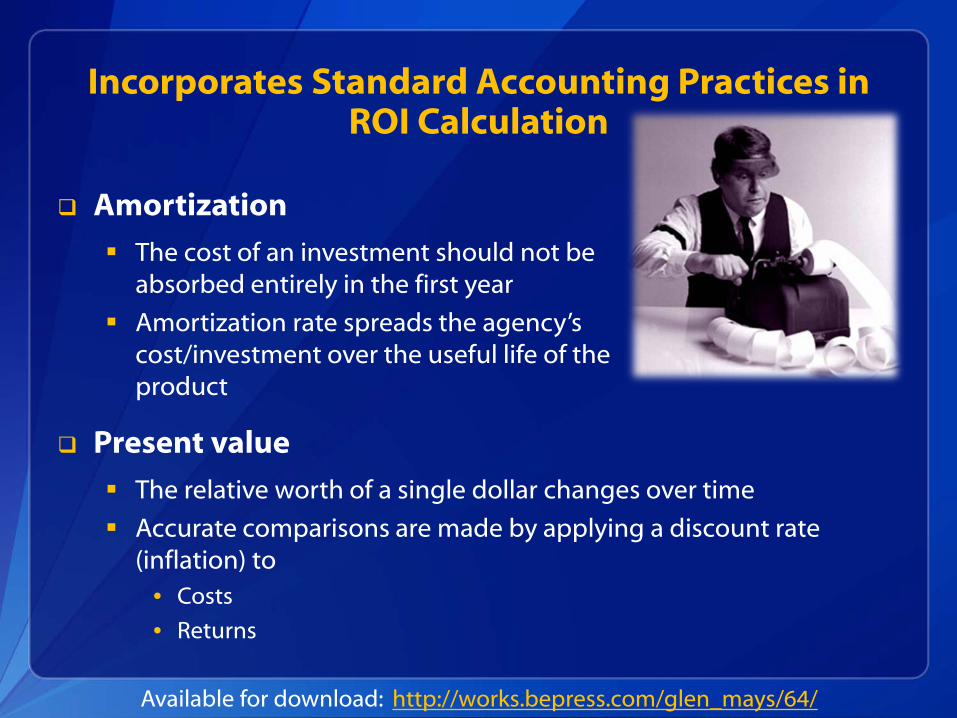
Incorporates Standard Accounting Practices in ROI Calculation
Amortization
The cost of an investment should not be absorbed entirely in the first year
Amortization rate spreads the agency’s cost/investment over the useful life of the product
Present value
The relative worth of a single dollar changes over time
Accurate comparisons are made by applying a discount rate (inflation) to
• Costs
• Returns
Available for download: http://works.bepress.com/glen_mays/64/

Tool Can Be Used throughout Project
Prospectively – Planning Phase
Implementation Phase
Retrospectively – Post Implementation
Available for download: http://works.bepress.com/glen_mays/64/

Improving the Connecticut Department of Public Health Databases AIM: Make three DPH databases compliant with the CT DPH policy on collecting
sociodemographic data (similar to federal OMB-15 directive in 1997) Increase the percentage of compliant databases from 4% to 10%
Put a plan in place to modify the remaining databases
Make sure that all newly-designed databases are aligned with the DPH data
collection policy. The modification process for the targeted databases was implemented and this
strategy was followed on a continuous quality improvement basis through 2014.
Example Quality Improvement Initiative
Source: Susan Logan, MS, MPH, Connecticut Department of Public Health

Salary Costs for QI Initiative Team
6/10/2013 63
Pre-Implementation - Baseline Implementation Period 1
From To From To
Cost Category Reporting Period: 4/1/12 8/19/12 8/20/12 11/30/12
Salary and
Fringe
Salary and
Fringe
Personnel (see below) List by name or by category FTE % Cost FTE % Cost
Project Sponsor - Epidemiologist 4 Project team member
5.00% 87,931.00 $ 1,721.98 3.00%
87,931.00 $ 725.43
Project leader-Epidemiologist 2 20.00% 53,143.00 $ 4,162.87 20.00%
53,143.00 $ 2,922.87
Epidemiologist 4 Project team member 4.00% 87,931.00 $ 1,377.59 2.00%
87,931.00 $ 483.62
Epidemiologist 3 Project team member 6.00% 76,884.00 $ 1,806.77 5.00%
76,884.00 $ 1,057.16
Section Chief: Practitioner Licensing Project team member 5.00% 100,000.00 $ 1,958.33 5.00%
100,000.00 $ 1,375.00
Manager Vital Statistics Project team member 5.00% 86,300.00 $ 1,690.04 5.00%
86,300.00 $ 1,186.63
Section Chief: IT Project team member 4.00% 100,000.00 $ 1,566.67 2.00%
100,000.00 $ 550.00
Takes into account time prds (4.7 mos baseline)
Source: Susan Logan, MS, MPH, Connecticut Department of Public Health

Salary Costs for QI Initiative Team: Implementation Periods 2 and 3
6/10/2013 64
Implementation Period 2 Implementation Period 3
From To From To
Cost Category 12/1/12 12/31/13 1/1/14 12/31/14
Salary and
Fringe
Salary and
Fringe
Personnel (see below) FTE % Cost FTE % Cost
Project Sponsor - Epidemiologist 4 6.00% 87,931.00 $ 5,715.52 6.00%
87,931.00 $ 5,275.86
Project leader-Epidemiologist 2 8.00% 53,143.00 $ 4,605.73 8.00%
53,143.00 $ 4,251.44
Epidemiologist 4 4.00% 87,931.00 $ 3,810.34 4.00%
87,931.00 $ 3,517.24
Epidemiologist 3 $ - $ -
Section Chief: Practitioner Licensing $ - $ -
Manager Vital Statistics 3.00% 86,300.00 $ 2,804.75 3.00%
86,300.00 $ 2,589.00
Section Chief: IT 3.00% 100,000.00 $ 3,250.00 3.00%
100,000.00 $ 3,000.00
Data quality committee reviewing databases and overseeing fixes (Impl Prds 2 - 3)
Source: Susan Logan, MS, MPH, Connecticut Department of Public Health
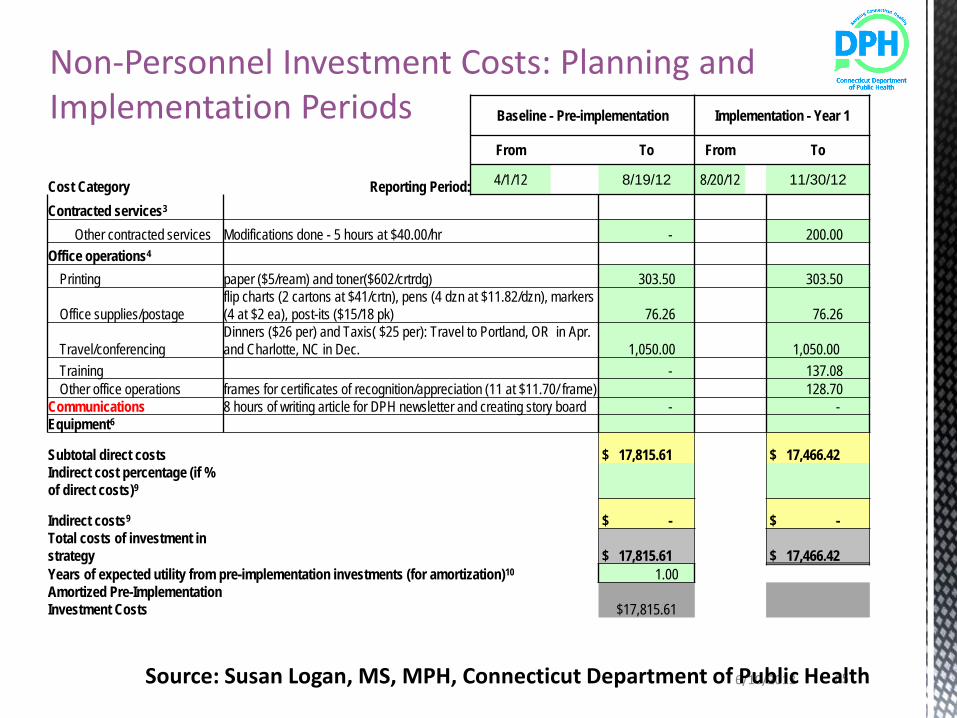
Non-Personnel Investment Costs: Planning and Implementation Periods
6/10/2013 65
Baseline - Pre-implementation Implementation - Year 1
From To From To
Cost Category Reporting Period: 4/1/12 8/19/12 8/20/12 11/30/12
Contracted services3 Other contracted services Modifications done - 5 hours at $40.00/hr - 200.00 Office operations4
Printing paper ($5/ream) and toner($602/crtrdg) 303.50 303.50
Office supplies/postage flip charts (2 cartons at $41/crtn), pens (4 dzn at $11.82/dzn), markers (4 at $2 ea), post-its ($15/18 pk) 76.26 76.26
Travel/conferencing Dinners ($26 per) and Taxis( $25 per): Travel to Portland, OR in Apr. and Charlotte, NC in Dec. 1,050.00 1,050.00
Training - 137.08 Other office operations frames for certificates of recognition/appreciation (11 at $11.70/ frame) 128.70
Communications 8 hours of writing article for DPH newsletter and creating story board - - Equipment6
Subtotal direct costs $ 17,815.61 $ 17,466.42 Indirect cost percentage (if % of direct costs)9
Indirect costs9 $ - $ - Total costs of investment in strategy $ 17,815.61 $ 17,466.42 Years of expected utility from pre-implementation investments (for amortization)10 1.00 Amortized Pre-Implementation Investment Costs $17,815.61
Source: Susan Logan, MS, MPH, Connecticut Department of Public Health
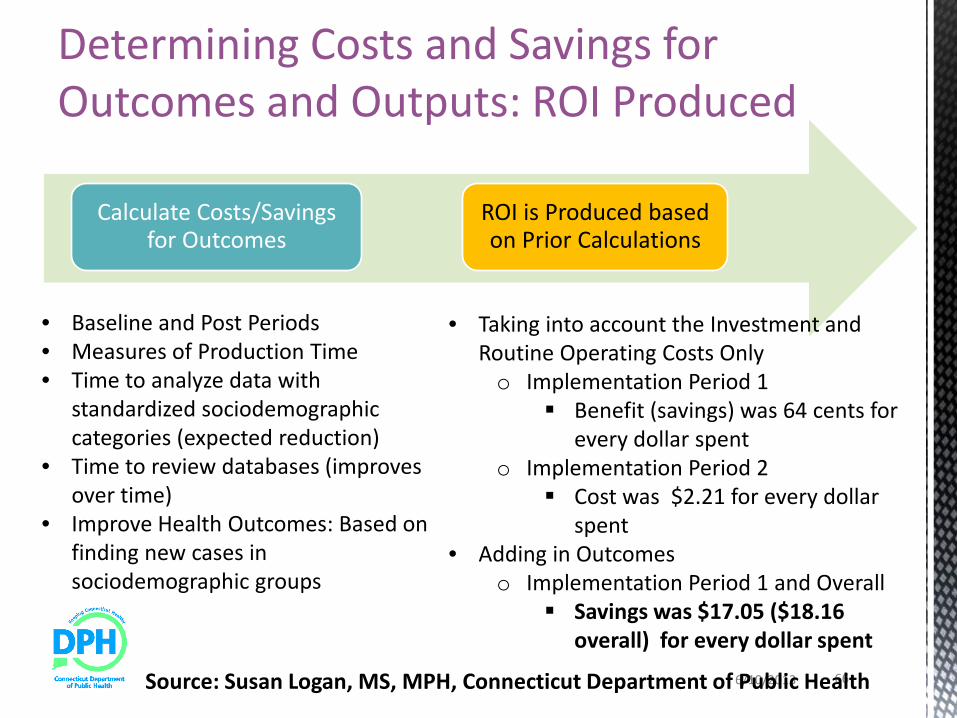
Calculate Costs/Savings for Outcomes
ROI is Produced based on Prior Calculations
Determining Costs and Savings for Outcomes and Outputs: ROI Produced
• Baseline and Post Periods • Measures of Production Time • Time to analyze data with
standardized sociodemographic categories (expected reduction)
• Time to review databases (improves over time)
• Improve Health Outcomes: Based on finding new cases in sociodemographic groups
• Taking into account the Investment and Routine Operating Costs Only o Implementation Period 1
Benefit (savings) was 64 cents for every dollar spent
o Implementation Period 2 Cost was $2.21 for every dollar
spent • Adding in Outcomes
o Implementation Period 1 and Overall Savings was $17.05 ($18.16
overall) for every dollar spent 6/10/2013 66 Source: Susan Logan, MS, MPH, Connecticut Department of Public Health

Outcome/Output Measures: Production Time Costs and Savings
6/10/2013 67
Measures of Production Time Baseline Post Period - Year I
TRUE Description: output/event and time frame
Total events
Average time
(days)
Total time (days
)
Total event
s
Average time (days)
Total time
(days)
Time to analyze data with standardized sociodemographic categories
May see reductions in Post Periods-Year 2 and 3 when employees are trained and databases were starting to be used for quarterly and final reports: 1/1/2013 to 12/31/2014
7.00
3.00
21.00
7.00
2.50
17.50
Number of databases reviewed by project sponsor and leader
Spent 1 hour per database review in baseline and QA checks
8.00
0.20
1.60
8.00
0.03
0.24
Number of databases reviewed by data quality committee
Will spend 1 hour per database review in baseline and QA checks
-
-
Total 5 4.52 22.60 5 3.548 17.74
Source: Susan Logan, MS, MPH, Connecticut Department of Public Health

Outcome/Output Measures: Reach Outcomes: Rates
6/10/2013 68
Measures of Reach/Intermediate Outcomes Baseline Post Period - Year I
FALSE
Description: target population and outcome
Numerator
Denominator Rate Numerato
r Denomin
ator Rate
Finding cancer cases based on self-identified gender
Using SEER cancer registry as source data 343 75,250 455.81 350 75,250 465.12
Finding cases of reportable disease based on sociodemographic characteristics (e.g. black race)
Focusing program services for African-Americans throughout the CT 5,000 660,000 757.58 5,500 660,000 833.33
Finding cases of adult lead poisoning based on sociodemographic characteristics (e.g. Hispanic) Finding more cases of hispanic origin 22 874,500 2.52 30 874,500 3.43
Composite reach 5,365 1,609,750 333.28 5,880 1,609,750 365.27
Used these rows as a worksheet for the health outcomes on next slide
Did not include data in ROI calculations (unchecked)
Source: Susan Logan, MS, MPH, Connecticut Department of Public Health
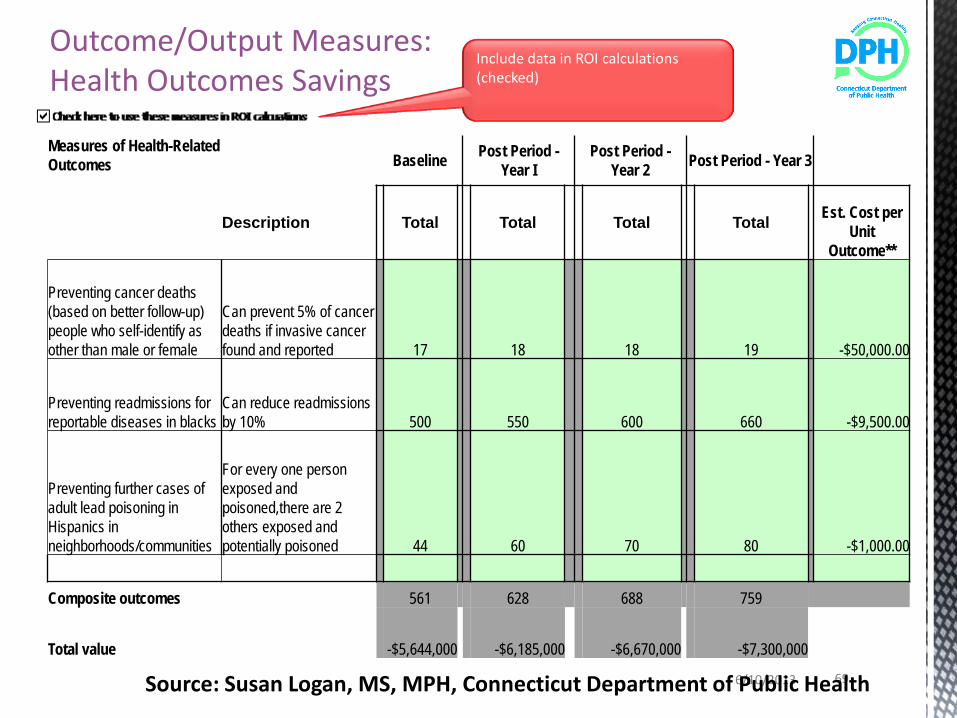
Outcome/Output Measures: Health Outcomes Savings
6/10/2013 69
Include data in ROI calculations (checked)
Measures of Health-Related Outcomes Baseline Post Period -
Year I Post Period -
Year 2 Post Period - Year 3
TRUE Description Total Total Total
Total
Est. Cost per Unit
Outcome**
Preventing cancer deaths (based on better follow-up) people who self-identify as other than male or female
Can prevent 5% of cancer deaths if invasive cancer found and reported 17 18 18 19 -$50,000.00
Preventing readmissions for reportable diseases in blacks
Can reduce readmissions by 10% 500 550 600 660 -$9,500.00
Preventing further cases of adult lead poisoning in Hispanics in neighborhoods/communities
For every one person exposed and poisoned,there are 2 others exposed and potentially poisoned 44 60 70 80 -$1,000.00
Composite outcomes 561 628 688 759
Total value -$5,644,000 -$6,185,000 -$6,670,000 -$7,300,000
Source: Susan Logan, MS, MPH, Connecticut Department of Public Health
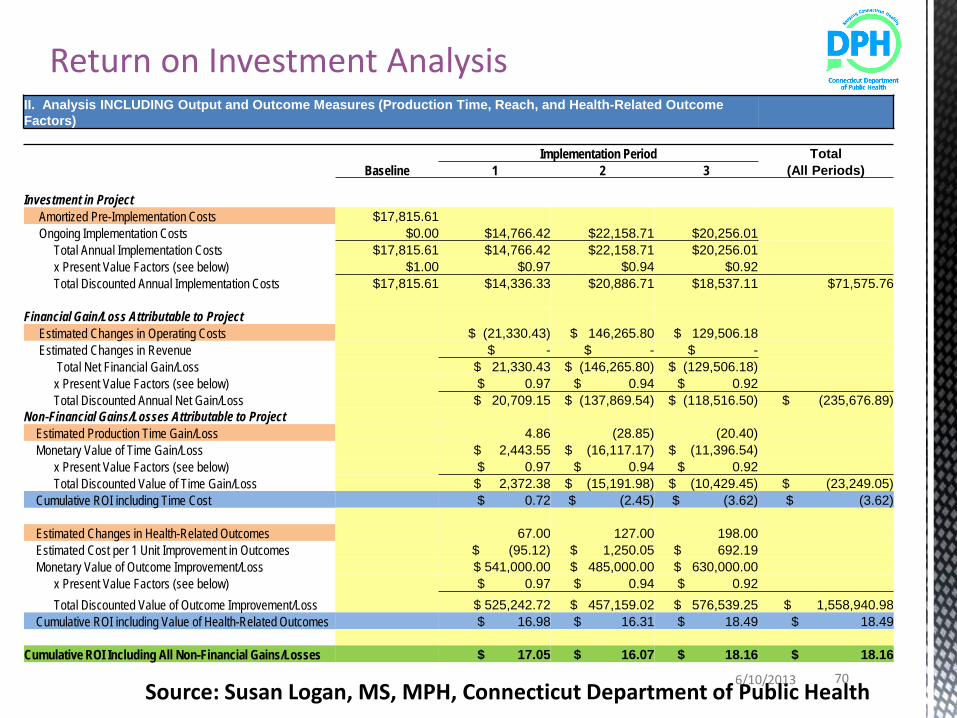
Return on Investment Analysis
6/10/2013 70
II. Analysis INCLUDING Output and Outcome Measures (Production Time, Reach, and Health-Related Outcome Factors) Implementation Period Total
Baseline 1 2 3 (All Periods)
Investment in Project Amortized Pre-Implementation Costs $17,815.61 Ongoing Implementation Costs $0.00 $14,766.42 $22,158.71 $20,256.01 Total Annual Implementation Costs $17,815.61 $14,766.42 $22,158.71 $20,256.01 x Present Value Factors (see below) $1.00 $0.97 $0.94 $0.92 Total Discounted Annual Implementation Costs $17,815.61 $14,336.33 $20,886.71 $18,537.11 $71,575.76
Financial Gain/Loss Attributable to Project Estimated Changes in Operating Costs $ (21,330.43) $ 146,265.80 $ 129,506.18 Estimated Changes in Revenue $ - $ - $ - Total Net Financial Gain/Loss $ 21,330.43 $ (146,265.80) $ (129,506.18) x Present Value Factors (see below) $ 0.97 $ 0.94 $ 0.92 Total Discounted Annual Net Gain/Loss $ 20,709.15 $ (137,869.54) $ (118,516.50) $ (235,676.89) Non-Financial Gains/Losses Attributable to Project Estimated Production Time Gain/Loss 4.86 (28.85) (20.40) Monetary Value of Time Gain/Loss $ 2,443.55 $ (16,117.17) $ (11,396.54) x Present Value Factors (see below) $ 0.97 $ 0.94 $ 0.92 Total Discounted Value of Time Gain/Loss $ 2,372.38 $ (15,191.98) $ (10,429.45) $ (23,249.05) Cumulative ROI including Time Cost $ 0.72 $ (2.45) $ (3.62) $ (3.62)
Estimated Changes in Health-Related Outcomes 67.00 127.00 198.00 Estimated Cost per 1 Unit Improvement in Outcomes $ (95.12) $ 1,250.05 $ 692.19 Monetary Value of Outcome Improvement/Loss $ 541,000.00 $ 485,000.00 $ 630,000.00 x Present Value Factors (see below) $ 0.97 $ 0.94 $ 0.92 Total Discounted Value of Outcome Improvement/Loss $ 525,242.72 $ 457,159.02 $ 576,539.25 $ 1,558,940.98 Cumulative ROI including Value of Health-Related Outcomes $ 16.98 $ 16.31 $ 18.49 $ 18.49
Cumulative ROI Including All Non-Financial Gains/Losses $ 17.05 $ 16.07 $ 18.16 $ 18.16
Source: Susan Logan, MS, MPH, Connecticut Department of Public Health

Example: Increase Enrollment in Plan First – Virginia’s Medicaid Family Planning Program
71
Post Partum
Birth Control
Other – Family Planning
LHD
External Provider
Registration
WebVision
DSS
Individuals Providers Enrollment Process
Service
Billing
Service Provide
d
STD Testing
WIC Clinic
Demographic, Age, Income,
Insurance
Possible - Prompt for Plan First. Clerk
still must know parameters
Ask Questions to Determine Eligibility
If eligible – fill out application/ self populates some
fields
If Interested Individual Signs & Dates
LHD Submits
Printed App to DSS
Eligible No More
Needed
Application Given to
Individual Not
Interested
Individual Follows Up
Eligibility
LHD Bills
Medicaid
No Incentive
Title X & Payment Issues
System Understanding
& Function
Tracking & Follow Up Capability
Application Process/
Form Length
Auto-Enrollment & Payment
Knowledge
Knowledge
Knowledge
Eligibility Levels
Tracking/ Notificati
on
Source: Josh Czarda, Virginia Department of Health
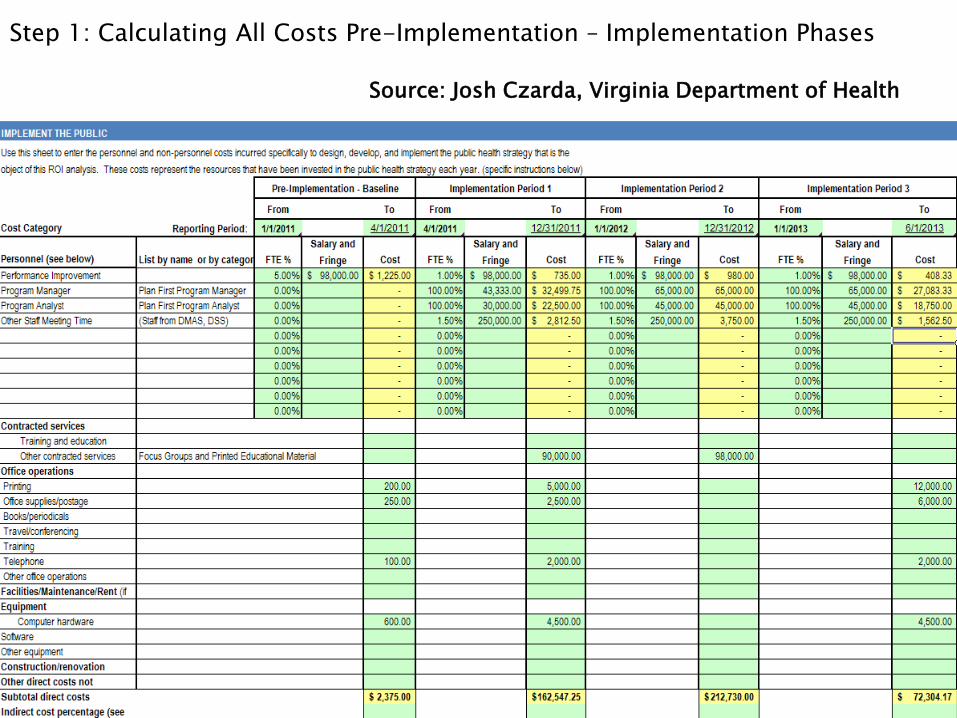
Step 1: Calculating All Costs Pre-Implementation – Implementation Phases
Source: Josh Czarda, Virginia Department of Health
$-
$10,000.00
$20,000.00
$30,000.00
$40,000.00
$50,000.00
$60,000.00
$70,000.00
$80,000.00AL
EXAN
DRI
AAL
LEGH
ANY
ARLI
NGT
ON
CEN
TRAL
SH
ENAN
DO
AHCE
NTR
AL V
IRG
INIA
CHES
APEA
KECH
ESTE
RFIE
LDCH
ICKA
HO
MIN
YCR
ATER
CUM
BERL
AND
PLA
TEAU
EAST
ERN
SH
ORE
HAM
PTO
NLE
NO
WIS
COLO
RD F
AIRF
AXLO
UDO
UNM
OUN
T RO
GER
SN
EW R
IVER
NO
RFO
LKPE
NIN
SULA
PIED
MO
NT
PITT
SYLV
ANIA
/DAN
VILL
EPO
RTSM
OUT
HPR
INCE
WIL
LIAM
RAPP
AHAN
NO
CKRA
PPAH
ANN
OCK
-RAP
IDAN
RICH
MO
ND
ROAN
OKE
SOUT
HSI
DE
THO
MAS
JEFF
ERSO
NTH
REE
RIVE
RSVI
RGIN
IA B
EACH
WES
T PI
EDM
ON
TW
ESTE
RN T
IDEW
ATER
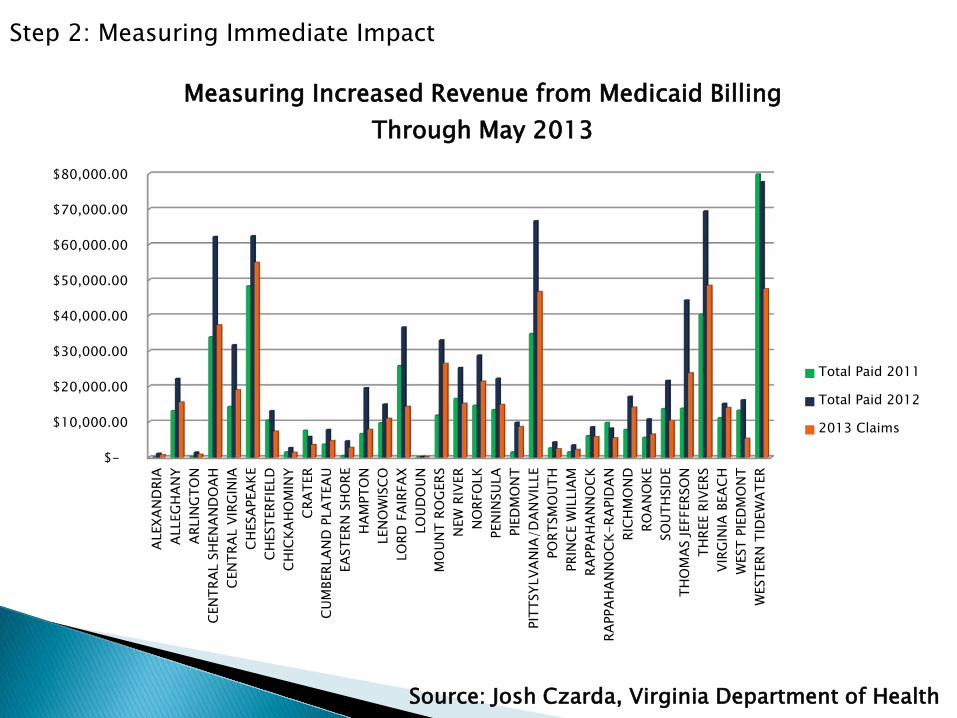
Measuring Increased Revenue from Medicaid Billing Through May 2013
Total Paid 2011
Total Paid 2012
2013 Claims
Step 2: Measuring Immediate Impact
Source: Josh Czarda, Virginia Department of Health

Initial View of Short Term ROI Calculations Using the Tool
III. Examples of economic evaluation in public health


Variations in policy design, implementation, enforcement
Estimated Effects of Smoke-free Policies on AMI admissions
Glantz 2008
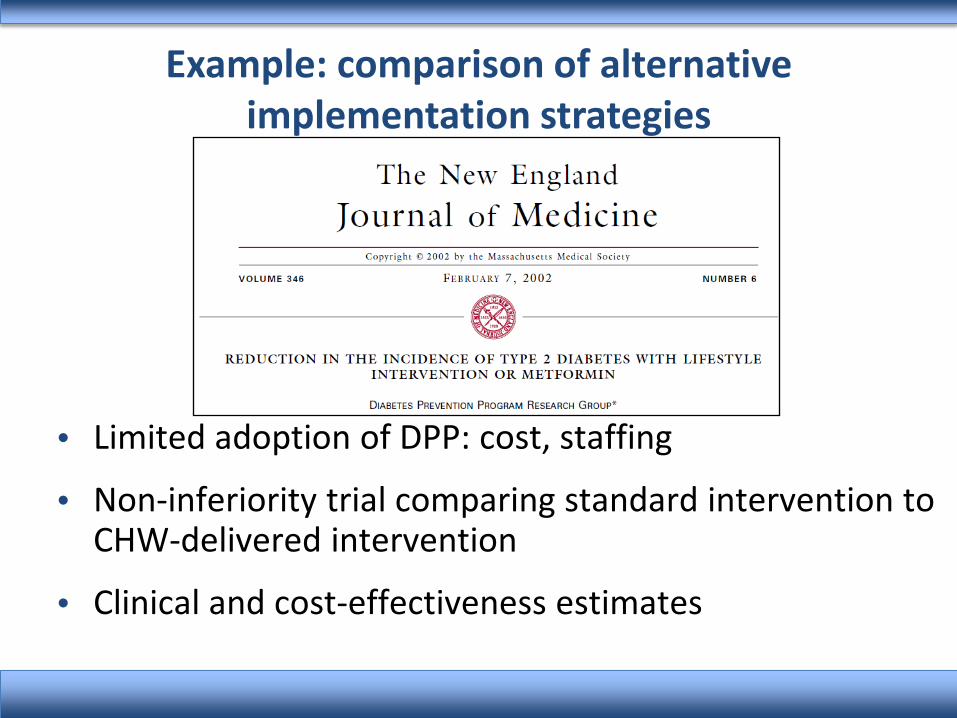
Example: comparison of alternative implementation strategies
• Limited adoption of DPP: cost, staffing
• Non-inferiority trial comparing standard intervention to CHW-delivered intervention
• Clinical and cost-effectiveness estimates

0 5%
10
%
15%
Frac
tion
of A
genc
ies
–$50 $0 $50
Change in Per Capita Spending (Current Dollars) –$10 –$20 –$30 –$40 $40 $30 $20 $10
35%
65%
Estimating the aggregate value of public health spending
Change in Local Public Health Spending, 1993-2005

Example: Mortality reductions attributable to local public health spending, 1993-2008
-9
-8
-7
-6
-5
-4
-3
-2
-1
0
1
2
Infantmortality
Heartdisease Diabetes Cancer Influenza All-cause Alzheimers Injury
Perc
ent c
hang
e
Mays et al. Health Affairs, 2011

Aggregate value of spending Source Cost per Life- Year Gained Medical care spending, 1990-2000 $36,300 (Cutler et al. NEJM, 2006) Public health spending, 1993-2005 $12,200-$25,600

Example: Medical Care Offsets Attributable to Local Public Health Spending, 1993-2008
5800
6000
6200
6400
6600
6800
7000
7200
0
20
40
60
80
100
120
Quintile 1 Quintile 2 Quintile 3 Quintile 4 Quintile 5
Med
ical
spen
ding
/per
son
($)
.
Publ
ic h
ealth
spen
ding
/cap
ita ($
) .
Quintiles of public health spending/capita
Public health spending/capita
Medicare spending per recipient
Mays et al. Health Services Research, 2009
Medical Cost Offset = 0.088%

Example: Projecting effects of new public health spending
1.2% increase in public health spending in average community over 10 years: Public health cost $7.2M Medical cost offset -$6.3M (Medicare only) Deaths averted 175.8 Life years gained 1758 Net cost/LY $546
Mays et al. forthcoming 2012
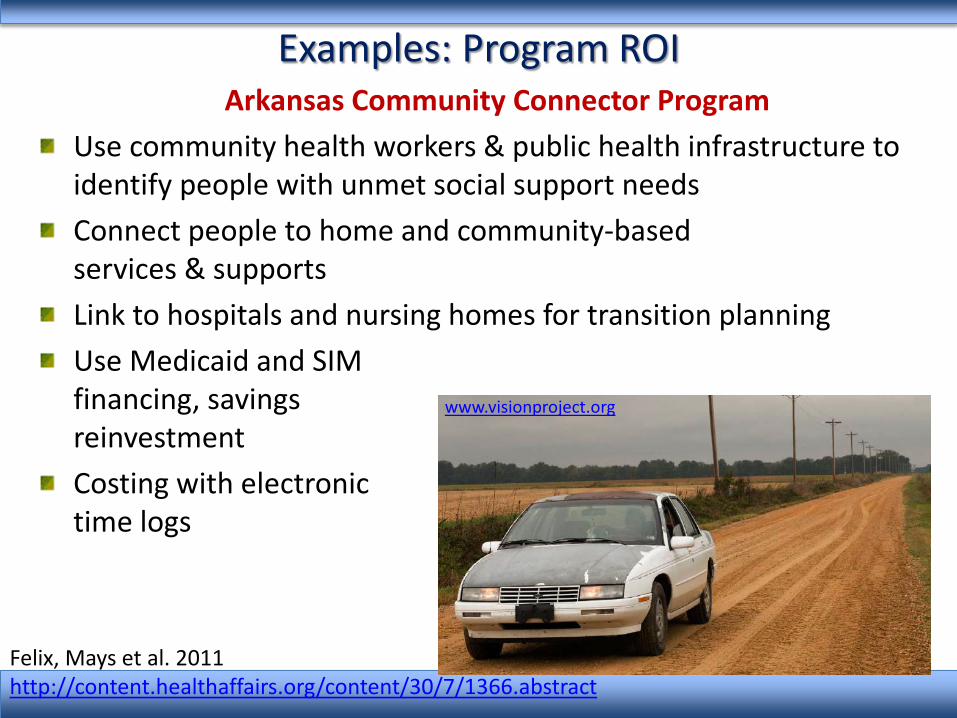
Examples: Program ROI Arkansas Community Connector Program
Use community health workers & public health infrastructure to identify people with unmet social support needs Connect people to home and community-based services & supports Link to hospitals and nursing homes for transition planning Use Medicaid and SIM financing, savings reinvestment Costing with electronic time logs
www.visionproject.org
Felix, Mays et al. 2011 http://content.healthaffairs.org/content/30/7/1366.abstract

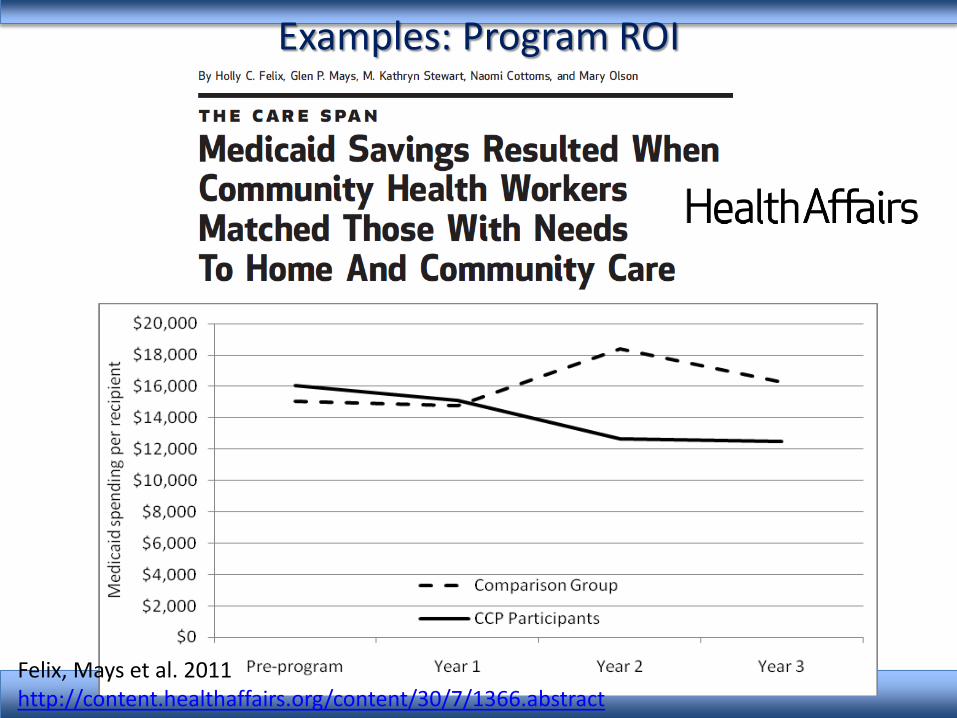
Example: Program ROI
Quasi-experimental research design Three year demonstration period + 1 year extension Measured expenditures for CCP participants one year before participation and up to 3 years after participation Constructed a statistically-matched comparison group of Medicaid recipients not served by CCP Use difference-in-difference models to estimate impact, controlling for time-varying covariates
Examples: Program ROI
Felix, Mays et al. 2011 http://content.healthaffairs.org/content/30/7/1366.abstract

Three Year Aggregate Estimates Combined Medicaid spending reductions: $3.515 M Program implementation costs: $0.896 M Net savings: $2.629 M ROI: $2.92
Examples: Program ROI
Felix, Mays et al. 2011 http://content.healthaffairs.org/content/30/7/1366.abstract

IV. Small Group Exercise

V. DSHS Examples
VI. Interpretation, Limitations and Caveats

Interpreting & using results: Key considerations
Uncertainty and sensitivity analysis Measurement error Attribution and threats to validity Scenario analysis Upper-bound and lower-bound estimates

Advancing Economic Analysis in Public Health
Enhanced tracking of public health expenditures Enhanced monitoring of program performance – Reach/targeting – Effectiveness – Efficiency – Equity
Analysis of cross-cutting infrastructure needed to implement/maintain programs

For More Information
Glen P. Mays, Ph.D., M.P.H. [email protected]
Supported by The Robert Wood Johnson Foundation
Email: [email protected] Web: www.publichealthsystems.org Journal: www.FrontiersinPHSSR.org Archive: works.bepress.com/glen_mays Blog: publichealtheconomics.org
Nat iona l Coordinat ing Center