fundamental properties of low-viscosity self-compacting ... papers/data/e140.pdf ·...
TRANSCRIPT

Fundamental Properties of Low-Viscosity Self-Compacting Concrete with a Superplasticizer Containing an Innovative
Viscosity-Modifying Admixture
Yusuke Baba1*, Takumi Sugamata2, Minoru Yaguchi1, Hironobu Yamamiya3 and Takao Furusawa1
1Technical Development Center, Construction Chemicals, BASF Japan Ltd., Japan 2Technical Services, Construction Chemicals, BASF Australia Ltd., Australia
3Sales, Construction Chemicals, BASF Japan Ltd., Japan *2722, Hagizono, Chigasaki-shi, Kanagawa, 253-0071, Japan, <[email protected]>,
<[email protected]>, <[email protected]>, <[email protected]>, <[email protected]>
ABSTRACT
A technology with which it is possible, without causing segregation, to economically upgrade ordinary concrete to self-compacting concrete that has superior fluidity with a high deformation velocity at low viscosity and superior self-compactability is proposed through the utilization of a newly developed superplasticizer containing an innovative viscosity-modifying admixture. The basic characteristics of this technology are evaluated using laboratory tests and full-scale tests. The results confirmed that while the low-viscosity self-compacting concrete using that superplasticizer has a low viscosity, it also has good segregation resistance and self-compactability, which are expected to lead to a reduction in labor and rationalized, more energy-efficient rapid construction. It was also found that the hardened properties of the concrete are almost identical to those of ordinary concrete having the same water-cement ratio.
Keywords. Viscosity-Modifying Admixture, Self-Compacting Concrete, Low Viscosity, Superplasticizer, Self-Compactability
INTRODUCTION
Self-compacting concrete not only improves the reliability of concrete structures from the perspective of quality and durability through superior self-compactability; it also significantly contributes to a reduction in labor and yields a rationalized, more energy-efficient construction, which in turn enables more rapid construction. In the drive for sustainable development, the role that self-compacting concrete should play in the construction industry is extremely important because of the need for further improvement in the durability of concrete structures and more energy-efficient construction as an environmentally friendly measure. However, there are problems with self-compacting concrete. These include the following: 1) self-compacting concrete costs more compared with ordinary concrete; 2) the use of mineral admixtures and viscosity modifying admixtures

is restricted by plant equipment; and 3) workability is reduced (for example, the pumping pressure is high because of the high viscosity, and finishing is difficult because there is little bleeding).
Therefore, the authors propose a technology with which it is possible to economically upgrade ordinary concrete to self-compacting concrete by utilizing a newly developed superplasticizer containing an innovative viscosity-modifying admixture and which does not cause the normal strength concrete to segregate. The resulting concrete will have: a) superior fluidity with a high deformation velocity at low viscosity and b) self-compactability. This self-compacting concrete using a superplasticizer containing a viscosity-modifying admixture has been adopted as the surfactant system of viscosity-agent-type self-compacting concrete in "Recommendations for Mix Design and Construction of Self-Compacting Concrete - 2012" by the Japan Society of Civil Engineers.
In this paper, the fundamental properties of low-viscosity self-compacting concrete with a superplasticizer containing an innovative viscosity-modifying admixture are discussed.
OUTLINE OF EXPERIMENT
Phase 1. Table 1 shows the materials used in the experiment. Table 2 shows the mix proportion and test items. An evaluation of the basic characteristics of the low-viscosity self-compacting concrete (SDC) using the new superplasticizer containing viscosity- modifying admixture (SP-SDC) was conducted alongside ordinary concrete (OC) with a slump of 21 cm and using conventional superplasticizer for comparison. Further, SP-SDC is a unique, newly developed viscosity-modifying admixture mixed with a polycarboxylic ether compound that is the main component of the superplasticizer.
Table 2. Mix proportion of concrete and test items
Table 1. Materials Symbol Kind Physical properties and main components
Water W Tap water -
Ordinarily portland cement (N) Density: 3.16g/cm3
Portland blast-furnace slag cement type B (BB) Density: 3.04g/cm3
Mineral admixture LP Limestone powder Density: 2.71g/cm3
Fine aggregate S Land sand (Oi-gawa River system) Density in saturated surface-dry condition: 2.59g/cm3,Fineness modulus: 2.70
Coarse aggregate G Crushed hard sand-stone from Ome Density in saturated surface-dry condition: 2.66g/cm3,Maximum size: 20mm
SP Superplasticizer Polycarboxylic ether compound
SP-SDC Superplasticizer containing innovative viscosity- modifying admixture
Complex of polycarboxylic ether compound and viscosity-modifying polymer
Cement C
Chemical admixture
Kind of concrete SymbolTargetslump /
slump flow
Target aircontent
(%)Cement
W/C(%)
s/a(%)
Unit absolute volumeof coarse aggregate
(m3/m3)
Unit watercontent
(kg/m3)
Chemicaladmixture
N45.050.040.0
47.848.746.5
BB 45.0 47.4
N45.050.040.0
50.551.449.3
BB 45.0 50.2
SP
SP-SDCSlump flow
600mm4.5
175
Low-viscosity self-compacting concrete
SDC
0.343Ordinary concrete OCSlump21cm
4.5
0.325
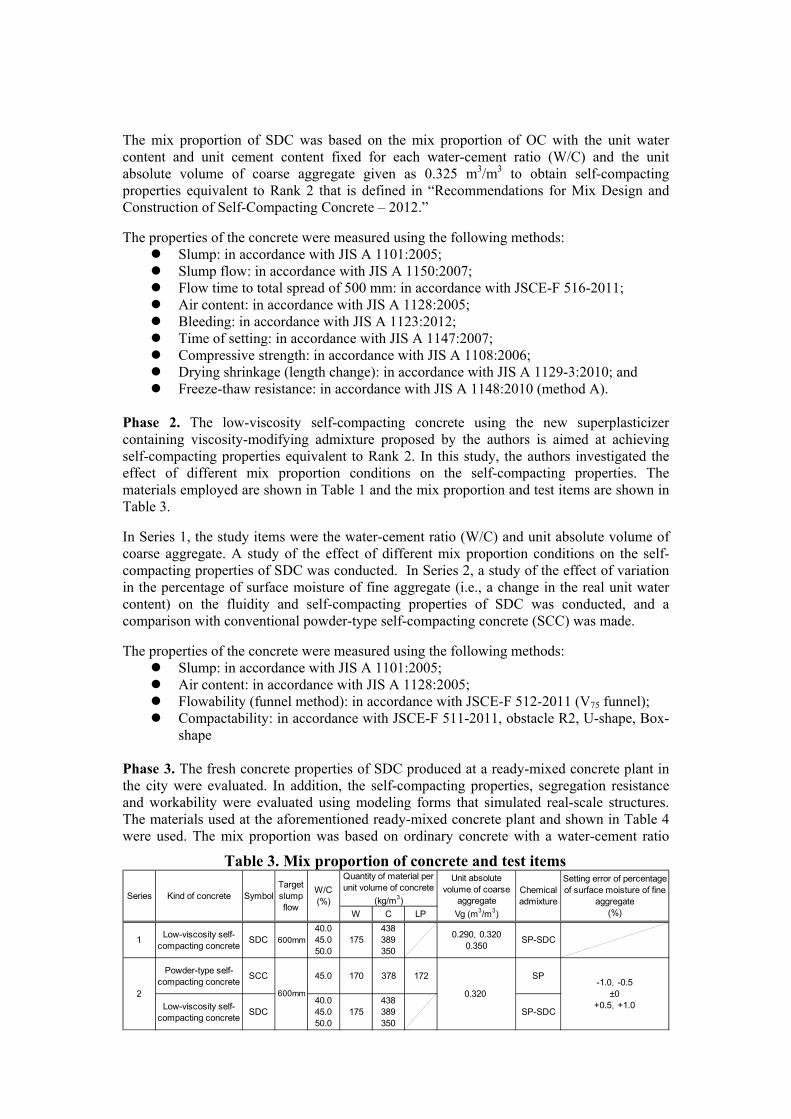
The mix proportion of SDC was based on the mix proportion of OC with the unit water content and unit cement content fixed for each water-cement ratio (W/C) and the unit absolute volume of coarse aggregate given as 0.325 m3/m3 to obtain self-compacting properties equivalent to Rank 2 that is defined in “Recommendations for Mix Design and Construction of Self-Compacting Concrete – 2012.”
The properties of the concrete were measured using the following methods: Slump: in accordance with JIS A 1101:2005; Slump flow: in accordance with JIS A 1150:2007; Flow time to total spread of 500 mm: in accordance with JSCE-F 516-2011; Air content: in accordance with JIS A 1128:2005; Bleeding: in accordance with JIS A 1123:2012; Time of setting: in accordance with JIS A 1147:2007; Compressive strength: in accordance with JIS A 1108:2006; Drying shrinkage (length change): in accordance with JIS A 1129-3:2010; and Freeze-thaw resistance: in accordance with JIS A 1148:2010 (method A).
Phase 2. The low-viscosity self-compacting concrete using the new superplasticizer containing viscosity-modifying admixture proposed by the authors is aimed at achieving self-compacting properties equivalent to Rank 2. In this study, the authors investigated the effect of different mix proportion conditions on the self-compacting properties. The materials employed are shown in Table 1 and the mix proportion and test items are shown in Table 3.
In Series 1, the study items were the water-cement ratio (W/C) and unit absolute volume of coarse aggregate. A study of the effect of different mix proportion conditions on the self-compacting properties of SDC was conducted. In Series 2, a study of the effect of variation in the percentage of surface moisture of fine aggregate (i.e., a change in the real unit water content) on the fluidity and self-compacting properties of SDC was conducted, and a comparison with conventional powder-type self-compacting concrete (SCC) was made.
The properties of the concrete were measured using the following methods: Slump: in accordance with JIS A 1101:2005; Air content: in accordance with JIS A 1128:2005; Flowability (funnel method): in accordance with JSCE-F 512-2011 (V75 funnel); Compactability: in accordance with JSCE-F 511-2011, obstacle R2, U-shape, Box-
shape Phase 3. The fresh concrete properties of SDC produced at a ready-mixed concrete plant in the city were evaluated. In addition, the self-compacting properties, segregation resistance and workability were evaluated using modeling forms that simulated real-scale structures. The materials used at the aforementioned ready-mixed concrete plant and shown in Table 4 were used. The mix proportion was based on ordinary concrete with a water-cement ratio
Table 3. Mix proportion of concrete and test items
W C LP
1Low-viscosity self-
compacting concreteSDC 600mm
40.045.050.0
175438389350
0.290,0.3200.350
SP-SDC
Powder-type self-compacting concrete
SCC 45.0 170 378 172 SP
Low-viscosity self-compacting concrete
SDC40.045.050.0
175438389350
SP-SDC
SymbolTargetslumpflow
W/C(%)
Quantity of material perunit volume of concrete
(kg/m3)
Unit absolutevolume of coarse
aggregate
Vg (m3/m3)
Chemicaladmixture
Setting error of percentageof surface moisture of fine
aggregate(%)
2 600mm 0.320-1.0,-0.5
±0+0.5,+1.0
Series Kind of concrete
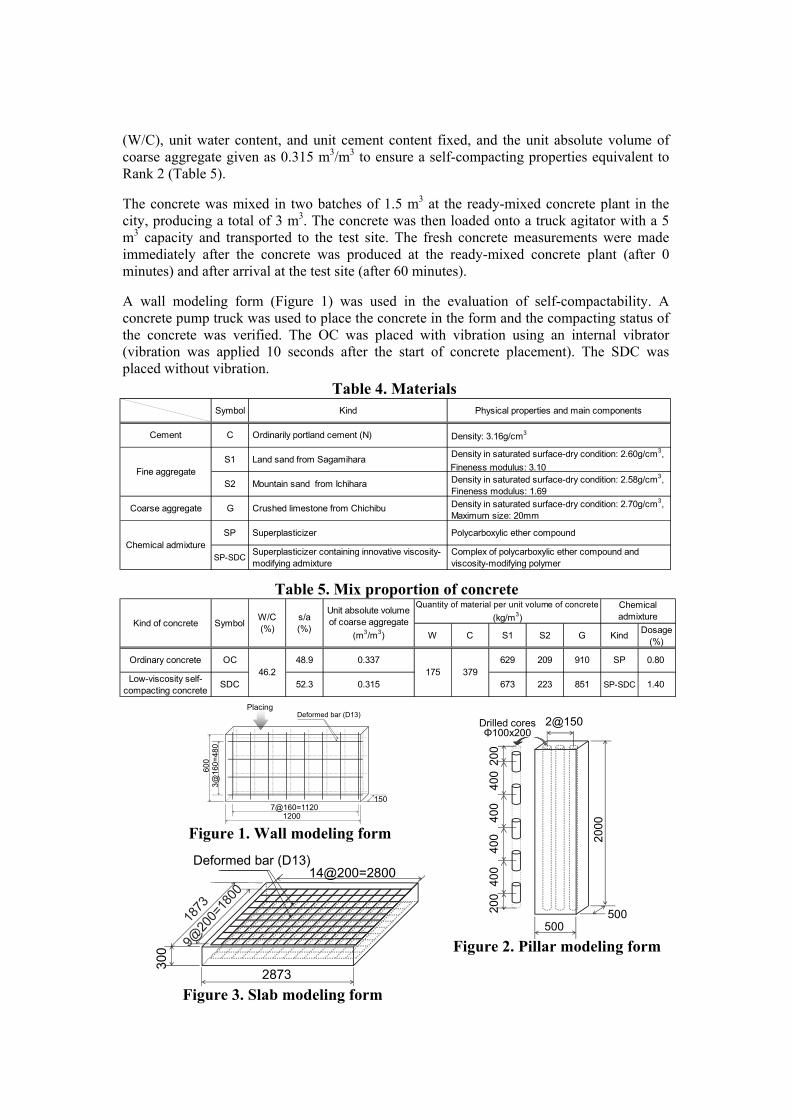
(W/C), unit water content, and unit cement content fixed, and the unit absolute volume of coarse aggregate given as 0.315 m3/m3 to ensure a self-compacting properties equivalent to Rank 2 (Table 5).
The concrete was mixed in two batches of 1.5 m3 at the ready-mixed concrete plant in the city, producing a total of 3 m3. The concrete was then loaded onto a truck agitator with a 5 m3 capacity and transported to the test site. The fresh concrete measurements were made immediately after the concrete was produced at the ready-mixed concrete plant (after 0 minutes) and after arrival at the test site (after 60 minutes).
A wall modeling form (Figure 1) was used in the evaluation of self-compactability. A concrete pump truck was used to place the concrete in the form and the compacting status of the concrete was verified. The OC was placed with vibration using an internal vibrator (vibration was applied 10 seconds after the start of concrete placement). The SDC was placed without vibration.
2@150
2000
500500
200
400
400
200
Drilled cores Φ100x200
400
400
300
2873
14@200=2800Deformed bar (D13)
12007@160=1120
3@16
0=48
06
00
150
PlacingDeformed bar (D13)
Figure 1. Wall modeling form
Figure 2. Pillar modeling form
Figure 3. Slab modeling form
Table 5. Mix proportion of concrete
Table 4. Materials
W C S1 S2 G KindDosage
(%)
Ordinary concrete OC 48.9 0.337 629 209 910 SP 0.80
Low-viscosity self-compacting concrete
SDC 52.3 0.315 673 223 851 SP-SDC 1.4046.2 379175
Chemicaladmixture
Kind of concrete SymbolW/C(%)
s/a(%)
Unit absolute volumeof coarse aggregate
(m3/m3)
Quantity of material per unit volume of concrete
(kg/m3)
Symbol Kind Physical properties and main components
Cement C Ordinarily portland cement (N) Density: 3.16g/cm3
S1 Land sand from Sagamihara Density in saturated surface-dry condition: 2.60g/cm3, Fineness modulus: 3.10
S2 Mountain sand from Ichihara Density in saturated surface-dry condition: 2.58g/cm3,Fineness modulus: 1.69
Coarse aggregate G Crushed limestone from Chichibu Density in saturated surface-dry condition: 2.70g/cm3,Maximum size: 20mm
SP Superplasticizer Polycarboxylic ether compound
SP-SDC Superplasticizer containing innovative viscosity- modifying admixture
Complex of polycarboxylic ether compound and viscosity-modifying polymer
Chemical admixture
Fine aggregate

The segregation resistance was evaluated using a pillar model (Figure 2). The concrete was placed in the upper level of the form using a concrete pump vehicle and was removed from the form at an age of 7 days, then air-cured outside. At a material age of 28 days, 3 cores of concrete (10 cm in diameter) were extracted vertically from the upper surface of the concrete and each core was cut height wise into 5 core test pieces. The core compressive strength and coarse aggregate area ratio were measured. The coarse aggregate area ratio was measured using image analysis of splits in the surface of the core test pieces.
The workability was evaluated using a slab modeling form (Figure 3). The concrete was placed in the form directly from the truck agitator and the operation times required to complete placement for OC and SDC were measured.
RESULTS AND DISCUSSION
Phase 1. The dosage of chemical admixture used to obtain the specified fluidity is shown in Figure 4. The symbol is expressed as “W/C - kind of cement” in the figure. The SDC mix proportion is made up of the same unit water content and unit cement content as the OC. The dosage of SP-SDC used was approximately 1.5 to 2 times more compared with SP by increasing the target fluidity from 21 cm slump to a slump flow of 600 mm. Figure 5 shows the flow time to total spread of 500 mm. Figure 5 also includes the measurement results for the conventional viscosity agent-type self-compacting concrete for which a test was implemented separately using the same mix proportion. The Flow time to total spread of 500 mm for SDC was 4.0 to 5.3 seconds, compared with 7.6 to 9.0 seconds for SCC. It was confirmed that the viscosity was low and the deformation velocity was high. The authors concluded that the pressure loss during pumping is reduced and construction can be executed more quickly. Moreover, a sufficient segregation resistance was observed when the spread of slump flow was visually monitored.
The measurement results for bleeding are shown in Figure 6. A high bleeding-inhibiting effect was not identified for SDC as it was observed for SCC, but because the bleeding
0.0
0.5
1.0
1.5
2.0
OC
SD
C
OC
SD
C
OC
SD
C
OC
SD
C
45-BB40-N50-N45-N
Dos
age
of c
hem
ical
ad
mix
ture
(C
x%)
02468
101214
OC
SD
C
OC
SD
C
OC
SD
C
OC
SD
C
Tim
e of
set
ting
(hou
rs)
Time of initial setting
Time of final setting
45-BB40-N50-N45-N
0.00
0.02
0.04
0.06
0.08
0.10
OC
SD
C
OC
SD
C
OC
SD
C
OC
SD
C
Ble
edin
g vo
lum
e(c
m3 /
cm2 )
45-BB40-N50-N45-N
8.4
5.0
8.0
5.2
9.0
5.3
7.6
4.0
0.0
2.0
4.0
6.0
8.0
10.0
12.0
SC
CS
DC
SC
CS
DC
SC
CS
DC
SC
CS
DC
Tim
e to
500
mm
flow
(s) 45-BB40-N50-N45-N
Figure 4. Dosage of chemical admixture Figure 5. Flow time to total spread of 500 mm
Figure 6. Bleeding volume Figure 7. Time of setting
volume is almost the same as for OC, it is thought that the same finishability as that achieved with ordinary concrete can be guaranteed. Moreover, as shown in Figure 7, the time of setting tended to be approximately 90 to 120 minutes longer due to the dosage of admixture used being 1.5 to 2 times greater than the dosage used for OC.
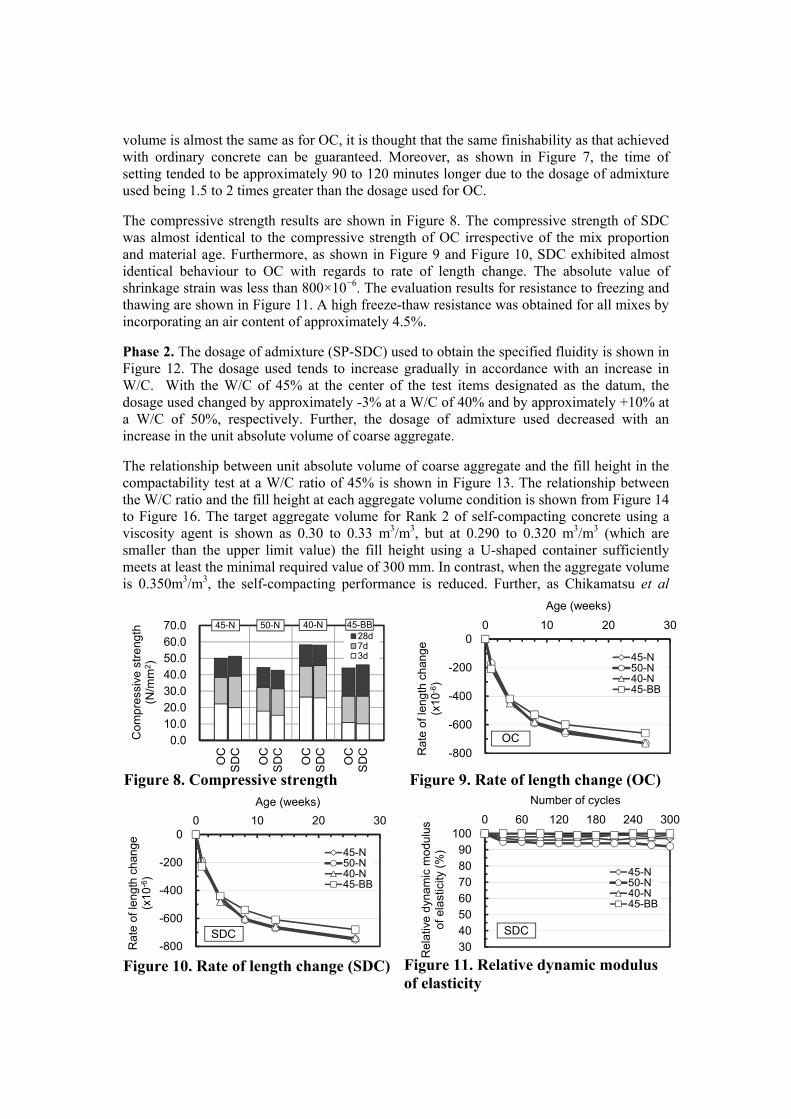
The compressive strength results are shown in Figure 8. The compressive strength of SDC was almost identical to the compressive strength of OC irrespective of the mix proportion and material age. Furthermore, as shown in Figure 9 and Figure 10, SDC exhibited almost identical behaviour to OC with regards to rate of length change. The absolute value of shrinkage strain was less than 800×10−6. The evaluation results for resistance to freezing and thawing are shown in Figure 11. A high freeze-thaw resistance was obtained for all mixes by incorporating an air content of approximately 4.5%.
Phase 2. The dosage of admixture (SP-SDC) used to obtain the specified fluidity is shown in Figure 12. The dosage used tends to increase gradually in accordance with an increase in W/C. With the W/C of 45% at the center of the test items designated as the datum, the dosage used changed by approximately -3% at a W/C of 40% and by approximately +10% at a W/C of 50%, respectively. Further, the dosage of admixture used decreased with an increase in the unit absolute volume of coarse aggregate.
The relationship between unit absolute volume of coarse aggregate and the fill height in the compactability test at a W/C ratio of 45% is shown in Figure 13. The relationship between the W/C ratio and the fill height at each aggregate volume condition is shown from Figure 14 to Figure 16. The target aggregate volume for Rank 2 of self-compacting concrete using a viscosity agent is shown as 0.30 to 0.33 m3/m3, but at 0.290 to 0.320 m3/m3 (which are smaller than the upper limit value) the fill height using a U-shaped container sufficiently meets at least the minimal required value of 300 mm. In contrast, when the aggregate volume is 0.350m3/m3, the self-compacting performance is reduced. Further, as Chikamatsu et al
0.010.020.030.040.050.060.070.0
OC
SD
C
OC
SD
C
OC
SD
C
OC
SD
C
Com
pre
ssiv
e s
tre
ng
th
(N/m
m2)
28d7d3d
45-BB40-N50-N45-N
30405060708090
1000 60 120 180 240 300
Rel
ativ
e d
yna
mic
mo
dulu
s of
ela
stic
ity (
%)
Number of cycles
45-N50-N40-N45-BB
SDC
-800
-600
-400
-200
00 10 20 30
Rat
e of
leng
th c
hang
e (x
10-6
)
Age (weeks)
45-N50-N40-N45-BB
OC
-800
-600
-400
-200
00 10 20 30
Rat
e of
leng
th c
hang
e (x
10-6
)
Age (weeks)
45-N50-N40-N45-BB
SDC
Figure 8. Compressive strength Figure 9. Rate of length change (OC)
Figure 10. Rate of length change (SDC) Figure 11. Relative dynamic modulus of elasticity

found, the evaluation of compacting performance using a Box-shaped container has a tendency to show inferior in comparison to a U-shaped container (Figure 17) and when the W/C ratio is 50%, in other words, when the unit cement content is small, even when the aggregate volume is 0.290 or 0.320 m3/m3, it tends to be impossible to obtain sufficient self-compacting performance.
Figure 18 shows the relationship between the setting error of percentage of surface moisture of fine aggregate and the slump flow. The slump flow for SDC increased by approximately 50mm at a change in the percentage of surface moisture of -1.0%, and decreased by approximately 100 mm at a change in the percentage of surface moisture of +1.0%, irrespective of the W/C. However, the increase and decrease is more restrained than for the
100
150
200
250
300
350
400
40 45 50
Fill
hei
ght(
mm
)
W/C (%)
Vg=0.290Box-shapedU-shaped
100
150
200
250
300
350
400
40 45 50
Fill
he
igh
t(m
m)
W/C (%)
Vg=0.320Box-shapedU-shaped
100
150
200
250
300
350
400
40 45 50
Fill
hei
ght(
mm
)
W/C (%)
Vg=0.350
Box-shapedU-shaped
100
150
200
250
300
350
400
0.290 0.320 0.350
Fill
hei
ght(
mm
)
Unit absolute volume of coarseaggregate (m3/m3)
W/C=45%
Box-shapedU-shaped
0.80
1.00
1.20
1.40
1.60
1.80
2.00
40 45 50
W/C (%)
Vg=0.290Vg=0.320Vg=0.350
Dos
age
of S
P-S
DC
(C
x%)
100
150
200
250
300
350
400
100 150 200 250 300 350 400
W/C=40%W/C=45%W/C=50%
Fill height using Box-shapedcontainer (mm)
Fill
he
ight
usin
g U
-sha
ped
cont
ain
er
(mm
)
Figure 12. Relationship between W/C and dosage of SP-SDC
Figure 13. Relationship between unit absolute volume of coarse aggregate and fill height
Figure 14. Relationship between W/C and fill height (Vg=0.290)
Figure 15. Relationship between W/C and fill height (Vg=0.320)
Figure 16. Relationship between W/C and fill height (Vg=0.350)
Figure 17. Relationship between fill height using Box-shaped container and U-shaped container

SCC implemented for comparative purposes. The authors identified that SDC is less susceptible to the effect of a change in the percentage of surface moisture. The relationship between setting error of percentage of surface moisture of fine aggregate and flow-through time of V75-funnel is shown in Figure 19. The relationship between setting error of percentage of surface moisture of fine aggregate and fill height using Box-shaped container and U-shaped container is shown in Figure 20 and in Figure 21. At a W/C of 50%, the flow-through time of V75-funnel and the fill height using Box-shaped container are susceptible to the effect of the change in the percentage of surface moisture and have a tendency to fluctuate easily, but at W/Cs of 45% and 40%, the variation was identified as being more restrained than the variation for SCC.
Phase 3. Table 6 shows the results of the measurement of the fresh concrete properties. For both Series 1 and Series 2, the slump flow retention is favorable for SDC. The time to a 500 mm flow is approximately 3 seconds, and the time to the end of the flow is approximately 25 seconds from immediately after mixing to 60 minutes after mixing. Low viscosity is obtained, as in the laboratory test, and segregation is not visually apparent.
The conditions when concrete is placed into a wall modeling form are shown in Figure 22. In the case of OC, before vibration the concrete in the bottom of the placement location was still until 10 seconds had passed and then after that the entire form was filled evenly with the
400
450
500
550
600
650
700
-1.0 -0.5 0 +0.5 +1.0
Slu
mp
flow
(m
m)
W/C=40%W/C=45%W/C=50%SCC
Setting error of percentage of surface moisture of fine aggregate (%)
0.0
5.0
10.0
15.0
20.0
25.0
30.0
-1.0 -0.5 0 +0.5 +1.0
Flo
w-t
hrou
gh ti
me
ofV
75-f
unne
l (s)
Setting error of percentage of surface moisture of fine aggregate (%)
W/C=40%W/C=45%W/C=50%SCC
100
150
200
250
300
350
400
-1.0 -0.5 0 +0.5 +1.0
Fill
hei
ght(
mm
)
Setting error of percentage of surface moisture of fine aggregate (%)
Box-shaped
W/C=40% W/C=45%W/C=50% SCC
100
150
200
250
300
350
400
-1.0 -0.5 0 +0.5 +1.0
Fill
hei
ght(
mm
)
Setting error of percentage of surface moisture of fine aggregate (%)
U-shaped
W/C=40%W/C=45%W/C=50%SCC
Figure 18. Relationship between setting error of percentage of surface moisture of fine aggregate and slump flow
Figure 19. Relationship between setting error of percentage of surface moisture of fine aggregate and flow-through time of V75-funnel
Figure 20. Relationship between setting error of percentage of surface moisture of fine aggregate and fill height using Box-shaped container
Figure 21. Relationship between setting error of percentage of surface moisture of fine aggregate and fill height using U-shaped container

concrete by vibration from the internal vibrator. On the other hand, SDC exhibited high self-compacting performance without vibration.
The compressive strength distribution for the core test pieces taken from the pillar is shown in Figure 23. The coarse aggregate distribution is shown in Figure 24 and in Figure 25. The compressive strength and distribution of coarse aggregate are the same for OC and SDC at all positions. Issues of coarse aggregate sedimentation and uneven distribution due to low viscosity were not identified. The conditions when concrete is placed into a slab modeling
15 sec.
20 sec.
30 sec.
10 sec.【SDC】
Placing
Placing
15 sec. (Vibration)
20 sec. (Vibration)
30 sec. (Vibration)
Internal vibrator
【OC】 10 sec. (No vibration)
Figure 24. Distribution of coarse aggregate in drilled core
SDC
OC
0 15 30 45 60 75
0.2
0.6
1.0
1.4
1.8
Compressive strength (N/mm2)
Pos
ition
from
the
uppe
r le
vel o
f pill
ar (
m) OC
SDC
Figure 23. Distribution of compressive strength of pillar
SDC
OC
Figure 22. Filling situation in wall modeling form
10 sec. (No vibration) 20 sec. (Vibration)
10 sec. (No vibration) 20 sec. (No vibration)
Table 6. Test result of fresh concrete
SeriesKind of
concrete
Elapsedtime
(min.)
Testinglocation
Slump(cm)
Slump flow(mm)
Time to500mm flow
(s)
Time to theend of the flow
(s)
Air content(%)
Concretetemperature
(°C)
0 Plant 22.5 - - - 4.2 18.0
60 Test site 21.0 - - - 4.6 18.0
0 Plant - 640 2.5 24.0 4.5 18.0
60 Test site - 610 3.0 24.7 4.8 18.0
0 Plant 21.5 - - - 4.5 12.0
60 Test site 22.0 - - - 4.8 13.5
0 Plant - 665 3.5 24.3 4.2 13.0
60 Test site - 680 3.7 25.7 4.5 13.5
1
OC
SDC
OC
SDC
2
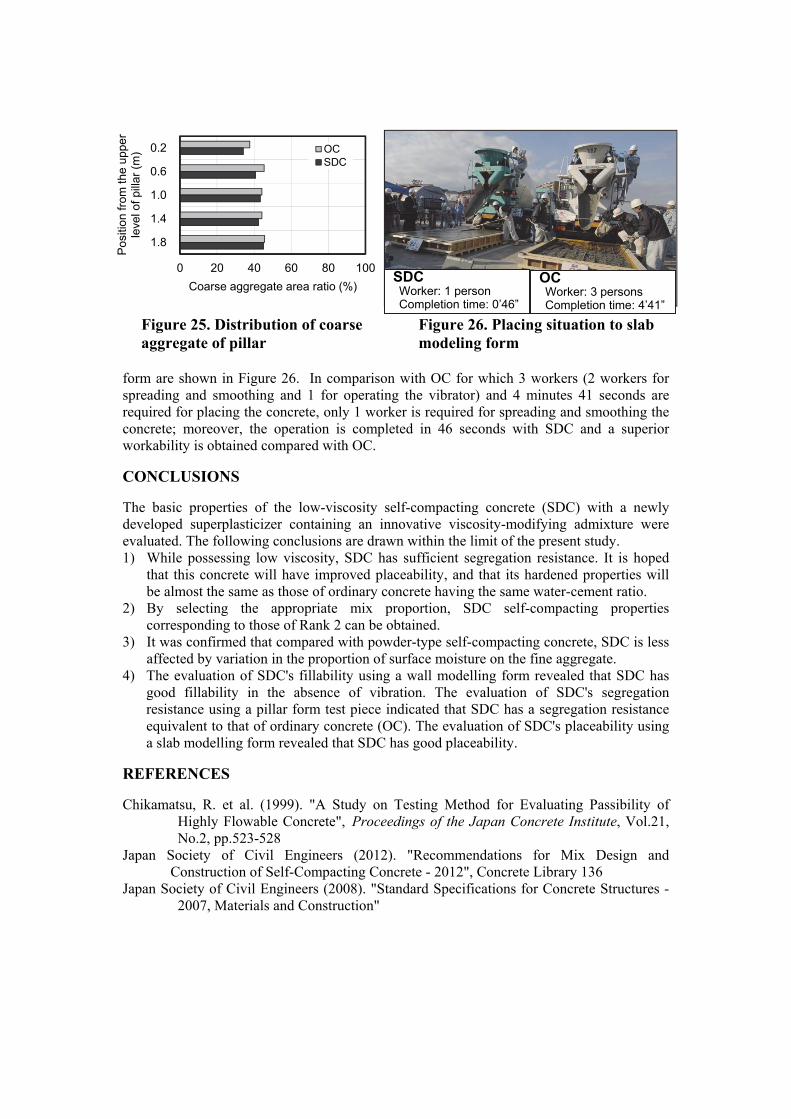
form are shown in Figure 26. In comparison with OC for which 3 workers (2 workers for spreading and smoothing and 1 for operating the vibrator) and 4 minutes 41 seconds are required for placing the concrete, only 1 worker is required for spreading and smoothing the concrete; moreover, the operation is completed in 46 seconds with SDC and a superior workability is obtained compared with OC.
CONCLUSIONS
The basic properties of the low-viscosity self-compacting concrete (SDC) with a newly developed superplasticizer containing an innovative viscosity-modifying admixture were evaluated. The following conclusions are drawn within the limit of the present study. 1) While possessing low viscosity, SDC has sufficient segregation resistance. It is hoped
that this concrete will have improved placeability, and that its hardened properties will be almost the same as those of ordinary concrete having the same water-cement ratio.
2) By selecting the appropriate mix proportion, SDC self-compacting properties corresponding to those of Rank 2 can be obtained.
3) It was confirmed that compared with powder-type self-compacting concrete, SDC is less affected by variation in the proportion of surface moisture on the fine aggregate.
4) The evaluation of SDC's fillability using a wall modelling form revealed that SDC has good fillability in the absence of vibration. The evaluation of SDC's segregation resistance using a pillar form test piece indicated that SDC has a segregation resistance equivalent to that of ordinary concrete (OC). The evaluation of SDC's placeability using a slab modelling form revealed that SDC has good placeability.
REFERENCES
Chikamatsu, R. et al. (1999). "A Study on Testing Method for Evaluating Passibility of Highly Flowable Concrete", Proceedings of the Japan Concrete Institute, Vol.21, No.2, pp.523-528
Japan Society of Civil Engineers (2012). "Recommendations for Mix Design and Construction of Self-Compacting Concrete - 2012", Concrete Library 136
Japan Society of Civil Engineers (2008). "Standard Specifications for Concrete Structures -2007, Materials and Construction"
Figure 26. Placing situation to slab modeling form
SDCWorker: 1 person Completion time: 0’46”
OC Worker: 3 persons Completion time: 4’41”
0 20 40 60 80 100
0.2
0.6
1.0
1.4
1.8
Coarse aggregate area ratio (%)
Pos
ition
from
the
uppe
r le
vel o
f pill
ar (
m) OC
SDC
Figure 25. Distribution of coarse aggregate of pillar