fund fact sheet - january 2018 - sbimf.com 2018.pdf · at sbi mutual fund, our endeavour is to...
TRANSCRIPT

January 8

Product range (Minimum RecommendedInvestment Period (MRIP)
1 day
Liquid
3months 5 years4 years3 years2 years1 year
Arbitrage Hybrid Funds Diversified Funds
UltraShort Debt
ShortTerm Debt
MediumTerm Debt
Large CapMid &
Small Cap
LongTerm Debt
IndexFunds
TaxSavings
“Investor should consult their financial advisors”.

Index
From the Managing Director’s Desk
Market Overview
From the CMO’s Desk
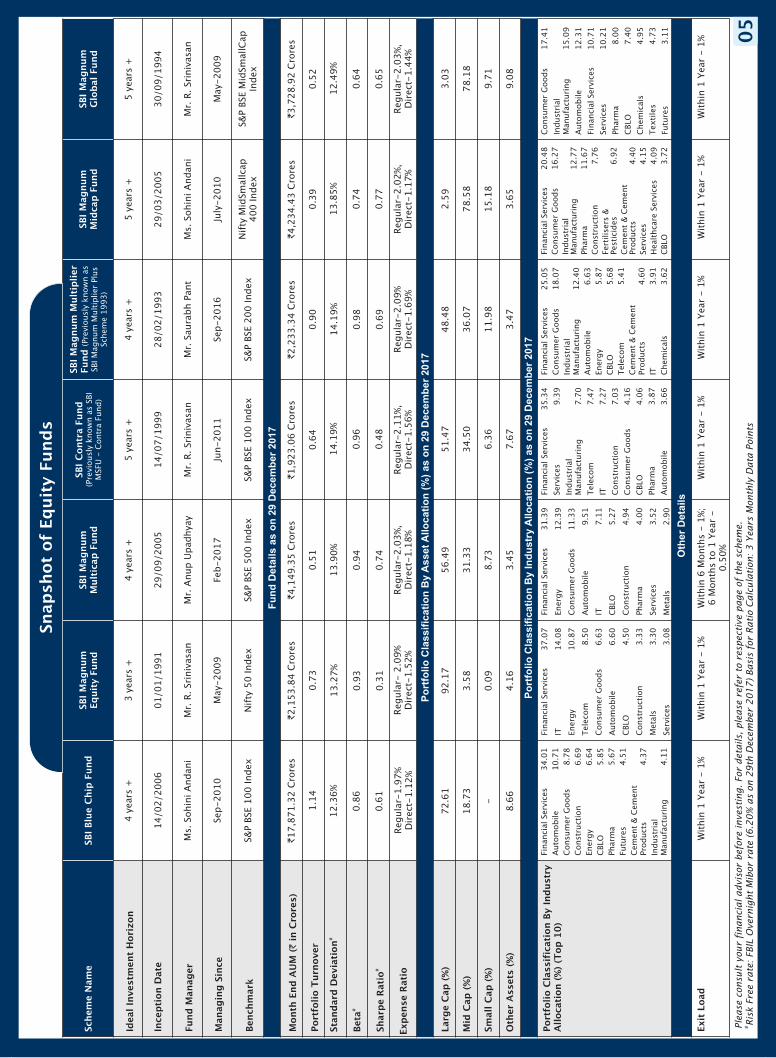
Snapshot of Equity Funds
Equity
LargeCap
Diversified Cap
Midcap & Small Cap
TaxSaving
Thematic
Arbitrage
Index Fund
SBI Blue Chip Fund
SBI Magnum Equity Fund
SBI Magnum Multicap Fund
SBI Contra Fund
SBI Magnum Multiplier Fund
SBI Magnum MidCap Fund
SBI Magnum Global Fund
SBI Small & Midcap Fund
SBI Magnum Taxgain Scheme
SBI Pharma Fund
SBI Banking And Financial Services Fund
SBI PSU Fund
SBI Magnum Comma Fund
SBI Infrastructure Fund
SBI FMCG Fund
SBI IT Fund
SBI Gold Fund
SBI Arbitrage Opportunities Fund
SBI Nifty Index Fund
SBI Emerging Businesses Fund
1
2
4
5
8
9
10
11
12
14
15
16
17
18
19
20
21
22
23
24
25
26
27
13

Index
Snapshot of Hybrid Funds
How to read the Factsheet
Hybrid Fund
Total Expense Ratios
Disclaimer
SBI Funds Management Pvt Ltd Branches
SBI Magnum Balanced Fund
SBI Dynamic Asset Allocation Fund
SBI Magnum Monthly Income Plan
SBI Magnum Monthly Income Plan – Floater
SBI Magnum Children's Benefit Plan
SBI Equity Savings Fund
SBI Magnum Gilt Fund – Long Term Plan
SBI Magnum Income Fund
SBI Dynamic Bond Fund
SBI Corporate Bond Fund
SBI Regular Savings Fund
SBI Short Term Debt Fund
SBI Magnum Gilt Fund – Short Term Plan
SBI Ultra Short Term Debt Fund
SBI Savings Fund
SBI Treasury Advantage Fund
SBI Premier Liquid Fund
SBI Magnum InstaCash Fund
SBI Magnum InstaCash Fund – Liquid Floater
28
29
30
31
32
33
34
63
35
37
38
39
40
41
42
43
44
45
46
47
48
49
50
55
57
58
61
62
Snapshot of Debt Funds
Comparative Performance for all Schemes
Systematic Investment Plan (SIP)
DEBT
Long Term
Short Term
Ultrashort
Liquid
Medium Term
Dividend History Of Debt & Hybrid Funds

From the Managing Director’s Desk
Dear Investors,
Managing Director & CEO
Markets ended the calendar year touching an all-time high. S&P BSE Sensex was up 2.7%
and Nifty 50 delivered 3% returns in the last month. Market saw a gradual upward
movement in the month of December with intermittent volatility as sentiments were
politically driven on the backdrop of state elections. Mutual Fund flows however witnessed
a different trend with net outflows of 1.64 lakh crore in the last month of the calendar
year 2017.
The end of the calendar year marks the beginning of the last quarter of the financial year.
One of the key things to look at in this quarter would be tax planning. Tax planning is the
most effective way to attain maximum benefits of the Income Tax laws. One can avail tax
deduction under various sections of the Income Tax Act such as 80C, 80D and 80CCD
among others. It is advisable to start your tax planning at the start of the financial year,
however it’s still not late if you haven’t.
One of the effective ways of tax savings is through investment in mutual funds. Mutual
Funds offer Equity Linked Savings Scheme (ELSS) which qualify for deduction under
Section 80C as per the Income Tax Act where an individual can avail tax benefits on
investments up to 1.5 lakh. Along with tax benefit, investing through ELSS offers an
opportunity to participate in the equity market growth. ELSS have a lock in period of 3
years post which the capital gains earned on the investments are exempt from tax.
Before selecting an Equity Linked Savings Scheme you should understand a fund’s
investment approach and fund manager’s investment style. Mutual funds offer both open
ended and closed ended ELSS schemes. You can invest lumpsum or opt for an SIP in ELSS
for disciplined investing. Now, investors can invest in no time with digital platforms such
as website and mobile.
At SBI Mutual Fund, our endeavour is to cater to the evolving customer base via various
digital platforms. Another step forward towards this endeavour is the launch of chat bot
“YUVA” – Your Virtual Assistant on SBI Mutual Fund website. The chat bot is equipped to
help investors in generating account statement, locating branches, Aadhar linking,
generating capital gain/loss statement and execute online transactions among other
investment related assistance.
We are proud that you have placed your trust in SBI Mutual Fund and assure you that we will
endeavor to provide every support for your current and future needs. You may get in touch
with your financial advisor or visit our website for information on our offerings.
Warm Regards,
Anuradha Rao
`
`
Anuradha RaoMD & CEO
01

Market Overview
Navneet MunotED & CIO
2017 was the year of new highs or new lows.
Global growth finally shaped up as we head into the tenth anniversary of global financial crisis. In
2017, global growth is likely to be the strongest since 2011 (IMF projects 3.6%) and is expected to
edge up further in 2018. Unemployment rate fell to new lows (in US, Eurozone, China, Japan and
UK) but failed to spiral wage growth momentum. Thus, inflation across most economies fell short
of the set targets. That said, as the signs of financial market exuberance became more evident and
central banks fathomed the inefficacy of loose monetary policy to spur any further growth, some
of them- the likes of Korea, Canada, and England- joined the US in raising rates. ECB announced it
tapering program. The US succeeded in passing its tax reform. Re-iterating our thoughts, this can
potentially initiate similar actions from across the world and support the growth momentum.
Despite the rising Fed rates and improving growth in US, DXY (US Dollar Index) headed south
through the year as Eurozone, Japan and China depicted positive surprise on macro front. The
index touched a 3-year low of 91 in September following the increased geopolitical tension with
North Korea; and have been broadly gyrating around 91-94 levels there since.
2017 proved good for equities with MSCI-world index delivering 20% while volatility levels (VIX
Index) falling to historic lows. Non-surprising election outcomes in Europe, improving growth
with low inflation helped reduce equity market volatility.
In line with the EM equities (up 30%), Indian equity markets, too, delivered 29% returns in local
currency terms and 37% in US$ terms. Performance down the capitalization curve was stronger
with mid-cap delivering 48 % and small-cap growing by 60%. Most key sectors generated positive
returns, with growth being strongest for the Real-estate and metals. Strong domestic flows were a
big support to the market. Equity related schemes garnered over Rs. 2 trillion (twice the amount
garnered in 2016, and four times of total FII equity investment).
Demonetization, RERA and GST have disrupted the traditional modus operandi of Indian
businesses. Hence, while the financial markets (particularly equity and currency) participated in
the global rally, the Indian growth could not keep pace with strength in the global growth. In line
with the weak growth, earnings belied market expectations, yet again.
Rupee was extremely stable in comparison to other EM currencies and appreciated by 6.3%.
Current account deficit was fully funded by just the FDI flows. Inflation touched the historic lows
(1.5% in June 2017) and fiscal deficit saw gradual consolidation.
While the EM equities and currencies rallied, EM bonds markets came under pressure. India 10-
year G-sec yields, too, treaded higher to close the year at 7.33% (up 81bps y-o-y). Rising fiscal
risk, bottoming out of inflation, rising commodity prices (particularly crude), the start of gradual
monetary tightening and consequently rising yields globally indicated the end of rate-cutting
cycle by RBI.
For the first time in last six years, the central government will borrow more than budgeted,
indicating a likely miss in fiscal deficit target (likely by 30bps). Outlook for government finances in
FY19 is also not significantly better. While the GST related revenue disruptions should peter out,
the government will face the pressure on expenditure. The onus of supporting growth and
investment will also rest on the government as it heads into the last full year budget before the
2019 general election.
The global monetary easing cycle is over and the central banks are likely to either stay pat or
02

embark on a cautious rate hike cycle. ECB will most likely stop its net asset purchases when the
current program ends in 2H 2018. US dot-plots indicate three rate hikes in 2018. However, as the
policy rate moves higher and the
gap to longer-term rate closes, the ability to provide a more reliable forward guidance will diminish
leading to more volatility in financial markets.
Crude oil prices may remain elevated on OPEC member’s commitment to production cuts and
improving global growth. On the other hand, it is getting increasingly difficult to establish a
consensus on US Dollar. While the tax reform and consequent growth improvement in US lend
strength to Dollar, doubts are raised when growth elsewhere is taken in cognizance. Crude and US
Dollar Index will be the two global parameters to closely watch in 2018 as it can have significant
implications on Indian and global markets.
Domestically, fiscal and politics are key risks to watch. It is an election heavy year with eight state
elections, which would also set the tones for 2019 general elections. Consequently, Union budget is
likely to be rural focused and hence the related sectors should benefit. It will be important to watch
tax collection buoyancy as it will have its bearing on government’s ability to spend particularly on
capex.
Disruptions pertaining to reforms measures will phase out as we progress through 2018 and lead to
some growth recovery on the back of revival in consumer sentiment and pick-up in business
manufacturing activity. Some green-shoots of increased capacity additions can be seen in the
cement, steel and Oil & Gas space, but a broad based strength in private investment in lacking. The
latest Q3 FY18 data on new project announcement (released by CMIE) has fallen to 768 billion, the
lowest level since 2004. We would be keenly watching if India is finally able to participate in global
growth recovery. Some of the large export sectors such as textiles, Gems & jewelries,
pharmaceuticals and IT services haven’t done as well due to industry specific challenges. From a
broader perspective, India hasn’t invested enough in innovations and R&D which requires
considerable attention by the policy makers and industry.
Hardening of yields may have an impact on domestic flows and global liquidity tightening could
challenge the FII investment. To that extent, earnings trajectory will be closely watched in 2018. In
the latest Q2 FY18 results, the downgrades in earnings were negligible in most sectors and there is
an increased hope of revival in earnings cycle in 2018. The revival in earnings is absolutely critical for
such rich valuations to sustain. Last few years have favored growth over value stocks. However,
recently we have seen interest emerging in contrarian themes such as corporate lenders, telecom
and construction. After the stellar performance in 2018, particularly in mid and small caps, it is very
important to keep an eye on valuations. We remain focused on bottom up stock picking.
While the growth may recover, the rising crude price challenges the stable macro of Indian economy.
The downward trend in CPI inflation has also likely ended thus leading the RBI to maintain status-quo
on rates.
As we head in 2018, one should also watch out for trend reversal on rates and bank credit growth
(both to rise). We are optimistic on the NPA resolution process and in line with that, expect bank
credit growth to recover in FY19. Against this back-drop, deposit mobilization and liquidity will be
the key. Banks are sitting on SLR holdings of ~28% of NDTL against the mandated norm of 19.5%.
Drawdown of excess SLR holdings may adversely affect the banks’ appetite of government bonds.
Though, purely from valuations perspective G-sec yields are turning attractive, one needs to watch
the impact of credit recovery on G-sec demand and shaping up of crude trajectory.
`
Navneet Munot, ED & CIO – SBI Funds Management Private Limited
(Mutual funds' investments are subject to market risks, read all scheme related documents
carefully.)
03
Dear Friends,
Executive Director & CMO (Domestic Business)
I wish you and your family a Happy, Healthy and Prosperous New Year. May the year 2018 bring new
joys and you look afresh at what can be done to make this year even better.
For the mutual fund industry and the equity markets, 2017 was a landmark year with impressive
growth shown all around. While the market indices, S&P BSE Sensex and Nifty reached new peaks
ending the year up, 28 percent and 29 percent respectively, the average assets under management
of the mutual fund industry ended at over 22 lakh crore. This is an addition of over 5.4 lakh crore
during the year in the AAUM which has now doubled in a short span of about three and a half years.
The total number of folios now stand at 6.65 crores with the equity share of folios (Equity, ELSS and
Balanced schemes) where retail investors invest are now at 5.46 crores or 80% of the total. On an
average, over 9 lakh SIP folios were registered in 2017 with inflows of over 5,800 crores every
month. Equity-based funds (Equity, Balanced and ELSS) received net-inflows of over 2 lakh crore
last year as compared to 73,601 crore in 2016.
I believe the growth we saw last year will continue and for multiple reasons. Retail investors continue
to invest in equity funds driven by low interest rates in traditional asset classes, the convenience and
transparency offered by mutual funds and the overall low penetration of mutual funds as an
investment option. SIPs are the right way to invest for the long-term into equity funds and we
continue to get consistent inflows every month which enables sustained growth for the industry. The
work done by the industry towards investor awareness is paying dividends as we are also seeing
smaller towns invest in mutual funds at a sustained pace.
For us at SBI Mutual Fund, 2018 is going to be continued effort into increasing our awareness
initiatives; and creating investment solutions for investors looking to invest for their financial goals
in life. The use of technology today to reach, build scale, add convenience and reduce costs is a no-
brainer today as people want investing to be as simple as purchasing products online. While we do
this, other stakeholders like financial advisers and distribution partners remain equally important
for those looking to know more before they invest. We as an industry are at a tipping point of our
growth and the right barometer for our success should be increasing interest from new investors
and this is an opportunity we must not lose. And one which does not depend on market highs but
achieving life’s highs when achieving their goals through mutual funds.
As always, we value your investments and look forward to your continued patronage.
Warm Regards,
D.P.Singh
` `
`
`
`
D.P. SinghED & CMO (Domestic Business)
04
From the CMO’s Desk
Po
rtfo
lio
Cla
ssif
icati
on
By In
du
str
yA
llo
cati
on
(%
) as o
n 2
9 D
ecem
ber
2017
Port
folio C
lassif
icati
on B
y I
nd
ustr
yA
llocati
on (
%)
(Top
10
)
Oth
er
De
tail
s
Exit
Load
Wit
hin
1 Y
ear
- 1
%W
ithin
1 Y
ear
- 1
%W
ithin
6 M
onth
s -
1%
;6
Month
s t
o 1
Year
-0
.50
%
Wit
hin
1 Y
ear
- 1
%W
ithin
1 Y
ear
- 1
%W
ithin
1 Y
ear
- 1
%W
ithin
1 Y
ear
- 1
%
Fin
ancia
l Serv
ices
34
.01
Auto
mobile
10
.71
Consum
er
Goods
8.7
8
Constr
ucti
on
6.6
9
Energ
y6
.64
CBLO
5.8
5
Pharm
a5
.67
Futu
res
4.5
1
Cem
ent
& C
em
ent
Pro
ducts
4.3
7
Industr
ial
Manufa
ctu
ring
4.1
1
Fin
ancia
l Serv
ices
37.0
7
IT14.0
8
Energ
y10.8
7
Tele
com
8.5
0
Consum
er
Goods
6.6
3
Auto
mobile
6.6
0
CBLO
4.5
0
Constr
ucti
on
3.3
3
Meta
ls3.3
0
Serv
ices
3.0
8
Fin
ancia
l Serv
ices
31.3
9
Energ
y12.3
9
Consum
er
Goods
11.3
3
Auto
mobile
9.5
1
IT7.1
1
CBLO
5.2
7
Constr
ucti
on
4.9
4
Pharm
a4.0
0
Serv
ices
3.5
2
Meta
ls2.9
0
Fin
ancia
l Serv
ices
35.3
4
Serv
ices
9.3
9
Industr
ial
Manufa
ctu
ring
7.7
0
Tele
com
7.4
7
IT7.2
7
Constr
ucti
on
7.0
3
Consum
er
Goods
4.1
6
CBLO
4.0
6
Pharm
a3.8
7
Auto
mobile
3.6
6
Fin
ancia
l Serv
ices
25.0
5
Consum
er
Goods
18.0
7
Industr
ial
Manufa
ctu
ring
12.4
0
Auto
mobile
6.6
3
Energ
y5.8
7
CBLO
5.6
8
Tele
com
5.4
1
Cem
ent
& C
em
ent
Pro
ducts
4.6
0
IT3.9
1
Chem
icals
3.6
2
Fin
ancia
l Serv
ices
20.4
8
Consum
er
Goods
16.2
7
Industr
ial
Manufa
ctu
ring
12.7
7
Pharm
a11.6
7
Constr
ucti
on
7.7
6
Fert
ilis
ers
&Pesti
cid
es
6.9
2
Cem
ent
& C
em
ent
Pro
ducts
4.4
0
Serv
ices
4.1
5
Healt
hcare
Serv
ices
4.0
9
CBLO
3.7
2
Consum
er
Goods
17.4
1
Industr
ial
Manufa
ctu
ring
15.0
9
Auto
mobile
12.3
1
Fin
ancia
l Serv
ices
10.7
1
Serv
ices
10.2
1
Pharm
a8.0
0
CBLO
7.4
0
Chem
icals
4.9
5
Texti
les
4.7
3
Futu
res
3.1
1
Fu
nd
Deta
ils a
s o
n 2
9 D
ecem
ber
2017
Month
End
AU
M (
in C
rore
s)
``17,8
71.3
2 C
rore
s`2
,15
3.8
4 C
rore
s`4
,14
9.3
5 C
rore
s`1
,92
3.0
6 C
rore
s`2
,23
3.3
4 C
rore
s`4
,23
4.4
3 C
rore
s`3
,72
8.9
2 C
rore
s
Port
folio T
urn
over
1.1
40
.73
0.5
10
.64
0.9
00
.39
0.5
2
Exp
ense R
ati
oRegula
r-1.9
7%
Dir
ect-
1.1
2%
Regula
r- 2
.09
%D
irect-
1.5
2%
Regula
r-2
.03
%,
Dir
ect-
1.1
8%
Regula
r-2
.11
%,
Dir
ect-
1.5
6%
Regula
r-2
.09
%D
irect-
1.6
9%
Regula
r-2
.02
%,
Dir
ect-
1.1
7%
Regula
r-2
.03
%,
Dir
ect-
1.4
4%
Sta
nd
ard
Devia
tion
Beta
#
#
#Sharp
e R
ati
o
12.3
6%
0.8
6
0.6
1
13
.27
%
0.9
3
0.3
1
13
.90
%
0.9
4
0.7
4
14
.19
%
0.9
6
0.4
8
14
.19
%
0.9
8
0.6
9
13
.85
%
0.7
4
0.7
7
12
.49
%
0.6
4
0.6
5
Schem
e N
am
eSBI
Blu
e C
hip
Fund
SBI
Magnum
Eq
uit
y F
und
SBI
Magnum
Mult
icap
Fund
SBI
Contr
a F
und
(Pre
vio
usly
know
n a
s S
BI
MSFU
- C
ontr
aFund)
SBI
Magnum
Mult
iplier
Fund
(Pre
vio
usly
know
n a
sSBI M
agnum
Mult
iplier
Plu
sSchem
e 1
993)
SBI
Magnum
Mid
cap
Fund
SBI
Magnum
Glo
bal Fund
Ideal In
vestm
ent
Hori
zon
4years
+3
years
+4
years
+5
years
+4
years
+5
years
+5
years
+
Incep
tion D
ate
14/02/2006
01
/0
1/1
99
12
9/0
9/2
00
51
4/0
7/1
99
92
8/0
2/1
99
32
9/0
3/2
00
53
0/0
9/1
99
4
Fund
Manag
er
Ms.
Sohin
i A
ndani
Mr.
R.
Sri
niv
asan
Mr.
Anup U
padhyay
Mr.
R.
Sri
niv
asan
Mr.
Saura
bh P
ant
Ms. Sohin
i A
ndani
Mr.
R. Sri
niv
asan
Managin
g S
ince
Sep-2010
May-2
00
9Feb-2
01
7Ju
n-2
01
1Sep-2
01
6Ju
ly-2
01
0M
ay-2
00
9
Benchm
ark
S&
P B
SE 1
00 Index
Nif
ty 5
0 Index
S&
P B
SE 5
00
Index
S&
P B
SE 1
00
Index
S&
P B
SE 2
00
Index
Nif
ty M
idSm
allcap
40
0 Index
S&
P B
SE M
idSm
allC
ap
Index
Po
rtfo
lio
Cla
ssif
icati
on
By
Asset
Allo
cati
on
(%
) as o
n 2
9 D
ecem
ber
2017
Larg
e C
ap
(%
)
Mid
Cap
(%
)
Sm
all C
ap
(%
)
Oth
er
Assets
(%
)
72.6
1
18.7
3
-
8.6
6
92
.17
3.5
8
0.0
9
4.1
6
56
.49
31
.33
8.7
3
3.4
5
51
.47
34
.50
6.3
6
7.6
7
48
.48
36
.07
11
.98
3.4
7
2.5
9
78
.58
15
.18
3.6
5
3.0
3
78
.18
9.7
1
9.0
8
Snap
shot
of
Eq
uit
y F
und
s
Ple
ase
consu
lt y
our
financia
l advis
or
befo
re invest
ing.
For
deta
ils,
ple
ase
refe
r to
resp
ecti
ve p
age o
f th
e s
chem
e.
#Ris
k F
ree r
ate
: FBIL
Overn
ight
Mib
or
rate
(6.2
0%
as
on 2
9th
Decem
ber
20
17
) Basi
s fo
r R
ati
o C
alc
ula
tion:
3 Y
ears
Month
ly D
ata
Poin
ts05

Po
rtfo
lio
Cla
ssif
icati
on
By In
du
str
yA
llo
cati
on
(%
) as o
n 2
9 D
ecem
ber
2017
Port
folio C
lassif
icati
on B
y I
nd
ustr
yA
llocati
on (
%)
(Top
10
)
Consum
er
Goods
24
.10
Fin
ancia
l Serv
ices
22
.38
Serv
ices
16
.32
Industr
ial
Manufa
ctu
ring
16
.12
Chem
icals
5.4
4
Pharm
a5
.06
CBLO
3.8
6
Constr
ucti
on
3.8
0
Auto
mobile
1.9
3
Cash A
nd O
ther
Receiv
able
s0
.97
Consum
er
Goods
26.2
4
Industr
ial
Manufa
ctu
ring
13.4
6
Serv
ices
12.2
5
Constr
ucti
on
10.7
8
Chem
icals
7.0
1
Fin
ancia
l Serv
ices
6.6
1
Texti
les
4.8
2
Paper
4.7
4
Pharm
a3.7
2
Auto
mobile
2.9
8
Fin
ancia
l Serv
ices
30.8
4
Energ
y11.5
4
Consum
er
Goods
8.6
8
Auto
mobile
7.2
2
Tele
com
7.1
5
Constr
ucti
on
6.2
8
Serv
ices
5.5
2
Industr
ial
Manufa
ctu
ring
5.3
1
IT4.3
8
Cem
ent
& C
em
ent
Pro
ducts
3.8
9
Pharm
a8
4.2
5
Healt
hcare
Serv
ices
12.1
3
CBLO
2.4
6
Cash A
nd O
ther
Receiv
able
s1.1
6
Fin
ancia
l Serv
ices
97.4
3
CBLO
3.0
9
Cash A
nd O
ther
Receiv
able
s-0.5
2
Energ
y38.2
6
Fin
ancia
l Serv
ices
22.7
7
Industr
ial
Manufa
ctu
ring
13.7
6
Constr
ucti
on
10.1
2
CBLO
5.7
2
Meta
ls4.9
5
Serv
ices
4.6
3
Cash A
nd O
ther
Receiv
able
s-0.2
2
Energ
y38.0
5
Meta
ls24.2
3
Cem
ent
& C
em
ent
Pro
ducts
10.0
2
Chem
icals
8.8
5
Consum
er
Goods
6.1
8
CBLO
4.4
7
Fert
ilis
ers
& P
esti
cid
es
3.7
4
Industr
ial
Manufa
ctu
ring
3.5
8
Texti
les
3.1
1
Cash A
nd O
ther
Receiv
able
s-2.2
2
Fu
nd
Deta
ils a
s o
n 2
9 D
ecem
ber
2017
Month
End
AU
M (
Rs. in
Cro
res)
`2,3
86.6
7 C
rore
s`9
43
.56
Cro
res
`6
,55
0.0
5 C
rore
s`1
,13
2.7
3 C
rore
s`4
93
.39
Cro
res
`2
34
.37
Cro
res
`3
73
.06
Cro
res
Port
folio T
urn
over
0.3
70
.75
0.7
30
.66
0.7
40
.73
0.5
9
Exp
ense R
ati
oRegula
r-2.0
8%
Dir
ect-
1.4
0%
Regula
r-2
.28
%D
irect-
1.3
9%
Regula
r-2
.00
%,
Dir
ect-
1.5
4%
Regula
r-2
.22
%,
Dir
ect-
1.2
1%
Regula
r-2
.46
%D
irect-
1.6
5%
Regula
r-2
.56
%,
Dir
ect-
2.1
2%
Regula
r-2
.52
%,
Dir
ect-
1.9
3%
Sta
nd
ard
Devia
tion
Beta
#
#
#Sharp
e R
ati
o
12.9
4%
0.7
6
0.7
1
16
.79
%
0.8
3
1.2
8
13
.80
%
0.9
6
0.4
4
16
.99
%
0.9
2
-0
.07
- - -
17
.32
%
0.8
5
0.1
7
15
.58
%
0.8
0
0.8
6
Schem
e N
am
e
SBI
Em
erg
ing
Busin
esses F
und
(Pre
vio
usly
know
n a
s S
BI
MSFU
- E
merg
ing
Busin
esses F
und)
SBI
Sm
all &
Mid
cap
Fund
SBI
Magnum
Taxgain
Schem
eSBI
Pharm
a F
und
SBI
Bankin
g &
Fin
ancia
l Serv
ices
Fund
SBI
PSU
Fund
SBI
Magnum
CO
MM
A F
und
Ideal In
vestm
ent
Hori
zon
5years
+5
years
+3
years
+T
acti
cal
Tacti
cal
Tacti
cal
Tacti
cal
Incep
tion D
ate
11/10/2004
09
/0
9/2
00
93
1/0
3/1
99
31
4/0
7/1
99
92
6/0
2/2
01
50
7/0
7/2
01
00
8/0
8/2
00
5
Fund
Manag
er
Mr.
R.
Sri
niv
asan
Mr.
R.
Sri
niv
asan
Mr.
Din
esh
Bala
chandra
nM
r. T
anm
aya
Desai
Ms. Sohin
i A
ndani
Mr.
Ric
hard
D's
ouza
Mr.
Ric
hard
D's
ouza
Managin
g S
ince
May-2009
Nov
- 2
01
3Sep-2
01
6Ju
n-2
01
1Feb-2
01
5A
ug-2
01
4A
ug-2
01
4
Benchm
ark
S&
P B
SE 5
00 Index
S&
P B
SE S
mall C
ap Index
S&
P B
SE 1
00
Index
S&
P B
SE H
EA
LT
H C
AR
EIn
dex
Nif
ty F
inancia
l Serv
ices
S&
P B
SE P
SU
IN
DEX
Nif
ty C
om
modit
ies
Index
Po
rtfo
lio
Cla
ssif
icati
on
By
Asset
Allo
cati
on
(%
) as o
n 2
9 D
ecem
ber
2017
Larg
e C
ap
(%
)
Mid
Cap
(%
)
Sm
all C
ap
(%
)
Oth
er
Assets
(%
)
15.9
8
66.8
3
12.3
2
4.8
7
4.5
6
31
.75
59
.06
4.6
3
70
.13
22
.37
5.1
2
2.3
8
26
.47
56
.34
13
.44
3.7
5
68
.55
25
.84
3.1
1
2.5
0
60
.71
33
.89
-
5.4
0
55
.78
22
.06
20
.01
2.1
5
Oth
er
De
tail
s
Exit
Load
Wit
hin
1 Y
ear
- 1
%W
ithin
1 Y
ear
- 1
%N
ILW
ithin
15
Days -
0.5
0%
Wit
hin
1 Y
ear
- 1
%W
ithin
1 Y
ear
- 1
%W
ithin
1 Y
ear
- 1
%
Snap
shot
of
Eq
uit
y F
und
s
Ple
ase
consu
lt y
our
financia
l advis
or
befo
re invest
ing.
For
deta
ils,
ple
ase
refe
r to
resp
ecti
ve p
age o
f th
e s
chem
e.
#Ris
k F
ree r
ate
: FBIL
Overn
ight
Mib
or
rate
(6.2
0%
as
on 2
9th
Decem
ber
20
17
) Basi
s fo
r R
ati
o C
alc
ula
tion:
3 Y
ears
Month
ly D
ata
Poin
ts06

Po
rtfo
lio
Cla
ssif
icati
on
By In
du
str
yA
llo
cati
on
(%
)a
s o
n 2
9 D
ec
em
be
r 2
01
7
Port
folio C
lassif
icati
on B
y I
nd
ustr
yA
llocati
on (
%)
(Top
10)
Constr
ucti
on
40.6
2
Industr
ial
Manufa
ctu
ring
12.2
5
Tele
com
12.0
0
Energ
y10.5
9
Fin
ancia
l Serv
ices
6.8
2
Serv
ices
5.0
4
CBLO
3.2
1
Cash A
nd O
ther
Receiv
able
s2.6
8
Auto
mobile
2.5
6
Cem
ent
& C
em
ent
Pro
ducts
2.1
4
Consum
er
Goods
94.0
2
CBLO
3.8
5
Texti
les
2.5
3
Cash A
nd O
ther
Receiv
able
s-0.4
1
IT90.3
0
CBLO
5.8
2
Cash A
nd O
ther
Receiv
able
s2.4
0
Serv
ices
1.4
8
ETF
99.6
9
CBLO
0.2
7
Cash A
nd O
ther
Receiv
able
s0.0
4
Cash A
nd O
ther
Receiv
able
s67.6
1Fin
ancia
l Serv
ices
43.6
4M
arg
in F
ixed
Deposit
s12.7
2C
em
ent
& C
em
ent
Pro
ducts
5.8
9M
eta
ls5.5
3A
uto
mobile
5.3
1M
edia
And
Ente
rtain
ment
4.3
7Energ
y4.2
3Pharm
a3.7
9Tele
com
3.5
1
Fin
ancia
l Serv
ices
33.7
2
Energ
y14.5
3
IT10.7
1
Auto
mobile
10.2
3
Consum
er
Goods
8.8
6
Futu
res
4.6
2
CBLO
4.4
3
Meta
ls4.3
7
Pharm
a3.8
7
Constr
ucti
on
3.6
7
Fu
nd
Deta
ils
as
on
29
De
ce
mb
er
20
17
Month
End
AU
M (
Rs. in
Cro
res)
`676.7
0 C
rore
s`4
59
.00
Cro
res
`6
3.7
9 C
rore
s`3
89.8
3 C
rore
s`1
,26
7.9
9 C
rore
s`2
38
.95
Cro
res
Port
folio T
urn
over
0.7
70
.43
0.5
1-
11
.60
1.2
2
Exp
ense R
ati
oRegula
r-2
.39
%D
irect-
1.8
5%
Regula
r-2
.49
%D
irect-
1.7
3%
Regula
r-2
.70
%D
irect-
2.1
9%
Regula
r-0
.43
%,
Dir
ect-
0.0
2%
Regula
r-0
.80
%,
Dir
ect-
0.2
5%
Regula
r-0
.63
%,
Dir
ect-
0.2
7%
Sta
nd
ard
Devia
tion
Beta
#
#
#Sharp
e R
ati
o
15.5
4%
0.7
5
0.6
8
15
.19
%
0.9
5
0.7
7
14
.73
%
0.7
8
-0
.09
5
- - -
0.5
1%
1.1
3
-0
.09
- - -
Schem
e N
am
eSBI
Infr
astr
uctu
reFund
SBI
FM
CG
Fund
(Pre
vio
usly
know
n a
s S
BI
MSFU
- F
MC
G F
und)
SBI
IT F
und
(Pre
vio
usly
know
n a
s S
BI
MSFU
- IT F
und)
SBI
Gold
Fund
SBI
Arb
itra
ge
Op
port
unit
ies F
und
SBI
Nif
ty I
nd
ex F
und
(Pre
vio
usly
know
n a
s S
BI M
agnum
Index F
und)
Ideal In
vestm
ent
Hori
zon
Tacti
cal
Tacti
cal
Tacti
cal
Tacti
cal
3m
onth
s3
years
+
Incep
tion D
ate
06/07/2
00
71
4/0
7/1
99
91
4/0
7/1
99
91
2/0
9/2
01
10
3/1
1/2
00
61
7/0
1/2
00
2
Fund
Manag
er
Mr.
Ric
hard
D's
ouza
Mr.
Saura
bh P
ant
Mr.
Anup U
padhyay
Mr.
Ravip
rakash S
harm
aM
r. N
eera
j K
um
ar
Mr.
Ravip
rakash
Sharm
a
Manag
ing
Sin
ce
Aug-20
14
Jun-2
01
1Ju
n-2
01
1Sep-2
01
1O
ct-
20
12
Feb-2
01
1
Benchm
ark
Nif
ty Infr
astr
uctu
reIn
dex
S&
P B
SE F
ast
Movin
gC
onsum
er
Goods Index
S&
P B
SE -
Info
rmati
on
Technolo
gy Index
Pri
ce o
f Physic
al G
old
CR
ISIL
Liq
uid
Fund
Index
Nif
ty 5
0 Index
Po
rtfo
lio
Cla
ss
ific
ati
on
By
As
se
tA
llo
ca
tio
n (
%)
as
on
29
De
ce
mb
er
20
17
Larg
e C
ap
(In
%)
Mid
Cap
(In
%)
Sm
all C
ap
(In
%)
Oth
er
Assets
(In
%)
39.8
6
31.8
2
22.6
0
5.7
2
22
.35
42
.89
31
.19
3.5
7
54
.46
34
.77
4.3
7
6.4
0
- - -
10
0.0
0
-0
.14
-0
.25
-0
.01
10
0.4
0
95
.58
- -
4.4
2
Oth
er
De
tail
s
Exit
Load
Wit
hin
1 Y
ear
- 1
%W
ithin
15
Days -
0.5
0%
Wit
hin
15
Days -
0.5
0%
Wit
hin
1 Y
ear
- 1
%W
ithin
1 M
onth
- 0
.50
%For
exit
wit
hin
15
days f
rom
the d
ate
of
allotm
ent
- 0
.20
%For
exit
on o
r aft
er
15
days
from
the d
ate
of
allotm
ent
-N
il (
w.e
.f. N
ovem
ber
30
, 2
01
7)
Snap
shot
of
Eq
uit
y F
und
s
Ple
ase
consu
lt y
our
financia
l advis
or
befo
re invest
ing.
For
deta
ils,
ple
ase
refe
r to
resp
ecti
ve p
age o
f th
e s
chem
e.
#R
isk F
ree r
ate
: FBIL
Overn
ight
Mib
or
rate
(6.2
0%
as
on 2
9th
Decem
ber
20
17
) Basi
s fo
r R
ati
o C
alc
ula
tion:
3 Y
ears
Month
ly D
ata
Poin
ts07

08
EQUITY-LARGE CAP
Option NAV ( )`
Reg-Plan-Dividend 22.0996
Reg-Plan-Growth 38.8337
Dir-Plan-Dividend 26.3474
Dir-Plan-Growth 40.5878
NET ASSET VALUE
Record Date Dividend NAV ( )`(in /Unit)`
23-Sep-16 (Reg Plan) 1.00 18.5964
23-Sep-16 (Dir Plan) 1.20 21.8569
17-Jul-15 (Reg Plan) 2.50 17.6880
17-Jul-15 (Dir Plan) 2.90 20.5395
21- Mar-14 (Reg Plan) 1.80 12.7618
LAST DIVIDENDS
Investors understand that their principal
will be at Moderately High risk
�
�
Long term capital appreciation.
Investment in equity shares of companies whose market capitalization is at least equal to or morethan the least market capitalized stock of S&P BSE 100 index to provide long term capital growthopportunities.
SBI Blue Chip FundThis product is suitable for investors who are seeking^:
Face value: 10`
Investment Objective
Quantitative Data
To provide investors with opportunities
for long-term growth in capital through
an active management of investments in a
diversified basket of equity stocks of
companies whose market capitalization
is at least equal to or more than the least
market capitalized stock of S&P BSE 100
Index.
Fund Details
Standard Deviation :
Beta :
Sharpe Ratio :
Portfolio Turnover* :
#
#
#
12.36%
0.86
0.61
1.14#Source : CR IS IL Fund Ana lyser
*Portfolio Turnover = lower of total sale ortotal purchase for the last 12 monthsupon Avg. AUM of trailing twelve months.
Risk Free rate: FBIL Overnight Mibor rate(6.20% as on 29th December 2017) Basisfor Ratio Calculation: 3 Years MonthlyData Points
PORTFOLIO CLASSIFICATION BY
(%)ASSET ALLOCATION
Financial Services 34.01
Automobile 10.71
Consumer Goods 8.78
Construction 6.69
Energy 6.64
Pharma 5.67
Futures 4.51
Cement & Cement Products 4.37
Industrial Manufacturing 4.11
Fertilisers & Pesticides 3.66
IT 2.94
Metals 2.39
Services 1.69
Healthcare Services 1.46
Chemicals 0.55
Telecom 0.16
Others 1.66
•
•
•
•
•
•
•
•
•
•
•
•
•
•
Type of Scheme
Date of Allotment:
Report As On:
AAUM for the Month of December 2017
AUM as on December 29, 2017
Fund Manager: Ms. Sohini Andani
Managing Since:
Total Experience:
Benchmark:
Exit Load:
Entry Load:
Plans Available:
Options:
SIP
Minimum Investment
Additional Investment
An Open - Ended Growth Scheme
14/02/2006
29/12/2017
17,424.98 Crores
17,871.32 Crores
Sep-2010
Over 22 years
S&P BSE 100 Index
For exit within 1 year from the date of
allotment - 1 %; For exit after 1 year
from the date of allotment - Nil
N.A.
Regular, Direct
Growth, Dividend
Weekly - Minimum 1000 & in multiples
of 1 thereafter for a minimum of 6
instalments.
Monthly - Minimum 1000 & in
multiples of 1 thereafter for minimum
six months (or) minimum 500 & in
multiples of 1 thereafter for minimum
one year.
Quarterly - Minimum 1500 & in
multiples of 1 thereafter for minimum
one year.
5000 & in multiples of 1
1000 & in multiples of 1
`
`
`
`
`
`
`
`
`
`
` `
` `
PORTFOLIO CLASSIFICATION BY
INDUSTRY ALLOCATION (%)
PORTFOLIO
HDFC Bank Ltd. 7.93Larsen & Toubro Ltd. 4.33Mahindra & Mahindra Ltd. 3.10Nestle India Ltd. 3.02ITC Ltd. 2.64Hindustan Petroleum Corporation Ltd. 2.64Bharat Electronics Ltd. 2.57State Bank Of India 2.55Hindalco Industries Ltd. 2.39Indusind Bank Ltd. 2.39UPL Ltd. 2.37Hero Motocorp Ltd. 2.29Kotak Mahindra Bank Ltd. 2.28Cholamandalam Investment AndFinance Company Ltd. 2.18Maruti Suzuki India Ltd. 2.04Titan Company Ltd. 2.00ICICI Bank Ltd. 1.98Divi's Laboratories Ltd. 1.78InterGlobe Aviation Ltd. 1.69Voltas Ltd. 1.69Motherson Sumi Systems Ltd. 1.68HDFC Ltd. 1.59HCL Technologies Ltd. 1.56Mahindra & Mahindra Financial Services Ltd. 1.55Reliance Industries Ltd. 1.52Indian Oil Corporation Ltd. 1.40Infosys Ltd. 1.39Ultratech Cement Ltd. 1.32Shriram Transport Finance Company Ltd. 1.30PI Industries Ltd. 1.29The Ramco Cements Ltd. 1.28Grasim Industries Ltd. 1.26Sun Pharmaceutical Industries Ltd. 1.21Aurobindo Pharma Ltd. 1.12NTPC Ltd. 1.09Strides Shasun Ltd. 1.05
Stock Name (%) Of Total AUM Stock Name (%) Of Total AUM
The Federal Bank Ltd. 1.00Bajaj Finserv Ltd. 0.95SBI Life Insurance Company Ltd. 0.89Tata Motors Ltd. 0.83ICICI Lombard General Insurance Company Ltd. 0.79Britannia Industries Ltd. 0.77Eicher Motors Ltd. 0.76LIC Housing Finance Ltd. 0.71Apollo Hospitals Enterprise Ltd. 0.71Sadbhav Engineering Ltd. 0.66Schaeffler India Ltd. 0.65ICICI Prudential Life Insurance Company Ltd. 0.64HDFC Standard Life Insurance Company Ltd. 0.62Housing And Urban Development Corporation Ltd. 0.57Shriram City Union Finance Ltd. 0.56Max Financial Services Ltd. 0.55Pidilite Industries Ltd. 0.55Thermax Ltd. 0.54Torrent Pharmaceuticals Ltd. 0.51Shree Cements Ltd. 0.51Dr. Lal Path Labs Ltd. 0.44Procter & Gamble Hygiene And Health Care Ltd. 0.35SKF India Ltd. 0.35Narayana Hrudayalaya Ltd. 0.31Bharti Airtel Ltd. 0.16
HDFC Ltd. 0.52
NABARD 2.23Motilal Oswal Securities Ltd. 0.14Capital First Ltd. 0.07Clix Capital Services Pvt. Ltd. 0.01
Equity Shares Total 90.87
Warrants Total 0.52
Commercial Papers Total 2.45CBLO 5.85Index Futures Total 4.51Cash & Other Receivables -4.19Grand Total 100.00
Pursuant to payment of dividend, the NAV of Dividend Option ofscheme/plans would fall to the extent of payout and statutory levy, ifapplicable.
^Investors should consult their financial advisers if in doubt about whether the product is suitable for them.
Large Cap MidcapCash & Other Current Assets
72.61
18.73
8.66

09
EQUITY-LARGE CAP
Option NAV ( )`
Reg-Plan-Dividend 33.4492
Reg-Plan-Growth 95.7640
Dir-Plan-Dividend 39.7090
Dir-Plan-Growth 99.1661
NET ASSET VALUE
Record Date Dividend NAV ( )`(in /Unit)`
30-May-17 (Reg Plan) 2.00 30.8936
(Dir Plan) 2.50 36.502730-May-17
29-Apr-16 (Reg Plan) 4.50 27.4893
29-Apr-16 (Dir Plan) 5.00 32.3240
24-Apr-15 (Reg Plan) 6.00 31.7479
24-Apr-15 (Dir Plan) 7.00 36.7592
LAST DIVIDENDS
Investors understand that their principal
will be at Moderately High risk
�
�
Long term capital appreciation.
Investments in high growth companies along with the liquidity of an open-ended scheme throughinvestments primarily in equities.
SBI Magnum Equity FundThis product is suitable for investors who are seeking^:
Face value: 10`
Investment Objective
Quantitative Data
To provide the investor long-term capital
appreciation by investing in high growth
companies along with the liquidity of an
o p e n - e n d e d s c h e m e t h r o u g h
investments primarily in equities and the
balance in debt and money market
instruments.
Fund Details
Standard Deviation :
Beta :
Sharpe Ratio :
Portfolio Turnover* :
#
#
#
13.27%
0.93
0.31
0.73#Source : CR IS IL Fund Ana lyser
*Portfolio Turnover = lower of total sale ortotal purchase for the last 12 monthsupon Avg. AUM of trailing twelve months.
Risk Free rate: FBIL Overnight Mibor rate(6.20% as on 29th December 2017) Basisfor Ratio Calculation: 3 Years MonthlyData Points
PORTFOLIO CLASSIFICATION BY
(%)ASSET ALLOCATION
Financial Services 37.07
IT 14.08
Energy 10.87
Telecom 8.50
Consumer Goods 6.63
Automobile 6.60
Construction 3.33
Metals 3.30
Services 3.08
Pharma 2.23
Mutual Fund 0.09
Others 4.21
Pursuant to payment of dividend, the NAV of Dividend Option ofscheme/plans would fall to the extent of payout and statutory levy, ifapplicable.
•
•
•
•
•
•
•
•
•
•
•
•
•
•
Type of Scheme
Date of Allotment:
Report As On:
AAUM for the Month of December 2017
AUM as on December 29, 2017
Fund Manager: Mr. R. Srinivasan
Managing Since:
Total Experience:
Benchmark:
Exit Load:
Entry Load:
Plans Available:
Options:
SIP
Minimum Investment
Additional Investment
An Open - Ended Equity Scheme
01/01/1991
29/12/2017
2,133.63 Crores
2,153.84 Crores
May-2009
Over 24 years
Nifty 50 Index
For exit within 1 year from the date of
allotment - 1 %;
For exit after 1 year from the date of
allotment - Nil
N.A.
Regular, Direct
Growth, Dividend
Weekly - Minimum 1000 & in multiples
of 1 thereafter for a minimum of 6
instalments.
Monthly - Minimum 1000 & in
multiples of 1 thereafter for minimum
six months (or) minimum 500 & in
multiples of 1 thereafter for minimum
one year
Quarterly - Minimum 1500 & in
multiples of 1 thereafter for minimum
one year.
1000 & in multiples of 1
1000 & in multiples of 1
`
`
`
`
`
`
`
`
`
`
` `
` `
PORTFOLIO CLASSIFICATION BY
INDUSTRY ALLOCATION (%)
PORTFOLIO
HDFC Bank Ltd. 9.56
Reliance Industries Ltd. 7.27
ICICI Bank Ltd. 6.27
State Bank Of India 5.32
Infosys Ltd. 5.32
Bharti Airtel Ltd. 5.16
Kotak Mahindra Bank Ltd. 5.16
HCL Technologies Ltd. 3.72
Indian Oil Corporation Ltd. 3.61
Colgate Palmolive (India) Ltd. 3.57
Bharti Infratel Ltd. 3.34
Larsen & Toubro Ltd. 3.33
Hindustan Zinc Ltd. 3.30
HDFC Ltd. 3.18
InterGlobe Aviation Ltd. 3.08
ITC Ltd. 3.05
Bajaj Finance Ltd. 3.02
Stock Name (%) Of Total AUM Stock Name (%) Of Total AUM
Oracle Financial Services Software Ltd. 2.66
ICICI Lombard General InsuranceCompany Ltd. 2.52
Tata Consultancy Services Ltd. 2.38
Hero Motocorp Ltd. 2.28
Aurobindo Pharma Ltd. 2.23
Bajaj Auto Ltd. 2.17
Bosch Ltd. 2.15
Indiabulls Housing Finance Ltd. 2.05
SBI Magnum Instacash Fund - Direct Plan 0.09
Equity Shares Total 95.70
Mutual Fund Units Total 0.10
CBLO 4.50
Cash & Other Receivables -0.30
Grand Total 100.00
^Investors should consult their financial advisers if in doubt about whether the product is suitable for them.
Large Cap Midcap
Cash & Other Current Assets Smallcap
92.17
3.580.09 4.16

10
EQUITY-DIVERSIFIED CAP
Option NAV ( )`
Reg-Plan-Dividend 23.8257
Reg-Plan-Growth 48.7101
Dir-Plan-Dividend 27.6830
Dir-Plan-Growth 50.7210
NET ASSET VALUE
Record Date Dividend NAV ( )`(in /Unit)`
29-Dec-17 (Reg Plan) 2.50 23.8257
Dir
30-Dec-16 (Reg Plan) 1.90 19.2173
30-Dec-16 (Dir Plan) 2.20 22.0670
20-Nov-15 (Reg Plan) 2.90 19.2712
20-Nov-15 (Dir Plan) 3.20 21.8941
29-Dec-17 ( Plan) 2.90 27.6830
LAST DIVIDENDS
Investors understand that their principal
will be at Moderately High risk
�
�
Long term capital appreciation.
Investment in diversified basket of equity stocks spanning the entire market capitalizationspectrum to provide both long term growth opportunities and liquidity.
SBI Magnum Multicap FundThis product is suitable for investors who are seeking^:
Face value: 10`
Investment Objective
Quantitative Data
To provide investors with opportunitiesfor long-term growth in capital alongwith the liquidity of an open-endedscheme through an active managementof investments in a diversified basket ofequity stocks spanning the entire marketcapitalization spectrum and in debt andmoney market instruments.
Fund Details
Standard Deviation :
Beta :
Sharpe Ratio :
Portfolio Turnover* :
#
#
#
13.90%
0.94
0.74
0.51#Source : CR IS IL Fund Ana lyser
*Portfolio Turnover = lower of total sale ortotal purchase for the last 12 monthsupon Avg. AUM of trailing twelve months.
Risk Free rate: FBIL Overnight Mibor rate(6.20% as on 29th December 2017) Basisfor Ratio Calculation: 3 Years MonthlyData Points
PORTFOLIO CLASSIFICATION BY
(%)ASSET ALLOCATION
Financial Services 31.39Energy 12.39Consumer Goods 11.33Automobile 9.51IT 7.11Construction 4.94Pharma 4.00Services 3.52Metals 2.90Telecom 2.60Media And Entertainment 1.84Industrial Manufacturing 1.18Chemicals 0.96Healthcare Services 0.86Fertilisers & Pesticides 0.85Textiles 0.85Cement & Cement Products 0.49Others 3.29
Pursuant to payment of dividend, the NAV of Dividend Option ofscheme/plans would fall to the extent of payout and statutory levy, ifapplicable.
•
•
•
•
•
•
•
•
•
•
•
•
•
•
Type of Scheme
Date of Allotment:
Report As On:
AAUM for the Month of December 2017
AUM as on December 29, 2017
Fund Manager: Mr. Anup Upadhyay
Managing Since:
otal Experience:
Benchmark:
Exit Load:
Entry Load:
Plans Available:
Options;
SIP
Minimum Investment
Additional Investment
An Open - Ended Growth Scheme
29/09/2005
29/12/2017
3,947.17 Crores
4,149.35 Crores
Feb-2017
T Over 10 years
S&P BSE 500 Index
For exit within 6 months from the date of
allotment - 1 %;
For exit after 6 months but within one
year from the date of allotment – 0.50%
For exit after one year from the date of
allotment - Nil
N.A.
Regular, Direct
Growth, Dividend
Weekly - Minimum 1000 & in multiples
of 1 thereafter for a minimum of 6
instalments.
Monthly - Minimum 1000 & in multiples
of 1 thereafter for minimum six months
(or) minimum 500 & in multiples of 1
thereafter for minimum one year.
Quarterly - Minimum 1500 & in
multiples of 1 thereafter for minimum
one year.
1000 & in multiples of 1
1000 & in multiples of 1
`
`
`
`
`
`
` `
`
`
` `
` `
Large Cap Midcap
Cash & Other Current Assets Smallcap
PORTFOLIO CLASSIFICATION BY
INDUSTRY ALLOCATION (%)
PORTFOLIO
HDFC Bank Ltd. 6.91
HCL Technologies Ltd. 3.41
Indian Oil Corporation Ltd. 3.40
Mahindra & Mahindra Financial Services Ltd. 3.14
ICICI Bank Ltd. 2.94
Gujarat State Petronet Ltd. 2.74
Colgate Palmolive (India) Ltd. 2.61
Bharti Airtel Ltd. 2.60
Maruti Suzuki India Ltd. 2.52
Kotak Mahindra Bank Ltd. 2.42
Indusind Bank Ltd. 2.11
Tech Mahindra Ltd. 2.04
Bajaj Finserv Ltd. 1.84
AU Small Finance Bank Ltd. 1.79
Equitas Holdings Ltd. 1.79
Hero Motocorp Ltd. 1.70
Tata Consultancy Services Ltd. 1.67
JSW Steel Ltd. 1.65
InterGlobe Aviation Ltd. 1.61
Nestle India Ltd. 1.59
Tata Motors Ltd. 1.57
Shriram Transport Finance Company Ltd. 1.55
Jubilant Foodworks Ltd. 1.54
Oil & Natural Gas Corporation Ltd. 1.47
Motherson Sumi Systems Ltd. 1.41
Sheela Foam Ltd. 1.40
PNC Infratech Ltd. 1.40
Hindalco Industries Ltd. 1.24
GE T&D India Ltd. 1.18
Mahindra & Mahindra Ltd. 1.18
Aurobindo Pharma Ltd. 1.17
Bank Of Baroda 1.15
Apollo Tyres Ltd. 1.12
TV Today Network Ltd. 1.10
Kalpataru Power Transmission Ltd. 1.08
Container Corporation Of India Ltd. 1.05
Stock Name (%) Of Total AUM Stock Name (%) Of Total AUM
Hindustan Petroleum Corporation Ltd. 1.05
ITC Ltd. 1.03
Sadbhav Engineering Ltd. 1.03
Punjab National Bank 1.00
Muthoot Finance Ltd. 0.99
Natco Pharma Ltd. 0.96
Laurus Labs Ltd. 0.96
Atul Ltd. 0.96
SREI Infrastructure Finance Ltd. 0.94
NTPC Ltd. 0.93
Prataap Snacks Ltd. 0.93
Strides Shasun Ltd. 0.91
CESC Ltd. 0.90
LT Foods Ltd. 0.89
Indian Energy Exchange Ltd. 0.88
Dr. Lal Path Labs Ltd. 0.86
Techno Electric & Engineering Company Ltd. 0.86
ITD Cementation India Ltd. 0.86
VA Tech Wabag Ltd. 0.85
UPL Ltd. 0.85
Indian Terrain Fashions Ltd. 0.85
Gail (INDIA) Ltd. 0.82
Dewan Housing Finance Corporation Ltd. 0.80
Procter & Gamble Hygiene And Health Care Ltd. 0.80
UFO Moviez India Ltd. 0.73
SBI Life Insurance Company Ltd. 0.72
PSP Projects Ltd. 0.60
The India Cements Ltd. 0.49
Muthoot Capital Services Ltd. 0.44
Greenply Industries Ltd. 0.44
Power Mech Projects Ltd. 0.20
Blue Star Ltd. 0.10
Equity Shares Total 96.71
CBLO 5.27
Cash & Other Receivables -1.98
Grand Total 100.00
^Investors should consult their financial advisers if in doubt about whether the product is suitable for them.
56.49
31.33
8.733.45

11
EQUITY-DIVERSIFIED CAP
Option NAV ( )`
Reg-Plan-Dividend 23.6743
Reg-Plan-Growth 122.2888
Dir-Plan-Dividend 29.7042
Dir-Plan-Growth 126.0101
NET ASSET VALUE
Investors understand that their principal
will be at Moderately High risk
�
�
Long term capital appreciation.
Equity Investments in contrarian stocks which are currently out of favour in the market to providemaximum growth opportunities.
SBI Contra FundThis product is suitable for investors who are seeking^:
Investment Objective
Quantitative Data
To provide the investors maximumgrowth opportunity through equityinvestments in stocks of growth orientedsectors of the economy.
Fund Details
Standard Deviation :
Beta :
Sharpe Ratio :
Portfolio Turnover* :
#
#
#
14.19%
0.96
0.48
0.64#Source : CR IS IL Fund Ana lyser
*Portfolio Turnover = lower of total sale ortotal purchase for the last 12 monthsupon Avg. AUM of trailing twelve months.
Risk Free rate: FBIL Overnight Mibor rate(6.20% as on 29th December 2017) Basisfor Ratio Calculation: 3 Years MonthlyData Points
Note: Fund Manager for ForeignSecurities Mr.Mohit Jain w.e.f. Nov 28,2017. Exp. Over 5years
PORTFOLIO CLASSIFICATION BY
(%)ASSET ALLOCATION
Financial Services 35.34
Services 9.39
Industrial Manufacturing 7.70
Telecom 7.47
IT 7.27
Construction 7.03
Consumer Goods 4.16
Pharma 3.87
Automobile 3.66
Energy 3.06
Metals 2.66
Chemicals 2.42
Cement & Cement Products 2.19
Others 3.77
•
•
•
•
•
•
•
•
•
•
•
•
•
•
Type of Scheme
Date of Allotment:
Report As On:
AAUM for the Month of December 2017
AUM as on December 29, 2017
Fund Manager: Mr. R. Srinivasan
Managing Since:
Total Experience:
Benchmark:
Exit Load:
Entry Load:
Plans Available:
Options:
SIP
Minimum Investment
Additional Investment
An Open - Ended Equity Fund
14/07/1999
29/12/2017
1,892.65 Crores
1,923.06 Crores
Jun-2011
Over 24 years
S&P BSE 100 Index
For exit within 1 year from the date of
allotment - 1 %;
For exit after 1 year from the date of
allotment - Nil.
N.A.
Regular, Direct
Growth, Dividend
Weekly - Minimum 1000 & in multiples
of 1 thereafter for a minimum of 6
instalments.
Monthly - Minimum 1000 & in
multiples of 1 thereafter for minimum
six months (or) minimum 500 & in
multiples of 1 thereafter for minimum
one year.
Quarterly - Minimum 1500 & in
multiples of 1 thereafter for minimum
one year.
5000 & in multiples of 1
1000 & in multiples of 1
`
`
`
`
`
`
`
`
`
`
` `
` `
Large Cap Midcap
Cash & Other Current Assets Smallcap
PORTFOLIO CLASSIFICATION BY
INDUSTRY ALLOCATION (%)
PORTFOLIO
HDFC Bank Ltd. 7.49
Bharti Airtel Ltd. 7.47
ELGI Equipments Ltd. 5.30
ICICI Bank Ltd. 4.90
State Bank Of India 4.83
InterGlobe Aviation Ltd. 4.39
Rural Electrification Corporation Ltd. 4.05
Kotak Mahindra Bank Ltd. 4.04
Bajaj Finance Ltd. 3.65
HCL Technologies Ltd. 3.24
Indian Oil Corporation Ltd. 2.83
Sadbhav Engineering Ltd. 2.82
Jindal Steel & Power Ltd. 2.66
AU Small Finance Bank Ltd. 2.43
Atul Ltd. 2.42
Bharat Heavy Electricals Ltd. 2.40
Balkrishna Industries Ltd. 2.36
IRB Infrastructure Developers Ltd. 2.35
Container Corporation Of India Ltd. 2.33
Equitas Holdings Ltd. 2.31
Greenply Industries Ltd. 2.28
Stock Name (%) Of Total AUM Stock Name (%) Of Total AUM
The India Cements Ltd. 2.19
Sun Pharmaceutical Industries Ltd. 2.08
Westlife Development Ltd. 2.06
Prataap Snacks Ltd. 1.88
PNC Infratech Ltd. 1.86
Aurobindo Pharma Ltd. 1.79
SREI Infrastructure Finance Ltd. 1.44
JK Tyre & Industries Ltd. 1.30
Adlabs Entertainment Ltd. 0.61
JSW Energy Ltd. 0.23
Summit Securities Ltd. 0.21
Cognizant Technology Solutions Corporation 4.03
Equity Shares Total 92.20
Foreign Equity Total 4.03
CBLO 4.06
Cash & Other Receivables -0.29
Grand Total 100.00
(Previously known as SBI MSFU - Contra Fund)
^Investors should consult their financial advisers if in doubt about whether the product is suitable for them.
Record Date Dividend NAV ( )`(in /Unit)`
23-Jun-17 (Dir Plan) 2.90 25.7138
23-Jun-17 (Reg Plan) 2.30 20.5531
26-Feb-16 (Dir Plan) 2.30 20.0765
26-Feb-16 (Reg Plan) 2.00 16.1649
26-Dec-14 (Reg Plan) 2.00 20.3376
LAST DIVIDENDS Face value: 10`
Pursuant to payment of dividend, the NAV of Dividend Option ofscheme/plans would fall to the extent of payout and statutory levy, ifapplicable.
51.47
34.50
6.36
7.67

12
EQUITY-DIVERSIFIED CAP
Option NAV ( )`
Reg-Plan-Dividend 113.7669
Reg-Plan-Growth 225.4902
Dir-Plan-Dividend 134.1249
Dir-Plan-Growth 230.3824
NET ASSET VALUE
Record Date Dividend NAV ( )`(in /Unit)`
27-Feb-17 (Reg-plan) 7.80 89.6546
27-Feb-17 (Dir-plan) 9.20 105.2064
12-Sep-14 (Reg-plan) 11.50 74.9641
12-Oct-09 (Reg-plan) 7.00 57.91
LAST DIVIDENDS
Investors understand that their principal
will be at Moderately High risk
�
�
Long term capital appreciation.
Investments in diversified portfolio of equities of high growth companies to provide a blend of longterm capital appreciation and liquidity.
SBI Magnum Multiplier FundThis product is suitable for investors who are seeking^:
Face value: 10`
Investment Objective
Quantitative Data
To provide investors long term capitalappreciation/dividend along with theliquidity of an open-ended scheme.
Fund Details
Standard Deviation :
Beta :
Sharpe Ratio :
Portfolio Turnover* :
#
#
#
14.19%
0.98
0.69
0.90#Source : CR IS IL Fund Ana lyser
*Portfolio Turnover = lower of total sale ortotal purchase for the last 12 monthsupon Avg. AUM of trailing twelve months.
Risk Free rate: FBIL Overnight Mibor rate(6.20% as on 29th December 2017) Basisfor Ratio Calculation: 3 Years MonthlyData Points
PORTFOLIO CLASSIFICATION BY
(%)ASSET ALLOCATION
Financial Services 25.05
Consumer Goods 18.07
Industrial Manufacturing 12.40
Automobile 6.63
Energy 5.87
Telecom 5.41
Cement & Cement Products 4.60
IT 3.91
Chemicals 3.62
Pharma 3.60
Metals 2.70
Services 2.07
Construction 1.40
Healthcare Services 1.25
Others 3.42
Pursuant to payment of dividend, the NAV of Dividend Option ofscheme/plans would fall to the extent of payout and statutory levy, ifapplicable.
•
•
•
•
•
•
•
•
•
•
•
•
•
•
Type of Scheme
Date of Allotment:
Report As On:
AAUM for the Month of December 2017
AUM as on December 29, 2017
Fund Manager: Mr. Saurabh Pant
Managing Since:
Total Experience
Benchmark:
Exit Load:
Entry Load:
Plans Available:
Options:
SIP
Minimum Investment
Additional Investment
An Open - Ended Equity Scheme
28/02/1993
29/12/2017
2,171.34 Crores
2,233.34 Crores
Sep-2016
Over 10 years
S&P BSE 200 Index
For exit within 12 months from the date
of allotment - 1.00%;
For exit after 12 months from the date of
allotment - Nil
N.A.
Regular, Direct
Growth, Dividend
Weekly - Minimum 1000 & in multiples
of 1 thereafter for a minimum of 6
instalments.
Monthly - Minimum 1000 & in
multiples of 1 thereafter for minimum
six months (or) minimum 500 & in
multiples of 1 thereafter for minimum
one year.
Quarterly - Minimum 1500 & in
multiples of 1 thereafter for minimum
one year.
5000 & in multiples of 1
1000 & in multiples of 1
`
`
`
`
`
`
`
`
`
`
` `
` `
Large Cap Midcap
Cash & Other Current Assets Smallcap
PORTFOLIO CLASSIFICATION BY
INDUSTRY ALLOCATION (%)
PORTFOLIO
ICICI Bank Ltd. 7.03
Bharti Airtel Ltd. 5.41
Sheela Foam Ltd. 4.43
Reliance Industries Ltd. 4.13
Mahindra & Mahindra Financial Services Ltd. 3.94
State Bank Of India 3.89
Thermax Ltd. 3.50
Jubilant Foodworks Ltd. 3.49
Colgate Palmolive (India) Ltd. 2.78
Tech Mahindra Ltd. 2.71
Hindalco Industries Ltd. 2.70
Kirloskar Oil Engines Ltd. 2.60
Prataap Snacks Ltd. 2.24
HDFC Bank Ltd. 2.10
ICICI Lombard General Insurance Company Ltd. 2.08
Tata Motors Ltd. 2.08
Delta Corp Ltd. 2.07
Mahindra & Mahindra Ltd. 2.02
Shriram Transport Finance Company Ltd. 1.99
Solar Industries India Ltd. 1.96
The India Cements Ltd. 1.81
Sun Pharmaceutical Industries Ltd. 1.79
Indian Oil Corporation Ltd. 1.74
ABB India Ltd. 1.73
Bajaj Finserv Ltd. 1.71
Hero Motocorp Ltd. 1.70
Stock Name (%) Of Total AUM Stock Name (%) Of Total AUM
Camlin Fine Sciences Ltd. 1.66
Equitas Holdings Ltd. 1.66
Disa India Ltd. 1.61
Grasim Industries Ltd. 1.57
NRB Bearings Ltd. 1.54
Manpasand Beverages Ltd. 1.43
Dixon Technologies (India) Ltd. 1.41
Ahluwalia Contracts (India) Ltd. 1.40
Thyrocare Technologies Ltd. 1.25
Hatsun Agro Product Ltd. 1.23
Shree Cements Ltd. 1.21
HCL Technologies Ltd. 1.20
Nestle India Ltd. 1.06
Dynamatic Technologies Ltd. 0.84
Sequent Scientific Ltd. 0.84
GE T&D India Ltd. 0.81
Strides Shasun Ltd. 0.81
Greaves Cotton Ltd. 0.61
HDFC Ltd. 0.38
Reliance Nippon Life Asset Management Ltd. 0.27
Alembic Pharmaceuticals Ltd. 0.15
ACC Ltd. 0.01
Equity Shares Total 96.58
CBLO 5.69
Cash & Other Receivables -2.26
Grand Total 100.00
(Previously known as SBI Magnum Multiplier Plus Scheme 1993)
^Investors should consult their financial advisers if in doubt about whether the product is suitable for them.
48.48
36.07
11.98
3.47

13
EQUITY-DIVERSIFIED CAP
Option NAV ( )`
Reg-Plan-Dividend 28.0020
Reg-Plan-Growth 137.4703
Dir-Plan-Dividend 38.8377
Dir-Plan-Growth 143.4159
NET ASSET VALUE
Record Date Dividend NAV ( )`(in /Unit)`
28-Apr-17 (Reg Plan) 2.20 22.1892
(Dir Plan) 3.00 30.590528-Apr-17
07-Apr-16 (Reg Plan) 2.00 20.1119
07-Apr-16 (Dir Plan) 2.50 27.4503
28-Nov-14 (Reg Plan) 2.70 21.2616
LAST DIVIDENDS
Investors understand that their principal
will be at Moderately High risk
�
�
Long term capital appreciation.
Investments in companies that are considered emergent and have export orientation/outsourcingopportunities or are globally competitive to participate in growth potential of Indian businesses.
SBI Emerging Businesses FundThis product is suitable for investors who are seeking^:
Face value: 10`
Investment Objective
Quantitative Data
The investment objective of the Emerging
Businesses Fund would be to participate
in the growth potential presented by
various companies that are considered
e m e r g e n t a n d h a v e e x p o r t
orientation/outsourcing opportunities or
are globally competitive by investing in
the stock representing such companies.
The fund may also evaluate Emerging
Businesses with growth potential and
domestic focus.
Fund Details
Standard Deviation :
Beta :
Sharpe Ratio :
Portfolio Turnover* :
#
#
#
12.94%
0.76
0.71
0.37#Source : CR IS IL Fund Ana lyser
*Portfolio Turnover = lower of total sale ortotal purchase for the last 12 monthsupon Avg. AUM of trailing twelve months.
Risk Free rate: FBIL Overnight Mibor rate(6.20% as on 29th December 2017) Basisfor Ratio Calculation: 3 Years MonthlyData Points
PORTFOLIO CLASSIFICATION BY
(%)ASSET ALLOCATION
Consumer Goods 24.10
Financial Services 22.38
Services 16.32
Industrial Manufacturing 16.12
Chemicals 5.44
Pharma 5.06
Construction 3.80
Automobile 1.93
Others 4.83
Pursuant to payment of dividend, the NAV of Dividend Option ofscheme/plans would fall to the extent of payout and statutory levy, ifapplicable.
•
•
•
•
•
•
•
•
•
•
•
•
•
•
•
Type of Scheme
Date of Allotment:
Report As On:
AAUM for the Month of December 2017
AUM as on December 29, 2017
Fund Manager: Mr. R. Srinivasan
Managing Since:
Total Experience:
Benchmark:
Exit Load:
Entry Load:
Plans Available:
Options:
SIP
Minimum Investment
Additional Investment
An Open - Ended Equity Fund
11/10/2004
29/12/2017
2,308.21 Crores
2,386.67 Crores
May-2009
Over 24 years
S&P BSE 500 Index
For exit within 1 year from the date of
allotment - 1 %;
For exit after 1 year from the date of
allotment - Nil.
N.A.
Regular, Direct
Growth, Dividend
Weekly - Minimum 1000 & in multiples
of 1 thereafter for a minimum of 6
instalments.
Monthly - Minimum 1000 & in
multiples of 1 thereafter for minimum
six months (or) minimum 500 & in
multiples of 1 thereafter for minimum
one year.
Quarterly - Minimum 1500 & in
multiples of 1 thereafter for minimum
one year.
5000 & in multiples of 1
1000 & in multiples of 1
`
`
`
`
`
`
`
`
`
`
` `
` `
PORTFOLIO CLASSIFICATION BY
INDUSTRY ALLOCATION (%)
PORTFOLIO
Procter & Gamble Hygiene AndHealth Care Ltd. 9.45
HDFC Bank Ltd. 8.63
ELGI Equipments Ltd. 6.61
Solar Industries India Ltd. 5.44
The Great Eastern Shipping Company Ltd. 5.19
Divi's Laboratories Ltd. 5.06
Kirloskar Oil Engines Ltd. 4.94
Westlife Development Ltd. 4.15
GRUH Finance Ltd. 4.01
Kotak Mahindra Bank Ltd. 3.81
Techno Electric & Engineering Company Ltd. 3.80
InterGlobe Aviation Ltd. 3.54
3M India Ltd. 3.45
Hawkins Cookers Ltd. 3.31
Agro Tech Foods Ltd. 3.28
AU Small Finance Bank Ltd. 3.14
Hatsun Agro Product Ltd. 3.13
Stock Name (%) Of Total AUM Stock Name (%) Of Total AUM
Muthoot Finance Ltd. 2.79
Sheela Foam Ltd. 2.65
Finolex Industries Ltd. 2.49
Dixon Technologies (India) Ltd. 2.28
Finolex Cables Ltd. 2.08
Goodyear India Ltd. 1.93
Equity Shares Total 95.17
CBLO 3.86
Cash & Other Receivables 0.97
Grand Total 100.00
(Previously known as SBI MSFU - EmergingBusinesses Fund)
^Investors should consult their financial advisers if in doubt about whether the product is suitable for them.
Large Cap Midcap
Cash & Other Current Assets Smallcap
15.98
66.83
12.32
4.87

14
EQUITY-MIDCAP & SMALLCAP
Option NAV ( )`
Reg-Plan-Dividend 37.3003
Reg-Plan-Growth 86.5176
Dir-Plan-Dividend 54.1532
Dir-Plan-Growth 90.5608
NET ASSET VALUE
Record Date Dividend NAV ( )`(in /Unit)`
30-Jun-16 (Reg-Plan) 2.50 28.2445
30-Jun-16 (Dir-Plan) 3.50 40.3050
20-Mar-15 (Reg-Plan) 4.80 26.6619
20-Mar-15 (Dir-Plan) 6.80 37.4040
08-Aug-13 (Reg-Plan) 5.00 18.1066
LAST DIVIDENDS
Investors understand that their principal
will be at Moderately High risk
�
�
long term capital appreciation.
Investment predominantly in a well diversified equity stocks of Midcap companies
SBI Magnum Midcap FundThis product is suitable for investors who are seeking^:
Face value: 10`
Investment Objective
Quantitative Data
To provide investors with opportunities
for long-term growth in capital along
with the liquidity of an open-ended
scheme by investing predominantly in a
well diversified basket of equity stocks of
Midcap companies.
Fund Details
Standard Deviation :
Beta :
Sharpe Ratio :
Portfolio Turnover* :
#
#
#
13.85%
0.74
0.77
0.39#Source : CR IS IL Fund Ana lyser
*Portfolio Turnover = lower of total sale ortotal purchase for the last 12 monthsupon Avg. AUM of trailing twelve months.
Risk Free rate: FBIL Overnight Mibor rate(6.20% as on 29th December 2017) Basisfor Ratio Calculation: 3 Years MonthlyData Points
PORTFOLIO CLASSIFICATION BY
(%)ASSET ALLOCATION
Financial Services 20.48
Consumer Goods 16.27
Industrial Manufacturing 12.77
Pharma 11.67
Construction 7.76
Fertilisers & Pesticides 6.92
Cement & Cement Products 4.40
Services 4.15
Healthcare Services 4.09
IT 3.43
Energy 2.38
Chemicals 1.28
Textiles 0.73
Others 3.65
Pursuant to payment of dividend, the NAV of Dividend Option ofscheme/plans would fall to the extent of payout and statutory levy, ifapplicable.
•
•
•
•
•
•
•
•
•
•
•
•
•
•
Type of Scheme
Date of Allotment:
Report As On:
AAUM for the Month of December 2017
AUM as on December 29, 2017
Fund Manager: Ms. Sohini Andani
Managing Since:
Total Experience:
Benchmark:
Exit Load:
Entry Load:
Plans Available:
Options:
SIP
Minimum Investment
Additional Investment
An Open - Ended Growth Scheme
29/03/2005
29/12/2017
4,116.86 Crores
4,234.43 Crores
July-2010
Over 22 years
Nifty MidSmallcap 400 Index
For exit within 1 year from the
date of allotment - 1 %;
For exit after 1 year from the date of
allotment - Nil
N.A.
Regular, Direct
Growth, Dividend
Weekly - Minimum 1000 & in multiples
of 1 thereafter for a minimum of 6
instalments.
Monthly - Minimum 1000 & in
multiples of 1 thereafter for minimum
six months (or) minimum 500 & in
multiples of 1 thereafter for minimum
one year.
Quarterly - Minimum 1500 & in
multiples of 1 thereafter for minimum
one year.
5000 & in multiples of 1
1000 & in multiples of 1
`
`
`
`
`
`
`
`
`
`
` `
` `
Large Cap Midcap
Cash & Other Current Assets Smallcap
PORTFOLIO CLASSIFICATION BY
INDUSTRY ALLOCATION (%)
PORTFOLIO
Dixon Technologies (India) Ltd. 4.46
Carborundum Universal Ltd. 4.39
Cholamandalam Investment AndFinance Company Ltd. 4.09
The Ramco Cements Ltd. 3.76
Sheela Foam Ltd. 3.68
Manpasand Beverages Ltd. 3.27
PI Industries Ltd. 2.98
The Federal Bank Ltd. 2.97
Voltas Ltd. 2.93
Schaeffler India Ltd. 2.82
Strides Shasun Ltd. 2.61
Shriram City Union Finance Ltd. 2.48
VIP Industries Ltd. 2.45
Indraprastha Gas Ltd. 2.38
Sadbhav Engineering Ltd. 2.34
Hexaware Technologies Ltd. 2.32
Sanofi India Ltd. 2.18
Mahindra & Mahindra Financial Services Ltd. 2.06
Thermax Ltd. 1.98
UPL Ltd. 1.83
ERIS Lifesciences Ltd. 1.80
RBL Bank Ltd. 1.80
VA Tech Wabag Ltd. 1.78
Natco Pharma Ltd. 1.73
Laurus Labs Ltd. 1.67
Dr. Lal Path Labs Ltd. 1.63
Sharda Cropchem Ltd. 1.60
Equitas Holdings Ltd. 1.55
Indian Energy Exchange Ltd. 1.52
SKF India Ltd. 1.49
Stock Name (%) Of Total AUM Stock Name (%) Of Total AUM
Mahindra Holidays & Resorts India Ltd. 1.47
NCC LTD. 1.46
Thyrocare Technologies Ltd. 1.41
Clariant Chemicals (India) Ltd. 1.28
Emami Ltd. 1.26
Greenply Industries Ltd. 1.16
HDFC Ltd. 1.15
Persistent Systems Ltd. 1.11
Care Ratings Ltd. 1.10
Narayana Hrudayalaya Ltd. 1.05
Divi's Laboratories Ltd. 0.99
Greaves Cotton Ltd. 0.81
Swaraj Engines Ltd. 0.77
Shriram Transport Finance Company Ltd. 0.76
Navkar Corporation Ltd. 0.75
Page Industries Ltd. 0.73
Sequent Scientific Ltd. 0.67
Mangalam Cement Ltd. 0.64
Repco Home Finance Ltd. 0.56
ITD Cementation India Ltd. 0.55
NRB Bearings Ltd. 0.52
Bayer Cropscience Ltd. 0.51
Godrej Properties Ltd. 0.48
AU Small Finance Bank Ltd. 0.35
Westlife Development Ltd. 0.15
Summit Securities Ltd. 0.10
Equity Shares Total 96.35
CBLO 3.72
Cash & Other Receivables -0.07
Grand Total 100.00
^Investors should consult their financial advisers if in doubt about whether the product is suitable for them.
2.59
78.58
15.18
3.65
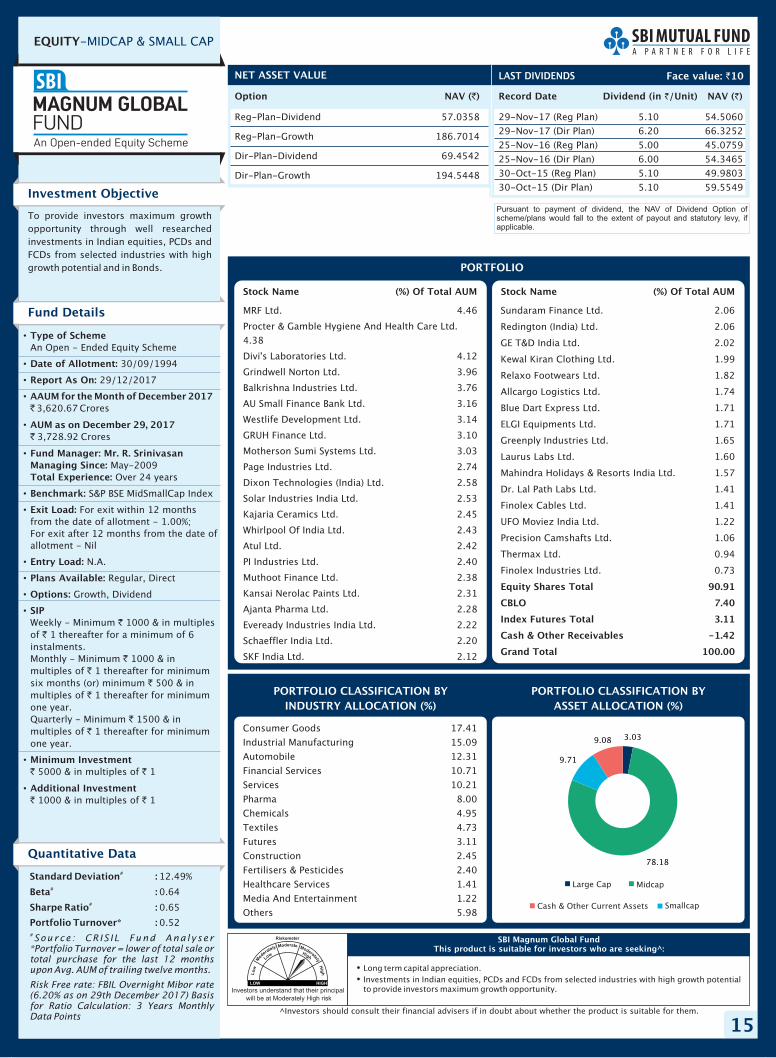
15
EQUITY-MIDCAP & SMALL CAP
Option NAV ( )`
Reg-Plan-Dividend 57.0358
Reg-Plan-Growth 186.7014
Dir-Plan-Dividend 69.4542
Dir-Plan-Growth 194.5448
NET ASSET VALUE
Investors understand that their principal
will be at Moderately High risk
�
�
Long term capital appreciation.
Investments in Indian equities, PCDs and FCDs from selected industries with high growth potentialto provide investors maximum growth opportunity.
SBI Magnum Global FundThis product is suitable for investors who are seeking^:
Investment Objective
Quantitative Data
To provide investors maximum growth
opportunity through well researched
investments in Indian equities, PCDs and
FCDs from selected industries with high
growth potential and in Bonds.
Fund Details
Standard Deviation :
Beta :
Sharpe Ratio :
Portfolio Turnover* :
#
#
#
12.49%
0.64
0.65
0.52#Source : CR IS IL Fund Ana lyser
*Portfolio Turnover = lower of total sale ortotal purchase for the last 12 monthsupon Avg. AUM of trailing twelve months.
Risk Free rate: FBIL Overnight Mibor rate(6.20% as on 29th December 2017) Basisfor Ratio Calculation: 3 Years MonthlyData Points
PORTFOLIO CLASSIFICATION BY
(%)ASSET ALLOCATION
Consumer Goods 17.41
Industrial Manufacturing 15.09
Automobile 12.31
Financial Services 10.71
Services 10.21
Pharma 8.00
Chemicals 4.95
Textiles 4.73
Futures 3.11
Construction 2.45
Fertilisers & Pesticides 2.40
Healthcare Services 1.41
Media And Entertainment 1.22
Others 5.98
•
•
•
•
•
•
•
•
•
•
•
•
•
•
Type of Scheme
Date of Allotment:
Report As On:
AAUM for the Month of December 2017
AUM as on December 29, 2017
Fund Manager: Mr. R. Srinivasan
Managing Since:
Total Experience:
Benchmark:
Exit Load:
Entry Load:
Plans Available:
Options:
SIP
Minimum Investment
Additional Investment
An Open - Ended Equity Scheme
30/09/1994
29/12/2017
3,620.67 Crores
3,728.92 Crores
May-2009
Over 24 years
S&P BSE MidSmallCap Index
For exit within 12 months
from the date of allotment - 1.00%;
For exit after 12 months from the date of
allotment - Nil
N.A.
Regular, Direct
Growth, Dividend
Weekly - Minimum 1000 & in multiples
of 1 thereafter for a minimum of 6
instalments.
Monthly - Minimum 1000 & in
multiples of 1 thereafter for minimum
six months (or) minimum 500 & in
multiples of 1 thereafter for minimum
one year.
Quarterly - Minimum 1500 & in
multiples of 1 thereafter for minimum
one year.
5000 & in multiples of 1
1000 & in multiples of 1
`
`
`
`
`
`
`
`
`
`
` `
` `
PORTFOLIO CLASSIFICATION BY
INDUSTRY ALLOCATION (%)
PORTFOLIO
MRF Ltd. 4.46
Procter & Gamble Hygiene And Health Care Ltd.
4.38
Divi's Laboratories Ltd. 4.12
Grindwell Norton Ltd. 3.96
Balkrishna Industries Ltd. 3.76
AU Small Finance Bank Ltd. 3.16
Westlife Development Ltd. 3.14
GRUH Finance Ltd. 3.10
Motherson Sumi Systems Ltd. 3.03
Page Industries Ltd. 2.74
Dixon Technologies (India) Ltd. 2.58
Solar Industries India Ltd. 2.53
Kajaria Ceramics Ltd. 2.45
Whirlpool Of India Ltd. 2.43
Atul Ltd. 2.42
PI Industries Ltd. 2.40
Muthoot Finance Ltd. 2.38
Kansai Nerolac Paints Ltd. 2.31
Ajanta Pharma Ltd. 2.28
Eveready Industries India Ltd. 2.22
Schaeffler India Ltd. 2.20
SKF India Ltd. 2.12
Stock Name (%) Of Total AUM Stock Name (%) Of Total AUM
Sundaram Finance Ltd. 2.06
Redington (India) Ltd. 2.06
GE T&D India Ltd. 2.02
Kewal Kiran Clothing Ltd. 1.99
Relaxo Footwears Ltd. 1.82
Allcargo Logistics Ltd. 1.74
Blue Dart Express Ltd. 1.71
ELGI Equipments Ltd. 1.71
Greenply Industries Ltd. 1.65
Laurus Labs Ltd. 1.60
Mahindra Holidays & Resorts India Ltd. 1.57
Dr. Lal Path Labs Ltd. 1.41
Finolex Cables Ltd. 1.41
UFO Moviez India Ltd. 1.22
Precision Camshafts Ltd. 1.06
Thermax Ltd. 0.94
Finolex Industries Ltd. 0.73
Equity Shares Total 90.91
CBLO 7.40
Index Futures Total 3.11
Cash & Other Receivables -1.42
Grand Total 100.00
^Investors should consult their financial advisers if in doubt about whether the product is suitable for them.
Record Date Dividend NAV ( )`(in /Unit)`
29-Nov-17 (Reg Plan) 5.10 54.5060
29-Nov-17 (Dir Plan) 6.20 66.3252
25-Nov-16 (Reg Plan) 5.00 45.0759
25-Nov-16 (Dir Plan) 6.00 54.3465
30-Oct-15 (Reg Plan) 5.10 49.9803
30-Oct-15 (Dir Plan) 5.10 59.5549
LAST DIVIDENDS Face value: 10`
Pursuant to payment of dividend, the NAV of Dividend Option ofscheme/plans would fall to the extent of payout and statutory levy, ifapplicable.
Large Cap Midcap
Cash & Other Current Assets Smallcap
3.03
78.18
9.71
9.08

16
EQUITY-MIDCAP & SMALL CAP
Option NAV ( )`
Reg-Plan-Dividend 47.1612
Reg-Plan-Growth 62.7059
Dir-Plan-Dividend 57.4724
Dir-Plan-Growth 66.1565
NET ASSET VALUE
Record Date Dividend NAV ( )`(in /Unit)`
28-Aug-15 (Reg Plan) 3.60 23.5236
28-Aug-15 (Dir Plan) 4.30 27.8630
30-Jan-15 (Reg Plan) 4.00 26.0785
LAST DIVIDENDS
Investors understand that their principal
will be at Moderately High risk
�
�
long term capital appreciation
Investment in diversified portfolio of predominantly in equity and equity-related securities ofsmall & midcap companies.
SBI Small & Midcap FundThis product is suitable for investors who are seeking^:
Face value: 10`
Investment Objective
Quantitative Data
The Scheme seeks to generate incomeand long term capital appreciation byinvesting in a diversified portfolio ofpredominantly in equity and equityrelated securities of small & midcapCompanies
Fund Details
Standard Deviation :
Beta :
Sharpe Ratio :
Portfolio Turnover* :
#
#
#
16.79%
0.83
1.28
0.75#Source : CR IS IL Fund Ana lyser
*Portfolio Turnover = lower of total sale ortotal purchase for the last 12 monthsupon Avg. AUM of trailing twelve months.
Risk Free rate: FBIL Overnight Mibor rate(6.20% as on 29th December 2017) Basisfor Ratio Calculation: 3 Years MonthlyData Points
PORTFOLIO CLASSIFICATION BY
(%)ASSET ALLOCATION
Consumer Goods 26.24
Industrial Manufacturing 13.46
Services 12.25
Construction 10.78
Chemicals 7.01
Financial Services 6.61
Textiles 4.82
Paper 4.74
Pharma 3.72
Automobile 2.98
Media And Entertainment 2.72
Others 4.67
Pursuant to payment of dividend, the NAV of Dividend Option ofscheme/plans would fall to the extent of payout and statutory levy, ifapplicable.
•
•
•
•
•
•
•
•
•
•
•
•
•
•
•
Type of Scheme
Date of Allotment:
Report As On:
AAUM for the Month of December 2017
AUM as on December 29, 2017
Fund Manager: Mr. R. Srinivasan
Managing Since:
Total Experience:
Benchmark:
Exit Load:
Entry Load:
Plans Available:
Options:
SIP
Minimum Investment
Additional Investment
An Open Ended Equity Scheme
09/09/2009
29/12/2017
915.93 Crores
943.56 Crores
Nov - 2013
Over 24 years
S&P BSE Small Cap Index
For exit within one year from
the date of allotment -1%
For exit after one year from the date of
allotment – Nil
N.A.
Regular, Direct
Growth, Dividend
Not Available
Not Available
Not Available
Subscription /Additional Subscription/
Switch in/ new SIP/ new STP/ DTP
discontinued till further notice
`
`
^
^
^
^
PORTFOLIO CLASSIFICATION BY
INDUSTRY ALLOCATION (%)
PORTFOLIO
Westlife Development Ltd. 5.94
LT Foods Ltd. 5.78
Relaxo Footwears Ltd. 5.03
Kirloskar Oil Engines Ltd. 4.81
Tamil Nadu Newsprint & Papers Ltd. 4.74
Hawkins Cookers Ltd. 4.69
ELGI Equipments Ltd. 4.58
HDFC Bank Ltd. 4.56
Camlin Fine Sciences Ltd. 4.51
Techno Electric & Engineering Company Ltd. 4.36
Orient Refractories Ltd. 4.06
The Great Eastern Shipping Company Ltd. 3.81
Thangamayil Jewellery Ltd. 3.65
Ashiana Housing Ltd. 3.52
Hatsun Agro Product Ltd. 3.42
Power Mech Projects Ltd. 2.89
UFO Moviez India Ltd. 2.72
Ganesha Ecosphere Ltd. 2.58
Gufic Biosciences Ltd. 2.55
Nesco Ltd. 2.50
Stock Name (%) Of Total AUM Stock Name (%) Of Total AUM
Fairchem Speciality Ltd. 2.50
Garware Wall Ropes Ltd. 2.24
Rajratan Global Wire Ltd. 2.08
AU Small Finance Bank Ltd. 2.05
AvanTI Feeds Ltd. 1.88
V2 Retail Ltd. 1.59
Alembic Ltd. 1.17
Gabriel India Ltd. 0.90
Sheela Foam Ltd. 0.21
Equity Shares Total 95.33
CBLO 2.43
Cash & Other Receivables 2.24
Grand Total 100.00
Pursuant to acquisition of Daiwa Industry
Leaders Fund (DILF) from Daiwa Mutual Fund,
w.e.f November 16, 2013 the name of the
scheme was changed to SBI Small & Midcap
Fund.
^Investors should consult their financial advisers if in doubt about whether the product is suitable for them.
Large Cap Midcap
Cash & Other Current Assets Smallcap
4.56
31.75
59.06
4.63

17
EQUITY-TAXSAVING
Option NAV ( )`
Reg-Plan-Dividend 49.1532
Reg-Plan-Growth 150.0227
Dir-Plan-Dividend 61.7049
Dir-Plan-Growth 154.2991
NET ASSET VALUE
Record Date Dividend NAV ( )`(in /Unit)`
17-Mar-17 (Reg Plan) 4.00 41.1004
17-Mar-17 (Dir Plan) 5.00 51.3144
11-Mar-16 (Reg Plan) 4.00 36.4523
11-Mar-16 (Dir Plan) 5.00 45.2369
27-Mar-15 (Reg Plan) 5.50 51.8907
27-Mar-15 (Dir Plan) 7.00 64.2735
LAST DIVIDENDS
Investors understand that their principal
will be at Moderately High risk
�
�
Long term capital appreciation.
Investment in a portfolio of equity shares, while offering deduction under Section 80 C of IT Act,1961.
SBI Magnum Taxgain SchemeThis product is suitable for investors who are seeking^:
Face value: 10`
Investment Objective
Quantitative Data
To deliver the benefit of investment in a
portfolio of equity shares, while offering
deduction on such investment made in
the scheme under section 80C of the
Income-tax Act, 1961. It also seeks to
distribute income periodically depending
on distributable surplus. Investments in
this scheme would be subject to a
statutory lock-in of 3 years from the date
of allotment to avail Section 80C benefits.
Fund Details
Standard Deviation :
Beta :
Sharpe Ratio :
Portfolio Turnover* :
#
#
#
13.80%
0.96
0.44
0.73#Source : CR IS IL Fund Ana lyser
*Portfolio Turnover = lower of total sale ortotal purchase for the last 12 monthsupon Avg. AUM of trailing twelve months.
Risk Free rate: FBIL Overnight Mibor rate(6.20% as on 29th December 2017) Basisfor Ratio Calculation: 3 Years MonthlyData Points
PORTFOLIO CLASSIFICATION BY
(%)ASSET ALLOCATION
Financial Services 30.84
Energy 11.54
Consumer Goods 8.68
Automobile 7.22
Telecom 7.15
Construction 6.28
Services 5.52
Industrial Manufacturing 5.31
IT 4.38
Cement & Cement Products 3.89
Fertilisers & Pesticides 2.69
Pharma 1.85
Chemicals 1.18
Metals 1.08
Others 2.39
Pursuant to payment of dividend, the NAV of Dividend Option ofscheme/plans would fall to the extent of payout and statutory levy, ifapplicable.
•
•
•
•
•
•
•
•
•
•
•
•
•
•
Type of Scheme
Date of Allotment:
Report As On:
AAUM for the Month of December 2017
AUM as on December 29, 2017
Fund Manager: Mr. Dinesh
Balachandran
Managing Since:
Total Experience:
Benchmark:
Exit Load:
Entry Load:
Plans Available:
Options:
SIP
Minimum Investment
Additional Investment
An Open - Ended Equity Linked Savings
Scheme
31/03/1993
29/12/2017
6,381.72 Crores
6,550.05 Crores
Sep-2016
Over 15 years
S&P BSE 100 Index
NIL
N.A.
Regular, Direct
Growth, Dividend
Weekly - Minimum 500 & in multiples
of 500 thereafter for a minimum of 6
instalments. Monthly - Minimum 500 &
in multiples of 500.
500 & in multiples of 500
500 & in multiples of 500
`
`
`
`
`
`
` `
` `
Large Cap Midcap
Cash & Other Current Assets Smallcap
PORTFOLIO CLASSIFICATION BY
INDUSTRY ALLOCATION (%)
PORTFOLIO
ICICI Bank Ltd. 6.85Reliance Industries Ltd. 5.29Bharti Airtel Ltd. 3.81Mahindra & Mahindra Ltd. 3.44State Bank Of India 3.34HDFC Bank Ltd. 3.27Larsen & Toubro Ltd. 3.06Tata Motors Ltd. 2.77Gail (INDIA) Ltd. 2.36Idea Cellular Ltd. 2.25UPL Ltd. 2.16United Breweries Ltd. 2.06Ambuja Cements Ltd. 2.05VA Tech Wabag Ltd. 2.00Axis Bank Ltd. 1.98Bharat Heavy Electricals Ltd. 1.95Rural Electrification Corporation Ltd. 1.91IRB Infrastructure Developers Ltd. 1.82HCL Technologies Ltd. 1.77Mahindra & Mahindra Financial Services Ltd. 1.76InterGlobe Aviation Ltd. 1.51ICICI Prudential Life Insurance Company Ltd. 1.50Glaxosmithkline Consumer Healthcare Ltd. 1.46KEC International Ltd. 1.41Infosys Ltd. 1.40Bharat Electronics Ltd. 1.39Shriram Transport Finance Company Ltd. 1.36CESC Ltd. 1.35Tech Mahindra Ltd. 1.21Bank Of Baroda 1.20Bharat Petroleum Corporation Ltd. 1.20Atul Ltd. 1.18ITC Ltd. 1.14HDFC Ltd. 1.12LT Foods Ltd. 1.11Blue Dart Express Ltd. 1.10
Stock Name (%) Of Total AUM Stock Name (%) Of Total AUM
Equitas Holdings Ltd. 1.09Colgate Palmolive (India) Ltd. 1.09Bharti Infratel Ltd. 1.08NMDC Ltd. 1.08GE T&D India Ltd. 1.07ICICI Lombard General Insurance Company Ltd. 1.06NHPC Ltd. 1.02Kotak Mahindra Bank Ltd. 1.00ACC Ltd. 0.95Nestle India Ltd. 0.94NRB Bearings Ltd. 0.90Grasim Industries Ltd. 0.89The Federal Bank Ltd. 0.80Container Corporation Of India Ltd. 0.79Laurus Labs Ltd. 0.77Manpasand Beverages Ltd. 0.69Bosch Ltd. 0.66HDFC Standard Life Insurance Company Ltd. 0.65Bajaj Finserv Ltd. 0.61Strides Shasun Ltd. 0.55Rallis India Ltd. 0.53Sequent Scientific Ltd. 0.52CRISIL Ltd. 0.43SREI Infrastructure Finance Ltd. 0.43Dynamatic Technologies Ltd. 0.36JSW Energy Ltd. 0.32Reliance Nippon Life Asset Management Ltd. 0.24Indian Energy Exchange Ltd. 0.20Prataap Snacks Ltd. 0.19The Great Eastern Shipping Company Ltd. 0.11Summit Securities Ltd. 0.05Equity Shares Total 97.61CBLO 2.63Cash & Other Receivables -0.24Grand Total 100.00
^Investors should consult their financial advisers if in doubt about whether the product is suitable for them.
70.13
22.37
5.122.38

18
EQUITY-THEMATIC
Option NAV ( )`
Reg-Plan-Dividend 98.8127
Reg-Plan-Growth 132.3034
Dir-Plan-Dividend 114.9599
Dir-Plan-Growth 139.6007
NET ASSET VALUE
Record Date Dividend NAV ( )`(in /Unit)`
30-Jan-15 (Reg Plan) 10.00 93.5001
LAST DIVIDENDS
Investors understand that their principal
will be at High risk
�
�
Long term capital appreciation.
Equity Investments in stock of Pharmaceuticals sector of the economy to provide sector specificgrowth opportunities.
SBI Pharma FundThis product is suitable for investors who are seeking^:
Face value: 10`
Investment Objective
Quantitative Data
To provide the investors maximumgrowth opportunity through equityinvestments in stocks of growth orientedsectors of the economy.
Fund Details
Standard Deviation :
Beta :
Sharpe Ratio :
Portfolio Turnover* :
#
#
#
16.99%
0.92
-0.07
0.66#Source : CR IS IL Fund Ana lyser
*Portfolio Turnover = lower of total sale ortotal purchase for the last 12 monthsupon Avg. AUM of trailing twelve months.
Risk Free rate: FBIL Overnight Mibor rate(6.20% as on 29th December 2017) Basisfor Ratio Calculation: 3 Years MonthlyData Points
PORTFOLIO CLASSIFICATION BY
(%)ASSET ALLOCATION
Pharma 84.25
Healthcare Services 12.13
Others 3.62
Pursuant to payment of dividend, the NAV of Dividend Option ofscheme/plans would fall to the extent of payout and statutory levy, ifapplicable.
•
•
•
•
•
•
•
•
•
•
•
•
•
•
Type of Scheme
Date of Allotment:
Report As On:
AAUM for the Month of December 2017
AUM as on December 29, 2017
Fund Manager: Mr. Tanmaya Desai
Managing Since:
Total Experience:
Benchmark:
Exit Load:
Entry Load:
Plans Available:
Options:
SIP
Minimum Investment
Additional Investment
An Open - Ended Equity Fund
14/07/1999
29/12/2017
1,103.70 Crores
1,132.73 Crores
Jun-2011
Over 9 years
S&P BSE HEALTH CARE
Index
For exit within 15 Days from
the date of allotment - 0.50%;
For exit after 15 Days from the date of
allotment - Nil.
N.A.
Regular, Direct
Growth, Dividend
Weekly - Minimum 1000 & in multiples
of 1 thereafter for a minimum of 6
instalments.
Monthly - Minimum 1000 & in
multiples of 1 thereafter for minimum
six months (or) minimum 500 & in
multiples of 1 thereafter for minimum
one year.
Quarterly - Minimum 1500 & in
multiples of 1 thereafter for minimum
one year.
5000 & in multiples of 1
1000 & in multiples of
`
`
`
`
`
`
`
`
`
`
` `
` ` 1
Large Cap Midcap
Cash & Other Current Assets Smallcap
PORTFOLIO CLASSIFICATION BY
INDUSTRY ALLOCATION (%)
PORTFOLIO
Divi's Laboratories Ltd. 11.65
Cipla Ltd. 9.25
Aurobindo Pharma Ltd. 7.30
Strides Shasun Ltd. 7.28
Alkem Laboratories Ltd. 5.84
Natco Pharma Ltd. 5.10
Sun Pharmaceutical Industries Ltd. 5.05
Torrent Pharmaceuticals Ltd. 5.02
Cadila Healthcare Ltd. 4.91
Thyrocare Technologies Ltd. 3.71
Gufic Biosciences Ltd. 3.70
Apollo Hospitals Enterprise Ltd. 3.20
Ajanta Pharma Ltd. 3.16
Sanofi India Ltd. 3.14
Dr. Lal Path Labs Ltd. 3.12
Sequent Scientific Ltd. 2.59
Stock Name (%) Of Total AUM Stock Name (%) Of Total AUM
ERIS Lifesciences Ltd. 2.53
Laurus Labs Ltd. 2.40
Narayana Hrudayalaya Ltd. 2.11
Neuland Laboratories Ltd. 1.97
Alembic Pharmaceuticals Ltd. 1.88
Alembic Ltd. 1.49
Equity Shares Total 96.38
CBLO 2.46
Cash & Other Receivables 1.16
Grand Total 100.00
(Previously known as SBI MSFU - Pharma Fund)
^Investors should consult their financial advisers if in doubt about whether the product is suitable for them.
26.47
56.34
13.44
3.75

19
EQUITY-THEMATIC
Option NAV ( )`
Reg-Plan-Dividend 15.2135
Reg-Plan-Growth 15.2123
Dir-Plan-Dividend 15.5599
Dir-Plan-Growth 15.5610
NET ASSET VALUE
�
�
Long term capital appreciation.
Investment predominantly in a portfolio of equity & equity related securities of companiesengaged in banking and financial services.
SBI Banking & Financial Services FundThis product is suitable for investors who are seeking^:
Investment Objective
“The investment objective of the scheme
is to generate long-term capital
appreciation to unit holders from a
portfolio that is invested predominantly
in equity and equity related securities of
companies engaged in banking and
financial services. However, there can be
no assurance that the investment
objective of the Scheme will be realized."
Fund Details
PORTFOLIO CLASSIFICATION BY
(%)ASSET ALLOCATION
Financial Services 97.43
Others 2.57
•
•
•
•
•
•
•
•
•
•
•
•
•
•
Type of Scheme
Date of Allotment:
Report As On:
AAUM for the Month of December 2017
AUM as on December 29, 2017
Fund Manager: Ms. Sohini Andani
Managing Since:
Total Experience:
Benchmark:
Exit Load:
Entry Load:
Plans Available:
Options:
SIP
Minimum Investment
Additional Investment
An Open - Ended Sector Fund
26/02/2015
29/12/2017
490.53 Crores
493.39 Crores
Feb-2015
Over 22 years
Nifty Financial Services
For exit within 12 months from the date
of allotment - 1.00%;
For exit after 12 months from the date of
allotment - Nil
N.A.
Regular, Direct
Growth, Dividend
Weekly - Minimum 1000 & in multiples
of 1 thereafter for a minimum of 6
instalments.
Monthly – Minimum 1000 & in multiples
of 1 thereafter for minimum 6months
or Minimum 500 & in multiples of 1
thereafter for minimum 12months
Quarterly - Minimum 1500 & in
multiples of 1 thereafter for minimum
one year.
5000 & in multiples of 1
1000 & in multiples of 1
`
`
`
`
`
`
` `
`
`
` `
` `
PORTFOLIO CLASSIFICATION BY
INDUSTRY ALLOCATION (%)
^Investors should consult their financial advisers if in doubt about whether the product is suitable for them.
PORTFOLIO
HDFC Bank Ltd. 12.10
Mahindra & Mahindra Financial Services Ltd. 8.04
ICICI Bank Ltd. 7.80
Kotak Mahindra Bank Ltd. 7.55
State Bank Of India 6.21
AU Small Finance Bank Ltd. 5.43
Bajaj Finserv Ltd. 4.98
Bajaj Finance Ltd. 4.63
SBI Life Insurance Company Ltd. 4.62
Bank Of Baroda 3.91
Shriram Transport Finance Company Ltd. 3.60
Punjab National Bank 3.12
ICICI Lombard General Insurance Company Ltd. 3.09
HDFC Standard Life Insurance Company Ltd. 3.03
Equitas Holdings Ltd. 3.00
ICICI Prudential Life Insurance Company Ltd. 2.71
Muthoot Capital Services Ltd. 2.56
Bharat Financial Inclusion Ltd. 2.43
Canara Bank 2.19
Muthoot Finance Ltd. 1.91
Dewan Housing Finance Corporation Ltd. 1.72
Reliance Nippon Life Asset Management Ltd. 1.09
Mas Financial Services Ltd. 0.55
HDFC Ltd.(Warrants) 1.14
Equity Shares Total 96.29
Warrants Total 1.14
CBLO 3.09
Cash & Other Receivables -0.52
Grand Total 100.00
Stock Name (%) Of Total AUM
Investors understand that their principal
will be at High risk
Quantitative Data
Portfolio Turnover* : 0.74
*Portfolio Turnover = lower of total sale ortotal purchase for the last 12 monthsupon Avg. AUM of trailing twelve months.
Large Cap Midcap
Cash & Other Current Assets Smallcap
68.55
25.84
3.11 2.50

20
EQUITY-THEMATIC
Option NAV ( )`
Reg-Plan-Dividend 12.9009
Reg-Plan-Growth 12.9019
Dir-Plan-Dividend 13.1960
Dir-Plan-Growth 13.2104
NET ASSET VALUE
�
�
Long term capital appreciation.
Investments in diversified basket of equity stocks and debt of domestic Public SectorUndertakings to provide long term growth in capital with improved liquidity.
SBI PSU FundThis product is suitable for investors who are seeking^:
Investment Objective
Quantitative Data
The objective of the scheme would be toprovide investors with opportunities forlong-term growth in capital along withthe liquidity of an open-ended schemethrough an active management ofinvestments in a diversified basket ofequity stocks of domestic Public SectorUnder takings and in debt and moneymarket instruments issued by PSUs andothers.
Fund Details
Standard Deviation :
Beta :
Sharpe Ratio :
Portfolio Turnover* :
#
#
#
17.32%
0.85
0.17
0.73#Source : CR IS IL Fund Ana lyser
*Portfolio Turnover = lower of total sale ortotal purchase for the last 12 monthsupon Avg. AUM of trailing twelve months.
Risk Free rate: FBIL Overnight Mibor rate(6.20% as on 29th December 2017) Basisfor Ratio Calculation: 3 Years MonthlyData Points
PORTFOLIO CLASSIFICATION BY
(%)ASSET ALLOCATION
Energy 38.26
Financial Services 22.77
Industrial Manufacturing 13.76
Construction 10.12
Metals 4.95
Services 4.63
Others 5.51
•
•
•
•
•
•
•
•
•
•
•
•
•
•
Type of Scheme
Date of Allotment:
Report As On:
AAUM for the Month of December 2017
AUM as on December 29, 2017
Fund Manager: Mr. Richard D'souza
Managing Since:
Total Experience:
Benchmark:
Exit Load:
Entry Load:
Plans Available:
Options:
SIP
Minimum Investment
Additional Investment
An Open - Ended Equity Scheme
07/07/2010
29/12/2017
231.46 Crores
234.37 Crores
Aug 2014
Over 25 years
S&P BSE PSU INDEX
For exit within 1 year from the date of
allotment - 1%;
For exit after 1 year from the date of
allotment - Nil
N.A.
Regular, Direct
Growth, Dividend
Weekly - Minimum 1000 & in multiples
of 1 thereafter for a minimum of 6
instalments.
Monthly - Minimum 1000 & in
multiples of 1 thereafter for minimum
six months (or) minimum 500 & in
multiples of 1 thereafter for minimum
one year.
Quarterly - Minimum 1500 & in
multiples of 1 thereafter for minimum
one year.
5000 & in multiples of 1
1000 & in multiples of 1
`
`
`
`
`
`
`
`
`
`
` `
` `
PORTFOLIO CLASSIFICATION BY
INDUSTRY ALLOCATION (%)
PORTFOLIO
State Bank Of India 10.24
Oil & Natural Gas Corporation Ltd. 7.73
Engineers India Ltd. 6.97
Gail (India) Ltd. 6.28
Bharat Electronics Ltd. 5.76
National Aluminium Company Ltd. 4.95
Hindustan Petroleum Corporation Ltd. 4.73
Power Grid Corporation Of India Ltd. 4.65
Container Corporation Of India Ltd. 4.63
NTPC Ltd. 4.30
Indraprastha Gas Ltd. 4.29
Indian Oil Corporation Ltd. 3.83
Punjab National Bank 3.36
Canara Bank 3.30
Cochin Shipyard Ltd. 3.17
Stock Name (%) Of Total AUM Stock Name (%) Of Total AUM
NBCC (India) Ltd. 3.16
Bank Of Baroda 3.05
HDFC Ltd. 2.81
BEML Ltd. 2.76
Oil India Ltd. 2.44
Bharat Heavy Electricals Ltd. 2.07
Equity Shares Total 94.49
CBLO 5.73
Cash & Other Receivables -0.22
Grand Total 100.00
^Investors should consult their financial advisers if in doubt about whether the product is suitable for them.
Investors understand that their principal
will be at High risk
Large Cap MidcapCash & Other Current Assets
60.71
33.89
5.40

21
EQUITY-THEMATIC
Option NAV ( )`
Reg-Plan-Dividend 28.4127
Reg-Plan-Growth 42.0679
Dir-Plan-Dividend 29.2802
Dir-Plan-Growth 43.3279
NET ASSET VALUE
Record Date Dividend NAV ( )`(in /Unit)`
15-03-10 3.00 16.01
25-07-08 2.00 17.14
27-11-06 1.50 16.18
LAST DIVIDENDS
Investors understand that their principal
will be at High risk
�
�
Long term capital appreciation.
Equity Investments in a portfolio of stocks of companies engaged in the commodity businesswithin Oil & Gas, Metals, Materials and Agriculture Sectors of the economy to provide growth andpossibility of consistent returns.
SBI Magnum Comma FundThis product is suitable for investors who are seeking^:
Face value: 10`
Investment Objective
Quantitative Data
To generate opportunities for growthalong with possibility of consistentreturns by investing predominantly in aportfolio of stocks of companies engagedin the commodity business within thefollowing sectors - Oil & Gas, Metals,Materials & Agriculture and in debt &money market instruments.
Fund Details
Standard Deviation :
Beta :
Sharpe Ratio :
Portfolio Turnover* :
#
#
#
15.58%
0.80
0.86
0.59#Source : CR IS IL Fund Ana lyser
*Portfolio Turnover = lower of total sale ortotal purchase for the last 12 monthsupon Avg. AUM of trailing twelve months.
Risk Free rate: FBIL Overnight Mibor rate(6.20% as on 29th December 2017) Basisfor Ratio Calculation: 3 Years MonthlyData Points
PORTFOLIO CLASSIFICATION BY
(%)ASSET ALLOCATION
Energy 38.05
Metals 24.23
Cement & Cement Products 10.02
Chemicals 8.85
Consumer Goods 6.18
Fertilisers & Pesticides 3.74
Industrial Manufacturing 3.58
Textiles 3.11
Others 2.25
Pursuant to payment of dividend, the NAV of Dividend Option ofscheme/plans would fall to the extent of payout and statutory levy, ifapplicable.
•
•
•
•
•
•
•
•
•
•
•
•
•
•
Type of Scheme
Date of Allotment:
Report As On:
AAUM for the Month of December 2017
AUM as on December 29, 2017
Fund Manager: Mr. Richard D'souza
Managing Since:
Total Experience:
Benchmark:
Exit Load:
Entry Load:
Plans Available:
Options:
SIP
Minimum Investment
Additional Investment
An Open - Ended Equity Scheme
08/08/2005
29/12/2017
360.84 Crores
373.06 Crores
Aug-2014
Over 25 years
Nifty Commodities Index
For exit within 1 year from the date of
allotment - 1 %;
For exit after 1 year from the date of
allotment - Nil.
N.A.
Regular, Direct
Growth, Dividend
Weekly - Minimum 1000 & in multiples
of 1 thereafter for a minimum of 6
instalments.
Monthly - Minimum 1000 & in
multiples of 1 thereafter for minimum
six months (or) minimum 500 & in
multiples of 1 thereafter for minimum
one year.
Quarterly - Minimum 1500 & in
multiples of 1 thereafter for minimum
one year.
5000 & in multiples of 1
1000 & in multiples of 1
`
`
`
`
`
`
`
`
`
`
` `
` `
Large Cap Midcap
Cash & Other Current Assets Smallcap
PORTFOLIO CLASSIFICATION BY
INDUSTRY ALLOCATION (%)
PORTFOLIO
Reliance Industries Ltd. 8.14
Camlin Fine Sciences Ltd. 6.58
Oil & Natural Gas Corporation Ltd. 6.38
Hindalco Industries Ltd. 5.86
Godrej Agrovet Ltd. 4.62
Tata Steel Ltd. 4.61
Jindal Steel & Power Ltd. 4.39
Indraprastha Gas Ltd. 4.27
Gail (India) Ltd. 4.10
Vedanta Ltd. 3.98
Sagar Cements Ltd. 3.92
Indian Oil Corporation Ltd. 3.82
Petronet LNG Ltd. 3.68
EPC Industrie Ltd. 3.58
Grasim Industries Ltd. 3.12
Mayur Uniquoters Ltd. 3.11
Hindustan Zinc Ltd. 3.02
Stock Name (%) Of Total AUM Stock Name (%) Of Total AUM
Hindustan Petroleum Corporation Ltd. 2.94
Tata Power Company Ltd. 2.88
Ultratech Cement Ltd. 2.55
UPL Ltd. 2.45
Tata Metaliks Ltd. 2.37
Atul Ltd. 2.27
Hatsun Agro Product Ltd. 1.56
Bayer Cropscience Ltd. 1.28
NTPC Ltd. 1.07
Oil India Ltd. 0.76
Everest Industries Ltd. 0.42
Equity Shares Total 97.75
CBLO 4.47
Cash & Other Receivables -2.22
Grand Total 100.00
^Investors should consult their financial advisers if in doubt about whether the product is suitable for them.
55.7822.06
20.01
2.15

22
EQUITY-THEMATIC
Option NAV ( )`
Reg-Plan-Dividend 17.3951
Reg-Plan-Growth 17.3935
Dir-Plan-Dividend 17.8434
Dir-Plan-Growth 17.8644
NET ASSET VALUE
Investors understand that their principal
will be at High risk
�
�
Long term capital appreciation.
Equity Investments in stock of companies directly or indirectly involved in the infrastructuregrowth of the Indian economy to provide long term capital growth opportunities.
SBI Infrastructure FundThis product is suitable for investors who are seeking^:
Investment Objective
Quantitative Data
To provide investors with opportunities
for long-term growth in capital through
an active management of investments in a
diversified basket of equity stocks of
companies directly or indirectly involved
in the infrastructure growth in the Indian
economy and in debt & money market
instruments.
Fund Details
Standard Deviation :
Beta :
Sharpe Ratio :
Portfolio Turnover* :
#
#
#
15.54%
0.75
0.68
0.77#Source : CR IS IL Fund Ana lyser
*Portfolio Turnover = lower of total sale ortotal purchase for the last 12 monthsupon Avg. AUM of trailing twelve months.
Risk Free rate: FBIL Overnight Mibor rate(6.20% as on 29th December 2017) Basisfor Ratio Calculation: 3 Years MonthlyData Points
PORTFOLIO CLASSIFICATION BY
(%)ASSET ALLOCATION
Construction 40.62
Industrial Manufacturing 12.25
Telecom 12.00
Energy 10.59
Financial Services 6.82
Services 5.04
Automobile 2.56
Cement & Cement Products 2.14
Metals 2.09
Others 5.90
•
•
•
•
•
•
•
•
•
•
•
•
•
•
Type of Scheme
Date of Allotment:
Report As On:
AAUM for the Month of December 2017
AUM as on December 29, 2017
Fund Manager: Mr. Richard D'souza
Managing Since:
Total Experience:
Benchmark:
Exit Load:
Entry Load:
Plans Available:
Options:
SIP
Minimum Investment
Additional Investment
An Open - Ended Growth Scheme
06/07/2007
29/12/2017
651.80 Crores
676.70 Crores
Aug-2014
Over 25 years
Nifty Infrastructure Index
For exit within 1 year from the date of
allotment - 1 %;
For exit after 1 year from the date of
allotment - Nil
N.A.
Regular, Direct
Growth, Dividend
Weekly - Minimum 1000 & in multiples
of 1 thereafter for a minimum of 6
instalments.
Monthly - Minimum 1000 & in
multiples of 1 thereafter for minimum
six months (or) minimum 500 & in
multiples of 1 thereafter for minimum
one year.
Quarterly - Minimum 1500 & in
multiples of 1 thereafter for minimum
one year.
5000 & in multiples of 1
1000 & in multiples of 1
`
`
`
`
`
`
`
`
`
`
` `
` `
Large Cap Midcap
Cash & Other Current Assets
PORTFOLIO CLASSIFICATION BY
INDUSTRY ALLOCATION (%)
PORTFOLIO
Bharti Airtel Ltd. 9.77
Larsen & Toubro Ltd. 8.57
NCC LTD. 5.27
ITD Cementation India Ltd. 4.73
ELGI Equipments Ltd. 4.61
JMC Projects (India) Ltd. 4.37
PNC Infratech Ltd. 4.33
Sadbhav Engineering Ltd. 4.31
Timken India Ltd. 3.89
Kennametal India Ltd. 3.75
NTPC Ltd. 3.16
Kalpataru Power Transmission Ltd. 3.13
Ashoka Buildcon Ltd. 2.80
ICICI Bank Ltd. 2.78
InterGlobe Aviation Ltd. 2.61
Shanthi Gears Ltd. 2.56
VA Tech Wabag Ltd. 2.43
Petronet LNG Ltd. 2.25
Idea Cellular Ltd. 2.23
Shriram Transport Finance Company Ltd. 2.19
Stock Name (%) Of Total AUM Stock Name (%) Of Total AUM
Star Cement Ltd. 2.14
DLF Ltd. 2.10
Vedanta Ltd. 2.09
Power Grid Corporation Of India Ltd. 2.04
IRB Infrastructure Developers Ltd. 2.02
Capacit'E Infraprojects Ltd. 1.93
Indian Energy Exchange Ltd. 1.85
The Phoenix Mills Ltd. 0.20
Equity Shares Total 94.10
CBLO 3.21
Cash & Other Receivables 2.68
Grand Total 100.00
(Previously known as SBI Infrastructure Fund - Series 1)
^Investors should consult their financial advisers if in doubt about whether the product is suitable for them.
Smallcap
39.86
31.82
22.60
5.72

23
EQUITY-THEMATIC
Option NAV ( )`
Reg-Plan-Dividend 84.4221
Reg-Plan-Growth 118.6560
Dir-Plan-Dividend 103.6175
Dir-Plan-Growth 124.5813
NET ASSET VALUE
Record Date Dividend NAV ( )`(in /Unit)`
29-May-15 (Reg Plan) 10.00 51.3257
29-May-15 (Dir Plan) 12.00 61.4862
17-May-13 (Reg Plan) 8.00 46.0416
3-Mar-06 6.00 22.05
LAST DIVIDENDS
�
�
Long term capital appreciation.
Equity Investments in stock of FMCG sector of the economy to provide sector specific growthopportunities.
SBI FMCG FundThis product is suitable for investors who are seeking^:
Face value: 10`
Investment Objective
Quantitative Data
To provide the investors maximumgrowth opportunity through equityinvestments in stocks of growth orientedsectors of the economy.
Fund Details
Standard Deviation :
Beta :
Sharpe Ratio :
Portfolio Turnover* :
#
#
#
15.19%
0.95
0.77
0.43#Source : CR IS IL Fund Ana lyser
*Portfolio Turnover = lower of total sale ortotal purchase for the last 12 monthsupon Avg. AUM of trailing twelve months.
Risk Free rate: FBIL Overnight Mibor rate(6.20% as on 29th December 2017) Basisfor Ratio Calculation: 3 Years MonthlyData Points
PORTFOLIO CLASSIFICATION BY
(%)ASSET ALLOCATION
Consumer Goods 94.02
Textiles 2.53
Others 3.45
•
•
•
•
•
•
•
•
•
•
•
•
•
•
Type of Scheme
Date of Allotment:
Report As On:
AAUM for the Month of December 2017
AUM as on December 29, 2017
Fund Manager: Mr. Saurabh Pant
Managing Since:
Total Experience:
Benchmark:
Exit Load:
Entry Load:
Plans Available:
Options:
SIP
Minimum Investment
Additional Investment
An Open - Ended Equity Fund
14/07/1999
29/12/2017
438.76 Crores
459.00 Crores
Jun-2011
Over 10 years
S&P BSE Fast Moving
Consumer Goods Index
For exit within 15 Days from the date of
allotment - 0.50%;
For exit after 15 Days from the date of
allotment - Nil.
Nil
Regular, Direct
Growth, Dividend
Weekly - Minimum 1000 & in multiples
of 1 thereafter for a minimum of 6
instalments.
Monthly - Minimum 1000 & in
multiples of 1 thereafter for minimum
six months (or) minimum 500 & in
multiples of 1 thereafter for minimum
one year
Quarterly - Minimum 1500 & in
multiples of 1 thereafter for minimum
one year.
5000 & in multiples of 1
1000 & in multiples of 1
`
`
`
`
`
`
`
`
`
`
` `
` `
Large Cap Midcap
Cash & Other Current Assets Smallcap
PORTFOLIO CLASSIFICATION BY
INDUSTRY ALLOCATION (%)
PORTFOLIO
ITC Ltd. 17.23
Colgate Palmolive (India) Ltd. 8.14
Jubilant Foodworks Ltd. 6.92
Sheela Foam Ltd. 6.57
Radico Khaitan Ltd. 5.79
Glaxosmithkline Consumer Healthcare Ltd. 5.71
Procter & Gamble Hygiene And Health Care Ltd. 5.62
LT Foods Ltd. 5.29
Nestle India Ltd. 5.15
Prataap Snacks Ltd. 5.02
Manpasand Beverages Ltd. 4.78
Greenply Industries Ltd. 4.45
Hatsun Agro Product Ltd. 3.98
Thangamayil Jewellery Ltd. 3.26
Indian Terrain Fashions Ltd. 2.53
Hawkins Cookers Ltd. 2.30
Eveready Industries India Ltd. 1.57
VIP Industries Ltd. 1.24
V2 Retail Ltd. 1.02
Equity Shares Total 96.56
CBLO 3.85
Cash & Other Receivables -0.41
Grand Total 100.00
Stock Name (%) Of Total AUM
(Previously known as SBI MSFU - FMCG Fund)
Investors understand that their principal
will be at High risk
^Investors should consult their financial advisers if in doubt about whether the product is suitable for them.
Pursuant to payment of dividend, the NAV of Dividend Option ofscheme/plans would fall to the extent of payout and statutory levy, ifapplicable.
22.35
42.89
31.19
3.57
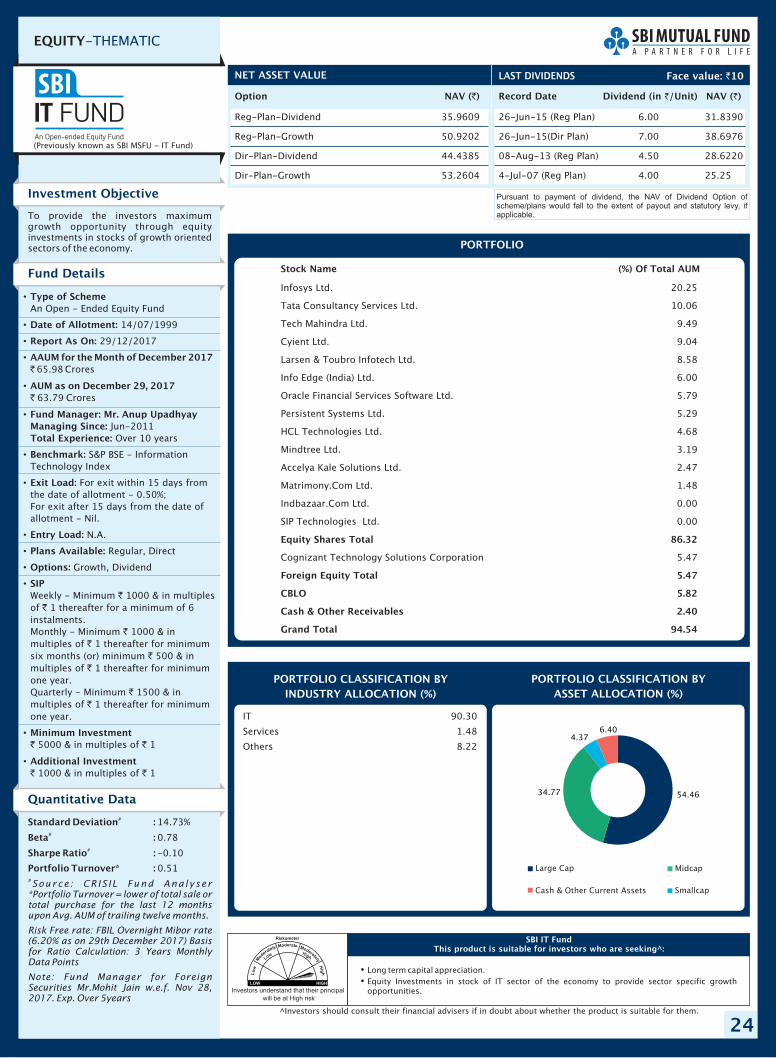
24
EQUITY-THEMATIC
Option NAV ( )`
Reg-Plan-Dividend 35.9609
Reg-Plan-Growth 50.9202
Dir-Plan-Dividend 44.4385
Dir-Plan-Growth 53.2604
NET ASSET VALUE
Record Date Dividend NAV ( )`(in /Unit)`
26-Jun-15 (Reg Plan) 6.00 31.8390
26-Jun-15(Dir Plan) 7.00 38.6976
08-Aug-13 (Reg Plan) 4.50 28.6220
4-Jul-07 (Reg Plan) 4.00 25.25
LAST DIVIDENDS
�
�
Long term capital appreciation.
Equity Investments in stock of IT sector of the economy to provide sector specific growthopportunities.
SBI IT FundThis product is suitable for investors who are seeking^:
Face value: 10`
Investment Objective
Quantitative Data
To provide the investors maximumgrowth opportunity through equityinvestments in stocks of growth orientedsectors of the economy.
Fund Details
Standard Deviation :
Beta :
Sharpe Ratio :
Portfolio Turnover* :
#
#
#
14.73%
0.78
-0.10
0.51#Source : CR IS IL Fund Ana lyser
*Portfolio Turnover = lower of total sale ortotal purchase for the last 12 monthsupon Avg. AUM of trailing twelve months.
Risk Free rate: FBIL Overnight Mibor rate(6.20% as on 29th December 2017) Basisfor Ratio Calculation: 3 Years MonthlyData Points
Note: Fund Manager for ForeignSecurities Mr.Mohit Jain w.e.f. Nov 28,2017. Exp. Over 5years
PORTFOLIO CLASSIFICATION BY
(%)ASSET ALLOCATION
IT 90.30
Services 1.48
Others 8.22
Pursuant to payment of dividend, the NAV of Dividend Option ofscheme/plans would fall to the extent of payout and statutory levy, ifapplicable.
•
•
•
•
•
•
•
•
•
•
•
•
•
•
Type of Scheme
Date of Allotment:
Report As On:
AAUM for the Month of December 2017
AUM as on December 29, 2017
Fund Manager: Mr. Anup Upadhyay
Managing Since:
Total Experience:
Benchmark:
Exit Load:
Entry Load:
Plans Available:
Options:
SIP
Minimum Investment
Additional Investment
An Open - Ended Equity Fund
14/07/1999
29/12/2017
65.98 Crores
63.79 Crores
Jun-2011
Over 10 years
S&P BSE - Information
Technology Index
For exit within 15 days from
the date of allotment - 0.50%;
For exit after 15 days from the date of
allotment - Nil.
N.A.
Regular, Direct
Growth, Dividend
Weekly - Minimum 1000 & in multiples
of 1 thereafter for a minimum of 6
instalments.
Monthly - Minimum 1000 & in
multiples of 1 thereafter for minimum
six months (or) minimum 500 & in
multiples of 1 thereafter for minimum
one year.
Quarterly - Minimum 1500 & in
multiples of 1 thereafter for minimum
one year.
5000 & in multiples of 1
1000 & in multiples of 1
`
`
`
`
`
`
`
`
`
`
` `
` `
PORTFOLIO CLASSIFICATION BY
INDUSTRY ALLOCATION (%)
PORTFOLIO
Infosys Ltd. 20.25
Tata Consultancy Services Ltd. 10.06
Tech Mahindra Ltd. 9.49
Cyient Ltd. 9.04
Larsen & Toubro Infotech Ltd. 8.58
Info Edge (India) Ltd. 6.00
Oracle Financial Services Software Ltd. 5.79
Persistent Systems Ltd. 5.29
HCL Technologies Ltd. 4.68
Mindtree Ltd. 3.19
Accelya Kale Solutions Ltd. 2.47
Matrimony.Com Ltd. 1.48
Indbazaar.Com Ltd. 0.00
SIP Technologies Ltd. 0.00
Cognizant Technology Solutions Corporation 5.47
Equity Shares Total 86.32
Foreign Equity Total 5.47
CBLO 5.82
Cash & Other Receivables 2.40
Grand Total 94.54
Stock Name (%) Of Total AUM
(Previously known as SBI MSFU - IT Fund)
^Investors should consult their financial advisers if in doubt about whether the product is suitable for them.
Investors understand that their principal
will be at High risk
Large Cap Midcap
Cash & Other Current Assets Smallcap
54.4634.77
4.376.40

25
Option NAV ( )`
Reg-Plan-Dividend 9.3709
Reg-Plan-Growth 9.3691
Dir-Plan-Dividend 9.5569
Dir-Plan-Growth 9.5631
NET ASSET VALUE
Investors understand that their principal
will be at Moderately High risk
�
�
Long term capital appreciation.
Investment in SBI - ETF Gold.
SBI GOLD FundThis product is suitable for investors who are seeking^:
Investment Objective
The scheme seeks to provide returns thatclosely correspond to returns provided bySBI - ETF Gold (Previously known as SBIGETS).
Fund Details
PORTFOLIO CLASSIFICATION BY (%)ASSET ALLOCATION
•
•
•
•
•
•
•
•
•
•
•
•
•
•
Type of Scheme
Date of Allotment:
Report As On:
AAUM for the Month of December 2017
AUM as on December 29, 2017
Fund Manager: Mr. Raviprakash
Sharma
Managing Since:
Total Experience:
Benchmark:
Exit Load:
Entry Load:
Plans Available:
Options:
SIP
Minimum Investment
Additional Investment
An Open Ended Fund of Fund Scheme
12/09/2011
29/12/2017
388.48 Crores
389.83 Crores
Sep-2011
Over 17 years
Price of Physical Gold
Exit within 1 year from the
date of allotment – 1%.
Exit after 1 year from the date of
allotment - Nil
N.A.
Regular, Direct
Growth, Dividend
Weekly - Minimum 1000 & in multiples
of 1 thereafter for a minimum of 6
instalments.
The minimum amount of investment for
SIP transactions is 6000 (aggregate)
either through:
(1) 100/- per month and in multiples of
1/- thereafter for minimum 60 months
(2) 500/- per month and in multiples of
1/- thereafter for minimum 12 months
(3) 1000/- per month and in multiples
of 1/- thereafter for minimum 6
months
(4) 500/- per quarter and in multiples
of 1/- thereafter for minimum 12
quarters
(5) 1500/- per quarter and in multiples
of 1/- thereafter for minimum 4
quarters
5000 & in multiples of 1
1000 & in multiples of 1
`
`
`
`
`
`
`
`
`
`
`
`
`
`
`
` `
` `
Mutual Fund Units NCA (INCL. Cash, Deposits)
PORTFOLIO
SBIMF-ETF Gold 99.69
Mutual Fund Units Total 99.69
CBLO 0.27
Cash & Other Receivables 0.04
Grand Total 100.00
Mutual Fund Units (%) Of Total AUM
^Investors should consult their financial advisers if in doubt about whether the product is suitable for them.
FUND OF FUNDS
99.69
0.31

26
EQUITY-ARBITRAGE
Option NAV ( )`
Reg-Plan-Dividend 13.2689
Reg-Plan-Growth 22.2964
Dir-Plan-Dividend 14.0832
Dir-Plan-Growth 22.8276
NET ASSET VALUE
Record Date Dividend NAV ( )`(in /Unit)`
27-Dec-17 (Reg Plan) 0.06 13.2612
27-Dec-17 (Dir Plan) 0.07 14.0746
29-Nov-17 (Reg Plan) 0.06 13.2723
29-Nov-17 (Dir Plan) 0.07 14.0868
27-Oct-17 (Reg Plan) 0.06 13.2543
27-Oct-17 (Dir Plan) 0.07 14.0669
LAST DIVIDENDS
Investors understand that their principal
will be at Moderately Low risk
�
�
Short term investment.
Investments to exploit profitable arbitrage opportunities between the spot and derivative marketsegments to provide capital appreciation and regular income.
SBI Arbitrage Opportunities FundThis product is suitable for investors who are seeking^:
Face value: 10`
Investment Objective
Quantitative Data
To provide capital appreciation andregular income for unit holders byident i fy ing prof i table arbi t rageopportunities between the spot andderivative market segments as alsothrough investment of surplus cash indebt and money market instruments.
Fund Details
Standard Deviation :
Beta :
Sharpe Ratio :
Portfolio Turnover* :
#
#
#
0.51%
1.13
-0.09
11.60#Source : CR IS IL Fund Ana lyser
*Portfolio Turnover = lower of total sale ortotal purchase for the last 12 monthsupon Avg. AUM of trailing twelve months.
Risk Free rate: FBIL Overnight Mibor rate(6.20% as on 29th December 2017) Basisfor Ratio Calculation: 3 Years MonthlyData Points
PORTFOLIO CLASSIFICATION BY
(%)ASSET ALLOCATION
Financial Services 43.64
Margin Fixed Deposits 12.72
Cement & Cement Products 5.89
Metals 5.53
Automobile 5.31
Media And Entertainment 4.37
Energy 4.23
Pharma 3.79
Telecom 3.51
Consumer Goods 3.08
Services 2.63
Industrial Manufacturing 2.33
Construction 1.82
Healthcare Services 1.04
IT 0.62
Fertilisers & Pesticides 0.50
Futures -68.67
Others 67.68
Pursuant to payment of dividend, the NAV of Dividend Option ofscheme/plans would fall to the extent of payout and statutory levy, ifapplicable.
•
•
•
•
•
•
•
•
•
•
•
•
•
•
Type of Scheme
Date of Allotment:
Report As On:
AAUM for the Month of December 2017
AUM as on December 29, 2017
Fund Manager: Mr. Neeraj Kumar
Managing Since:
Total Experience:
Benchmark:
Exit Load:
Entry Load:
Plans Available:
Option:
SIP
Minimum Investment
Additional Investment
An Open - Ended Scheme
03/11/2006
29/12/2017
1,229.21 Crores
1,267.99 Crores
Oct-2012
Over 20 years
CRISIL Liquid Fund Index
For exit within 1 month fromthe date of allotment - 0.50%;For exit after 1 month from the date ofallotment - Nil.
N.A.
Regular, Direct
Growth, Dividend
Weekly - Minimum 1000 & in multiples of1 thereafter for a minimum of 6
instalments.
Monthly - Minimum 1000 & in multiplesof 1 thereafter for minimum six months(or) minimum 500 & in multiples of 1thereafter for minimum one year.
Quarterly - Minimum 1500 & in multiplesof 1 thereafter for minimum one year.
5000 & in multiples of 1
1000 & in multiples of 1
`
`
`
`
`
`
` `
`
`
` `
` `
PORTFOLIO CLASSIFICATION BY
INDUSTRY ALLOCATION (%)
PORTFOLIO
Century Textiles & Industries Ltd. 5.49Tata Communications Ltd. 3.43Tata Motors Ltd. 2.83Jet Airways (India) Ltd. 2.63Indiabulls Housing Finance Ltd. 2.26TV18 Broadcast Ltd. 2.17Sun TV Network Ltd. 2.14Reliance Capital Ltd. 2.05Hindalco Industries Ltd. 1.93Vedanta Ltd. 1.91State Bank Of India 1.90Capital First Ltd. 1.84CESC Ltd. 1.71Reliance Infrastructure Ltd. 1.68Dewan Housing Finance Corporation Ltd. 1.63Ceat Ltd. 1.62Bharat Financial Inclusion Ltd. 1.54IDFC Bank Ltd. 1.50Aurobindo Pharma Ltd. 1.45Manappuram Finance Ltd. 1.31Jain Irrigation Systems Ltd. 1.25Ajanta Pharma Ltd. 1.23Ujjivan Financial Services Ltd. 1.22The Federal Bank Ltd. 1.18Fortis Healthcare Ltd. 1.04Larsen & Toubro Ltd. 1.02Wockhardt Ltd. 0.99The South Indian Bank Ltd. 0.98ICICI Bank Ltd. 0.95ITC Ltd. 0.91Havells India Ltd. 0.91JSW Steel Ltd. 0.90IRB Infrastructure Developers Ltd. 0.80Godrej Consumer Products Ltd. 0.73Multi Commodity Exchange Of India Ltd. 0.70Bank Of Baroda 0.69L&T Finance Holdings Ltd. 0.63Tata Elxsi Ltd. 0.62Power Finance Corporation Ltd. 0.61IDFC Ltd. 0.59Suzlon Energy Ltd. 0.58Punjab National Bank 0.57Rural Electrification Corporation Ltd. 0.56Bharat Heavy Electricals Ltd. 0.50National Aluminium Company Ltd. 0.45
Stock Name (%) Of Total AUM Stock Name (%) Of Total AUM
UPL Ltd. 0.43Escorts Ltd. 0.38MRF Ltd. 0.38Adani Power Ltd. 0.36SREI Infrastructure Finance Ltd. 0.36Reliance Industries Ltd. 0.29Tata Steel Ltd. 0.26Bajaj Finance Ltd. 0.26United Breweries Ltd. 0.24The India Cements Ltd. 0.15Grasim Industries Ltd. 0.15Titan Company Ltd. 0.14Balrampur Chini Mills Ltd. 0.12HDFC Ltd. 0.12Granules India Ltd. 0.11ACC Ltd. 0.11JSW Energy Ltd. 0.11Exide Industries Ltd. 0.09Andhra Bank 0.09Reliance Power Ltd. 0.08Idea Cellular Ltd. 0.07Hindustan Zinc Ltd. 0.07Equitas Holdings Ltd. 0.07Gujarat State Fertilizers & Chemicals Ltd. 0.07PVR Ltd. 0.06LIC Housing Finance Ltd. 0.04Godrej Industries Ltd. 0.02
Tata Motors Finance Solutions Ltd. 1.59Non Convertible Debentures Total 1.59Tata Motor Finance Holdings Ltd. 4.57
Samvardhana Motherson International Ltd. 4.30Clix Capital Services Pvt. Ltd. 3.77Reliance Capital Ltd. 3.04Capital First Ltd. 1.81Ford Credit India Pvt. Ltd. 0.94
Axis Bank Ltd. 7.67The Federal Bank Ltd. 5.05
Equity Shares Total 68.27
Zero Coupon Bonds Total 4.57
Commercial Papers Total 13.86
Margin Fixed Deposits Total 12.72CBLO 0.07Stock Futures Total -68.67Cash & Other Receivables 67.61Grand Total 100.00
^Investors should consult their financial advisers if in doubt about whether the product is suitable for them.
Large Cap Midcap
Cash & Other Current Assets Smallcap
-0.14-0.25
-0.01
100.40

27
EQUITY-INDEX FUND
Option NAV ( )`
Reg-Plan-Dividend 45.9044
Reg-Plan-Growth 89.6093
Dir-Plan-Dividend 46.9833
Dir-Plan-Growth 91.5363
NET ASSET VALUE
Investors understand that their principal
will be at Moderately High risk
�
�
Long term capital appreciation.
Passive Investment in stocks comprising the Nifty 50 Index in the same proportion as in the indexto achieve returns equivalent to the Total returns Index of Nifty 50 Index.
SBI Nifty Index FundThis product is suitable for investors who are seeking^:
Investment Objective
Quantitative Data
The scheme will adopt a passiveinvestment strategy. The scheme willinvest in stocks comprising the Nifty 50Index in the same proportion as in theindex with the objective of achievingreturns equivalent to the Total ReturnsIndex of Nifty 50 Index by minimizing theperformance difference between thebenchmark index and the scheme. TheTotal Returns Index is an index thatreflects the returns on the index fromindex gain/loss plus dividend paymentsby the constituent stocks.
Fund Details
Portfolio Turnover* :
Tracking Error :
1.22
0.17%
*Portfolio Turnover = lower of total sale ortotal purchase for the last 12 monthsupon Avg. AUM of trailing twelve months.
Tracking Error is computed for the 3 YearPeriod ending 29th December 2017,based on month-end NAV. Tracking Erroris computed using Total Returns Index.
PORTFOLIO CLASSIFICATION BY
(%)ASSET ALLOCATION
Financial Services 33.72
Energy 14.53
IT 10.71
Automobile 10.23
Consumer Goods 8.86
Futures 4.62
Metals 4.37
Pharma 3.87
Construction 3.67
Telecom 2.35
Cement & Cement Products 1.54
Media And Entertainment 0.75
Services 0.74
Margin Fixed Deposits 0.69
Fertilisers & Pesticides 0.66
Others -1.31
•
•
•
•
•
•
•
•
•
•
•
•
•
•
Type of Scheme
Date of Allotment:
Report As On:
AAUM for the Month of December 2017
AUM as on December 29, 2017
Fund Manager: Mr. RaviprakashSharmaManaging Since:Total Experience:
Benchmark:
Exit Load:
Entry Load:
Plans Available:
Options:
SIP
Minimum Investment
Additional Investment
An Open - Ended Index Fund
17/01/2002
29/12/2017
232.15 Crores
238.95 Crores
Feb-2011Over 17 years
Nifty 50 Index
For exit within 15 days from thedate of allotment - 0.20%For exit on or after 15 days from the date ofallotment - Nil
N.A.
Regular, Direct
Growth, Dividend
Weekly - Minimum 1000 & in multiplesof 1 thereafter for a minimum of 6instalments.Monthly - Minimum 1000 & inmultiples of 1 thereafter for minimumsix months (or) minimum 500 & inmultiples of 1 thereafter for minimumone year.Quarterly - Minimum 1500 & inmultiples of 1 thereafter for minimumone year.
5000 & in multiples of 1
1000 & in multiples of 1
`
`
`
`
`
`
`
`
`
`
` `
` `
PORTFOLIO CLASSIFICATION BY
INDUSTRY ALLOCATION (%)
PORTFOLIO
HDFC Bank Ltd. 9.06
Reliance Industries Ltd. 7.51
HDFC Ltd. 6.46
ITC Ltd. 5.31
Infosys Ltd. 4.93
ICICI Bank Ltd. 4.77
Larsen & Toubro Ltd. 3.67
Kotak Mahindra Bank Ltd. 3.19
Tata Consultancy Services Ltd. 3.18
Maruti Suzuki India Ltd. 3.06
State Bank Of India 2.72
Hindustan Unilever Ltd. 2.31
Axis Bank Ltd. 2.27
Indusind Bank Ltd. 1.99
Tata Motors Ltd. 1.89
Mahindra & Mahindra Ltd. 1.66
Bharti Airtel Ltd. 1.65
Sun Pharmaceutical Industries Ltd. 1.49
Vedanta Ltd. 1.45
Yes Bank Ltd. 1.37
Oil & Natural Gas Corporation Ltd. 1.30
NTPC Ltd. 1.28
Asian Paints Ltd. 1.24
HCL Technologies Ltd. 1.17
Hero Motocorp Ltd. 1.16
Tata Steel Ltd. 1.16
Bajaj Auto Ltd. 1.07
Ultratech Cement Ltd. 1.07
Power Grid Corporation Of India Ltd. 1.04
Stock Name (%) Of Total AUM Stock Name (%) Of Total AUM
Bajaj Finance Ltd. 0.98
Eicher Motors Ltd. 0.96
Bharat Petroleum Corporation Ltd. 0.96
Hindalco Industries Ltd. 0.94
Indian Oil Corporation Ltd. 0.94
Indiabulls Housing Finance Ltd. 0.92
Coal India Ltd. 0.81
Gail (India) Ltd. 0.76
Zee Entertainment Enterprises Ltd. 0.75
Tech Mahindra Ltd. 0.75
Hindustan Petroleum Corporation Ltd. 0.74
Adani Ports And Special Economic Zone Ltd. 0.74
Cipla Ltd. 0.73
Bharti Infratel Ltd. 0.70
Dr. Reddy'S Laboratories Ltd. 0.69
Wipro Ltd. 0.69
UPL Ltd. 0.66
Lupin Ltd. 0.50
Ambuja Cements Ltd. 0.47
Aurobindo Pharma Ltd. 0.46
Bosch Ltd. 0.44
Axis Bank Ltd. 0.69
Equity Shares Total 96.00
Margin Fixed Deposits Total 0.69
CBLO 4.43
Stock Futures Total 0.25
Index Futures Total 4.37
Cash & Other Receivables -5.74
Grand Total 100.00
(Previously known as SBI Magnum In Fund)dex
^Investors should consult their financial advisers if in doubt about whether the product is suitable for them.
Record Date Dividend NAV ( )`(in /Unit)`
23-Mar-06 3.30 14.5541
28-Mar-05 3.80 15.0818
LAST DIVIDENDS Face value: 10`
Pursuant to payment of dividend, the NAV of Dividend Option ofscheme/plans would fall to the extent of payout and statutory levy, ifapplicable.
Large Cap Cash & Other Current Assets
95.58
4.42

4.795.75
3.10
3.26
14.40
68.70
NCA (Incl. Cash, Deposits) SOV, AAA, AA+ and Equivalent
Large Cap Midcap Small Cap Below AA+
Month
End
AU
M (
Rs. in
Cro
res)
`19,4
44.5
3 C
rore
s`1
24
.21
Cro
res
`1
,64
0.5
2 C
rore
s`3
24
.76
Cro
res
`5
7.7
8 C
rore
s`1
,15
7.9
6 C
rore
s
Sta
nd
ard
Devia
tion
#
Beta
#
Sharp
e R
ati
o#
Exp
ense R
ati
oRegula
r-1.9
7%
Dir
ect-
1.2
7%
Regula
r-2
.42
%D
irect-
1.4
8%
Regula
r-1
.88
%D
irect-
1.3
1%
Regula
r-2
.28
%D
irect-
1.6
8%
Regula
r-2
.45
%D
irect-
1.7
5%
Regula
r-2
.02
%D
irect-
0.6
2%
Fu
nd
Deta
ils a
s o
n 2
9 D
ecem
ber
2017
4.4
7
6.5
5
7.6
5
9.7
1%
0.9
6
0.6
2
- - -
- - -
- - -
- - -
- - -
- - -
3.8
7
6.0
3
7.6
1
0.4
8
0.5
6
6.9
9
0.6
7
0.8
6
7.7
5
- - -
Schem
e N
am
eSBI
Magnum
Bala
nced
Fund
SBI
Dynam
ic A
sset
Allocati
on F
und
SBI
Magnum
Month
ly I
ncom
e P
lan*
SBI
Magnum
Month
lyIn
com
e P
lan
–Flo
ate
r*SBI
Magnum
Child
ren's
Benefi
t Pla
nSBI
Eq
uit
ySavin
gs F
und
Ideal In
vestm
ent
Hori
zon
3years
+3
years
+2
years
+2
years
+3
years
+1
year
Incep
tion D
ate
31/12/1995
26
/0
3/2
01
50
9/0
4/2
00
12
1/1
2/2
00
52
1/0
2/2
00
22
7/0
5/2
01
5
Fund
Manag
er
Mr.
R.
Sri
niv
asan -
Equit
yM
r. D
inesh A
huja
- D
ebt
Mr.
Din
esh B
ala
chandra
n- E
quit
y &
Equit
y r
ela
ted instr
um
ents
& D
ebt
and M
oney M
ark
et
Instr
um
ents
port
ion- M
r. M
ohit
Jain
-in
vestm
ents
in f
ore
ign s
ecuri
ties o
fth
e S
chem
e.
Mr.
Ruchit
Mehta
-Equit
yM
r. D
inesh A
huja
-D
ebt
Mr.
Ruchit
Mehta
-Equit
yM
r. D
inesh A
huja
-D
ebt
Mr.
Raje
ev
Radhakri
shnan
Mr.
Neera
j K
um
ar
-A
rbit
rage P
ort
ion
Mr.
Ruchit
Mehta
-Equit
y, D
ebt
Manag
ing
Sin
ce
Jan-2012
Mar-
20
15
July
-2
01
1Ju
ly-2
01
1Ju
n-2
00
8M
ay-2
01
5
Benchm
ark
CRIS
IL B
ala
nced F
und -
Aggre
ssiv
eIn
dex
50
% C
risil 1
year
CD
Index +
50
%BSE S
&P S
ensex
CR
ISIL
MIP
Ble
nded F
und
Index
CR
ISIL
MIP
Ble
nded Index
CR
ISIL
MIP
Ble
nded F
und
Index
30
% N
ifty
50
+ 7
0%
Cri
sil L
iquid
Fund Index
Co
mp
osit
ion
by R
ati
ng
s &
Assets
as o
n 2
9 D
ecem
ber
2017
Exit
Load
For
10%
of
the investm
ents
wit
hin
1Year
–N
il;
For
the r
em
ain
ing investm
ents
-1.0
0%
Wit
hin
1 y
ear
- 1
.00
%For
10%
of
the
investm
ents
wit
hin
1Year
–N
il;For
the
rem
ain
ing
investm
ents
-1.0
0%
For10%
ofth
ein
vest
ments
within
1Year–
Nil;Forth
ere
main
ing
invest
ments
-1.0
0%
Wit
hin
1 y
ear
- 3
%;
Wit
hin
2 y
ears
- 2
%;
Wit
hin
3 y
ears
- 1
%
For
9%
of
the
investm
ents
wit
hin
1Year
–N
il;For
the
rem
ain
ing
investm
ents
-1.0
0%
Larg
e C
ap
Mid
Cap
Futu
res
Sm
all C
ap
Belo
w A
A+
NC
A (
INC
L. C
ASH
, D
EPO
SIT
S)
SO
V, A
AA
, A
A+
and
Eq
uiv
ale
nt
Oth
er
Deta
ils
Co
mp
osit
ion
by
Assets
as o
n 2
9 D
ecem
ber
2017
Eq
uit
y S
hare
s
Corp
ora
te D
eb
t
Gilts
Money M
ark
et
Instr
um
ents
Oth
er
Assets
68.5
5
8.1
2
11.2
8
4.2
7
7.7
8
93
.94
- - -
6.0
6
15
.03
46
.54
18
.86
-
19
.57
14
.94
3.0
2
3.0
9
63
.58
15
.37
22
.15
34
.05
- -
43
.80
68
.02
18
.44
-
1.2
9
12
.25
37.0
3
31.6
3
3.1
0
1.4
0
4.6
4
2.8
9
19.3
1
8.4
2
2.4
9
- - -
89
.09
-
15
.98
66
.83
-
12
.32
16
.41
-5
3.7
1
42
.17
56
.49
31
.33
-
8.7
3
2.6
5
-6
6.5
6
67
.36
6.0
9
14
.08
-
1.9
7
28
.88
43
.80
5.1
8
7.9
6
2.8
5
-
21
.48
11
.94
49
.27
6.5
0
Ple
ase
consu
lt y
our
financia
l advis
or
befo
re invest
ing.
For
deta
ils,
ple
ase
refe
r to
resp
ecti
ve p
age o
f th
e s
chem
e.
*Month
ly Incom
e is
not
ass
ure
d a
nd is
subje
ct
to t
he a
vailabilit
y o
f dis
trib
uta
ble
surp
lus.
Sourc
e: C
RIS
IL F
und A
naly
ser
Ris
k F
ree r
ate
: FBIL
Overn
ight
Mib
or
rate
()
Basi
s fo
r R
ati
o C
alc
ula
tion:
3 Y
ears
Month
ly D
ata
Poin
ts#
6.2
0%
as
on 2
9th
Decem
ber
20
17
Mod
ifie
d D
ura
tion
Avera
ge M
atu
rity
Yie
ld t
o M
atu
rity
(%
)(years
)
(years
)
Snap
shot
of
Hyb
rid
Fund
s
28

29
HYBRID
Option NAV ( )`
Reg-Plan-Dividend 29.9413
Reg-Plan-Growth 128.3991
Dir-Plan-Dividend 43.2706
Dir-Plan-Growth 134.3917
NET ASSET VALUE
Record Date Dividend Nav ( )`(in /Unit)`
29-Dec-17 (Reg Plan) 0.67 29.9413
29-Dec-17 (Dir Plan) 0.97 43.2706
29-Sep-17 (Reg Plan) 0.65 28.0809
29-Sep-17 (Dir Plan) 0.90 40.4782
30-Jun-17 (Reg Plan) 0.60 27.7410
30-Jun-17 (Dir Plan) 0.85 39.8462
LAST DIVIDENDS
Investors understand that their principal
will be at Moderately High risk
�
�
Long term capital appreciation.
Investment in a mix of debt and equity through stocks of high growth companies and relatively safeportfolio of debt to provide both long term capital appreciation and liquidity.
SBI Magnum Balanced FundThis product is suitable for investors who are seeking^:
Face value: 10`
Investment Objective
Quantitative Data
To provide investors long term capitalappreciation along with the liquidity of anopen-ended scheme by investing in a mixof debt and equity. The scheme will investin a diversified portfolio of equities ofhigh growth companies and balance therisk through investing the rest in arelatively safe portfolio of debt.
Fund Details
Standard Deviation :
Beta :
Sharpe Ratio :
#
#
#
9.71%
0.96
0.62
4.47Modified Duration :
Average Maturity :
Yield to Maturity :
years
6.55 years
7.65%#Source: CRISIL Fund Analyser
Risk Free rate: FBIL Overnight Mibor rate(6.20% as on 29th December 2017) Basis forRatio Calculation: 3 Years Monthly DataPoints
PORTFOLIO
HDFC Bank Ltd. 6.82Bharti Airtel Ltd. 3.86State Bank Of India 3.71ICICI Bank Ltd. 3.46Kotak Mahindra Bank Ltd. 2.79Divi's Laboratories Ltd. 2.52Interglobe Aviation Ltd. 2.51Tata Consultancy Services Ltd. 2.39Sundaram Clayton Ltd. 1.97Gruh Finance Ltd. 1.83Motherson Sumi Systems Ltd. 1.51Eclerx Services Ltd. 1.48AU Small Finance Bank Ltd. 1.47Sundaram Finance Ltd. 1.47AIA Engineering Ltd. 1.45Bharti Infratel Ltd. 1.38Reliance Industries Ltd. 1.34Colgate Palmolive (India) Ltd. 1.34HCL Technologies Ltd. 1.20Bajaj Finance Ltd. 1.19Solar Industries India Ltd. 1.17ERIS Lifesciences Ltd. 1.12Info Edge (India) Ltd. 1.11Ajanta Pharma Ltd. 1.05Procter & Gamble Hygiene AndHealth Care Ltd. 1.033M India Ltd. 1.00Gillette India Ltd. 0.99Adani Ports And Special Economic Zone Ltd. 0.93Bajaj Holdings & Investment Ltd. 0.88Grindwell Norton Ltd. 0.83Thermax Ltd. 0.82NLC India Ltd. 0.80The Great Eastern Shipping Company Ltd. 0.79Graphite India Ltd. 0.78Dr. Lal Path Labs Ltd. 0.74Westlife Development Ltd. 0.69SJVN Ltd. 0.68Infosys Ltd. 0.67Hindustan Zinc Ltd. 0.64Allcargo Logistics Ltd. 0.63Sun Pharmaceutical Industries Ltd. 0.63National Aluminium Company Ltd. 0.54Equitas Holdings Ltd. 0.54GE T&D India Ltd. 0.53IRB Infrastructure Developers Ltd. 0.50Apollo Hospitals Enterprise Ltd. 0.50Bharat Heavy Electricals Ltd. 0.43Navkar Corporation Ltd. 0.39Goodyear India Ltd. 0.33Aurobindo Pharma Ltd. 0.27Precision Camshafts Ltd. 0.25Accelya Kale Solutions Ltd. 0.20ELGI Equipments Ltd. 0.18UFO Moviez India Ltd. 0.15Adlabs Entertainment Ltd. 0.06Prataap Snacks Ltd. 0.02Motor Industries Co. Ltd. 0.001
Numero Uno International Ltd. -
L&T Metro Rail (Hyderabad) Ltd. [ICRA]AAA 0.73Cholamandalam Investment AndFinance Company Ltd. [ICRA]AA 0.56AU Small Finance Bank Ltd. IND A+ 0.52Reliance Home Finance Ltd. BWR AA+ 0.52HDFC Credila Financial Services Pvt. Ltd. CRISIL AAA 0.52Manappuram Finance Ltd. CARE AA 0.41Tata Motors Ltd. [ICRA]AA 0.34Century Textiles & Industries Ltd. CRISIL AA- 0.31Repco Home Finance Ltd. [ICRA]AA- 0.29Rural Electrification Corporation Ltd. CRISIL AAA 0.29Equitas Small Finance Bank Ltd. IND A+ 0.26Equitas Small Finance Bank Ltd. CARE A+ 0.26Indian Railway Finance Corporation Ltd. CRISIL AAA 0.26United Bank Of India CRISIL AA- 0.20National Highways Authority Of India CRISIL AAA 0.19Tata Chemicals Ltd. BWR AA+ 0.13Forbes & Company Ltd. [ICRA]AA- 0.13SEI Baskara Power Pvt. Ltd. CARE AA-(SO) 0.12Elena Renewable Energy Pvt. Ltd. CARE AA-(SO) 0.12Pratyash Renewable Pvt. Ltd. CARE AA-(SO) 0.12SEI Enerstar Renewable Energy Pvt. Ltd. CARE AA-(SO) 0.12SEI Mihir Energy Pvt. Ltd. CARE AA-(SO) 0.12Shreyas Renewable Energy Pvt. Ltd. CARE AA-(SO) 0.12Aarish Solar Power Pvt. Ltd. CARE AA-(SO) 0.12Divyesh Power Pvt. Ltd. CARE AA-(SO) 0.12Aashman Energy Pvt. Ltd. CARE AA-(SO) 0.12Zuvan Energy Pvt. Ltd. CARE AA-(SO) 0.12National Housing Bank CRISIL AAA 0.11NABARD CRISIL AAA 0.10Janalakshmi Financial Services Ltd. [ICRA]A- 0.08Housing Development FinanceCorporation Ltd. CRISIL AAA 0.05IFCI Ltd. [ICRA]A- 0.05Power Finance Corporation Ltd. CRISIL AAA 0.02Blue Dart Express Ltd. [ICRA]AA 0.01
SVL Ltd. [ICRA]AA 0.55
Reliance Capital Ltd. BWR A1+ 2.33Power Finance Corporation Ltd. CRISIL A1+ 1.82
NABARD CRISIL A1+ 0.13
Government Of India SOVEREIGN 11.28
State Government Of Tamil Nadu SOVEREIGN 0.26State Government Of Madhya Pradesh SOVEREIGN 0.07
HDFC Bank Ltd. 0.52
Equity Shares Total 68.55
Non Convertible Debentures Total 7.57
Zero Coupon Bonds Total 0.55
Commercial Papers Total 4.15
Certificate Of Deposits Total 0.13
Government Securities Total 11.28
State Development Loans Total 0.33
Margin Fixed Deposits Total 0.52CBLO 6.14Stock Futures Total 1.64Index Futures Total 1.47Cash & Other Receivables -2.31Grand Total 100.00
PORTFOLIO CLASSIFICATION BYASSET CLASS / RATING CLASS (%)
Financial Services 33.48Sovereign 11.60Services 7.74IT 7.05Pharma 5.58Telecom 5.24Industrial Manufacturing 5.13Automobile 4.41Energy 4.05Consumer Goods 3.38Futures 3.11Chemicals 1.30Healthcare Services 1.23Metals 1.19Construction 0.69Margin Fixed Deposits 0.52Cement & Cement Products 0.31Media And Entertainment 0.15CBLO 6.14Cash and Other Receivables -2.31
Pursuant to payment of dividend, the NAV of Dividend Option ofscheme/plans would fall to the extent of payout and statutory levy, ifapplicable.
•
•
•
•
•
•
•
•
•
•
•
•
•
•
Type of Scheme
Date of Allotment:
Report As On:
AAUM for the Month of December 2017
AUM as on December 29, 2017
Fund Managers:Mr. R. Srinivasan -EquityMr. Dinesh Ahuja -DebtManaging Since:Total Experience:Mr. R. Srinivasan -Mr. Dinesh Ahuja -
Benchmark:
Exit Load:
Entry Load:
Plans Available:
Options:
SIP
Minimum Investment
Additional Investment
An Open - Ended Balanced Scheme
31/12/1995
29/12/2017
18,710.85C rores
19,444.53 Crores
Jan-2012
Over 24 yearsOver 19 years
CRISIL Balanced Fund -Aggressive Index
For exit within 12 months from the dateof allotment:For 10% of investment - NilFor remaining investments - 1.00%;For exit after 12 months from the dateof allotment - Nil.
N.A.
Regular, Direct
Growth, Dividend
Weekly - Minimum 1000 & in multiplesof 1 thereafter for a minimum of 6instalments.Monthly - Minimum 1000 & inmultiples of 1 thereafter for minimumsix months (or) minimum 500 & inmultiples of 1 thereafter for minimumone yearQuarterly - Minimum 1500 & inmultiples of 1 thereafter for minimumone year.
1000 & in multiples of 1
1000 & in multiples of 1
`
`
`
`
`
`
`
`
`
`
` `
` `
PORTFOLIO CLASSIFICATION BY
INDUSTRY ALLOCATION (%)
Issuer Name (%) Of Total AUM Issuer Name (%) Of Total AUM
^Investors should consult their financial advisers if in doubt about whether the product is suitable for them.
NCA (Incl. Cash, Deposits) SOV, AAA, and EquivalentAA+,
Large Cap Midcap Small Cap Below AA+ Futures
37.03
31.63
3.10
1.40
4.64
2.89
19.31

30
HYBRID
Option NAV ( )`
Reg-Plan-Dividend 12.1258
Reg-Plan-Growth 12.1260
Dir-Plan-Dividend 12.2794
Dir-Plan-Growth 12.2873
NET ASSET VALUE
Investors understand that their principal
will be at Moderately High risk
�
�
Income and capital appreciation.
Dynamic Asset allocation between equity related Instruments and fixed income instruments so asto provide with long term capital appreciation.
SBI Dynamic Asset Allocation FundThis product is suitable for investors who are seeking^:
Investment Objective
The objective of the fund will be toprovide investors with an opportunity toinvest in a portfolio of a mix of equity andequity related securities and fixed incomeinstruments.The allocation between fixed income andequity instruments will be manageddynamically so as to provide investorswith long term capital appreciation.However, there can be no assurance thatthe investment objective of the Schemewill be achieved.
Fund Details
PORTFOLIO
HDFC Bank Ltd. 10.05
Reliance Industries Ltd. 8.77
HDFC Ltd. 7.97
ITC Ltd. 6.57
Infosys Ltd. 6.05
ICICI Bank Ltd. 5.95
Larsen & Toubro Ltd. 4.41
Tata Consultancy Services Ltd. 4.08
Maruti Suzuki India Ltd. 3.77
Kotak Mahindra Bank Ltd. 3.44
State Bank Of India 3.23
Axis Bank Ltd. 2.88
Hindustan Unilever Ltd. 2.83
Tata Motors Ltd. 2.77
Mahindra & Mahindra Ltd. 2.03
Bharti Airtel Ltd. 1.93
Sun Pharmaceutical Industries Ltd. 1.80
Oil & Natural Gas Corporation Ltd. 1.53
Asian Paints Ltd. 1.52
Tata Steel Ltd. 1.43
Hero Motocorp Ltd. 1.42
NTPC Ltd. 1.38
Power Grid Corporation Of India Ltd. 1.34
Bajaj Auto Ltd. 1.32
Wipro Ltd. 1.15
Adani Ports And Special Economic Zone Ltd. 1.00
Coal India Ltd. 0.95
Cipla Ltd. 0.92
Dr. Reddy'S Laboratories Ltd. 0.85
Lupin Ltd. 0.60
Axis Bank Ltd. 3.19
Allahabad Bank 2.20
Equity Shares Total 93.94
Margin Fixed Deposits Total 5.39
CBLO 0.37
Cash & Other Receivables 0.31
Grand Total 100.00
PORTFOLIO CLASSIFICATION BYASSET CLASS / RATING CLASS (%)
Financial Services 33.52
Energy 13.02
Automobile 11.31
IT 11.28
Consumer Goods 10.92
Margin Fixed Deposits 5.38
Construction 4.41
Pharma 4.18
Metals 2.37
Telecom 1.93
Services 1.00
CBLO 0.36
Cash and Other Receivables 0.31
•
•
•
•
•
•
•
•
•
•
•
•
•
•
Type of Scheme
Date of Allotment:
Report As On:
AAUM for the Month of December 2017
AUM as on December 29, 2017
Fund Manager:
Mr. Dinesh Balachandran
Mr. Mohit Jain
Managing Since:
Total Experience:
Mr. Dinesh Balachandran
Mr. Mohit Jain
Benchmark:
Exit Load:
Entry Load:
Plans Available:
Options:
SIP
Minimum Investment
Additional Investment
An Open - Ended Dynamic Asset
Allocation Scheme
26/03/2015
29/12/2017
123.27 Crores
124.21 Crores
-Equity &
Equity related instruments & Debt and
Money Market Instruments portion-
- investments in foreign
securities of the Scheme. (w.e.f. Nov 28,
2017.)
Mar - 2015
Over 15 Years
Over 5 Years
50% Crisil 1 year CD Index +
50% BSE S&P Sensex
For exit within 12 months
from the date of allotment - 1.00%;
For exit after 12 months from the date of
allotment - Nil
N.A.
Regular, Direct
Growth, Dividend
Weekly - Minimum 1000 & in multiples
of 1 thereafter for a minimum of 6
instalments.
Monthly - Minimum 1000 & in multiples
of 1 thereafter for minimum six months
(or) minimum 500 & in multiples of 1
thereafter for minimum one year
Quarterly - Minimum 1500 & in
multiples of 1 thereafter for minimum
one year.
5000 & in multiples of 1
1000 & in multiples of 1
`
`
`
`
`
`
` `
`
`
` `
` `
PORTFOLIO CLASSIFICATION BY
INDUSTRY ALLOCATION (%)
Issuer Name (%) Of Total AUMIssuer Name (%) Of Total AUM
^Investors should consult their financial advisers if in doubt about whether the product is suitable for them.
8.422.49
89.09
Large Cap NCA (Incl. Cash, Deposits) Midcap

31
HYBRID
Option NAV ( )` Option NAV ( )`
Reg-Plan-Growth 38.2971
Reg-Plan-Monthly Dividend 12.9280
Reg-Plan-Quarterly Dividend 12.3923
Reg-Plan-Annual Dividend 15.0992
Dir-Plan-Growth 39.9714
Dir-Plan-Monthly Dividend 15.7855
Dir-Plan-Quarterly Dividend 13.6258
Dir-Plan-Annual Dividend 17.5090
NET ASSET VALUE
Investors understand that their principal
will be at Moderate risk
�
�
Long term capital appreciation and current income
Investment in equity and equity related instruments as well as fixed income securities (debt andmoney market securities).
SBI Magnum Monthly Income Plan*This product is suitable for investors who are seeking^:
Investment Objective
Quantitative Data
To provide regular income, liquidity andattractive returns to the investorsthrough an actively managed portfolio ofdebt, equity and money marketinstruments. Income may be generatedthrough the receipt of coupon payments,the amortization of the discount on thedebt instruments, receipt of dividends orpurchase and sale of securities in theunderlying portfolio.
Fund Details
Modified Duration :
Average Maturity :
Yield to Maturity :
3.87
6.03 years
7.61%
years
PORTFOLIO CLASSIFICATION BYASSET CLASS / RATING CLASS (%)
Financial Services 28.80
Sovereign 19.29
Energy 12.08
Metals 5.05
Services 4.43
Consumer Goods 3.89
Construction 2.32
Automobile 1.48
Cement & Cement Products 1.37
Textiles 0.74
Telecom 0.71
Fertilisers & Pesticides 0.37
Pharma 0.31
CBLO 12.00
Cash and Other Receivables 7.14
•
•
•
•
•
•
•
•
•
•
•
•
•
•
•
Type of Scheme
Date of Allotment:
Report As On:
AAUM for the Month of December
2017
AUM as on December 29, 2017
Fund Managers:
Mr. Ruchit Mehta Equity
Mr. Dinesh Ahuja Debt
Managing Since:
Total Experience
Mr. Ruchit Mehta
Mr. Dinesh Ahuja
Benchmark:
Exit Load:
Entry Load:
Plans Available:
Options:
SIP
Minimum Investment
Additional Investment
An Open - Ended Debt Scheme
09/04/2001
29/12/2017
1,625.12 Crores
1,640.52 Crores
-
-
July-2011
- Over 13 years
- Over 19 years
CRISIL MIP Blended Fund Index
For exit within 1 year from
the date of allotment For 10% of
investment : Nil
For remaining investment: 1.00%
For exit after one year from the date of
allotment – Nil
N.A.
Regular, Direct
Growth, Dividend
Weekly - Minimum 1000 & in multiples
of 1 thereafter for a minimum of 6
instalments.
Monthly - Minimum 1000 & in
multiples of 1 thereafter for minimum
six months (or) minimum 500 & in
multiples of 1 thereafter for minimum
one year
Quarterly - Minimum 1500 & in
multiples of 1 thereafter for minimum
one year.
5,000 & in multiples of 1
1,000 & in multiples of 1
`
`
`
`
`
`
`
`
`
`
` `
` `
PORTFOLIO CLASSIFICATION BY
INDUSTRY ALLOCATION (%)
PORTFOLIO
HDFC Bank Ltd. 1.02
Titan Company Ltd. 0.89
Interglobe Aviation Ltd. 0.77
Indian Terrain Fashions Ltd. 0.74
Greenply Industries Ltd. 0.74
The Ramco Cements Ltd. 0.73
Maruti Suzuki India Ltd. 0.71
Bharti Airtel Ltd. 0.71
Prataap Snacks Ltd. 0.69
ACC Ltd. 0.64
ITD Cementation India Ltd. 0.53
Kotak Mahindra Bank Ltd. 0.52
Procter & Gamble Hygiene And Health Care Ltd. 0.52
Indraprastha Gas Ltd. 0.51
Mahindra & Mahindra Financial Services Ltd. 0.49
Motherson Sumi Systems Ltd. 0.49
Shriram Transport Finance Company Ltd. 0.48
Sheela Foam Ltd. 0.45
Hindustan Petroleum Corporation Ltd. 0.43
UPL Ltd. 0.37
Mas Financial Services Ltd. 0.33
Kansai Nerolac Paints Ltd. 0.32
Petronet LNG Ltd. 0.31
Aurobindo Pharma Ltd. 0.31
SREI Infrastructure Finance Ltd. 0.31
Britannia Industries Ltd. 0.29
Tata Motors Ltd. 0.28
Bajaj Finance Ltd. 0.27
Repco Home Finance Ltd. 0.17
Reliance Industries Ltd. CRISIL AAA 6.00
Hindalco Industries Ltd. CRISIL AA 5.05
Indian Railway FinanceCorporation Ltd. CRISIL AAA 4.89
HDFC Credila FinancialServices Pvt. Ltd. CRISIL AAA 3.04
Equity Shares Total 15.03
Muthoot Finance Ltd. CRISIL AA 2.45
Reliance Home Finance Ltd. BWR AA+ 2.13
Power Finance Corporation Ltd. CRISIL AAA 2.13
Manappuram Finance Ltd. CARE AA 1.86
L&T Metro Rail (Hyderabad) Ltd. [ICRA]AAA 1.84
Tata Realty And Infrastructure Ltd. CRISIL AA 1.79
AU Small Finance Bank Ltd. IND A+ 1.55
HDFC Ltd. CRISIL AAA 1.53
Equitas Small Finance Bank Ltd. CARE A+ 1.23
Rural ElectrificationCorporation Ltd. CRISIL AAA 1.23
NABARD CRISIL AAA 1.21
Oriental Hotels Ltd. CARE A+ 1.21
Indiabulls Housing Finance Ltd. BWR AAA 1.06
Janalakshmi Financial Services Ltd. [ICRA]A- 0.91
Vadodara Bharuch Tollway Ltd. IND A 0.60
Aashman Energy Pvt. Ltd. CARE AA-(SO) 0.48
SEI Mihir Energy Pvt. Ltd. CARE AA-(SO) 0.48
Zuvan Energy Pvt. Ltd. CARE AA-(SO) 0.48
Aarish Solar Power Pvt. Ltd. CARE AA-(SO) 0.48
Shreyas Renewable Energy Pvt. Ltd. CARE AA-(SO) 0.48
Pratyash Renewable Pvt. Ltd. CARE AA-(SO) 0.48
Divyesh Power Pvt. Ltd. CARE AA-(SO) 0.48
SEI Baskara Power Pvt. Ltd. CARE AA-(SO) 0.48
Elena Renewable Energy Pvt. Ltd. CARE AA-(SO) 0.48
SEI Enerstar RenewableEnergy Pvt. Ltd. CARE AA-(SO) 0.48
Government Of India SOVEREIGN 18.86
State Government Of Tamil Nadu SOVEREIGN 0.43
Non Convertible Debentures Total 46.54
Government Securities Total 18.86
State Development Loans Total 0.43
CBLO 12.00
Cash & Other Receivables 7.14
Grand Total 100.00
Issuer Name Rating (%) Of TotalAUM
Issuer Name Rating (%) Of TotalAUM
^Investors should consult their financial advisers if in doubt about whether the product is suitable for them.
NCA (Incl. Cash, Deposits) SOV, AAA, and EquivalentAA+,
Large Cap Midcap Small Cap Below AA+
15.98
66.83
12.3216.41
-53.71
42.17

23.15
14.16
29.09
17.75
15.86
32
HYBRID
Option NAV ( )` Option NAV ( )`
Reg-Plan-Growth 25.9348
Reg-Plan-Monthly Dividend 12.7066
Reg-Plan-Quarterly Dividend 12.7267
Reg-Plan-Annual Dividend 16.2476
Dir-Plan-Growth 26.9131
Dir-Plan-Monthly Dividend 13.1798
Dir-Plan-Quarterly Dividend 13.9277
Dir-Plan-Annual Dividend 16.9057
NET ASSET VALUE
�
�
Long term capital appreciation and current income
Investment in equity and equity related instruments as well as fixed income securities (debt andmoney market securities).
SBI Magnum Monthly Income Plan – Floater*This product is suitable for investors who are seeking^:
Investment Objective
Quantitative Data
To provide regular income, liquidity andattractive returns to investors in additionto mitigating the impact of interest raterisk through an actively managedportfolio of floating rate and fixed ratedebt instruments, equity, money marketinstruments and derivatives.
Fund Details
Modified Duration :
Average Maturity :
Yield to Maturity :
0.48
0.56 years
6.99%
years
PORTFOLIO CLASSIFICATION BYASSET CLASS / RATING CLASS (%)
Financial Services 51.26
Construction 10.62
Sovereign 7.32
Telecom 6.08
Consumer Goods 3.59
Cement & Cement Products 1.30
Energy 1.11
Textiles 1.06
Pharma 0.82
Chemicals 0.78
Automobile 0.75
Services 0.37
CBLO 15.58
Cash and Other Receivables -0.63
•
•
•
•
•
•
•
•
•
•
•
•
•
•
Type of Scheme
Date of Allotment:
Report As On:
AAUM for the Month of December 2017
AUM as on December 29, 2017
Fund Managers:
Mr. Ruchit Mehta Equity
Mr. Dinesh Ahuja Debt
Managing Since:
Total Experience
Mr. Ruchit Mehta
Mr. Dinesh Ahuja
Benchmark:
Exit Load:
Entry Load:
Plans Available:
Options:
SIP
Minimum Investment
Additional Investment
An Open - Ended Debt Scheme
21/12/2005
29/12/2017
314.28 Crores
324.76 Crores
-
-
July-2011
- Over 13 years
- Over 19 years
CRISIL MIP Blended Fund Index
For exit within 12 months
from the date of allotment
For 10% of investments : Nil
For remaining investment: 1.00%
For exit after 12 months from the date of
allotment – Nil
N.A.
Regular, Direct
Growth, Dividend
Weekly - Minimum 1000 & in multiples
of 1 thereafter for a minimum of 6
instalments.
Monthly - Minimum 1000 & in multiples
of 1 thereafter for minimum six months
(or) minimum 500 & in multiples of 1
thereafter for minimum one year.
Quarterly - Minimum 1500 & in
multiples of 1 thereafter for minimum
one year.
5,000 & in multiples of 1
1,000 & in multiples of 1
`
`
`
`
`
`
` `
`
`
` `
` `
PORTFOLIO CLASSIFICATION BY
INDUSTRY ALLOCATION (%)
PORTFOLIO
Dixon Technologies (India) Ltd. 1.42
Titan Company Ltd. 0.98
Shriram Transport Finance Company Ltd. 0.91
ITD Cementation India Ltd. 0.84
Alkem Laboratories Ltd. 0.82
PNC Infratech Ltd. 0.79
Atul Ltd. 0.78
LT Foods Ltd. 0.75
Maruti Suzuki India Ltd. 0.75
AU Small Finance Bank Ltd. 0.74
The Ramco Cements Ltd. 0.69
Indian Terrain Fashions Ltd. 0.66
Kotak Mahindra Bank Ltd. 0.62
Star Cement Ltd. 0.61
Petronet LNG Ltd. 0.60
Bajaj Finserv Ltd. 0.58
Punjab National Bank 0.53
Hindustan Petroleum Corporation Ltd. 0.51
Reliance Capital Ltd. 0.45
Radico Khaitan Ltd. 0.44
Ganesha Ecosphere Ltd. 0.40
Reliance Home Finance Ltd. 0.07
Manappuram Finance Ltd. CARE AA 1.57
Tata Realty & Infrastructure Ltd. CRISIL AA 0.62
Janalakshmi FinancialServices Ltd. [ICRA]A- 0.46
Equity Shares Total 14.94
L&T Metro Rail (Hyderabad) Ltd. [ICRA]AAA 0.37
Shapoorji Pallonji And CompanyPrivate Ltd. [ICRA]A1+ 8.37
STCI Finance Ltd. CRISIL A1+ 7.59
Indus Towers Ltd. CRISIL A1+ 6.08
Kotak Mahindra Investments Ltd. CRISIL A1+ 4.55
TGS Investment & Trade Pvt. Ltd. [ICRA]A1+ 3.00
Reliance Capital Ltd. BWR A1+ 1.48
Indusind Bank Ltd. CRISIL A1+ 8.97
Axis Bank Ltd. CRISIL A1+ 7.53
NABARD CRISIL A1+ 6.12
Small Industries DevelopmentBank Of India CRISIL A1+ 6.09
Government Of India SOVEREIGN 3.09
State Government Of Tamil Nadu SOVEREIGN 0.42
323 Day T-Bill 13.03.18 SOVEREIGN 3.81
Non Convertible Debentures Total 3.02
Commercial Papers Total 31.07
Certificate Of Deposits Total 28.70
Government Securities Total 3.09
State Development Loans Total 0.42
Treasury Bills Total 3.81
CBLO 15.58
Cash & Other Receivables -0.63
Grand Total 100.00
Issuer Name Rating (%) Of TotalAUM
Issuer Name Rating (%) Of TotalAUM
^Investors should consult their financial advisers if in doubt about whether the product is suitable for them.
Investors understand that their principal
will be at Moderate risk
NCA (Incl. Cash, Deposits) SOV, AAA, AA+ and Equivalent
Large Cap Midcap Small Cap Below AA+
56.49
31.33
8.73
2.65-66.56
67.36

33
HYBRID
Option NAV ( )`
Reg-Plan-Growth 54.9858
Dir-Plan-Growth 57.2734
NET ASSET VALUE
Investors understand that their principal
will be at Moderately High risk
�
�
Long term capital appreciation and current income
Investment in equity and equity related instruments as well as fixed income securities (debt andmoney market securities).
SBI Magnum Children's Benefit PlanThis product is suitable for investors who are seeking^:
Investment Objective
Quantitative Data
To provide attractive returns to theMagnum holders / Unit holders by meansof capital appreciation through anactively managed portfolio of debt, equityand money market instruments. Incomegenerated through the receipt of couponpayments, the amortization of thediscount on the debt instruments, receiptof dividends or purchase and sale ofsecurities in the underlying portfolio, willbe reinvested.
Fund Details
Modified Duration :
Average Maturity :
Yield to Maturity :
0.67
0.86 years
7.75%
years
PORTFOLIO CLASSIFICATION BYASSET CLASS / RATING CLASS (%)
Financial Services 24.39
Construction 7.85
Consumer Goods 4.63
Metals 4.55
Industrial Manufacturing 4.12
Media And Entertainment 3.12
Pharma 1.76
Telecom 1.05
Services 0.93
Automobile 0.89
IT 0.86
Energy 0.84
Textiles 0.65
Cement & Cement Products 0.57
CBLO 42.07
Cash and Other Receivables 1.73
•
•
•
•
•
•
•
•
•
•
•
•
•
•
Type of Scheme
Date of Allotment:
Report As On:
AAUM for the Month of December
2017
AUM as on December 29, 2017
Fund Manager:
Mr. Rajeev RadhakrishnanManaging Since:Total Experience:
Benchmark:
Exit Load:
Entry Load:
Plans Available:
Options:
SIP
Minimum Investment
Additional Investment
An Open - Ended Income Scheme
21/02/2002
29/12/2017
56.79 Crores
57.78 Crores
Jun-2008Over 16 years
CRISIL MIP Blended Fund Index
Within 1 year :3%, Within 2 years :2%,Within 3 years :1%, above 3 years: NIL.
N.A
Regular, Direct
Growth,
Weekly - Minimum 1000 & inmultiples of 1 thereafter for aminimum of 6 instalments.Monthly - Minimum 1000 & inmultiples of 1 thereafter forminimum six months (or) minimum500 & in multiples of 1 thereafter forminimum one yearQuarterly - Minimum 1500 & inmultiples of 1 thereafter forminimum one year.
5,000 & in multiples of 1
1,000 & in multiples of 1
`
`
`
`
`
`
`
`
`
`
` `
` `
PORTFOLIO CLASSIFICATION BY
INDUSTRY ALLOCATION (%)
PORTFOLIO
Tata Global Beverages Ltd. 1.81
State Bank Of India 1.50
Dixon Technologies (India) Ltd. 1.31
Sadbhav Engineering Ltd. 1.17
Ahluwalia Contracts (India) Ltd. 1.12
PNC Infratech Ltd. 1.06
Bharti Airtel Ltd. 1.05
Thermax Ltd. 1.04
NCC LTD. 1.01
Blue Dart Express Ltd. 0.93
Bharat Heavy Electricals Ltd. 0.91
Divi's Laboratories Ltd. 0.90
Tata Motors Ltd. 0.89
Bharat Forge Ltd. 0.87
Infosys Ltd. 0.86
Gufic Biosciences Ltd. 0.86
GE T&D India Ltd. 0.84
Kalpataru Power Transmission Ltd. 0.84
Colgate Palmolive (India) Ltd. 0.74
VIP Industries Ltd. 0.68
Issuer Name Rating (%) Of TotalAUM
Issuer Name Rating (%) Of TotalAUM
The India Cements Ltd. 0.57
Raymond Ltd. 0.48
Grindwell Norton Ltd. 0.46
Page Industries Ltd. 0.18
United Breweries Ltd. 0.09
Janalakshmi FinancialServices Ltd. [ICRA]A- 6.05
Reliance Home Finance Ltd. BWR AA+ 5.17
Corporation Bank CRISIL A- 4.66
Hindalco Industries Ltd. CRISIL AA 4.55
Manappuram Finance Ltd. CARE AA 3.52
Floreat Investments Ltd. [ICRA]AA 3.50
Indostar Capital Finance Ltd. CARE AA- 3.49
Sharda Solvent Ltd. BWR AA- (SO) 3.12
Equity Shares Total 22.15
Non Convertible Debentures Total 34.05
CBLO 42.07
Cash & Other Receivables 1.73
Grand Total 100.00
^Investors should consult their financial advisers if in doubt about whether the product is suitable for them.
NCA (Incl. Cash, Deposits) SOV, AAA, and EquivalentAA+,
Large Cap Midcap Small Cap Below AA+
6.09
14.08
1.97
28.88
43.80
5.18

34
HYBRID
Investors understand that their principal
will be at Moderately High risk
�
�
Regular income & Capital appreciation.
To generate income by investing in arbitrage opportunities in the cash and derivatives segment ofthe equity market, and capital appreciation through a moderate exposure in equity.
SBI Equity Savings FundThis product is suitable for investors who are seeking^:
Investment Objective
The scheme aims to generate income byinvesting in arbitrage opportunities in thecash and derivatives segment of theequity market, and capital appreciationthrough a moderate exposure in equity.
Fund Details
PORTFOLIO CLASSIFICATION BYASSET CLASS / RATING CLASS (%)
Financial Services 28.31Consumer Goods 10.34Automobile 8.54Energy 8.41Metals 7.12Margin Fixed Deposits 4.41IT 4.35Services 4.24Construction 3.58Cement & Cement Products 3.34Pharma 3.11Telecom 2.14Healthcare Services 1.24Textiles 1.03Media And Entertainment 0.92Fertilisers & Pesticides 0.67Industrial Manufacturing 0.41Futures -17.12Cash and Other Receivables 22.84CBLO 2.12
•
•
•
•
•
•
•
•
•
•
•
•
•
•
Type of Scheme
Date of Allotment:
Report As On:
AAUM for the Month of December 2017
AUM as on December 29, 2017
Fund Manager:Mr. Neeraj Kumar -Mr. Ruchit Mehta -Managing Since:Total Experience:Mr. Neeraj Kumar -Mr. Ruchit Mehta -
Benchmark:
Exit Load:
Entry Load:
Plans Available:
Options:
SIP
Minimum Investment
Additional Investment
An Open-Ended Equity Scheme
27/05/2015
29/12/2017
1,106.46 Crores
1,157.96 Crores
Arbitrage portionEquity, Debt
May-2015
Over 20 yearsOver 13 years
30% Nifty 50 + 70% CrisilLiquid Fund Index.
For exit within 1 year from the date ofallotment:
- For 9% of the investments - Nil;
- For remaining investments – 1.00%
For exit after 1 year from the date ofallotment – Nil
N.A.
Regular, Direct
Growth, Dividend
Weekly - Minimum 1000 & in multiples
of 1 thereafter for a minimum of 6
instalments.Monthly - Minimum 1000 & in
multiples of 1 thereafter for minimum
6 months (or) minimum 500 & in
multiples of 1 thereafter for minimum
one yearQuarterly - Minimum 1500 & in
multiples of 1 thereafter for minimum
one year
1000 & in multiples of 1
1000 & in multiples of 1
`
`
`
`
`
`
`
`
`
`
` `
` `
PORTFOLIO CLASSIFICATION BY
INDUSTRY ALLOCATION (%)
PORTFOLIO
ITC Ltd. 2.36Reliance Industries Ltd. 2.20ICICI Bank Ltd. 2.07Maruti Suzuki India Ltd. 2.04Hindalco Industries Ltd. 2.01Housing Development Finance Corporation Ltd. 1.96Dewan Housing Finance Corporation Ltd. 1.95Tata Motors Ltd. 1.86Kotak Mahindra Bank Ltd. 1.61Hero Motocorp Ltd. 1.51Infosys Ltd. 1.49Bharti Airtel Ltd. 1.44Dixon Technologies (India) Ltd. 1.42State Bank Of India 1.33Fortis Healthcare Ltd. 1.24HCL Technologies Ltd. 1.18HDFC Bank Ltd. 1.14Larsen & Toubro Ltd. 1.11Aurobindo Pharma Ltd. 1.08LIC Housing Finance Ltd. 1.00Grasim Industries Ltd. 0.99JSW Steel Ltd. 0.98Tata Consultancy Services Ltd. 0.97ITD Cementation India Ltd. 0.94ACC Ltd. 0.93Motherson Sumi Systems Ltd. 0.89Hindustan Petroleum Corporation Ltd. 0.88Bajaj Finance Ltd. 0.85The Ramco Cements Ltd. 0.82Reliance Infrastructure Ltd. 0.79Indian Terrain Fashions Ltd. 0.78Hindustan Unilever Ltd. 0.70Axis Bank Ltd. 0.69Interglobe Aviation Ltd. 0.68Sun Pharmaceutical Industries Ltd. 0.67UPL Ltd. 0.67Greenply Industries Ltd. 0.64Muthoot Finance Ltd. 0.64Reliance Capital Ltd. 0.62Indusind Bank Ltd. 0.60Shriram Transport Finance Company Ltd. 0.55Gabriel India Ltd. 0.55LT Foods Ltd. 0.52TV Today Network Ltd. 0.52Petronet LNG Ltd. 0.51Mahindra & Mahindra Ltd. 0.50Ujjivan Financial Services Ltd. 0.50Tata Steel Ltd. 0.48Tata Communications Ltd. 0.46Vedanta Ltd. 0.44Apollo Tyres Ltd. 0.43Colgate Palmolive (India) Ltd. 0.43SREI Infrastructure Finance Ltd. 0.42Yes Bank Ltd. 0.42Suzlon Energy Ltd. 0.41Coal India Ltd. 0.40Oil & Natural Gas Corporation Ltd. 0.40Wockhardt Ltd. 0.39NTPC Ltd. 0.39Procter & Gamble Hygiene And Health Care Ltd. 0.38Manpasand Beverages Ltd. 0.38Asian Paints Ltd. 0.38Hindustan Zinc Ltd. 0.37Reliance Nippon Life Asset Management Ltd. 0.36Strides Shasun Ltd. 0.36
Stock Name (%) Of Total AUM Stock Name (%) Of Total AUMBajaj Auto Ltd. 0.33Ultratech Cement Ltd. 0.32Power Grid Corporation Of India Ltd. 0.32NIIT Technologies Ltd. 0.31United Breweries Ltd. 0.30Eicher Motors Ltd. 0.30Bharat Petroleum Corporation Ltd. 0.29Indian Oil Corporation Ltd. 0.29United Spirits Ltd. 0.29Indiabulls Housing Finance Ltd. 0.28Ganesha Ecosphere Ltd. 0.25Bajaj Finserv Ltd. 0.25Bharti Infratel Ltd. 0.24Dr. Reddy'S Laboratories Ltd. 0.23Gail (India) Ltd. 0.23Zee Entertainment Enterprises Ltd. 0.23Adani Ports And Special Economic Zone Ltd. 0.23Tech Mahindra Ltd. 0.23Cipla Ltd. 0.22Wipro Ltd. 0.18National Aluminium Company Ltd. 0.17Sun TV Network Ltd. 0.17Lupin Ltd. 0.15Jubilant Foodworks Ltd. 0.15The Federal Bank Ltd. 0.14Ambuja Cements Ltd. 0.14Bosch Ltd. 0.14The India Cements Ltd. 0.12DLF Ltd. 0.11IRB Infrastructure Developers Ltd. 0.10IDFC Ltd. 0.09Adani Enterprises Ltd. 0.09Balrampur Chini Mills Ltd. 0.06Multi Commodity Exchange Of India Ltd. 0.05Manappuram Finance Ltd. 0.03Century Textiles & Industries Ltd. 0.02Equitas Holdings Ltd. 0.01
Vedanta Ltd.(Preference Shares) 2.26
AU Small Finance Bank Ltd. 3.07Rural Electrification Corporation Ltd. 2.14Reliance Industries Ltd. 2.12Muthoot Finance Ltd. 1.56Indiabulls Housing Finance Ltd. 1.33Floreat Investments Ltd. 1.31Housing Development Finance Corporation Ltd. 0.87Equitas Small Finance Bank Ltd. 0.43Vadodara Bharuch Tollway Ltd. 0.43Blue Dart Express Ltd. 0.13LIC Housing Finance Ltd. 0.04
Essel Corporate Resources Pvt. Ltd. 2.68Aditya Birla Retail Ltd. 2.32
Capital First Ltd. 1.29
HDFC Bank Ltd. 3.37Axis Bank Ltd. 1.03
Equity Shares Total 65.75
Preference Shares Total 2.26
Non Convertible Debentures Total 13.44
Zero Coupon Bonds Total 5.00
Commercial Papers Total 1.29
Margin Fixed Deposits Total 4.41CBLO 2.12Stock Futures Total -17.12Cash & Other Receivables 22.84Grand Total 100.00
Option NAV ( )`
Reg-Plan-Growth 12.5691
Reg-Plan-Monthly Dividend 11.9379
Reg-Plan-Quarterly Dividend 12.3879
Dir-Plan-Growth 13.0981
Dir-Plan-Monthly Dividend 12.3179
Dir-Plan-Quarterly Dividend 12.9050
NET ASSET VALUE
^Investors should consult their financial advisers if in doubt about whether the product is suitable for them.
Record Date Dividend Nav ( )`(in /Unit)`
29-Dec-17 (Dir Plan) 0.07 12.3179
29-Dec-17 (Reg Plan) 0.07 11.9379
24-Nov-17 (Dir Plan) 0.06 12.1829
24-Nov-17 (Reg Plan) 0.06 11.8345
27-Oct-17 (Dir Plan) 0.07 12.1744
29-Sep-17 (Reg Plan) 0.07 11.6436
LAST DIVIDENDS Face value: 10`
Pursuant to payment of dividend, the NAV of Dividend Option ofscheme/plans would fall to the extent of payout and statutory levy, ifapplicable.
NCA (Incl. Cash, Deposits) SOV, AAA, AA+ and Equivalent
Large Cap Midcap Small Cap Below AA+
7.962.85
21.48
11.94
49.27
6.51

Co
mp
osit
ion
by R
ati
ng
s a
s o
n2
9 D
ec
em
be
r 2
01
7
Wit
hin
1 y
ear
- 1
.50
%N
ILN
IL
SO
V, A
AA
and
Eq
uiv
ale
nt
AA
+
Belo
w A
A+
NC
A
Oth
er
Deta
ils
Exit
Load
NIL
Fu
nd
Deta
ils a
s o
n2
9 D
ec
em
be
r 2
01
7
Month
End
AU
M (
Rs. in
Cro
res)
`3,1
21.0
4 C
rore
s`2
,20
6.5
9 C
rore
s`3
,89
1.7
2 C
rore
s`5
,00
4.2
1 C
rore
s`1
,56
3.7
0 C
rore
s`8
,40
7.6
4 C
rore
s`5
04
.65
Cro
res
Exp
ense R
ati
oRegula
r-1.0
1%
Dir
ect-
0.4
3%
Regula
r-1
.45
%D
irect-
0.6
0%
Regula
r-1
.71
%D
irect-
0.8
7%
Regula
r-1
.40
%D
irect-
0.7
0%
Regula
r-1
.20
%D
irect-
0.5
0%
Regula
r-0
.90
%D
irect-
0.3
0%
Regula
r-0
.71
%D
irect-
0.3
5%
Mod
ifie
d D
ura
tion
Avera
ge M
atu
rity
(years
)
(years
)
Yie
ld t
o M
atu
rity
(%)
4.6
6
7.4
1
6.9
1
3.7
4
4.8
9
7.8
8
3.5
8
5.2
6
6.6
7
2.1
7
2.7
9
8.7
1
2.2
9
3.0
0
8.0
5
2.0
1
2.1
9
7.6
4
1.6
3
2.0
1
6.5
1
Snap
shot
of
Fund
sD
eb
t
Schem
e N
am
eSBI
Magnum
Gilt
Fund
–Long T
erm
Pla
nSBI
Magnum
Incom
eFund
SBI
Dynam
ic B
ond
Fund
SBI
Corp
ora
te B
ond
Fund
(SBI M
IF -
Flo
ati
ng
Rate
Pla
n -
LTP r
estr
uctu
red a
sSBI C
orp
ora
te B
ond F
und
(w.e
.f July
17, 2014)
SBI
Regula
r Savin
gs
Fund
(Pre
vio
usly
know
n a
sSBI M
agnum
Incom
e P
lus
Fund -
Investm
ent)
SBI
Short
Term
Deb
t Fund
SBI
Magnum
Gilt
Fund
-Short
Term
Ideal In
vestm
ent
Hori
zon
3years
+3
years
+3
years
+2
years
+2
years
+1
year
+1
year
+
Incep
tion D
ate
30/12/2000
25
/1
1/1
99
80
9/0
2/2
00
41
7/0
7/2
01
41
2/1
1/2
00
32
7/7
/2
00
73
0/1
2/2
00
0
Fund
Manag
er
Mr.
Din
esh A
huja
Mr.
Din
esh A
huja
Mr.
Din
esh A
huja
Mr.
Lokesh
Mallya
&M
s.
Mansi Saje
ja
Mr.
Ruchit
Mehta
-Equit
y M
r. D
inesh
Ahuja
-D
ebt
Mr.
Raje
ev
Radhakri
shnan
Mr.
Din
esh A
huja
Manag
ing
Sin
ce
Jan-2011
Jan-2
01
1Ja
n-2
01
1Feb-2
01
7Ju
l-2
01
1Ju
n-2
00
8Ja
n-2
01
1
Benchm
ark
I-Sec L
i-BEX Index
CR
ISIL
Com
posit
e B
ond
Fund Index
CR
ISIL
Com
posit
e B
ond
Fund Index
CR
ISIL
Com
posit
e B
ond
Fund Index
CR
ISIL
MIP
Ble
nded
Index
CR
ISIL
Short
Term
Bond
Fund Index
I-Sec S
i-BEX Index
Co
mp
osit
ion
by
Assets
as o
n2
9 D
ec
em
be
r 2
01
7
Eq
uit
y S
hare
s
Corp
ora
te D
eb
t
Gilts
Money M
ark
et
Instr
um
ents
Oth
er
Assets
- -
62.7
5
-
37.2
5
-
55
.39
35
.98
-
8.6
3
-
18
.10
40
.67
8.9
4
32
.29
-
93
.75
- -
6.2
5
-
68
.75
10
.34
-
20
.91
-
88
.50
1.6
6
1.1
4
8.7
0
- -
22
.13
-
77
.87
66.0
0
- -
34.0
0
58
.60
6.6
3
27
.36
7.4
1
68
.17
- -
31
.83
19
.56
9.3
6
64
.78
6.3
0
31
.28
2.6
2
45
.16
20
.93
89
.17
5.0
7
1.7
0
4.0
6
42
.86
- -
57
.13
For
10
% o
f th
ein
vestm
ents
wit
hin
1Year
–N
il;
For
the
rem
ain
ing investm
ents
- 1
.00
%
For
10
% o
f th
ein
vestm
ents
1m
onth
–N
il;
For
the r
em
ain
ing
investm
ents
- 0
.25
%
wit
hin
For
8%
of
the investm
ents
1 Y
ear
–N
il;
For
the
rem
ain
ing investm
ents
- 3
.00%
For
8%
of
the investm
ents
aft
er
1 Y
ear
to 2
Years
–N
il;
For
the
rem
ain
ing investm
ents
- 1
.50%
For
8%
of
the investm
ents
aft
er
2 Y
ear
to 3
Years
–N
il;
For
the
rem
ain
ing investm
ents
- 0
.75%
wit
hin
Ple
ase
consu
lt y
our
financia
l advis
or
befo
re invest
ing.
For
deta
ils,
ple
ase
refe
r to
resp
ecti
ve p
age o
f th
e s
chem
e.
35

Co
mp
osit
ion
by R
ati
ng
s a
s o
n2
9 D
ec
em
be
r 2
01
7
Exit
Load
NIL
Wit
hin
3 b
usin
ess d
ays -
0.1
0%
NIL
NIL
NIL
NIL
SO
V, A
AA
and
Eq
uiv
ale
nt
AA
+
Belo
w A
A+
NC
A
Oth
er
Deta
ils
Fu
nd
Deta
ils a
s o
n2
9 D
ec
em
be
r 2
01
7
Month
End
AU
M (
Rs. in
Cro
res)
`10,8
77.0
5 C
rore
s`4
,10
7.0
1 C
rore
s`4
,00
1.2
0 C
rore
s`25
,69
9.5
9 C
rore
s`4
,87
3.4
1 C
rore
s`4
9.1
2 C
rore
s
Exp
ense R
ati
oRegula
r-0.4
2%
Dir
ect-
0.3
3%
Regula
r-1
.16
%D
irect-
0.5
4%
Regula
r-0
.80
%D
irect-
0.3
0%
Regula
r-0
.16
%D
irect-
0.1
0%
Regula
r-0
.21
%D
irect-
0.1
0%
Regula
r-0
.20
%D
irect-
0.1
0%
Mod
ifie
d D
ura
tion (
Avera
ge M
atu
rity
Yie
ld t
o M
atu
rity
years
)
years
)
(%)
(
0.5
2
0.5
6
7.1
7
0.6
0
0.6
6
7.7
6
0.6
0
0.6
6
7.4
1
0.1
3
0.1
3
6.5
8
0.1
0
0.1
0
6.5
6
0.0
03
0.0
03
6.0
0
Schem
e N
am
eSBI
Ult
ra S
hort
Term
Deb
t Fund
SBI
Savin
gs F
und
(Pre
vio
usly
know
n a
s S
BI M
IF -
FRP -
Savin
gs P
lus B
ond P
lan)
SBI
Tre
asury
Ad
vanta
ge
Fund
^SBI
Pre
mie
r Liq
uid
Fund
SBI
Magnum
Insta
cash
Fund
SBI
Magnum
Insta
cash
Fund
-Liq
uid
Flo
ate
r
Ideal In
vestm
ent
Hori
zon
3m
onth
s+
3m
onth
s+
3m
onth
s+
1day
+1
day
+1
day
+
Incep
tion D
ate
27/7/2007
19
/0
7/2
00
40
9/1
0/2
00
92
4/1
1/2
00
32
1/0
5/1
99
90
1/1
0/2
00
2
Fund
Manag
er
Mr.
Raje
ev
Radhakri
shnan
Mr.
R.
Aru
nM
r. R
aje
ev
Radhakri
shnan
Mr.
Raje
ev
Radhakri
shnan
Mr.
Raje
ev
Radhakri
shnan
Mr.
R. A
run
Manag
ing
Sin
ce
Jun-2008
Apr-
20
12
Nov-2
01
3M
ay-2
01
0M
ay-2
01
0A
pr-
20
12
Benchm
ark
CRIS
IL L
iquid
Fund Index
CR
ISIL
Liq
uid
Fund Index
CR
ISIL
1 Y
ear
CD
Index
CR
ISIL
Liq
uid
Fund Index
CR
ISIL
Liq
uid
Fund Index
CR
ISIL
Liq
uid
Fund Index
Co
mp
osit
ion
by
Assets
as o
n2
9 D
ec
em
be
r 2
01
7
Eq
uit
y S
hare
s
Corp
ora
te D
eb
t
Gilts
Money M
ark
et
Instr
um
ents
Oth
er
Assets
-
50.7
2
-
45.8
9
3.3
9
-
73
.35
-
21
.61
5.0
4
-
58
.64
-
51
.38
-1
0.0
2
- - -
10
0.6
5
-0
.65
-
2.0
5
-
95
.68
2.2
7
- - - -
10
0.0
0
84.8
5
6.9
8
5.8
2
2.3
5
54
.78
7.7
0
33
.27
4.2
6
88
.51
5.6
1
15
.71
-9
.83
10
0.6
6
- -
-0
.66
97
.75
- -
2.2
5
- - -
10
0.0
0
Snap
shot
of
Deb
t Fund
s
^Purs
uant
to a
cquis
itio
n o
f D
aiw
aTre
asury
Advanta
ge F
und,
(DT
AF)
from
Daiw
aM
utu
al Fund,
w.e
.f N
ovem
ber
16
, 2
01
3 t
he n
am
e o
f th
e s
chem
e w
as c
hanged t
o S
BI T
reasury
Advanta
ge F
und.
Ple
ase
consu
lt y
our
financia
l advis
or
befo
re invest
ing.
For
deta
ils,
ple
ase
refe
r to
resp
ecti
ve p
age o
f th
e s
chem
e.
35
36
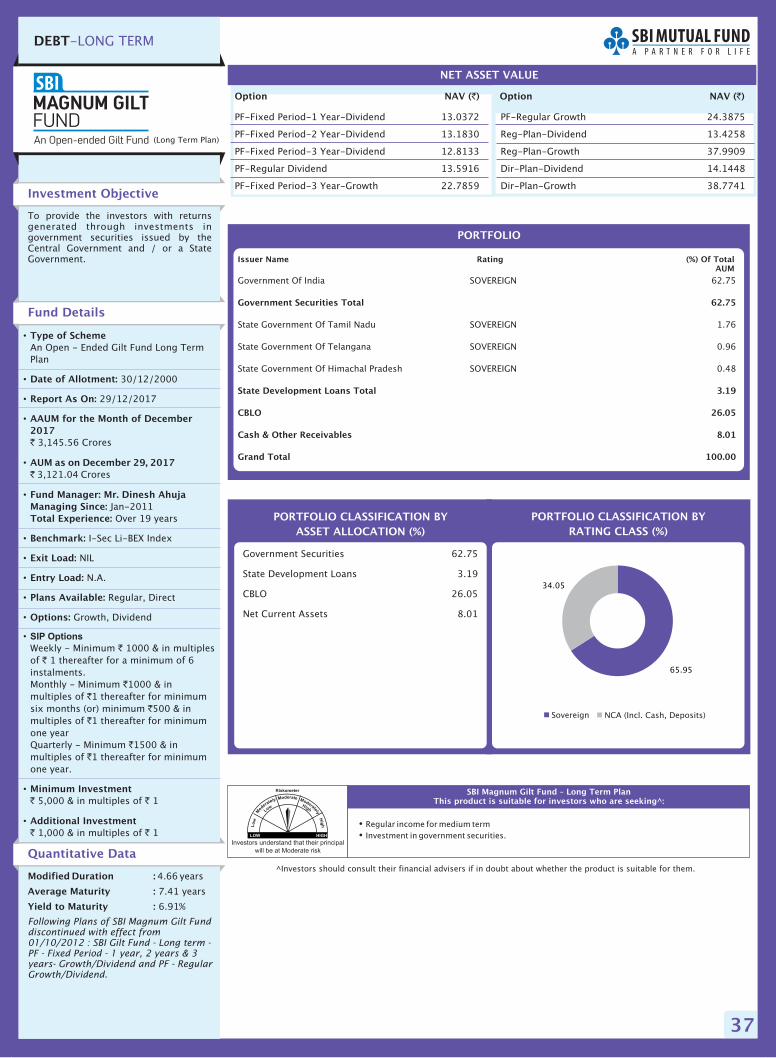
37
DEBT-LONG TERM
Investment Objective
Quantitative Data
To provide the investors with returnsgenerated through investments ingovernment securities issued by theCentral Government and / or a StateGovernment.
Fund Details
Modified Duration :
Average Maturity :
Yield to Maturity :
4.66
7.41 years
6.91%
years
Following Plans of SBI Magnum Gilt Funddiscontinued with effect from01/10/2012 : SBI Gilt Fund - Long term -PF - Fixed Period - 1 year, 2 years & 3years- Growth/Dividend and PF - RegularGrowth/Dividend.
•
•
•
•
•
•
•
•
•
•
•
•
•
•
Type of Scheme
Date of Allotment:
Report As On:
AAUM for the Month of December
2017
AUM as on December 29, 2017
Fund Manager: Mr. Dinesh Ahuja
Managing Since:
Total Experience:
Benchmark:
Exit Load:
Entry Load:
Plans Available:
Options:
Minimum Investment
Additional Investment
An Open - Ended Gilt Fund Long Term
Plan
30/12/2000
29/12/2017
3,145.56 Crores
3,121.04 Crores
Jan-2011
Over 19 years
I-Sec Li-BEX Index
NIL
N.A.
Regular, Direct
Growth, Dividend
Weekly - Minimum 1000 & in multiples
of 1 thereafter for a minimum of 6
instalments.
Monthly - Minimum 1000 & in
multiples of 1 thereafter for minimum
six months (or) minimum 500 & in
multiples of 1 thereafter for minimum
one year
Quarterly - Minimum 1500 & in
multiples of 1 thereafter for minimum
one year.
5,000 & in multiples of 1
1,000 & in multiples of 1
`
`
`
`
`
`
`
`
`
`
` `
` `
SIP Options
Option NAV ( )`
PF-Fixed Period-1 Year-Dividend 13.0372
PF-Fixed Period-2 Year-Dividend 13.1830
PF-Fixed Period-3 Year-Dividend 12.8133
PF-Regular Dividend 13.5916
PF-Fixed Period-3 Year-Growth 22.7859
NET ASSET VALUE
Option NAV ( )`
PF-Regular Growth 24.3875
Reg-Plan-Dividend 13.4258
Reg-Plan-Growth 37.9909
Dir-Plan-Dividend 14.1448
Dir-Plan-Growth 38.7741
PORTFOLIO CLASSIFICATION BY
RATING CLASS (%)
Government Securities 62.75
State Development Loans 3.19
CBLO 26.05
Net Current Assets 8.01
PORTFOLIO CLASSIFICATION BY
ASSET ALLOCATION (%)
(Long Term Plan)
Investors understand that their principal
will be at Moderate risk
�
�
Regular income for medium term
Investment in government securities.
SBI Magnum Gilt Fund – Long Term PlanThis product is suitable for investors who are seeking^:
^Investors should consult their financial advisers if in doubt about whether the product is suitable for them.
PORTFOLIO
Government Of India SOVEREIGN 62.75
State Government Of Tamil Nadu SOVEREIGN 1.76
State Government Of Telangana SOVEREIGN 0.96
State Government Of Himachal Pradesh SOVEREIGN 0.48
Government Securities Total 62.75
State Development Loans Total 3.19
CBLO 26.05
Cash & Other Receivables 8.01
Grand Total 100.00
Issuer Name Rating (%) Of TotalAUM
Sovereign NCA (Incl. Cash, Deposits)
65.95
34.05

38
DEBT-LONG TERM
Option NAV ( )`
Reg-Plan-Bonus 25.4107
Reg-Plan-Growth 41.9375
Reg-Plan-Dividend 12.4869
Reg-Plan-Quarterly Dividend 13.1237
NET ASSET VALUE
Option NAV ( )`
�
�
Regular income for medium term
Investment in Debt and Money Market securities
SBI Magnum Income FundThis product is suitable for investors who are seeking^:
Investment Objective
Quantitative Data
To provide the investors an opportunityto earn, in accordance with theirrequirements, through capital gains orthrough regular dividends, returns thatwould be higher than the returns offeredby comparable investment avenuesthrough investment in debt & moneymarket securities.
Fund Details
Modified Duration :
Average Maturity :
Yield to Maturity :
3.74
4.89 years
7.88%
years
PORTFOLIO CLASSIFICATION BY
RATING CLASS (%)
Non Convertible Debentures 54.20
Government Securities 35.98
State Development Loans 1.23
Zero Coupon Bonds 1.20
CBLO 5.94
Net Current Assets 1.47
•
•
•
•
•
•
•
•
•
•
•
•
•
•
Type of Scheme
Date of Allotment:
Report As On:
AAUM for the Month of December
2017
AUM as on December 29, 2017
Fund Manager: Mr. Dinesh Ahuja
Managing Since:
Total Experience:
Benchmark:
Exit Load:
Entry Load:
Plans Available:
Options:
SIP
Minimum Investment
Additional Investment
An Open - Ended Debt Scheme
25/11/1998
29/12/2017
2,218.94 Crores
2,206.59 Crores
Jan-2011
Over 19 years
CRISIL Composite Bond Fund Index
For exit within 1 year from the
date of allotment.
For 10% of investment : Nil
For remaining investment: 1.00%
For exit after one year from the date of
allotment – Nil
N.A.
Regular, Direct
Growth, Dividend
Weekly - Minimum 1000 & in multiples
of 1 thereafter for a minimum of 6
instalments.
Monthly - Minimum 1000 & in
multiples of 1 thereafter for minimum
six months (or) minimum 500 & in
multiples of 1 thereafter for minimum
one year
Quarterly - Minimum 1500 & in
multiples of 1.
5,000 & in multiples of 1
1,000 & in multiples of 1
`
`
`
`
`
`
`
`
`
`
` `
` `
PORTFOLIO CLASSIFICATION BY
ASSET ALLOCATION (%)
Dir-Plan-Bonus 26.1086
Dir-Plan-Growth 42.9903
Dir-Plan-Dividend 13.7972
Dir-Plan-Quarterly Dividend 13.8089
^Investors should consult their financial advisers if in doubt about whether the product is suitable for them.
Investors understand that their principal
will be at Moderate risk
AAA,AA+ and Equivalent
Below AA+
Sovereign
NCA (Incl. Cash, Deposits)
PORTFOLIO
L&T Metro Rail (Hyderabad) Ltd. [ICRA]AAA 8.42
Muthoot Finance Ltd. CRISIL AA 7.96
Hindalco Industries Ltd. CRISIL AA 6.63
Floreat Investments Ltd. [ICRA]AA 6.46
HDFC Credila Financial Services Pvt. Ltd. CRISIL AAA 5.05
Ahmedabad-Maliya Tollway Ltd. [ICRA]AA (SO) 3.98
Indiabulls Housing Finance Ltd. BWR AAA 2.31
Reliance Industries Ltd. CRISIL AAA 2.22
Indostar Capital Finance Ltd. CARE AA- 1.96
Rural Electrification Corporation Ltd. CRISIL AAA 1.36
Power Finance Corporation Ltd. CRISIL AAA 1.34
NABARD CRISIL AAA 0.68
Pratyash Renewable Pvt. Ltd. CARE AA-(SO) 0.58
SEI Baskara Power Pvt. Ltd. CARE AA-(SO) 0.58
SEI Mihir Energy Pvt. Ltd. CARE AA-(SO) 0.58
Aashman Energy Pvt. Ltd. CARE AA-(SO) 0.58
Zuvan Energy Pvt. Ltd. CARE AA-(SO) 0.58
SEI Enerstar Renewable Energy Pvt. Ltd. CARE AA-(SO) 0.58
Elena Renewable Energy Pvt. Ltd. CARE AA-(SO) 0.58
Aarish Solar Power Pvt. Ltd. CARE AA-(SO) 0.58
Divyesh Power Pvt. Ltd. CARE AA-(SO) 0.58
Shreyas Renewable Energy Pvt. Ltd. CARE AA-(SO) 0.58
SVL Ltd. [ICRA]AA 1.20
Government Of India SOVEREIGN 35.98
State Government Of Madhya Pradesh SOVEREIGN 0.78
State Government Of Tamil Nadu SOVEREIGN 0.45
Non Convertible Debentures Total 54.20
Zero Coupon Bonds Total 1.20
Government Securities Total 35.98
State Development Loans Total 1.23
CBLO 5.94
Cash & Other Receivables 1.47
Grand Total 100.00
Issuer Name Rating (%) Of TotalAUM
37.21
33.99
21.40
7.40
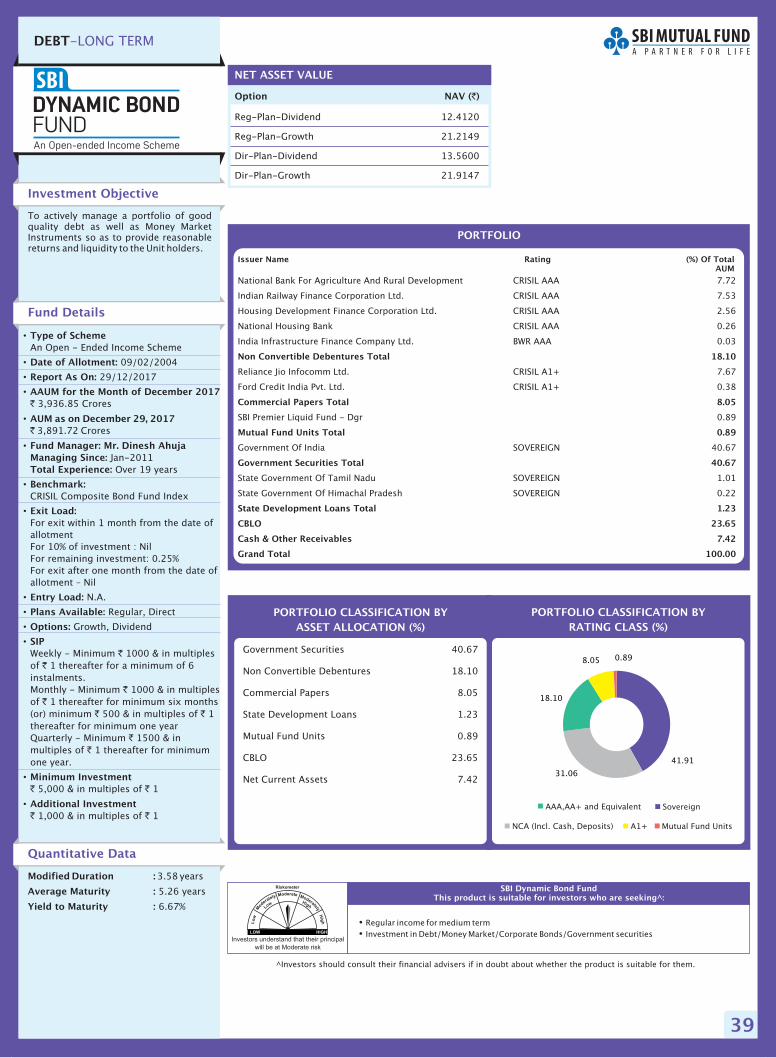
39
DEBT-LONG TERM
Option NAV ( )`
Reg-Plan-Dividend 12.4120
Reg-Plan-Growth 21.2149
Dir-Plan-Dividend 13.5600
Dir-Plan-Growth 21.9147
NET ASSET VALUE
Investors understand that their principal
will be at Moderate risk
�
�
Regular income for medium term
Investment in Debt/Money Market/Corporate Bonds/Government securities
SBI Dynamic Bond FundThis product is suitable for investors who are seeking^:
Investment Objective
Quantitative Data
To actively manage a portfolio of goodquality debt as well as Money MarketInstruments so as to provide reasonablereturns and liquidity to the Unit holders.
Fund Details
Modified Duration :
Average Maturity :
Yield to Maturity :
3.58
5.26 years
6.67%
years
PORTFOLIO CLASSIFICATION BY
RATING CLASS (%)
Government Securities 40.67
Non Convertible Debentures 18.10
Commercial Papers 8.05
State Development Loans 1.23
Mutual Fund Units 0.89
CBLO 23.65
Net Current Assets 7.42
•
•
•
•
•
•
•
•
•
•
•
•
•
•
Type of Scheme
Date of Allotment:
Report As On:
AAUM for the Month of December 2017
AUM as on December 29, 2017
Fund Manager: Mr. Dinesh Ahuja
Managing Since:
Total Experience:
Benchmark:
Exit Load:
Entry Load:
Plans Available:
Options:
SIP
Minimum Investment
Additional Investment
An Open - Ended Income Scheme
09/02/2004
29/12/2017
3,936.85 Crores
3,891.72 Crores
Jan-2011
Over 19 years
CRISIL Composite Bond Fund Index
For exit within 1 month from the date of
allotment
For 10% of investment : Nil
For remaining investment: 0.25%
For exit after one month from the date of
allotment – Nil
N.A.
Regular, Direct
Growth, Dividend
Weekly - Minimum 1000 & in multiples
of 1 thereafter for a minimum of 6
instalments.
Monthly - Minimum 1000 & in multiples
of 1 thereafter for minimum six months
(or) minimum 500 & in multiples of 1
thereafter for minimum one year
Quarterly - Minimum 1500 & in
multiples of 1 thereafter for minimum
one year.
5,000 & in multiples of 1
1,000 & in multiples of 1
`
`
`
`
`
`
` `
`
`
` `
` `
PORTFOLIO CLASSIFICATION BY
ASSET ALLOCATION (%)
^Investors should consult their financial advisers if in doubt about whether the product is suitable for them.
PORTFOLIO
National Bank For Agriculture And Rural Development CRISIL AAA 7.72
Indian Railway Finance Corporation Ltd. CRISIL AAA 7.53
Housing Development Finance Corporation Ltd. CRISIL AAA 2.56
National Housing Bank CRISIL AAA 0.26
India Infrastructure Finance Company Ltd. BWR AAA 0.03
Reliance Jio Infocomm Ltd. CRISIL A1+ 7.67
Ford Credit India Pvt. Ltd. CRISIL A1+ 0.38
SBI Premier Liquid Fund - Dgr 0.89
Government Of India SOVEREIGN 40.67
State Government Of Tamil Nadu SOVEREIGN 1.01
State Government Of Himachal Pradesh SOVEREIGN 0.22
Non Convertible Debentures Total 18.10
Commercial Papers Total 8.05
Mutual Fund Units Total 0.89
Government Securities Total 40.67
State Development Loans Total 1.23
CBLO 23.65
Cash & Other Receivables 7.42
Grand Total 100.00
Issuer Name Rating (%) Of TotalAUM
41.91
18.10
8.05 0.89
AAA,AA+ and Equivalent Sovereign
31.06
NCA (Incl. Cash, Deposits) A1+ Mutual Fund Units

40
DEBT-LONG TERM
Option NAV ( )`
Reg-Plan-Dividend 13.7276
Reg-Plan-Daily Dividend 10.4804
Reg-Plan-Growth 27.4525
NET ASSET VALUE
Option NAV ( )`
Investors understand that their principal
will be at Moderate risk
�
�
Regular income for medium term
Predominantly investment in corporate debt securities.
SBI Corporate Bond FundThis product is suitable for investors who are seeking^:
Investment Objective
Quantitative Data
The investment objective will be toactively manage a portfolio of goodquality corporate debt as well as MoneyMarket Instruments so as to providereasonable returns and liquidity to theUnit holders. However there is noguarantee or assurance that theinvestment objective of the scheme willbe achieved.
Fund Details
Modified Duration :
Average Maturity :
Yield to Maturity :
2.17
2.79 years
8.71%
years
$per investor per day across allsubscription transactions (i.e. freshpurchases, additional purchases, switch-in and trigger transactions such as SIP,STP and RSP trigger), as available underthe scheme.
PORTFOLIO CLASSIFICATION BY
RATING CLASS (%)
Non Convertible Debentures 81.05
Zero Coupon Bonds 12.71
CBLO 3.71
Net Current Assets 2.54
•
•
•
•
•
•
•
•
•
•
•
•
•
•
Type of Scheme
Date of Allotment*:
Report As On:
AAUM for the Month of
AUM as on
Fund Manager:Mr. Lokesh Mallya & Ms. Mansi SajejaManaging Since:Total Experience:Mr. Lokesh MallyaMs. Mansi SajejaBenchmark:
Exit Load
Entry Load:Plans Available:Options:SIP
Minimum Investment
Additional Investment
An Open - Ended Debt Fund17/07/2014
4,955.41 Crores
5,004.21 Crores
Feb-2017
- Over 11 years- Over 11 years
CRISIL Composite Bond FundIndex
For exit within 12 months from the date ofallotment: For 8% of the investment – NilFor the remaining investment - 3% For exitafter 12 months but within 24 months fromthe date of allotment: For 8% of theinvestment – Nil For the remaininginvestment -1.5% For exit after 24 monthsbut within 36 months from the date ofallotment: For 8% of the investment – NilFor the remaining investment -0.75%; Forexit after 36 months from the date ofallotment – Nil
N.A.Regular, Direct
Growth, Dividend
Weekly - Minimum 1000 & in multiples of1 thereafter for a minimum of 6
instalments.Monthly - Minimum 1000 & in multiplesof 1 thereafter for minimum six months(or) minimum 500 & in multiples of 1thereafter for minimum one yearQuarterly - Minimum 1500 & in multiplesof 1 thereafter for minimum one year.Maximum 10 cr
5000 & in multiples of 1 (Restrictinvestment in the scheme to a maximumlimit of 10 Cr. per investor across all folioson cumulative investment)
1,000 & in multiples of 1
29/12/2017December 2017
December 29, 2017`
`
`
`
`
`
` `
`
`
` `
` `
$
PORTFOLIO CLASSIFICATION BY
ASSET ALLOCATION (%)
Dir-Plan-Dividend 14.4748
Dir-Plan-Daily Dividend 10.4852
Dir-Plan-Growth 28.2117
PORTFOLIO
Rural ElectrificationCorporation Ltd. CRISIL AAA 5.96
Muthoot Finance Ltd. CRISIL AA 5.51
Power Finance Corporation Ltd. CRISIL AAA 5.10
Sterlite Power Grid Ventures Ltd. IND A+ 4.00
Dalmia Cement (Bharat) Ltd. [ICRA]AA 3.93
Reliance Home Finance Ltd. BWR AA+ 2.99
Pune Solapur Expressways Pvt. Ltd. [ICRA]A (SO) 2.84
Bank Of Baroda CRISIL AA+ 2.76
AU Small Finance Bank Ltd. IND A+ 2.71
Vadodara Bharuch Tollway Ltd. IND A 2.57
Tata Realty And Infrastructure Ltd. CRISIL AA 2.57
Reliance Industries Ltd. CRISIL AAA 2.44
Equitas Small Finance Bank Ltd. CARE A+ 2.01
Nirma Ltd. CRISIL AA 1.99
Power Grid CorporationOf India Ltd. CRISIL AAA 1.97
Shapoorji Pallonji InfrastructureCapital Company Ltd. [ICRA]A 1.81
Quess Corp Ltd. [ICRA]AA- 1.48
L&T Metro Rail (Hyderabad) Ltd. [ICRA]AAA 1.42
Manappuram Finance Ltd. CARE AA 1.42
Nirchem Cement Ltd. CRISIL AA 1.41
Bhaskar Industries Pvt. Ltd. BWR AA- (SO) 1.21
Crompton Greaves ConsumerElectricals Ltd. CRISIL AA 1.01
Syndicate Bank IND AA- 1.01
Indostar Capital Finance Ltd. IND AA- 1.01
Tata Capital Housing Finance Ltd. CRISIL AA+ 1.00
LIC Housing Finance Ltd. CRISIL AAA 1.00
Tata Power Renewable Energy Ltd. CARE AA (SO) 0.99
State Bank Of India CRISIL AA+ 0.98
Mahindra World City (Jaipur) Ltd. CRISIL A+ 0.92
Indian Railway FinanceCorporation Ltd. CRISIL AAA 0.88
Oriental Hotels Ltd. CARE A+ 0.84
Century Textiles & Industries Ltd. CRISIL AA- 0.80
Cholamandalam Investment And
Finance Company Ltd. [ICRA]AA 0.79
Sharda Solvent Ltd. BWR AA- (SO) 0.76
Aarish Solar Power Pvt. Ltd. CARE AA-(SO) 0.59
Divyesh Power Pvt. Ltd. CARE AA-(SO) 0.59
Elena Renewable Energy Pvt. Ltd. CARE AA-(SO) 0.59
Pratyash Renewable Pvt. Ltd. CARE AA-(SO) 0.59
SEI Enerstar RenewableEnergy Pvt. Ltd. CARE AA-(SO) 0.59
Aashman Energy Pvt. Ltd. CARE AA-(SO) 0.59
Zuvan Energy Pvt. Ltd. CARE AA-(SO) 0.59
SEI Baskara Power Pvt. Ltd. CARE AA-(SO) 0.59
Shreyas Renewable Energy Pvt. Ltd. CARE AA-(SO) 0.59
SEI Mihir Energy Pvt. Ltd. CARE AA-(SO) 0.59
Shapoorji Pallonji Energy(Gujarat) Pvt. Ltd. [ICRA]AA 0.50
NABARD CRISIL AAA 0.49
United Bank Of India CRISIL AA- 0.49
Shriram City Union Finance Ltd. CARE AA+ 0.45
Corporation Bank CRISIL A- 0.44
AU Small Finance Bank Ltd. [ICRA]A+ 0.42
Forbes & Company Ltd. [ICRA]AA- 0.40
Shriram Transport FinanceCompany Ltd. CRISIL AA+ 0.40
Sunny View Estates Pvt. Ltd. [ICRA]AA 0.30
National Highways AuthorityOf India CRISIL AAA 0.30
Janalakshmi Financial Services Ltd. [ICRA]A- 0.29
Tata Motors Ltd. [ICRA]AA 0.22
Repco Home Finance Ltd. [ICRA]AA- 0.20
Indostar Capital Finance Ltd. CARE AA- 0.10
Essel Corporate Resources Pvt. Ltd. BWR AA- (SO) 5.16
Aditya Birla Retail Ltd. IND A+ 3.21
Aditya Birla Retail Ltd. CRISIL A- 2.27
Sprit Textiles Private Ltd. BWR AA- 2.06
Non Convertible Debentures Total 81.05
Zero Coupon Bonds Total 12.71
CBLO 3.71
Cash & Other Receivables 2.54
Grand Total 100.00
Issuer Name Rating (%) Of TotalAUM
Issuer Name Rating (%) Of TotalAUM
*SBI Magnum Income Fund - Floating RatePlan – LTP has been restructured as SBICorporate Bond Fund (w.e.f July 17, 2014)
^Investors should consult their financial advisers if in doubt about whether the product is suitable for them.
AAA,AA+ and Equivalent Below AA+
NCA (Incl. Cash, Deposits)
65.61
28.15
6.25

41
DEBT-MEDIUM TERM
Option NAV ( )`
Reg-Plan-Dividend 12.8096
Reg-Plan-Growth 29.7149
Dir-Plan-Dividend 13.2745
Dir-Plan-Growth 30.8342
NET ASSET VALUE
�
�
Long term capital appreciation and current income
Investment in equity and equity related instruments as well as fixed income securities (debt andmoney market securities).
SBI Regular Savings FundThis product is suitable for investors who are seeking^:
Investment Objective
Quantitative Data
To provide attractive returns to theMagnum holders / Unit holders eitherthrough periodic dividends or throughcapital appreciation through an activelymanaged portfolio of debt, equity andmoney market instruments.
Fund Details
Modified Duration :
Average Maturity :
Yield to Maturity :
2.29
3.00 years
8.05%
years
PORTFOLIO CLASSIFICATION BY
RATING CLASS (%)
Non Convertible Debentures 55.39
Zero Coupon Bonds 13.36
Government Securities 10.34
State Development Loans 0.16
CBLO 16.92
Net Current Assets 3.84
•
•
•
•
•
•
•
•
•
•
•
•
•
•
Type of Scheme
Date of Allotment:
Report As On:
AAUM for the Month of December 2017
AUM as on December 29, 2017
Fund Managers:
Mr. Ruchit Mehta Equity
Mr. Dinesh Ahuja Debt
Managing Since:
Total Experience:
Mr. Ruchit Mehta
Mr. Dinesh Ahuja
Benchmark:
Exit Load:
Entry Load:
Plans Available:
Options:
SIP
Minimum Investment
Additional Investment
An Open - Ended Income Scheme
12/11/2003
29/12/2017
1,542.45 Crores
1,563.70 Crores
-
-
July-2011
- Over 12 years
- Over 18 years
CRISIL MIP Blended Fund Index
For exit within 12 months from the date
of allotment: 1.50%; For exit after 12
months from the date of allotment: Nil
N.A.
Regular, Direct
Growth, Dividend
Weekly - Minimum 1000 & in multiples
of 1 thereafter for a minimum of 6
instalments.
Monthly - Minimum 1000 & in multiples
of 1 thereafter for minimum six months
(or) minimum 500 & in multiples of 1
thereafter for minimum one year
Quarterly - Minimum 1500 & in
multiples of 1 thereafter for minimum
one year.
5,000 & in multiples of 1
1,000 & in multiples of 1
`
`
`
`
`
`
` `
`
`
` `
` `
PORTFOLIO CLASSIFICATION BY
ASSET ALLOCATION (%)
PORTFOLIO
Reliance Industries Ltd. CRISIL AAA 7.90
Muthoot Finance Ltd. CRISIL AA 4.61
Indiabulls Housing Finance Ltd. BWR AAA 4.46
HDFC Ltd. CRISIL AAA 4.19
Vadodara Bharuch Tollway Ltd. IND A 3.41
Pune Solapur Expressways Pvt. Ltd. [ICRA]A (SO) 3.20
Tata Power Renewable Energy Ltd. CARE AA (SO) 3.19
United Bank Of India CRISIL AA- 3.13
Floreat Investments Ltd. [ICRA]AA 2.72
Hindalco Industries Ltd. CRISIL AA 2.63
HDFC Credila FinancialServices Pvt. Ltd. CRISIL AAA 2.43
Forbes & Company Ltd. [ICRA]AA- 1.03
Manappuram Finance Ltd. CARE AA 0.98
Equitas Small Finance Bank Ltd. CARE A+ 0.97
Rural ElectrificationCorporation Ltd. CRISIL AAA 0.65
Shapoorji Pallonji InfrastructureCapital Company Ltd. [ICRA]A 0.64
Shreyas Renewable Energy Pvt. Ltd. CARE AA-(SO) 0.63
SEI Baskara Power Pvt. Ltd. CARE AA-(SO) 0.63
Aashman Energy Pvt. Ltd. CARE AA-(SO) 0.63
Aarish Solar Power Pvt. Ltd. CARE AA-(SO) 0.63
Pratyash Renewable Pvt. Ltd. CARE AA-(SO) 0.63
SEI Mihir Energy Pvt. Ltd. CARE AA-(SO) 0.63
Divyesh Power Pvt. Ltd. CARE AA-(SO) 0.63
Zuvan Energy Pvt. Ltd. CARE AA-(SO) 0.63
SEI Enerstar RenewableEnergy Pvt. Ltd. CARE AA-(SO) 0.63
Elena Renewable Energy Pvt. Ltd. CARE AA-(SO) 0.63
Tata Realty And Infrastructure Ltd. CRISIL AA 0.58
MFL Securitisation Trust [ICRA]AAA 0.51
L&T Metro Rail (Hyderabad) Ltd. [ICRA]AAA 0.39
AU Small Finance Bank Ltd. IND A+ 0.33
Power Finance Corporation Ltd. CRISIL AAA 0.33
Nirchem Cement Ltd. CRISIL AA 0.32
Oriental Hotels Ltd. CARE A+ 0.26
Piramal Enterprises Ltd. [ICRA]AA 0.19
Aditya Birla Retail Ltd. IND A+ 5.15
Essel Corporate Resources Pvt. Ltd. BWR AA- (SO) 4.63
Repco Home Finance Ltd. [ICRA]AA- 3.58
Government Of India SOVEREIGN 10.34
State Government Of Tamil Nadu SOVEREIGN 0.16
Non Convertible Debentures Total 55.39
Zero Coupon Bonds Total 13.36
Government Securities Total 10.34
State Development Loans Total 0.16
CBLO 16.92
Cash & Other Receivables 3.84
Grand Total 100.00
Issuer Name Rating (%) Of TotalAUM
Issuer Name Rating (%) Of TotalAUM
(Previously known as SBI Magnum Income
Plus Fund - Investment)
^Investors should consult their financial advisers if in doubt about whether the product is suitable for them.
Investors understand that their principal
will be at Moderate risk
AAA,AA+ and Equivalent Below AA+
SovereignNCA (Incl. Cash, Deposits)
47.90
20.85
20.75
10.50

42
DEBT-SHORT TERM
�
�
Regular income for short term
Investment in Debt and Money Market securities
SBI Short Term Debt FundThis product is suitable for investors who are seeking^:
Investment Objective
Quantitative Data
To provide investors with an opportunityto generate regular income throughinvestments in a portfolio comprising ofdebt instruments which are rated notbelow investment grade by a credit ratingagency, and money market instruments.
Fund Details
Modified Duration :
Average Maturity :
Yield to Maturity :
2.01
2.19 years
7.64%
years
Following Plans of SBI Short Horizon DebtFund- Short Term Fund discontinued witheffect from 01/10/2012 for freshpurchase: SBI Short Horizon Debt Fund-Short Term Fund-Retail Plan-Growth &Weekly/ Fortnightly/ Monthly/Dividend.
PORTFOLIO CLASSIFICATION BY
RATING CLASS (%)
Non Convertible Debentures 86.09
State Development Loans 4.53
Zero Coupon Bonds 2.41
Government Securities 1.66
Certificate Of Deposits 1.14
CBLO 1.07
Net Current Assets 3.09
• Type of Scheme
Date of Allotment:
Report As On:
AAUM for the Month of December
2017
AUM as on December 29, 2017
Fund Manager:
Mr. Rajeev Radhakrishnan
Managing Since:
Total Experience:
Benchmark:
Exit Load:
Entry Load:
Plans Available:
Options:
SIP
Minimum Investment
Additional Investment
An Open - Ended Income Scheme
27/7/2007
29/12/2017
9,510.36 Crores
8,407.64 Crores
Jun-2008
Over 16 years
CRISIL Short Term Bond Fund Index
Nil
N.A.
Regular, Direct
Growth, Dividend
Weekly - Minimum 1000 & in multiples
of 1 thereafter for a minimum of 6
instalments.
Monthly - Minimum 1000 & in
multiples of 1 thereafter for minimum
six months (or) minimum 500 & in
multiples of 1 thereafter for minimum
one year
Quarterly - Minimum 1500 & in
multiples of 1 thereafter for minimum
one year.
5,000 & in multiples of 1
1,000 & in multiples of 1
•
•
•
•
•
•
•
•
•
•
•
•
•
`
`
`
`
`
`
`
`
`
`
` `
` `
PORTFOLIO CLASSIFICATION BY
ASSET ALLOCATION (%)
Option NAV ( )`
Retail-Plan-Fortnightly Dividend 10.9594
Retail-Plan-Growth 22.2808
Retail-Plan-Monthly Dividend 11.3053
Retail-Plan-Weekly Dividend 10.9410
Reg-Plan-Fortnightly Dividend 10.3676
Reg-Plan-Growth 19.6939
NET ASSET VALUE
Option NAV ( )`
Reg-Plan-Monthly Dividend 11.9878
Reg-Plan-Weekly Dividend 10.5342
Dir-Plan-Fortnightly Dividend 13.5596
Dir-Plan-Growth 20.1313
Dir-Plan-Monthly Dividend 12.3535
Dir-Plan-Weekly Dividend 10.5397
PORTFOLIO
HDFC Ltd. CRISIL AAA 11.92
Power Finance Corporation Ltd. CRISIL AAA 9.36
NABARD CRISIL AAA 6.73
Rural ElectrificationCorporation Ltd. CRISIL AAA 6.68
Power Grid CorporationOf India Ltd. CRISIL AAA 6.37
Reliance Industries Ltd. CRISIL AAA 6.31
LIC Housing Finance Ltd. CRISIL AAA 4.93
Indian Railway FinanceCorporation Ltd. CRISIL AAA 4.31
Daimler Financial ServicesIndia Pvt. Ltd. IND AAA 4.28
Shriram Transport FinanceCompany Ltd. CRISIL AA+ 2.95
Tata Sons Ltd. CRISIL AAA 2.41
BMW India FinancialServices Pvt. Ltd. CRISIL AAA 2.37
Export-Import Bank Of India CRISIL AAA 2.37
LIC Housing Finance Ltd. CARE AAA 2.37
HDB Financial Services Ltd. CRISIL AAA 1.79
Orix Leasing & FinancialServices India Ltd. IND AAA 1.43
NABARD IND AAA 1.42
Ultratech Cement Ltd. CRISIL AAA 1.16
Fullerton India CreditCompany Ltd. CARE AAA 1.13
Muthoot Finance Ltd. CRISIL AA 1.10
Small Industries DevelopmentBank Of India CARE AAA 0.83
Housing And Urban DevelopmentCorporation Ltd. [ICRA]AAA 0.77
Food Corporation Of India CRISIL AAA 0.71
L&T Infra Debt Fund Ltd. CRISIL AAA 0.61
Nirchem Cement Ltd. CRISIL AA 0.60
IDFC Bank Ltd. [ICRA]AAA 0.38
L&T Metro Rail (Hyderabad) Ltd. [ICRA]AAA 0.36
Konkan Railway Corporation Ltd. [ICRA]AAA 0.21
Cholamandalam Investment AndFinance Company Ltd. IND AA+ 0.12
NTPC Ltd. CRISIL AAA 0.07
State Bank Of India CRISIL AAA 0.04
Nabha Power Ltd. [ICRA]AAA 0.02
Bajaj Finance Ltd. CRISIL AAA 0.01
Shriram Transport FinanceCompany Ltd. IND AA+ 1.26
Tata Motors Finance Ltd. CARE AA+ 0.74
L&T Interstate Road Corridor Ltd. [ICRA]AAA 0.34
Axis Finance Ltd. IND AAA 0.07
ICICI Bank Ltd. [ICRA]A1+ 1.14
Government Of India SOVEREIGN 1.66
State Government Of Rajasthan SOVEREIGN 2.94
State Government Of Gujarat SOVEREIGN 0.87
State Government Of Maharashtra SOVEREIGN 0.61
State Government Of Tamil Nadu SOVEREIGN 0.11
Non Convertible Debentures Total 86.09
Zero Coupon Bonds Total 2.41
Certificate Of Deposits Total 1.14
Government Securities Total 1.66
State Development Loans Total 4.54
CBLO 1.07
Cash & Other Receivables 3.09
Grand Total 100.00
Issuer Name Rating (%) Of TotalAUM
Issuer Name Rating (%) Of TotalAUM
Investors understand that their principal
will be at Moderately Low risk
^Investors should consult their financial advisers if in doubt about whether the product is suitable for them.
SovereignNCA (Incl. Cash, Deposits)
86.81
6.20
4.161.69
1.14
AAA,AA+ and Equivalent Below AA+ A1+

43
Option NAV ( )`
Reg-Plan-Dividend 12.8937
Reg-Plan-Growth 36.3588
Dir-Plan-Dividend 13.0689
Dir-Plan-Growth 36.9098
NET ASSET VALUE
�
�
Regular income for short term
Investment in government securities.
SBI Magnum Gilt Fund – Short Term PlanThis product is suitable for investors who are seeking^:
Investment Objective
Quantitative Data
To provide the investors with returnsgenerated through investments ingovernment securities issued by theCentral Government and / or a StateGovernment.
Fund Details
Modified Duration :
Average Maturity :
Yield to Maturity :
1.63
2.01 years
6.51%
years
PORTFOLIO CLASSIFICATION BY
RATING CLASS (%)
Government Securities 22.13
State Development Loans 20.75
CBLO 56.90
Net Current Assets 0.22
•
•
•
•
•
•
•
•
•
•
•
•
•
•
Type of Scheme
Date of Allotment:
Report As On:
AAUM for the Month of December 2017
AUM as on December 29, 2017
Fund Manager: Mr. Dinesh Ahuja
Managing Since:
Total Experience:
Benchmark:
Exit Load:
Entry Load:
Plans Available:
Options:
Minimum Investment
Additional Investment
An Open - Ended Gilt Fund Short Term
Plan
30/12/2000
29/12/2017
494.27 Crores
504.65 Crores
Jan-2011
Over 19 years
I-Sec Si-BEX Index
NIL
N.A.
Regular, Direct
Growth, Dividend
Weekly - Minimum 1000 & in multiples
of 1 thereafter for a minimum of 6
instalments.
Monthly - Minimum 1000 & in multiples
of 1 thereafter for minimum six months
(or) minimum 500 & in multiples of 1
thereafter for minimum one year
Quarterly - Minimum 1500 & in
multiples of 1 thereafter for minimum
one year.
5,000 & in multiples of 1
1,000 & in multiples of 1
`
`
`
`
`
`
` `
`
`
` `
` `
SIP Options
PORTFOLIO CLASSIFICATION BY
ASSET ALLOCATION (%)
DEBT-SHORT TERM
PORTFOLIO
Government Of India SOVEREIGN 22.13
State Government Of Rajasthan SOVEREIGN 20.19
State Government Of Uttar Pradesh SOVEREIGN 0.56
Government Securities Total 22.13
State Development Loans Total 20.75
CBLO 56.90
Cash & Other Receivables 0.22
Grand Total 100.00
Issuer Name Rating (%) Of TotalAUM
(Short Term Plan)
Investors understand that their principal
will be at Moderately Low risk
^Investors should consult their financial advisers if in doubt about whether the product is suitable for them.
SovereignNCA (Incl. Cash, Deposits)
57.12
42.88

44
Option NAV ( )`
Institutional-Daily Dividend 1008.0000
Institutional-Growth 2239.4001
Institutional-Weekly Dividend 1005.7993
Reg-Plan-Daily Dividend 1008.0000
Reg-Plan-Fortnightly Dividend 1029.4654
Reg-Plan-Growth 2200.7439
Reg-Plan-Monthly Dividend 1074.2842
NET ASSET VALUE
Option NAV ( )`
�
�
Regular income for short term
Investment in Debt and Money Market securities
SBI Ultra Short Term Debt FundThis product is suitable for investors who are seeking^:
Investment Objective
Quantitative Data
To provide investors with an opportunityto generate regular income with highdegree of liquidity through investmentsin a portfolio comprising predominantlyof money market instruments withmaturity / residual maturity up to oneyear and debt instruments which arerated not below investment grade by acredit rating agency.
Fund Details
Modified Duration :
Average Maturity :
Yield to Maturity :
0.52
0.56 years
7.17%
years
Following Plans of SBI Short HorizonDebt Fund Ultra Short Term Funddiscontinued with effect from01/10/2012 for fresh purchase: SBIShort Horizon Debt Fund-Ultra ShortTerm Fund- Institutional Plan-Growth &Daily / Monthly/Weekly/FortnightlyDividend.
PORTFOLIO CLASSIFICATION BY
RATING CLASS (%)
Non Convertible Debentures 46.83
Certificate Of Deposits 22.37
Commercial Papers 19.17
Treasury Bills 4.35
Zero Coupon Bonds 3.89
State Development Loans 1.91
CBLO 0.06
Net Current Assets 1.42
• Type of Scheme
Date of Allotment:
Report As On:
AAUM for the Month of December
2017
AUM as on December 29, 2017
Fund Manager:
Mr. Rajeev Radhakrishnan
Managing Since:
Total Experience:
Benchmark:
Exit Load:
Entry Load:
Plans Available:
Options:
SIP
Minimum Investment
Additional Investment
An Open - Ended Income Scheme
27/7/2007
29/12/2017
11,873.54 Crores
10,877.05 Crores
Jun-2008
Over 16 years
CRISIL Liquid Fund Index
Nil
N.A.
Regular, Direct
Growth, Dividend
Weekly - Minimum 1000 & in multiples
of 1 thereafter for a minimum of 6
instalments.
Monthly - Minimum 1000 & in
multiples of 1 thereafter for minimum
six months (or) minimum 500 & in
multiples of 1 thereafter for minimum
one year
Quarterly - Minimum 1500 & in
multiples of 1 thereafter for minimum
one year.
5,000 & in multiples of 1
1,000 & in multiples of 1
•
•
•
•
•
•
•
•
•
•
•
•
•
`
`
`
`
`
`
`
`
`
`
` `
` `
PORTFOLIO CLASSIFICATION BY
ASSET ALLOCATION (%)
Reg-Plan-Weekly Dividend 1011.3264
Dir-Plan-Daily Dividend 1008.0000
Dir-Plan-Fortnightly Dividend 1029.4893
Dir-Plan-Growth 2210.1205
Dir-Plan-Monthly Dividend 1078.9570
Dir-Plan-Weekly Dividend 1011.3325
DEBT-ULTRA SHORT
PORTFOLIO
HDFC Ltd. CRISIL AAA 8.55
NABARD CRISIL AAA 5.50
Rural ElectrificationCorporation Ltd. CRISIL AAA 5.08
Citicorp Finance (India) Ltd. [ICRA]AAA 4.64
Indiabulls Housing Finance Ltd. BWR AAA 3.87
Power Finance Corporation Ltd. CRISIL AAA 2.97
Shriram Transport FinanceCompany Ltd. IND AA+ 2.79
Cholamandalam Investment &Finance Company Ltd. [ICRA]AA 2.42
NABARD IND AAA 2.13
Tata Capital Ltd. CRISIL AA+ 1.85
Indian Railway FinanceCorporation Ltd. CRISIL AAA 1.62
Mahindra & MahindraFinancial Services Ltd. IND AAA 1.16
Tata Motors Finance Solutions Ltd. CRISIL AA 1.07
LIC Housing Finance Ltd. CRISIL AAA 0.56
Nirma Ltd. CRISIL AA 0.51
Power Grid Corporation OfIndia Ltd. CRISIL AAA 0.47
Tata Motors Ltd. CARE AA+ 0.47
Gruh Finance Ltd. CRISIL AAA 0.42
Shapoorji Pallonji Energy(Gujarat) Pvt. Ltd. [ICRA]AA 0.23
Tata Capital Financial Services Ltd. CRISIL AA+ 0.23
Tata Advanced Materials Ltd. CRISIL AA+ 0.19
Export-Import Bank Of India CRISIL AAA 0.12
Shriram Transport FinanceCompany Ltd. IND AA+ 1.47
Tata Motors Finance Ltd. CRISIL AA 0.76
SVL Ltd. [ICRA]AA 0.67
LIC Housing Finance Ltd. CRISIL AAA 0.54
TMF Holdings Ltd. CRISIL AA 0.25
L&T Interstate Road Corridor Ltd. [ICRA]AAA 0.20
Non Convertible Debentures Total 46.83
Zero Coupon Bonds Total 3.89
Indus Towers Ltd. CRISIL A1+ 3.01
Housing And Urban DevelopmentCorporation Ltd. [ICRA]A1+ 2.76
Indian Railway FinanceCorporation Ltd. CRISIL A1+ 2.75
Larsen & Toubro Ltd. CRISIL A1+ 1.83
Tata Motors Ltd. [ICRA]A1+ 1.83
HDFC Ltd. CARE A1+ 1.80
Kotak Mahindra Investments Ltd. CRISIL A1+ 1.35
Kotak Mahindra Prime Ltd. CRISIL A1+ 0.91
Turquoise InvestmentsAnd Finance Private Ltd. CRISIL A1+ 0.90
Trapti Trading & InvestmentsPrivate Ltd. [ICRA]A1+ 0.90
Power Finance Corporation Ltd. CRISIL A1+ 0.68
ICICI Securities Ltd. CRISIL A1+ 0.46
HDFC Bank Ltd. IND A1+ 6.75
ICICI Bank Ltd. [ICRA]A1+ 6.74
Indusind Bank Ltd. CRISIL A1+ 4.59
ICICI Bank Ltd. CARE A1+ 3.38
NABARD CRISIL A1+ 0.69
Axis Bank Ltd. CRISIL A1+ 0.22
State Government Of Rajasthan SOVEREIGN 1.36
State Government Of Uttar Pradesh SOVEREIGN 0.36
State Government Of Odisha SOVEREIGN 0.19
182 Day T-Bill 08.03.18 SOVEREIGN 2.29
329 Day T-Bill 12.03.18 SOVEREIGN 1.60
312 Day T-Bill 16.03.18 SOVEREIGN 0.46
Commercial Papers Total 19.17
Certificate Of Deposits Total 22.37
State Development Loans Total 1.91
Treasury Bills Total 4.35
CBLO 0.06
Cash & Other Receivables 1.42
Grand Total 100.00
Issuer Name Rating (%) Of TotalAUM
Issuer Name Rating (%) Of TotalAUM
Investors understand that their principal
will be at Moderately Low risk
^Investors should consult their financial advisers if in doubt about whether the product is suitable for them.
AAA,AA+ and Equivalent A1+
SovereignNCA (Incl. Cash, Deposits)
Below AA+
44.81
41.54
6.26
5.92 1.48

45
Option NAV ( )`
Reg-Plan-Daily Dividend 10.0800
Reg-Plan-Growth 26.5077
Reg-Plan-Monthly Dividend 11.5288
Reg-Plan-Weekly Dividend 11.5368
NET ASSET VALUE
Option NAV ( )`
�
�
Regular income for medium term
Investment in Floating rate Debt/Money Market securities
SBI Savings FundThis product is suitable for investors who are seeking^:
Investment Objective
Quantitative Data
To endeavour to mitigate interest raterisk and seek to generate regular incomealong with opportunities for capitalappreciation through a portfolioinvesting in Floating Rate debt securities,f ixed rate securit ies, derivativeinstruments as well as in Money Marketinstruments.
Fund Details
Modified Duration :
Average Maturity :
Yield to Maturity :
0.60
0.66 years
7.76%
years
PORTFOLIO CLASSIFICATION BY
RATING CLASS (%)
Non Convertible Debentures 68.01
Commercial Papers 15.52
Zero Coupon Bonds 5.34
Certificate Of Deposits 3.66
Treasury Bills 2.43
State Development Loans 1.91
CBLO 0.30
Net Current Assets 2.83
•
•
•
•
•
•
•
•
•
•
•
•
•
•
•
Type of Scheme
Date of Allotment:
Report As On:
AAUM for the Month of December
2017
AUM as on December 29, 2017
Fund Manager: Mr. R. Arun
Managing Since:
Total Experience:
Benchmark:
Exit Load:
Entry Load:
Plans Available:
Options:
SIP
Minimum Investment
Additional Investment
An Open - Ended Debt Fund
19/07/2004
29/12/2017
4,130.26 Crores
4,107.01 Crores
Apr-2012
Over 11 years
CRISIL Liquid Fund Index
For exit within 3 business days from the
date of allotment - 0.10%
For exit after 3 business days from the
date of allotment - Nil
N.A.
Regular, Direct
Growth, Dividend
Weekly - Minimum 1000 & in multiples
of 1 thereafter for a minimum of 6
instalments.
Monthly - Minimum 1000 & in
multiples of 1 thereafter for minimum
six months (or) minimum 500 & in
multiples of 1 thereafter for minimum
one year
Quarterly - Minimum 1500 & in
multiples of 1 thereafter for minimum
one year.
500 & in multiples of 1
500 & in multiples of 1
`
`
`
`
`
`
`
`
`
`
` `
` `
PORTFOLIO CLASSIFICATION BY
ASSET ALLOCATION (%)
Dir-Plan-Daily Dividend 10.0800
Dir-Plan-Growth 27.2839
Dir-Plan-Monthly Dividend 11.8456
Dir-Plan-Weekly Dividend 11.6271
DEBT-ULTRA SHORT
PORTFOLIO
HDFC Ltd. CRISIL AAA 9.11
Indiabulls Commercial Credit Ltd. CRISIL AAA 6.14
Tata Power Company Ltd. [ICRA]AA- 5.55
Writers And Publishers Private Ltd. BWR AA- (SO) 4.79
Dalmia Cement (Bharat) Ltd. [ICRA]AA 3.63
Power Finance Corporation Ltd. CRISIL AAA 3.60
Nirchem Cement Ltd. CRISIL AA 3.47
Tata Capital Housing Finance Ltd. CRISIL AA+ 3.46
LIC Housing Finance Ltd. CRISIL AAA 2.84
Bhaskar Industries Pvt. Ltd. BWR AA- (SO) 2.58
Mahindra & MahindraFinancial Services Ltd. IND AAA 2.48
Tata Capital Financial Services Ltd. [ICRA]AA+ 2.47
NABARD CRISIL AAA 2.46
APL Apollo Tubes Ltd. CRISIL AA- 1.84
Steel Authority Of India Ltd. IND AA- 1.83
Sharda Solvent Ltd. BWR AA- (SO) 1.53
Manappuram Finance Ltd. CARE AA 1.25
Indostar Capital Finance Ltd. CARE AA- 1.24
Indian Railway FinanceCorporation Ltd. CRISIL AAA 1.24
Shriram Transport FinanceCompany Ltd. IND AA+ 1.23
Export-Import Bank Of India CRISIL AAA 1.17
Power Grid CorporationOf India Ltd. CRISIL AAA 1.14
Rural ElectrificationCorporation Ltd. CRISIL AAA 1.06
Tata Capital Ltd. [ICRA]AA+ 0.63
Indostar Capital Finance Ltd. IND AA- 0.62
Reliance Industries Ltd. CRISIL AAA 0.60
Small Industries DevelopmentBank Of India CARE AAA 0.06
Janalakshmi Financial Services Ltd. [ICRA]A- 0.01
Essel Corporate Resources Pvt. Ltd. BWR AA- (SO) 3.81
Sprit Textiles Private Ltd. BWR AA- 1.53
SD Corporation Pvt. Ltd. [ICRA]A1+ 7.12
STCI Finance Ltd. CRISIL A1+ 5.45
Birla TMT Holdings Pvt. Ltd. CRISIL A1+ 1.19
Ford Credit India Pvt. Ltd. CRISIL A1+ 1.17
Turquoise InvestmentsAnd Finance Private Ltd. CRISIL A1+ 0.60
HDFC Bank Ltd. IND A1+ 3.58
NABARD CRISIL A1+ 0.07
State Government Of Rajasthan SOVEREIGN 1.91
323 Day T-Bill 13.03.18 SOVEREIGN 2.43
Non Convertible Debentures Total 68.01
Zero Coupon Bonds Total 5.34
Commercial Papers Total 15.52
Certificate Of Deposits Total 3.66
State Development Loans Total 1.91
Treasury Bills Total 2.43
CBLO 0.30
Cash & Other Receivables 2.83
Grand Total 100.00
Issuer Name Rating (%) Of TotalAUM
Issuer Name Rating (%) Of TotalAUM
(Previously known as SBI Magnum IncomeFund – Floating Rate Plan – Savings PlusBond Plan)
Investors understand that their principal
will be at Moderately Low risk
^Investors should consult their financial advisers if in doubt about whether the product is suitable for them.
SovereignNCA (Incl. Cash, Deposits)
AAA,AA+ and Equivalent A1+ Below AA+
39.69
33.66
19.18
4.34 3.13
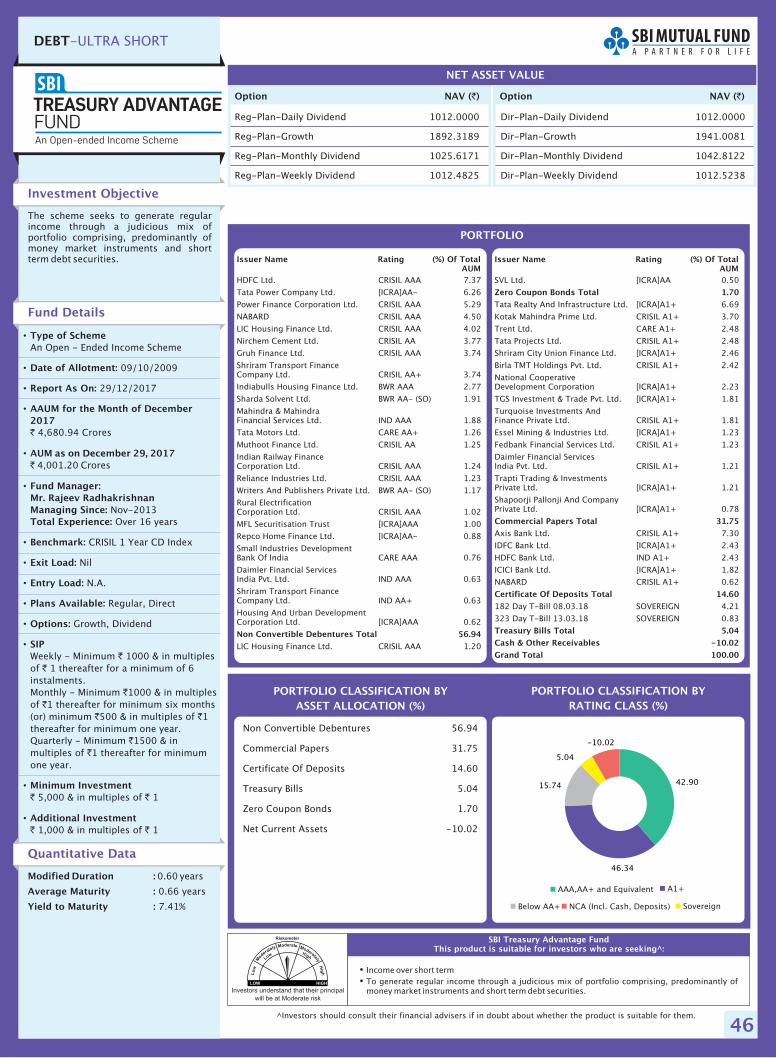
46
Option NAV ( )`
Reg-Plan-Daily Dividend 1012.0000
Reg-Plan-Growth 1892.3189
Reg-Plan-Monthly Dividend 1025.6171
Reg-Plan-Weekly Dividend 1012.4825
NET ASSET VALUE
Option NAV ( )`
�
�
Income over short term
To generate regular income through a judicious mix of portfolio comprising, predominantly ofmoney market instruments and short term debt securities.
SBI Treasury Advantage FundThis product is suitable for investors who are seeking^:
Investment Objective
Quantitative Data
The scheme seeks to generate regularincome through a judicious mix ofportfolio comprising, predominantly ofmoney market instruments and shortterm debt securities.
Fund Details
Modified Duration :
Average Maturity :
Yield to Maturity :
0.60
0.66 years
7.41%
years
PORTFOLIO CLASSIFICATION BY
RATING CLASS (%)
Non Convertible Debentures 56.94
Commercial Papers 31.75
Certificate Of Deposits 14.60
Treasury Bills 5.04
Zero Coupon Bonds 1.70
Net Current Assets -10.02
•
•
•
•
•
•
•
•
•
•
•
•
•
•
Type of Scheme
Date of Allotment:
Report As On:
AAUM for the Month of December
2017
AUM as on December 29, 2017
Fund Manager:
Mr. Rajeev Radhakrishnan
Managing Since:
Total Experience:
Benchmark:
Exit Load:
Entry Load:
Plans Available:
Options:
SIP
Minimum Investment
Additional Investment
An Open - Ended Income Scheme
09/10/2009
29/12/2017
4,680.94 Crores
4,001.20 Crores
Nov-2013
Over 16 years
CRISIL 1 Year CD Index
Nil
N.A.
Regular, Direct
Growth, Dividend
Weekly - Minimum 1000 & in multiples
of 1 thereafter for a minimum of 6
instalments.
Monthly - Minimum 1000 & in multiples
of 1 thereafter for minimum six months
(or) minimum 500 & in multiples of 1
thereafter for minimum one year.
Quarterly - Minimum 1500 & in
multiples of 1 thereafter for minimum
one year.
5,000 & in multiples of 1
1,000 & in multiples of 1
`
`
`
`
`
`
` `
`
`
` `
` `
AAA,AA+ and Equivalent A1+
Below AA+ SovereignNCA (Incl. Cash, Deposits)
PORTFOLIO CLASSIFICATION BY
ASSET ALLOCATION (%)
Dir-Plan-Daily Dividend 1012.0000
Dir-Plan-Growth 1941.0081
Dir-Plan-Monthly Dividend 1042.8122
Dir-Plan-Weekly Dividend 1012.5238
DEBT-ULTRA SHORT
PORTFOLIO
HDFC Ltd. CRISIL AAA 7.37
Tata Power Company Ltd. [ICRA]AA- 6.26
Power Finance Corporation Ltd. CRISIL AAA 5.29
NABARD CRISIL AAA 4.50
LIC Housing Finance Ltd. CRISIL AAA 4.02
Nirchem Cement Ltd. CRISIL AA 3.77
Gruh Finance Ltd. CRISIL AAA 3.74
Shriram Transport FinanceCompany Ltd. CRISIL AA+ 3.74
Indiabulls Housing Finance Ltd. BWR AAA 2.77
Sharda Solvent Ltd. BWR AA- (SO) 1.91
Mahindra & MahindraFinancial Services Ltd. IND AAA 1.88
Tata Motors Ltd. CARE AA+ 1.26
Muthoot Finance Ltd. CRISIL AA 1.25
Indian Railway FinanceCorporation Ltd. CRISIL AAA 1.24
Reliance Industries Ltd. CRISIL AAA 1.23
Writers And Publishers Private Ltd. BWR AA- (SO) 1.17
Rural ElectrificationCorporation Ltd. CRISIL AAA 1.02
MFL Securitisation Trust [ICRA]AAA 1.00
Repco Home Finance Ltd. [ICRA]AA- 0.88
Small Industries DevelopmentBank Of India CARE AAA 0.76
Daimler Financial ServicesIndia Pvt. Ltd. IND AAA 0.63
Shriram Transport FinanceCompany Ltd. IND AA+ 0.63
Housing And Urban DevelopmentCorporation Ltd. [ICRA]AAA 0.62
LIC Housing Finance Ltd. CRISIL AAA 1.20
Non Convertible Debentures Total 56.94
SVL Ltd. [ICRA]AA 0.50
Tata Realty And Infrastructure Ltd. [ICRA]A1+ 6.69
Kotak Mahindra Prime Ltd. CRISIL A1+ 3.70
Trent Ltd. CARE A1+ 2.48
Tata Projects Ltd. CRISIL A1+ 2.48
Shriram City Union Finance Ltd. [ICRA]A1+ 2.46
Birla TMT Holdings Pvt. Ltd. CRISIL A1+ 2.42
National CooperativeDevelopment Corporation [ICRA]A1+ 2.23
TGS Investment & Trade Pvt. Ltd. [ICRA]A1+ 1.81
Turquoise Investments AndFinance Private Ltd. CRISIL A1+ 1.81
Essel Mining & Industries Ltd. [ICRA]A1+ 1.23
Fedbank Financial Services Ltd. CRISIL A1+ 1.23
Daimler Financial ServicesIndia Pvt. Ltd. CRISIL A1+ 1.21
Trapti Trading & InvestmentsPrivate Ltd. [ICRA]A1+ 1.21
Shapoorji Pallonji And CompanyPrivate Ltd. [ICRA]A1+ 0.78
Axis Bank Ltd. CRISIL A1+ 7.30
IDFC Bank Ltd. [ICRA]A1+ 2.43
HDFC Bank Ltd. IND A1+ 2.43
ICICI Bank Ltd. [ICRA]A1+ 1.82
NABARD CRISIL A1+ 0.62
182 Day T-Bill 08.03.18 SOVEREIGN 4.21
323 Day T-Bill 13.03.18 SOVEREIGN 0.83
Zero Coupon Bonds Total 1.70
Commercial Papers Total 31.75
Certificate Of Deposits Total 14.60
Treasury Bills Total 5.04
Cash & Other Receivables -10.02
Grand Total 100.00
Issuer Name Rating (%) Of TotalAUM
Issuer Name Rating (%) Of TotalAUM
Investors understand that their principal
will be at Moderate risk
^Investors should consult their financial advisers if in doubt about whether the product is suitable for them.
42.90
46.34
15.74
5.04
-10.02

47
DEBT-LIQUID
�
�
Regular income for short term
Investment in Debt and Money Market securities
SBI Premier Liquid FundThis product is suitable for investors who are seeking^:
Investment Objective
Quantitative Data
To provide attractive returns to the
Magnum/Unit holders either through
periodic dividends or through capital
appreciation through an actively
managed portfolio of debt and money
market instruments. Income may be
generated through the receipt of coupon
payments, the amortization of the
discount on the debt instruments, receipt
of dividends or purchase and sale of
securities in the underlying portfolio.
Fund Details
Modified Duration :
Average Maturity :
Yield to Maturity :
0.13
0.13 years
6.58%
years
Following Plans of SBI Premier LiquidFund discontinued with effect from01/10/2012 for fresh purchase: SBIPremier Liquid Fund – Institutional Plan–Growth & Dividend / Weekly &Fortnightly Dividend.
PORTFOLIO CLASSIFICATION BY
RATING CLASS (%)
Commercial Papers 85.44
Certificate Of Deposits 8.09
Treasury Bills 7.12
Fixed Deposits 9.72
Net Current Assets -10.37
• Type of Scheme
Date of Allotment:
Report As On:
AAUM for the Month of December
2017
AUM as on December 29, 2017
Fund Manager:
Mr. Rajeev Radhakrishnan
Managing Since:
Total Experience:
Benchmark:
Exit Load:
Entry Load:
Plans Available:
Options:
SIP
Minimum Investment
Additional Investment
An Open - Ended Liquid Scheme
24/11/2003
29/12/2017
25,824.62 Crores
25,699.59 Crores
May-2010
Over 16 years
CRISIL Liquid Fund Index
NIL
N.A.
Regular, Direct
Growth, Dividend
N.A.
50,000 & in multiples of 1
10,000 & in multiples of 1
•
•
•
•
•
•
•
•
•
•
•
•
•
`
`
` `
` `
PORTFOLIO CLASSIFICATION BY
ASSET ALLOCATION (%)
Option NAV ( )`
Institutional-Daily Dividend 1003.2500
Institutional-Fortnightly Dividend 1025.5031
Institutional-Growth 2693.6078
Institutional-Weekly Dividend 1061.5158
Reg-Plan-Daily Dividend 1003.2500
Reg-Plan-Fortnightly Dividend 1014.1724
NET ASSET VALUE
Option NAV ( )`
Reg-Plan-Growth 2668.4917
Reg-Plan-Weekly Dividend 1062.2242
Dir-Plan-Daily Dividend 1003.2500
Dir-Plan-Fortnightly Dividend 1014.1936
Dir-Plan-Growth 2676.6375
Dir-Plan-Weekly Dividend 1062.2335
PORTFOLIO
NABARD CRISIL A1+ 9.11
Indiabulls Housing Finance Ltd. CRISIL A1+ 7.58
Nabha Power Ltd. [ICRA]A1+ 6.91
JSW Steel Ltd. [ICRA]A1+ 5.21
Vedanta Ltd. CRISIL A1+ 4.05
Piramal Enterprises Ltd. [ICRA]A1+ 3.39
Bharti Telecom Ltd. CRISIL A1+ 3.32
Hero Fincorp Ltd. CRISIL A1+ 2.86
Tata Motors Finance Ltd. [ICRA]A1+ 2.86
Indiabulls Commercial Credit Ltd. CRISIL A1+ 2.61
Piramal Finance Ltd. CRISIL A1+ 2.61
PNB Housing Finance Ltd. CRISIL A1+ 2.60
Edelweiss CommoditiesServices Ltd. [ICRA]A1+ 2.59
Manappuram Finance Ltd. CRISIL A1+ 2.46
Bahadur ChandInvestments Pvt. Ltd. [ICRA]A1+ 2.39
United Spirits Ltd. CRISIL A1+ 2.09
Tata Motors Finance Solutions Ltd. CRISIL A1+ 2.08
Aditya Birla Finance Ltd. [ICRA]A1+ 2.08
Tata Capital Financial Services Ltd. [ICRA]A1+ 1.57
India Infoline Housing Finance Ltd. CRISIL A1+ 1.57
Century Textiles & Industries Ltd. CRISIL A1+ 1.31
Cholamandalam InvestmentAnd Finance Company Ltd. [ICRA]A1+ 1.30
Dewan Housing FinanceCorporation Ltd. [ICRA]A1+ 1.04
Mahindra & Mahindra FinancialServices Ltd. CRISIL A1+ 1.04
Chambal Fertilisers AndChemicals Ltd. CRISIL A1+ 1.04
Aarti Industries Ltd. CRISIL A1+ 1.04
IIFL Wealth Finance Ltd. CRISIL A1+ 1.04
Steel Authority Of India Ltd. IND A1+ 0.78
IIFL Wealth Management Ltd. CRISIL A1+ 0.78
Tata Cleantech Capital Ltd. CRISIL A1+ 0.78
Shriram City Union Finance Ltd. [ICRA]A1+ 0.78
Barclays Investments AndLoans (India) Ltd. CRISIL A1+ 0.78
Axis Finance Ltd. CRISIL A1+ 0.78
Motilal Oswal Securities Ltd. CRISIL A1+ 0.65
Network18 Media &Investments Ltd. [ICRA]A1+ 0.52
KEC International Ltd. IND A1+ 0.52
HDFC Credila FinancialServices Pvt. Ltd. CRISIL A1+ 0.52
TVS Credit Services Ltd. CRISIL A1+ 0.52
Motilal Oswal FinancialServices Ltd. CRISIL A1+ 0.26
HDFC Bank Ltd. IND A1+ 7.81
NABARD CRISIL A1+ 0.29
91 Day T-Bill 01.03.18 SOVEREIGN 5.07
91 Day T-Bill 15.03.18 SOVEREIGN 2.05
RBL Bank Ltd. 4.73
Karur Vysya Bank Ltd. 3.94
Equitas Small Finance Bank Ltd. 1.05
Commercial Papers Total 85.44
Certificate Of Deposits Total 8.09
Treasury Bills Total 7.12
Fixed Deposits Total 9.72
Cash & Other Receivables -10.37
Grand Total 100.00
Issuer Name Rating (%) Of TotalAUM
Issuer Name Rating (%) Of TotalAUM
Investors understand that their principal
will be at Low risk
^Investors should consult their financial advisers if in doubt about whether the product is suitable for them.
A1+ Sovereign NCA (Incl. Cash, Deposits)
93.54
7.12 -0.65

48
�
�
Regular income for short term
Investment in Debt and Money Market securities
SBI Magnum InstaCash FundThis product is suitable for investors who are seeking^:
Investment Objective
Quantitative Data
To provide the investors an opportunity
to earn returns through investment in
debt & money market securities, while
having the benefit of a very high degree of
liquidity.
Fund Details
Modified Duration :
Average Maturity :
Yield to Maturity :
0.10
0.10 years
6.56%
years
PORTFOLIO CLASSIFICATION BY
RATING CLASS (%)
Commercial Papers 83.40
Certificate Of Deposits 8.14
Treasury Bills 4.14
Fixed Deposits 4.11
Non Convertible Debentures 2.05
Net Current Assets -1.84
•
•
•
•
•
•
•
•
•
•
•
•
•
•
Type of Scheme
Date of Allotment:
Report As On:
AAUM for the Month of December
2017
AUM as on December 29, 2017
Fund Manager:
Mr. Rajeev Radhakrishnan
Managing Since:
Total Experience:
Benchmark:
Exit Load:
Entry Load:
Plans Available:
Options:
SIP
Minimum Investment
Additional Investment
An Open - Ended Liquid Scheme
21/05/1999
29/12/2017
5,289.94 Crores
4,873.41 Crores
May-2010
Over 16 years
CRISIL Liquid Fund Index
Nil
N.A.
Regular, Direct
Growth, Dividend
N.A.
5,000 & in multiples of 1
1,000 & in multiples of 1
`
`
` `
` `PORTFOLIO CLASSIFICATION BY
ASSET ALLOCATION (%)
DEBT-LIQUID
Option NAV ( )`
Reg-Plan-Growth Option 3760.3588
Reg-Plan-Daily Dividend 1675.0300
Reg-Plan-Weekly Dividend 1078.7351
NET ASSET VALUE
Option NAV ( )`
Dir-Plan-Growth 3775.3415
Dir-Plan-Daily Dividend 1675.0300
Dir-Plan-Weekly Dividend 1078.7541
PORTFOLIO
HDFC Ltd. CRISIL AAA 2.05
Tata Capital Financial Services Ltd. [ICRA]A1+ 10.19
Tata Motor Finance Holdings Ltd. [ICRA]A1+ 10.00
Indiabulls Housing Finance Ltd. CRISIL A1+ 9.19
Talwandi Sabo Power Ltd. CRISIL A1+ 5.10
JSW Steel Ltd. [ICRA]A1+ 4.60
NABARD CRISIL A1+ 4.08
Haldia Energy Ltd. [ICRA]A1+ 4.07
Indian Railway FinanceCorporation Ltd. CRISIL A1+ 4.06
Axis Finance Ltd. CRISIL A1+ 3.06
Bharat Aluminium Company Ltd. CRISIL A1+ 3.06
Motilal Oswal FinancialServices Ltd. CRISIL A1+ 3.06
Motilal Oswal Securities Ltd. CRISIL A1+ 3.06
Birla TMT Holdings Pvt. Ltd. CRISIL A1+ 2.55
Dewan Housing FinanceCorporation Ltd. [ICRA]A1+ 2.04
Adani Ports And SpecialEconomic Zone Ltd. [ICRA]A1+ 2.04
Non Convertible Debentures Total 2.05
Trapti Trading & InvestmentsPrivate Ltd. [ICRA]A1+ 2.04
Tata Projects Ltd. CRISIL A1+ 2.04
Hinduja Leyland Finance Ltd. [ICRA]A1+ 2.04
HDB Financial Services Ltd. CRISIL A1+ 2.03
TV18 Broadcast Ltd. [ICRA]A1+ 1.53
Steel Authority Of India Ltd. IND A1+ 1.02
Afcons Infrastructure Ltd. [ICRA]A1+ 1.02
Cargill India Pvt. Ltd. [ICRA]A1+ 1.02
Supreme Industries Ltd. CRISIL A1+ 0.51
Axis Bank Ltd. CRISIL A1+ 4.08
RBL Bank Ltd. [ICRA]A1+ 4.06
91 Day T-Bill 08.03.18 SOVEREIGN 4.14
RBL Bank Ltd. 4.11
Commercial Papers Total 83.40
Certificate Of Deposits Total 8.14
Treasury Bills Total 4.14
Fixed Deposits Total 4.11
Cash & Other Receivables -1.84
Grand Total 100.00
Issuer Name Rating (%) Of TotalAUM
Issuer Name Rating (%) Of TotalAUM
Investors understand that their principal
will be at Low risk
^Investors should consult their financial advisers if in doubt about whether the product is suitable for them.
Note: Instant redemption facility available
upto 50,000. For further details visit:
www.sbimf.com
`
91.54
4.14
2.05
AAA,AA+ and Equivalent A1+
SovereignNCA (Incl. Cash, Deposits)
2.26

49
�
�
Regular income for short term
Investment in Debt and Money Market securities
SBI Magnum InstaCash Fund – Liquid FloaterThis product is suitable for investors who are seeking^:
Investment Objective
Quantitative Data
To mitigate interest rate risk and
generate opportunities for regular
income through a portfolio investing
predominantly in floating rate securities
and Money Market instruments.
Fund Details
Modified Duration :
Average Maturity :
Yield to Maturity :
0.003 Year
0.003 Year
6.00%
PORTFOLIO CLASSIFICATION BY
RATING CLASS (%)
CBLO 99.29
Net Current Assets 0.71
•
•
•
•
•
•
•
•
•
•
•
•
•
•
Type of Scheme
Date of Allotment:
Report As On:
AAUM for the Month of December
2017
AUM as on December 29, 2017
Fund Manager: Mr. R. Arun
Managing Since:
Total Experience:
Benchmark:
Exit Load:
Entry Load:
Plans Available:
Options:
SIP
Minimum Investment
Additional Investment
An Open - Ended Liquid Fund
01/10/2002
29/12/2017
49.09 Crores
49.12 Crores
Apr-2012
Over 11 years
CRISIL Liquid Fund Index
Nil
N.A.
Regular, Direct
Growth, Dividend
N.A.
5,000 & in multiples of 1
1,000 & in multiples of 1
`
`
` `
` `
PORTFOLIO CLASSIFICATION BY
ASSET ALLOCATION (%)
DEBT-LIQUID
Option NAV ( )`
Reg-Plan-Daily Dividend 1009.9100
Reg-Plan-Growth 2843.4400
Reg-Plan-Weekly Dividend 1032.1595
NET ASSET VALUE
Option NAV ( )`
Dir-Plan-Daily Dividend 1009.9100
Dir-Plan-Growth 2864.9432
Dir-Plan-Weekly Dividend 1032.1722
PORTFOLIO
CBLO 99.29
Cash & Other Receivables 0.71
Grand Total 100.00
Issuer Name (%) Of TotalAUM
Investors understand that their principal
will be at Low risk
^Investors should consult their financial advisers if in doubt about whether the product is suitable for them.
NCA (Incl. Cash, Deposits)
100.00

50
Comparative Performance for all Schemes
Note: Wherever NAV/Benchmark Index value is not available for start/end date for concerned period, the previous business day value of NAV/Benchmark Index is considered for return computation.
Managing Since
Jan-11
Inception Date
09-02-2004
Managing Since
Jan-11
Inception Date
25-11-1998
Managing Since
Jan-11
Inception Date
30-12-2000
Inception Date
30-12-2000
Managing Since
Jan-11
Inception Date
31-12-1995
Inception Date
09-04-2001
Inception Date
12-11-2003
Inception Date
21-12-2005
Managing Since
Jan-12
Managing Since
Jul-11
Managing Since
Jul-11
Managing Since
Jul-11
3.91 10,391 8.25 12,683 8.24 14,852 5.56 21,217
4.69 10,469 8.71 12,844 8.79 15,237 6.67 24,529
-0.07 9,993 7.26 12,338 6.95 13,988 5.44 20,888
5.71 10,571 8.33 12,711 8.23 14,845 7.76 41,692
4.69 10,469 8.71 12,844 8.79 15,237 N.A. N.A.
-0.07 9,993 7.26 12,338 6.95 13,988 N.A. N.A.
6.24 10,624 9.35 13,074 9.88 16,012 7.87 36,214
6.05 10,605 8.06 12,616 8.16 14,798 N.A. N.A.
5.83 10,583 7.11 12,286 7.15 14,120 6.28 28,116
3.87 10,387 9.05 12,966 10.60 16,546 8.16 37,988
2.23 10,223 8.67 12,829 9.27 15,574 N.A. N.A.
-0.07 9,993 7.26 12,338 6.95 13,988 N.A. N.A.
27.65 12,765 12.45 14,215 17.88 22,750 16.43 2,94,332
19.82 11,982 8.70 12,841 11.29 17,069 N.A. N.A.
27.91 12,791 7.40 12,385 11.89 17,531 10.66 95,054
8.49 10,849 9.72 13,206 10.16 16,218 8.34 38,210
8.04 10,804 8.78 12,870 9.45 15,699 N.A. N.A.
-0.07 9,993 7.26 12,338 6.95 13,988 N.A. N.A.
10.89 11,089 9.85 13,254 10.97 16,823 8.24 25,935
8.04 10,804 8.78 12,870 9.45 15,699 8.35 26,238
5.83 10,583 7.11 12,286 7.15 14,120 6.26 20,758
7.64 10,764 9.40 13,089 9.68 15,870 7.99 29,651
8.04 10,804 8.78 12,870 9.45 15,699 8.09 30,043
-0.07 9,993 7.26 12,338 6.95 13,988 5.38 20,967
SBI Dynamic Bond Fund
SBI Magnum Income Fund
SBI Magnum Gilt Fund - Short Term
SBI Magnum Gilt Fund - Long Term
SBI Magnum Balanced Fund
SBI Magnum Monthly Income Plan
SBI Magnum Monthly Income Plan - Floater
SBI Regular Savings Fund
Scheme Benchmark: - CRISIL Composite Bond Fund Index
Additional Benchmark: - CRISIL 10 Year Gilt Index
Scheme Benchmark: - CRISIL Composite Bond Fund Index
Additional Benchmark: - CRISIL 10 Year Gilt Index
Scheme Benchmark: - I-Sec Si-BEX
Additional Benchmark: - CRISIL 1 Year T-Bill Index
Scheme Benchmark: - I-Sec Li-BEX
Additional Benchmark: - CRISIL 10 Year Gilt Index
Scheme Benchmark: - CRISIL Balanced Fund - Aggressive Index
Additional Benchmark: - S&P BSE Sensex
Scheme Benchmark: - CRISIL MIP Blended Index
Additional Benchmark: - CRISIL 10 Year Gilt Index
Scheme Benchmark: - CRISIL MIP Blended Index
Additional Benchmark: - CRISIL 1 Year T-Bill Index
Scheme Benchmark: - CRISIL MIP Blended Index
Additional Benchmark: - CRISIL 10 Year Gilt Index
Funds Managed by Mr. Dinesh Ahuja
CAGR %Point-to-Point
returns on StandardInvestment ofRs. 10,000/-
CAGR %Point-to-Point
returns on StandardInvestment ofRs. 10,000/-
CAGR %Point-to-Point
returns on StandardInvestment ofRs. 10,000/-
3 Years 5 Years
CAGR %Point-to-Point
returns on StandardInvestment ofRs. 10,000/-
Since Inception
Inception Date &Managing Since
Managing Since
May-09
Inception Date
01-01-1991
1 Year
Managing Since
May-09
Inception Date
30-09-1994
Managing Since
May-09
Inception Date
11-10-2004
Inception Date
14-07-1999
Managing Since
Jun-11
Inception Date
09-09-2009
Managing Since
Nov-13
24.07 12,407 9.93 13,282 14.87 19,996 14.79 4,14,675
28.65 12,865 8.34 12,714 12.27 17,833 N.A. N.A.
27.91 12,791 7.40 12,385 11.89 17,531 N.A. N.A.
41.94 14,194 14.52 15,012 22.37 27,427 15.60 2,91,727
54.62 15,462 20.50 17,488 20.83 25,742 N.A. N.A.
27.91 12,791 7.40 12,385 11.89 17,531 9.32 79,553
44.73 14,473 15.58 15,435 17.59 22,470 21.80 1,37,470
35.94 13,594 11.86 13,993 14.63 19,788 15.36 66,827
27.91 12,791 7.40 12,385 11.89 17,531 14.61 61,241
40.23 14,023 12.80 14,346 15.80 20,810 20.60 3,19,899
31.52 13,152 9.65 13,179 13.05 18,458 13.41 1,02,560
27.91 12,791 7.40 12,385 11.89 17,531 11.83 79,084
78.66 17,866 29.73 21,818 37.76 49,570 24.72 62,706
59.64 15,964 20.17 17,345 21.13 26,058 12.58 26,771
27.91 12,791 7.40 12,385 11.89 17,531 9.37 21,044
SBI Magnum Equity Fund
SBI Magnum Global Fund
SBI Emerging Businesses Fund
SBI Contra Fund
SBI Small & Midcap Fund
Scheme Benchmark: - Nifty 50
Additional Benchmark: - S&P BSE Sensex
Scheme Benchmark: - S&P BSE MidSmallCap
Additional Benchmark: - S&P BSE Sensex
Scheme Benchmark: - S&P BSE 500
Additional Benchmark: - S&P BSE Sensex
Scheme Benchmark: - S&P BSE 100
Additional Benchmark: - S&P BSE Sensex
Scheme Benchmark: - S&P BSE SMALL CAP
Additional Benchmark: - S&P BSE Sensex
Funds Managed by Mr. R. Srinivasan
Notes:
a.
c. Past performance may or may not be sustained in future and the same may not necessarily provide the basis for comparison with other investment.d. Load is not considered for computation of returns.e. Period for which scheme’s performance has been provided is computed basis last day of the month-end preceding the date of advertisement. In case, the start/end date of the concerned period is a non-business day, the NAV of the
previous date is considered for computation of returns.
The details of the period since the Fund Manager is managing the scheme(s) & inception date provided alongside of the table. The total no of schemes managed by Mr. R.Srinivasan is 6 ( 1 scheme is jointly managed by Mr. DineshAhuja). The
total no of schemes managed by DineshAhuja is 8 ( 3 schemes are jointly managed by Mr. Ruchit Mehta & 1 scheme are jointly managed by Mr. R. Srinivasan)b. Different plans shall have a different expense structure. The performance provided for SBI Magnum Equity Fund, SBI Magnum Global Fund, SBI Contra Fund and SBI Magnum Balanced Fund are of regular plan- Dividend Option and is Net of
Dividend distribution tax, if any. Performance for all other scheme(s) are of Regular- growth option. SBI Magnum Equity Fund Growth option introduced on 27/11/06, SBI Magnum Global Fund Growth option introduced on 27/06/05, SBI Contra
Fund Growth option introduced on 06/05/05, SBI Magnum Balanced Fund Growth option introduced on 19/01/05. In case of return calculated the dividend option, it is assumed that dividend declared under the schemes have been reinvested
at the prevailing NAV.
f. Scheme count for the total schemes managed by the Fund Managers does not include close ended / interval scheme.
i. The data of the last working day has been considered for the calculation of performance.
Fund Jointly Managed by Mr. R. Srinivasan (Equity portion) & Mr. Dinesh Ahuja (Debt portion)
Fund Jointly Managed by Mr. Dinesh Ahuja (Debt portion) & Mr. Ruchit Mehta (Equity portion)

51
Comparative Performance for all Schemes
Notes:
a.
b.
c. Past performance may or may not be sustained in future and the same may not necessarily provide the basis for comparison with other investment.
d. Load is not considered for computation of returns.
e. Period for which scheme’s performance has been provided is computed basis last day of the month-end preceding the date of advertisement. In case, the start/end date of the concerned period is a non-business day, the NAV of the previous
date is considered for computation of returns.
f. Scheme count for the total schemes managed by the Fund Managers does not include ended / interval scheme.
The details of the period since the Fund Manager is managing the scheme(s) & inception date provided alongside of the table. The total no of schemes managed by Mr. Neeraj Kumar is 2 (1 scheme is jointly managed by Mr. Ruchit Mehta).
The total no of schemes managed by Mr.Anup Upadhyay is 2. The total no of schemes managed by Mr. Lokesh Mallya and Ms. Mansi Sajeja is 1
Different plans shall have a different expense structure. The performance provided for SBI IT Fund are of regular plan- Dividend Option and is Net of Dividend distribution tax, if any. SBI IT Fund Growth option introduced on 01/01/13. The
performance details provided for SBI Magnum MultiCap Fund, SBI Arbitrage Opportunities Fund, SBI Equity Savings Fund, SBI Magnum Monthly Income Plan, SBI Magnum Monthly Income Plan - Floater, SBI Regular Savings Fund, SBI
Corporate Bond Fund are of Growth Option-Regular Plan. In case of return calculated the dividend option, it is assumed that dividend declared under the schemes have been reinvested at the prevailing NAV.
close
g. SBI Equity Savings Fund scheme have not completed 3 & 5 years period & SBI Corporate Bond Fund scheme have not completed 5 years period, hence the performance of such period are not provided.
I. The data of the last working day has been considered for the calculation of performance.
CAGR %Point-to-Point
returns on StandardInvestment ofRs. 10,000/-
CAGR %Point-to-Point
returns on StandardInvestment ofRs. 10,000/-
CAGR %Point-to-Point
returns on StandardInvestment ofRs. 10,000/-
3 Years 5 Years
CAGR %Point-to-Point
returns on StandardInvestment ofRs. 10,000/-
Since Inception
Inception Date &Managing Since
Managing Since
Oct-12
Inception Date
03-11-2006SBI Arbitrage Opportunities Fund
SBI Equity Savings Fund
Scheme Benchmark: - CRISIL Liquid Fund Index
Additional Benchmark: - S&P BSE Sensex
Scheme Benchmark: - 30% Nifty 50 + 70%CRISIL Liquid Fund Index
Additional Benchmark: - S&P BSE Sensex
5.32 10,532 6.34 12,022 7.33 14,237 7.45 22,296
6.64 10,664 7.46 12,405 8.12 14,772 7.54 22,498
27.91 12,791 7.40 12,385 11.89 17,531 8.91 25,937
14.62 11,462 N.A. N.A. N.A. N.A. 9.21 12,569
12.91 11,291 N.A. N.A. N.A. N.A. 8.10 12,240
27.91 12,791 N.A. N.A. N.A. N.A. 8.49 12,355
1 Year
Managing Since
May-15
Inception Date
27-05-2015
Fund Jointly Managed by Mr. Neeraj Kumar (Arbitrage portion) & Mr. Ruchit Mehta (Equity & Debt portion)
Funds Managed by Mr. Neeraj Kumar
Managing Since
Jun-11
Inception Date
14-07-1999
SBI IT Fund
SBI Magnum MultiCap Fund
Scheme Benchmark: - S&P BSE - InformationTechnology
Additional Benchmark: - S&P BSE Sensex
Scheme Benchmark: - S&P BSE 500
Additional Benchmark: - S&P BSE Sensex
13.03 11,303 3.81 11,185 17.44 22,334 13.02 96,194
10.83 11,083 2.14 10,656 14.70 19,841 12.49 88,256
27.91 12,791 7.40 12,385 11.89 17,531 11.83 79,084
36.98 13,698 16.77 15,917 21.18 26,118 13.79 48,710
35.94 13,594 11.86 13,993 14.63 19,788 12.54 42,551
27.91 12,791 7.40 12,385 11.89 17,531 11.83 39,371Managing Since
Feb-17
Inception Date
29-09-2005
Managing Since
Feb-17
Inception Date
17-07-2014SBI Corporate Bond Fund
Scheme Benchmark: - CRISIL Composite Bond Fund
Additional Benchmark: - CRISIL 10 Year Gilt Index
6.89 10,689 9.03 12,956 N.A. N.A. 9.41 13,642
4.69 10,469 8.71 12,844 N.A. N.A. 9.67 13,756
-0.07 9,993 7.26 12,338 N.A. N.A. 8.77 13,372
Funds Managed by Mr. Lokesh Mallya and Ms. Mansi Sajeja
Funds Managed by Mr. Anup Upadhyay
Notes:
a. The details of the period since the Fund Manager is managing the scheme(s) & inception date provided alongside of the table. Mr. Raviprakash Sharma has been managing SBI GOLD Fund since September 2011 and SBI Nifty Index Fund sinceFebruary 2011. The total number of schemes managed by Mr. Raviprakash Sharma is 2.
b. Past performance may or may not be sustained in future and the same may not necessarily provide the basis for comparison with other investment.c. Load is not considered for computation of returns.d. Period for which scheme’s performance has been provided is computed basis last day of the month-end preceding the date of advertisement. In case, the start/end date of the concerned period is a non-business day, the NAV of the previous
date is considered for computation of returns.e. Different plans shall have a different expense structure. The performance provided for SBI GOLD Fund, are of regular plan - Dividend Option and is Net of Dividend distribution tax, if any. SBI
Magnum Taxgain Scheme Growth option introduced on 07/05/07. The performance details provided for SBI Nifty Index Fund are of Growth Option-Regular Plan.f. Scheme count for the total schemes managed by the Fund Managers does not include close ended / interval scheme.g. The data of the last working day has been considered for the calculation of performance.
CAGR %Point-to-Point
returns on StandardInvestment ofRs. 10,000/-
CAGR %Point-to-Point
returns on StandardInvestment ofRs. 10,000/-
CAGR %Point-to-Point
returns on StandardInvestment ofRs. 10,000/-
3 Years 5 Years
CAGR %Point-to-Point
returns on StandardInvestment ofRs. 10,000/-
Since Inception
Inception Date &Managing Since
Managing Since
Sep-11
Inception Date
12-09-2011
SBI Gold Fund
SBI Nifty Index Fund
Scheme Benchmark: - The Morning Fixing of Gold by LondonBullion Market Association (LBMA)
Additional Benchmark: - S&P BSE Sensex
Scheme Benchmark: - Nifty 50
Additional Benchmark: - S&P BSE Sensex
3.49 10,349 1.50 10,456 -2.59 8,772 -1.03 9,369
3.85 10,385 2.53 10,776 -0.93 9,545 0.58 10,373
27.91 12,791 7.40 12,385 11.89 17,531 12.19 20,638
29.13 12,913 8.56 12,791 12.13 17,721 14.73 89,609
28.65 12,865 8.34 12,714 12.27 17,833 15.15 94,940
27.91 12,791 7.40 12,385 11.89 17,531 15.53 1,00,133
1 Year
Managing Since
Feb-11
Inception Date
17-01-2002
Funds Managed by Mr. Ravi Prakash Sharma

52
Comparative Performance for all Schemes
Notes:
a.
b.
c. Past performance may or may not be sustained in future and the same may not necessarily provide the basis for comparison with other investment.
d. Load is not considered for computation of returns.
e. Period for which scheme’s performance has been provided is computed basis last day of the month-end preceding the date of advertisement. In case, the start/end date of the concerned period is a non-business day, the NAV of the previous
date is considered for computation of returns.
f. Scheme count for the total schemes managed by the Fund Managers does not include ended / interval scheme.
The details of the period since the Fund Manager is managing the scheme(s) & inception date provided alongside of the table. The total no of schemes managed by Mr. Saurabh Pant is 2. The total no of schemes managed by Mr.Tanmaya Desai
is 1.
Different plans shall have a different expense structure. The performance provided for SBI FMCG Fund, SBI Magnum Multiplier Fund, SBI Pharma Fund are of regular plan- Dividend Option and is Net of Dividend distribution tax, if any. SBI
FMCG Fund Growth option introduced on 01/01/13, SBI Magnum Multiplier Fund Growth option introduced on 25/05/05, SBI Pharma Fund Growth option introduced on 31/12/04. In case of return calculated the dividend option, it is assumed
that dividend declared under the schemes have been reinvested at the prevailing NAV.
close
i. The data of the last working day has been considered for the calculation of performance.
CAGR %Point-to-Point
returns on StandardInvestment ofRs. 10,000/-
CAGR %Point-to-Point
returns on StandardInvestment ofRs. 10,000/-
CAGR %Point-to-Point
returns on StandardInvestment ofRs. 10,000/-
3 Years 5 Years
CAGR %Point-to-Point
returns on StandardInvestment ofRs. 10,000/-
Since Inception
Inception Date &Managing Since
Managing Since
Jun-11
Inception Date
14-07-1999
SBI FMCG Fund
SBI Magnum Multiplier Fund
Scheme Benchmark: - S&P BSE Fast MovingConsumer Goods Index
Additional Benchmark: - S&P BSE Sensex
Scheme Benchmark: - S&P BSE 200
Additional Benchmark: - S&P BSE Sensex
53.10 15,310 18.21 16,510 18.77 23,618 16.24 1,61,793
31.54 13,154 11.27 13,771 12.58 18,078 12.25 84,853
27.91 12,791 7.40 12,385 11.89 17,531 11.83 79,084
40.46 14,046 16.15 15,664 20.76 25,672 15.20 3,36,829
33.26 13,326 10.94 13,649 14.06 19,299 11.57 1,51,857
27.91 12,791 7.40 12,385 11.89 17,531 10.60 1,22,349Managing Since
Sep-16
Inception Date
28-02-1993
1 Year
Funds Managed by Mr. Saurabh Pant
Managing Since
Jun-11
Inception Date
14-07-1999SBI Pharma Fund
Scheme Benchmark: - S&P BSE Health Care
Additional Benchmark: - S&P BSE Sensex
2.06 10,206 3.70 11,149 17.14 22,048 16.62 1,71,960
0.49 10,049 0.24 10,072 12.73 18,198 14.14 1,15,521
27.91 12,791 7.40 12,385 11.89 17,531 11.83 79,084
Funds Managed by Mr. Tanmaya Desai
Notes:
a. Ms. SohiniAndani has been managing SBI Blue Chip Fund since September 2010, SBI Magnum Midcap Fund sinceJuly 2010 and SBI Banking and Financial Services Fund since February 2015. The total number of schemes managed by Ms. SohiniAndani is 3.
b. Past performance may or may not be sustained in future and the same may not necessarily provide the basis for comparison with other investment.c. Load is not considered for computation of returns.d. Period for which scheme’s performance has been provided is computed basis last day of the month-end preceding the date of advertisement. In case, the start/end date of the concerned period is a non-business day, the NAV of the previous date
is considered for computation of returns.e. Different plans shall have a different expense structure. The performance details provided herein are of Growth Option - Regular Plan. Performance for Schemes not having Growth Option has been calculated considering the Dividend Option
and is Net of Dividend distribution tax, if any.f. Scheme count for the total schemes managed by the Fund Managers does not include ended / interval scheme.close endedg. SBI Banking & Financial Services Fund scheme has not completed 3 & 5 years period, hence the performance of such period are not provided.i. The data of the last working day has been considered for the calculation of performance.
The details of the period since the Fund Manager is managing the scheme(s) & inception date provided alongside of the table.
CAGR %Point-to-Point
returns on StandardInvestment ofRs. 10,000/-
CAGR %Point-to-Point
returns on StandardInvestment ofRs. 10,000/-
CAGR %Point-to-Point
returns on StandardInvestment ofRs. 10,000/-
3 Years 5 Years
CAGR %Point-to-Point
returns on StandardInvestment ofRs. 10,000/-
Since Inception
Inception Date &Managing Since
Managing Since
July-10
Inception Date
29-03-2005
SBI Magnum MidCap Fund
SBI Blue Chip Fund
SBI Banking & Financial Services Fund
Scheme Benchmark: - Nifty MidSmallcap 400
Additional Benchmark: - S&P BSE Sensex
Scheme Benchmark: - S&P BSE 100
Additional Benchmark: - S&P BSE Sensex
Scheme Benchmark: - Nifty Financial Services
Additional Benchmark: - S&P BSE Sensex
33.49 13,349 17.23 16,105 25.77 31,450 18.42 86,518
55.28 15,528 20.68 17,569 22.29 27,334 N.A. N.A.
27.91 12,791 7.40 12,385 11.89 17,531 14.04 53,482
30.23 13,023 13.83 14,742 18.60 23,450 12.10 38,834
31.52 13,152 9.65 13,179 13.05 18,458 11.31 35,714
27.91 12,791 7.40 12,385 11.89 17,531 10.79 33,764
40.69 14,069 N.A. N.A. N.A. N.A. 15.91 15,212
41.42 14,142 N.A. N.A. N.A. N.A. 11.38 13,584
27.91 12,791 N.A. N.A. N.A. N.A. 6.15 11,847
1 Year
Managing Since
Sep-10
Inception Date
14-02-2006
Managing Since
Feb-15
Inception Date
26-02-2015
Funds Managed by Ms. Sohini Andani

53
Comparative Performance for all Schemes
Notes:
a. Mr. R.Arun has been managing SBI Savings Fund and SBI Magnum InstaCash Fund – Liquid Floater Plan sinceApril2012. The total number of schemes managed by Mr. R.Arun is 2.
b. Past performance may or may not be sustained in future and the same may not necessarily provide the basis for comparison with other investment.c. Load is not considered for computation of returns.d. Period for which scheme’s performance has been provided is computed basis last day of the month-end preceding the date of advertisement. In case, the start/end date of the concerned period is a non-business day, the NAV of the previous date
is considered for computation of returns.e. Different plans shall have a different expense structure. The performance details provided herein are of Growth Option - Regular Plan. Performance for Schemes not having Growth Option has been calculated considering the Dividend Option
and is Net of Dividend distribution tax, if any.f. Scheme count for the total schemes managed by the Fund Managers does not include ended / interval scheme.closei. The data of the last working day has been considered for the calculation of performance.
The details of the period since the Fund Manager is managing the scheme(s) & inception date provided alongside of the table.
CAGR %Point-to-Point
returns on StandardInvestment ofRs. 10,000/-
CAGR %Point-to-Point
returns on StandardInvestment ofRs. 10,000/-
CAGR %Point-to-Point
returns on StandardInvestment ofRs. 10,000/-
3 Years 5 Years
CAGR %Point-to-Point
returns on StandardInvestment ofRs. 10,000/-
Since Inception
Inception Date &Managing Since
Managing Since
Apr-12
Inception Date
01-10-2002SBI Magnum InstaCash Fund - Liquid Floater
SBI Savings Fund
Scheme Benchmark: - CRISIL Liquid Fund Index
Additional Benchmark: - CRISIL 1 Year T-Bill Index
Scheme Benchmark: - CRISIL Liquid Fund Index
Additional Benchmark: - CRISIL 1 Year T-Bill Index
5.76 10,576 6.76 12,172 7.58 14,410 7.08 28,406
6.66 10,666 7.45 12,410 8.12 14,777 6.79 27,262
5.85 10,585 7.11 12,290 7.15 14,124 5.94 24,138
6.34 10,634 7.66 12,475 8.22 14,842 7.51 26,491
6.64 10,664 7.46 12,405 8.12 14,772 7.10 25,163
5.83 10,583 7.11 12,286 7.15 14,120 6.04 22,012
Managing Since
Apr-12
Inception Date
19-07-2004
1 Year
Funds Managed by Mr. R. Arun
Notes:
a. Mr. Dinesh Balachandran has been managing SBI Magnum Taxgain Scheme since September 2016 and comanaging SBI Dynamic Asset Allocation Fund (Equity & Equity related instruments and Debt & Money Market instruments portion) since March 2015 with Mr. Mohit Jain (investments in foreign securities portion). The total number ofschemes managed by Mr. Dinesh Balachandran is 2.
b. Mr. Mohit Jain is the fund manager for investment in foreign securities in SBI DynamicAssetAllocation fund w.e.f. Nov 28, 2017*.c. Past performance may or may not be sustained in future and the same may not necessarily provide the basis for comparison with other investment.d. Load is not considered for computation of returns.e. Period for which scheme’s performance has been provided is computed basis last day of the month-end preceding the date of advertisement. In case, the start/end date of the concerned period is a non-business day, the NAV of the previous date
is considered for computation of returns.f. Different plans shall have a different expense structure. The performance provided for SBI Magnum Taxgain Scheme, are of regular plan - Dividend Option and is Net of Dividend distribution tax, if any. SBI
Magnum Taxgain Scheme Growth option introduced on 07/05/07. The performance details provided for SBI DynamicAssetAllocation Fund are of Growth Option-Regular Plan.g. Scheme count for the total schemes managed by the Fund Managers does not include ended / interval scheme.closeh. SBI Dynamic Asset Allocation Fund scheme has not completed 3 & 5 years period, hence the performance of such period are not provided.i. The data of the last working day has been considered for the calculation of performance.
The details of the period since the Fund Manager is managing the scheme(s) & inception date provided alongside of the table.
CAGR %Point-to-Point
returns on StandardInvestment ofRs. 10,000/-
CAGR %Point-to-Point
returns on StandardInvestment ofRs. 10,000/-
CAGR %Point-to-Point
returns on StandardInvestment ofRs. 10,000/-
3 Years 5 Years
CAGR %Point-to-Point
returns on StandardInvestment ofRs. 10,000/-
Since Inception
Inception Date &Managing Since
Managing Since
Sep-16
Inception Date
31-03-1993
SBI Magnum Taxgain Scheme
SBI Dynamic Asset Allocation Fund
Scheme Benchmark: - S&P BSE 100
Additional Benchmark: - S&P BSE Sensex
Scheme Benchmark: - 50% CRISIL 1 year CD Index +50% BSE S&P Sensex
Additional Benchmark: - S&P BSE Sensex
33.04 13,304 11.93 14,018 17.49 22,377 16.78 4,65,719
31.52 13,152 9.65 13,179 13.05 18,458 12.53 1,86,185
27.91 12,791 7.40 12,385 11.89 17,531 11.54 1,49,338
16.95 11,695 N.A. N.A. N.A. N.A. 7.22 12,126
16.49 11,649 N.A. N.A. N.A. N.A. 8.12 12,407
27.91 12,791 N.A. N.A. N.A. N.A. 8.10 12,403
1 Year
Managing Since
Mar-15
Inception Date
26-03-2015
Fund Jointly Managed by Mr. Dinesh Balachandran (Equity & Debt portion)*
Funds Managed by Mr. Dinesh Balachandran

54
Comparative Performance for all Schemes
Notes:
a. Mr. Rajeev Radhakrishnan is also the Fund Manager of other close-ended schemes like SBI Debt Fund Series andmanages the debt portion of the SBI DualAdvantage Fund Series.
b. Past performance may or may not be sustained in future and the same may not necessarily provide the basis for comparison with other investment.c. Load is not considered for computation of returns.d. Period for which scheme’s performance has been provided is computed basis last day of the month-end preceding the date of advertisement. In case, the start/end date of the concerned period is a non-business day, the NAV of the previous date
is considered for computation of returns.e. Different plans shall have a different expense structure. The performance details of all the schemes provided herein are of Growth Option - Regular Plan. Performance for Schemes not having Growth Option has been calculated considering the
Dividend Option and is Net of Dividend distribution tax, if any.f. Scheme count for the total schemes managed by the Fund Managers does not include ended / interval scheme.closei. The data of the last working day has been considered for the calculation of performance.
The details of the period since the Fund Manager is managing the scheme(s) & inception date provided alongside of the table.
CAGR %Point-to-Point
returns on StandardInvestment ofRs. 10,000/-
CAGR %Point-to-Point
returns on StandardInvestment ofRs. 10,000/-
CAGR %Point-to-Point
returns on StandardInvestment ofRs. 10,000/-
3 Years 5 Years
CAGR %Point-to-Point
returns on StandardInvestment ofRs. 10,000/-
Since Inception
Inception Date &Managing Since
Managing Since
Jun-08
Inception Date
27-07-2007
1 Year
Managing Since
Jun-08
Inception Date
27-07-2007
Managing Since
Jun-08
Inception Date
21-02-2002
Inception Date
09-10-2009
Inception Date
21-05-1999
Inception Date
24-11-2003
Managing Since
Nov-13
Managing Since
May-10
Managing Since
May-10
6.62 10,662 7.86 12,545 8.34 14,923 7.85 22,007
6.64 10,664 7.46 12,405 8.12 14,772 7.49 21,251
5.83 10,583 7.11 12,286 7.15 14,120 6.31 18,928
5.74 10,574 7.93 12,569 8.35 14,927 6.71 19,694
6.03 10,603 8.17 12,653 8.64 15,134 8.02 22,374
5.83 10,583 7.11 12,286 7.15 14,120 6.31 18,928
24.28 12,428 15.59 15,440 15.14 20,227 11.32 54,767
8.04 10,804 8.78 12,870 9.45 15,699 N.A. N.A.
-0.07 9,993 7.26 12,338 6.95 13,988 6.48 27,093
6.39 10,639 7.82 12,532 8.36 14,936 8.06 18,923
5.88 10,588 7.72 12,495 8.11 14,762 N.A. N.A.
5.83 10,583 7.11 12,286 7.15 14,120 6.51 16,802
6.60 10,660 7.52 12,431 8.18 14,817 7.36 37,530
6.66 10,666 7.45 12,410 8.12 14,777 N.A. N.A.
5.85 10,585 7.11 12,290 7.15 14,124 6.55 32,588
6.55 10,655 7.47 12,414 8.13 14,785 7.68 22,205
6.66 10,666 7.45 12,410 8.12 14,777 7.57 21,971
5.85 10,585 7.11 12,290 7.15 14,124 6.43 19,580
SBI Ultra Short Term Debt Fund
SBI Short Term Debt Fund
SBI Magnum Children's Benefit Plan
SBI Treasury Advantage Fund
SBI Magnum InstaCash Fund
SBI Premier Liquid Fund
Scheme Benchmark: - CRISIL Liquid Fund Index
Additional Benchmark: - CRISIL 1 Year T-Bill Index
Scheme Benchmark: - CRISIL Short Term Bond Fund Index
Additional Benchmark: - CRISIL 1 Year T-Bill Index
Scheme Benchmark: - CRISIL MIP Blended Index
Additional Benchmark: - CRISIL 10 Year Gilt Index
Scheme Benchmark: - CRISIL 1 Year CD Index
Additional Benchmark: - CRISIL 1 Year T-Bill Index
Scheme Benchmark: - CRISIL Liquid Fund Index
Additional Benchmark: - CRISIL 1 Year T-Bill Index
Scheme Benchmark: - CRISIL Liquid Fund Index
Additional Benchmark: - CRISIL 1 Year T-Bill Index
Funds Managed by Mr. Rajeev Radhakrishnan
Notes:
a. The total number of schemes managed by Mr. Richard D’souza is 3.b. Past performance may or may not be sustained in future and the same may not necessarily provide the basis for comparison with other investment.c. Load is not considered for computation of returns.d. Period for which scheme’s performance has been provided is computed basis last day of the month-end preceding the date of advertisement. In case, the start/end date of the concerned period is a non-business day, the NAV of the previous date
is considered for computation of returns.e. Different plans shall have a different expense structure. The performance details provided herein are of Growth Option - Regular Plan. Performance for Schemes not having Growth Option has been calculated considering the Dividend Option
and is Net of Dividend distribution tax, if any.f. Scheme count for the total schemes managed by the Fund Managers does not include ended / interval scheme.closei. The data of the last working day has been considered for the calculation of performance.
The details of the period since the Fund Manager is managing the scheme(s) & inception date provided alongside of the table.
CAGR %Point-to-Point
returns on StandardInvestment ofRs. 10,000/-
CAGR %Point-to-Point
returns on StandardInvestment ofRs. 10,000/-
CAGR %Point-to-Point
returns on StandardInvestment ofRs. 10,000/-
3 Years 5 Years
CAGR %Point-to-Point
returns on StandardInvestment ofRs. 10,000/-
Since Inception
Inception Date &Managing Since
Managing Since
Aug-14
Inception Date
08-08-2005SBI Magnum Comma Fund
SBI Infrastructure Fund
SBI PSU Fund
Scheme Benchmark: - Nifty Commodities
Additional Benchmark: - S&P BSE Sensex
Scheme Benchmark: - Nifty Infrastructure
Additional Benchmark: - S&P BSE Sensex
Scheme Benchmark: - S&P BSE PSU Index
Additional Benchmark: - S&P BSE Sensex
39.22 13,922 20.02 17,280 14.59 19,750 12.28 42,068
34.75 13,475 15.00 15,204 10.14 16,207 10.92 36,167
27.91 12,791 7.40 12,385 11.89 17,531 12.85 44,775
41.74 14,174 16.75 15,906 15.73 20,756 5.42 17,394
34.11 13,411 6.17 11,966 7.07 14,072 -0.63 9,357
27.91 12,791 7.40 12,385 11.89 17,531 8.15 22,759
21.95 12,195 8.02 12,601 9.15 15,488 3.46 12,902
19.27 11,927 3.70 11,150 4.58 12,507 -0.29 9,785
27.91 12,791 7.40 12,385 11.89 17,531 9.33 19,493
Managing Since
Aug-14
Inception Date
06-07-2007
1 Year
Funds Managed by Mr. Richard D'souza
Managing Since
Aug-14
Inception Date
07-07-2010
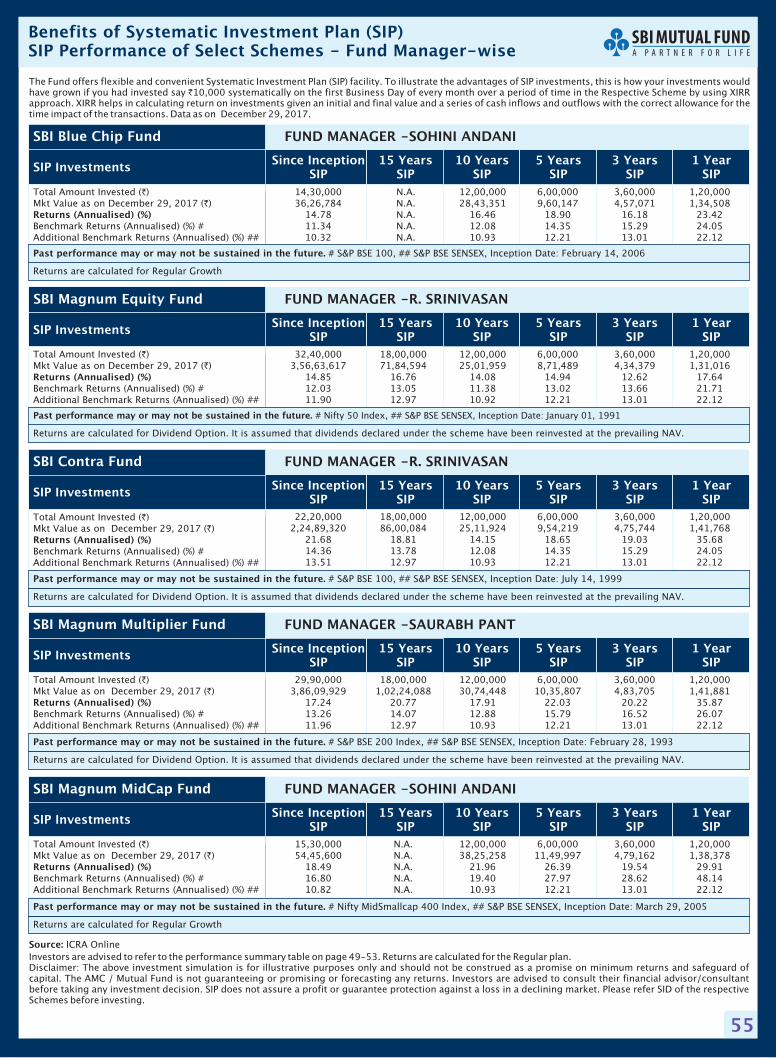
55
The Fund offers flexible and convenient Systematic Investment Plan (SIP) facility. To illustrate the advantages of SIP investments, this is how your investments wouldhave grown if you had invested say 10,000 systematically on the first Business Day of every month over a period of time in the Respective Scheme by using XIRRapproach. XIRR helps in calculating return on investments given an initial and final value and a series of cash inflows and outflows with the correct allowance for thetime impact of the transactions. Data as on December 29, 2017.
`
Investors are advised to refer to the performance summary table on page 49-53. Returns are calculated for the Regular plan.Disclaimer: The above investment simulation is for illustrative purposes only and should not be construed as a promise on minimum returns and safeguard ofcapital. The AMC / Mutual Fund is not guaranteeing or promising or forecasting any returns. Investors are advised to consult their financial advisor/consultantbefore taking any investment decision. SIP does not assure a profit or guarantee protection against a loss in a declining market. Please refer SID of the respectiveSchemes before investing.
Source: ICRA Online
Benefits of Systematic Investment Plan (SIP)SIP Performance of Select Schemes - Fund Manager-wise
32,40,000 18,00,000 12,00,000 6,00,000 3,60,000 1,20,0003,56,63,617 71,84,594 25,01,959 8,71,489 4,34,379 1,31,016
14.85 16.76 14.08 14.94 12.62 17.6412.03 13.05 11.38 13.02 13.66 21.7111.90 12.97 10.92 12.21 13.01 22.12
Total Amount Invested ( )Mkt Value as on December 29, 2017 ( )
Benchmark Returns (Annualised) (%) #Additional Benchmark Returns (Annualised) (%) ##
`
`
Returns (Annualised) (%)
SIP Investments
Past performance may or may not be sustained in the future. # Nifty 50 Index, ## S&P BSE SENSEX, Inception Date: January 01, 1991
Returns are calculated for Dividend Option. It is assumed that dividends declared under the scheme have been reinvested at the prevailing NAV.
SBI Magnum Equity Fund FUND MANAGER -R. SRINIVASAN
22,20,000 18,00,000 12,00,000 6,00,000 3,60,000 1,20,0002,24,89,320 86,00,084 25,11,924 9,54,219 4,75,744 1,41,768
21.68 18.81 14.15 18.65 19.03 35.6814.36 13.78 12.08 14.35 15.29 24.0513.51 12.97 10.93 12.21 13.01 22.12
Total Amount Invested ( )Mkt Value as on December 29, 2017 ( )
Benchmark Returns (Annualised) (%) #Additional Benchmark Returns (Annualised) (%) ##
`
`
Returns (Annualised) (%)
SIP Investments
Past performance may or may not be sustained in the future. # S&P BSE 100, ## S&P BSE SENSEX, Inception Date: July 14, 1999
Returns are calculated for Dividend Option. It is assumed that dividends declared under the scheme have been reinvested at the prevailing NAV.
SBI Contra Fund FUND MANAGER -R. SRINIVASAN
14,30,000 N.A. 12,00,000 6,00,000 3,60,000 1,20,00036,26,784 N.A. 28,43,351 9,60,147 4,57,071 1,34,508
14.78 N.A. 16.46 18.90 16.18 23.4211.34 N.A. 12.08 14.35 15.29 24.0510.32 N.A. 10.93 12.21 13.01 22.12
Total Amount Invested ( )Mkt Value as on December 29, 2017 ( )
Benchmark Returns (Annualised) (%) #Additional Benchmark Returns (Annualised) (%) ##
`
`
Returns (Annualised) (%)
SIP Investments
Past performance may or may not be sustained in the future. # S&P BSE 100, ## S&P BSE SENSEX, Inception Date: February 14, 2006
Returns are calculated for Regular Growth
SBI Blue Chip Fund FUND MANAGER -SOHINI ANDANI
29,90,000 18,00,000 12,00,000 6,00,000 3,60,000 1,20,0003,86,09,929 1,02,24,088 30,74,448 10,35,807 4,83,705 1,41,881
17.24 20.77 17.91 22.03 20.22 35.8713.26 14.07 12.88 15.79 16.52 26.0711.96 12.97 10.93 12.21 13.01 22.12
Total Amount Invested ( )Mkt Value as on December 29, 2017 ( )
Benchmark Returns (Annualised) (%) #Additional Benchmark Returns (Annualised) (%) ##
`
`
Returns (Annualised) (%)
SIP Investments
Past performance may or may not be sustained in the future. # S&P BSE 200 Index, ## S&P BSE SENSEX, Inception Date: February 28, 1993
Returns are calculated for Dividend Option. It is assumed that dividends declared under the scheme have been reinvested at the prevailing NAV.
SBI Magnum Multiplier Fund FUND MANAGER -SAURABH PANT
15,30,000 N.A. 12,00,000 6,00,000 3,60,000 1,20,00054,45,600 N.A. 38,25,258 11,49,997 4,79,162 1,38,378
18.49 N.A. 21.96 26.39 19.54 29.9116.80 N.A. 19.40 27.97 28.62 48.1410.82 N.A. 10.93 12.21 13.01 22.12
Total Amount Invested ( )Mkt Value as on December 29, 2017 ( )
Benchmark Returns (Annualised) (%) #Additional Benchmark Returns (Annualised) (%) ##
`
`
Returns (Annualised) (%)
SIP Investments
Past performance may or may not be sustained in the future. # Nifty MidSmallcap 400 Index, ## S&P BSE SENSEX, Inception Date: March 29, 2005
Returns are calculated for Regular Growth
SBI Magnum MidCap Fund FUND MANAGER -SOHINI ANDANI
Since InceptionSIP
15 YearsSIP
10 YearsSIP
5 YearsSIP
3 YearsSIP
1 YearSIP
Since InceptionSIP
15 YearsSIP
10 YearsSIP
5 YearsSIP
3 YearsSIP
1 YearSIP
Since InceptionSIP
15 YearsSIP
10 YearsSIP
5 YearsSIP
3 YearsSIP
1 YearSIP
Since InceptionSIP
15 YearsSIP
10 YearsSIP
5 YearsSIP
3 YearsSIP
1 YearSIP
Since InceptionSIP
15 YearsSIP
10 YearsSIP
5 YearsSIP
3 YearsSIP
1 YearSIP

56
The Fund offers flexible and convenient Systematic Investment Plan (SIP) facility. To illustrate the advantages of SIP investments, this is how your investments wouldhave grown if you had invested say 10,000 systematically on the first Business Day of every month over a period of time in the Respective Scheme by using XIRRapproach. XIRR helps in calculating return on investments given an initial and final value and a series of cash inflows and outflows with the correct allowance for thetime impact of the transactions. Data as on December 29, 2017.
`
Investors are advised to refer to the performance summary table on page 49-53. Returns are calculated for the Regular plan.Disclaimer: The above investment simulation is for illustrative purposes only and should not be construed as a promise on minimum returns and safeguard ofcapital. The AMC / Mutual Fund is not guaranteeing or promising or forecasting any returns. Investors are advised to consult their financial advisor/consultantbefore taking any investment decision. SIP does not assure a profit or guarantee protection against a loss in a declining market. Please refer SID of the respectiveSchemes before investing.
Benefits of Systematic Investment Plan (SIP)SIP Performance of Select Schemes - Fund Manager-wise
26,40,000 18,00,000 12,00,000 6,00,000 3,60,000 1,20,0002,42,41,198 73,21,904 27,22,646 9,36,669 4,52,904 1,36,034
17.21 16.98 15.65 17.89 15.54 25.9610.77 11.33 10.64 11.74 11.71 15.0512.73 12.97 10.93 12.21 13.01 22.12
Total Amount Invested ( )Mkt Value as on December 29, 2017 ( )
Benchmark Returns (Annualised) (%) #Additional Benchmark Returns (Annualised) (%) ##
`
`
Returns (Annualised) (%)
SIP Investments
Past performance may or may not be sustained in the future. # CRISIL Balanced Fund - Aggressive Index, ## S&P BSE SENSEX, Inception Date: December 31, 1995
Returns are calculated for Dividend Option. It is assumed that dividends declared under the scheme have been reinvested at the prevailing NAV.
SBI Magnum Balanced Fund FUND MANAGER -R. SRINIVASAN (Equity) & DINESH AHUJA (Debt)
29,80,000 18,00,000 12,00,000 6,00,000 3,60,000 1,20,0005,21,03,230 98,37,626 27,10,157 9,43,287 4,57,578 1,37,280
19.17 20.33 15.57 18.18 16.26 28.0612.95 13.78 12.08 14.35 15.29 24.0512.02 12.97 10.93 12.21 13.01 22.12
Total Amount Invested ( )Mkt Value as on December 29, 2017 ( )
Benchmark Returns (Annualised) (%) #Additional Benchmark Returns (Annualised) (%) ##
`
`
Returns (Annualised) (%)
SIP Investments
Past performance may or may not be sustained in the future. # S&P BSE 100, ## S&P BSE SENSEX, Inception Date: March 31, 1993
Returns are calculated for Dividend Option. It is assumed that dividends declared under the scheme have been reinvested at the prevailing NAV.
SBI Magnum Taxgain Scheme FUND MANAGER -DINESH BALACHANDRAN
28,00,000 18,00,000 12,00,000 6,00,000 3,60,000 1,20,0004,79,85,485 1,22,88,714 36,25,867 10,66,818 4,82,337 1,48,487
20.40 22.84 20.97 23.26 20.01 47.3210.32 14.39 18.26 26.81 28.64 49.1512.45 12.97 10.93 12.21 13.01 22.12
Total Amount Invested ( )Mkt Value as on December 29, 2017 ( )
Benchmark Returns (Annualised) (%) #Additional Benchmark Returns (Annualised) (%) ##
`
`
Returns (Annualised) (%)
Since InceptionSIP
15 YearsSIP
10 YearsSIP
5 YearsSIP
3 YearsSIP
1 YearSIP
SIP Investments
Past performance may or may not be sustained in the future. # S&P BSE MIDSMALL CAP, ## S&P BSE SENSEX, Inception Date: September 30, 1994
Returns are calculated for Dividend Option. It is assumed that dividends declared under the scheme have been reinvested at the prevailing NAV.
SBI Magnum Global Fund FUND MANAGER -R. SRINIVASAN
15,90,000 N.A. 12,00,000 6,00,000 3,60,000 1,20,00061,37,129 N.A. 36,78,708 10,48,847 4,99,706 1,47,516
18.78 N.A. 21.24 22.55 22.57 45.6212.73 N.A. 13.32 16.87 17.92 28.6611.21 N.A. 10.93 12.21 13.01 22.12
Total Amount Invested ( )Mkt Value as on December 29, 2017 ( )
Benchmark Returns (Annualised) (%) #Additional Benchmark Returns (Annualised) (%) ##
`
`
Returns (Annualised) (%)
Since InceptionSIP
15 YearsSIP
10 YearsSIP
5 YearsSIP
3 YearsSIP
1 YearSIP
SIP Investments
Past performance may or may not be sustained in the future. # S&P BSE 500, ## S&P BSE SENSEX, Inception Date: October 11, 2004
Returns are calculated for Regular Growth
SBI Emerging Businesses Fund FUND MANAGER -R. SRINIVASAN
10,00,000 N.A. N.A. 6,00,000 3,60,000 1,20,00039,28,383 N.A. N.A. 16,61,394 6,36,754 1,70,737
31.87 N.A. N.A. 42.18 40.91 87.7618.48 N.A. N.A. 28.62 30.22 54.0210.86 N.A. N.A. 12.21 13.01 22.12
Total Amount Invested ( )Mkt Value as on December 29, 2017 ( )
Benchmark Returns (Annualised) (%) #Additional Benchmark Returns (Annualised) (%) ##
`
`
Returns (Annualised) (%)
SIP Investments
Past performance may or may not be sustained in the future. # S&P BSE SMALL CAP, ## S&P BSE SENSEX, Inception Date: September 09, 2009
Returns are calculated for Regular Growth
SBI Small & Midcap Fund FUND MANAGER -R. SRINIVASAN
Since InceptionSIP
15 YearsSIP
10 YearsSIP
5 YearsSIP
3 YearsSIP
1 YearSIP
Since InceptionSIP
15 YearsSIP
10 YearsSIP
5 YearsSIP
3 YearsSIP
1 YearSIP
Since InceptionSIP
15 YearsSIP
10 YearsSIP
5 YearsSIP
3 YearsSIP
1 YearSIP

57
Statutory Details & Risk Factors
Mutual Fund investments are subject to market risks, read all scheme related documents carefully.
Disclaimer: In the preparation of the material contained in this document, the Asset Management Company (AMC) has used information that
is publicly available, including information developed in-house. Some of the material used in the document may have been obtained from
members/persons other than the AMC and/or its affiliates and which may have been made available to the AMC and/or to its affiliates.
Information gathered and material used in this document is believed to be from reliable sources. The AMC however does not warrant the
accuracy, reasonableness and / or completeness of any information. We have included statements / opinions / recommendations in this
document, which contain words, or phrases such as “will”, “expect”, “should”, “believe” and similar expressions or variations of such
expressions that are “forward looking statements”. Actual results may differ materially from those suggested by the forward looking
statements due to risk or uncertainties associated with our expectations with respect to, but not limited to, exposure to market risks, general
economic and political conditions in India and other countries globally, which have an impact on our services and / or investments, the
monetary and interest policies of India, inflation, deflation, unanticipated turbulence in interest rates, foreign exchange rates, equity prices
or other rates or prices etc.
The AMC (including its affiliates), the Mutual Fund, the trust and any of its officers, directors, personnel and employees, shall not be liable for
any loss, damage of any nature, including but not limited to direct, indirect, punitive, special, exemplary, consequential, as also any loss of
profit in any way arising from the use of this material in any manner. The recipient alone shall be fully responsible/are liable for any decision
taken on this material.
SBI Blue Chip Fund 1.97% 1.12%
SBI Magnum Balanced Fund 1.97% 1.27%
SBI Magnum Global Fund 2.03% 1.44%
SBI Magnum MidCap Fund 2.02% 1.17%
SBI Magnum Equity Fund 2.09% 1.52%
SBI Emerging Businesses Fund 2.08% 1.40%
SBI FMCG Fund 2.49% 1.73%
SBI Pharma Fund 2.22% 1.21%
SBI IT Fund 2.70% 2.19%
SBI Contra Fund 2.11% 1.56%
SBI Magnum MultiCap Fund 2.03% 1.18%
SBI Magnum Multiplier Fund 2.09% 1.69%
SBI Nifty Index Fund 0.63% 0.27%
SBI Magnum Comma Fund 2.52% 1.93%
SBI PSU Fund 2.56% 2.12%
SBI Infrastructure Fund 2.39% 1.85%
SBI Arbitrage Opportunities Fund 0.80% 0.25%
SBI Small And Midcap Fund 2.28% 1.39%
SBI Dynamic Asset Allocation Fund 2.42% 1.48%
SBI Equity Savings Fund 2.02% 0.62%
SBI Banking And Financial Services Fund 2.46% 1.65%
SBI Gold Fund 0.43% 0.02%
SBI Magnum TaxGain Scheme 2.00% 1.54%
SBI Ultra Short Term Debt Fund 0.42% 0.33%
SBI Short Term Debt Fund 0.90% 0.30%
SBI Magnum Monthly Income Plan 1.88% 1.31%
SBI Premier Liquid Fund 0.16% 0.10%
SBI Magnum Childrens Benefit Plan 2.45% 1.75%
SBI Magnum Income Fund 1.45% 0.60%
SBI Magnum Gilt Fund-Short Term 0.71% 0.35%
SBI Magnum Gilt Fund-long Term 1.01% 0.43%
SBI Magnum Monthly Income Plan Floater 2.28% 1.68%
SBI Savings Fund 1.16% 0.54%
SBI Dynamic Bond Fund 1.71% 0.87%
SBI Corporate Bond Fund 1.40% 0.70%
SBI Regular Savings Fund 1.20% 0.50%
SBI Magnum InstaCash Fund 0.21% 0.10%
SBI Magnum Instacash Fund - Liquid Floater Plan 0.20% 0.10%
SBI Treasury Advantage Fund 0.80% 0.30%
Equity Schemes Reg -Plan Dir-Plan Debt Schemes Reg -Plan Dir-Plan
Note: Expense ratio excluding GST on management fees and B15 Expenses.
Total Expense Ratios

58
SBI Magnum Monthly Income Plan - Monthly Dividend
27-Oct-17 0.0600 0.0600 15.8675
27-Oct-17 0.0600 0.0600 13.0375
24-Nov-17 0.0650 0.0650 15.8187
24-Nov-17 0.0650 0.0650 12.9768
29-Dec-17 0.0600 0.0600 15.7855
29-Dec-17 0.0600 0.0600 12.9280
Scheme Name Record Date Individual Corporate NAV(in Rs./Unit) (in Rs./Unit) ( )`
Direct Plan - Mthly Div
Regular Plan - Mthly Div
Direct Plan - Mthly Div
Regular Plan - Mthly Div
Regular Plan - Mthly Div
Direct Plan - Mthly Div
Face value: 10`
SBI Magnum Monthly Income Plan - Quarterly Dividend
Scheme Name Record Date Individual Corporate NAV(in Rs./Unit) (in Rs./Unit) ( )`
Regular Plan - Qtr Div
Direct Plan - Qtr Div
Regular Plan - Qtr Div
Direct Plan - Qtr Div
Regular Plan - Qtr Div
Direct Plan - Qtr Div
Face value: 10`
30-Jun-17 0.2400 0.2400 12.6299
30-Jun-17 0.2400 0.2400 13.7771
29-Sep-17 0.2500 0.2500 12.5397
29-Sep-17 0.2500 0.2500 13.7330
29-Dec-17 0.2500 0.2500 12.3923
29-Dec-17 0.2500 0.2500 13.6258
SBI Magnum Monthly Income Plan - Annual Dividend
20-Mar-15 1.2000 1.2000 13.1654
20-Mar-15 1.2000 1.2000 14.6305
23-Mar-16 0.7500 0.7500 13.1919
23-Mar-16 0.7500 0.7500 14.9221
24-Mar-17 0.8000 0.8000 14.2182
24-Mar-17 0.8000 0.8000 16.3740
Scheme Name Record Date Individual Corporate NAV(in Rs./Unit) (in Rs./Unit) ( )`
Regular Plan - Annual Div
Direct Plan - Annual Div
Regular Plan - Annual Div
Direct Plan - Annual Div
Regular Plan - Annual Div
Direct Plan - Annual Div
Face value: 10`
SBI Magnum Monthly Income Plan - Floater
31-Oct-17 0.0600 0.0600 12.5343
31-Oct-17 0.0600 0.0600 12.9776
30-Nov-17 0.0600 0.0600 12.6095
30-Nov-17 0.0600 0.0600 13.0676
29-Dec-17 0.0600 0.0600 12.7066
29-Dec-17 0.0600 0.0600 13.1798
Scheme Name Record Date Individual Corporate NAV(in Rs./Unit) (in Rs./Unit) ( )`
Reg. Plan - Monthly Div
Direct Plan - Monthly Div
Reg. Plan - Monthly Div
Direct Plan - Monthly Div
Reg. Plan - Monthly Div
Direct Plan - Monthly Div
Face value: 10`
SBI Magnum Monthly Income Plan -Floater - Quarterly Dividend
30-Jun-17 0.2300 0.2300 12.5164
30-Jun-17 0.2300 0.2300 13.5898
29-Sep-17 0.2500 0.2500 12.5487
29-Sep-17 0.2500 0.2500 13.6787
29-Dec-17 0.2500 0.2500 12.7267
29-Dec-17 0.2500 0.2500 13.9277
Scheme Name Record Date Individual Corporate NAV(in Rs./Unit) (in Rs./Unit) ( )`
Regular Plan - Qtr Div
Direct Plan - Qtr Div
Regular Plan - Qtr Div
Direct Plan - Qtr Div
Regular Plan - Qtr Div
Direct Plan - Qtr Div
Face value: 10`
Pursuant to payment of dividend, the NAV of Dividend Option of schemes/plans would fall to the extent of payout and statutory levy, if applicable.Existing plans under the scheme are named Regular w.e.f. 01/01/2013
SBI Magnum Monthly Income Plan - Floater - Annual Dividend
20-Mar-15 1.2000 1.2000 13.9524
20-Mar-15 1.2000 1.2000 14.0803
23-Mar-16 0.7500 0.7500 14.2490
23-Mar-16 0.7500 0.7500 14.5438
24-Mar-17 0.8000 0.8000 15.0660
24-Mar-17 0.8000 0.8000 15.5711
Scheme Name Record Date Individual Corporate NAV(in Rs./Unit) (in Rs./Unit) ( )`
Regular Plan - Annual Div
Direct Plan - Annual Div
Regular Plan - Annual Div
Direct Plan - Annual Div
Regular Plan - Annual Div
Direct Plan - Annual Div
Face value: 10`
SBI Magnum Gilt Fund - Long Term Plan Dividend -PF Fixed 1 Year - Quarterly Dividend
30-Dec-16 0.2000 0.2000 13.3213
24-Mar-17 0.1500 0.1500 13.2200
30-Jun-17 0.2500 0.2500 13.5654
29-Sep-17 0.2000 0.2000 13.4245
29-Dec-17 0.2000 0.2000 13.0372
Scheme Name Record Date Individual Corporate NAV(in Rs./Unit) (in Rs./Unit) ( )`
Dividend - PF Fixed 1 Year
Dividend - PF Fixed 1 Year
Dividend - PF Fixed 1 Year
Dividend - PF Fixed 1 Year
Dividend - PF Fixed 1 Year
Face value: 10`
30-Dec-16 0.2000 0.2000 13.4616
24-Mar-17 0.1500 0.1500 13.3607
30-Jun-17 0.2500 0.2500 13.7125
29-Sep-17 0.2000 0.2000 13.5722
29-Dec-17 0.2000 0.2000 13.1830
Scheme Name Record Date Individual Corporate NAV(in Rs./Unit) (in Rs./Unit) ( )`
Div-PF Fixed 2 Years
Div-PF Fixed 2 Years
Div-PF Fixed 2 Years
Div-PF Fixed 2 Years
Div-PF Fixed 2 Years
SBI Magnum Gilt Fund - Long Term Plan Dividend -PF Fixed 2 Years - Quarterly Dividend
Face value: 10`
SBI Magnum Gilt Fund - -PF Fixed 3 Years -
Long Term Plan DividendQuarterly Dividend
30-Dec-16 0.2000 0.2000 13.1057
24-Mar-17 0.1500 0.1500 13.0035
30-Jun-17 0.2500 0.2500 13.3392
29-Sep-17 0.2000 0.2000 13.1972
29-Dec-17 0.2000 0.2000 12.8133
Scheme Name Record Date Individual Corporate NAV(in Rs./Unit) (in Rs./Unit) ( )`
Div-PF Fixed 3 Years
Div-PF Fixed 3 Years
Div-PF Fixed 3 Years
Div-PF Fixed 3 Years
Div-PF Fixed 3 Years
Face value: 10`
30-Dec-16 0.2000 0.2000 13.8549
24-Mar-17 0.1500 0.1500 13.7555
30-Jun-17 0.2500 0.2500 14.1250
29-Sep-17 0.2000 0.2000 13.9865
29-Dec-17 0.2000 0.2000 13.5916
Scheme Name Record Date Individual Corporate NAV(in Rs./Unit) (in Rs./Unit) ( )`
Dividend - PF Regular
Dividend - PF Regular
Dividend - PF Regular
Dividend - PF Regular
Dividend - PF Regular
SBI Magnum Gilt Fund - -Long Term Plan DividendQuarterly Dividend
Face value: 10`
Dividend History Of Debt & Hybrid Funds

59Pursuant to payment of dividend, the NAV of Dividend Option of schemes/plans would fall to the extent of payout and statutory levy, if applicable.Existing plans under the scheme are named Regular w.e.f. 01/01/2013
SBI Magnum Income Fund - Quarterly Dividend
30-Jun-17 0.2500 0.2500 13.4618
30-Jun-17 0.2500 0.2500 14.0721
29-Sep-17 0.2500 0.2500 13.3813
29-Sep-17 0.2500 0.2500 14.0336
29-Dec-17 0.2500 0.2500 13.1237
29-Dec-17 0.2500 0.2500 13.8089
Scheme Name Record Date Individual Corporate NAV(in Rs./Unit) (in Rs./Unit) ( )`
Regular Plan - Dividend
Direct Plan - Dividend
Regular Plan - Dividend
Direct Plan - Dividend
Regular Plan - Dividend
Direct Plan - Dividend
Face value: 10`
SBI Magnum Income Fund - Half Yearly Dividend
23-Mar-16 0.3000 0.3000 11.6745
23-Mar-16 0.3000 0.3000 12.6225
30-Sep-16 0.4000 0.4000 12.1855
30-Sep-16 0.4000 0.4000 13.2601
24-Mar-17 0.3000 0.3000 12.3751
24-Mar-17 0.3000 0.3000 13.5272
29-Sep-17 0.5000 0.5000 12.4939
29-Sep-17 0.5000 0.5000 13.7724
Scheme Name Record Date Individual Corporate NAV(in Rs./Unit) (in Rs./Unit) ( )`
Regular Plan - Dividend
Direct Plan - Dividend
Regular Plan - Dividend
Direct Plan - Dividend
Regular Plan - Dividend
Direct Plan - Dividend
Regular Plan - Dividend
Direct Plan - Dividend
Face value: 10`
30-Jun-17 0.2400 0.2400 12.8565
30-Jun-17 0.2400 0.2400 13.9538
29-Sep-17 0.2000 0.2000 12.7418
29-Sep-17 0.2000 0.2000 13.8724
29-Dec-17 0.2000 0.2000 12.4120
29-Dec-17 0.2000 0.2000 13.5600
Scheme Name Record Date Individual Corporate NAV(in Rs./Unit) (in Rs./Unit) ( )`
Regular Plan - Dividend
Direct Plan - Dividend
Regular Plan - Dividend
Direct Plan - Dividend
Regular Plan - Dividend
Direct Plan - Dividend
SBI Dynamic Bond Fund - Quarterly Dividend
Face value: 10`
SBI Regular Savings Fund - Quarterly Dividend
24-Mar-17 0.2000 0.2000 12.8424
24-Mar-17 0.2000 0.2000 13.1912
30-Jun-17 0.2400 0.2400 13.0286
30-Jun-17 0.2400 0.2400 13.4166
29-Sep-17 0.2500 0.2500 12.9872
29-Sep-17 0.2500 0.2500 13.4154
29-Dec-17 0.2500 0.2500 12.8096
29-Dec-17 0.2500 0.2500 13.2745
Scheme Name Record Date Individual Corporate NAV(in Rs./Unit) (in Rs./Unit) ( )`
Regular Plan - Dividend
Direct Plan - Dividend
Regular Plan - Dividend
Direct Plan - Dividend
Regular Plan - Dividend
Direct Plan - Dividend
Regular Plan - Dividend
Direct Plan - Dividend
Face value: 10`
SBI Short Term Debt Fund
31-Oct-17 0.0600 0.0600 12.4494
31-Oct-17 0.0600 0.0600 12.0960
30-Nov-17 0.0600 0.0600 12.4170
30-Nov-17 0.0600 0.0600 12.0568
29-Dec-17 0.0600 0.0600 12.3535
29-Dec-17 0.0600 0.0600 11.9878
Scheme Name Record Date Individual Corporate NAV(in Rs./Unit) (in Rs./Unit) ( )`
Direct Plan - Monthly Div
Regular Plan - Monthly Div
Direct Plan - Monthly Div
Regular Plan - Monthly Div
Direct Plan - Monthly Div
Regular Plan - Monthly Div
Face value: 10`
SBI Short Term Debt Fund - Retail Plan
30-Jun-17 0.0600 0.0600 11.4071
31-Jul-17 0.0600 0.0600 11.4450
31-Aug-17 0.0600 0.0600 11.4561
29-Sep-17 0.0600 0.0600 11.4150
31-Oct-17 0.0600 0.0600 11.4141
30-Nov-17 0.0600 0.0600 11.3737
29-Dec-17 0.0600 0.0600 11.3053
Scheme Name Record Date Individual Corporate NAV(in Rs./Unit) (in Rs./Unit) ( )`
Monthly Dividend
Monthly Dividend
Monthly Dividend
Monthly Dividend
Monthly Dividend
Monthly Dividend
Monthly Dividend
Face value: 10`
SBI Magnum Gilt Fund - Long Term Plan - Quarterly Dividend
Scheme Name Record Date Individual Corporate NAV(in Rs./Unit) (in Rs./Unit) ( )`
30-Jun-17 0.2500 0.2500 13.9567
30-Jun-17 0.2500 0.2500 14.6444
29-Sep-17 0.2000 0.2000 13.8174
29-Sep-17 0.2000 0.2000 14.5269
29-Dec-17 0.2000 0.2000 13.4258
29-Dec-17 0.2000 0.2000 14.1448
Face value: 10`
Regular Plan - Dividend
Direct Plan - Dividend
Regular Plan - Dividend
Direct Plan - Dividend
Regular Plan - Dividend
Direct Plan - Dividend
24-Mar-17 0.2000 0.2000 13.7772
24-Mar-17 0.2000 0.2000 14.3998
30-Jun-17 0.2500 0.2500 13.8655
30-Jun-17 0.2500 0.2500 14.5355
29-Sep-17 0.2500 0.2500 13.8788
29-Sep-17 0.2500 0.2500 14.5916
29-Dec-17 0.2500 0.2500 13.7276
29-Dec-17 0.2500 0.2500 14.4748
Scheme Name Record Date Individual Corporate NAV(in Rs./Unit) (in Rs./Unit) ( )`
Regular Plan - Dividend
Direct Plan - Dividend
Regular Plan - Dividend
Direct Plan - Dividend
Regular Plan - Dividend
Direct Plan - Dividend
Regular Plan - Dividend
Direct Plan - Dividend
SBI Corporate Bond Fund - Quarterly Dividend#
(#SBI MIF - Floating Rate Plan - LTP restructured as SBI Corporate Bond Fund)
Face value: 10`
Dividend History Of Debt & Hybrid Funds

60Pursuant to payment of dividend, the NAV of Dividend Option of schemes/plans would fall to the extent of payout and statutory levy, if applicable.Existing plans under the scheme are named Regular w.e.f. 01/01/2013
29-Sep-17 6.0000 6.0000 1082.1631
31-Oct-17 6.0000 6.0000 1077.9283
31-Oct-17 6.0000 6.0000 1082.3095
30-Nov-17 6.0000 6.0000 1076.7164
30-Nov-17 6.0000 6.0000 1081.2920
29-Dec-17 6.0000 6.0000 1074.2842
29-Dec-17 6.0000 6.0000 1078.9570
Scheme Name Record Date Individual Corporate NAV(in Rs./Unit) (in Rs./Unit) ( )`
Direct Plan - Mthly Div
Regular Plan - Mthly Div
Direct Plan - Mthly Div
Regular Plan - Mthly Div
Direct Plan - Mthly Div
Mthly Div
Mthly Div
Regular Plan -
Direct Plan -
SBI Ultra Short Term Debt Fund
Face value: 1000`
SBI Ultra Short Term Debt Fund - Retail Plan
31-Jul-14 6.5000 6.5000 1047.1081
31-Jul-14 6.5000 6.5000 1047.4407
30-May-14 6.0000 6.0000 1045.1610
30-May-14 6.0000 6.0000 1045.3861
30-Jun-14 6.3000 6.3000 1046.5158
30-Jun-14 6.3000 6.3000 1046.7751
Scheme Name Record Date Individual Corporate NAV(in Rs./Unit) (in Rs./Unit) ( )`
Retail Plan
Retail Plan - Dir - Mthly Div
Retail Plan
Retail Plan - Dir - Mthly Div
Retail Plan
Retail Plan - Dir - Mthly Div
Face value: 1000`
SBI Ultra Short Term Debt Fund - Institutional Plan
31-Oct-12 8.0486 8.0486 1065.0685
30-Nov-12 7.1638 7.1638 1065.0685
31-Dec-12 7.5144 7.5144 1065.0685
31-Jan-13 7.5715 7.5715 1065.0685
28-Feb-13 6.1130 6.1130 1065.0685
26-Mar-13 7.5986 7.5986 1065.0685
30-Apr-13 9.7772 9.7772 1065.0685
31-May-13 7.2888 7.2888 1065.0685
Scheme Name Record Date Individual Corporate NAV(in Rs./Unit) (in Rs./Unit) ( )`
Institutional Plan - Mthly Div
Institutional Plan - Mthly Div
Institutional Plan - Mthly Div
Institutional Plan - Mthly Div
Institutional Plan - Mthly Div
Institutional Plan - Mthly Div
Institutional Plan - Mthly Div
Institutional Plan - Mthly Div
Face value: 1000`
SBI Treasury Advantage Fund - Monthly Dividend
29-Sep-17 6.0000 6.0000 1030.1463
29-Sep-17 6.0000 6.0000 1045.8161
31-Oct-17 6.0000 6.0000 1030.0072
31-Oct-17 6.0000 6.0000 1046.2269
30-Nov-17 6.0000 6.0000 1028.5496
30-Nov-17 6.0000 6.0000 1045.2724
29-Dec-17 6.0000 6.0000 1025.6171
29-Dec-17 6.0000 6.0000 1042.8122
Scheme Name Record Date Individual Corporate NAV(in Rs./Unit) (in Rs./Unit) ( )`
Regular Plan - Mthly Div
Direct Plan - Mthly Div
Regular Plan - Mthly Div
Direct Plan - Mthly Div
Regular Plan - Mthly Div
Direct Plan - Mthly Div
Regular Plan - Mthly Div
Direct Plan - Mthly Div
Face value: 1000`
SBI Magnum Gilt Fund Short Term
29-Sep-17 0.0600 0.0600 12.9867
31-Oct-17 0.0600 0.0600 13.1367
31-Oct-17 0.0600 0.0600 12.9697
30-Nov-17 0.0600 0.0600 13.1271
30-Nov-17 0.0600 0.0600 12.9557
29-Dec-17 0.0600 0.0600 13.0689
29-Dec-17 0.0600 0.0600 12.8937
Scheme Name Record Date Individual Corporate NAV(in Rs./Unit) (in Rs./Unit) ( )`
Regular Plan - Dividend
Direct Plan - Dividend
Regular Plan - Dividend
Direct Plan - Dividend
Regular Plan - Dividend
Direct Plan - Dividend
Regular Plan - Dividend
Face value: 10`
SBI Savings Fund (Previously known as SBI Magnum Income Fund –Floating Rate Plan – Savings Plus Bond Plan)
29-Sep-17 0.0600 0.0600 11.9112
31-Oct-17 0.0600 0.0600 11.5901
31-Oct-17 0.0600 0.0600 11.9275
30-Nov-17 0.0600 0.0600 11.5765
30-Nov-17 0.0600 0.0600 11.9225
29-Dec-17 0.0600 0.0600 11.5288
29-Dec-17 0.0600 0.0600 11.8456
Scheme Name Record Date Individual Corporate NAV(in Rs./Unit) (in Rs./Unit) ( )`
Direct Plan - Dividend
Regular Plan - Dividend
Direct Plan - Dividend
Regular Plan - Dividend
Direct Plan - Dividend
Regular Plan - Dividend
Direct Plan - Dividend
Face value: 10`
Dividend History Of Debt & Hybrid Funds

61
Disclaimer for data from CRISIL'S FUND ANALYSER:
Disclaimer:
Disclaimer of SBI Nifty Index Fund:
Mutual Fund Investments are subject to market risks, read all scheme related documents carefully.
Asset Management Company:
Trustee Company:
Registered Office:
CRISIL has taken due care and caution in compilation of the
Data contained in the CRISIL'S FUNDANALYSER. The Data in the CRISIL'S FUNDANALYSER has been obtained by
CRISIL from sources, which it considers reliable. However, CRISIL does not guarantee the accuracy, adequacy or
completeness of any Data in the CRISIL'S FUND ANALYSER and is not responsible for any errors or omissions or for
the results obtained from the use of such Data. CRISIL especially states that it has no financial liability whatsoever to
the users of CRISIL'S FUND ANALYSER. CRISIL or any of its directors/ employees/ representatives does not accept
any liability for any direct or consequential loss arising from the use of the Data contained in the CRISIL'S FUND
ANALYSER or any data generated from the CRISIL'S FUNDANALYSER.
This investment update is for information purpose only and is not an offer to sell or a solicitation to buy any
mutual fund units/securities. These views alone are not sufficient and should not be used for the development or
implementation of an investment strategy. It should not be construed as investment advice to any party.All opinions and
estimates included in this schemes guide constitute our view as of this date and are subject to change without notice.
Neither SBI Funds Management Private Limited, nor any person connected with it, accepts any liability arising from the
use of this information. The recipient of this material should rely on their own investigations and take professional
advice on their own.
In the preparation of the material contained in this document, the AMC has used information that is publicly available,
including information developed in-house. Information gathered and material used in this document is believed to be
from reliable sources published by third parties. While such publications are believed to be reliable, however, neither
theAMC, its officers, the trustees, the Fund nor any of their affiliates or representatives assume any responsibility of the
accuracy, reasonableness and/or completeness of any information. For data referred to of any third party in this
material no such party will assume any liability for the same. Further, all opinion included in this newsletter are as of date
and are subject to change without any notice.All recipients of this material should seek appropriate professional advice
and carefully read the scheme information document/ statement of additional information and before dealing and or
transacting in any of the products referred to in this material make their own investigation.The Fund, the AMC and
Trustees and any of its directors, officers, employees and other personnel shall not liable for any loss, damage of any
nature, including but not limited to direct, indirect, punitive, special, exemplary, consequential, as also any loss of profit
in any way arising from the use of this material in any manner whatsoever. The recipient alone shall be fully
responsible/are liable for any decision taken on the basis of this material.
“The “SBI Nifty Index Fund” offered by “SBI Funds Management Private Limited”
is not sponsored, endorsed, sold or promoted by India Index Services & Products Limited (IISL) and its affiliates. IISLdo
not make any representation or warranty, express or implied (including warranties of merchantability or fitness for
particular purpose or use) and disclaims all liability to the owners of “SBI Nifty Index Fund” or any member of the public
regarding the advisability of investing in securities generally or in the “SBI Nifty Index Fund” linked to Nifty 50 Index or
particularly in the ability of the Nifty 50 Index to track general stock market performance in India. Please read the full
Disclaimers in relation to the Nifty 50 Index in the Scheme Information Document.”
SBI Funds Management Private Limited (A joint venture between SBI & AMUNDI)
CIN: U65990MH1992PTC065289. SBI Mutual Fund Trustee Company Private Limited
9th Floor, Crescenzo, C-38 & 39, G Block, Bandra-Kurla Complex,
Bandra (East), Mumbai 400 051. Tel.: 022-61793000 E-mail : [email protected] • www. sbimf.com
CIN:
U65991MH2003PTC138496.
Disclaimer

62
NORTH
SOUTH
EAST
WEST
Chandigarh: 0172-2703380 • Gurgaon: 0124-4200828/ 0124-4083769 • Jaipur: 0141-2740061/2740023• Kanpur: 0512-6900314/15 • Lucknow: 0522-2286742 • Ludhiana: 0161-2449849 • New Delhi: (011) 23466666Aligarh: 0571-2402017 • Ambala: (0171) 2653400 • Bathinda: (0164) 2218415 • Dehradun: 0135-2651719• Dhanbad: 0326-2301545 • Dharamshala: 01892-225814 • Faizabad: 919999029351/ 919811607620• Faridabad: 0129 - 4030661 • Ferozepur: 01632-236167 • Ghaziabad: 0120-2797582 Gorakhpur:0551-2203378 • Haldwani: 0594-6220526 • Hissar: 01662 238415 Hosiharpur: 0188-2228415 • Jabalpur:0761-2410042 • Jalandhar: 0181-2238415 • Jammu: 0191-2474975 • Jhansi: 0510-2330298 • Jodhpur:0291-2611929/ 28 • Leh: 09469468778 • Meerut: 0121-2667877 • Moradabad: 0591-2411411 • Panchakula:9592008415 • Panipat: 0180-2648415 • Pathankot: 8872008415 • Patiala: 0175-2300058 • Rohtak:(0126) 2258415 • Saharanpur: 0132-2720789 • Shimla: 0177-2807608 • Sonepat: 011- 23466666 • Udaipur: -• Varanasi: 0542-2222492 • Nehru Place (Delhi): (011) 26224606 • Noida: 0120-4232214 • Pitam Pura (Delhi):(011) 23751974
Bangalore: 080-25580014/51 • Chennai : 044 2854 3382/83 • Coimbatore: 0422 - 2541666 • Ernakulam:0484-2323489 2318886 • Hyderabad: 040-69000541/42 • Thrivanthapuram: 0471-4011590 / 4011591 / 4011592• Vijayawada: 0866-2436113/2438217 Bareilly: 7830111140 • Belgaum: 0831-2422463 • Bellary: 0839-2271775• Calicut: 0495-2768270/4020079 • Cuttack: 0671-2422792 • Davangere: 08192-231463
• Guntur: 0863-2211022 • Hubli: 0836-2368477 • Kannur: 0497-2708180 • Kollam: 0474-2752760• Kottayam: 0481-2570816 • Kurnool: 08518-227776 • Madurai: 0452 4374242 • Mangalore: 0824-2222463• Mysore: 0821-2424919 • Nellore: 0861-2338688 • Pondichery: 9445196934 • Rajahmundry:0883-2434002/2432306 • Salem: 0427 - 4552289 • Shimoga: 08182-222463 • Thiruchirapalli: 0431-4000667• Thrissur: 8129354324 • Thrissur: 0487-2445700 • Tinsukia: - • Tirunelveli: 0462 4220023 • Tirupati(0877)6450828 • Vellore: 0416- 2225005 • Vishakapatnam: 0891-3293018/2511853 • Warangal: 0870-2430307
Bhubaneshwar: (0674) 2392401/501 • Guwahati: 0361-2463747/2130366 • Kolkata: 22882342 / 22883767 /22883768 • Patna: 0612-3242047 • Raipur: (0771) 2543355 / 4263256 • Ranchi:0651-2213212/3205026 Agartala: 0381-2384107 • Asansol: 8170037270 • Balasore: 0678-2262646• Bhagalpur: 0641-2420661 • Bhilai: 0788-6940012/6940011-6940010/6940014/6940013 • Bokaro: 9304823011• Bokaro: 06542-232561 • Burdwan: 8335844461 • Darbhanga: 06272-245004 • Dimapur: 0386-2224267• Durgapur: 2544191 / 192 • Gaya: 0631-2222405 • Hazaribagh: 06546-270415 • Imphal: 0386-2224267• Itanagar: 0360-2292416 • Jamshedpur: 0657-2440446 • Jorhat: 0367-2304396 • Kalyani: 033-25827700• Kharagpur: (03222) 225592 • Malda: (03512)266128 • Port Blair: (03192)235552 • Rourkela: 0661-2400299• Sambalpur: 0663-2410001 • Shillong: 9436704232 • Silchar: 0384-2221109 • Siliguri: (0353) 2537065• Sriganganagar: 9829067384
Ahmedabad: 079-26423060/70; 26463090 • Bhopal: 0755-2557341 • Goa: (0832) 2235283 / 6642475 • Indore:0731-2541141/6900080/85 • Mumbai: (022) 66532800 • Nagpur: 0712 - 6458368 • Pune: 020 25670961/25671524/ 25653398 / 99 • Surat: 0261-3994800/6646555/2462764 • Vadodara: 0265-2323010 Agra: 0562-2850239 • Ajmer: 0145-2426284 • Allahabad: 0532-2261028 • Alwar: (0144) 2332035 • Amravati: - • Amritsar:0183-2221755 • Anand: 02692-246210 • Aurangabad: 0240 3244781 • Bavnagar: (0278) 2523788 • Bharuch:02642-247550 • Bhilwara: 01482-240144 • Bhuj: (02832) 250900 • Bilaspur: 07752-415300 • Gandhidham:02836-233615 • Gwalior: 0751-2447272 • Jalgaon: 9545025850 • Jamnagar: (0288) 2660104 • Junagadh: 0285-2670350 • Kolhapur: 0231 2680880 • Korba: 07759-230082 • Kota: 0744 – 2390631 • Margao: 0832-6578283• Mehsana: 02762-233872 • Nadiad: 0268-2560110 • Nashik: 0253 - 6575888, 2232553 • Navsari: 02637-242266• Raipur: (0771) 2543355 / 4263256 • Rajkot: 0281-2466740/41 • Ratlam: 07412-409492 • Sagar: 07582-241367• Solapur: 09226389292 • Srinagar: 0194-2474864 • Valsad: 02632-245440 • Vapi: 0260-2400480 • Borivali(Mumbai): 022-28927551 • Chinchwad: 020 27355721 • Kalyan: (0251) 2311850 / 2311980 • Thane:022-25414594 • Vashi: 022-27810368
•
• Gulbarga:9980872463
• Muzzaffarpur: 9473199059
•
SBI Funds Management Pvt Ltd Branches

63
Fund Manager :
Application Amount for Fresh Subscription :
Minimum Additional Amount :
Yield to Maturity :
SIP :
NAV :
Benchmark :
Entry Load :
Note:
Exit Load :
Modified Duration :
Standard Deviation :
Sharpe Ratio :
Beta :
AUM :
Holdings :
Nature of Scheme :
Rating Profile :
Tracking Error :
An employee of the asset management company such as a mutual fund or life insurer, who manages
investments of the scheme. He is usually part of a larger team of fund managers and research analysts.
This is the minimum investment amount for a new investor in a mutual fund
scheme.
This is the minimum investment amount for an existing investor in a mutual fund scheme.
The Yield to Maturity or the YTM is the rate of return anticipated on a bond if held until maturity. YTM is
expressed as an annual rate. The YTM factors in the bond's current market price, par value, coupon interest rate and time to
maturity.
SIP or systematic investment plan works on the principle of making periodic investments of a fixed sum. It works similar
to a recurring bank deposit. For instance, an investor may opt for an SIP that invests Rs 500 every 15th of the month in an
equity fund for a period of three years.
The NAV or the net asset value is the total asset value per unit of the mutual fund after deducting all related and
permissible expenses. The NAV is calculated at the end of every business day. It is the value at which the investor enters or
exits the mutual fund.
A group of securities, usually a market index, whose performance is used as a standard or benchmark to
measure investment performance of mutual funds, among other investments. Some typical benchmarks include the Nifty 50,
S&P BSE Sensex, BSE 200, BSE 500, 10-Year Gsec.
A mutual fund may have a sales charge or load at the time of entry and/or exit to compensate the
distributor/agent. Entry load is charged at the time an investor purchases the units of a mutual fund. The entry load is added to
the prevailing NAV at the time of investment. For instance, if the NAV is Rs. 100 and the entry load is 1%, the investor will enter
the fund at Rs 101.
SEBI, vide circular dated June 30, 2009 has abolished entry load and mandated that the upfront commission to
distributors will be paid by the investor directly to the distributor, based on his assessment of various factors including the
service rendered by the distributor
Exit load is charged at the time an investor redeems the units of a mutual fund. The exit load is deducted from the
prevailing NAV at the time of redemption. For instance, if the NAV is Rs 100 and the exit load is 1%, the redemption price would
be Rs 99 Per Unit.
Modified duration is the price sensitivity and the percentage change in price for a unit change in yield
Standard deviation is a statistical measure of the range of an investment's performance. When a mutual
fund has a high standard deviation, its means its range of performance is wide, implying greater volatility.
The Sharpe Ratio, named after its founder, the Nobel Laureate William Sharpe, is a measure of risk-adjusted
returns. It is calculated using standard deviation and excess return to determine reward per unit of risk.
Beta is a measure of an investment's volatility vis-à-vis the market. Beta of less than 1 means that the security will be
less volatile than the market. A beta of greater than 1 implies that the security's price will be more volatile than the market.
AUM or assets under management refers to the recent / updated cumulative market value of investments managed by a
mutual fund or any investment firm.
The holdings or the portfolio is a mutual fund's latest or updated reported statement of investments/securities.
These are usually displayed in terms of percentage to net assets or the rupee value or both. The objective is to give investors an
idea of where their money is being invested by the fund manager.
The investment objective and underlying investments determine the nature of the mutual fund scheme.
For instance, a mutual fund that aims at generating capital appreciation by investing in stock markets is an equity fund or
growth fund. Likewise, a mutual fund that aims at capital preservation by investing in debt markets is a debt fund or income
fund. Each of these categories may have sub-categories.
Mutual funds invest in securities after evaluating their creditworthiness as disclosed by the ratings. A
depiction of the mutual fund in various investments based on their ratings becomes the rating profile of the fund. Typically,
this is a feature of debt funds.
Measure that indicates how closely the portfolio return tracks the benchmark return. Tracking error is the
standard deviation of the difference of returns between a portfolio and the benchmark over a specified holding period.
S&P S&P
How to read the Factsheet?