functions and graphs 1.2. functionsfunctions symmetric about the y axis symmetric about the origin
TRANSCRIPT

Functions and Graphs
1.2

FUNCTIONSSymmetric about the y axis
Symmetric about the origin

2 -7 -6 -5 -4 -3 -2 -1 1 5 7 3 0 4 6 8
7
123456
8
-2-3-4-5-6-7
So for an even function, for every point (x, y) on the graph, the point (-x, y) is also on the graph.
Even functions have y-axis Symmetry

2 -7 -6 -5 -4 -3 -2 -1 1 5 7 3 0 4 6 8
7
123456
8
-2-3-4-5-6-7
So for an odd function, for every point (x, y) on the graph, the point (-x, -y) is also on the graph.
Odd functions have origin Symmetry

2 -7 -6 -5 -4 -3 -2 -1 1 5 7 3 0 4 6 8
7
123456
8
-2-3-4-5-6-7
We wouldn’t talk about a function with x-axis symmetry because it wouldn’t BE a function.
x-axis Symmetry

A function is even if f( -x) = f(x) for every number x in the domain.
So if you plug a –x into the function and you get the original function back again it is even.
125 24 xxxf Is this function even?
1251)(2)(5 2424 xxxxxfYES
xxxf 32 Is this function even?
xxxxxf 33 2)()(2NO
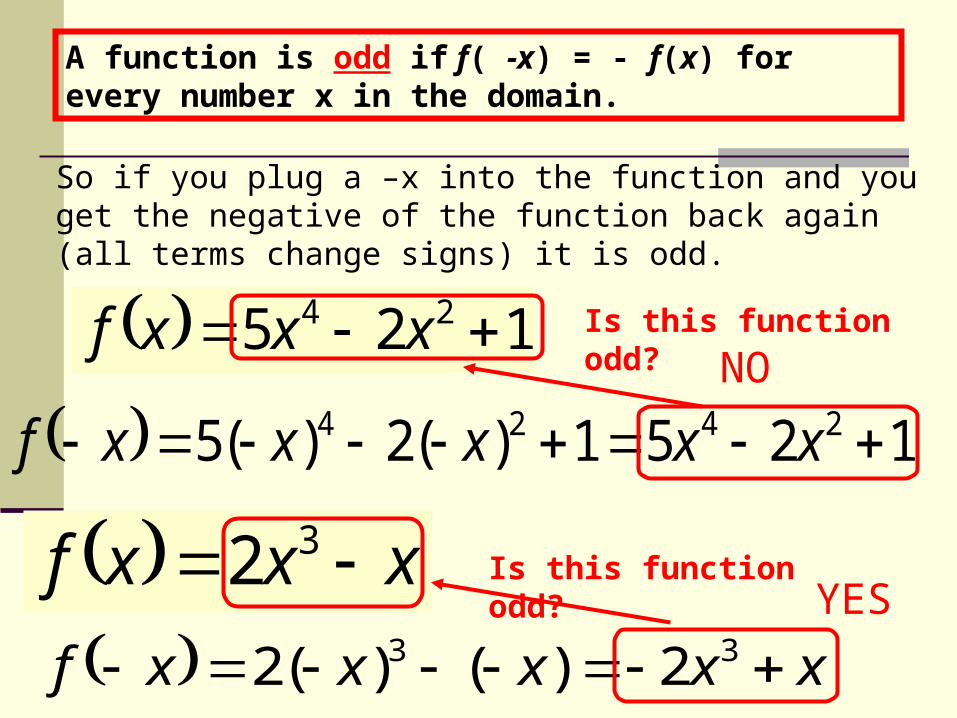
A function is odd if f( -x) = - f(x) for every number x in the domain.
So if you plug a –x into the function and you get the negative of the function back again (all terms change signs) it is odd.
125 24 xxxf Is this function odd?
1251)(2)(5 2424 xxxxxfNO
xxxf 32 Is this function odd?
xxxxxf 33 2)()(2YES

If a function is not even or odd we just say neither (meaning neither even nor odd)
15 3 xxf
Determine if the following functions are even, odd or neither.
1515 33 xxxf
Not the original and all terms didn’t change signs, so NEITHER.
23 24 xxxf
232)()(3 2424 xxxxxf
Got f(x) back so EVEN.
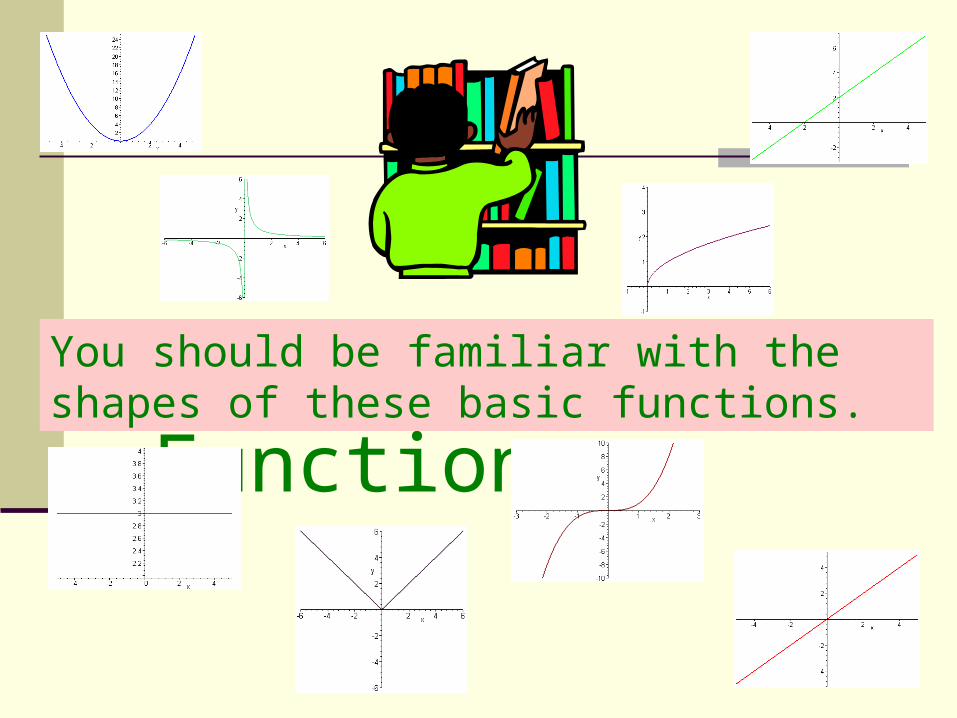
Library of FunctionsYou should be familiar with the shapes of these basic functions.

Linear Functio
ns
Equations that can be written f(x) = mx + b
The domain of these functions is all real numbers.
slope y-intercept
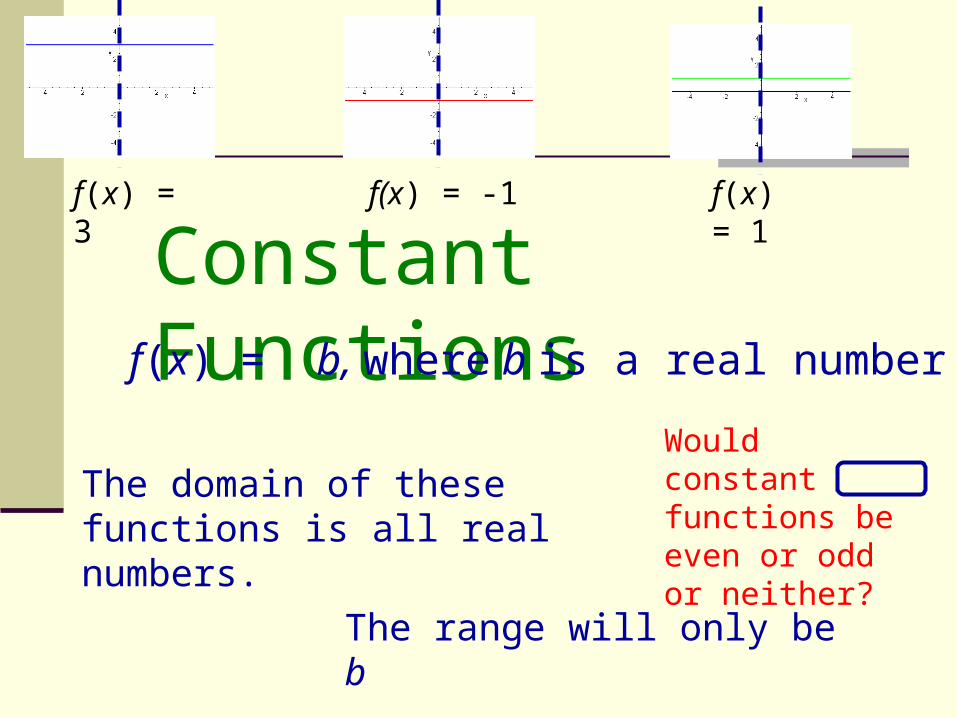
Constant Functionsf(x) = b, where b is a real number
The domain of these functions is all real numbers.
The range will only be b
f(x) = 3 f(x) = -1 f(x) = 1
Would constant functions be even or odd or neither?

Identity Functionf(x) = x, slope 1, y-intercept = 0
The domain of this function is all real numbers.
The range is also all real numbers
f(x) = x
Would the identity function be even or odd or neither?
If you put any real number in this function, you get the same real number “back”.
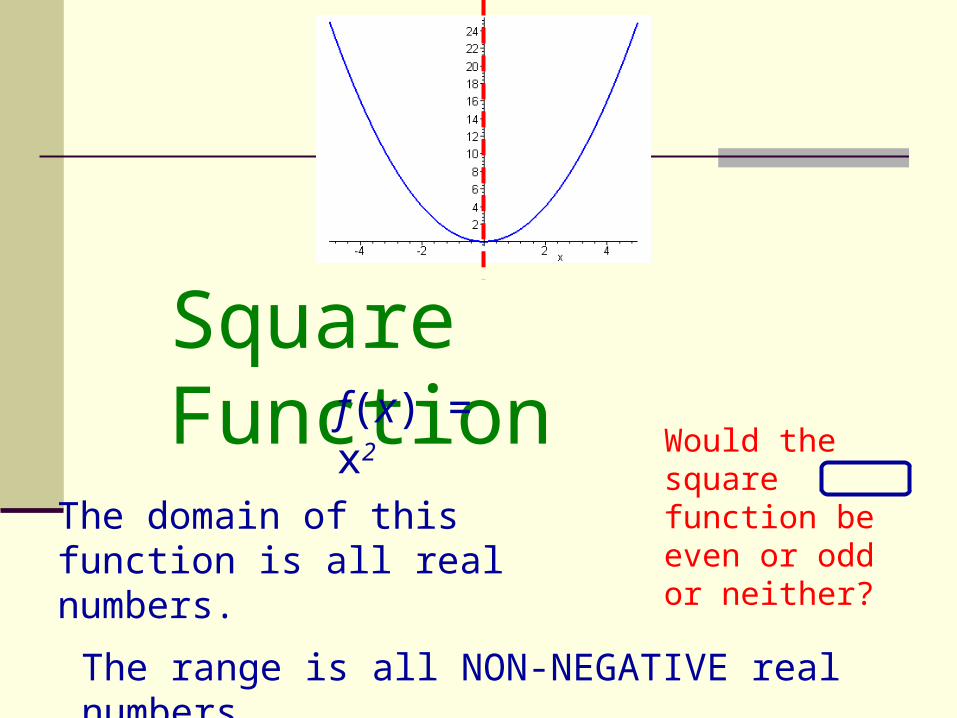
Square Functionf(x) = x2
The domain of this function is all real numbers.
The range is all NON-NEGATIVE real numbers
Would the square function be even or odd or neither?

Cube Functionf(x) = x3
The domain of this function is all real numbers.
The range is all real numbers
Would the cube function be even or odd or neither?

Square Root Function
The domain of this function is NON-NEGATIVE real numbers.
The range is NON-NEGATIVE real numbers
Would the square root function be even or odd or neither?
xxf
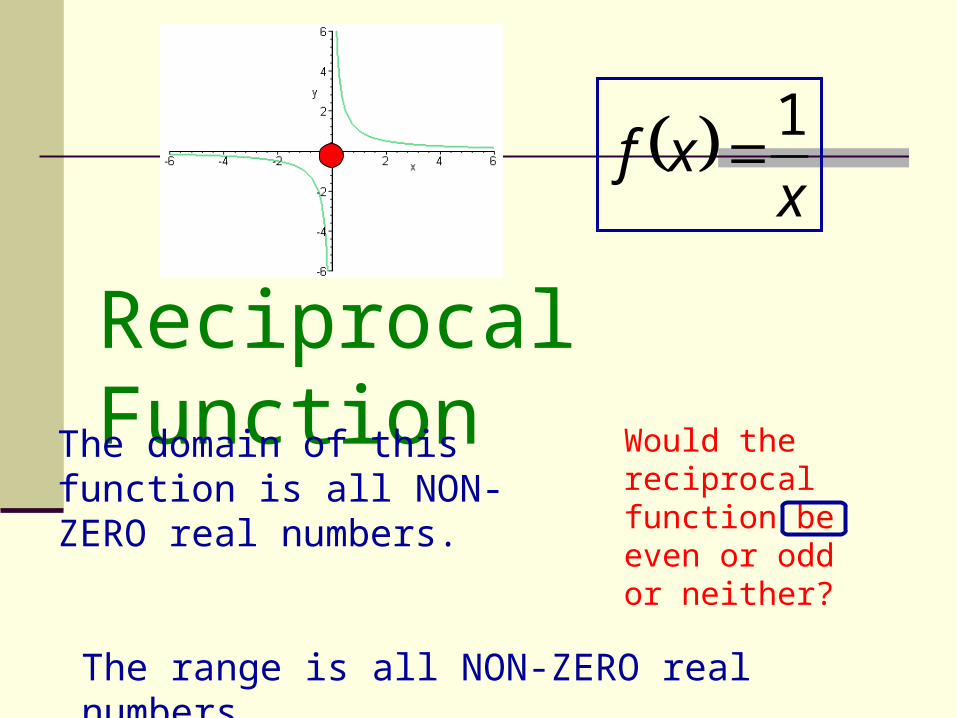
Reciprocal FunctionThe domain of this function is all NON-ZERO real numbers.
The range is all NON-ZERO real numbers.
Would the reciprocal function be even or odd or neither?
x
xf1

Absolute Value FunctionThe domain of this function is all real numbers.
The range is all NON-NEGATIVE real numbers
Would the absolute value function be even or odd or neither?
xxf
WISE
FUN
CTIO
NS
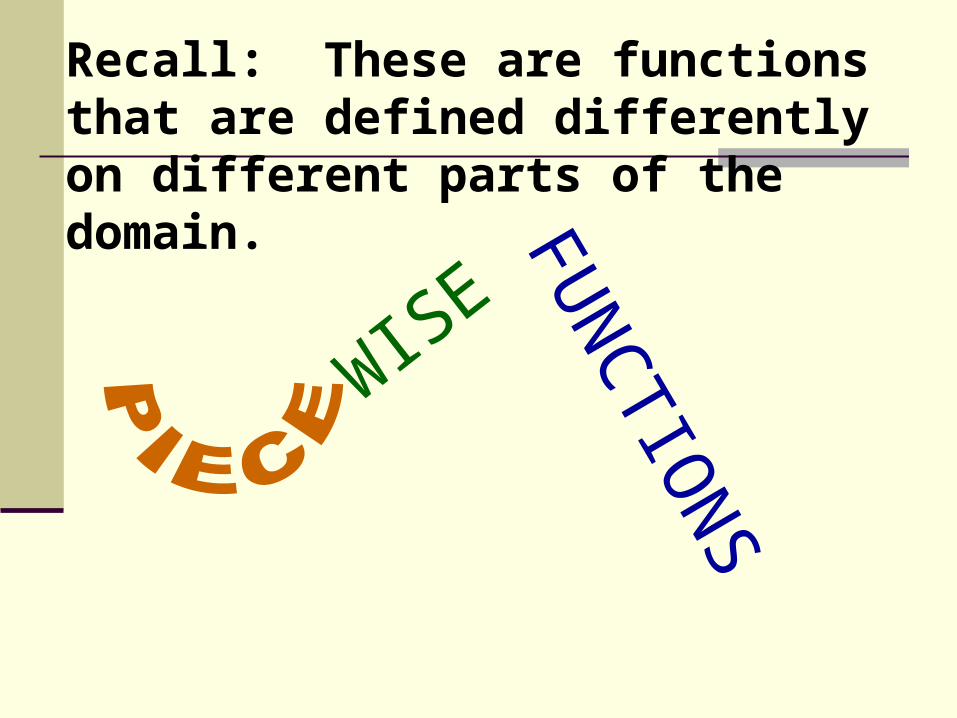
Recall: These are functions that are defined differently on different parts of the domain.

0,
0,2 xx
xxxf
This means for x’s less than 0, put them in f(x) = -x but for x’s greater than or equal to 0, put them in f(x) = x2
What does the graph of f(x) = -x look like?
Remember y = f(x) so let’s graph y = - x which is a line of slope –1 and y-intercept 0.
Since we are only supposed to graph this for x< 0, we’ll stop the graph at x = 0.
What does the graph of f(x) = x2 look like?
Since we are only supposed to graph this for x 0, we’ll only keep the right half of the graph.
Remember y = f(x) so lets graph y = x2 which is a square function (parabola)
This then is the graph for the piecewise function given above.

0,5
0,3
03,52
xx
x
xx
xf
For x values between –3 and 0 graph the line y = 2x + 5.
Since you know the graph is a piece of a line, you can just plug in each end value to get the endpoints. f(-3) = -1 and f(0) = 5
For x = 0 the function value is supposed to be –3 so plot the point (0, -3)
For x > 0 the function is supposed to be along the line y = - 5x.
Since you know this graph is a piece of a line, you can just plug in 0 to see where to start the line and then count a – 5 slope.
So this the graph of the piecewise function
solid dot for "or equal to"
open dot since not
"or equal to"

You try one:Graph the function described by:
3
33)(
2 xx
xxxh
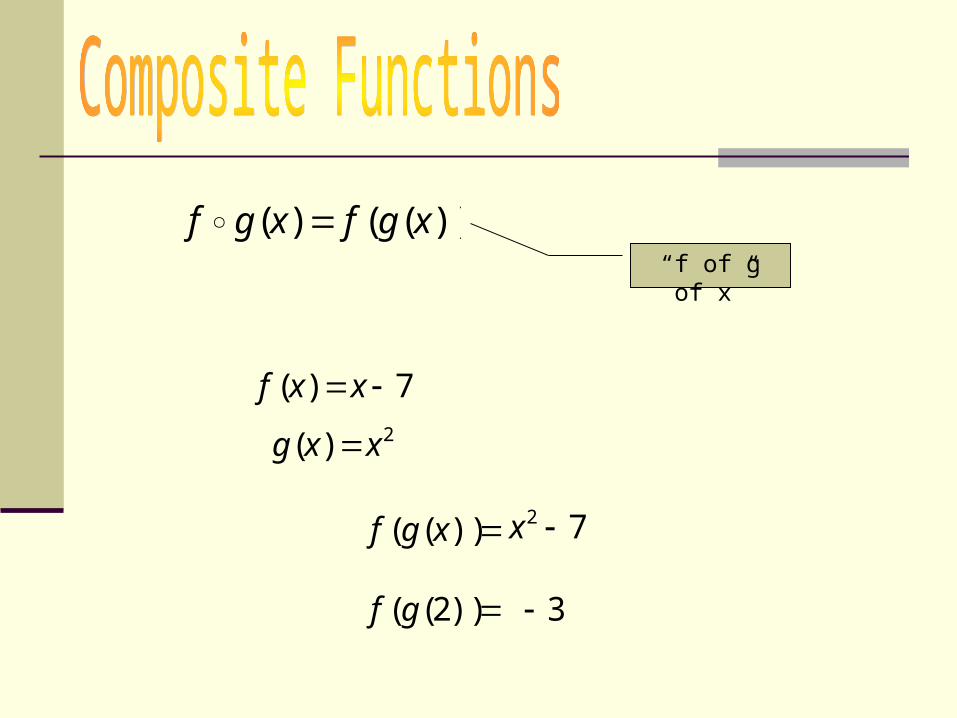
))(()( xgfxgf “f of g of x”
7)( xxf2)( xxg
))(( xgf 72 x
))2((gf 3