chambleems.dekalb.k12.ga.uschambleems.dekalb.k12.ga.us/downloads/iv-t7-graph...
TRANSCRIPT
4/3/2016 USATestprep, Inc.
http://www.usatestprep.com/modules/quiz_factory/qf.php?testid=535 1/41
Coordinate Algebra EOC (GSE) Quiz Answer KeyFunctions - (MGSE9‐12.F.IF.7 ) Graph Functions
Student Name: _______________________ Date: _________Teacher Name: THUYNGA DAO Score: _________
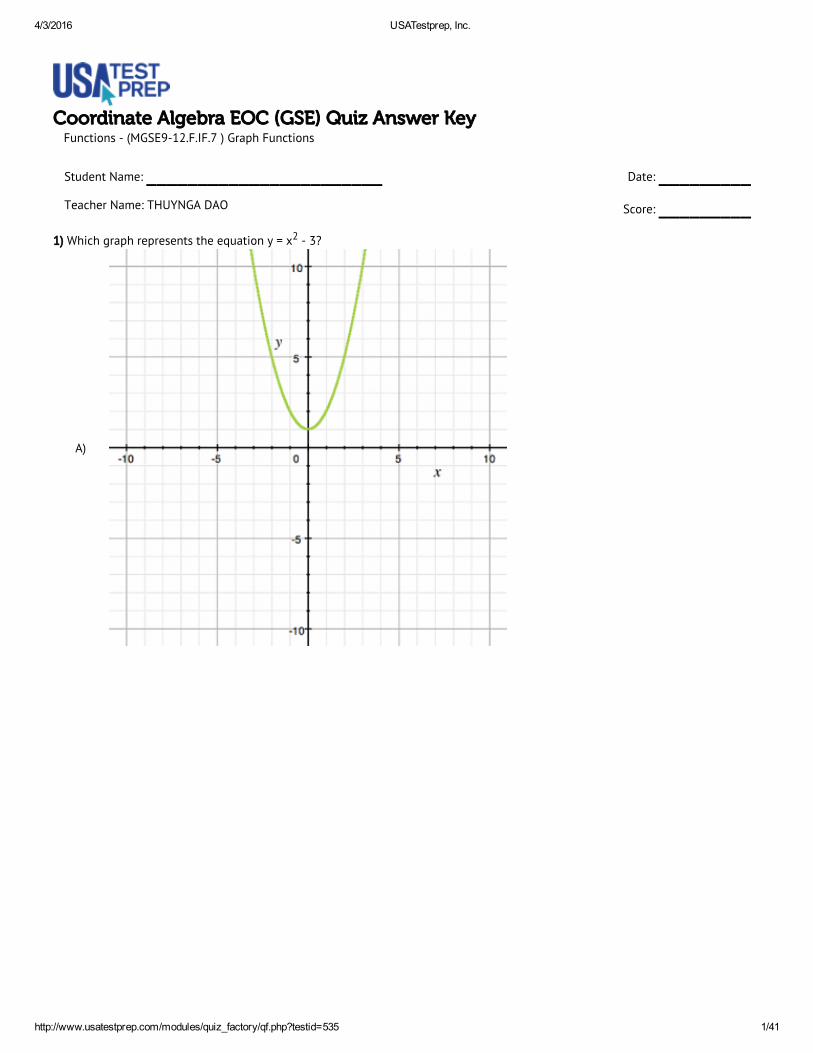
1) Which graph represents the equation y = x2 - 3?
A)

4/3/2016 USATestprep, Inc.
http://www.usatestprep.com/modules/quiz_factory/qf.php?testid=535 2/41
B)
C)

4/3/2016 USATestprep, Inc.
http://www.usatestprep.com/modules/quiz_factory/qf.php?testid=535 3/41
D)
Explanation:Solution: B. The graph shown in choice B has been shifted down 3 units.
2) Which graph represents the equation y = x2 + 1?
A)

4/3/2016 USATestprep, Inc.
http://www.usatestprep.com/modules/quiz_factory/qf.php?testid=535 4/41
B)
C)

4/3/2016 USATestprep, Inc.
http://www.usatestprep.com/modules/quiz_factory/qf.php?testid=535 5/41
D)
Explanation:Solution: A. The graph shown in choice A has been shifted up 1 unit.
3)
Which equation matches the function shown in the graph?
A) y = x
B) y = |x|
C) y = x2

4/3/2016 USATestprep, Inc.
http://www.usatestprep.com/modules/quiz_factory/qf.php?testid=535 6/41
D) y = x
Explanation:Solution: y = lxl. The function shown in the graph is the absolute value function.
4)
Which equation would shift the parabola down 3 units?
A) y = x2
B) y = x2 - 3
C) y = x2 + 3
D) y = (x + 3)2
Explanation:
The solution is y = x2 - 3. The -3 in this equation indicated a downward shift.
5)

4/3/2016 USATestprep, Inc.
http://www.usatestprep.com/modules/quiz_factory/qf.php?testid=535 7/41
Identify the equation for the graph shown.
A) y = |x - 3|
B) y = |x| - 3
C) y = |x| + 3
D) y = |x + 3|
Explanation:The y-intercept is at (0,-3) which only fits in equation B. The answer is y = |x| - 3.

4/3/2016 USATestprep, Inc.
http://www.usatestprep.com/modules/quiz_factory/qf.php?testid=535 8/41
6)
The graph shown matches which quadratic equation?
A) y = x2 + 3
B) y = x2 - 3
C) y = (x - 3)2
D) y = (x + 3)2
Explanation:
Solution: y = x2 - 3. The -3 in the equation indicates that the graph has been shifted 3 units down.
7) Which shows the graph of f(x) = |x| - 2?

4/3/2016 USATestprep, Inc.
http://www.usatestprep.com/modules/quiz_factory/qf.php?testid=535 9/41
A)
B)

4/3/2016 USATestprep, Inc.
http://www.usatestprep.com/modules/quiz_factory/qf.php?testid=535 10/41
C)
D)
Explanation:The |x| portion of the function tells you the graph will be open to the top. The (- 2) portion of the function tells you the graph will beshifted down two units. This is shown on graph C.
8)

4/3/2016 USATestprep, Inc.
http://www.usatestprep.com/modules/quiz_factory/qf.php?testid=535 11/41
Which absolute value equation matches the graph?
A) y = 3|x|
B) y = |x| - 3
C) y = |x| + 3
D) y = -|x| + 3
Explanation:Solution: y = |x| + 3Create a table of values with the x values that are graphed and determine which equation matches the graph. In this case theanswer is y = |x| + 3.
9)

4/3/2016 USATestprep, Inc.
http://www.usatestprep.com/modules/quiz_factory/qf.php?testid=535 12/41
The graph shown matches which quadratic equation?
A) y = x2 + 3
B) y = x2 - 3
C) y = -x2 + 3
D) y = (x - 3)2
Explanation:
Solution: y = x2 + 3. The +3 in the equation indicates that the graph has been shifted 3 units up.
10) Which graph represents the equation y = 1
2x + 3 ?

4/3/2016 USATestprep, Inc.
http://www.usatestprep.com/modules/quiz_factory/qf.php?testid=535 13/41
A)
B)

4/3/2016 USATestprep, Inc.
http://www.usatestprep.com/modules/quiz_factory/qf.php?testid=535 14/41
C)
D)
Explanation:
Solution: A. The graph for choice A has a slope of 1
2 and a y-intercept of 3.

4/3/2016 USATestprep, Inc.
http://www.usatestprep.com/modules/quiz_factory/qf.php?testid=535 15/41
11)
Which equation matches the graph?
A) y = 2x2
B) y = -2x2
C) y = x2 - 4
D) y = x2 + 4
Explanation:
Find the x - intercepts for the graph and find the equation with the same x-intercepts. The equation is y = x2 - 4.
12) The graphs represent equations of the form y = x2 + c. For which graph is the value of c the greatest?

4/3/2016 USATestprep, Inc.
http://www.usatestprep.com/modules/quiz_factory/qf.php?testid=535 16/41
A)
B)

4/3/2016 USATestprep, Inc.
http://www.usatestprep.com/modules/quiz_factory/qf.php?testid=535 17/41
C)
D)
Explanation:Solution: C. The graph shown in choice C has a value of 4 for c.
13)
4/3/2016 USATestprep, Inc.
http://www.usatestprep.com/modules/quiz_factory/qf.php?testid=535 18/41
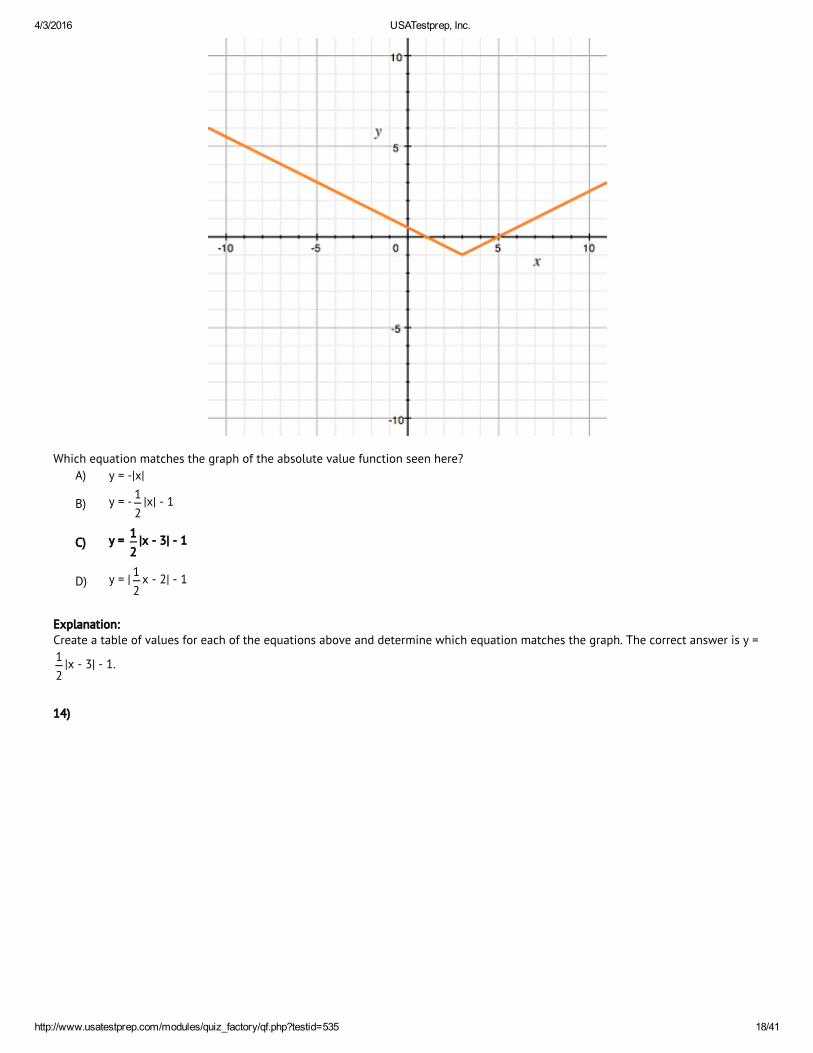
Which equation matches the graph of the absolute value function seen here?
A) y = -|x|
B) y = -1
2|x| - 1
C) y = 1
2|x - 3| - 1
D) y = |1
2x - 2| - 1
Explanation:Create a table of values for each of the equations above and determine which equation matches the graph. The correct answer is y =
1
2|x - 3| - 1.
14)

4/3/2016 USATestprep, Inc.
http://www.usatestprep.com/modules/quiz_factory/qf.php?testid=535 19/41
Which equation matches the graph?
A) y = 2|x| + 2
B) y = 2|x| - 2
C) y = -2|x| + 2
D) y = -2|x| - 2
Explanation:Create a table for each equation above and find the one that matches the graph. The correct answer is y = -2|x| + 2.

4/3/2016 USATestprep, Inc.
http://www.usatestprep.com/modules/quiz_factory/qf.php?testid=535 20/41
15) Graph
y = 2x + 3
A)
B)

4/3/2016 USATestprep, Inc.
http://www.usatestprep.com/modules/quiz_factory/qf.php?testid=535 21/41
C)
D)
Explanation:
The slope is 2 or 2
1 and the y-intercept is 3. So we start at 3 on the y-axis and then go up 2 and to the right 1. The correct answer is
graph B.
16) Which graph represents the equation y = 1
2x - 3 ?

4/3/2016 USATestprep, Inc.
http://www.usatestprep.com/modules/quiz_factory/qf.php?testid=535 22/41
A)
B)

4/3/2016 USATestprep, Inc.
http://www.usatestprep.com/modules/quiz_factory/qf.php?testid=535 23/41
C)
D)
Explanation:
Solution: B. The graph for choice B has a slope of 1
2 and a y-intercept of -3.
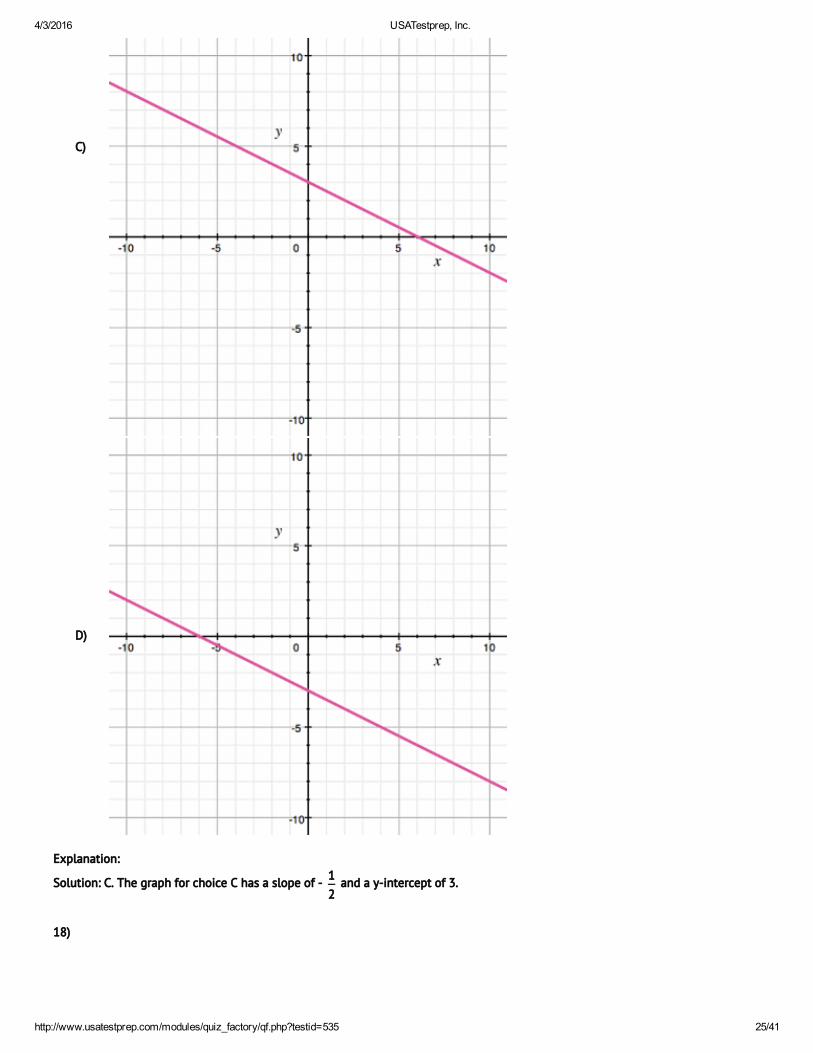
17) Which graph represents the equation y = -1
2x + 3 ?

4/3/2016 USATestprep, Inc.
http://www.usatestprep.com/modules/quiz_factory/qf.php?testid=535 24/41
A)
B)
4/3/2016 USATestprep, Inc.
http://www.usatestprep.com/modules/quiz_factory/qf.php?testid=535 25/41
C)
D)
Explanation:
Solution: C. The graph for choice C has a slope of - 1
2 and a y-intercept of 3.
18)

4/3/2016 USATestprep, Inc.
http://www.usatestprep.com/modules/quiz_factory/qf.php?testid=535 26/41
The graph of the function y = x2 is shown. How will the graph change if the equation is changed to y = 1
4x2?
A) The parabola will become wider.
B) The parabola will become narrower.
C) The parabola will move up 1
4 unit.
D) The parabola will move down 1
4 unit.
Explanation:
The parabola will become wider. The graph of the function y = 1
4x2 is wider than the graph of the function y = x2. This can be seen
by plugging in a few test points and plotting the function.

4/3/2016 USATestprep, Inc.
http://www.usatestprep.com/modules/quiz_factory/qf.php?testid=535 27/41
19)
The graph of the function y = x2 is shown. How will the graph change if the equation is changed to y = 2x2?
A) The parabola will become wider.
B) The parabola will become narrower.
C) The parabola will move up 2 units.
D) The parabola will move down 2 units.
Explanation:
The parabola will become narrower. The graph of the function y = 2x2 is more narrow than the graph of the function y = x2. This canbe seen by plugging in a few test points and plotting the function.
20) Given: m = 1
2 and b = 4
The slope and y-intercept for a linear equation are given. Which graph matches this information?

4/3/2016 USATestprep, Inc.
http://www.usatestprep.com/modules/quiz_factory/qf.php?testid=535 28/41
A)
B)

4/3/2016 USATestprep, Inc.
http://www.usatestprep.com/modules/quiz_factory/qf.php?testid=535 29/41
C)
D)
Explanation:
Since the slope is 1
2 and the y-intercept is 4, we can conclude that the equation is y =
1
2x + 4. The graph crosses the y-axis at
positive 4 and has a positive slope of 1
2. This is shown in graph C.
21)

4/3/2016 USATestprep, Inc.
http://www.usatestprep.com/modules/quiz_factory/qf.php?testid=535 30/41
Which of the equations represents the function?
A) y = x3
B) y = x2
C) y = -x3
D) y = -x2
Explanation:
The correct answer is y = -x2.It only changes direction once so it is a quadratic and it opens downward so the leading coefficient must be negative.
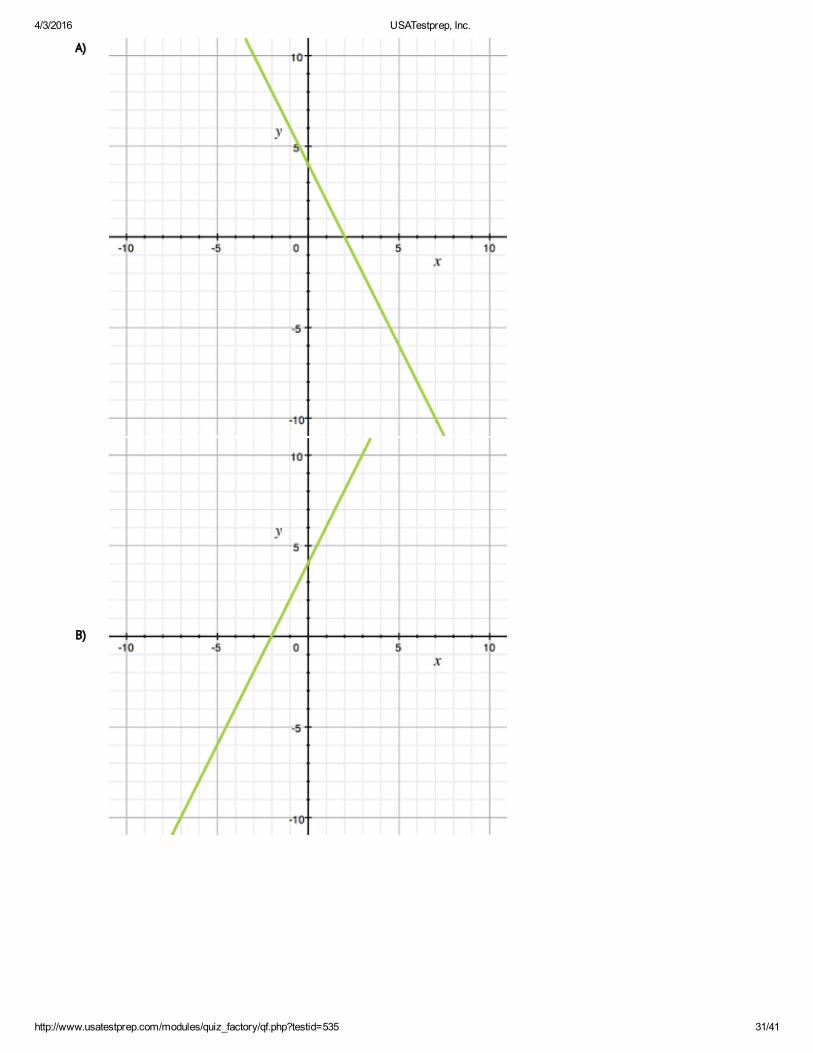
22) Which graph models the equation -2x + y = 4?
4/3/2016 USATestprep, Inc.
http://www.usatestprep.com/modules/quiz_factory/qf.php?testid=535 31/41
A)
B)

4/3/2016 USATestprep, Inc.
http://www.usatestprep.com/modules/quiz_factory/qf.php?testid=535 32/41
C)
D)
Explanation:The solution is Graph B. In this form, it is easier to see that when x = 0, y = 4, and when y = 0, x = -2. The line passes through (0, 4)and (-2, 0)

4/3/2016 USATestprep, Inc.
http://www.usatestprep.com/modules/quiz_factory/qf.php?testid=535 33/41
23)
A
x y
1 1
2 4
3 9
4 16
C
x y
1 4
2 2
3 4/3
4 1
B
x y
1 1/2
2 1
3 3/2
4 2
D
x y
1 3
2 5
3 7
4 9
The tables show four relationships between x and y. In which table is there a NEGATIVE rate of change?
A)
B)
C)
D)
Explanation:In table C the y-values fall as x increases, so the rate of change is negative.
24) The graphs represent equations of the form y = x2 + c. For which graph is the value of c the smallest?

4/3/2016 USATestprep, Inc.
http://www.usatestprep.com/modules/quiz_factory/qf.php?testid=535 34/41
A)
B)

4/3/2016 USATestprep, Inc.
http://www.usatestprep.com/modules/quiz_factory/qf.php?testid=535 35/41
C)
D)
Explanation:Solution: D. The graph shown in choice D has a value of -5 for c.
25)
4/3/2016 USATestprep, Inc.
http://www.usatestprep.com/modules/quiz_factory/qf.php?testid=535 36/41
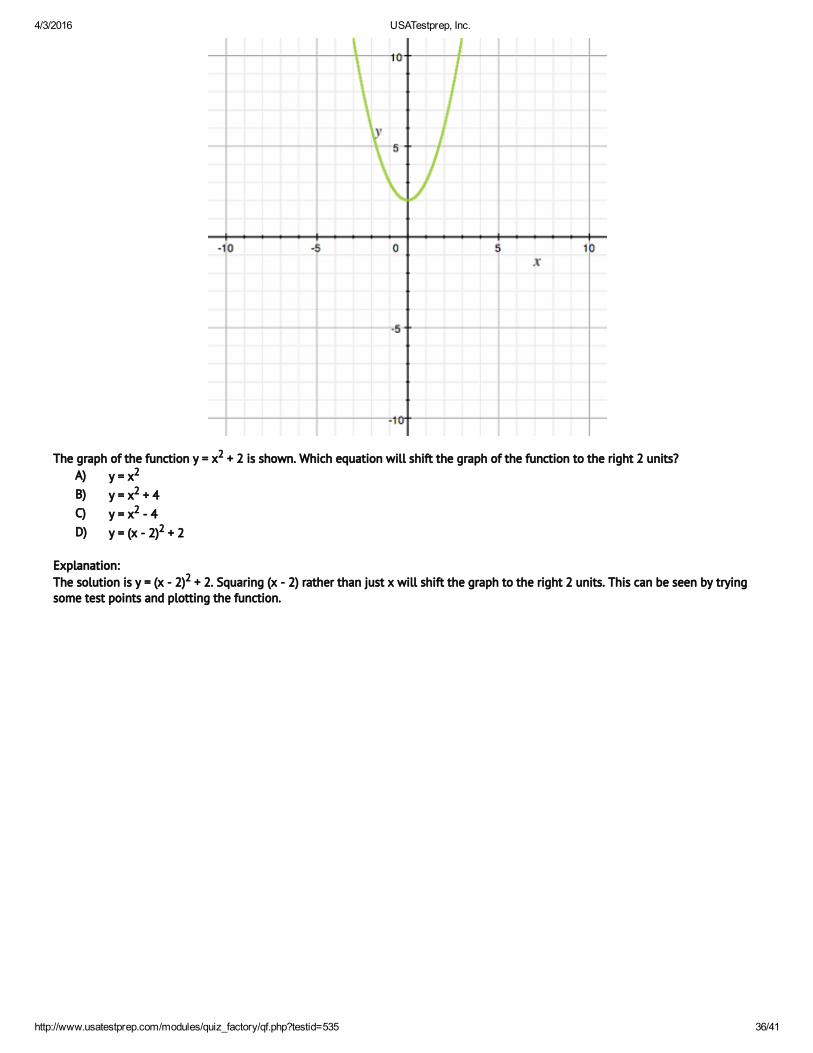
The graph of the function y = x2 + 2 is shown. Which equation will shift the graph of the function to the right 2 units?
A) y = x2
B) y = x2 + 4
C) y = x2 - 4
D) y = (x - 2)2 + 2
Explanation:
The solution is y = (x - 2)2 + 2. Squaring (x - 2) rather than just x will shift the graph to the right 2 units. This can be seen by tryingsome test points and plotting the function.
4/3/2016 USATestprep, Inc.
http://www.usatestprep.com/modules/quiz_factory/qf.php?testid=535 37/41
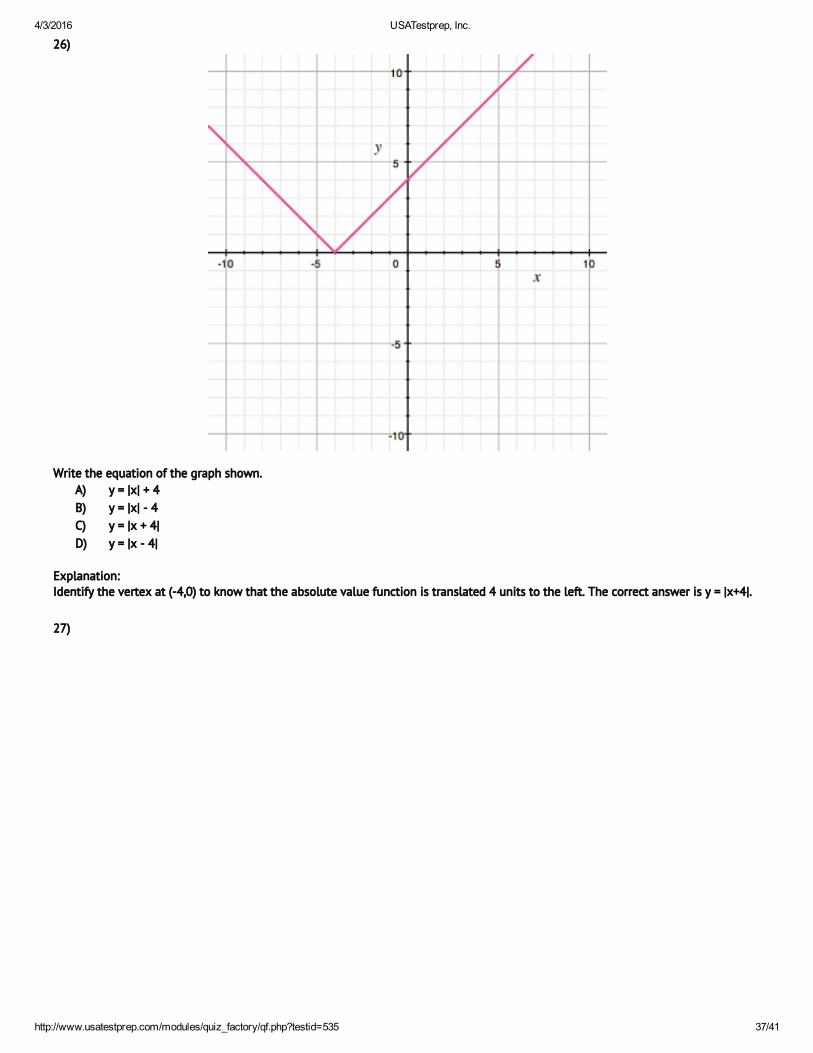
26)
Write the equation of the graph shown.
A) y = |x| + 4
B) y = |x| - 4
C) y = |x + 4|
D) y = |x - 4|
Explanation:Identify the vertex at (-4,0) to know that the absolute value function is translated 4 units to the left. The correct answer is y = |x+4|.
27)

4/3/2016 USATestprep, Inc.
http://www.usatestprep.com/modules/quiz_factory/qf.php?testid=535 38/41
Which equation is graphed?
A) y = (x + 2)2
B) y = (x - 2)2
C) y = x2 - 2
D) y = x2 + 2
Explanation:
The solution is y = (x + 2)2. B represents a shift to the right, C represents a shift down, and D represents a shift up.
28)

4/3/2016 USATestprep, Inc.
http://www.usatestprep.com/modules/quiz_factory/qf.php?testid=535 39/41
Which function best represents the graph shown?
A) g(x) = -|x + 2| + 3
B) g(x) = -|x - 2| + 3
C) g(x) = -|x + 2| - 3
D) g(x) = -|x - 2| - 3
Explanation:The graph opens upside down and has been moved to the right 2 units and up 3 units. The correct equation is g(x) = -|(x - 2)| + 3
29)

4/3/2016 USATestprep, Inc.
http://www.usatestprep.com/modules/quiz_factory/qf.php?testid=535 40/41
Which equation is graphed here?
A) y = -3x + 3
B) y = -3x - 3
C) y = -1
3x +3
D) y = -1
3x -3
Explanation:y = -3x + 3 is correct. The graph passes through the points (0,3) and (1,0) having a y-intercepts of 3 and a slope of -3.

4/3/2016 USATestprep, Inc.
http://www.usatestprep.com/modules/quiz_factory/qf.php?testid=535 41/41
30)
Which equation is graphed here?
A) y = 2 + 2
3x
B) y = -2 - 2
3x
C) y = 2
3x - 2
D) y = -2
3x + 2
Explanation:
-2
3x + 2 is correct. The y-intercept is 2 and the slope is -
2
3 since you rise 2 and run to the left 3.