functional separation and economies of vertical integration in
TRANSCRIPT
FUNCTIONAL SEPARATION AND ECONOMIES OF VERTICAL INTEGRATION
IN EUROPEAN FIXED TELECOMS
Clementina Bruno
Working Paper n. 03/2012
2
PRESIDENTE
Giovanni Fraquelli
SEGRETARIO
Cristina Piai
COMITATO DIRETTIVO
Giovanni Fraquelli (Presidente)
Cristina Piai (Segretario)
Guido Del Mese (ASSTRA)
Graziella Fornengo (Università di Torino)
Giancarlo Guiati (GTT S.p.A.)
© HERMES
Fondazione Collegio Carlo Alberto
Via Real Collegio, 30
10024 - Moncalieri (TO)
Tel: +39 011 6705000
+390321375414
http://www.hermesricerche.it
I diritti di riproduzione, di memorizzazione e di adattamento totale o parziale
con qualsiasi mezzo (compresi microfilm e copie fotostatiche) sono riservati.
3
FUNCTIONAL SEPARATION AND ECONOMIES OF VERTICAL INTEGRATION
IN EUROPEAN FIXED TELECOMS
Clementina Bruno,
HERMES Research Centre and Università del Piemonte Orientale, Italy
Abstract
This work presents an empirical analysis of the economies of vertical integration in fixed
telecommunications, which is an issue of large interest but rarely addressed from the empirical
perspective. The dataset includes European incumbent firms and the analysis employs a method
based on Data Envelopment Analysis. It allows to compute the economies of vertical integration by
comparing, for each firm, the efficiency scores obtained with respect to the separated firms frontier
with the efficiency scores computed with respect to the integrated firms frontier. The results show
that diseconomies of vertical integration are relevant, providing an important argument in favor of
separation policies. However, they reduce when the downstream output (retail lines) is split in
narrow and broadband lines (i.e., by considering the quality of the downstream accesses), for firms
more concentrated on broadband.

4
1 Introduction
During the last decades the telecom industry, as many other utilities, has been involved, in most developed
and developing countries, in a privatization and liberalization process. In order to foster competition in
sectors which have been operating as monopolies for a long time, many Governments and regulators have
implemented unbundling (separation) policies of the incumbent firms, with the aim of separating the segment
of the production chain that shows monopolistic features. Once separated from the rest of the company, the
access to the bottleneck infrastructure (in general, the network) should be granted under equal conditions to
the incumbent firm and to the competitors, improving (service-based) competition.
The “last mile” (the local access network), that the incumbent possesses and that the competitors need to
access in order to provide their service to the final users, is what gives to the fixed telecom market
monopolistic features, because it is difficult and costly to replicate. The separation of this segment is
involved in a relevant debate: the European Union has considered functional separation as a solution to foster
competition and grant equal and fair condition of access to the last mile to competitor firms, when mandatory
access imposed on incumbents does not work effectively. Some member States have shown a positive
attitude towards this opportunity (e.g. Ireland, Latvia, Poland), but the cases where functional separation has
already been implemented are very limited (for a deep discussion, see Tropina et al., 2010 and Crandall et
al., 2010).
UK has been the first country moving in this direction. In 2005, the negotiation between the regulator and the
incumbent, British Telecom (BT), leaded to the creation of a separate BT business unit, Openreach, in charge
of operating the local access network and of providing the related wholesale services either to the BT retail
branch and to competitors.
Italy moved the first steps towards separation in 2002, when AGCOM, the regulator, directed Telecom Italia
(TI) towards the creation of distinct retail and wholesale business units. However, the most significant
change occurred in 2008, when, the powers of AGCOM were expanded: the Italian legislation conferred the
regulator the power to impose functional separation. TI, then, created a separated unit, OpenAccess,
following the line of Openreach1. At the end of 2008, AGCOM approved the measure.
Moreover, 2008 has been a crucial year also for the Swedish telecom market. The regulator, PTS, received
from the Parliament the power to impose separation on the incumbent TeliaSonera. Even before the law was
approved, TeliaSonera implemented functional separation by creating a wholly owned subsidiary,
TeliaSonera Skanova Access, that provides access to the incumbent’s network both to the competitors and to
the downstream branch of the parent company.
Strong and broadly accepted theoretical reasons support functional separation as a mean to foster
competition; however (and, again, in theory), such a solution could in principle generate important
drawbacks, in terms of reduced incentives to investment and innovation, and in term of losses of (vertical)
economies of scope. Whether or not the competition benefits offset the efficiency losses is mainly an
empirical question, whose answer requires to quantify both the gains and the costs. The aim of this work is to
provide a contribution with respect to the costs side:
Q: Is functional separation in fixed telecoms costly in terms of losses of economies of vertical integration?
To answer this question, a non-parametric DEA-based methodology will be applied over a sample of 14
European operators, with data over the period 2005-2010. The dataset contains cost and operational
information on integrated and functionally separated firms. Two model specifications will be tested: a basic
model that simply distinguishes wholesale and retail activities, and an improved model accounting for
different quality of access (narrow band and broadband) provided to the final users.
The rest of the paper is organized as follows. The next section introduces the competition issues in fixed
telecommunications and clarifies the pros and cons of functional separation; moreover it provides a
definition of economies of vertical integration and reviews some empirical contributions addressing the
problem of economies of scope in telecommunications; section 3 presents the methodology; section 4
illustrates the dataset and the variables employed in the two model specifications; section 5 discusses the
results, while section 6 draws some conclusions.
1 However Open Access deals directly only with TI retail division, not with the competitors, that must ask for services
the wholesale division. This one and other transparency issues are discussed in Nucciarelli and Sadowsky, 2010.
5
2 Background
2.1 Telecommunications and competition
As previously mentioned, the competition issue in fixed telecommunications is related to the presence of a
downstream segment (retail, involving the provision of services to the final users) which is, at least
potentially, competitive, and of an upstream segment (wholesale, or more precisely, the access infrastructure,
i.e. the so-called “last mile”) which shows some monopolistic features.
As a first step, it is important to distinguish between two definitions of competition (see Tropina et al.,
2010). It is infrastructure based when the competitors do not rely (at least, not relevantly) on the access
infrastructure of the incumbent, because they possess their own one. It is the most powerful form of
competition, but it requires long time to be implemented and strong investments on the side of the competing
firms. Therefore, as a quicker solution, many Governments and regulators’ efforts are directed to foster
service based competition. In this case competitors use the incumbent firm’s access network to provide their
services. The level of required investment is reduced and the development of a competitive market is faster,
but some drawbacks arise: for instance, the necessary regulatory effort is relevant, because the authority has
to impose some forms of mandatory access (e.g. local loop unbundling, LLU) on the incumbent, in order to
grant the competitors the possibility to access the last mile at fair conditions. On the regulator side, this is not
a simple task: the incumbent has the incentive, and in general also the ability, to engage anticompetitive
behaviors, basically in the form of price and non-price discrimination. The former consists in charging
excessively high wholesale prices on competitors (thus rising their costs) or in applying predatory prices to
its own retail customers, in order to drive new entrants out of the market. Many other non-price-based forms
of discriminatory behavior are available for monopolists (for instance, a strategic variable in this sense is the
quality of service offered to other firms); usually they are identified as non-price discrimination or sabotage.
Regulators have seen in some forms of business separation an effective way to deter and to detect such
undesirable behaviors. To use the consolidate taxonomy suggested in Cave (2006), a first step is accounting
separation, which requires just separate accounts for the separated branches, in order to allow the regulator to
detect too high wholesale margins or too low retail profits (indicating excessive access prices applied to
competitors or predatory prices in the downstream segment, respectively). If price discrimination can be
effectively dealt with by implementing this solution, non-price discrimination remains an unsolved issue.
More pervasive forms of separations seem necessary in this sense. Crew et al. (2004), develop a model
referred to RBOCs (Regional Bell Operating Companies), firms controlling the access to local network in
US. They demonstrate that the divestiture by RBOCs of their local network could be a highly powerful tool
against sabotage and other monopoly issues. Moreover, it would constitute a welfare enhancing solution if
economies of scope in the industry were not relevant.
The extreme option of ownership separation (the incumbent has to divest the bottleneck segment, which
cannot belong to the same ownership as the rest of the firm) has been implemented in some countries for
other network industry (e.g. electricity). However some authors do not consider it as a suitable option for
telecoms (see Cave et al., 2006), for several reasons, among which is again highlighted the impossibility to
exploit of economies of scope and coordination across the ownership boundary2.
Functional separation is seen as an intermediate solution, effective against non-price discrimination and able
to limit the disadvantages of more pervasive forms of break-up. It can itself be ranked in several degrees,
ranging from the creation of a wholesale division to legal separation (separate entities under the same
ownership). As discussed by Tropina et al. 2010, to provide a definition, separation occurs with respect to
functions, employees and information.
In this framework, it is reasonable to question whether some of the disadvantages previously mentioned for
ownership separation are likely to occur also implementing this softer option, perhaps in a weaker form. For
instance, the impossibility to share production factor (which in principle could be common between stages)
such as labor, or to transfer information relevant for coordination activities could produce inefficiencies in
term of loss of economies of vertical integration. Moreover, the availability of the bottleneck assets for
competitors at favorable conditions is, on one hand, useful to foster service-based competition; nevertheless,
2 The authors highlight also the possibility of reducing the incentive to invest, the difficulty in establishing a clear and
stable point of break-up, which is impossible to be moved in case of mistake, and the fact that (except the separation of
AT&T), structural separation operations in telecoms have often failed.

6
on the other hand, it reduces the incentive of new entrants to invest in their own infrastructure, thus delaying
the implementation of infrastructure-based competition, broadly recognized as superior.
It emerges that it is relevant, from a regulatory perspective, to identify the potential pros and cons of a break-
up policy, even if implemented in a “soft” form such as functional separation. Moreover, it is relevant to
understand the magnitude of gains and costs, which must be correctly balanced. The aim of this work is to
evaluate the costs, if any, in term of losses in economies of vertical integration, of the implementation of
functional separation in European Countries. If such economies did not exist or were not relevant, this would
constitute an argument in favor to functional separation, as this solution would benefit consumers through
improved competition (which is likely to induce lower prices), without hurting them with efficiency losses in
the production of the service, which ultimately would impact negatively by raising the final tariff. If such
economies were relevant, instead, they would represent a relevant cost of a separation policy, which should
be implemented only if the gains in term of competition were large enough to offset those efficiency losses.
2.2 Economies of vertical integration and the telecom industry
The economies of vertical integration (EVI, henceforth) can be though as a special case of economies of
scope. Following Baumol, Panzar and Willig (1982), economies of scope are said to exist if the joint
production of several outputs is cheaper than the production of the same outputs by means of separated
specialized firms. The measure, in the case of two distinct vertical stages (and two outputs), can be expressed
as
Where indicates the output of the upstream stage, indicates the output of the downstream stage and
represents the cost of producing a certain output vector.
indicates economies of vertical integration, indicates diseconomies.
EVI in fixed telecom is not largely investigated in empirical works. In particular, to the best of our
knowledge, this is the first attempt to address the question of the existence of EVI in EU incumbent operator
after the implementation of separation policies.
Even if the issue of vertical economies between the wholesale and retail segments is, in general, not
explicitly investigated in the empirical literature on economies of scope in telecoms, there exist some
interesting contributions assessing the synergies between local and long distance (toll) services, which
reflect, in principle, a similar vertical relationship. In fact, the long distance provider need to access the local
network, which usually belong to the local operators. These works are mainly developed with reference to
the US market in the context of the debate concerning the break-up of AT&T. Therefore, they rely on quite
old dataset; moreover, the findings are controversial.
For instance, Evans and Heckman (1984) suggest a local test for natural monopoly based on the estimation
of a translog cost function. The estimated parameters are used to compute the predicted value of cost for joint
production of local and toll services and predicted value for disaggregated production, evaluated for different
output mixes. The results show that the cost function is not subadditive, providing evidence against joint
service provision.
A similar methodology is employed by Shin and Ying (1992), considering three outputs: number of access
lines, local calls and toll calls. Also in this case, the evidence supports superadditivity of cost in most of the
analyzed possibilities.
On the other hand, several studies provide evidence in favor of integration. For instance, Röller (1990) finds
important economies of scope and cost complementarities between local and toll services by testing two
models (with aggregated toll services or with a distinction in intra/interLATA), using quadratic
specifications of the cost function.
Charnes et al. (1988) as well find important efficiency gains coming from joint production with respect to
multi-firm production, by employing a goal programming /constrained regression model (basically a
parametric frontier model) in order to test for the presence of natural monopoly features in the Bell System.
Banker et al. (1998) estimate a multiple linear equations model, where the dependent variables (different cost
categories) are regressed on the same set of explanatory variables, that includes some indicators of joint

7
production (scope): scope lines (business, residential, public), scope calls (local or toll) and scope geography
(single or multi-state). The results show a negative impact of joint production on almost all cost categories,
thus including “scope calls”, even if only the effect of the indicator “scope lines” is statistically significant.
Gabel and Kennet (1994) employ cost data generated by means of an optimization model to compute
economies of scope between switched and non-switched (private line) service, either local and toll. They find
the economies of scope between switched and non-switched services to decrease with costumers density,
while stable and strong economies of scope are shown to exist between local and long-distance services
within the switched branch.
Moreover, to mention some non-US based contribution, it is important to recall Fuss and Waverman’s (1981)
work, using data related to Canadian operators. They estimate a translog cost function and find no significant
cost complementarities among the three considered outputs: local services, message toll (long distance)
services and other (competitive) services. However, the signs of the computed (non-significant) values
suggest the presence of complementarities between local and toll services.
Finally, evidence in favor of scope economies is provided by Bloch et al. (2001). The authors use a
composite cost function estimated on Telstra (the Australian incumbent) data, from 1926 to 1991. They find
that the economies of scope hypothesis hold between local and long distance calls.
As it emerges from the analysis of previous studies, there is not consistent evidence of the existence of
economies of scope in fixed telecom: the results are quite controversial and sensitive to the methodology
employed. Moreover, as mentioned above, the analyses rely on old datasets, while the rapid evolvement of
the technology would suggest that the findings could change by employing more recent data.
3 Methodology.
In this work we employ a non-parametric method to compute EVI. It is based on Data Envelopment Analysis
(DEA) and employs a two stages procedure, which will be illustrated below. The use of DEA methods to
estimate economies of scope has been introduced by Färe (1986). Later, similar approaches have been used,
among the others, by Arocena (2008), for electricity; Ferrier et al. (1993), for banking; Prior (1996), Fried et
al. (1998), Prior and Solá (2000), Kittelsen and Magnussen (2003), concerning hospitals; Grosskopf and
Yaisawarng (1990), on local public services; Kwon and Yun (2003), on cogeneration; Cummins et al.
(2003), on insurance; Growitsch and Wetzel (2007), on railways.
The basic idea is to construct two different frontiers: one for integrated firms, providing both the upstream
and the downstream outputs, while a second frontier is constructed for “specialized firms”. In many of the
above mentioned contributions, the specialized firms (providing only one of the considered outputs) are
combined, i.e. summed, in order to create virtual “additive” units producing output vectors similar to those
ones produced by the integrated firms; in doing so, the technology defined by summing the specialized firms
does not reflect joint production; rather, it conserves the productivity characteristics of the specialized
production technologies.
Let us analyze the procedure. First of all, the N units are divided in two groups: the group I of integrated (not
separated) firms, and the group S of “combined” separated firms. Moreover we have:
= input (cost) of firm n, n = 1, …, N
= output (vector) of firm n
J, H = (S,I)
Stage 1. For each firm n, we need to get the efficiency score computed with respect to its own frontier, which
can be defined as:
This is computed by means of a standard DEA program, and we expect to get
Stage 2. For each firm n, we need also the cross-frontier efficiency score, i.e. the efficiency score each firm
gets when compared to the frontier constructed with respect to the firms belonging to the other group:

8
This is computed by solving a super-efficiency DEA program. It allows to exclude from the frontier the unit
under evaluation, i.e. the firm receives an efficiency score but does not contribute to define the shape of the
production possibility set. For this reason, in this stage is not constrained to be smaller or equal to one.
After the second stage each firms possess two efficiency score: , computed with respect to the separated
firms frontier, and , computed with respect to the integrated firms frontier. These values allow to compute
the EVI.
Starting from the definition of economies of vertical integration presented in section 2.2, and following
Arocena (2008), we will get, for each one of the considered units:
EVI =
=
=
-1. (1)
Where the term “ ” represents the observed cost projected on the frontier, as it is multiplied by the
efficiency score, considering the “separated” technology, while the term “ ” represents the efficient
cost of producing the same output vector by means of the “integrated” technology.
Clearly, if the (efficient) joint production is cheaper than the (efficient) separated production, economies of
vertical integration occur (EVI>0). Diseconomies would result in the opposite case.
Such approach presents some relevant advantages:
- it is implemented in a non-parametric (DEA) framework, which has the desirable features of not
imposing any pre-specified functional form and of being suitable for small dataset, which is actually
our case.
- It employs a frontier technique, therefore no cost-minimizing behavior is assumed a priori; rather,
the existence of inefficiency is allowed for. Following Grosskopf et al. (1992), this is an interesting
feature, because it allows to compute economies and diseconomies of integration on the “pure”
technology, “cleaned” from the inefficiency effect that could distort the results.
- Two separated frontiers are constructed for integrated and separated firms; in this way we do not
assume that the two groups operate under the same technology; rather, the existence of two different
production possibility sets is allowed for.
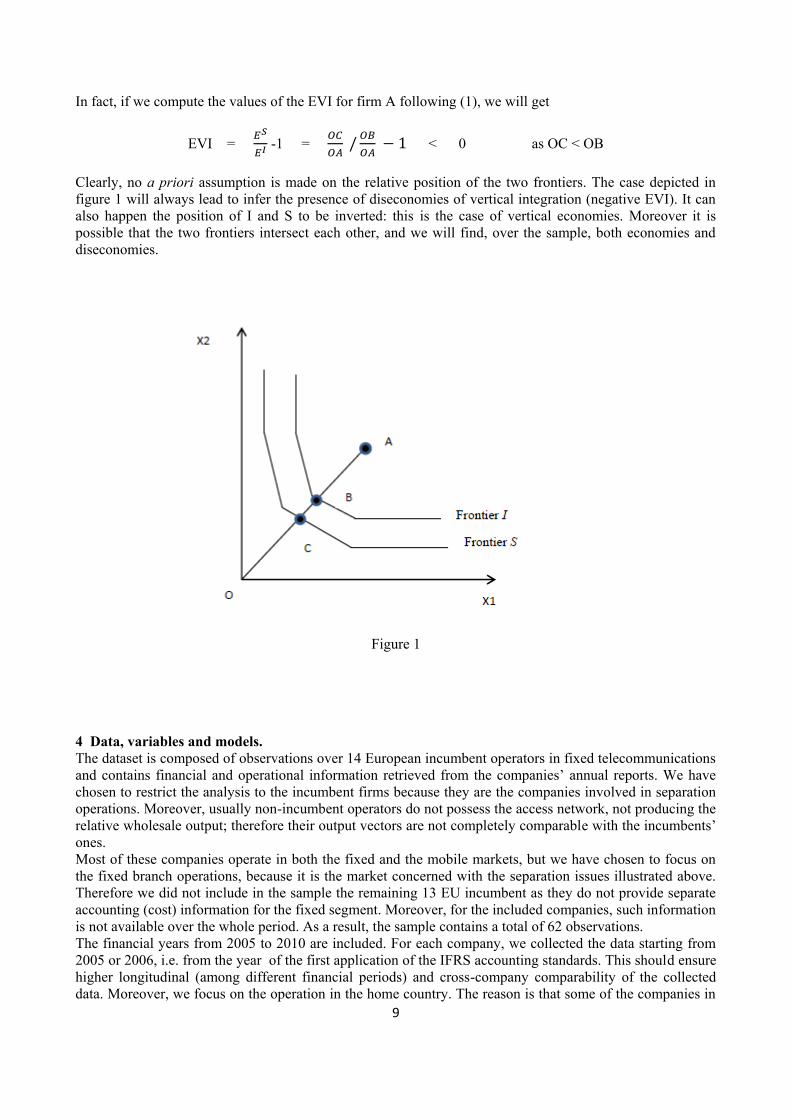
In Figure 1 a two inputs (x1 and x2) case is represented. It is relevant to point out that this is not the case of
the two models proposed in this work. Anyway, such a representation is helpful to better understand the
methodology.
The two isoquants represent all the efficient combinations of inputs allowing to produce a given level of
output by means of a joint (I) or of a separate (S) production technology, respectively. Let us assume that
firm A is a functionally (vertically) separated firm operating with some degree of inefficiency, as the input
consumption is higher than the efficient one, represented in the point C, that lies on the (separated) frontier
isoquant. The efficiency score of firm A would be
, which express the maximal proportional
contraction that can be applied to the input and still allows to produce the given output.
If we compute , the efficiency score of firm A with respect to the frontier I, i.e.
, we would get an
higher ratio, because the segment OB is longer than the segment OC. In other words, we will have
.
This is so because the integrated production technology (bounded by the frontier I) is “internal” to the
separated one, in the sense that some of the production combinations allowed by the technology S are not
feasible in I. This is evident by looking at the relative position of the two frontier: S requires, for a given
level of output, an always lower quantity of x1 or x2, or of both the factors. This means that it is more
efficient to produce using technology S rather than technology I; in other words, diseconomies of vertical
integration occur.
9
In fact, if we compute the values of the EVI for firm A following (1), we will get
EVI =
-1 =
< 0 as OC < OB
Clearly, no a priori assumption is made on the relative position of the two frontiers. The case depicted in
figure 1 will always lead to infer the presence of diseconomies of vertical integration (negative EVI). It can
also happen the position of I and S to be inverted: this is the case of vertical economies. Moreover it is
possible that the two frontiers intersect each other, and we will find, over the sample, both economies and
diseconomies.
Figure 1
4 Data, variables and models.
The dataset is composed of observations over 14 European incumbent operators in fixed telecommunications
and contains financial and operational information retrieved from the companies’ annual reports. We have
chosen to restrict the analysis to the incumbent firms because they are the companies involved in separation
operations. Moreover, usually non-incumbent operators do not possess the access network, not producing the
relative wholesale output; therefore their output vectors are not completely comparable with the incumbents’
ones.
Most of these companies operate in both the fixed and the mobile markets, but we have chosen to focus on
the fixed branch operations, because it is the market concerned with the separation issues illustrated above.
Therefore we did not include in the sample the remaining 13 EU incumbent as they do not provide separate
accounting (cost) information for the fixed segment. Moreover, for the included companies, such information
is not available over the whole period. As a result, the sample contains a total of 62 observations.
The financial years from 2005 to 2010 are included. For each company, we collected the data starting from
2005 or 2006, i.e. from the year of the first application of the IFRS accounting standards. This should ensure
higher longitudinal (among different financial periods) and cross-company comparability of the collected
data. Moreover, we focus on the operation in the home country. The reason is that some of the companies in
10
the sample are controlled or participated by other ones which are as well included in the dataset, and which
consolidate the former in the group accounts. The exclusion of the operations in foreign countries avoids the
problem of attributing the same costs and outputs twice, to the controlled and to the controlling company.
The group of separated units is composed of three firms: Telecom Italia, British Telecom and TeliaSonera. In
all these cases, the separated wholesale entities still belong to the parent company (division) or to its group
(subsidiary). Therefore, the separated firms technology is estimated through units that produce both the
upstream and the downstream output, but with the awareness that they operate under functional separation
restrictions. In relation to this point, this work differs from other contributions employing similar
methodologies: in most cases, the “separate” technology is estimated by means of “virtual” firms constructed
combining (summing the data of) observations related to completely specialized independent units. In this
work, instead, the separated units are real, rather than “virtual”, firms. This fact could be considered an
advantage, as here it make sense to estimate the EVI (as “potential” EVI lost as a consequence of functional
separation) also over this segment of the sample.
The group of integrated units is composed by the observations related to the remaining firms (49
observation).
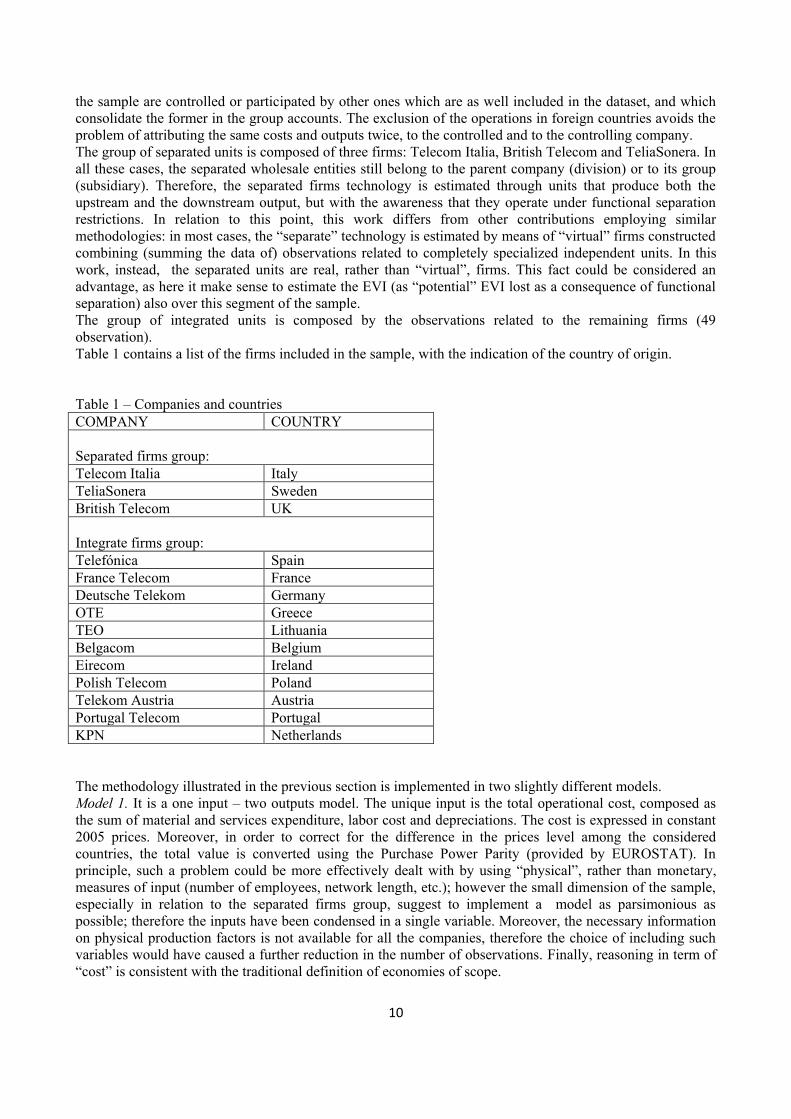
Table 1 contains a list of the firms included in the sample, with the indication of the country of origin.
Table 1 – Companies and countries
COMPANY COUNTRY
Separated firms group:
Telecom Italia Italy
TeliaSonera Sweden
British Telecom UK
Integrate firms group:
Telefónica Spain
France Telecom France
Deutsche Telekom Germany
OTE Greece
TEO Lithuania
Belgacom Belgium
Eirecom Ireland
Polish Telecom Poland
Telekom Austria Austria
Portugal Telecom Portugal
KPN Netherlands
The methodology illustrated in the previous section is implemented in two slightly different models.
Model 1. It is a one input – two outputs model. The unique input is the total operational cost, composed as
the sum of material and services expenditure, labor cost and depreciations. The cost is expressed in constant
2005 prices. Moreover, in order to correct for the difference in the prices level among the considered
countries, the total value is converted using the Purchase Power Parity (provided by EUROSTAT). In
principle, such a problem could be more effectively dealt with by using “physical”, rather than monetary,
measures of input (number of employees, network length, etc.); however the small dimension of the sample,
especially in relation to the separated firms group, suggest to implement a model as parsimonious as
possible; therefore the inputs have been condensed in a single variable. Moreover, the necessary information
on physical production factors is not available for all the companies, therefore the choice of including such
variables would have caused a further reduction in the number of observations. Finally, reasoning in term of
“cost” is consistent with the traditional definition of economies of scope.

11
The two outputs must reflect the upstream and the downstream operations. The most relevant indicator
available for all the firms is the number of access lines. Therefore the two considered output measures are:
- The total number of wholesale accesses (provided to other operators by means of local loop
unbundling, wholesale line rental, etc.)
- The total number of retail accesses provided to the final customers.
As in Arocena (2008), the observations are pooled, i.e. each observation is treated as an independent unit in
order to construct an inter-temporal best practice frontier, as explained in Tulkens and Vanden Eeckaut
(1995). This procedure also allows to operate with a sufficient number of observations.
The DEA programs are run under the CRS assumption. This assumption ensure that, once an inefficient unit
is projected on the frontier, we have net out all the possible sources of inefficiency, namely technical and
scale inefficiency, thus we are able to detect pure scope effects. Moreover, it allows to avoid problems in
dealing with the super-efficiency estimates, as the super-efficiency program could in some cases have no
solution if VRS were assumed.
Model 2 follows almost entirely model 1, except for the fact that the retail output is split in narrow band and
broadband accesses. The underlying idea is that not all the retail lines present the same quality in terms of
customer utility. Moreover, telecom companies receive pressure from the regulatory side to increase the
penetration of the broadband. Finally, it is likely that the higher quality of the broadband output is reflected
in higher resource consumption. Summing up, the variables appearing in model 2 are:
- total cost, as defined in model 1, as input;
- total wholesale accesses (which in principle could as well be divided in narrow and broadband;
unfortunately, the information is not available for all the firms. Moreover, the number of
observations is not sufficient to deal with one more dimension);
- “low-quality” retail accesses: narrow band lines provided to the final customers (e.g. traditional
PSTN lines)
- “high-quality” retail accesses: broadband lines provided to final customers (e.g. DSL lines).
The two proposed models are very similar, anyway it is interesting to undertake both the approaches in order
to understand whether or not accounting for qualitative difference in the provided services has an impact on
the final results.
Table 2 provides some descriptive statistics of the variables. It emerges a relevant variability that depends
mainly on the different size of the analyzed firms.
Table 2. Descriptive statistics
Mean St.Dev. Min. Max.
Tot. cost (euro millions) 6335 5971 250 20340
Wholesale accesses (thousands) 3646 4560 35 16221
Retail accesses (thousands) 14132 13203 689 44800
Broadband retail accesses (thousands) 3149 3079 102 12100
Narrowband retail accesses (thousands) 10983 10398 477 37900
5 Results
From the application of the described methodology, it is possible to get, as an “intermediate” result, the
efficiency scores of the observed units. As table 3 shows, on average, the efficiency scores are slightly higher
for the separated firms group in both the models. As we are analyzing the efficiency measures computed, for
each unit (observation), with respect to its own frontier, we still cannot say whether the firms in group S are
more efficient than firms in group I. This result just means that, on average, the separated units lie closer to
the frontier, while the integrated ones are more dispersed.

12
Table 3. Average efficiency scores and average by year.
MODEL 1
MODEL 2
Separated Integrated Separated Integrated
mean 80,06 75,94 85,11 81,23
2005 - 69,40 - 77,17
2006 63,85 70,54 66,40 74,77
2007 69,78 71,19 73,80 75,03
2008 77,99 78,63 83,88 84,10
2009 86,07 79,11 91,82 85,52
2010 93,79 87,27 99,64 90,80
Moreover, dealing with observations related to different years allows to highlight a trend: the efficiency
scores are, on average, increasing over the considered time period. The tendency is confirmed either by
model 1 and model 2 (except for year 2005 in model 2, in relation to group I) and suggests the presence of a
technological improvement, which seems to be faster and more evident for group S. By examining the
individual efficiency scores, not reported in the table3, it emerges that this trend holds for all the separated
firms, while the integrated ones do not show such a clear tendency.
Let us turn to the examination of the estimated economies of vertical integration, summarized in table 4 (the
EVI are reported for each firm as average over the available period).
Table 4. Average EVI by firm
FIRMS EVI M1 EVI M2
Separated firms
Telecom Italia -0,27 -0,20
TeliaSonera -0,28 -0,28
British Telecom -0,47 -0,45
Integrated firms
Telefonica -0,19 -0,17
France Telecom -0,26 -0,25
Deutsche Telecom -0,24 -0,20
OTE -0,24 -0,25
TEO -0,19 -0,05
Belgacom -0,19 -0,21
Eirecom -0,29 -0,25
Polish Telecom -0,20 -0,18
Telekom Austria -0,19 -0,10
Portugal Telecom -0,19 -0,21
KPN -0,36 -0,35
mean -0,25 -0,21
Quite surprisingly, at least from a theoretical perspective, negative EVI (diseconomies) result from both the
models and present, on average, relevant values (more than 20%). This result should be interpreted, for
integrated firms, as an higher cost sustained because of joint provision of wholesale and retail services; for
3 Available upon request

13
the S group, instead, the EVI indicator expresses the savings firms achieve by operating under functional
separation. Putting it differently, separated firms are able to produce more efficiently. It is relevant to point
out that these losses and savings do not apply to the observed cost level of the firms: it is the effect that
vertical integration or disintegration would induce on the units if they operated efficiently, i.e. on the
frontier.
The EVI indicators estimated by means of model 1 are quite stable (20-30%), with the exception of British
Telecom that presents higher values. The stability is maintained also when we consider the value of the
indicator computed for single observations (not reported in the table).
By looking at the results of model 2, it emerges an higher variability in the EVI indicator, which is on
average lower in terms of absolute value; in other words, diseconomies of integration still prevail, but they
are smaller and less stable across firms. Only two companies, Belgacom and Portugal Telecom, present
higher diseconomies4. Paying attention to the composition of the output, it emerges that the increase in the
EVI indicator across models is higher the more the firms are concentrated on the broadband service: the
correlation coefficient between the increase in EVI across models and the percentage of broadband access
provided is about 80%, meaning that when the broadband output becomes more important, the two frontiers
get closer. Basically, it appears that on average separated firms operate by far more efficiently than the
integrated ones, but they become relatively less good once more advanced services must be supplied.
Summing up, from the empirical analysis, the following points emerge:
1) Separated firms increase their efficiency level over time more (and more quickly) than integrated
firm do.
2) Separated firms are able to operate more efficiently than integrated ones: by comparing the two
frontiers, it emerges that the separated production technology is superior over the whole sample in
model 1, and over most of the sample in model 2. This suggests that the technology does not present
synergies of joint production, rather, separating wholesale and retail branches seems to induce
efficiency gains. However, the superior efficiency of the separated technology can have other
sources than “pure” economies of vertical integration. For instance, it is possible that the S group
companies, in implementing functional separation, have also re-organized their way to operate, by
solving congestion problems or eliminating other latent sources of inefficiency; this could easily be
the case since these incumbent firms have enjoyed some degrees of discretion in the re-organization
process.
Finally, it is possible that the implementation of functional separation, by encouraging new entries,
or, at least, by generating the expectation of new entries in the future, provides an incentive to the
incumbent firms to improve their performance: higher competitive pressure (or, at least, a threat in
this sense) often leads the firms in the market to operate more carefully on the cost side.
3) The magnitude of diseconomies decreases when, on the output side, a distinction is made between
narrow and broadband accesses, and firms concentrate more on the latter service. This fact suggests
that, although separation remains, at least on average, the most efficient way to operate, when
advanced services such as broadband assume more weight in terms of output mix, the separated
firms loose part of their relative advantage. A possible explanation is that the provision of advanced
services (and, probably, this is especially the case in the starting phases) requires to share production
factors and, perhaps more relevantly, information flows across vertically related stage. When
“Chinese walls” are built between subsequent segments, this task becomes harder, generating
efficiency reductions.
The general idea emerging from the analysis strongly support functional separation policies: not only they
foster competition, but they also induce improvements, rather than losses, in terms of economies of scope.
Clearly, this analysis does not consider another major possible drawback of separation, namely the
possibility that new entrants delay investments on their own network and thus the implementation of
infrastructure based competition. Anyway, if the efficiency gains coming from separation actually depended
only on the presence of “pure” diseconomies of scope characterizing the technology, the interest in providing
incentive for new entrants to undertake such investments would be questionable. In fact, it would lead to a
4 By looking to the EVI value for single observations, the variability is even higher, with a few cases (4 observation)
where the sign changes (small economies: around 2%).

14
market composed of many vertically integrated operators, whose performance would suffer of inefficiencies
due to negative EVI. Rather, it could be the case to consider the opportunity to further foster service-based
competition and to promote separation as a best practice solution.
6 Conclusions
Functional separation in fixed telecommunication is now involved in a relevant academic and non-academic
debate. The aim of implementing such a policy is to foster service-based competition, which would
ultimately benefit consumers through lower prices. However, some potential drawbacks have been pointed
out: a major one is related to the possible losses in production efficiency due to the inability to exploit
economies of scope. This work is aimed to check whether the implementation of functional separation in
some European Countries has been costly in terms of economies of vertical integration.
The empirical analysis is performed by means of a DEA-based methodology allowing to estimate the value
of EVI by computing and comparing, for each firm, two efficiency scores, evaluated with respect to the
separated and to the integrated technology frontiers, respectively.
Two models have been implemented: a basic model that simply distinguishes wholesale and retail outputs,
and an improved model that considers different quality levels in the downstream output, treating narrow
band and broadband accesses as distinct variables.
The findings show that separation is not costly from an efficiency perspective; rather, diseconomies of
vertical integration emerge from both the models (more that 20%, on average). This fact can be related to the
technological features characterizing the industry (we would have detected “pure” diseconomies), but can
also depend on other reasons. For instance, the companies, in implementing functional separation, could
have undertaken a sort of organizational restructuring helpful in improving performance by eliminating
latent inefficiency sources, not necessarily related to the vertical structure of the firm. Moreover, it is likely
that the increased competitive pressure following separation (or the incumbents’ expectations in this sense)
acts as an incentive leading to improve the efficiency level.
Whatever the cause (“pure” vertical diseconomies, re-organization, competitive pressure, or a mix of these
factors), it emerges that separation positively affects incumbent performance, sustaining the arguments in
favor of the implementation of such a policy choice.
However, if model 1 is completely consistent with these results, model 2 presents more variability in the
estimated EVI indicators. The level of diseconomies is (on average) lower than in model 1, and the
difference is more evident for the units more concentrated on the provision of the broadband output. This
means that, although on average separate production is superior, its relative advantage is reduced when firms
focus on more advanced services. It could be related to the fact that the provision (or, at least, the
implementation) of advanced services requires production factors or, more likely, information to flow freely
across subsequent operational stages; separation limits these possibilities of “circulation”, and this fact could
act reducing the separation advantages. Therefore, if increasing broadband penetration is a regulatory
priority, than more caution should be taken in implementing separation policies.
However, it is worthwhile to point out that, from a policy perspective, our results should be taken cautiously,
considering the limited dimension of the sample, especially in relation to the group of the separated firms.
Moreover, no environmental factors have been included in the analysis: European incumbent firms operate in
similar, but not identical, environments, and accounting for such factors could constitute an interesting
development for future research.
Aknowledgments
The author acknowledges a grant for the Lagrange Project – CRT Foundation.

15
REFERENCES
Arocena, P. (2008) “Cost and quality gains from diversification and vertical integration in the electricity
industry: a DEA approach”. Energy economics, 30, pp.39-58.
Banker, R.D., Chang, H.H., Majumdar, S.K. (1998). “Economies of scope in the U.S.
telecommunications industry”. Information economics and policy, 10, pp.253-272.
Baumol, W.J., Panzar, J.C., Willig, R.D. (1982). “Contestable markets and the theory of industry
structure”. Harcourt Brace Jovanovich, New York.
Bloch, H., Madden, G., Savage, S.J. (2001). “Economies of scale and scope in Australian
telecommunications”. Review of industrial organization, 18, pp. 219-227.
Cave, M., Correa, L., Crocioni, P., (2006). “Regulating for non-price discrimination. The case of UK
fixed telecoms”. Online at:
http://web.si.umich.edu/tprc/papers/2006/526/non-price2.pdf
Cave, M. (2006). “Six degrees of separation. Operational separation as a remedy in European
telecommunications regulation”. MPRA paper no. 3572.
online at http://mpra.ub.uni-muenchen.de/3572/
Charnes, A., Cooper, W.W., Sueyoshi, T. (1988). “A goal programming/constrained regression review of
the Bell system breakup”. Management Science, vol. 34, n.1, pp. 1-26
Crandall, R.W., Eisenach, J.A., Litan, R.E. (2010). “Vertical separation of telecommunication networks:
evidence from five countries”. Federal Communication law journal, vol.62, n.3, pp. 493-539
Crew, M.A., Kleindorfer, P.R., Sumpter, J. (2004). “Bringing competition to telecommunications by
divesting the RBOCs” in Obtaining the best from regulation and competition, Kluwer Academic
Publishers, pp.21-40
Cummins, J.D., Weiss, M.A., Zi, H. (2003). “Economies of scope in financial services: A DEA
bootstrapping Analysis of the US insurance industry”. Available at
http://irm.wharton.upenn.edu/F03-Cummins.pdf
Evans, D.S., Heckman, J.J. (1984). “A test for subadditivity of the cost function with an application to
the Bell system”. The American economic review, vol.74, no.4, pp. 615-623.
Evans, D.S., Heckman, J.J. (1986). “A test for subadditivity of the cost function with an application to
the Bell system - erratum”. The American economic review, vol.76, no.4, pp. 856-858.
Evans, D.S., Heckman, J.J. (1988). “Natural monopoly and the Bell system: response to Charnes, Cooper
and Sueyoshi”. Management science, vol.34, no.1, pp-27-38.
Färe, R. (1986). “Addition and efficiency”. Quarterly journal of economics, 51, pp. 861-865.
Ferrier, G.D., Grosskopf, S., Hayes, K.J., Yaisawarng, S. (1993). “Economies of diversification in the
banking industry”. Journal of monetary economics, 31, pp. 229-249.
Fried, H.O., Schmidt, S.S., Yaisawarng, S. (1998). “Productive, scale and scope efficiencies in U.S.
hospital-based nursing homes”. INFOR, 36, 3. pp. 103-119.
16
Fuss, M., Waverman, L. (1981). “Regulation and the multiproduct firm: the case of telecommunications
in Canada”. In Studies in public regulation, ed. By G. Fromm, Cambridge: MIT Press, 277-313.
Gabel, D., Kennet, D. M. (1994). “Economies of scope in the local telephone exchange market”. Journal
of regulatory economics, 6, pp. 381-398.
Grosskopf, S., Yaisawarng, S. (1990). Economies of scope in the provision of local public services.
National tax journal, 43, 1, pp. 61-74
Grosskopf, S., Hayes, K., Yaisawarng, S. (1992) “Measuring economies of diversification: a frontier
approach”. Journal of business & economic statistics, vol.10, n.4, pp. 453-459.
Growitsch, C., Wetzel, H. (2007) “Testing for economies of scope in European Railways: an efficiency
analysis”. University of Luneburg, working paper series in economics, n.72.
Kittelsen, S.AC., Magnussen, J. (2003). “Economies of scope in Norwegian hospital production – a DEA
analysis”. Available at:
http://www.med.uio.no/helsam/forskning/nettverk/hero/publikasjoner/skriftserie/2003/HERO2003_8.pdf
Kwon, O.S., Yun, W.C. (2003). “Measuring economies of scope for cogeneration systems in Korea, a
non-parametric approach. Energy economics, 25, pp. 331-338
Penrose, E. (1959). “The theory of the growth of the firm”. Oxford: Basil Blackwell
Prior, D. (1996). “Technical efficiency and scope economies in hospitals”. Applied economics, 78, pp.
1295 - 1301
Prior, D., Solà M. (2000). “Technical efficiency and economies of diversification in health care”. Health
care management science, 3, pp. 299-307.
Röller, L.-H. (1990). “Proper quadratic cost functions with an application to the Bell System”. The
review of economics and statistics, vol. 72, no.2, pp. 202-210
Sappington, D.E.M. (2002). “Price regulation and incentives” in Handbook of telecommunication
economics (EdS) M. Cave, S. Majumdar, and I. Vogelsang, North Holland, Amsterdam pp. 225-93.
Shin, R.T., Ying, J.S. (1992). “Unnatural monopolies in local telephone”. The RAND journal of
economics, vol. 23, no.2, pp. 171- 183
Tropina, T., Whalley, J., Curwen, P. (2010). “ Functional separation within the European Union: debates
and challenges”. Telematics and informatics, 27, pp. 231-241.
Tulkens, H., Vanden Eeckaut, P. (1995). “Non-parametric efficiency, progress and regress measures
for panel data,methodological aspects”. European Journal of Operational Research, 80, pp.474–
499.