functional description iec 61000-2-4 watchdog
TRANSCRIPT

Dok
. Nr.
2.03
3.12
9.0
Janitza electronics GmbHVor dem Polstück 1D-35633 LahnauSupport tel. +49 (0) 64 41 9642-22Fax +49 (0) 64 41 9642-30e-mail: [email protected]: http://www.janitza.com
ww
w.ja
nit
za.c
om
Functional description
IEC 61000-2-4 Watchdogfor UMG 605, UMG 511 and UMG 512
Article no.: 51.00.265
IEC 61000-2-4 Watchdog2
IEC 61000-2-4 Watchdog
Content
Introduction 3
Copyright 3
Trademarks 3
Disclaimer 3
Comments on the manual 3
“IEC 61000-2-4 Watchdog” app 5
Short description 5
Most important characteristics: 5
Integrate Power Analyser into the GridVis 6
Fixed IP address 6
DHCP mode 6
Integrating the UMG 605 7
Integrating the UMG 511 / 512 8
Setting the IP address of the computer for a direct connection 9
Insert the device in the GridVis software 10
Installing the app 12
Getting to the app 13
Basic operation of the app 14
Opening the app 14
Structure of the screen 15
IEC 61000-2-4 Settings app 16
Comprehensive user guide 17
Viewing a report 17
Overview harmonics according to IEC 61000-2-4 standard 19
Trouble shooting 20
IEC 61000-2-4 Watchdog3
IEC 61000-2-4 Watchdog
Introduction
Copyright
This functional description is subject to the legal requirements for copyright protection and may not be, either in whole or in part, photocopied, reprinted, or reproduced by mechanical or electronic means, or in any other manner be duplicated or redistributed without the legally binding, written agreement of
Janitza electronics GmbH, Vor dem Polstück 1,
D 35633 Lahnau, Germany,
Trademarks
All trademarks and their resulting rights belong to the respective holders of these rights.
Disclaimer
Janitza electronics GmbH takes no responsibility for errors or defects within this functional description and takes no responsibility for keeping the contents of this operating manual up to date.
Comments on the manual
We welcome your comments. In the event that anything in this manual seems unclear, please let us know and send an EMAIL to: [email protected]
m Follow the instructions in the operating manual when installation and operating the device!

IEC 61000-2-4 Watchdog4
IEC 61000-2-4 Watchdog
c Dangerous voltage!
Danger to life or risk of serious injury. Disconnect system and device from power supply before beginning work on them.
Meaning of the symbols
The following pictograms are used in the operating manual at hand:
m Caution!
Please follow the documentation. This symbol warns of possible dangers that can arise during installation, commissioning and use.
C Note
IEC 61000-2-4 Watchdog5
IEC 61000-2-4 Watchdog
“IEC 61000-2-4 Watchdog” app
The IEC 61000-2-4 gives numerical compatibility levels for industrial and non-public power distribution sys-tems at nominal voltages up to 35 kV. It is a must to monitor the voltage quality continuously in every critical installation, in accordance with the IEC 61000-2-4 standard to guarantee proper working of the equipment installed.
Short description
The “IEC61000-2-4” app, once installed on your Janitza meters, makes it possible to view reports created using the IEC61000-2-4 standard. With help of the reports, you can check the voltage quality continuously and act on any discrepancies.
Most important characteristics:
• Embedded watchdog functionality in accordance with the IEC 61000-2-4 standard
• Ability to generate reports either per day or per week
• Not necessary to transfer high amounts of measuring data from the meter to a host system
• Ability to change the settings to match your electrical network and class
• Easy Analysis with embedded traffic light principle
• Saving communication costs in remote applications
• Possible to do PQ-analyses without specific power quality knowledge
C Note!
The auxiliary voltage of the device should be buffered to ensure that power failures can be reliably detected as events.
IEC 61000-2-4 Watchdog6
IEC 61000-2-4 Watchdog
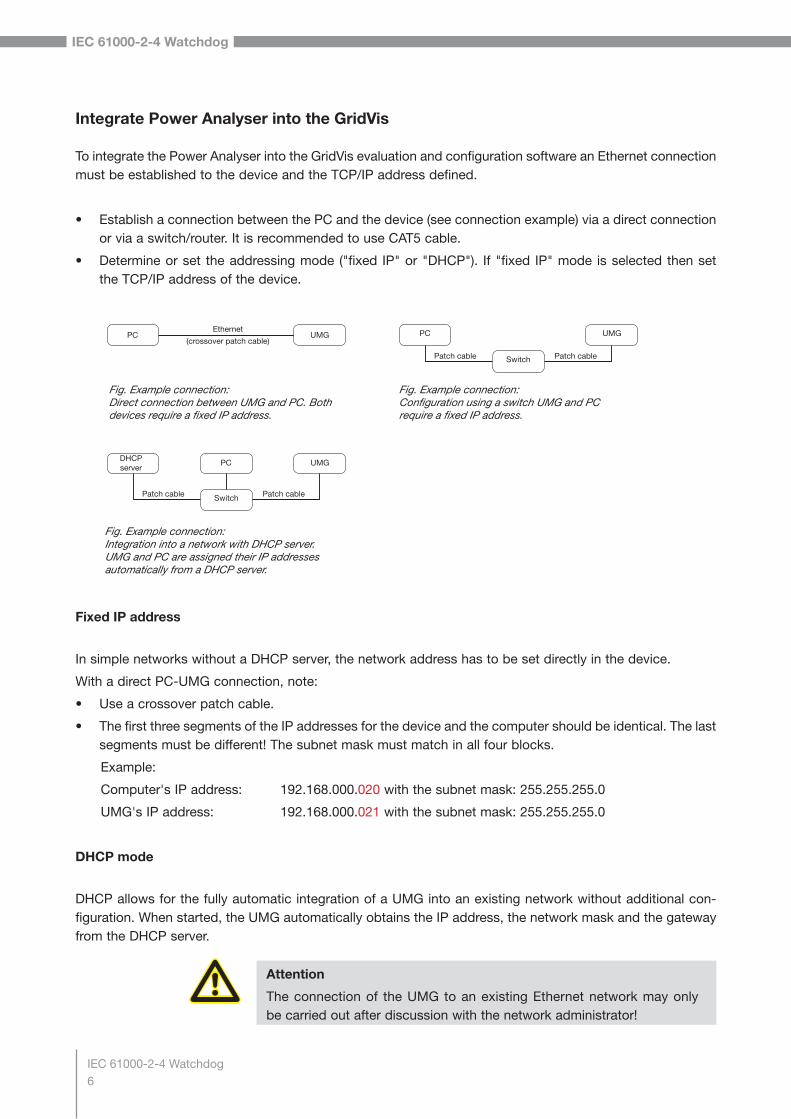
Integrate Power Analyser into the GridVis
To integrate the Power Analyser into the GridVis evaluation and configuration software an Ethernet connection must be established to the device and the TCP/IP address defined.
• Establish a connection between the PC and the device (see connection example) via a direct connection or via a switch/router. It is recommended to use CAT5 cable.
• Determine or set the addressing mode ("fixed IP" or "DHCP"). If "fixed IP" mode is selected then set the TCP/IP address of the device.
Fixed IP address
In simple networks without a DHCP server, the network address has to be set directly in the device.
With a direct PC-UMG connection, note:
• Use a crossover patch cable.
• The first three segments of the IP addresses for the device and the computer should be identical. The last segments must be different! The subnet mask must match in all four blocks.
Example:
Computer's IP address: 192.168.000.020 with the subnet mask: 255.255.255.0
UMG's IP address: 192.168.000.021 with the subnet mask: 255.255.255.0
DHCP mode
DHCP allows for the fully automatic integration of a UMG into an existing network without additional con-figuration. When started, the UMG automatically obtains the IP address, the network mask and the gateway from the DHCP server.
Fig. Example connection: Configuration using a switch UMG and PC require a fixed IP address.
SwitchPatch cable Patch cable
PC UMG
Fig. Example connection: Integration into a network with DHCP server. UMG and PC are assigned their IP addresses automatically from a DHCP server.
Patch cable Patch cable
DHCPserver
PC UMG
Switch
PC UMGEthernet
(crossover patch cable)
Fig. Example connection: Direct connection between UMG and PC. Both devices require a fixed IP address.
m Attention
The connection of the UMG to an existing Ethernet network may only be carried out after discussion with the network administrator!
IEC 61000-2-4 Watchdog7
IEC 61000-2-4 Watchdog
Integrating the UMG 605
• Change the device to programming mode. To do so press buttons 1 and 2 simultaneously for approx. 1 second. With the password query deactivated the programming mode is then started and identified with the text "PRG". The first digit of the address flashes.
• Set the address 205 for the selection "DHCP-Modus" (=2) or "Fixed IP address" (=0).
• To do so, use button 2 to set the first digit to the value 2. Then switch to the second digit with button 1 and set it to a value of 0 with button 2. Set the third digit to a value of 5 in the same way.
• Once the address is set, switch to the setting with button 1. Use button 2 to set the parameter to the corresponding value (cf. "Addressing mode" table).
• For further settings use button 1 to go back and enter the next address.
• If no button is actuated for ca. 60 seconds, or if buttons 1 and 2 are pressed simultaneously for ca. 1 seconds, then the device exits programming mode and changes back to display mode.
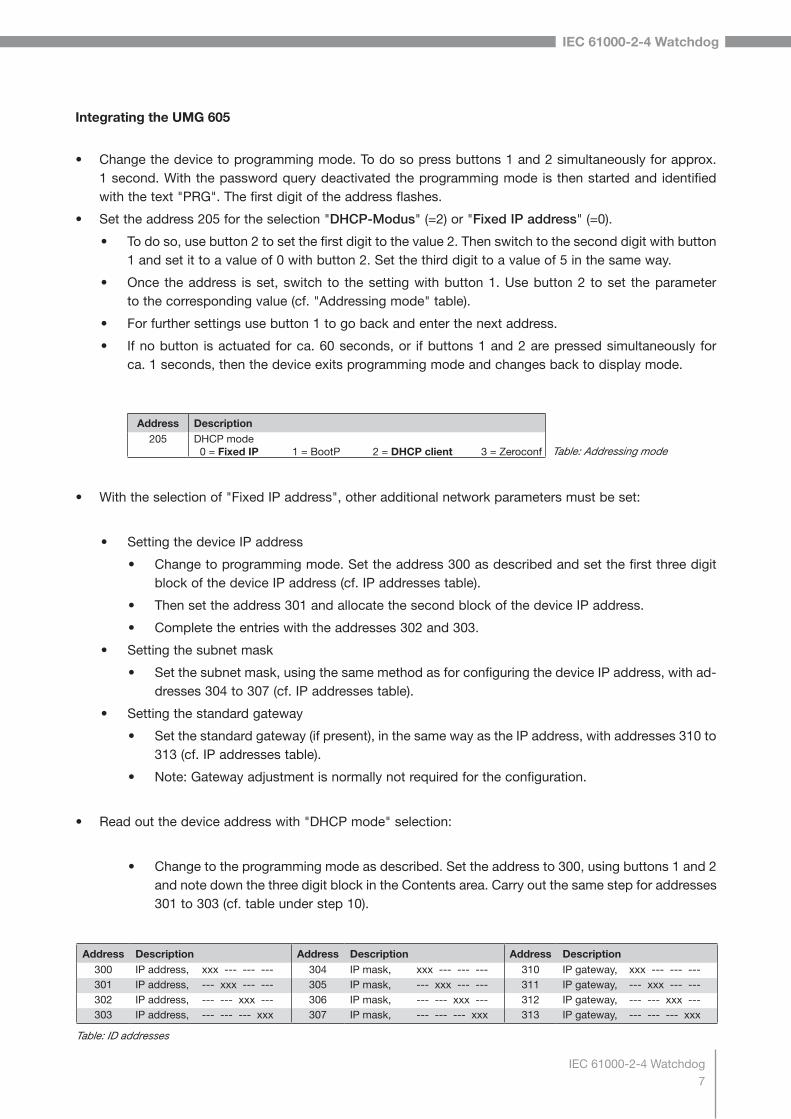
Address Description205 DHCP mode
0 = Fixed IP 1 = BootP 2 = DHCP client 3 = Zeroconf Table: Addressing mode
• With the selection of "Fixed IP address", other additional network parameters must be set:
• Setting the device IP address
• Change to programming mode. Set the address 300 as described and set the first three digit block of the device IP address (cf. IP addresses table).
• Then set the address 301 and allocate the second block of the device IP address.
• Complete the entries with the addresses 302 and 303.
• Setting the subnet mask
• Set the subnet mask, using the same method as for configuring the device IP address, with ad-dresses 304 to 307 (cf. IP addresses table).
• Setting the standard gateway
• Set the standard gateway (if present), in the same way as the IP address, with addresses 310 to 313 (cf. IP addresses table).
• Note: Gateway adjustment is normally not required for the configuration.
• Read out the device address with "DHCP mode" selection:
• Change to the programming mode as described. Set the address to 300, using buttons 1 and 2 and note down the three digit block in the Contents area. Carry out the same step for addresses 301 to 303 (cf. table under step 10).
Address Description Address Description Address Description300 IP address, xxx --- --- --- 304 IP mask, xxx --- --- --- 310 IP gateway, xxx --- --- ---301 IP address, --- xxx --- --- 305 IP mask, --- xxx --- --- 311 IP gateway, --- xxx --- ---302 IP address, --- --- xxx --- 306 IP mask, --- --- xxx --- 312 IP gateway, --- --- xxx ---303 IP address, --- --- --- xxx 307 IP mask, --- --- --- xxx 313 IP gateway, --- --- --- xxx
Table: ID addresses
IEC 61000-2-4 Watchdog8
IEC 61000-2-4 Watchdog
Integrating the UMG 511 / 512
• Start the configuration menu from the home display with button 1 ("ESC"). Change to the "Communica-tion" entry with button 3 and open this with button 6.
• Similarly to above, set the selection to "DHCP". To do so mark the "DHCP" entry and open this via but-ton 6. Select the corresponding entry "DHCP" or "Off" with button 3 or 4 and confirm this with button 6. Deactivate the entry in the case of networks without DHCP servers ("Off").
• With the DHCP mode deactivated ("Off") further network parameters must be set:
• Setting the device IP address
• Select the entry "Address" with button 3 or 4 and open this with button 6. Change the first digit of the address via button 3 or 4. Then switch to the second digit with button 5 and set this in a similar manner to above. Complete the IP address and confirm the entries with button 6.
• Setting the subnet mask
• Select the entry "Netmask" with button 3 or 4 and open this with button 6. Set the subnet mask in a similar manner to the setting of the IP address for the device.
• Setting the standard gateway
• Select the entry "Address" with button 3 or 4 and open this with button 6. Set the IP address for the Standard Gateway (if present) in a similar manner.
• Note: Gateway adjustment is normally not required for the configuration.
• Reading out the device address:
• Start the configuration menu from the home display with button 1 ("ESC"). Change to the "Com-munication" entry with button 3 and open this with button 6.
• Note the addresses under "Address" and "Netmask".
IEC 61000-2-4 Watchdog9
IEC 61000-2-4 Watchdog
Setting the IP address of the computer for a direct connection
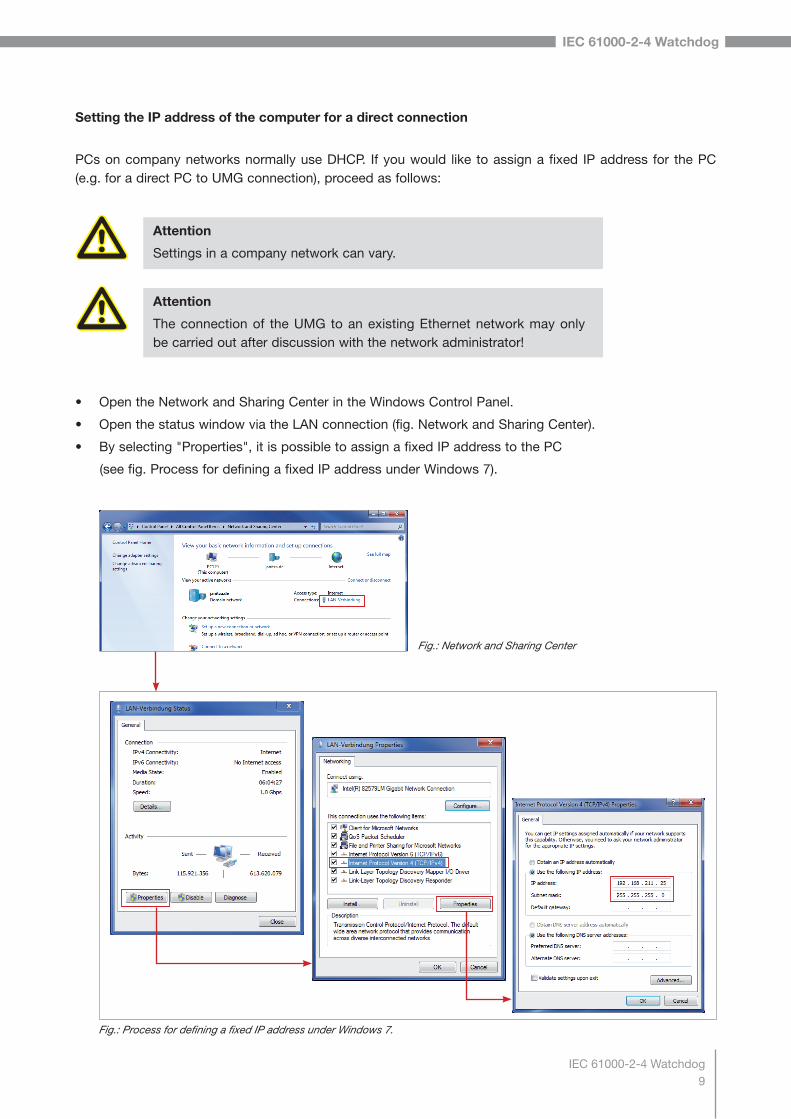
PCs on company networks normally use DHCP. If you would like to assign a fixed IP address for the PC (e.g. for a direct PC to UMG connection), proceed as follows:
• Open the Network and Sharing Center in the Windows Control Panel.
• Open the status window via the LAN connection (fig. Network and Sharing Center).
• By selecting "Properties", it is possible to assign a fixed IP address to the PC
(see fig. Process for defining a fixed IP address under Windows 7).
m Attention
Settings in a company network can vary.
m Attention
The connection of the UMG to an existing Ethernet network may only be carried out after discussion with the network administrator!
Fig.: Network and Sharing Center
Fig.: Process for defining a fixed IP address under Windows 7.
IEC 61000-2-4 Watchdog10
IEC 61000-2-4 Watchdog
Insert the device in the GridVis software
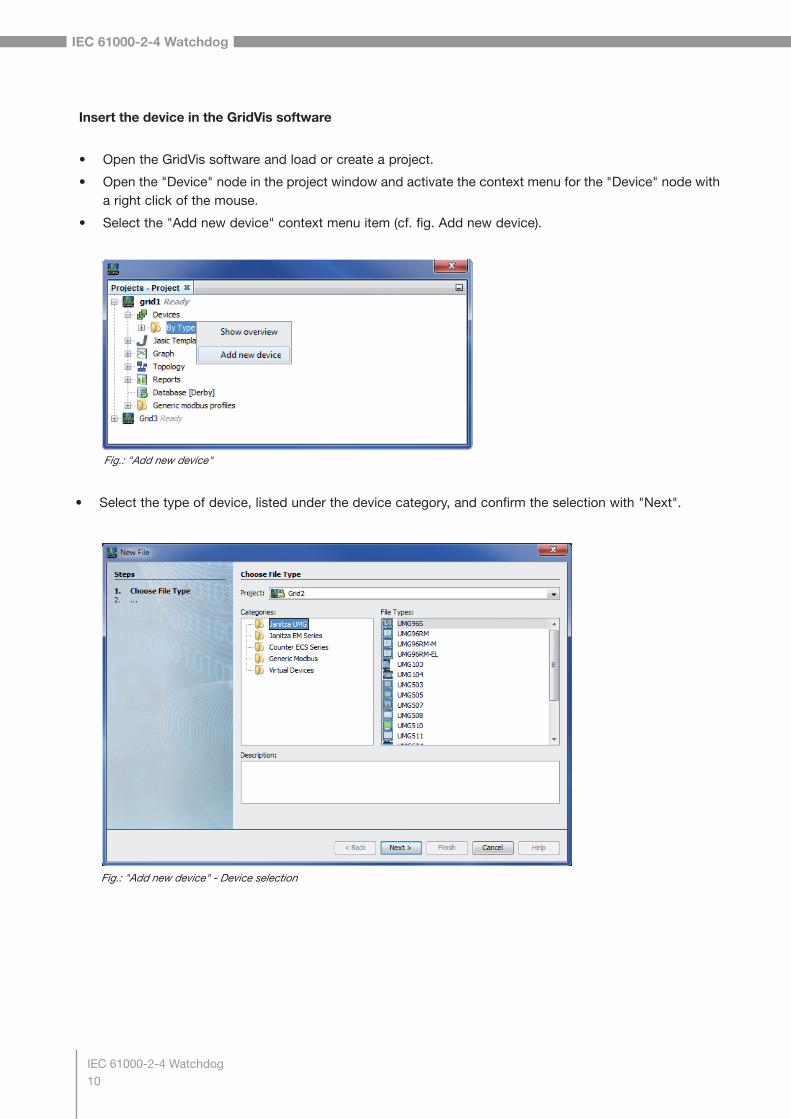
• Open the GridVis software and load or create a project.
• Open the "Device" node in the project window and activate the context menu for the "Device" node with a right click of the mouse.
• Select the "Add new device" context menu item (cf. fig. Add new device).
Fig.: "Add new device"
• Select the type of device, listed under the device category, and confirm the selection with "Next".
Fig.: "Add new device" - Device selection
IEC 61000-2-4 Watchdog11
IEC 61000-2-4 Watchdog
C Further information on using the GridVis software can be found in the internet at:
https://wiki.janitza.de/display/GRIDVIS60/GridVis-Dokumentation+6.0
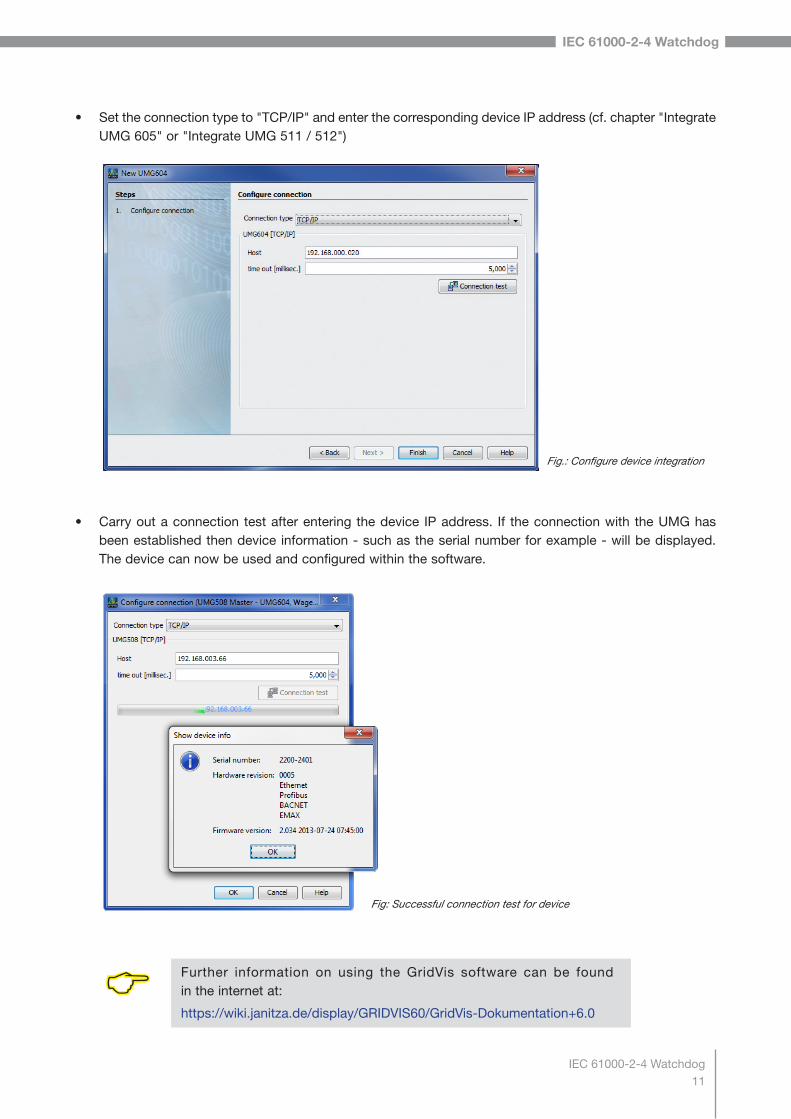
• Set the connection type to "TCP/IP" and enter the corresponding device IP address (cf. chapter "Integrate UMG 605" or "Integrate UMG 511 / 512")
• Carry out a connection test after entering the device IP address. If the connection with the UMG has been established then device information - such as the serial number for example - will be displayed. The device can now be used and configured within the software.
Fig.: Configure device integration
Fig: Successful connection test for device
IEC 61000-2-4 Watchdog12
IEC 61000-2-4 Watchdog
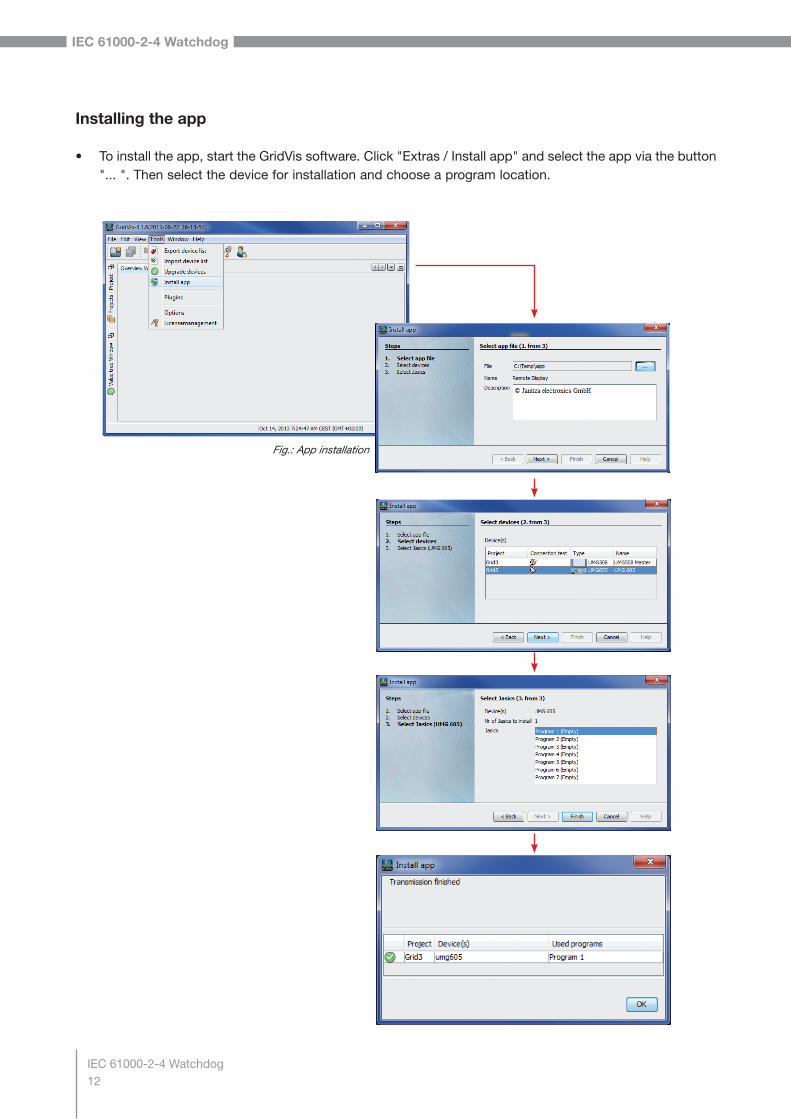
Fig.: App installation
Installing the app
• To install the app, start the GridVis software. Click "Extras / Install app" and select the app via the button "... ". Then select the device for installation and choose a program location.
IEC 61000-2-4 Watchdog13
IEC 61000-2-4 Watchdog
Getting to the app
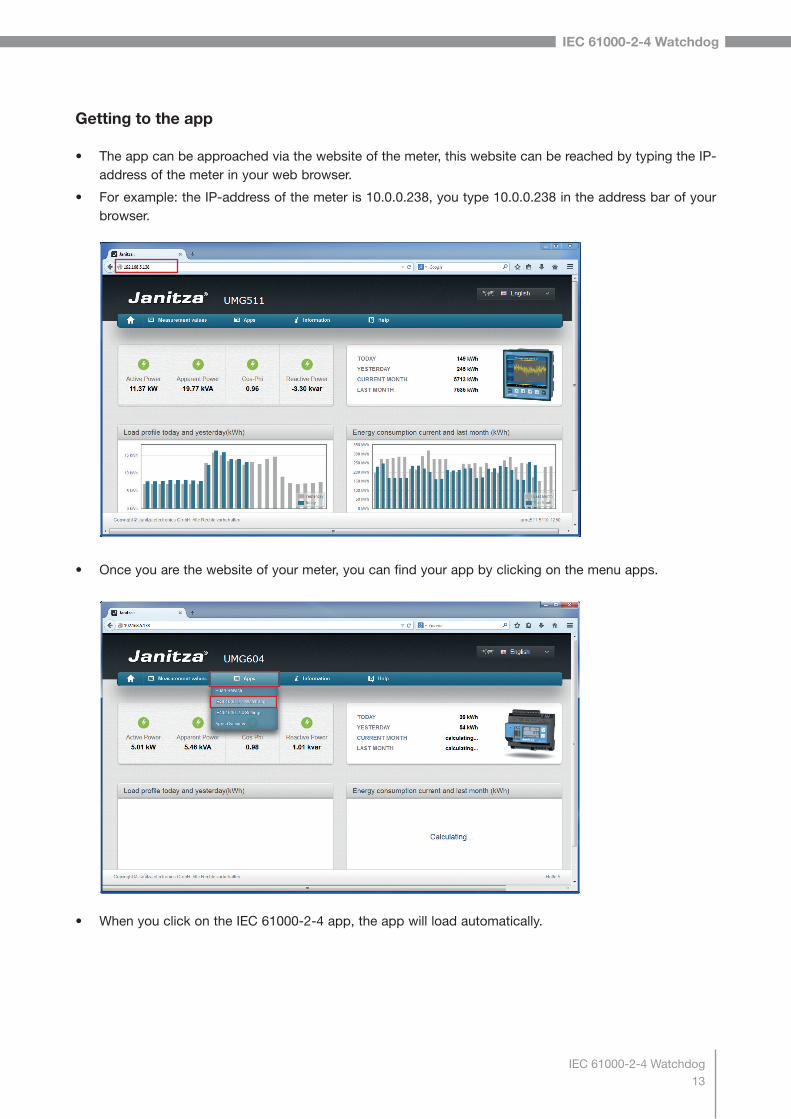
• The app can be approached via the website of the meter, this website can be reached by typing the IP-address of the meter in your web browser.
• For example: the IP-address of the meter is 10.0.0.238, you type 10.0.0.238 in the address bar of your browser.
• Once you are the website of your meter, you can find your app by clicking on the menu apps.
• When you click on the IEC 61000-2-4 app, the app will load automatically.
IEC 61000-2-4 Watchdog14
IEC 61000-2-4 Watchdog
Basic operation of the app
• In the following chapter we will be looking at the basic operation of the IEC 61000-2-4 app.
Opening the app
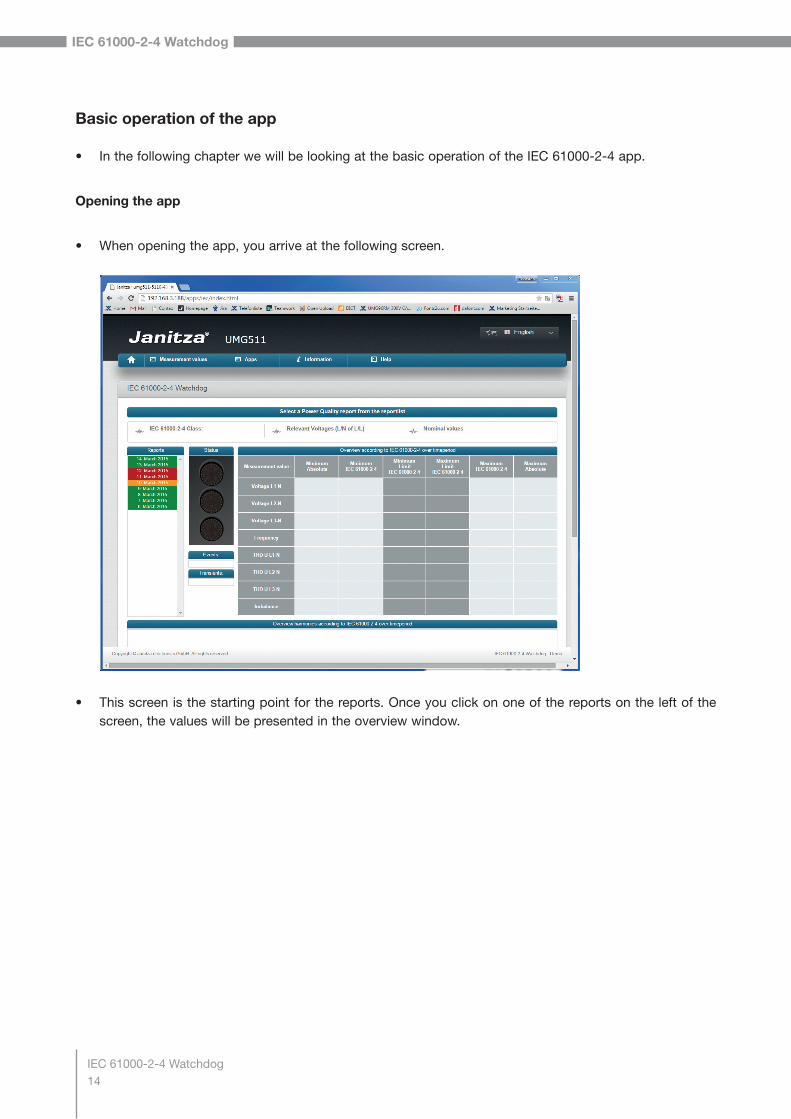
• When opening the app, you arrive at the following screen.
• This screen is the starting point for the reports. Once you click on one of the reports on the left of the screen, the values will be presented in the overview window.
IEC 61000-2-4 Watchdog15
IEC 61000-2-4 Watchdog
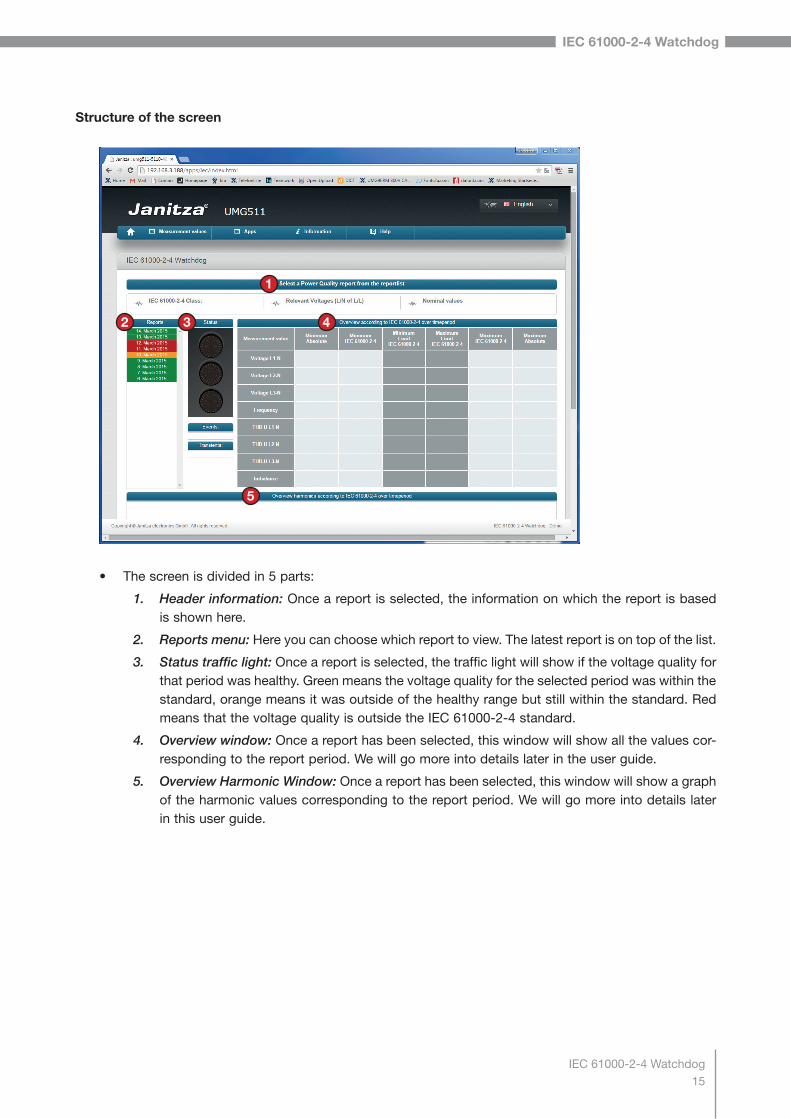
Structure of the screen
1
2 3 4
5
• The screen is divided in 5 parts:
1. Header information: Once a report is selected, the information on which the report is based is shown here.
2. Reports menu: Here you can choose which report to view. The latest report is on top of the list.
3. Status traffic light: Once a report is selected, the traffic light will show if the voltage quality for that period was healthy. Green means the voltage quality for the selected period was within the standard, orange means it was outside of the healthy range but still within the standard. Red means that the voltage quality is outside the IEC 61000-2-4 standard.
4. Overview window: Once a report has been selected, this window will show all the values cor-responding to the report period. We will go more into details later in the user guide.
5. Overview Harmonic Window: Once a report has been selected, this window will show a graph of the harmonic values corresponding to the report period. We will go more into details later in this user guide.
IEC 61000-2-4 Watchdog16
IEC 61000-2-4 Watchdog
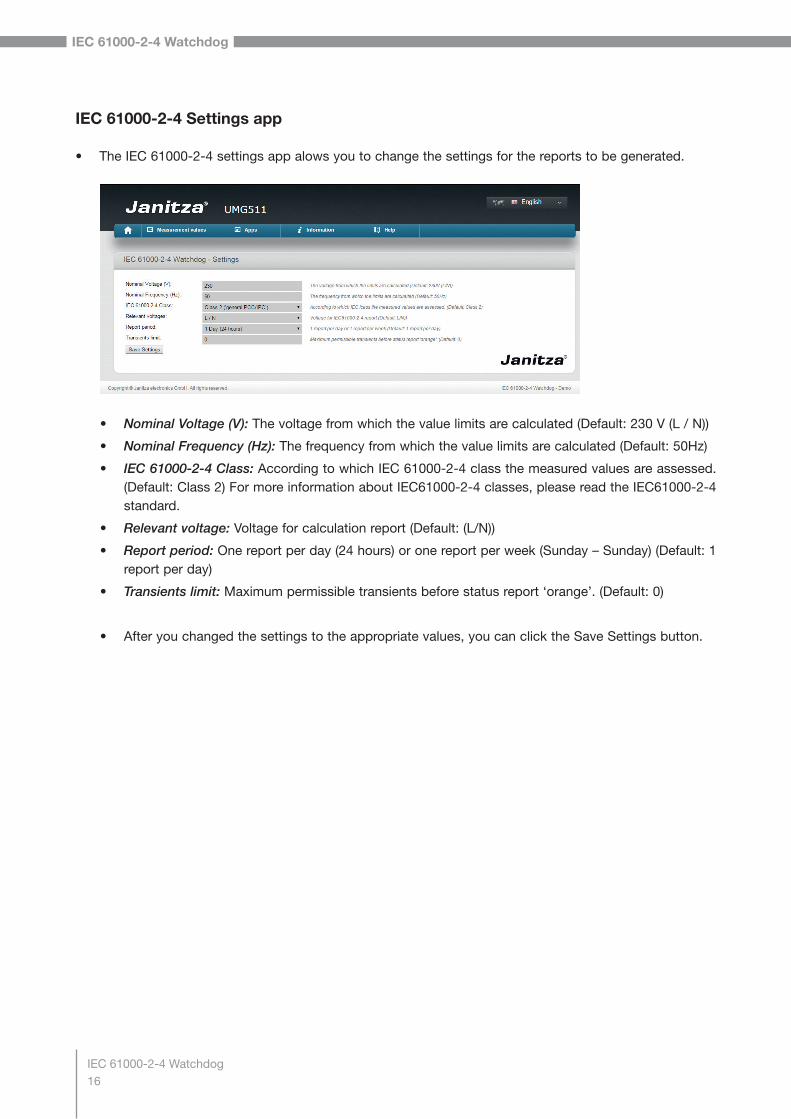
IEC 61000-2-4 Settings app
• The IEC 61000-2-4 settings app alows you to change the settings for the reports to be generated.
• Nominal Voltage (V): The voltage from which the value limits are calculated (Default: 230 V (L / N))
• Nominal Frequency (Hz): The frequency from which the value limits are calculated (Default: 50Hz)
• IEC 61000-2-4 Class: According to which IEC 61000-2-4 class the measured values are assessed. (Default: Class 2) For more information about IEC61000-2-4 classes, please read the IEC61000-2-4 standard.
• Relevant voltage: Voltage for calculation report (Default: (L/N))
• Report period: One report per day (24 hours) or one report per week (Sunday – Sunday) (Default: 1 report per day)
• Transients limit: Maximum permissible transients before status report ‘orange’. (Default: 0)
• After you changed the settings to the appropriate values, you can click the Save Settings button.
IEC 61000-2-4 Watchdog17
IEC 61000-2-4 Watchdog
1
Comprehensive user guide
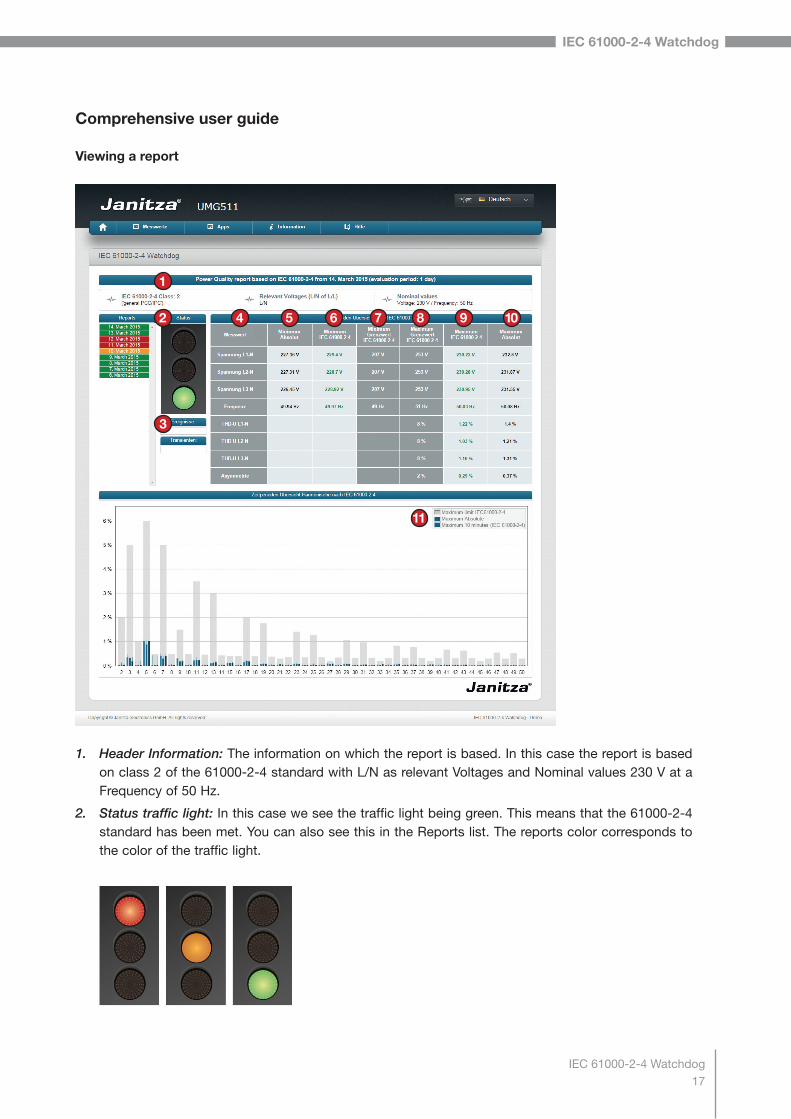
Viewing a report
2
3
4 5 6 7 8 9 10
11
1. Header Information: The information on which the report is based. In this case the report is based on class 2 of the 61000-2-4 standard with L/N as relevant Voltages and Nominal values 230 V at a Frequency of 50 Hz.
2. Status traffic light: In this case we see the traffic light being green. This means that the 61000-2-4 standard has been met. You can also see this in the Reports list. The reports color corresponds to the color of the traffic light.
IEC 61000-2-4 Watchdog18
IEC 61000-2-4 Watchdog
3. Events and Transients: Events and Transients which are registered by the meter. The result of this de-pends on what you have configured in Gridvis.
4. Measurement value: This shows what is being measured in the report.
5. Minimum Absolute: The values that are shown here, show the lowest measurement values (200 msec) registered by the meter during the period of the report (In this case, the period of 1 day). Note: The Mini-mum Absolute is not applicable to the 61000-2-4 standard.
6. Minimum 10 Minutes IEC 61000-2-4: This is the lowest 10 minute average value registered by the meter during the report period in accordance to the minimum value allowed by the IEC 61000-2-4 standard.
7. Minimum Limit IEC 61000-2-4: This is the minimum limit which is allowed according to the IEC 61000-2-4 standard. These values are fixed values based on the Voltage and Frequency settings made in the IEC 61000-2-4 settings app. These fixed values change when the Voltage and Frequency settings change.
8. Maximum Limit 61000-2-4: This is the maximum limit which is allowed according to the IEC 61000-2-4 standard. These values are fixed values based on the Voltage and Frequency settings made in the IEC 61000-2-4 settings app. These fixed values change when the Voltage and Frequency settings change.
9. Maximum 10 Minutes IEC 61000-2-4: This is the highest 10 minute average value registered by the meter during the report period in accordance to the maximum value allowed by the IEC 61000-2-4 standard.
10. Maximum Absolute: The values that are shown here, show the highest measurement values (200 msec) registered by the meter during the period of the report. (in this case, the period of 1 day) Note: The Maxi-mum Absolute is not applicable to the 61000-2-4 standard.
• Red: At least one value is outside of the IEC 61000-2-4 standard.
• Orange: At least one value is close to the maximum IEC 61000-2-4 limit (20%). At least one event has occurred. There occurred more transients than the amount of transients set in the settings of the IEC 61000-2-4 app.
• Green: All values are well within the limits of the IEC 61000-2-4 standard.
IEC 61000-2-4 Watchdog19
IEC 61000-2-4 Watchdog
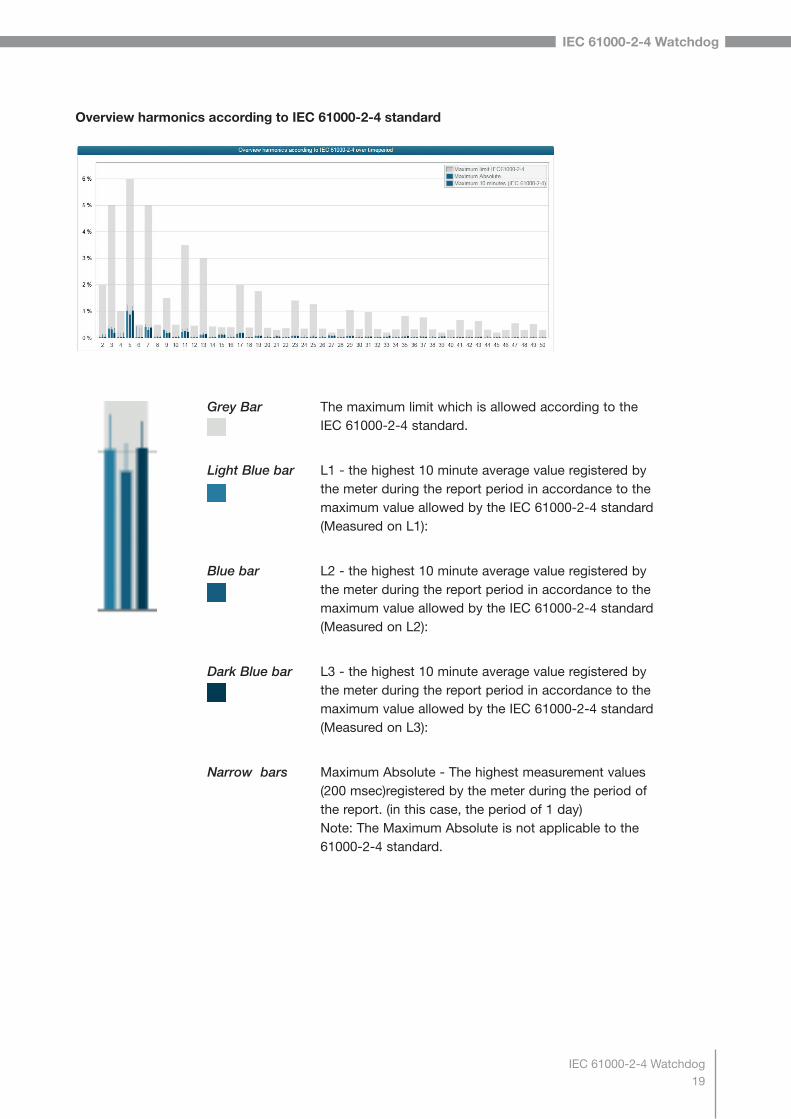
Overview harmonics according to IEC 61000-2-4 standard
Grey Bar The maximum limit which is allowed according to the IEC 61000-2-4 standard.
Light Blue bar L1 - the highest 10 minute average value registered by the meter during the report period in accordance to the maximum value allowed by the IEC 61000-2-4 standard (Measured on L1):
Blue bar L2 - the highest 10 minute average value registered by the meter during the report period in accordance to the maximum value allowed by the IEC 61000-2-4 standard (Measured on L2):
Dark Blue bar L3 - the highest 10 minute average value registered by the meter during the report period in accordance to the maximum value allowed by the IEC 61000-2-4 standard (Measured on L3):
Narrow bars Maximum Absolute - The highest measurement values (200 msec)registered by the meter during the period of the report. (in this case, the period of 1 day) Note: The Maximum Absolute is not applicable to the 61000-2-4 standard.
IEC 61000-2-4 Watchdog20
IEC 61000-2-4 Watchdog
Trouble shooting
Below you find some questions that might arise after the app has been installed.
Question: I cannot see any report in the report list.
Answer: No report has been calculated yet. Please make sure the device has been online during the measurement period and make sure the app has been installed correctly.
Question: My report shows strange limits
Answer: Please make sure the nominal values are set correctly in accordance to your electricity network
Question: My report shows a lot of transients or events
Answer: Please make sure you configure the transients and events correctly in the device using GridVis.
Question: I am unable to reach the application
Answer: Please check if the device is online or that the app has been installed correctly.
Question: I have been waiting for more than one day but I do not have a report yet.
Answer: Please make sure your settings have been set to generate a report every day. Your device was offline at 12 am. Your device time is incorrect