fullerton ar cover
TRANSCRIPT


Corporate Information
BOARD OF DIRECTORS*Gan Chee Yen, Chairman
Shantanu Mitra, Chief Executive Officer & Managing Director
Rajeev Kakar, Non-Executive Director
Kenneth Ho Tat Meng, Non-Executive Director
Sudha Pillai, Independent Director
Renu Challu, Independent Director
Premod Paul �omas, Independent Director
Dr. Robert Milan Shuster, Independent Director
COMPANY SECRETARYPankaj Malik
STATUTORY AUDITORSS.R. Batliboi & Co. LLP
BANKERSAllahabad Bank
Andhra Bank
Axis Bank Limited
Bank of America N.A.
Bank of Baroda
Bank of India
Bank of Maharashtra
BNP Paribas
Canara Bank
Corporation Bank
Credit Suisse AG
Dena Bank
DCB Bank Limited
Deutsche Bank AG
Federal Bank Limited
HDFC Bank Limited
ICICI Bank Limited
IDBI Bank
Indian Overseas Bank
JP Morgan Chase Bank N.A.
Kotak Bank
Oriental Bank of Commerce
Punjab National Bank
Small Industries Development Bank of India
South Indian Bank Ltd
Standard Chartered Bank
State Bank of Bikaner and Jaipur
State Bank of Hyderabad
State Bank of India
Syndicate Bank
�e Hongkong and Shanghai Banking Corporation
Limited
Union Bank of India
United Bank of India
RATING AGENCIESCredit Analysis & Research Limited
ICRA Limited
India Ratings & Research Pvt. Ltd.
REGISTERED OFFICEMegh Towers, �ird Floor,
New No. 165, Old No. 307,
Poonamallee High Road,
Maduravoyal, Chennai-600 095
CORPORATE OFFICEFloor 6, B Wing, Supreme Business Park,
Supreme City, Behind Lake Castle,
Powai, Mumbai – 400076
*As on 30th April 2016

“Our vision is to build self-reliant communities, enhance financial literacy, empower individuals and fulfill emerging financial needs of our target customers. We will achieve this by reaching out to customers through our wide distribution network in the urban and rural markets, offering affordable and need based finance, delivering through advanced technology and through a highly engaged workforce”
Chairman’s statement
Your Company has been working towards providing credit access to the unbanked for a decade now.
2Chairman’s statement

Global economic growth, at 3.1%, remained relatively low in
FY2016, a trend which continued from the last financial year.
India, however, was one of the fastest growing economy
with a GDP growth of 7.6%. India’s various macroeconomic
parameters such as inflation, fiscal deficit and current account
balances have exhibited signs of improvement.
�e Government’s thrust on revitalising the rural economy is a
vital contributor. �e Union Budget announced in February this
year has significantly increased investments into agriculture
and infrastructure, with a flow-through impact on demand
generation and employment growth. Proposals such as
MUDRA scheme for boosting self-employment, integrated
e-platform for marketing rural products and focus on rural
infrastructure will help drive the economy.
�e proposed GST (Goods and Services Tax) Bill will simplify
the complex regime of indirect taxes, and create a single,
unified national market. We believe this will improve the
economics of the country, and spur growth. �e seventh
central pay commission, and the adoption of the One Rank
One Pension (OROP) principle will further improve disposable
incomes, and enhance retail consumption.
Financial services have been a key to the economic growth of
India, with about 6% of the country’s GDP contributed by this
sector. Non-Banking Finance Companies (NBFCs) continue
to exhibit strong growth, with share of credit improving to
over 13%. NBFCs serve a vital role in financial inclusion of
largely unbanked population and have driven the last mile
transmission of credit to sectors that have not had meaningful
access to formal banking credit.
Your Company has been working towards providing credit
access to the unbanked for a decade now. We have one of
the largest dedicated distribution networks, comprising 488
branches in more than 21 states and 3 union territories, over
4,000 front end sales employees and close to 3,000 active
channel partners. Our rural business conducted under the
Gramshakti brand endeavours to cover the ‘last mile’ between
the branch and the end customer in each village enabling
financial inclusion of the under-served segments of the rural
markets.
Our well-embedded analytics capabilities, supplemented by
meaningful technology interventions allow us to draw timely
insights from our large customer database and strengthen
our customer acquisition. Our engagement strategy help us
provide much-needed financing to the unbanked population at
relatively lower cost.
Your Company’s risk management framework and ability to
balance analytics with judgemental underwriting has helped us
maintain portfolio resilience across benign and stress cycles
even as we deliver profitable returns to our shareholders.
2016 was a very good year for your Company, with strong
performance across asset growth, revenues and profits. We
have built a resilient, diversified portfolio of retail assets –
across asset classes, collateral types and geography – and
this continues to deliver predictable and strong results.
We continue to invest in growth. We have made significant
investments in enhancing our branch network, and upgrading
our systems. More pertinently, your Company launched its
housing finance subsidiary under the brand name ‘Grihashakti’.
With a strong tier II and tier III presence, we see home finance
as a key value proposition to our customers, and we believe
that this Company will go a long way in supporting the
Government’s vision of improving home ownership in the
country.
We remain committed to giving back to the society and
our Corporate Social Responsibility initiatives under the
brand name- ‘Uday’ serves the underprivileged across the
geographies. Since inception, more than 9 lakh household
have been benefitted through Livelihood, Health Care,
Educational and Environmental Programs. Your Company
aims to reach out to the unbanked by not just providing them
with financial services but by also enabling the communities
with services and skills that would improve their standard and
quality of living.
On behalf of my colleagues on the Board of Directors, I would
like to commend the untiring effort of the entire team at
Fullerton India Credit Company Ltd. for their performance in
the last financial year. I would also like to express our gratitude
to the regulators, our stakeholders and customers for their
continued support in enabling us to build one of India’s leading
financial institutions.
Gan Chee Yen
Chairman
3Annual Report 2016 Fullerton India Credit Company Limited

Chief Executive Officer and Managing Director’s statement
It gives me great pleasure to present to you the Annual Report for the
financial year ended 31 March 2016.
In a challenging external environment, your Company performed well
and delivered another year of consistent, strong and profitable growth.
Assets under Management (AUM) grew by 33% to a record ` 11,508 crore
as at the end of the financial year and Profits Before Taxes (PBT) grew
by 43% to ` 430 crore.
I am pleased to share some highlights of our financial performance:
Gross Income of ` 2277 crore against ` 1720 crore in the previous year,
an increase of 32%
Profit after taxes of ` 398 crore against ` 301 crore in the previous
year, an increase of 32%
Disbursals of ` 8572 crore against ` 6800 crore in the previous year,
an increase of 26%
Shareholders’ Funds of ` 2115 crore against ` 1567 crore in the
previous year, an increase of 35%
Return on Average Equity 22%
Return on Average Assets 3.4%
During the year, your Company continued to drive multi-pronged
growth, across business verticals, even as we remained committed to
“A strong and focused business strategy, guard-railed by a well-defined risk appetite framework and an analytics driven approach to lending, and relentless focus on execution have enabled us to build a high quality asset portfolio that delivers a predictable and strong business outcome.”
4Chief Executive Officer and Managing Director’s statement

our core purpose of providing meaningful financial products to
the underserved retail and MSME customers of India.
Both our urban and our rural businesses, aided by strong
treasury and functional support had a strong role to play in
delivering these robust results.
Our rural business (Gramshakti) continues to grow well with a
strong rural footprint and a broad product range. Gramshakti
provides financial solutions to rural and semi-urban customers
across nine states, through 265 branches and touches more
than 48000 villages.
Our urban distribution network comprises 223 branches
across 21 states and three Union Territories, and services 1.65
lakh customers. A full range of products – salaried personal
loans, MSME unsecured financing, loans against property and
commercial vehicle loans – enable us provide customised
financial services solutions to customers, across a large
geography. During the year under review, your Company
enhanced its digital footprint through development of a
proprietary online acquisition portal, digitisation of rural loan
disbursals and collections, and enhancing customer self-
service across channels and further upgrading its analytics
capabilities.
In line with its objective as a full-service financial products
provider, your Company launched its housing finance
subsidiary, ‘Grihashakti’. Launched in December 2015,
Grihashakti is now present in 20 locations across seven states
and offers a wide range of home finance products, primarily
aimed at the underserved affordable housing segment.
Grihashakti is establishing itself as a leading player in home
finance by expanding into underserved markets and carving a
niche in the small to medium ticket space.
One of the major strengths of your Company is the relentless
focus on execution and cost efficiencies. Continuous
improvement programmes, enhancements to our technology
platform and focused elimination of waste has helped us
generate sustained cost savings that were invested behind
our operations. We are harnessing technology to build
stronger customer solutioning and analytics capabilities
across platforms and channels. Simplifying the borrowing and
servicing experience for the consumer remains foremost on
our agenda.
Our business strategy remains consistent, is driven by a sharp
focus on a target product and market segment that aligns
with our core capability, and is guard-railed by a well-defined
risk appetite framework that ensures portfolio diversity
and resilience during periods of downturn. A robust risk
management framework has allowed us to maintain our credit
quality, notwithstanding environmental turbulence. Our net
NPAs improved, during the year, to 1.3% (1.4% in the previous
year).
Your Company recognises that its people are crucial to its
success, and continues to build an environment that attracts
and retains talent in an environment that creates opportunities
for individual professional growth. A culture that underpins
integrity, meritocracy, teamwork, process discipline and
regulatory compliance underpins our people strategies.
�e business remains well funded with conservative liquidity
strategies. �e balance sheet is financed substantially by long
tenor bank borrowings. �e Company extended its average
borrowing tenor to 40 months (33 months in the previous
year). Additionally, a prudent liquid assets policy allows for
business stability notwithstanding turbulence in the financing/
liquidity markets. A diversified lender base provides strong
lending support with over 140 institutional lenders across
Banks, Insurance companies, Foreign Portfolio investors,
Mutual Funds, Pensions and Provident Funds.
In FY2016, our CSR programmes were conducted under the
brand name – ‘Uday’. We have conducted more than 1,000
CSR programmes benefiting over 1.50 lakh households.
�rough different programmes like ‘Jeevika’ (the vocational
training programme for women) and ‘Pashu Vikas’ (the cattle
care initiative), Niramaya and Jyoti (the health care programs),
over 35,000 rural households were impacted
Your Company has always maintained the highest corporate
governance standards and practices. �e cardinal principles of
independence, accountability, responsibility, transparency, fair
and timely disclosures and the best Board practices are strictly
adhered to for discharging your Company’s responsibility
towards its shareholders, customers, employees and lending
institutions.
I would like to thank our parent companies – Fullerton Financial
Holdings Pte Ltd and Temasek Holdings Pte Ltd, Singapore
for their support. We appreciate their faith and confidence in
the team managing this organisation and look forward to their
continued support and guidance in growing the business. I
would also like to thank the Regulators, our Bankers and Rating
Agencies for their continued support and confidence in us.
With best wishes,
Shantanu Mitra,
Chief Executive Officer and Managing Director
5Annual Report 2016 Fullerton India Credit Company Limited
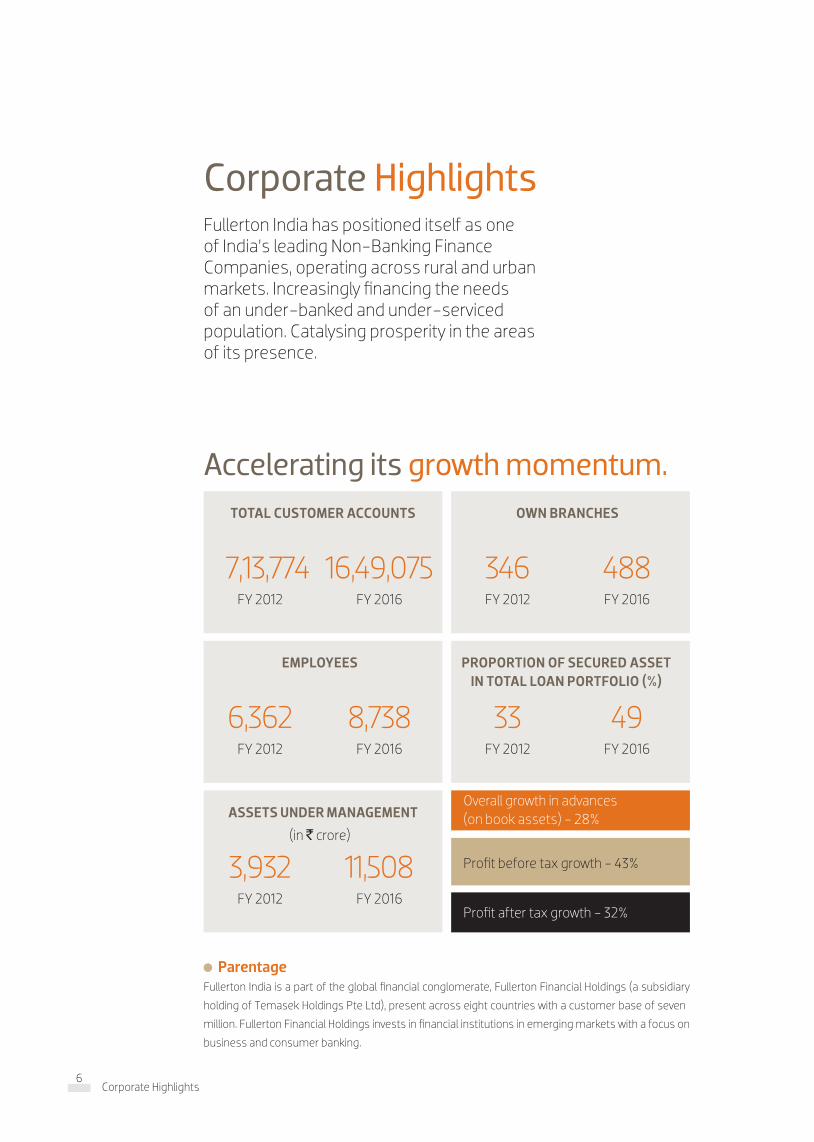
TOTAL CUSTOMER ACCOUNTS
FY 2012
7,13,774 FY 2016
16,49,075
EMPLOYEES
FY 2012
6,362 FY 2016
8,738
ASSETS UNDER MANAGEMENT
(in ` crore)
FY 2012
3,932 FY 2016
11,508
OWN BRANCHES
FY 2012
346FY 2016
488
PROPORTION OF SECURED ASSET IN TOTAL LOAN PORTFOLIO (%)
FY 2012
33FY 2016
49
Overall growth in advances (on book assets) - 28%
Profit before tax growth - 43%
Profit after tax growth - 32%
Corporate HighlightsFullerton India has positioned itself as one of India’s leading Non-Banking Finance Companies, operating across rural and urban markets. Increasingly financing the needs of an under-banked and under-serviced population. Catalysing prosperity in the areas of its presence.
ParentageFullerton India is a part of the global financial conglomerate, Fullerton Financial Holdings (a subsidiary
holding of Temasek Holdings Pte Ltd), present across eight countries with a customer base of seven
million. Fullerton Financial Holdings invests in financial institutions in emerging markets with a focus on
business and consumer banking.
Accelerating its growth momentum.
6Corporate Highlights

Products�e Company has the following products under their portfolio:
Personal Loans Business Loans Loans Against Property & SME Loans Rural Livelihood Loans
Rural Enterprise Loans Rural Housing Finance Two-Wheeler Loans Commercial Vehicle Loans
Merchandise Loans Insurance
TOTAL REVENUE
(in ` crore)
FY 2012
990FY 2016
2,277
PBT
(in ` crore)
FY 2012
49FY 2016
430
SHAREHOLDERS’ FUND
(in ` crore)
FY 2012
777FY 2016
2,115
EBIDTA*
(in ` crore)
FY 2012
409FY 2016
1,405
BALANCE SHEET SIZE
(in ` crore)
FY 2012
4,596FY 2016
13,446
Disbursement Growth - 26.1%
Net NPA to total customer outstanding - 1.3%
Capital adequacy ratio - 21.9%
*EBIDTA amount before considering finance cost
7Annual Report 2016 Fullerton India Credit Company Limited

Board of Directors*
1 Gan Chee Yen, Chairman 2 Shantanu Mitra, Chief Executive Officer and Managing Director 3 Rajeev Kakar, Non
-Executive Director 4 Kenneth Ho Tat Meng, Non - Executive Director 5 Sudha Pillai, Independent Director 6 Renu Challu,
Independent Director 7 Dr. Robert Milan Shuster, Independent Director 8 Premod Paul �omas, Independent Director
*As on 30th April 2016
1
3
6
2
4
7
5
8
1. Gan Chee Yen, Chairman
Chairman of the Company since November 2011. CEO and Board member of Fullerton Financial Holdings Pte Ltd, Singapore (FFH), and Board Commissioner of Bank Danamon. Previously, Co-Chief Investment Officer and Senior Managing Director, Special Projects at Temasek International. With Temasek since 2003, first as CFO and subsequently in various senior management roles. Has served on several boards including Neptune Orient Line. Is a member of the Institute of Certified Public Accountants of Singapore.
8Board of Directors

2. Shantanu Mitra, Chief Executive Officer and Managing Director since August 2011
Joined FFH in 2010 as Head of Consumer Risk Management for consumer markets across all operational entities in various countries including India. Before the current role, he was the Deputy CEO of the Company. Over three decades of experience in financial services, with about 20 years at Standard Chartered and Citibank where he had stints in Singapore, �ailand and India. A Chartered Accountant with the Institute of Chartered Accountants, England and Wales.
3. Rajeev Kakar, Non - Executive Director
Head of Consumer Banking at FFH. Executive Director and founder CEO of Dunia Finance LLC, a Dubai-based JV partnered by Fullerton Financial Holdings. Has over 20 years of experience in financial services. Served Citibank in a variety of Consumer Banking roles internationally. Is a Bachelor of Technology & Mechanical Engineering from the Indian Institute of Technology Delhi, and MBA from Indian Institute of Management, Ahmedabad.
4. Kenneth Ho Tat Meng, Non - Executive Director
Mr. Kenneth Ho carries more than two decades of Consumer and Commercial Banking experience. He is a graduate in Economics from Flinders University of South Australia and a Master of Business Administration holder from University Putra Malaysia. Currently, he is the Senior Vice President, Consumer Banking for Fullerton Financial Holdings (International) Pte Ltd. Previously he was with Citibank for 10 years covering the roles of Regional Director, Consumer Secured Lending of Citibank Asia Pacific regional office and in Citibank Singapore Pte Ltd as Head of Auto business and Citibusiness (Commercial Banking). Prior to joining Citibank, he also had substantial exposure in EON Bank Berhad, Malaysia, including managing the entire Auto Loans business (national) and covering numerous roles in Branch Banking as well.
5. Sudha Pillai, Independent DirectorMs. Pillai, a 1972 batch IAS officer held a number of senior positions in the Government of India and the State Government of Kerala for 40 years. She handled the Industry and Finance portfolios for nearly twenty years. In the Centre, she worked in the Ministries of Industry, Corporate Affairs, Labour and Employment. She contributed notably to reforms in Industrial and Foreign Direct Investment policies as also in formulating the National Skill Development Policy. In Kerala, as Principal Secretary Finance she worked to achieve enhanced developed outcomes, coupled with efficient fiscal management. Earlier as CMD, Kerala Finance Corporation she dealt with project financing to SMEs. Her last assignment was as Member Secretary (in the rank of Minister of State), Planning Commission, Government of India. She is also on the Boards of
many other companies.
6. Renu Challu, Independent Director
Ms. Renu Challu is a seasoned banker with decades of
experience in Commercial and Investment Banking. She was
with the State Bank of India (SBI) for more than 38 years
serving in variety of positions. Some of the positions held at
SBI include President & COO at SBI Capital Markets, MD & CEO
at SBI DFHI, MD of State Bank of Hyderabad and Deputy MD,
Corporate Strategy and New Business Development. She is
on the Board of many other companies and is a partner in 5th
Bridge Data Technologies LLP.
7. Dr. Robert Milan Shuster,Independent Director
Dr. Shuster, is a professional with decades of experience
in the banking sector. He is currently Chairman of the Audit
Committee at Bank Danamon Indonesia. He served at Asian
Development Bank, ING Bank, National Bank of Canada,
Nippon Credit Bank in various capacities. After working as
the President and CEO of P. T. Bank PDFCI, he served Bank
Danamon Indonesia in various capacities. He became its
president and CEO and later its Independent Commissioner.
He has also served many other entities in Directorial and
advisory capacities. He holds Ph.D. in International Economics
and Law from University of Oxford. He also holds Master of Law
from London School of Economics and Bachelor of Business
Administration from Ivey Business School.
8. Premod Paul �omas, Independent Director
Mr. �omas is currently the Chief Executive Officer and
Executive Director of Capital Insights Pte Ltd, a management
and strategy consulting company focused on the financial
technology and healthcare sectors. He is also the Head of
Corporate Strategy of Clifford Capital Pte Ltd, a company
providing financing solutions in the infrastructure and offshore
marine sectors and an Independent Director and Member
of the Audit and Risk Committee of Mapletree Commercial
Trust Management Ltd, Singapore. Before establishing
Capital Insights Pte Ltd, he was the Chief Financial Officer
and Executive Director of Singapore-listed GuocoLeisure Ltd.
�is was preceded by a career in Finance and Banking with
Temasek Holding Ltd, Standard Chartered Bank and Bank of
America. In addition, Mr. �omas is a member of the Singapore
Institute of Directors. Mr. �omas holds an MBA from the
Indian Institute of Management, Ahmedabad (PGDM) and a
Bachelor of Commerce degree from Loyola College, Madras.
9Annual Report 2016 Fullerton India Credit Company Limited

Leadership Team
1. Shantanu MitraChief Executive Officer and Managing Director
Shantanu is a Chartered Accountant from England and Wales
and joined Fullerton Financial Holdings, Singapore in 2010 as
the Head of Consumer Risk for the Group after nearly three
decades in Consumer Banking and Risk with Citibank and
Standard Chartered Bank. Shantanu has worked across various
Asian markets, including Singapore, �ailand and India, and
was the Regional Credit Head for India, Middle East, South Asia
and Africa. Shantanu took over as CEO and MD of Fullerton
India in Aug 2011.
2. Anand NatarajanHead of Strategy and Business Execution
Anand is a Chartered Accountant and a Cost Accountant, with
an MBA from Henley Business School. Anand is responsible
for the overall corporate strategy of the Company and its
subsidiaries - covering Risk, Operations, Technology, Analytics
and Digital Initiatives. He joined Fullerton India in January 2016
from ANZ Bank, Indonesia, where he served as Chief Operating
Officer, responsible for retail, institutional, branch and credit
operations, technology and infrastructure, contact centre
and service, procurement and property management and
enterprise-wide operational risk management. Previously,
Anand was the Chief Operating Officer for Fullerton India with
responsibilities of Treasury, Finance and Operations. Anand
has held various leadership positions in his 23 years with
Standard Chartered Bank, where he served as Head of Global
Markets Operations - India, Head Securities Services - South
Asia, Chief Operating Officer Consumer Banking, Head Country
/BPO Operations and Regional Credit Officer - Middle East,
Pakistan and Africa and as the Chief Risk Officer for Consumer
Banking, India and South Asia.
3. Rakesh MakkarHead of Business, Marketing & CSR
Rakesh spearheads Fullerton India’s Urban and Rural business,
in addition to heading the Marketing & CSR functions. He
has over two decades of valuable experience including new
business and brand launches while developing dynamic sales
teams, product and distribution networks. Prior to joining
Fullerton India, Rakesh was the Chief Distribution Officer and
Management Committee member at DHFL. His earlier stints
include Future Money as Chief Executive Officer, Citigroup and
as a consultant for a Vietnamese Bank on consumer finance.
Rakesh is a qualified national rank holder Chartered Accountant
and an MBA.
1
4
8
2
5
9
6 7
3
10 11
10Leadership Team

4. Ravindra RaoCEO - Fullerton India Home Finance Co. Ltd.
Ravindra comes with 21 years of experience in Risk Management and Business function. He has been with Fullerton India since September 2011 and has headed Credit Policy & Underwriting, Collections, Fraud Risk, Operational Risk, Legal and Compliance, Mortgage and SME business. Prior to his appointment as CEO of Fullerton Home Finance Company Limited, Ravindra held the position of COO in Fullerton India. Prior to joining Fullerton India, Ravindra was heading Collections and Fraud Control for South Asia in Standard Chartered Bank. He has held senior positions at HDFC Bank, ABN Amro.
5. Ajay PareekHead, Sales & Product - Urban Business
Ajay is a Chartered Accountant with over 19 years’ experience in audit & financial services Starting his career with A.F. Fergusons & Co, he moved to CitiFinancial as part of the start-up team to launch their retail finance business in India. At CitiFinancial he handled the risk and operations functions for 2 years and later took over as a Regional Business Head. After 5 years at CitiFinancial, he joined Fullerton India in 2005 as part of the start-up team. Ajay is now Head - Sales and Product for the Urban Business and oversees distribution of the Company’s key products of Personal Loans, Mortgages, SME and Commercial vehicle .
6. Rajesh KrishnamoorthyChief Risk Officer
Rajesh is responsible for Enterprise Risk Management, Legal and Compliance functions in Fullerton India. A management graduate, Rajesh joined Fullerton India in September 2013 and comes with over 19 years of post-qualification experience in the financial services sector across consumer and commercial lending. Prior to Fullerton India, Rajesh was the Chief Risk Officer at Bajaj Finance Limited. His other stints include working in risk management domains at HSBC Ltd., GE Countrywide, Prime Financial and First Leasing.
7. Swaminathan SubramanianHead, Human Capital
Swaminathan is an engineer from Jadavpur University, Kolkata and an MBA from XLRI. He joined Fullerton India in May 2013 to lead the Human Capital and Training function. Swami has over 19 years of HR experience across Asia, Africa and Middle East markets. He has held various leadership positions including Head of HR for Retail Banking, Barclays- Africa and Head of Compensation & Benefits, Standard Chartered Bank, South Asia and more recently as HR lead for Corporate and Investment Banking Operations & Technology with JP Morgan Chase, India.
8. Pankaj MalikChief Financial Officer & Company Secretary
Pankaj has an experience of over 19 years in various capacities across finance and allied functions. He is the Chief Financial Officer, Company Secretary & Chief Compliance Officer for Fullerton India. He is responsible for corporate planning, accounting, finance, taxation, compliance and corporate governance functions. Prior to joining Fullerton India in Sep 2007, Pankaj was associated with COLT Telecom (“COLT”), an affiliate of Fidelity international, as the Financial Controller-cum-Company Secretary. In his earlier stints, he had been associated with GE Commercial Financial and Motherson Sumi Systems Limited in various capacities. Pankaj is a Chartered Accountant, Company Secretary and Cost Accountant from India and Certified Public Accountant from the State of Colorado, the USA.
9. Deepak PatkarHead, Internal Audit
Deepak is an Electrical Engineer with a Masters in Management from Jamnalal Bajaj Institute, Mumbai. In his work experience of 19 years he has handled diverse roles including Quality Assurance, Sales and Distribution, Debt Collections, Operational Risk and Audit. After successful stints at Cable Corporation, HCL Infosystems and Citibank he joined Fullerton India in 2007 as Head – Retail Collections. Deepak manages Internal Audit at Fullerton India in his current profile.
10. Arvind SampathHead, Treasury
Arvind is responsible for all liabilities strategy, surplus management and investor relationships. Arvind has over two decades of experience in financial markets. Prior to joining Fullerton India, Arvind was associated with ICICI Securities, where he was instrumental in setting up the ‘interest rate derivatives’ desk. In his earlier stints, he had been associated with Standard Chartered Bank in various capacities.
11. Bikramjit GangulyHead , Analytics & Digital Initiatives
Bikramjit is a Masters in Statistics from the Indian Statistical Institute and has an experience of over 13 years in various capacities across analytics and allied functions. He currently heads the Digital Initiatives and Analytics & Information Management for Fullerton India. Prior to Fullerton India, he was associated with Standard Chartered Bank, heading the regional credit risk analytics unit of South Asia. In his earlier stints, he had been associated with Fair Isaac (FICO) in various capacities.
11Annual Report 2016 Fullerton India Credit Company Limited

Management Team
From left to right: Sameer Mishra, Rajesh Krishnamoorthy, Arvind Sampath, Swaminathan Subramanian, Rakesh Makkar,
Shantanu Mitra, Anand Natarajan, Pankaj Malik, Ravindra Rao, Bikramjit Ganguly, Ajay Pareek, Ashish Singh .
12Management Team

13Annual Report 2016 Fullerton India Credit Company Limited
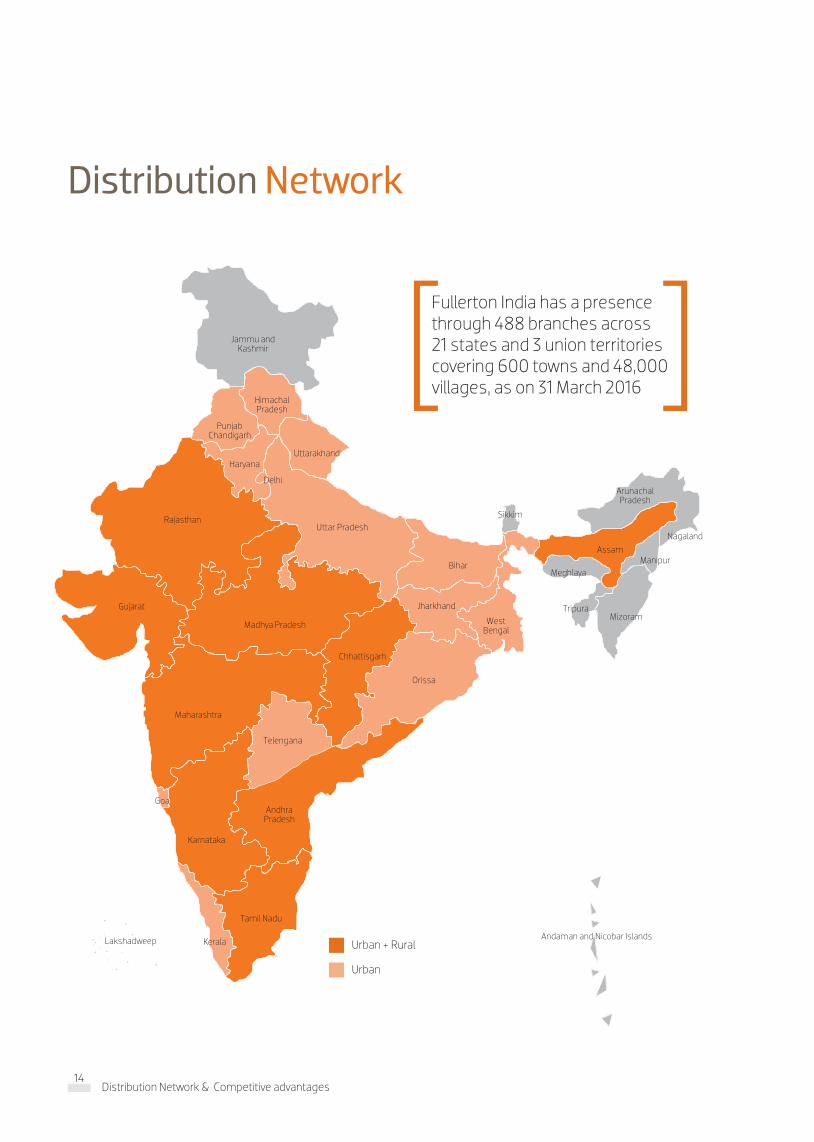
Urban + Rural
Urban
Jammu and Kashmir
Himachal Pradesh
Punjab Chandigarh
HaryanaUttarakhand
Delhi
Uttar PradeshRajasthan
Gujarat
Maharashtra
Madhya Pradesh
Chhattisgarh
Jharkhand
Orissa
Andhra Pradesh
Telengana
Andaman and Nicobar IslandsLakshadweep
Tamil Nadu
Arunachal Pradesh
AssamManipur
Nagaland
Tripura
Meghlaya
MizoramWest Bengal
Sikkim
Bihar
Kerala
Karnataka
Goa
Distribution Network
Fullerton India has a presence through 488 branches across 21 states and 3 union territories covering 600 towns and 48,000 villages, as on 31 March 2016 ][
14Distribution Network & Competitive advantages

Competitive Advantages
Brand: �e Fullerton brand stands for trust, superior service and innovative solutions. �is is reflected in the Company reaching ` 11,508 crore in assets under management as at 31 March 2016.
Reach: Fullerton India is present in 21 states and 3 union territories covering nearly 600 towns and more than 48,000 villages. Nearly 70% of the Company’s branches are in towns with populations of 1,00,000 to 5,00,000.
Governance: Fullerton India’s Board comprises four sub-committees: Risk Oversight Committee, Audit Committee, Nomination & Remuneration Committee and Corporate Social Responsibility Committee. �is strengthened governance culture, has helped the Company in improving governance standards and sustainability.
Experience: Fullerton India is part of Fullerton Financial Holdings, a global conglomerate engaged in providing financial services to consumers in seven countries. �e Company brings to table the best practices derived from each country.
23%CAGR growth in revenue in the five years leading to FY2016
15Number of products in Fullerton’s portfolio
1.3%Net NPA as on 31 March 2016.
14+Number (lakhs) of customers serviced by the Company, as at 31 March 2016
488Total number of branches
50%of the Company’s Board comprised Independent Directors (as on 31 March 2016)
Products: �e Company created a large product portfolio serving the various needs of both rural and urban customers across the country
Asset quality: �e Company demonstrated higher asset quality reflected in its well-controlled non-performing assets even as its book size continued to increase, signifying strong credit appraisal, credit underwriting and collection efficiency.
15Annual Report 2016 Fullerton India Credit Company Limited

16Functional overview

Functional overview
Business and Marketing
Risk Management
Analytics
Funding & Treasury
Information Technology
Human Capital
17Annual Report 2016 Fullerton India Credit Company Limited

Business and Marketing
In the business of retail finance, it is necessary to create a customer pull, strengthen online presence, recruit talent and widen product choice.
Over the years, Fullerton India’s business strategy, diversified product suite, best in class ‘analytics backed’ risk management practices, customer friendly approach, strong distribution network and commitment to the community have played a significant role in establishing the Company as the preferred financial partner for its customers.
Fullerton DifferentiatorFullerton India’s reach continues to be the biggest differentiator in the organised retail finance market in
India. Nearly 70% of the branches are in rural and suburban locations with population base ranging between
one to five lakh. In its target segments Fullerton India has one of the largest dedicated distribution networks,
comprising 488 branches, over 4,000 front end sales employees and close to 3,000 active channel partners.
18Business and Marketing

Rural Business OverviewFullerton India’s Rural Business – Gramshakti has further
consolidated its position during the current year as one of
the leading financial service provider in rural territories with
an enhanced branch network across large number of towns
and villages offering a range of products to meet customer
requirements. �e services are designed for the lower mass
market segment customers to advance and grow their existing
livelihoods and help them achieve their aspirational needs.
Gramshakti currently has a network of 265 branches locations
spread across 9 states covering over 48,000 villages. As
of March 2016, Gramshakti has a base of over 1.3 million
customers having over 1.5 million relationship accounts.
Highlights: Branch network now extended to 9 states with entry to Uttar
Pradesh. 42 new branches were added during the year.
Number of loans booked crossed 1 million mark with total
amount disbursed `3114 Crs in the FY2016.
AUM grew by 60% over last year to `2599 Cr
Robust y-o-y growth of 84% in pre tax profit.
Portfolio quality remains strong with a loss rate of 0.38%
Urban Business OverviewUrban business of Fullerton India has established its foothold
across 223 branches spread in 21 states and 3 union territories.
�is business line continues to be one of the market leaders in
retail asset lending space amongst the non-banks. Business
momentum is driven by strong risk analytics backed decision
model. FY2016 has witnessed a robust growth both in
customer count and disbursal volumes with credit losses well
under control.
It was a year during which we focused on strategy execution
and healthy growth, this was achieved through:
Market adaptability for selecting better customers with
existing bureau records
Nimble footed strategy to avoid risk concentration
Buildup of a strong secured asset base of Loan against
property and commercial vehicles
Conceptualisation of high level digital footprint for entire
customer life cycle
Highlights Personal loans to salaried individuals grew by 15% over
FY2015
Loan Against Property (LAP) disbursal grew by 16% over
FY2015
Launch of Digital Personal Loan origination
Commercial Vehicles accumulated losses written off , profits
achieved , geared for high growth
Strategic objective of increasing the secured products
portfolio met - with secured portfolio outstanding at 59%
MarketingDuring the course of the year, the Company also strengthened
its marketing initiatives with the objective to reach customers
faster, wider, deeper and better.
�e Company enhanced visibility by engaging with local media
channels in the regions of its presence and investment in
outdoor media activities. With a revamped and responsive
website, search engine optimisation was enabled to magnify
the Company’s presence digitally. Followed by social media
presence, the Company built its connect with consumers, both
existing and potential. Content marketing and social media
campaigns were enabled to build relevant connect and push
products in accordance.
Brand Amplification: Regional activations to build brand awareness
PR coverage at regional levels along with national
conferences
Extensive outdoor and transit media campaign at select
locations during Q4
Creation of marketing collaterals basis product and regional
requirements
Social media presence and campaigns to build product
knowledge
Reputational management to address concerns and
enhance customer experience
Strengths Fullerton India’s Gramshakti program , a well-entrenched
brand helps enhance its rural presence
Last mile reach to customers across underserved locations
helps in offering financial services at customer’s doorstep
Continuous Community Engagement has built goodwill and
trust
Fullerton India’s ability to leverage technology has helped it
to service the customers in a seamless and efficient manner
State of art asset origination to execution of technology
platforms
Strong distribution network with over 3000 channel partners
19Annual Report 2016 Fullerton India Credit Company Limited

Risk Management
Ability to manage evolving variables with competence, leading to predictability and sustainability has been the hallmark of Fullerton India’s Risk Management practice. We leverage our extensive domain knowledge to strengthen long term viability across products, geographies and market cycles.
�e Fullerton DifferentiatorUsing optimal mix of judgmental criteria and an highly evolved analytics-backed decision-making platform,
we manage through the lifecycle, different customer segments across diverse lending products and across
geographies. Credit norms are designed to achieve predictable Risk Adjusted Returns with Expected Lifetime
Losses.
Fullerton India is the only NBFC in India to implement Recession Loss Multiplier (RLM) which helps the
Company map portfolio volatility in case of a likely slowdown in the economy through the use of sophisticated
analytics. �is helps the Company in maintaining superior portfolio quality and enhancing business
profitability across product life cycle. Cutting edge digital platforms and algorithmic targeting techniques are
also adopted to ensure right customer segment is originated.
20Risk management

Overview�e role of risk management in the retail finance sector is
critical in view of the country’s vastness, deep diversity, relative
absence of organised and well established support structures,
need to blend organised and surrogate methods and the need
to cover rural and urban regions.
Fullerton’s key principles of risk management comprise the
following:
�e Company has enunciated an overarching well defined
risk appetite framework that, influences and shapes the
portfolio mix, desired returns, optimises enterprise-wide risk-
return proposition and ensures adequate capital and resource
deployment
�e Company has an independent risk management and
governance function
Maintenance of well documented credit risk policies and
programs with robust performance guardrails, as the basis of
its structured risk management approach.
Extensive use of risk and business analytics.
Credit bureau data is used as an integral part of informed
decision-making and portfolio management
�e Company has invested in forward-looking risk
assessment protocols; its pre-emptive credit and liquidity
interventions have translated into proactive responsiveness to
challenges.
Risk Appetite FrameworkAt the heart of Fullerton India’s risk management approach
lies a clear understanding of its desired risk appetite. �e risk
appetite framework approved by the Board of Directors, covers
different types of risks the organisation is exposed to and also
clearly defines the Company’s risk taking perimeters. Using
this the management decides the kind of segments to grow
into, products to be offered, portfolio shape to be built and
resources to be committed. �e decisions are driven not only
by return metrics like Return on Equity (RoE) but also based
on earnings volatility of such segments to take a “through
the cycle” view incorporating economic, credit and market
scenarios.
Fullerton India is a pioneer among NBFCs in India, to adopt this
framework, which uses extensive statistical models that are
aligned with approaches aligned with Internal Ratings Based
(IRB) norms of Basel II. Fullerton India periodically derisks itself
through portfolio-level stress tests that assess the impact of
extreme, though probable, stress scenarios (economic, credit,
market and collateral aberrations) and their financial impact.
Country Risk AssessmentFullerton India utilises macroeconomic and portfolio indicators
to arrive at an overall country risk outlook. �e related risk
assessment then applies itself across five critical areas (credit
underwriting and liquidity policies, delegation authorities,
exceptions, collections intensity and early warning triggers)
depending on the outlook and corresponding management
responses are initiated.
Product Policy, Governance and Monitoring FrameworkFullerton India adopts an independent approval process
guided by the use of product programs, customer selection
criteria (CSC), credit acceptance criteria (CAC) and other credit
underwriting processes for sanctioning and booking each loan.
Credit policies are designed by clearly defining target market,
customer selection and credit acceptance criteria, credit
approval methodology, verification, post disbursement
monitoring, collections and remedial management policies.
Credit policies are reviewed on a periodic basis based on
changes in macro- economic, industry / segment level and
customer level trends including Credit Bureau learnings.
�e Chairman of the Risk Oversight Committee, CEO, Head of
Business and Chief Risk Officer engage in an ongoing appraisal
of exposure caps, performance triggers, test programs and
country risk assessments.
Credit UnderwritingAt Fullerton India, an independent team governs the credit
assessment, approval and administration processes.
Processes are automated wherever possible to minimise
human intervention. A Business Rules Engine ensures
changes in policy which can be immediately implemented at
the branches. Fullerton India over the years, has optimised its
credit underwriting structures in urban retail and commercial
businesses depending on the product nuances, to have a
prudent mix of centralised, decentralised and Hub-and-Spoke
models. A fully integrated digital online lending platform is also
used by Fullerton India to provide loan approvals in a friction
free and seamless manner to select customer segments.
Operational Risk Management�e operational risk framework is designed on both business
and functional levels including business groups, credit,
operations, corporate and support functions. An operational
risk management committee supervises the management of
operational risks.
21Annual Report 2016 Fullerton India Credit Company Limited
Information Security Risk Management�e Information Security function administers risk
management at an enterprise level. �e IT Team is also
responsible for managing and mitigating any risks that may
emerge as a threat to data or the effective functioning of the
Company.
Fraud Risk ManagementFullerton India’s autonomous fraud management detects and
eliminates fraud risks–from origination to credit acceptance to
collection. A neural fraud risk system (Hunter), provides active
fraud risk alerts, and has enabled significant saves.
Liquidity Risk ManagementFullerton India has implemented treasury policies to manage
liquidity risks, investments, interest rate risk and borrowings.
�ese policies articulate the governance framework,
committee responsibilities and functions, risk measurement
parameters, measures for managing stress situations, inbuilt
alerts and other controls.
Strengths�e robustness of the Company’s risk management practices
is validated through an increase in profit after tax, higher
business returns and net non performing assets being lower
than the industry average.
�e Analytics team along with the Risk Management teams,
translated prevailing realities into policy and product pricing
using proprietary methods to risk-rank first time borrowers in
Tier 2, Tier 3 and Tier 4 locations.
To achieve all this, by adopting Basel II guidelines, the Company
developed recession loss multiplier (RLM), basing decisions
around the concept of “lifetime profitability” in which losses
cannot exceed a year’s operating profit during recession
periods
�e Company made extensive use of information from the
Credit Bureau in risk grading the segments and adopting
proactive early warning systems, through cutting-edge
investments in analytics. �e Company’s risk management
framework ensured robust risk standards, reconciling
customer needs with sustainable profitability.
Highlights FY2016�e absolute amount of net NPA has improved over last
year by 13 bps, despite a growth of 33% in Assets Under
Management.
�e Company increased the proportion of secured lending
from 45% in FY2015 to 49% in FY2016, further de-risking the
portfolio. �e Company enhanced the proportion of revenues
derived from non-personal loans from 42% in 2014-15 to 45%.
22Risk management & Analytics

Analytics
Analytics is a critical element of a retail lending business as it enables optimisation of effort and cost in customer targeting, assessment, onboarding and through the entire lifecycle management.
In Fullerton India, analytics has been at the center of strategy development, implementation and monitoring across products and segments, thus contributing significantly in the profitability of the business.
�e Fullerton Differentiator�e Company is one of the very few NBFC’s to use data driven analytics to shape its medium to long term
business strategy. Housing an experienced team of analytics professionals with experience of working
across major financial institutions and consultancies, the Company is capable of reading the pulse of the
customer in the retail lending space as well as interpret economic/environment changes and their impact on
business profitability.
23Annual Report 2016 Fullerton India Credit Company Limited

Overview�e huge volume of data available in retail finance, the core
business of Fullerton India, provides the opportunity of
in-depth learning of the customer mind-set/behaviour and
presents significant scope for the financial institutions to utilise
the insights to increase sales, manage risk and provide best
customer experience.
With the wave of digital innovation across our daily lives, there
is a continuous cycle of data being generated reflecting each
and every movement of the prospective or existing customer.
�e lifecycle needs, interest, habits, dwelling places and all
such relevant information is getting captured somewhere or
the other in the digital ecosystem. With increasing evolution in
machine learning and cognitive computing, analytics is poised
to play a key role in the financial business by appropriately
using these enormous data and propel business growth
significantly.
Strengths�e analytics capability of the Company is utilised for forming
medium and long term strategies to short term objective
driven activities.
Customer lifecycle management based on analytics starts
from targeting the right customer/segment to credit
decisioning/ verification through behaviour management,
collection prioritisation, cross-selling and finally attrition
management.
Various external data sources like credit bureau data, industry
reports, rating agencies reports are studied and explored
regularly to gain market intelligence. �is helps in building a
customer view which is not restricted to Fullerton India and
also provides insight into the underlying economic conditions.
�e analytics team uses tools like segmentation, predictive
modelling, simulations to devise strategies which eventually
are implemented across different interfaces. With the
Company’s foray into digital business increasing over time,
capability is developed in big data analytics to optimally use
the large customer data becoming available across the
digital interfaces. While the end objective is to maximise the
customer profitability, the strategies are meant to be customer
centric to offer the right product at the right time and right
price to the right customer and to provide the best in class
experience to the customer across the lifecycle.
Highlights, FY2016�e ideal portfolio shape for the Company in the long term
is determined by balancing the estimated future normal
cycle profitability and the losses to be incured in case of an
economic downturn.
�e Company has developed smart algorithm based on
alternate data (social media, GPS) for verification of customer
address (residential/work), which has led to a significant
reduction in operational cost of customer acquisition.
�e analytics team used customer behaviour data to devise a
strategy optimising effort in collecting money from defaulting
customers. �ere has been a significant improvement in
recovery without increasing any expense by targeting the right
set of customers.
24Risk management & Funding and Treasury Management

Funding and Treasury
ManagementMaintaining adequate liquidity for lending and ongoing operations is a high priority at Fullerton India. �e guiding principles at Fullerton India Treasury include diversification of funding by instrument, lender type and tenor. �ey also include matching of asset and liability tenor and maintaining sufficient buffers for contingencies. �e focus on efficient and conservative liquidity management continued this year with an improved, stable and de-risked funding mix. Enhanced interaction with funding partners resulted in better quality funding at competitive rates.
�e Fullerton Differentiator�e Treasury at Fullerton India is a strategy enabler providing continuous inputs on economy, global and
local markets thereby shaping key portfolio decisions. Treasury management at Fullerton India is given a
key importance with strong emphasis on durable and renewable funding relationships. Internal limits and
governances ensure lender interest and decisions are taken from a long term sustainability point of view.
25Annual Report 2016 Fullerton India Credit Company Limited
Overview�e Treasury function is responsible for all liability
management including borrowings and liquidity management.
It ensures that the Company stays well-funded for
disbursements and repayments and contingencies
should they arise. Treasury fronts all external financier
interaction, interfacing with rating agencies and other funding
intermediaries. Towards this objective, the Treasury has built
close relationships with over a hundred institutional investors.
Credit rating: �e Company enjoys a credit rating of AAA from
CARE and AA+ from ICRA and India Ratings on its long-term
debt instruments which are among the highest within the
country’s retail finance sector.
Capital adequacy: �e Company’s overall capital adequacy at
21.9% was far higher than RBI requirement of 15% reflecting its
confidence in investing and growing the business. �e Tier 1
Capital similarly was 16.1% compared to an RBI requirement of
10% (applicable by March 2017).
Matched Asset-Liability tenor: �e Company extended its
average borrowing tenor to 40 months from 33 months in
the previous year. �is effectively reduced mismatches and
brought down interest rate gapping risks. A selective mix of
funding instruments including Bank Borrowings and Capital
market is used to maintain optimal tenor, so that liquidity risks
are diminished.
Liquidity Buffer: �e Company maintained adequate liquidity
coverage in terms of high quality liquid assets, in order to stay
well funded even in case of external exigency. �ese include
cash and cash-equivalent instruments which can be easily
liquidated with nil dependence on borrowing. An adequate
cushion of fee paying committed lines and unavailed bank lines
is additionally maintained to strengthen the various lines of
defense.
Diversified Lender Base: To reduce investor concentration and
to reduce dependence on one investor type or instrument the
Company seeks to constantly diversify its lenders. In this year,
Fullerton India diversified its funding to over 140 institutional
lenders including Banks, Insurance Companies, Foreign
Portfolio Investors, Mutual Funds, Pension and Provident
Funds.
By way of instruments, Term loans from Banks constituted the
largest component of total borrowings, followed by issuance
of Non-Convertible Debentures and Commercial Paper. �is
ensures that the funding profile remains resilient to market
volatility and provides renewable relationships.
Highlights, FY2016�e strong treasury processes and conservative liquidity
management policies have been well recognised by external
lenders and rating agencies. �is is evidenced by the highest
category rating of AAA, being re-affirmed by CARE in the
FY2016.
Fullerton India continuously interacts with various lenders
and other funding partners on a continuous basis in order
to keep them updated on the Company’s developments
and key messages. Regular investors’ meets are organised
for increased engagements which include interaction with
management, discussion of financials, strategy and execution
plans.
�is financial year, Fullerton India added over 20 investors
including two PSU Banks and one large DFI thereby enhancing
its funding flexibility. Over the next few years these investor
additions would provide long tenor stable funding to the
Company adding to stability. Subordinated debt issuance, buy
back of high cost debt and sale of pool further improved its
capital efficiency and overall funding structure.
In addition to the above factors, strong financial performance
contributed in the Company receiving better commercial terms
from lenders reducing the overall financing cost by over 80
basis points.
26Funding and Treasury Management & Information Technology

Information Technology
Fullerton India has been at the forefront of technology adoption, bringing out solutions that enhance customers’ experience and provide world class convenience.
�e Fullerton Differentiator�e Company embraced cutting-edge technologies that made it possible for rural field employees to use
Android-based tablets that record transactions and issue receipts on real time basis, improving customer
experience. �e solution combines on-field data availability with controls like biometric (fingerprint-based)
authentication, digitally signed receipts and account statements that accelerates business processes and
enhances customer trust.
27Annual Report 2016 Fullerton India Credit Company Limited

OverviewFullerton India recognises the need to provide a unified
customer experience that cuts through various customer
touch points, products and geographies. Speedy solution to
customers is increasingly the critical factor, while ensuring high
asset quality and business continuity. Automation at every
level is therefore the key to enhanced efficiency. �e Company
has always been investing in advanced technology translating
into cutting edge product and services offerings and has been
stepping up its digitisation momentum.
Fullerton India has also invested in Customer Relationship
Management (CRM) solution which is used as a single platform
for all customer engagements. �e Company has revamped
its web portal with enquiry management, lead management
and customer online access. �e customers can now apply
online for loans and get automated approval decisions. �e
Company upgraded its Core Lending system for Rural business
with built-in workflows to reduce the turn around time for
sanctioning loans. A revamped and responsive Customer
Portal has been launched thus enabling the customers to
login and register through their social media account like
Facebook and Gmail. �is portal facilitates ease of navigation
and addresses the enquiry about their accounts online.
Furthermore, now the customers can also view documents
online and send service requests, which are integrated with
CRM solution. At the Company Call Centre, service delivery is
being optimised by directing the customers to the Interactive
Voice Response (IVR) solution.
Strengths�e Company’s data warehouse, Customer Relationship
Management (CRM), approval-in-principle engine and
analytics solutions helped target existing and new customers
in a cost-effective manner and offer customised solutions. In
addition to moderating the cost of customer acquisition, the
Company’s proactive technology investments helped deepen
customer relationships and drive higher efficiencies.
�e Company successfully implemented Desktop
Virtualisation, a Cloud Technology solution, to run all its core
operations across Urban and Rural markets. �rough this
deployment, Fullerton India moved from a physical desktop PC
environment to a private cloud-based Hosted Shared Desktop
environment. �e application delivery as a service (ADaaS)
solution works on the central server, derives server-based
processing power, provides instantaneous boot up, reduces
machine downtime and facilitates employee mobility. �e
Company has around 3,000 virtual machines that run over
much smaller physical technology infrastructure footprint to
power numerous IT enabled business services.
With a view to support the digital initiatives and focusing
squarely on customer-centricity, Fullerton India has embarked
on a program to equip its core platform with paperless
processing capacity to meet the scale, speed and transaction
volume requirements for the future through implementation
of SharePoint work flows.
�e Company has also created the state-of-the-art Business
Continuity and Disaster Recovery management strategy to
secure the live systems. Periodic switch-over and switch-back
drills of major IT applications are performed, thereby preparing
for the Company’s readiness in responding to emergency
situations.
Fullerton India uses Customer Relationship Management
(CRM) platform which acts as a single platform to log, handle,
escalate and resolve customer grievances. �e Company has
implemented a framework for the measurement of Customer
Experience (internal and external) to ensure that customer
feedback across each touch point (including customer
complaints, customer satisfaction surveys, telephonic surveys
and employee feedback) is analysed and acted upon.
Highlights, FY2016�e Company’s Infrastructure succeeded in delivering 99%
uptime (which is described as the ability to not affect more
than 25 individuals for more than 15 minutes during working
hours).
During the year the digital journey began with implementation
of Online Lending Platform which provides in principle approval
within minutes as well as an enhanced Customer Self Service
Portal with new features and service requests. During the
year, the Company also implemented a customer assessment
mobile application which would reduce the telephonic
verification timings drastically and help speedier sanction of
loans.
28Information Technology & Human Capital

Human Capital
Fullerton India’s Human Capital function plays an enabling role in creating an environment of growth and development for its employees. With a vision to be an ‘Employer of Choice’, Fullerton India has demonstrated commitment in building a culture that fosters Integrity, Meritocracy, Teamwork and a sense of Community which has inspired people to perform and succeed.
�e various Industry awards and recognition in several areas including Data Quality, Technology and CSR bear testimony to our approach in harnessing talent to achieve excellence.
�e Fullerton DifferentiatorIn its growth journey, Fullerton India has recruited selectively, trained comprehensively and communicated
transparently. �is has resulted in a highly engaged workforce which consistently delivers superior business
results. �e emphasis on staff development is evidenced by the fact that 60% of supervisory roles were filled
internally. Employees see their personal and professional growth in tandem with the Company’s growth.
29Annual Report 2016 Fullerton India Credit Company Limited
OverviewFullerton India has created a culture that underpins Integrity,
Meritocracy, Teamwork, Process discipline and Compliance.
Over the last few years, the Company has focused extensively
on employee communication as a key intervention to
enhance engagement, led by the CEO and the Leadership
Team, covering all employees across locations through
phone-casts, townhalls, location visits by the Leadership
Team and more recently adopted digital communications
channel called “LetzTalk”, an online chat with employees
on select topics . �rough these initiatives the Company has
successfully aligned employee aspirations and goals with the
organisation’s strategic priorities.
StrengthsFullerton India provides an inclusive and caring work
environment. �e Company’s Code of Conduct sets high
standards of integrity, conduct and workplace behavior.
People policies are designed to ensure a healthy and safe
workplace, free from discrimination or harassment where
employees can raise complaints without fear of retribution.
�e Company strengthened its performance measurement
through a sharply defined organisational scorecard, duly
approved by the Board, which in turn cascaded down to each
business function. �e Company has also further instituted
individual goal setting aligned to score cards �e strict ‘Pay
for Performance’ philosophy is reflected through short and
long-term incentives tied to performance metrics enabling
consistent performers to be remunerated competitively.
�e Company provides hands-on experience, exposure and
education to its Management staff through locally designed
learning programmes as well as the Temasek Business
Leadership Centre, where top performers were nominated
to learning programmes facilitated by a distinguished panel
of current and former professors and lecturers from IMD,
INSEAD, Yale School of Management, University of Michigan
and the Darden School of Business.
�e Company has also tied up with leading institutions such as
IRMA (Institute of Rural Management, Ahmedabad) instituting
customised Management Development Programs to groom
its middle management for leadership roles.
Several senior managers enhanced their professional
exposure through international assignments including full
time senior appointments in other international companies of
Fullerton Financial Holdings
Highlights, FY2016 Increased people strength from 7244 as on 31 March 2015 to
8738 as on 31 March 2016;
Recognised over 1500 employees under the ‘Fullerton India
Recognition of Excellence’ program (FIRE), which recognises
the top-performing employees at various intervals through
the year, culminating in the prestigious, annual CEO’s Elite List.
Invested 31,496 person-days in employee training including
career path programs across key functions, personal
effectiveness and bespoke programmes.
Launched FIRE B2S program -‘Fullerton India Recognition
of Excellence -Back to School’ program for our key Talent to
benefit from executive development programs offered by
globally renowned business schools.
Invested in employee welfare (including healthcare, life
insurance and emergency financial aid).
Instituted a Rural skills development program “Gurukul”
under its CSR program to impart employability skills amongst
youths in rural India. In FY2016 we have successfully launched
3 centers across 3 states. �e program has already trained
more than 400 youths and employed 100 such trainees in its
rural branches.
Several staff engagement programmes have been
organised including fun at workplace activities like corporate
cricket tournaments, inter-corporate quis competitions, and
staff meets called “Josh”.
�e adoption of digital practices for employee life cycle
management continued during the year with the launch of
a new version of the employee portal called eConnect which
features internal social media for employee interaction and
engagement.
30Human Capital & Grihashakti

Grihashakti- Fullerton India Home FinanceFullerton India launched its housing finance company under the brand name- ‘Grihashakti’ through its wholly-owned subsidiary Fullerton India Home Finance Company Limited. Grihashakti received license from the National Housing Bank (NHB) in July 2015 and commenced its business operation in Dec 2015.
31Annual Report 2016 Fullerton India Credit Company Limited

Fullerton India DifferentiatorAffordable/low cost housing finance is seen as the next
big opportunity with focus shifting towards low and middle
income segments in the housing market. �ere is a shortfall
of affordable housing units in India of 2.7 crore in urban areas
and 4.4 crore in rural area resulting in potential housing finance
opportunity of ` 27 lakh crores. Grihashakti with its focus on
tier II and tier III cities, is poised to address this huge demand.
Besides this, the existing 14 lakhs+ customer base of its
parent Company will serve as a ready platform to offer housing
solutions to the underserved markets.
OverviewGrihashakti launched its operations by establishing its footprint
in 20 locations spread across seven states, viz: Maharashtra,
Gujarat, Madhya Pradesh, Rajasthan, Tamil Nadu, Karnataka
and West Bengal. Since December 2015, the Company closed
its books in FY2016 with a portfolio of `24.2 crores. �e
average ticket size during the financial year was 16 lakhs with
an average loan value of 75%.
Highlights Average age of customers- 41 years
Average loan tenure- 15 years
75% of the portfolio concentrated across Maharashtra,
Karnataka and Madhya Pradesh
Salaried to self-employed customers- 40:60
Strengths Existing 14 lakhs+ customer base of Fullerton India
A ready platform of business intelligence and analytics
knowledge from the parent company
Grihashakti targets the entire spectrum of customer segment
comprising of low, middle and high income and focuses on
both salaried and the self-employed segment.
�e Company operates in the small to medium ticket space
and the average ticket size as of March 2016 is `16 lakh. �e
salaried to self-employed ratio was 40:60 and average loan to
value was 75%. A large part of the growth has come through
reaching out to new customers. �e average age of the
customers is 41 years and the average loan tenor has been 15
years.
75% of the portfolio is concentrated in the states of
Maharashtra, Karnataka and Madhya Pradesh. �e portfolio
would be balanced and spread across the remaining states
in FY2017 and towards this adequate staffing and distribution
ramp-up is being planned.
Grihashakti plans to establish itself as a leading player in home
finance by expanding into underserved markets and guiding
customers to choose their dream home.
32Grihashakti
Directors’ Report
Dear members,
Your Directors have the pleasure in presenting the 21st Annual Report of Fullerton India Credit Company
Limited along with the audited statement of accounts for the financial year ended 31 March, 2016.
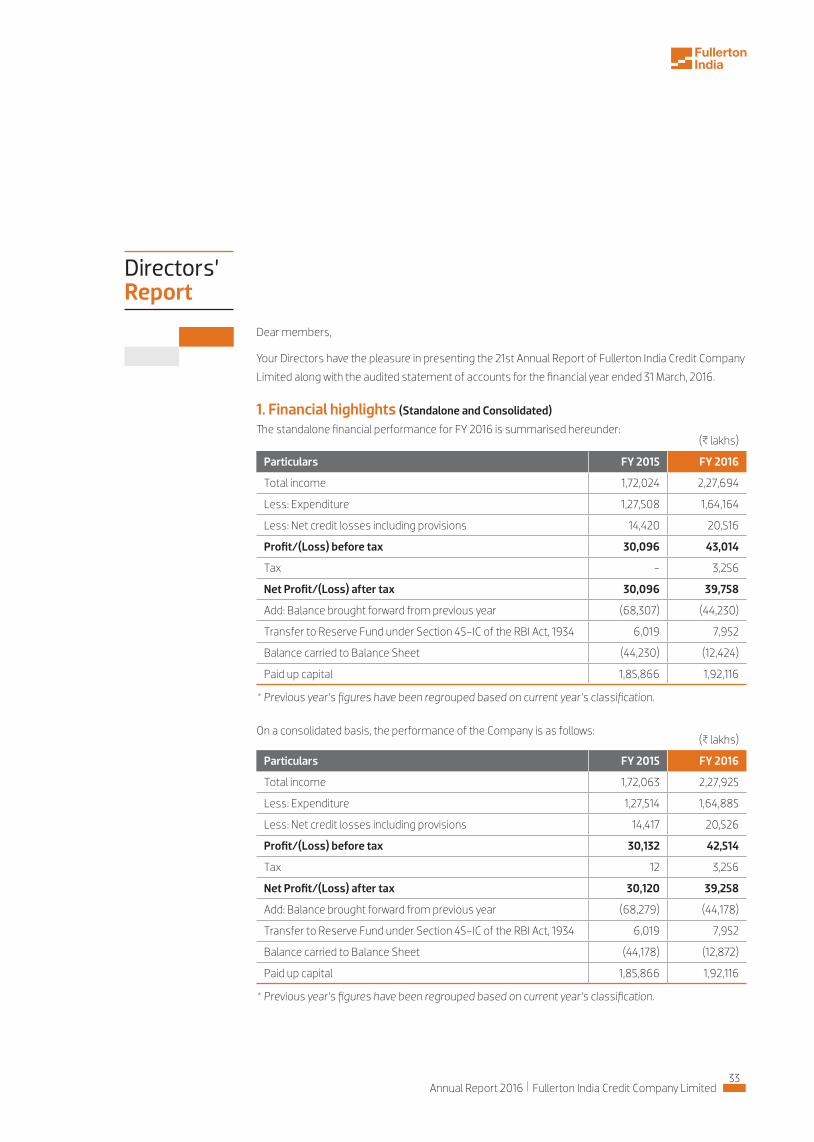
1. Financial highlights (Standalone and Consolidated) �e standalone financial performance for FY 2016 is summarised hereunder:
On a consolidated basis, the performance of the Company is as follows:
(B lakhs)
Particulars FY 2015 FY 2016
Total income 1,72,024 2,27,694
Less: Expenditure 1,27,508 1,64,164
Less: Net credit losses including provisions 14,420 20,516
Profit/(Loss) before tax 30,096 43,014
Tax - 3,256
Net Profit/(Loss) after tax 30,096 39,758
Add: Balance brought forward from previous year (68,307) (44,230)
Transfer to Reserve Fund under Section 45-IC of the RBI Act, 1934 6,019 7,952
Balance carried to Balance Sheet (44,230) (12,424)
Paid up capital 1,85,866 1,92,116
* Previous year’s figures have been regrouped based on current year’s classification.
(B lakhs)
Particulars FY 2015 FY 2016
Total income 1,72,063 2,27,925
Less: Expenditure 1,27,514 1,64,885
Less: Net credit losses including provisions 14,417 20,526
Profit/(Loss) before tax 30,132 42,514
Tax 12 3,256
Net Profit/(Loss) after tax 30,120 39,258
Add: Balance brought forward from previous year (68,279) (44,178)
Transfer to Reserve Fund under Section 45-IC of the RBI Act, 1934 6,019 7,952
Balance carried to Balance Sheet (44,178) (12,872)
Paid up capital 1,85,866 1,92,116
* Previous year’s figures have been regrouped based on current year’s classification.
33Annual Report 2016 Fullerton India Credit Company Limited

2. Financial performance and overviewDuring the year under review, the Company continued to
perform well and reported a healthy improvement across all its
operating metrics.
Assets under management (representing on-book assets
and assigned portfolios) witnessed a 33% growth and stood at
B11,50,816 lakhs (B8,66,916 lakhs as at 31 March, 2015) while the
assets on book were B11,03,736 lakhs (B8,60,976 lakhs as at 31
March, 2015). �e live customer base has grown to more than
14 lakhs.
�e Company continues to focus on building a diversified
lending portfolio such that there is balance between risk and
reward, and the overall portfolio, while delivering acceptable
ROE, remains resilient to any market stress. Accordingly,
secured assets now account for 49% of the assets under
management as on 31 March, 2016 as against 45% in the
previous year.
Overall disbursals for FY 2016 stood at B8,57,234 lakhs,
representing a 26% increase over the previous fiscal disbursals
of B6,79,994 lakhs.
�e growth in the Balance Sheet was financed substantially
by long tenor bank borrowings. Bank borrowings stood
at B5,49,036 lakhs (B4,46,142 lakhs as at 31 March, 2015)
representing an increase of 23% over last year. Non-convertible
debentures stood at B3,58,990 lakhs (B2,37,150 lakhs as at 31
March, 2015), including long tenure subordinated bonds eligible
for Tier-II capital aggregating B62,000 lakhs (B30,000 lakhs
in FY 2015). Short-term commercial papers increased by 23%
from B88,910 lakhs to B1,09,187 lakhs during the same period.
During 2015-16, the Company directly assigned/securitized
assets to the extent of B53,192 lakhs (accounting for 4.6% of
the total assets under management as on 31 March, 2016 (FY
2015 Nil). �e outstanding direct assigned/securitized assets
portfolio stood at B47,079 lakhs as on 31 March, 2016 (B5,941
lakhs as at 31 March 2015).
Gross income increased by 32% to B2,27,694 lakhs (B1,72,024
lakhs in FY 2015) and finance costs stood at B95,076 lakhs
(B70,860 lakhs in FY 2015). Net interest income increased by
27% to reach B1,08,710 lakhs (B85,857 lakhs in FY 2015).
Non interest expenditure stood at B69,088 lakhs (B56,648
lakhs in FY 2015), and as a percentage of total income, stood
lower at 52.1% (56.0% in FY 2015).
�e Company has been compliant with the proposed RBI
norms of recognizing NPAs at 90 DPD. During the financial year
under review, the Company further tightened its provisioning
policy to align with bank norms. Net credit losses during the
fiscal stood at B20,516 lakhs (B14,420 lakhs in FY 2015), with the
increases substantially due to these changes in policy. Gross
NPAs have held steady at 1.9% (1.9% in FY 2015), with net NPAs
improving to 1.3% (1.4% in FY 2015).
A strong underlying momentum, improved asset quality
and operational efficiency enabled the Company to report
Profits Before Tax of B43,014 lakhs (B30,096 lakhs in FY 2015),
representing a 43% growth. Profit after tax increased by 32%
B39,758 lakhs (B30,096 lakhs in FY 2015). During the year,
Company has become cumulatively profitable and started
paying income-taxes.
Please also refer the ‘Management discussion and analysis’,
enclosed as Annexure I to this report, for more details.
3. State of Company’s affairs and future outlook�e detailed overview of the state of affairs of the Company
and future outlook is provided in the ‘Management discussion
and analysis’ section, enclosed as Annexure I to this report.
4. Share CapitalDuring the year, 625 lakh Equity Shares of B10/- each
aggregating to B150 crores were allotted to M/s. Angelica
Investments Pte Ltd on rights basis, at premium of B14/- per
share.
�e issued, subscribed and paid-up capital of the Company as at 31 March, 2016, stood at B1,92,116.14 lakhs. �e Equity Shares, of
B10 each, were held as under:
Name Number of
shares%
Angelica Investments Pte Ltd 1,83,59,05,000 95.56
Fullerton Financial Holdings Pte Ltd 8,52,56,357 4.44
34Directors’ report

5. Capital adequacy�e details on ‘Tier-I’, ‘Tier-II’ capital and capital adequacy ratio
are given under the ‘Management discussion and analysis’
section of this Report.
6. DividendDue to non-availability of profits after the mandatory transfers
to the reserve fund, as stipulated by the RBI regulations, no
dividend is being recommended on Equity Shares of the
Company for the year ended 31 March, 2016.
7. Debt positionDuring the year under review, the Company placed B1,25,000
lakhs in commercial papers (B1,06,200 lakhs repaid during
the year) and B2,20,300 lakhs in non-convertible secured and
unsecured debentures (B98,460 lakhs repaid during the year)
with various mutual funds and financial institutions on a private
placement basis. �e Company availed long-term and short-
term loans worth B2,26,000 lakhs (and repaid B1,30,604 lakhs
during the year) from banks.
8. Change(s) in the nature of business, if any�ere were no material changes in the nature of the business
of the Company. Company’s subsidiary, Fullerton India Home
Finance Company Ltd, started its operations during the year
after receiving licence from the National Housing Bank. �e
other subsidiary, Fullerton India Foundation for Social &
Economic Development, did not conduct any operations during
the year.
9. Transfer to reservesDuring the year, the Company has transferred 20% of its profit
for the year amounting to B7,951 lakhs to reserves created as
per of the norms laid down under Section 45-IC of the Reserve
Bank of India Act, 1934.
10. Directors and key managerial personnel�e Company’s Board lays down the strategic objectives of
the Company and guides the management in meeting its goal
of aligning the interests of the shareholders with that of the
promoters.
Mr. Gan Chee Yen is liable to retire by rotation at the ensuing Annual General Meeting of the Company. Mr. Gan Chee Yen, being
eligible, has offered himself for reappointment. �e Board recommends his reappointment to the members of the Company.
Since the last AGM, the Board has appointed Mr. Kenneth Ho as an Additional Director under Section 161(1) of the Companies Act,
2013 on 20 November, 2015. �e profile of Mr. Kenneth Ho has been provided in the explanatory statement forming part of the AGM
notice. �e Board recommends his appointment as Director.
All Independent Directors have given declarations that they meet the criteria of independence as laid down under Section 149(6) of
the Companies Act, 2013.
�e following changes have taken place in the Board during the financial year 2015-16:
Since, the last AGM, the Board has appointed the following persons as Directors:
Name Category Date of appointment
Mr. Premod Paul �omas Independent Director 9 October, 2015
Mr. Kenneth Tat Meng Ho Additional Director 20 November, 2015
(i) Appointment of Directors
Name Category Date of appointment
Mr. Boon Leng Quah Non-Executive Director 20 May, 2015
Mr. Premod Paul �omas Independent Director 9 October, 2015
Mr. Kenneth Tat Meng Ho Additional Director 20 November, 2015
(ii) Resignation of Director
Name Category Date of resignation
Mr. Ferdy Khouw Non-Executive Director 12 June, 2015
Mr. Boon Leng Quah Non-Executive Director 5 October, 2015
35Annual Report 2016 Fullerton India Credit Company Limited

�e following are the key managerial personnel of the Company, as recorded by the Board:
Key managerial personnel Designation
Mr. Shantanu Mitra Chief Executive Officer & Managing Director
Mr. Pankaj Malik Chief Financial Officer and Company Secretary
Mr. Pratik Gandhi, resigned as the Chief Financial Officer during the year. Mr. Pankaj Malik was appointed as Chief Financial Officer
during the year.
11. Number of meetings of the Board of Directors�ere were four Board meetings held during the year on;
i. 20 May, 2015
ii. 26 August, 2015
iii. 17 December, 2015 and
iv. 15 March, 2016
�e time gap between any two meetings was less than 120
days with at least one meeting being held every quarter.
12. Board evaluationPursuant to the provisions of the Companies Act, 2013,
the Independent Directors met separately to review the
performance of Non-Independent Directors, Chairpersons of
the Company, the Board as a whole and the flow of information
between the Board and the management.
�e Board has completed the annual evaluation of its
own performance, the individual Directors (including the
Chairman) as well as an evaluation of the working of all
Board Committees. �e Board of Directors was assisted by
the Nomination and Remuneration Committee (“NRC”). �e
performance evaluation was carried out by seeking inputs from
all the Directors/Members of the Committees.
13. Managerial remuneration In terms of the provisions of Section 197 read with Rule 5 of
Companies (Appointment and Remuneration of Managerial
Personnel) Rules, 2014, the details of remuneration and
compensation of the employees are set out in the annexure
to the Directors’ Report. Having regard to the provisions of
Section 136 of the Companies Act, 2013, the Annual Report
excluding the aforesaid information is being sent to the
members of the Company. Any member interested in
obtaining such particulars may write to the Company Secretary
of the Company at the Corporate Office.
14. Details of subsidiaries�e Company has two subsidiary companies, both of which are
wholly-owned:
a. Fullerton India Home Finance Company Limited and
b. Fullerton India Foundation for Social & Economic
Development (a Section 8 company)
Fullerton India Home Finance Company Ltd (FIHFCL), received
licence from the National Housing Bank, to start the home
finance business in July 2015. Subsequently, the Company
made further capital infusion during the year by subscribing to
4,76,19,048 Equity Shares of B10 each at a premium of B0.50
per share. �e equity investment increased to B5761.90 lakhs
from B1,000 lakhs in FIHFCL. FIHFCL commenced its business
operations during the year.
Fullerton India Foundation for Social & Economic Development
did not conduct any operations during the year.
15. Statutory Auditors M/s. S. R. Batliboi & Co. LLP, the auditors of the Company
retire at the forthcoming AGM, and have made themselves
available for reappointment. �e Audit Committee, after review,
has recommended their reappointment. �e auditors have
given their consent for the reappointment and provided the
certificate as per the relevant provisions of Chapter X of the
Companies Act, 2013 vide their letter dated 7 May, 2016.
16. Secretarial AuditorsM/s. Vinod Kothari & Company were appointed as the
Secretarial Auditors of the Company by the Board, during the
year. �ey have conducted the secretarial audit as per the
provisions of section 204 of the Companies Act, 2013 and
issued a Secretarial Audit Report. Copy of the report is attached
to this report as Annexure IV.
36Directors’ report

17. Certificate on compliance with the regulations as regards downstream investment and other FEMA Regulations A certificate has also been obtained from the Auditors to the
effect that the Company is in compliance with the conditions
of Foreign Direct Investment for the downstream investments
made by the Company in subsidiary companies.
18. Response to the Auditors’ Report�ere were no qualifications, reservation or adverse remark or
disclaimer, made by the statutory or the secretarial auditors in
their reports.
19. Disclosure on ESOPS�e Company does not have any employee stock option/
purchase scheme. �e details of share appreciation rights are
mentioned in Note 32 of the notes to accounts.
20. Audit Committee �e details of the constitution, terms of reference, etc., of the
Audit Committee are mentioned in the Corporate Governance
Report, enclosed as Annexure II to this report.
21. Nomination and Remuneration Committee�e details of the constitution, terms of reference, etc., of the
Nomination and Remuneration Committee are mentioned in
the Corporate Governance Report, enclosed as Annexure II to
this report.
�e Company has clearly laid out guidelines approved by the
Nomination and Remuneration Committee (NRC) for Fit and
Proper Criteria for appointment of Directors in accordance with
the Companies Act, 2013 and the Reserve Bank of India.
Further, there is also a policy framed by NRC for remuneration
for directors, KMPs and employees incorporating principles of
fairness, pay for performance, a sufficient balance in rewarding
short and long term objectives reflected in the pay mix of fixed
and variable pay, meeting the financial viability of the Company.
22. Vigil mechanism �e Company has a whistle-blower policy in place as part
of the vigil mechanism for reporting of genuine concerns by
any stakeholder about any other one. �e policy, displayed
on the website of the Company, provides an opportunity for
anyone to report their concerns to the management about
any actual or suspected unethical behaviour, fraud or violation
of the Company’s Code of Conduct. �is policy also provides
safeguards against victimisation of stakeholders, who report
their concerns. �e whistle-blower policy comprehensively
covers processes for receiving, analysing, investigating,
inquiring and reporting of the issues raised. An update on
whistleblower cases and investigation conducted thereon is
presented to the Audit Committee on a quarterly basis.
23. Risk management policyIn line with the RBI regulations, the Company has a Board
Committee known as the Risk Oversight Committee. �e
Committee oversees the processes of risk assessment and
minimisation, monitors risk management plans and carries
out such other functions as may be directed by the Board.
Please refer the Corporate Governance report for the terms of
reference of the Committee.
�e Company has adopted several policies for risk
management. �e management reports to the Committee on
risks identified and the action taken to mitigate those risks.
�e specific objectives of the Risk Oversight Committee of the
Company include:
To ensure that all the current and future material risk
exposures of the Company are identified, assessed, quantified,
appropriately mitigated and managed;
To establish a framework for the Company’s risk
management process and ensure Companywide
implementation;
To ensure systematic and uniform assessment of risks
related to NBFCs;
To enable compliance with appropriate regulations,
wherever applicable, through the adoption of best-in-class
practices; and,
To assure business growth along with financial stability.
Please also refer the ‘Management discussion and analysis’,
enclosed as Annexure I to this report, for more details on the
subject.
24. Extract of the annual returnIn terms of the provisions of Section 197 read with Rule 5 of
Companies (Appointment and Remuneration of Managerial
37Annual Report 2016 Fullerton India Credit Company Limited

Personnel) Rules, 2014, the details forming part of the extract
of the Annual Return in Form MGT-9 are to be set out as
an annexure to the Directors’ Report. Having regard to the
provisions of Section 136 of the Companies Act, 2013, the
Annual Report excluding the aforesaid information is being
sent to the members of the Company. Any member interested
in obtaining such particulars may write to the Company
Secretary of the Company at the Corporate Office.
25. Material changes and commitments, if any, affecting the financial position of the Company which have occurred between the end of the financial year of the Company to which the financial statements relate and the date of the report�ere have been no such material changes and commitments
affecting the financial position of the Company which have
occurred during the said period.
26. Details of significant and material orders passed by the regulators/courts/tribunals impacting the going concern status and the Company’s operations in future�ere were no significant and material orders passed by the
regulators/courts/tribunals impacting the going concern
status of the Company and its operations in future.
27. Statement in respect of adequacy of internal financial controls with reference to the financial statements�e members may note that:
Systems have been laid to ensure that all transactions
are executed in accordance with management’s general and
specific authorization. �ere are well-laid manuals for such
general or specific authorisation.
Systems and procedures exist to ensure that all
transactions are recorded as necessary to permit preparation
of financial statements in conformity with generally accepted
accounting principles or any other criteria applicable to such
statements and to maintain accountability for aspects.
Access to assets is permitted only in accordance with
management’s general and specific authorization. No assets
of the Company are allowed to be used for personal purposes,
except in accordance with terms of employment or except as
specifically permitted.
�e existing assets of the Company are verified/checked
at reasonable intervals and appropriate action is taken with
respect to differences, if any.
Based on the above, your Board is of the view that adequate
internal financial controls exist in the Company.
28. Particulars of loans/advances/investments outstanding during the financial year�e disclosures relating to particulars of loans/advances/investments outstanding as per Regulation 53(f) of the SEBI (Listing
Obligations and Disclosure Requirements) Regulations, 2015 are as under:
A. With respect to Holding and Subsidiary companies
B. Cash Flow statement included in the financial statements.
Sr. No.
In the books of FICCL in capacity of
Disclosures of amounts at the year end and the maximum amount of loans/advances/investments outstanding during the year
Disclosure
1. Holding Company
Loans and advances in the nature of loans to subsidiaries by name and amount.
Loans and advances in the nature of loans to associates by name and amount.
(i) No repayment schedule or repayment beyond seven years; or
(ii) No interest or interest below section 186 of the Companies Act, 2013 by name and amount.
Loans and advances in the nature of loans to firms/companies in which Directors are interested by name and amount.
Nil
2. SubsidiarySame disclosures as applicable to the parent company in the accounts of subsidiary company
Nil
3. Holding CompanyInvestments by the loanee (borrower) in the shares of parent company and subsidiary company, when the Company has made a loan or advance in the nature of loan.
Nil
38Directors’ report
29. Deposits �e Company despite being registered as a ‘Deposit-taking
NBFC under the regulations of the RBI, has not accepted any
public deposits during the year under review (Nil during FY
2015), under Chapter V of the Companies Act, 2013.
30. Particulars of loans, guarantees or investments under Section 186�e Company is exempt from the provisions laid down
under Section 186 as regards to loan and advances made,
guarantees given or security provided. �e Company made
an equity investment in one of its wholly-owned subsidiaries,
details of which are provided under ‘Details of subsidiaries’
section herein above.
31. Particulars of contracts or arrangements with related parties�ere were no related party transactions falling under Section
188 of the Companies Act, 2013 during the year.
32. Corporate Governance A detailed report on Corporate Governance and copy of the
Certification of the Chief Executive Officer and Chief Financial
Officer of the Company are provided as Annexures II and III to
this report respectively.
33. Management discussion and analysisA detailed review of the operations, financial performance, risk
management, outlook, among others, is provided under the
section ‘Management discussion and analysis’ enclosed as
Annexure I to this report.
34. Fraud Reporting�e Company reports about the frauds to the Reserve Bank of
India every quarter in terms of the RBI regulations. �e details
of the frauds occurred during the quarter are also placed
before first Audit Committee meeting held after the end of the
quarter. �ere have been 23 instances of fraud cases reported
by the Company to the Board. �e Company has taken
appropriate action in these cases.
No frauds were reported by the Auditors, during the year.
35. Revision of financial statements or Board’s Report�ere have been no revisions in the financial statements or
Board’s Report as approved by the shareholders and published
in the annual report.
Sr. No. Trustee Contact details
1. GDA Trusteeship Limited
GDA House, Plot No.85, Bhusari Colony,Paud Road, Pune – 411038Phone: 020 – 25280081 Extension: 107 Fax: 020 – 25280275
2. IL & FS Trust Company Limited
�e IL&FS Financial Centre, Plot C- 22, G Block, Bandra Kurla Complex, Bandra (E), Mumbai 400051Phone: 022 - 26533333Fax: 022 - 26533038
36. Details of debenture trustees�e details of the entities which acted as the debenture trustees for the debenture holders of the Company during the year are as
under:
39Annual Report 2016 Fullerton India Credit Company Limited

Rating Agency Term Type Rating
ICRALT NCD/TL/SD [ICRA] AA+ with stable outlook
ST STD/CP [ICRA] A1+
India RatingsLT NCD/SD IND AA+ with stable outlook
ST STD/CP IND A1+
CARE LT NCD/SD CARE (AAA) (Triple A)
37. Credit rating�e credit ratings’ details of the Company as on 31 March, 2016 were as follows:
LT – Long-term ST – Short-term
NCD – Non-convertible debentures SD – Subordinate debt
CP – Commercial paper TL – Term loan
STD – Short-term debt
�e ratings mentioned above were reaffirmed by the rating agencies (ICRA, India Ratings and CARE) during the FY 2016.
38. Disclosures under the Sexual Harassment of Women at Workplace (Prevention, Prohibition & Redressal) Act, 2013Pursuant to the new legislation on “Prevention, Prohibition
and Redressal of Sexual Harassment of Women at Workplace
Act 2013”, the Company has framed a policy on Prevention of
Sexual Harassment at Workplace. During the year 2015-16, one
case was reported under the provisions and guidelines of this
policy and disposed off through conciliation.
39. Conservation of energy, technology absorption and foreign exchange earnings and outgo�e provisions relating to conservation of energy and
technology absorption do not apply to the Company, since it is
an NBFC.
However, FICCL adopts the usage of information technology
extensively and is prudent in utilising non-renewable
resources.
�e Company has been taking steps towards environment
conservation by adopting alternate and clean methods of
energy generation. �e Company has been investing in solar
power hybrid systems since 2012, and has made investments
worth B4.6 crores as on March 2016. �e Company is further
planning to invest B97 lakhs till July 2016 for the same initiative.
�e Company aims to drive energy efficiency at its branches
through an increased use of solar/wind hybrid systems.
As of December 2015, the Company has installed wind and
solar systems in 150 rural branches across 10 states thereby
saving 1,16,000 litres of diesel. It projects to add solar energy
systems at another 36 of its branches by the first half of
2016, saving a further 5,14,000 litres of diesel in the next 5
years. �e Company is the only NBFC in India that uses solar
energy to power its branches, thereby eliminating the need
for diesel powered generator backup. �rough this initiative,
as of December 2015, 280 MWh of clean energy has been
generated, reducing its carbon footprint by 310 tons due to the
non-consumption of fossil fuels.
�ere were foreign exchange outflows of B537 lakhs during the
year (B141 lakhs in FY 2015), pertaining to travel, training and
professional fees.
40. Corporate social responsibility �e details of the composition of CSR Committee and its
terms of reference are given in Corporate Governance report.
�e Company’s CSR policy, including overview of projects is
enclosed as Annexure V to this report.
41. Directors’ responsibility statementAs per the provisions of Section 134(3)(c) read with Section
134(5) of the Companies Act, 2013, your Directors confirm that:
(i) in the preparation of the annual accounts for the
year ended 31 March, 2016, the applicable accounting
standards had been followed along with proper
explanation relating to material departures;
(ii) the Directors had selected such accounting policies and
applied them consistently and made judgments and
estimates that are reasonable and prudent so as to give
40Directors’ report

a true and fair view of the state of affairs of the Company
at the end of the financial year and of the profit and loss of
the Company for that period;
(iii) the Directors had taken proper and sufficient care for
the maintenance of adequate accounting records
in accordance with the provisions of this Act for
safeguarding the assets of the Company and for
preventing and detecting fraud and other irregularities;
(iv) the Directors had prepared the annual accounts on a
going concern basis;
(v) the Directors had devised proper systems to ensure
compliance with the provisions of all applicable laws
and that such systems were adequate and operating
effectively;
(vi) the Directors had laid down internal financial controls to be
followed by the Company and that such internal financial
controls are adequate and were operating effectively.
42. Acknowledgement Your Directors would like to place on record, their gratitude
for the cooperation and guidance received from all the
statutory bodies, especially the RBI. �e Directors also thank
the shareholders, clients, vendors, investors, banks and
other stakeholders in placing their faith in the Company and
contributing to its growth. We would also like to appreciate the
hard work put in by all our employees, and we look forward to
their continuing patronage, going forward.
On behalf of the Board of Directors
Mumbai Gan Chee Yen
19 May, 2016 Chairman
41Annual Report 2016 Fullerton India Credit Company Limited

ManagementDiscussion and Analysis
Global economic reviewGlobal growth, at 3.1%, remained subdued in 2015. Various reasons contributed to the sluggishness,
including a tepid recovery of developed market economies, slowdown in emerging markets, rising
international debt, declining global commodity prices and slow growth of international trade. USA was
the fastest growing of the developed economies in 2015 – the growth helped reduce the slack in the
country’s labor market and strengthen household and corporate finances. Annual growth in the Euro
zone was stable due to robust domestic demand. Japanese economy ended on weak footing and a
strengthening Yen continued to weigh on exports and manufacturing activity. �ere was an economic
slowdown and rebalancing in China from investment and manufacturing towards consumption and
services, resulting in the weakest growth in that country in a quarter of a century. Energy and other
commodities were marked by lower realisations. �ere was a gradual tightening in US monetary policy
even as other major advanced economy central banks eased their monetary policies. All this resulted
into International Monetary Fund cutting its global growth forecast for the third time in less than a year,
in January 2016.
(Source: IMF)
Indian economic reviewIndia reported a healthy GDP growth of 7.6%, notwithstanding uneven economic conditions – and was
one of the fastest growing major economies. India endured a challenging 2015 monsoon, sluggish
infrastructure growth, relatively high interest rates, an increase in corporate non-performing assets,
and sluggishness in implementation of economic reforms. �e Union Budget, announced in Feb
2016 sustained the government’s fiscal consolidation through a number of measures to catalyse the
country’s rural economy, which is expected to translate into enhanced private consumption. India’s
various macroeconomic parameters such as inflation, fiscal deficit and current account balances have
exhibited signs of improvement. Wholesale price inflation has been in negative territory for more than
a year and the consumer prices inflation declined to nearly half of what it was a few years ago. �e
rupee has depreciated vis-à-vis the US Dollar, like most other currencies in the world, although less in
magnitude. At the same time, it has appreciated against a number of other major currencies.
Indian financial services �e Indian financial services sector is one of the fastest growing in the world, contributing nearly 6%
to the country’s GDP. �e sector comprises commercial banks, insurance companies, non-banking
financial companies, co-operatives, pension funds, mutual funds and other smaller entities. Over
the span of FY2006-FY2016, the total money supply in the banking industry grew at a CAGR of 11.4%.
Time deposits with banks reported the highest growth with a CAGR of 12.9% during FY2006-FY2016.
�e insurance sector reported growth in non-life insurance policies, growing at a CAGR of 9.2% over
FY2003-FY2015. Private players accounted for 50.2% market share in the insurance sector, while public
companies accounted for 49.8% in FY2015.
42Directors’ report

Non-Banking Financial Companies (NBFCs) continue to exhibit
strong growth, with share of credit improving from 10% in
FY2005 to 13% in FY2015. Within the retail space, NBFCs are
now leading financiers of home loans (increase from 26% in
FY2005 to 38% in FY2015) and commercial vehicle financing
(from 42% in FY2013 to 46% in FY2015).
NBFCs are vital financial intermediaries and have driven the
last mile transmission of credit to sectors that have not had
meaningful access to formal banking credit. Over the last
few decades, they have developed and supported important
infrastructural requirements driving economic growth –
especially in areas of transportation (commercial vehicle and
auto finance), rural industry (tractors, commodities, small
equipment) and rural small-sector finance. Additionally, in the
urban sector, they have provided valuable credit to the small-
scale industry, and middle-class consumption financing.
NBFCs are able to tap the opportunities on the strength of their
niche positioning, differentiated product offering, good market
knowledge and large customer outreach.
(Sources: IBEF, PwC report, BCG report)
�e recent introduction of payment banks, small finance banks
and the arrival of P2P and financial technology intermediaries
are likely to deconstruct the financial services value-chain in
the country. �is will open a strategic opportunity for NBFCs to
partner asset management companies and payment banks,
offering complete financial offerings (savings, investments,
transactions and borrowings).
Opportunities and �reats in Indian Financial servicesOpportunities:Rural demand: �e hinterlands in India consist of about 6.5 lakh villages. �ese are inhabited by about 85 crore consumers
making up for about 70% of the country’s population and contributing around half of the nation’s GDP. Consumption patterns in
these areas are gradually changing to increasingly resemble the consumption patterns of urban areas. With various government
initiatives, rural income is expected to get a boost in the coming years. A report by McKinsey forecasts the annual real income per
household in rural India to rise to 3.6% in 2025, from 2.8% in the last 20 years.
(Source: IBEF).
Share of NBFCs in various segments in last few years
NBFC share of overall credit steadily growing...
Share of credit (%)
Source: IBA, RBI Financial Statistics of NBFC Sector Database, ICRA Mortgage Finance Market Update 2015, Crisil Housing Finance Report 2015, Expert interviews, BCG analysis.
Share of credit (%)
Banks
NBFCs
NBFCs
...especially in segments like home loans and CV financing
FY2009 FY2011 FY2015
Share of credit (%)
Banks
NBFCs
FY2013 FY2014 FY2015FY2005 FY2015
10%
90%
13%
87%
26%
74%
42%
58%
32%
68%
44%
56%
38%
62%
46%
54%
Banks
43Annual Report 2016 Fullerton India Credit Company Limited

Rising proportion of the working age population: India, with 132 crore people, is the second most populous country in the world.
More than 50% of India’s current population is below the age of 25 years and over 65% below the age of 35. �e median age of the
country is 27 years, making it one of the youngest nations in the world with a larger working population base. According to a UN
study, India is expected to have the largest employable population in the world by 2050.
Urbanisation: India has the highest urban population rate change among the BRIC nations. In 2001, only 28% of the population lived
in the urban areas of the country while it is expected that 40% of the population of India will be living in urban areas by 2030. �is
migration will throw up opportunities for large scale housing and infrastructure development in the coming years.
Rising consumer class: Growth in India’s middle-class and the emerging middle class segment is expected to drive consumption
demand and commercial finance in the country. �e largest household group by income category by 2020 will be the emerging
middle class group with an annual income range of between B1.5 lakh to B5 lakh per annum.
Number and % of households in different income brackets*
�reatsCompetition amongst the various financial services entities could create a downward pressure on the asset returns. Besides, there
has been growing incidents of non-performing assets in the financial services sector, which could affect the overall financial health
of the sector. Inflation and economic slowdown may pose a threat to the credit demand. Attracting and retaining the right talent
may also hamper the growth of the sector. In addition, inadequate monsoons could have a dampening effect on the rural economy.
Indian retail credit scenario Banks today contribute to 56% of retail credit in the industry. Given challenges in corporate lending, and the opportunity provided by
a growing consumption class, banks have increased their focus on retail lending. Retail portfolios in banks have increased by 16.1% in
December 2015, as against 15.3% in March 2015. Retail credit of NBFCs as on 31 December, 2015 stood at around B4.70 lakh crores,
reporting a y-o-y growth of about 18.8% (14.5% in FY2015 and 9.5% in FY2014).
(Source: ICRA)
�e housing loan segment has driven much of the retail growth. Housing loans grew from 17.7% to 19% through the year,
strengthening capital formation.
Credit penetration in the country continues to be low, if compared with other economies. Penetration of the non-banking financial
sector is even lower. With estimated growth in the economy, it is expected that credit growth will rise significantly and based on the
historical growth, the NBFC sector is expected to surge further.
(*Sources- NCAER income distributions; EuroMonitor, IRS 2005 and 2010, BCG analysis)
Note- Annual gross income based on 2015 prices
NBFCs to leverage the enormous growth expected in middle class and emerging middle class segments
ClassAnnual income per HH
(lakh per annum)2010 2020
Elite >20 30 lacs (1%) 1.6 cr (7%)
Affluent 10-20 60 lacs (2%) 1.6 cr (7%)
Middle Class 5-10 1.4 cr (6%) 3.4 cr (14%)
Emerging Middle Class 1.5-5 10.1 cr (42%) 11.7 cr (49%)
Strugglers <1.5 11.7 cr (49%) 10.5 cr (44%)
44Directors’ report

Indian MSME sector scenario�e Micro, Small & Medium Enterprises (MSME) segment
is expected to play a significant role in national growth. �e
sector comprises 3.6 crore units, provides employment
to over 8 crore individuals, addresses more than 6,000
products, contributes about 8% to GDP, 45% to the national
manufacturing output and 40% to exports, and is critical for
financial inclusion, employment generation and creation of new
entrepreneurs.
India’s GDP is forecast to become a USD 5 trillion economy by
2025 with the MSME segment as its principal growth engine.
MSME contribution to GDP is expected to increase from 8% to
15% by 2020 and account for 50% of the overall employment.
It is expected that MSME workforce will increase to 10.6 crore
(agricultural, manufacturing and services) and the share of
MSME contribution across key public and private industry
sectors will increase considerably.
Despite this large MSME presence in the Indian economy, the
penetration of formal finance in India’s MSME sector is low. In
the MSME context, finance encompasses equity capital, loans
for fixed asset investment and working capital. Several policies,
regulatory and institutional initiatives have been implemented
to promote the availability of finance to MSMEs (credit support
mechanisms administered by government institutions).
(Source: msme. gov.in)
A large number of government initiatives - Smart Cities, ease
of doing business and renewed infrastructure focus – are likely
to catalyse the sector. NBFCs are also likely to capitalise on
prevailing opportunities: low penetration (25%) of financing in
the SME segment, a financing gap of more than US $40 billion
and 40% of SMEs being financed through informal sources or
self-financing.
(Sources: RBI, website of government initiatives, BCG)
Loan profile in India Loan against property (LAP): �is is one of the faster growing
loan segments. Loans are extended to promoters of small
businesses against the promoters’ property (usually self-
occupied residential). CRISIL expects the loan against property
business to grow at 22% annually in the next four years, and
double to B5 lakh crore by March 2019. However, competition
Source: EIU, International Financial Statistics Database, RBI, Global Shadow Banking Monitoring Report 2015, BCG analysis.
Total credit as % of the GDP
Lower credit penetration in India vs. other economies
Malaysia
127
�ailand
127
Germany
149
China
165
US
244
Japan
374
UK
447
India
97
Credit Comparison of India vs. other economies*
NBFC credit as % of the GDP
NBFC size substantially lower vs. other economies
Malaysia
26
�ailand
27
Germany
29
China33
US
74
Japan
130
UK
264
India
13
45Annual Report 2016 Fullerton India Credit Company Limited
risks are building. While relatively higher profitability will give
lenders adequate cushion to absorb increase in credit costs,
maintaining rigorous credit discipline will be critical for long-
term sustainability. Non- banks (NBFCs and HFCs) account for
nearly half of LAP loans (of B2.25 lakh crore), while private and
foreign banks have lent most of the rest. In the last four years,
the LAP portfolio has grown 36% a year, ahead of the industry
growth of 30%.
(Source: CRISIL)
Commercial vehicle loans: �e commercial vehicle segment in
India sustained its growth through 2016. Domestic Commercial
Vehicles (CV) sales grew by 11.5% in FY2016. �e Medium
and Heavy Commercial Vehicle (M&HCV) segment grew by
31.9% led by replacement demand and the roll-out of new
Bharat Stage IV (BSIV) norms in and around North India. Light
Commercial Vehicles (LCV) sales declined by 0.9% in FY2016
following a recovery in the LCV sector that began in the latter
half of the financial year. Bus sales grew by 13.7% in FY2016,
supported by an increase in demand from State Transport
Undertakings. �e M&HCV segment maintained double-
digit growth in one-and-a-half years. LCV sector was largely
negative, reporting growth only in the last couple of months of
FY2016.
(Source: SIAM and Auto car report)
In the CV market, credit availability is important. �e penetration
of finance in this sector is around 90%. �e automobile loans
by banks and other financial institutions catalysed the growth
of the automobile sector through competitive interest rates.
Acting as complementary banking support, NBFCs occupy
a significant financial intermediation position. NBFCs cover
a significant portion of the total CV finance market in India.
Over the years, banks concentrated on the car loan segment
whereas NBFCs remained focused on providing finance to the
commercial vehicle segment.
Initiatives in the financial and banking sectorsSeveral Union Budget FY2016 measures were intended
to revive and accelerate investments, including fiscal
consolidation with an emphasis on expenditure reforms and
continuation of fiscal reforms with a rationalisation of tax
structures. �e government and Reserve Bank of India (RBI)
initiatives comprised:
�e RBI granted in-principle licenses to 10 applicants
to open small finance banks to expand access to financial
services in rural and semi-urban areas.
�e RBI has also given in-principle approval to 11 entities to
open payment banks which are expected to result in widening
the reach of banking services and thereby improve the extent
of financial inclusion as envisaged by the government.
�e Government announced several schemes to enhance
financial inclusion. �e Prime Minister launched the Micro Unit
Development and Refinance Agency (MUDRA) to fund and
promote microfinance institutions (MFIs) to provide loans
to small and vulnerable business sections. �e government
announced that loans under Pradhan Mantri Mudra Yojana
(PMMY) could double loan disbursement to the small business
sector to over B1,00,000 crore.
�e Union Budget has allowed foreign investment in the
insurance and pension sectors in the automatic route up to
49% subject to the extant guidelines on Indian management
and control to be verified by the regulators.
Government of India’s Jan Dhan initiative for financial
inclusion gained momentum; the number of bank accounts
opened by 15 July, 2015 more than doubled to 16.9 crore from
6.87 crore at end of October 2014. �e government intends
to extend insurance, pension and credit facilities to those
excluded from these benefits under the Pradhan Mantri Jan
Dhan Yojana (PMJDY).
RBI allowed NBFCs to borrow via offshore bonds and loans
in rupees.
RBI revised PSL guidelines requiring quarterly compliance
from FY2017 and directing lending to small/ marginal farmers
and micro enterprises.
RBI moderated risk weight on certain small ticket housing
loans to incentivize housing sectors.
�e RBI has narrowed the policy rate corridor from +/- 100
bps to +/- 50 bps by reducing the Marginal Standing Facility
(MSF) rate by 75 bps and increasing the reverse repo rate by 25
bps with a view to ensuring greater alignment of the Weighted
Average Call Rate (WACR) with the repo rate. RBI reduced the
key lending rate by 25 bps in April 2016. �e central bank cut the
repo rate, the rate at which commercial banks borrow from it by
25 bps to 6.5% while maintaining the Cash Reserve Ratio (CRR)
at 4%. �e central bank reduced the MSF rate by 75 bps to 7%.
(Source: RBI website)
To facilitate the timely transmission of interest rate cuts
across the economic pyramid, RBI also directed all scheduled
commercial banks to shift to the marginal cost of funds-based
lending rate (MCLR). �e result is that all new loans sanctioned
on or after 01 April, 2016 would be linked to MCLR.
46Directors’ report

Urban businessFullerton India’s extensive distribution network comprises
223 branches (Metro to Tier-IV) across 21 states and three
Union Territories, servicing 1.65 lakh customers. In urban India,
the Company built a portfolio encompassing personal loans
(salaried, self-employed and MSME customers), loans against
property to MSME and self-employed customers, SME loans
and commercial vehicle loans addressing retail consumers,
MSMEs and commercial borrowers. A large suite of products,
tactical cross-selling measures, best-in-class analytics,
cutting-edge technology and operational excellence helped
service this diverse client base.
Personal loansFullerton India services the personal and business needs of
customers across different segments, income streams and
geographies. An 11% growth in the personal loan portfolio over
the last year was derived through best-in-class analytics,
a well-groomed product portfolio and a superior credit
deployment framework. �e Company continued to offer loans
to consumers with credible and relatively low-risk profile. �e
Company leveraged analytical tools to identify customers,
manage resources and enhance productivity.
During the year under review, the Company enhanced its
digital footprint and customer proximity. A case in point:
Fullerton India developed a proprietary online acquisition portal
(e-loans) to reduce the cost of acquisition of new borrowers.
Besides, it launched a new IVR-based self-service portal to
efficiently service existing borrowers.
Going ahead, the Company intends to emphasise the
development of a robust delivery platform, wider product
portfolio and creation of centres of excellence to enhance
cross- sale opportunities, forge strategic alliances and
integrate payment mechanisms.
Loans against property (LAP) & SMEExpanding the LAP portfolio will be foremost on the Company’s
agenda during the upcoming fiscal. Over the last few years,
the Company established itself as a visible player in the LAP
segment by expanding its reach to 39 locations and primarily
addressing self-employed individuals and MSMEs.
During the year under review, the Company increased its
presence in urban and suburban markets through superior
terms of credit quality and customer retention. �e Company
merged its retail LAP and SME loan businesses to leverage its
distribution networks and strengthen cost management. �e
result: the business reported a combined portfolio expansion
of 38%.
Going ahead, the Company expects to capitalise on the retail
loan segment, enhance credit quality, reduce turnaround
time, increase suburban market share, strengthen channel
engagement and enhance customer satisfaction.
Commercial vehiclesDuring the fiscal past, Fullerton India turned around its
commercial vehicle financing business by deploying a ‘sale-
and-collect’ model, recovering dues better and leveraging
market improvement. �e Company focused on asset
refinancing and offering new vehicle loans to retail customers
owning up to five vehicles. �e result: disbursals grew 78%
and portfolio grew by 61% accompanied by a significant credit
quality improvement.
With market conditions all set to improve, the Company will
persist with the ‘sale-and-collect’ mode, expand its footprint
to 26 locations and penetrate deeper into existing locations.
Business segment snapshot
Segment No of branches
Products Disbursal (J lakh) FY2016
Net Revenue FY2016 (H lakhs )
Urban business 223 Personal loans, loan against
property, SME loans and consumer
vehicle financing
5,45,811 83,575
Rural business 265 Mortgage loans, low value
loans, machinery loans, business
loans, micro-entrepreneur loans
3,11,424 49,050
FY FY2013 FY2014 FY2015 FY2016
Urban Branches 238 219 214 223
Rural Branches 123 178 223 265
Total Branches 361 397 437 488
47Annual Report 2016 Fullerton India Credit Company Limited
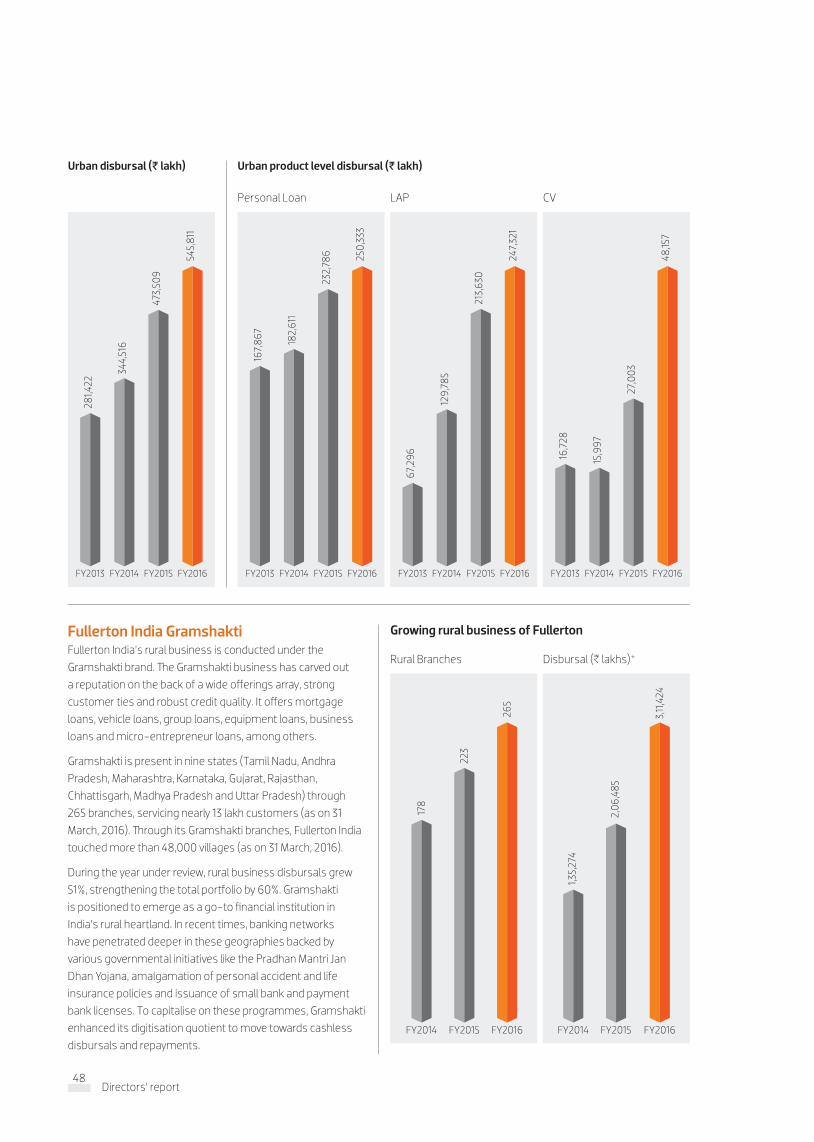
Fullerton India GramshaktiFullerton India’s rural business is conducted under the Gramshakti brand. �e Gramshakti business has carved out a reputation on the back of a wide offerings array, strong customer ties and robust credit quality. It offers mortgage loans, vehicle loans, group loans, equipment loans, business loans and micro-entrepreneur loans, among others.
Gramshakti is present in nine states (Tamil Nadu, Andhra Pradesh, Maharashtra, Karnataka, Gujarat, Rajasthan, Chhattisgarh, Madhya Pradesh and Uttar Pradesh) through 265 branches, servicing nearly 13 lakh customers (as on 31 March, 2016). �rough its Gramshakti branches, Fullerton India touched more than 48,000 villages (as on 31 March, 2016).
During the year under review, rural business disbursals grew 51%, strengthening the total portfolio by 60%. Gramshakti is positioned to emerge as a go-to financial institution in India’s rural heartland. In recent times, banking networks have penetrated deeper in these geographies backed by various governmental initiatives like the Pradhan Mantri Jan Dhan Yojana, amalgamation of personal accident and life insurance policies and issuance of small bank and payment bank licenses. To capitalise on these programmes, Gramshakti enhanced its digitisation quotient to move towards cashless disbursals and repayments.
Growing rural business of Fullerton
Urban product level disbursal (J lakh) Urban disbursal (J lakh)
Disbursal (B lakhs)*
FY2014
1,35,
274
FY2015
2,06
,485
FY2016
3,11
,424
Rural Branches
FY2014
178
FY2015
223
FY2016
265
CV
FY2016
48,15
7
FY2015
27,0
03
FY2014
15,9
97
FY201316
,728
LAP
FY2016
247,
321
FY2015
213,
630
FY2014
129,
785
FY2013
67,2
96
Personal Loan
FY2016
250,
333
FY2015
232,
786
FY2014
182,
611
FY2013
167,
867
FY2016
545,
811
FY2015
473,
509
FY2014
344,
516
FY2013
281,4
22
48Directors’ report

Product-wise disbursal (J lakh) Urban product level disbursal (J lakh)
GEL
FY2013 FY2014 FY2015 FY20166,
946
16,8
93
33,5
67
52,3
08
Two Wheeler Financing
FY2013 FY2014 FY2015 FY2016
5,33
0
8,39
5
11,2
84
15,5
81
Mortgage
FY2016
11,4
68
FY2015
1,629
FY2014
152
FY2013
15
Group Financing
FY2014 FY2015 FY2016FY2013
69,2
69
1,05,
853
1,54,
361
2,24
,904
Merchandise Loan
FY2016
5,65
5
FY2015
3,84
2
FY2014
2,64
2
FY2013
675
CV
FY2016
1,432
FY2015
1,725
FY2014
1,339
FY2013
293
49Annual Report 2016 Fullerton India Credit Company Limited

Fullerton India Home Finance - GrihashaktiFullerton India launched its housing finance business in Dec
2015 under the brand name ‘Grihashakti’ through its wholly-
owned subsidiary Fullerton India Home Finance Company
Limited (FIHFC). Grihashakti has built a portfolio of B24.2 crore
in FY2016 and is present in 20 cities across seven states
(Maharashtra, Gujarat, Madhya Pradesh, Rajasthan, Tamil Nadu,
Karnataka and West Bengal). �e Company carved a niche in
the small-to-medium ticket space where the average ticket
size was B16 lakh as of March 2016. �e salaried-to-self-
employed ratio was 40:60; average loan-to-value was 75%.
A large part of the growth was derived from reaching new
customers; a small part was derived from an increase in ticket
sizes. �e average customer age was 41 years; average loan
tenure was 15 years.
Digitisation�e world is passing through a digital revolution. �e World
Development Report 2016 released by the World Bank states
that more than 40% of the world’s population has access to
the internet. Among the poorest 20% of households, nearly
70% own a mobile phone. �e penetration of mobile phones
has led to a rise in digital banking and related financial services.
Over the next two years, banks in the US and Western Europe
are expected to generate 50% of their revenues through digital
sales.
While the global internet penetration increased seven-fold
from 6.5% to 43% between 2000 and 2015, Indian penetration
moved from less than 1% to 30%
(Source: ICT Facts and Figures, International
Telecommunications Union, May 2015)
Fullerton India is uniquely positioned to capitalise on this digital
revolution on account of its entrenched presence in urban and
rural areas. �e Company is adopting futuristic technologies
in anticipation of the digital revolution in the lending business.
During the year under review, the Company made significant
progress in the adoption of a digital culture and launched
customer-oriented digital initiatives as follows:
Launched an e-loan platform that allowed urban customers
to get in-principle approvals on loan applications instantly
and allow the Company to credit money faster to customer
accounts. �is allowed existing clients to access loan details
without much hassle.
Started collecting data generated via the digital footprints of
customers, using it to arrive at better and faster decisions.
Deployed the cashless mode for rural loan disbursals and
collections, thereby boosting systemic efficiency and paperless
environment.
Complemented processes by upgrading the internal digital
platform and honing skills to improve service delivery.
Risk managementFullerton India is exposed to various risks like- credit risks
originating from change in economic conditions, liquidity risks
arising from monetary actions, operations risks arising from
a distributed setup and the resultant impact of the same on
the business and its people. �e Company addresses all these
risks judiciously and has a well-defined risk appetite framework
that influences and shapes the portfolio mix, optimises
enterprise wide risks and returns and ensures adequate capital
and resource deployment.
�e robustness of Fullerton India’s risk management was
validated through a 43% increase in profit before tax and
increase in ‘Return on Average Equity’ to 22.0% while net
non-performing assets contained at 1.28%. �e Company
mitigated portfolio risk by extending from a single-product
(personal loans) to a multiple-product portfolio. �e
proportion of revenues accounted by this multiple- products
portfolio increased, as did the proportion of secured lending.
�e Company’s analytics team evaluated prevailing realities
to usher policy changes, price products and assess the
creditworthiness of first-time borrowers from Tier-II and III
locations, driving monthly disbursals beyond B700 crore.
�e highlight of the Company’s risk management was the
development of a recession loss multiplier model in line
with Basel-II requirements. �is was based on the concept
of ‘lifetime losses’, which suggests that the losses incurred
cannot exceed a year’s operating profit during recession
periods. �e Company also made an extensive use of
information provided by the Credit Bureau while assigning
risk profiles to customers (for a more comprehensive
understanding of the Company’s risk management process,
please read the standalone section on risk management).
50Directors’ report

Operating Results Information(H in lakhs, except percentages)
Particulars FY2015 FY2016 % change
Interest Income 1,56,717 2,03,785 30.0
Interest Expense 70,860 95,076 34.2
Net interest income 85,857 1,08,710 26.6
Non-interest income
- Fee income 6,822 12,048 76.6
- Assignment Income 453 1,161 156.2
- Profit on Sale of Investment 1,941 3,798 95.6
- Other income 1 6,091 6,901 13.3
Operating income 1,01,164 1,32,618 31.1
Operating expenses 56,648 69,088 22.0
Operating profit 44,516 63,530 42.7
Provisions and write-offs (net of write-backs) 14,420 20,516 42.3
Profit before tax 30,096 43,014 42.9
Tax, including deferred tax - 3,256 -
Profit after tax 30,096 39,758 32.1
Note:
1. Includes Commission on Life Insurance/General Insurance/Sale of �ird Party Products and Ancillary Income from operations e.g.
foreclosure, bounce, penal etc.
Net interest income and spread analysis
�e following table sets forth the net interest income and spread analysis.(H in lakhs, except percentages)
Particulars FY2015 FY2016 % change
Interest income 1,56,717 2,03,785 30.0
Interest expense 70,860 95,076 34.2
Net Interest income 85,857 1,08,710 26.6
Average interest-earning assets 1 7,89,422 11,28,512 43.0
Net interest margin 2 10.9% 9.6% -
Note:
1. Average daily balances of interest-earning assets includes loans (net of write-offs) and interest bearing investments
2. Net interest margin equals net interest income divided by average interest-earning assets.
Net interest income for the FY2016 was B1,08,710 lakh (B85,857 lakh in FY2015) on the back of a 43.0% increase in average interest-
earning assets.
�e yield on interest-earning assets declined from 19.9% in FY2015 to 18.1% in FY2016, in line with general decline in interest rate
and change in product mix, i.e. increase in secured assets. �is was partially compensated by reduction of cost of funds from 11% in
FY2015 to 10.2% in FY2016, resulting in decrease in interest margin by 1.2%.
Standalone financials as per Indian GAAPAnalysis of the Financial Statements �e Company continue its growth momentum during FY2016, which is an outcome of several initiatives taken over the last few
years, since the turnaround began in 2010/2011. FICC’s profit after tax increased 32%, to B39,758 lakh in FY2016 from B30,096 lakh
in FY2015.
51Annual Report 2016 Fullerton India Credit Company Limited

Particulars FY2015 FY2016 % change
Employee benefit expense 29,556 35,942 21.6
Depreciation 2,309 2,434 5.4
Other administrative expenses 24,783 30,712 23.9
Total non-interest expense 56,648 69,088 22.0
Provisions and write-offs 14,420 20,516 42.3
Increase in Fee income by 76.6% represents increase in average earning assets by 43.0% and recognizing upfront income of B342
lakh, on account of Assignment/Securitization during FY2016.
Profit on Sale of Investment (Investment income) increased primarily due to increase in investment balances to support enhanced
liquidity measures.
Assignment income increased from B453 lakh in FY2015 to B1,161 lakh in FY2016, in line with new assignment deals done during
FY2016 (more explained in the Funding and Liquidity management section).
Non-interest expense
�e following table sets forth the principal components of non-interest expense.
Employee expenses for FY2016 increased 21.6% over FY2015 due to an increase in employees from 7,244 to 8,738. Employee costs
accounted for 52% of total non-interest expense for FY2016 which is same as was in previous year. Other administrative expenses
increased 23.9% from B24,783 lakh in FY2015 to B30,712 lakh in FY2016, primarily in Lead Generation expense of B2,892 lakh,
Technology cost of B542 lakh, Corporate Social Responsibility of B424 lakh.
Particulars FY2015 FY2016 % change
Fee income 1 6,822 12,048 76.6
Assignment Income 453 1,161 156.2
Profit on Sale of Investment 1,941 3,798 95.6
Other income 2 6,091 6,901 13.3
Total Non-Interest Income 15,307 23,908 56.2
Note: Average balances are the daily averages of balances.
Average advances increased 36.0%, from B7,04,797 lakh in FY2015 to B9,58,484 lakh in FY2016. Growth was contributed by retail
secured businesses and rural loans. Increase in average interest earning investments, to support enhanced liquidity measures and
growth in advances.
Non-interest income
�e following tables set forth the principal components of non-interest income.
Notes:
1. Fee Income includes Processing Fees, Document Fees and Stamping Fees.
2. Other Income includes Commission on Life Insurance/General Insurance/IHO/Sale of �ird Party Products and other ancillary
income from operations.
Particulars FY2015 FY2016 % change
Advances 7,04,797 9,58,484 36.0
Interest earning investments 54,423 1,12,617 106.9
Other interest earning assets 30,203 57,411 90.1
Total interest earning assets 7,89,422 11,28,512 43.0
�e following table sets forth the trend in average interest-earning assets and average interest-bearing liabilities.
(H in lakhs, except percentages)
(H in lakhs, except percentages)
(H in lakhs, except percentages)
52Directors’ report

(H in lakhs, except percentages)
(H in lakhs, except percentages)
Assets At 31 March, 2015 At 31 March, 2016 % change
Cash and Bank Balances 54,051 80,862 49.6
Investments 51,689 95,501 84.8
- Government Securities 522 0 (100.0)
- Certificate of Deposits / NCD’s 30,593 69,075 125.8
- Equity / Preference investment 1,005 6,005 497.5
- Other investments 19,569 20,422 4.4
Advances 8,60,976 11,03,736 28.2
Fixed assets (including leased assets) 4,655 5,377 15.5
Other assets 42,574 59,158 39.0
Total assets 10,13,944 13,44,634 32.6
Provisions and write-off consisting of bad debt write off (net of recoveries), specific provisions for non-performing assets,
provisions for standard assets and provision for diminishing investment value, increased from B14,420 lakh to B20,516 lakh for
FY2016. �is includes increase provisions of B3,264 lakh, on account of change in Provision and SAP estimate during the year.
Financial conditionAssets�e following table sets forth the principal components of assets.
Note: All amounts have been rounded off to the nearest lakh.
Total assets increased 32.6% from B10,13,944 lakh at 31 March, 2015 to B13,44,634 lakh at 31 March, 2016, primarily due to an
increase in advances. Advances increased 28.2% from B8,60,976 lakh at 31 March, 2015 to B11,03,736 lakh at 31 March, 2016, primarily
due to an increase in loans against property portfolio and rural loan book.
Total investments increased 84.8% from B51,689 lakh at 31 March, 2015 to B95,501 lakh at 31 March, 2016, primarily due to the
Company’s policy of maintaining adequate liquidity to fund prospective liability for repayments, asset building (explained further
in the Funding and Liquidity) and infusion of equity capital of B5,000 lakh in subsidiary company i.e. Fullerton India Home Finance
Company Ltd.
Asset quality and composition
�e following table sets forth, at the dates indicated, the composition of outstanding portfolio.
Note:
1. Personal Loans includes Group Loans
Particulars
As on 31 March, 2015 As on March 31, 2016
Total Retail Advances
% of Total Retail
Advances
Total Retail Advances
% of Total Retail
Advances
Personal Loans 1 4,70,287 54.6 5,73,193 51.9
LAP 3,26,384 37.9 4,38,500 39.7
Two Wheeler 15,440 1.8 17,425 1.6
CV 45,342 5.3 70,265 6.4
Others 3,522 0.4 4,353 0.4
Total portfolio 8,60,976 100.0 1,103,736 100.0
53Annual Report 2016 Fullerton India Credit Company Limited

(H in lakhs, except percentages)
Liabilities At 31 March, 2015 At 31 March, 2016 % change
Equity Share Capital 1,85,866 1,92,116 3.4
Reserves (29,131) 19,377 (166.5)
Borrowings (excluding subordinated debt) 7,42,203 9,55,213 28.7
- Bank Loans 4,46,142 5,49,036 23.1
- Non-Convertible Debentures 2,07,150 2,96,990 43.4
- Commercial Paper 88,910 1,09,187 22.8
Subordinated debt (included in Tier-2 capital) 30,000 62,000 106.7
- Non-Convertible Debentures 30,000 62,000 106.7
Other liabilities 85,006 1,15,928 36.4
Total liabilities 10,13,944 13,44,634 32.6
Note: All amounts have been rounded off to the nearest lakh.
�e ratio of net NPAs to total customer outstanding reduced to 1.28% at 31 March, 2016 compared to 1.41% for the period ending
31 March, 2015. During FY2016, the Company wrote-off NPAs with an aggregate outstanding of B24,210 lakh compared to B20,068
lakh during FY2015.
FICCL’s provision coverage ratio (i.e. total provisions made against NPAs and prudential write-offs as a percentage of gross NPAs
and prudential write-offs) at 31 March, 2016 was 69%. At 31 March, 2016, total general provision held against standard assets was
B8,460 lakh compared with B5,165 lakh at 31 March, 2015.
Liabilities�e following table sets forth the principal components of liabilities (including capital and reserves).
Classification of loans�e Company classifies assets as performing and non-performing more conservatively than RBI guidelines for NBFCs. An asset is
classified as non-performing if any amount of interest or principal remains overdue for more than 90 days (compared to 150 days
as prescribed by RBI for 31 March, 2016).
Once an account becomes non-performing due to delinquency, the Company treats it as non-performing until the status for all
loans of the customer comes to 0 days past due. For the accounts tagged as non-performing due to settlement/ restructuring,
than that account will continue to be treated as non-performing irrespective of the delinquency status till the closure of loan /
recognition of loss.
�e following table sets forth, at the dates indicated, information regarding the asset classification of gross non-performing
assets.(H in lakhs)
Particulars 31 March, 2015 31 March, 2016
Non-performing assets
Sub-standard assets 15,918 20,381
Doubtful assets 767 1,111
Total non-performing assets 16,685 21,492
Year Ended Gross NPA Net NPA Total customers
outstanding
% of net NPA to total Customer
outstanding
31 March, 2015 16,685 12,096 8,60,976 1.41%
31 March, 2016 21,492 14,086 11,03,736 1.28%
�e following table sets forth information regarding non-performing assets (NPAs). (H in lakhs, except percentages)
54Directors’ report

Total liabilities (including capital and reserves) increased 32.6% from B10,13,944 lakh at 31 March, 2015 to B13,44,634 lakh at 31 March,
2016 following additional capital infusion and increase in borrowings.
Key ratios�e following table sets forth key financial ratios:
Notes
1. Return on average equity is the ratio of the net profit after tax to the averages of monthly balances of equity share capital and
reserves.
2. Return on average assets is the ratio of the net profit after tax to average monthly balances of total assets.
3. Cost represents operating expense. Income represents net interest income plus non-interest income.
Particulars FY 2015 FY 2016
Capital Adequacy – Total (%) 19.6 21.9
Return on average equity (%) 1 21.5 22.0
Return on average assets (%) 2 3.6 3.4
Earnings per share (B) 1.6 2.1
Book value per share (B) 7.8 10.3
Cost to income (%) 3 56.0 52.1
�e total capital adequacy ratio, computed in accordance
with RBI guidelines, improved by 2.3% and was at a 21.9% as
at 31 March, 2016, with a Tier-1 capital adequacy ratio of 16.1%
compared to a total capital adequacy ratio of 19.6% and Tier-1
capital adequacy ratio of 15.9% as at 31 March, 2015. �is was
mainly attributable to additional equity infusion of B15,000 lakh
by parent company and healthy internal accruals.
Return on average equity (ROE) increased to 22.0% as
compared to 21.5% previous year, indicating an increase of 50
basis points.
Funding/ Liquidity ManagementLiquidity management remained a key focus area. �e
conservative liquidity management measured by several
metrics, including long term to short term ratio, liquidity buffer
(in number of months), single lender limit, cash flow and pricing
gap mismatches continued with oversight from the Board and
its relevant committees.
Across several benchmarks, additional measures were
added this year to mitigate liquidity risk. �ese include an
emphasis on pool sale via Direct Assignment/ Securitization
aggregating B53,192 lakh, which enhances returns, preserving
borrowing capacity, matching assets and liabilities while
being capital accretive. �e Company also concluded a
maiden Securitization transaction via issue of Pass-through
certificates. As at 31 March, 2016 the assigned/ securitized
assets aggregated to B47,079 lakh.
Additionally, this year long tenor Subordinated Bonds eligible
for Tier II capital aggregating B32,000 lakh were raised
augmenting Capital Adequacy Ratio (CAR). Consequently
the subordinated debt outstanding was B62,000 lakh. Long
tenor funding from International Finance Corporation (IFC),
World Bank Group amounting to B45,000 lakh was concluded
thereby initiating a key Developmental Financial Institutions
relationship. �is year, several Insurance companies were
introduced as lenders. �is segment is traditionally seen as
durable, medium-term financing partners. Overall more than
twenty institutional lenders were added further diversifying the
borrowing profile.
Fee paying, committed lines from large local banks were
added this year, thereby de-risking the contingency funding
plan. More than half the Company’s borrowing is now sourced
from banks totaling over 35, lending stability and renewability
to the funding profile. 85% of the incremental bank borrowing
came from existing lenders indicating increasing strong
endorsement of the Company’s fundamentals.
Several funding cost reduction initiatives were taken this year
resulting in an overall decrease of 80 basis points in borrowing
cost. �ese included retiring of high cost debt by buyback,
prepayment and spread reduction by bankers. �e Company
maintained adequate liquidity buffers in liquid assets to remain
funded for lending and repayments. In times of anticipated
volatility these were dynamically increased to reduce funding
risks. �e Company further minimized the mismatch between
assets and liabilities tenor by increasing liability tenor to 40
months – now matching the asset profile.
55Annual Report 2016 Fullerton India Credit Company Limited
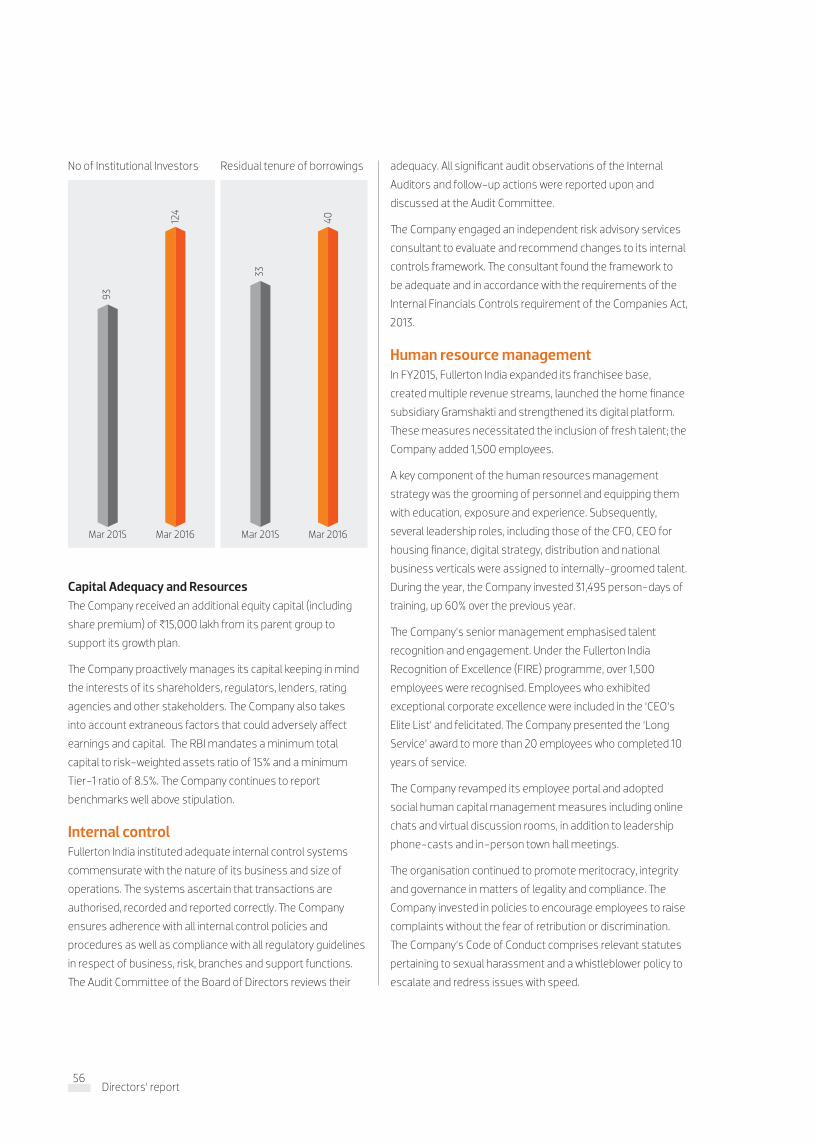
adequacy. All significant audit observations of the Internal
Auditors and follow-up actions were reported upon and
discussed at the Audit Committee.
�e Company engaged an independent risk advisory services
consultant to evaluate and recommend changes to its internal
controls framework. �e consultant found the framework to
be adequate and in accordance with the requirements of the
Internal Financials Controls requirement of the Companies Act,
2013.
Human resource managementIn FY2015, Fullerton India expanded its franchisee base,
created multiple revenue streams, launched the home finance
subsidiary Gramshakti and strengthened its digital platform.
�ese measures necessitated the inclusion of fresh talent; the
Company added 1,500 employees.
A key component of the human resources management
strategy was the grooming of personnel and equipping them
with education, exposure and experience. Subsequently,
several leadership roles, including those of the CFO, CEO for
housing finance, digital strategy, distribution and national
business verticals were assigned to internally-groomed talent.
During the year, the Company invested 31,495 person-days of
training, up 60% over the previous year.
�e Company’s senior management emphasised talent
recognition and engagement. Under the Fullerton India
Recognition of Excellence (FIRE) programme, over 1,500
employees were recognised. Employees who exhibited
exceptional corporate excellence were included in the ‘CEO’s
Elite List’ and felicitated. �e Company presented the ‘Long
Service’ award to more than 20 employees who completed 10
years of service.
�e Company revamped its employee portal and adopted
social human capital management measures including online
chats and virtual discussion rooms, in addition to leadership
phone-casts and in-person town hall meetings.
�e organisation continued to promote meritocracy, integrity
and governance in matters of legality and compliance. �e
Company invested in policies to encourage employees to raise
complaints without the fear of retribution or discrimination.
�e Company’s Code of Conduct comprises relevant statutes
pertaining to sexual harassment and a whistleblower policy to
escalate and redress issues with speed.
Capital Adequacy and Resources �e Company received an additional equity capital (including
share premium) of B15,000 lakh from its parent group to
support its growth plan.
�e Company proactively manages its capital keeping in mind
the interests of its shareholders, regulators, lenders, rating
agencies and other stakeholders. �e Company also takes
into account extraneous factors that could adversely affect
earnings and capital. �e RBI mandates a minimum total
capital to risk-weighted assets ratio of 15% and a minimum
Tier-1 ratio of 8.5%. �e Company continues to report
benchmarks well above stipulation.
Internal controlFullerton India instituted adequate internal control systems
commensurate with the nature of its business and size of
operations. �e systems ascertain that transactions are
authorised, recorded and reported correctly. �e Company
ensures adherence with all internal control policies and
procedures as well as compliance with all regulatory guidelines
in respect of business, risk, branches and support functions.
�e Audit Committee of the Board of Directors reviews their
No of Institutional Investors Residual tenure of borrowings
Mar 2015
93
Mar 2016
124
Mar 2015
33
Mar 2016
40
56Directors’ report

Report onCorporate Governance
I. Corporate Governance Philosophy and PracticeFullerton India Credit Company Ltd (FICCL) believes in adopting and adhering to the best recognized
corporate governance practices and continuously benchmarks itself against each such practice. It also
understands and respects its fiduciary role and responsibility towards its shareholders, customers,
employees and bankers and strives hard to meet their expectations.
�e Company believes that best Board practices and transparent disclosures are necessary for
creating shareholders’ value. �e Company has infused the philosophy of corporate governance
into all its activities. �e philosophy on corporate governance is an important tool for shareholders’
protection and maximization of their long term values. �e cardinal principles such as independence,
accountability, responsibility, transparency, fair and timely disclosures, credibility, etc., serve as the
means for implementing the philosophy of corporate governance in letter and spirit. In addition to
compliance with regulatory requirements, FICCL endeavors to ensure highest standards of ethical and
responsible conduct.
�e Company continuously focuses on upgrading its governance practices and systems to effectively
meet the new challenges faced by the Company. It is focused on raising the standards of corporate
governance and adopting best systems and procedures. It is also committed to achieve and maintain
the highest standards of corporate governance by timely and accurate disclosure of information
regarding the performance of the Company.
�e constitution of the Board and its committees are in compliance with the provisions of the
Companies Act, 2013 and the RBI regulations. Although the SEBI regulations as regards corporate
governance guidelines which are applicable to the equity listed companies are applicable to FICCL, as
its equity shares are not listed on any stock exchange, the Company still voluntarily follows the spirit of
regulations to the extent possible.
II. Board of Directors �e Corporate Governance principles of the Company ensure that the Board remains informed,
independent and provides guidance to the Company. Further the Board is fully aware of its fiduciary
responsibilities and recognizes its responsibilities to stakeholders to uphold the highest standards in all
matters concerning FICCL.
All the Directors of the Company are well qualified persons of proven competence and possess the
highest level of personal and professional ethics, integrity and values. �e Directors exercise their
objective judgment independently. �e Board is committed towards representing the long term
interests of its stakeholders. �e Board members actively participate in all strategic issues which are
crucial for the long term development of the organization.
Annexure II to the Directors’ Report
57Annual Report 2016 Fullerton India Credit Company Limited

As on date, the Board comprises eight Directors, with one
Executive Director (Managing Director), four Independent
Directors and three Non-Executive Directors. �e Chairman of
the Board is a Non-Executive Director.
None of the Independent and Non-Executive Directors have
any material pecuniary relationship or transactions with the
Company.
Four Board meetings were held during the year on;i. 20 May, 2015
ii. 26 August, 2015
iii. 17 December, 2015 and
iv. 15 March, 2016
�e time gap between any two meetings was less than 120
days and at least one meeting was held every quarter.
As a matter of good governance the dates of the Board
meetings are fixed in advance for the full calendar year to
enable maximum attendance and participation from all the
Directors. �e relevant background material of the agenda
items are distributed in advance of the meetings. All material
information is presented for meaningful deliberations at the
meeting. �e Board on a continuous basis reviews the actions
and decisions taken by it and by the Committees constituted
by it.
�e Board members meet the senior management personnel
from time to time.
�e names of the Directors, attendance at Board Meetings and Annual General Meeting during the year, the number of other
Directorships and Committee Memberships held by them as on 31 March, 2016 are as follows:
Name of the DirectorCategory of Directorship (i)
Board meetings attended out of 4 held
Attendance at the last AGM
held on 16 July, 2015
Number of other Directorships
Number of other Committee memberships(iv)
in other Indian public limited companies (ii)
in other Companies (iii)
Mr. Gan Chee Yen, Chairman NED 3/4 Absent Nil 12 Nil
Mr. Rajeev Kakar NED 3/4 Absent 1 1 2
Mr. Kenneth ho (Appointed w.e.f. November 20, 2015)
NED 2/4 N.A. 1 Nil Nil
Mr. Ferdy Khouw (Resigned w.e.f. June 12, 2015)
NED 1/4 N.A. Nil Nil Nil
Mr. Boon Leng Quah Appointed w.e.f. May 20, 2015 and Resigned w.e.f October 5, 2015)
NED 1/4 Absent Nil 4 Nil
Mr. Shantanu Mitra MD (ED) 4/4 Present 1 2 1
Dr. Milan Robert Shuster ID 4/4 N.A. 1 Nil 2
Ms. Sudha Pillai ID 4/4 N.A. 6 Nil 3
Ms. Renu Challu ID 4/4 N.A. 7 1 8
Mr. Premod �omas (Appointed w.e.f. October 09, 2015)
ID 2/4 N.A. Nil 3 Nil
Mr. Wilson Chia (Resigned w.e.f. May 21, 2015)
NED 1/4 N.A. Nil 3 Nil
Notes: *”Others” excludes the Company itself
MD – Managing DirectorED – Executive Director NED – Non Executive Director ID – Independent Director
ii. Comprises public limited companies incorporated in India.
iii. Comprises private limited companies incorporated in India, foreign companies and Section 8 companies.
iv. As per the requirement of SEBI (LODR) Regulations, 2015, only membership/chairmanship of the Audit Committee and Shareholders’/Investors Grievance Committee held in public limited companies have been considered.
v. None of the Directors of the Company hold Directorship in more than 10 Public Companies or is a member in more than 10 Committees or acts as Chairman of more than 5 Committees across all companies in which he or she is a Director.
58Directors’ report

Director seeking reappointmentMr. Gan Chee Yen will be retiring at the forthcoming AGM. He
being eligible has offered himself for re-appointment. �e
profile of Mr. Gan Chee Yen is as under:
Mr. Gan is currently working as the CEO at Fullerton Financial
Holdings Pte Ltd. Prior to his current appointment as the
CEO, Mr. Gan was the Co-Chief Investment Officer and Senior
Managing Director, Special Projects at Temasek International.
He joined Temasek in May 2003 as CFO and has since served
in various investments roles as a member of the senior
management team in Temasek.
�e investment clusters he has led included the Financial
Industry portfolio and the Transportation and Logistics
portfolio, before he took on the role of Co-CIO of Temasek
where he anchored several successful investments. He has
also completed his stint as Head of China market.
He has served on the boards of several companies including
Neptune Orient Lines Limited, a global shipping company, and
has been a board member of FFH and a board commissioner
of Bank Danamon since 2003.
Mr. Gan is a member of the Institute of Singapore Chartered
Accountants. He received his Bachelor of Accountancy from
the National University of Singapore. He has also attended the
Harvard Program for Management Development in September
2001.
Mr. Gan does not hold any shares in the Company.
III. Board Committees(a) Audit Committee
Terms of Reference
�e powers and terms of reference of the Audit Committee are
comprehensive and include the requirements as set by Section
177 of the Companies Act, 2013. �e Committee is vested
with necessary powers as defined in its charter to achieve its
objectives. �e role of the Committee in brief includes the
following:
To review appointment and removal, of Internal and external
auditors
To monitor the auditors’ independence and performance,
and effectiveness of internal and external audit process
To formulate the scope, functioning, periodicity and
methodology for conducting the internal audit and to approve
the internal audit plans
To review financial statements, oversee the financial
reporting process;
Examination of the internal and external auditors’ reports
and findings
Reviewing the adequacy of internal control systems
To review related Party Transactions of the Company
To conduct scrutiny of inter-corporate loans and
investments
To approve valuation of undertakings or assets or net worth
of a company or its liabilities
To oversee the vigil mechanism for directors and employees
To approve provision of any other services by auditors apart
from audit
Composition
�e Audit Committee currently comprises of two Independent
Directors and one Non-Executive Director. All the members
of the Audit Committee are financially literate and persons of
proven competence and integrity. �e Company Secretary acts
as the Secretary to the Committee. �e Statutory Auditors
and Internal Auditors are invited to the meeting to bring out
the issues which they may have with regards to finance,
operations, processes, systems and other allied matters.
�e Audit Committee Meetings were held on the following
dates and the necessary quorum was present at all the
meetings:
i. 20 May, 2015
ii. 26 August, 2015
iii. 10 November, 2015
iv. 17 December, 2015 and
v. 15 March, 2016
�e details of the composition of the Committee and
attendance at its Meetings are set out in the following table:
Name of MemberNumber of Meetings
Attended
Dr. Milan Robert Shuster, Chairman 5/5
Mr. Rajeev Kakar 4/5
Mr. Sudha Pillai 5/5
�e proceedings of the Audit Committee Meetings were noted
by the Board of Directors at their meetings.
(b) Risk Oversight Committee�e Company has a comprehensive, well-established and
detailed risk management framework. �e Company especially
focuses on improving sensitivity to assessment of risks and
improving methods of computation of risk weights, processes
and procedures. �e Company has constituted a Risk Oversight
59Annual Report 2016 Fullerton India Credit Company Limited
Committee to identify, review and control key risk areas,
across the entire organization as per the requirements of RBI
guidelines.
Terms of Reference
Risk Oversight Committee is a dedicated Board-level
committee that monitors the risk management in the
Company. �e risk assessment and mitigation procedures are
reviewed by the Board periodically. �e role of the Committee
in brief includes the following:
Oversee the development of risk policies and strategies
Implement risk policies relevant to all business units
Ensure that all activities are in compliance with the Prudential
Regulations and also within the framework of the policies and
controls established by the relevant units of the Company
Formulate the policy for the consideration of the Board on
client profile, products and risk return matrix on the asset side
Studying the market with regards to interest rate risk,
currency risk and other financial risks
Formulating the policy on raising the resources based on the
perceived risk parameters
Sanction of the credit limits within ceiling prescribed by the
Board
Determining the terms of the sanction such as the interest
rate, security, repayment, documents, etc. within the overall
credit policy of the Company
�e Risk Oversight Committee (ROC) controls and manages
the inherent risks relating to the Company’s activities in the
following categories:
Credit Risk
Market Risk / Liquidity Risk
Liquidity Risk Management
Currency Risk
Interest Rate Risk
Operational Risk
Regulatory / Reputational Risk, etc.
Composition
�e Risk Oversight Committee currently comprises of two
Independent Directors and two Non-Executive Directors.
Meetings
�e Risk Oversight Committee meetings were held on the
following dates and the necessary quorum was present at all
the meetings:
i. 20 May, 2015
ii. 26 August, 2015
iii. 17 December, 2015 and
iv. 15 March, 2016
�e details of the composition of the Committee and
attendance at its Meetings are set out in the following table:
Name of MemberNumber of Meetings
Attended
Mr. Wilson Chia, Ex Chairman (Resigned w.e.f. May 21, 2015)
1/1
Mr. Rajeev Kakar 3/4
Mr. Boon Leng Quah (Appointed as chairman w.e.f May 20, 2015 and resigned w.e.f October 5, 2015)
1/1
Ms. Renu Challu 4/4
Mr. Gan Chee Yen, Chairman (Appointed as chairman w.e.f November 20, 2015)
1/2
Mr. Premod �omas (Appointed w.e.f August 26, 2015)
2/2
�e proceedings of the Risk Oversight Committee Meetings
were noted by the Board of Directors at its meetings. �e
Company Secretary acts as secretary to the Committee.
(c) Nomination and Remuneration Committee �e Company has a Nomination & Remuneration Committee
(NRC) pursuant to the requirements of Section 178 of the
Companies Act, 2013. �e Committee is vested with necessary
powers, as per its Charter approved by the Board.
�e Terms of Reference of Nomination and Remuneration
Committee in brief are as under:
Nomination Functions:
Review the structure, size and composition of the Board
Formulate the criteria for evaluation for determining
qualifications, positive attributes and independence of
directors
Be responsible for identifying and nominating for the
approval of the Board, persons who are qualified to become
directors and who are “fit and proper as director” and may
be appointed in senior management in accordance with the
criteria laid down
Carry out evaluation of the directors’ performance
Evaluate suitable candidates and approve the appointment
of the CEO and the Company’s Leadership Team members
60Directors’ report

Formulate plans for succession for the CEO and the
Leadership Team members
Re-appoint any non-executive director at the conclusion of
his or her specified term of office.
Remuneration Functions:
Recommend to the Board a policy, relating to the
remuneration for the directors, key managerial personnel and
other employees
Determine and recommend to the Board the remuneration
payable to the directors
Recommend the compensation for the CEO & MD, and each
of the Leadership Team members
Recommend the compensation strategy and budget
covering all employees of the Company
Review deployment of key Human Capital strategies and
tools.
Composition
�e Nomination and Remuneration Committee currently
comprises of two Independent Directors and one Non-
Executive Director.
Meetings
�e Nomination and Remuneration Committee meetings were
held on the following dates and the necessary quorum was
present at all the meetings:
i. 20 May, 2015
ii. 26 August, 2015 and
iii. 15 March, 2016
�e Committee meets on need basis.
�e details of the composition of the Committee and
attendance at its meetings are set out in the following table:
Name of MemberNumber of Meetings
Attended
Mr. Wilson Chia, Ex Chairman (Resigned w.e.f. 21 May, 2015)
1/1
Mr. Gan Chee Yen 2/3
Mr. Boon Leng (Danny) Quah (Appointed as Chairman w.e.f 20 May, 2015 and Resigned. w.e.f. 5 October, 2015)
1/1
Dr. Milan Robert Shuster, Chairman(Appointed as Chairman w.e.f 20 November, 2015)
3/3
Ms. Renu Challu 3/3
�e proceedings of the Nomination and Remuneration
Committee meetings were noted by the Board of Directors at
its meetings.
(d) Corporate Social Responsibility (CSR) Committee�e Company has a Corporate Social Responsibility (CSR)
Committee to comply with the requirements of Section 135
of the Companies Act, 2013. �e Committee is vested with
necessary powers, as laid down in its charter to achieve its
objectives.
Terms of Reference
�e Terms of Reference of the CSR Committee in brief are as
under:
To recommend to the board the Company’s CSR policy
To monitor implementation of the CSR Policy of the
Company, to review CSR programs, reports on CSR activities,
recommend changes or alterations if any;
To recommend the amount of expenditure to be incurred on
different CSR activities
To institute a transparent monitoring mechanism for
ensuring implementation of the projects / programs /
activities proposed to be undertaken by the Company and
review the amount spent on them
To review synergy or alignment for various CSR activities
along with partners
To review and finalise the Annual CSR Report reflecting
fairly the Company’s CSR approach, policies, systems and
performance.
Composition
�e CSR Committee currently comprises of two independent
directors and one Non-Executive Director.
Meetings
�e CSR Committee meetings were held on the following dates
and the necessary quorum was present at all the meetings:
i. 26 August, 2015 and
ii. 15 March, 2016
�e Committee meets on need basis.
61Annual Report 2016 Fullerton India Credit Company Limited

�e details of the composition of the Committee and
attendance at its Meetings are set out in the following table:
Name of MemberNumber of Meetings
Attended
Mr. Gan Chee Yen (Chairman) 1/2
Ms. Sudha Pillai 2/2
Ms. Renu Challu 2/2
�e proceedings of the CSR Committee Meeting were noted by
the Board of Directors at its meeting.
Your Company has other management committees such
as Asset Liability Committee (ALCO) formed as per the
NBFC’s Prudential Norms (Reserve Bank) Directions, 1998, as
amended from time to time.
IV. Code of Conduct�e Company adopted the code of conduct approved by the
Board of Directors which is binding on the employees of the
Company and the same has been complied with. Code of
conduct is signed off on an annual basis every year.
V. Directors & Officers Liability Insurance coverage�e Company has obtained Directors and Officers Liability
Insurance coverage from HDFC Ergo General Insurance
Company Ltd to the extent of B20 crores along with entity
cover under Employees’ Practices Liability and any other legal
action that might be initiated against the Directors.
VI. General Body Meetings�e details of the General Body Meetings held in the last three financial years are given below:
General Body Meeting Day, Date Time Venue
Eighteenth AGMMonday
16 September, 201311.30 a.m.
Megh Towers, �ird Floor, Old No.307, New No.165,
Poonamallee High Road, Maduravoyal, Chennai – 600095
Extra-Ordinary General MeetingTuesday
29 April, 201411.30 a.m.
Board Room, Floor 6, B wing, Supreme IT Park,
Supreme City, Behind Lake Castle, Powai, Mumbai 400 076
Extra-Ordinary General MeetingTuesday
10 June, 201411.30 a.m.
Board Room, Floor 6, B wing, Supreme IT Park,
Supreme City, Behind Lake Castle, Powai, Mumbai 400 076
Nineteenth AGMWednesday
20 August, 201411.30 a.m.
Megh Towers, �ird Floor, Old No.307, New No.165,
Poonamallee High Road, Maduravoyal, Chennai – 600095
Extra-Ordinary General MeetingTuesday
30 December, 201411.30 a.m.
Board Room, Floor 6, B wing, Supreme IT Park,
Supreme City, Behind Lake Castle, Powai, Mumbai 400 076
Extra-Ordinary General MeetingFriday
24 April, 201511.30 a.m.
Board Room, Floor 6, B wing, Supreme IT Park,
Supreme City, Behind Lake Castle, Powai, Mumbai 400 076
Twentieth AGM�ursday
16 July, 201511.30 a.m.
Megh Towers, �ird Floor, Old No.307, New No.165,
Poonamallee High Road, Maduravoyal, Chennai – 600095
Extra-Ordinary General MeetingFriday
9 October, 201511.30 a.m.
Board Room, Floor 6, B wing, Supreme IT Park,
Supreme City, Behind Lake Castle, Powai, Mumbai 400 076
62Directors’ report

All the resolutions were passed by show of hands and no resolutions were passed by postal ballot.
VII. Disclosuresi. Disclosures on materially significant related party transactions that may have potential conflict with the interests of company at
large:
�e particulars of the transactions between the Company and ‘related parties’ are provided at point 27 of Notes to accounts
published elsewhere in the Annual Report. None of the transactions are likely to have any conflict with Company’s interest.
ii. Details of non-compliance by the Company, penalties, strictures imposed on the Company by Stock Exchange or SEBI or any
statutory authority, on any matter related to capital markets, during the last three years - NIL
VIII. CEO/CFO Certificate:�e CEO and the CFO of the Company have certified to the Board with regard to the financial statements and other matters. �is
certificate is included as Annexure III to the Directors’ Report.
�e details of the special resolutions passed in the General Meetings held in the previous three financial years are given below:
General Body Meeting Day, Date Resolution
Eighteenth AGMMonday 16 September,
2013
To appoint and approve remuneration of Mr. Shantanu Mitra as the
Managing Director of the Company
Extra-Ordinary General
MeetingTuesday 29 April, 2014
To approve changes in the terms and conditions of the appointment
of Mr. Shantanu Mitra as the Managing Director
Extra-Ordinary General
MeetingTuesday 10 June, 2014
Offer of Long Term Non Convertible Redeemable Debentures up to
B5,000 crores on private placement basis
Nineteenth AGMWednesday 20 August,
2014
I. To approve payment of commission to Non-Whole time directors
of the Company.
II. Offer of Long Term Non Convertible Debentures up to B5000
crores on private placement basis
Extra-Ordinary General
MeetingFriday 24 April, 2015
I. To approve increase in the Borrowing limits of the Company from
existing B10,000 Crores to B 20,000 Crores
II. To create charge on Company’s properties
Twentieth AGM �ursday 16 July, 2015
I. To re-appoint Mr. Shantanu Mitra as Managing Director of the
Company
II. To approve offer of Long Term Non Convertible Redeemable
Debentures up to B5,000 crores on private placement basis
63Annual Report 2016 Fullerton India Credit Company Limited

Certification by Chief Executive Officer (CEO) and Chief Financial Officer (CFO)
To,
�e Shareholders and the Board of Directors
Fullerton India Credit Company Limited
We, Shantanu Mitra, Chief Executive Officer & Managing Director and Pankaj Malik, Chief Financial
Officer, of Fullerton India Credit Company Limited, to the best of our knowledge and belief, certify that:
a. We have reviewed the financial statements and the cash flow statements for the year ended 31
March, 2016 (hereinafter referred to as the year) and that to the best of our knowledge and belief:
i. �ese statements do not contain any materially untrue statement or omit any material fact or
contain statements that might be misleading;
ii. �ese statements together present a true and fair view of the Company’s affairs and are in
compliance with existing accounting standards, applicable laws and regulations.
b. �ere are no transactions entered into by the Company during the year which are fraudulent, illegal
or violative of the Company’s internal policies
c. We accept responsibility for establishing and maintaining internal controls for financial reporting
and we have evaluated the effectiveness of internal control systems of the Company pertaining to
financial reporting and have disclosed to the auditors and the Audit Committee, deficiencies in the
design or operation of such internal controls, if any, of which we are aware and have taken requisite
steps to rectify these deficiencies.
d. We have indicated to the Auditors and the Audit Committee;
i. Significant changes in internal control over financial reporting during the year and
ii. Significant changes in accounting policies during the year and the same have been disclosed in
the notes to the financial statements.
e. �ere have been 13 instances of fraud reported by the Company to the Board. �e Company has
taken appropriate legal action against the same. Although the Company is registered as deposit-
taking NBFC, it has not accepted deposits from the public.
Sd/- Sd/-
Shantanu Mitra Pankaj Malik
Chief Executive Officer and Managing Director Chief Financial Officer
Date: May 19, 2016
Place: Mumbai
Annexure III to the Directors’ Report
64Directors’ report

Form No. MR-3
SECRETARIAL AUDIT REPORTFOR THE FINANCIAL YEAR ENDED 31st MARCH, 2016
[Pursuant to Section 204(1) of the Companies Act, 2013 and Rule no.9 of the Companies
(Appointment and Remuneration of Managerial Personnel) Rules, 2014]
To,
�e Members,
Fullerton India Credit Company Limited
We have conducted the secretarial audit of the
compliance of applicable statutory provisions
and the adherence to good corporate practices
by Fullerton India Credit Company Limited
(hereinafter called “the Company”). Secretarial
Audit was conducted in a manner that provided
us a reasonable basis for evaluating the
corporate conducts/statutory compliances and
expressing our opinion thereon.
Based on our verification of the Company’s
books, papers, minute books, forms and
returns filed and other records maintained by
the Company (as per Annexure – 1, hereinafter
referred to as “Books and Papers”) and also
the information provided by the Company, its
officers, agents and authorised representatives
during the conduct of secretarial audit, we
hereby report that in our opinion, the Company
has, during the period covered by our audit,
that is to say, from 1st April, 2015 to 31st March,
2016 (hereinafter referred to as “Audit Period”),
complied with the statutory provisions listed
hereunder and also that the Company has
proper board-processes and compliance-
mechanism in place to the extent, in the manner
and subject to the reporting made hereinafter:
We have examined the Books and Papers
maintained by the Company for the Audit Period
according to the provisions of:
1. �e Companies Act, 2013 (the Act) and the
rules made thereunder;
2. �e Securities Contracts (Regulation) Act,
1956 (SCRA) and the rules made thereunder;
3. �e Depositories Act, 1996 and the
regulations and bye-laws framed
thereunder;
4. �e following regulations and guidelines
prescribed under the Securities and
Exchange Board of India (SEBI) Act, 1992:-
a. �e SEBI (Issue and Listing of Debt
Securities) regulations, 2008;
b. �e SEBI (Registrars to an Issue and
Share Transfer Agents) regulations, 1993
regarding the Companies Act and dealing
with client;
c. �e SEBI (Prohibition of Insider Trading)
regulations, 2015;
d. �e SEBI (Listing Obligations and
Disclosure Requirements) regulations,
2015 to the extent applicable during the
Audit Period.
5. Foreign Exchange Management Act,
1999 and the rules and regulations made
thereunder to the extent of Foreign Direct
Investment;
6. Laws specifically applicable to the industry to
which the Company belongs, as identified by
the management, that is to say:
a. Reserve Bank of India Act, 1934;
Annexure IV to the Directors’ Report
65Annual Report 2016 Fullerton India Credit Company Limited

b. Non-Banking Financial (Deposit accepting or holding)
Companies prudential norms (Reserve Bank)
directions, 2007;
c. Non-Banking Financial Companies Auditor’s Report
(Reserve Bank) directions, 2008;
d. Frauds – future approach towards monitoring of
frauds in NBFCs;
e. Fair Practices Code (FPC) for all NBFCs;
f. Non-Banking Financial Companies – Corporate
Governance (Reserve Bank) Directions, 2015 (CG
Directions);
g. Raising money through private placement by NBFCs-
non convertible debentures;
h. Rounding off transactions to the nearest rupee by
NBFCs;
i. ‘Know Your Customer’ (KYC) guidelines – Anti Money
Laundering (AML) standards -’Prevention of Money
Laundering Act, 2002 - obligations of NBFCs in terms
of rules notified thereunder;
j. Returns to be submitted by NBFCs;
k. Early recognition of financial distress, prompt steps for
resolution and fair recovery for lenders: framework for
Revitalising distressed assets in the economy;
l. �e Insurance Regulatory and Development Authority
(Licensing of Corporate Agents) regulations, 2002;
m. Master circular - allied activities - entry into insurance
business.
We have also examined compliance with the applicable clauses
of the following:
a. Secretarial Standards 1 and 2 issued by the Institute of
Company Secretaries of India;
b. Listing agreement entered into with National Stock
Exchange India Limited for listing of debt securities on the
wholesale debt segment.
We report that during the period under review the Company
has complied with the provisions of the act, rules, regulations,
guidelines, and so on mentioned above.
Management Responsibility:
i. Maintenance of secretarial records is the responsibility of
the management of the Company. Our responsibility is to
express an opinion on these secretarial records based
on our audit;
ii. We have followed the audit practices and the processes as
were appropriate to obtain reasonable assurance about
the correctness of the contents of the secretarial records.
�e verification was done on test basis to ensure that
correct facts are reflected in secretarial records. We believe
that the processes and practices, we followed provide a
reasonable basis for our opinion;
iii. We have not verified the correctness and appropriateness
of financial records and Books of Accounts of the Company
or examined any books, information or statements other
than Books and Papers;
iv. We have not examined any other specific laws except as
mentioned above;
v. Wherever required, we have obtained the management
representation about the compliance of laws, rules and
regulation and happening of events and so on;
vi. �e compliance of the provisions of Corporate and
other applicable laws, rules, regulations, standards is
the responsibility of management. Our examination was
limited to the verification of procedure on test basis;
vii. �e Secretarial Audit report is neither an assurance as to
the future viability of the Company nor of the efficacy or
effectiveness with which the management has conducted
the affairs of the Company.
We further report that:
�e Board of Directors of the Company is duly constituted with
proper balance of Executive Directors, Non-Executive Directors
and Independent Directors. �e changes in the composition of
the Board of Directors that took place during the Audit Period
were carried out in compliance with the provisions of the act.
Adequate notice is given to all directors to schedule the
Board Meetings, agenda and detailed notes on agenda were
sent at least seven days in advance, and a system exists for
seeking and obtaining further information and clarifications
on the agenda items before the meeting and for meaningful
participation at the meeting.
Resolutions have been approved by majority while the
dissenting members’, if any, views are captured and recorded
as part of the minutes.
We further report that there are adequate systems and
processes in the Company commensurate with the size and
operations of the Company to monitor and ensure compliance
with applicable laws, rules, regulations and guidelines.
We further report that during the Audit Period, the Company
has not incurred any specific event/ action listed below
66Directors’ report

that can have a major bearing on the Company’s affairs in
pursuance of the above referred laws, rules, regulations,
guidelines, standards, and so on, except as follows:
i. Rights Issue of Equity Shares:
During the Audit Period, the Company has allotted 6.25
crores equity shares of face value B10 and premium of
B14 per share to Fullerton Financials Holdings Pte. Ltd.,
Singapore (‘FFHPL’) and Angelica Investments Pte. Ltd.,
Singapore (‘AIPL’) by way of rights issue. FFHPL renounced
the shares in favour of AIPL vide its letter dated 28th
October, 2015. AIPL subscribed to both i.e. offered shares
and renounced shares vide its letter dated 4th November,
2015.
ii. Private placement of Non Convertible Debentures:
During the Audit Period, the Company has issued NCDs
amounting to B2393 crores from series 31B to series 37
and subordinate debentures series 5 to series 10.
iii. Increase in borrowing limit to H20,000 crores:
Special resolution, in terms of section 180 (1) (a) &(c) was
passed in the extra ordinary general meeting held on
24th April, 2015 to affirm the borrowing powers of the
Company to the extent of B20,000 crores, as per details
provided in the resolution.
For Vinod Kothari & Company
Practising Company Secretaries
UIN P1996WB042300
Vinita Nair
Partner
Membership No.: A31669
C P No.: 11902
Place: Mumbai
Date: 5th May, 2016
67Annual Report 2016 Fullerton India Credit Company Limited

List of Documents
1. Corporate Matters
1.1 Minutes books of the following Committees were provided:
1.1.1 Board Meeting;
1.1.2 Audit Committee;
1.1.3 Nomination and Remuneration Committee;
1.1.4 Corporate Social Responsibility Committee;
1.1.5 Risk Management Committee;
1.1.6 Asset Liability Management Committee;
1.1.7 General Meeting;
1.2 Agenda papers for Board Meeting along with Notice;
1.3 Annual Report 2015;
1.4 Memorandum and Articles of Association;
1.5 Disclosures under Act, 2013 and Rules made thereunder;
1.6 Policies framed under Act, 2013 and RBI regulations for NBFCs;
1.7 Documents pertaining to Debt Listing Agreement compliance and Listing Regulations;
1.8 Forms and returns filed with the ROC & RBI;
1.9 Documents under SEBI (Prohibition of Insider Trading) Regulations, 2015;
1.10 Documents relating to issue of Non-Convertible Debentures;
1.11 Registers maintained under Companies Act, 2013;
1.12 Loan Agreement.
Annexure I
68Directors’ report

Annexure V to the Directors’ Report
1. A brief outline of the Company’s CSR policy, including overview of projects or programmes proposed to be undertaken and a reference to the website-link to the CSR Policy and projects or programmes.
CSR policy of Fullerton India (brief outline)
i. IntroductionFullerton India Credit Company Ltd. (“Fullerton India”) is committed to growing in a socially and
environmentally responsible manner. With financial inclusion as a guiding business vision, Fullerton
India aims to reach out to the under-banked and unbanked by not just providing them with financial
services but also by enabling the communities with services and skills that would help improve their
standard and quality of living.
�us, Fullerton India’s Corporate Social Responsibility (CSR) – brand named ‘Uday’ initiative aims at
having a long-term sustainable impact on the community. �e CSR initiatives will, however, not directly
relate to (i) the business of the Company and (ii) welfare of its employees.
Uday – Ek Nayi Subhah, - signifying the rising sun, a new dawn.
�e new logo was introduced in March 2016, a strategic CSR brand for showcasing our commitment to
upliftment of the under-privileged community. �e same reason the logo uses orange for the name
and has a bud with the reference of the rising sun. It reinforces our CSR missions
Of education and skill development
Of livelihood enhancement
Of healthcare
We also branded our individual initiatives to build mass connect. Below are the same:
ii. Uday VisionFullerton India’s CSR Vision – Uday, is to enable sustainable development and inclusive growth across
communities through innovative socio-economic and environmental interventions, in fulfillment of its
role as a socially responsible corporate citizen.
iii. Uday ObjectivesFullerton India’s Uday Initiative focuses on the three keys aspects of the community’s development
- social, economic and environment. To achieve long-term sustainable impact on the community,
Fullerton India’s Uday objectives are:
Advance livelihoods through
Identification of technical expertise for guidance and facilitation of programmes
Skill development and capacity building initiatives
Livelihood enhancement and
training programmes
Cattle Care Camps
(Livelihood)
Eye health Environment and Organic
Farming
General health care
69Annual Report 2016 Fullerton India Credit Company Limited

Income enhancement through market linkages, across value chains
Education programmes focusing on enhancement of knowledge leading to up-gradation of skills and empowerment
Improve the social wellbeing of the community through
Health awareness and intervention programmes for community and the under-privileged, with a focus on eye-care and nutrition.
Women and children - focused health interventions through awareness and implementation of programmes enabling adoption
of best health practices
Awareness about preventive healthcare, with a focus on hygiene and clean drinking water.
Adoption of sustainable environmental practices through
Promotion and adoption of environmentally sustainable practices, such as organic farming
Awareness and adoption of green technology and alternative energy through programmes / interventions
iv. Scope�e CSR Policy (the “Policy”) shall be applicable to all CSR initiatives and activities undertaken by Fullerton India and all its employees
for the welfare and sustainable development benefit of different segments of the society at large.
�is Policy is in line with the Section 135 of the Companies Act, 2013 (the “Act”) and the rules made thereunder.
Website link: http://www.fullertonindia.com/community-initiatives/our-csr-mission.aspx
2. �e Composition of the CSR Committee.�e CSR committee consists of 3 members, as below:
a) Mr. Gan Chee Yen (Chairman FICCL)
b) Mrs. Renu Challu (Independent Director)
c) Mrs. Sudha Pillai (Independent Director)
3. Average net profit of the Company for last three financial years
Average net Profit for last three financial years (J) in Cr
Company/Year FY 2013 FY 2014 FY 2015Average for the last three years
Fullerton India 152 188 301 214
4. Prescribed CSR Expenditure (two per cent. of the amount as in item 3 above)B4.28 Crore (2% of B214 Crore)
5. Details of CSR spends during the financial year.a) Total amount to be spent for the financial year: B4.28 cr (budget for current FY) + B1.62 cr (carry forward from FY 2016) = B5.9 cr
b) Amount unspent, if any: B57 lakhs (to be carried forward in FY20 17)
70Directors’ report
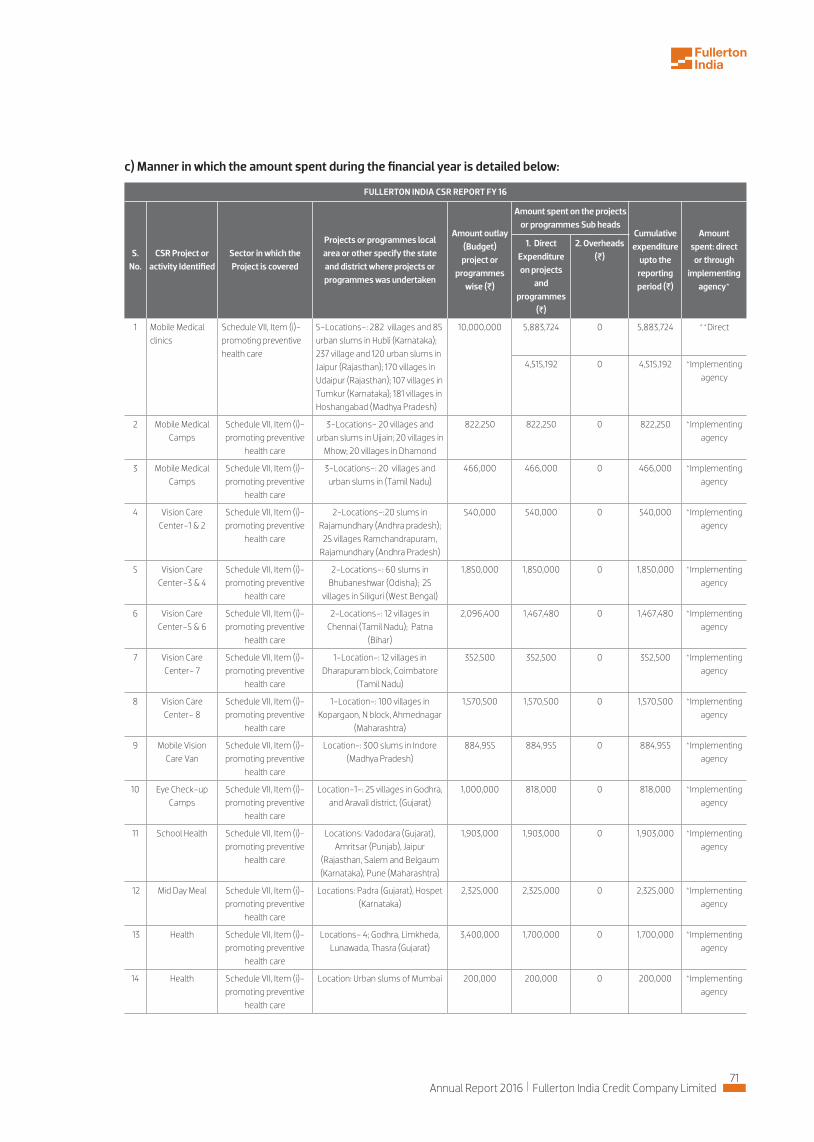
FULLERTON INDIA CSR REPORT FY 16
S. No.
CSR Project or activity Identified
Sector in which the Project is covered
Projects or programmes local area or other specify the state and district where projects or programmes was undertaken
Amount outlay (Budget) project or
programmes wise (J)
Amount spent on the projects or programmes Sub heads
Cumulative expenditure
upto the reporting period (J)
Amount spent: direct
or through implementing
agency*
1. Direct Expenditure on projects
and programmes
(J)
2. Overheads (J)
1 Mobile Medical clinics
Schedule VII, Item (i)- promoting preventive health care
5-Locations-: 282 villages and 85 urban slums in Hubli (Karnataka); 237 village and 120 urban slums in Jaipur (Rajasthan); 170 villages in Udaipur (Rajasthan); 107 villages in Tumkur (Karnataka); 181 villages in Hoshangabad (Madhya Pradesh)
10,000,000 5,883,724 0 5,883,724 **Direct
4,515,192 0 4,515,192 *Implementing agency
2 Mobile Medical Camps
Schedule VII, Item (i)- promoting preventive
health care
3-Locations- 20 villages and urban slums in Ujjain; 20 villages in
Mhow; 20 villages in Dhamond
822,250 822,250 0 822,250 *Implementing agency
3 Mobile Medical Camps
Schedule VII, Item (i)- promoting preventive
health care
3-Locations-: 20 villages and urban slums in (Tamil Nadu)
466,000 466,000 0 466,000 *Implementing agency
4 Vision Care Center-1 & 2
Schedule VII, Item (i)- promoting preventive
health care
2-Locations-:20 slums in Rajamundhary (Andhra pradesh);
25 villages Ramchandrapuram, Rajamundhary (Andhra Pradesh)
540,000 540,000 0 540,000 *Implementing agency
5 Vision Care Center-3 & 4
Schedule VII, Item (i)- promoting preventive
health care
2-Locations-: 60 slums in Bhubaneshwar (Odisha); 25
villages in Siliguri (West Bengal)
1,850,000 1,850,000 0 1,850,000 *Implementing agency
6 Vision Care Center-5 & 6
Schedule VII, Item (i)- promoting preventive
health care
2-Locations-: 12 villages in Chennai (Tamil Nadu); Patna
(Bihar)
2,096,400 1,467,480 0 1,467,480 *Implementing agency
7 Vision Care Center- 7
Schedule VII, Item (i)- promoting preventive
health care
1-Location-: 12 villages in Dharapuram block, Coimbatore
(Tamil Nadu)
352,500 352,500 0 352,500 *Implementing agency
8 Vision Care Center- 8
Schedule VII, Item (i)- promoting preventive
health care
1-Location-: 100 villages in Kopargaon, N block, Ahmednagar
(Maharashtra)
1,570,500 1,570,500 0 1,570,500 *Implementing agency
9 Mobile Vision Care Van
Schedule VII, Item (i)- promoting preventive
health care
Location-: 300 slums in Indore (Madhya Pradesh)
884,955 884,955 0 884,955 *Implementing agency
10 Eye Check-up Camps
Schedule VII, Item (i)- promoting preventive
health care
Location-1-: 25 villages in Godhra, and Aravali district, (Gujarat)
1,000,000 818,000 0 818,000 *Implementing agency
11 School Health Schedule VII, Item (i)- promoting preventive
health care
Locations: Vadodara (Gujarat), Amritsar (Punjab), Jaipur
(Rajasthan, Salem and Belgaum (Karnataka), Pune (Maharashtra)
1,903,000 1,903,000 0 1,903,000 *Implementing agency
12 Mid Day Meal Schedule VII, Item (i)- promoting preventive
health care
Locations: Padra (Gujarat), Hospet (Karnataka)
2,325,000 2,325,000 0 2,325,000 *Implementing agency
13 Health Schedule VII, Item (i)- promoting preventive
health care
Locations- 4; Godhra, Limkheda, Lunawada, �asra (Gujarat)
3,400,000 1,700,000 0 1,700,000 *Implementing agency
14 Health Schedule VII, Item (i)- promoting preventive
health care
Location: Urban slums of Mumbai 200,000 200,000 0 200,000 *Implementing agency
c) Manner in which the amount spent during the financial year is detailed below:
71Annual Report 2016 Fullerton India Credit Company Limited

FULLERTON INDIA CSR REPORT FY 16
S. No.
CSR Project or activity Identified
Sector in which the Project is covered
Projects or programmes local area or other specify the state and district where projects or programmes was undertaken
Amount outlay (Budget) project or
programmes wise (J)
Amount spent on the projects or programmes Sub heads
Cumulative expenditure
upto the reporting period (J)
Amount spent: direct
or through implementing
agency*
1. Direct Expenditure on projects
and programmes
(J)
2. Overheads (J)
15 Disaster Relief Schedule VII, Item (i)- promoting preventive
health care, eradicating hunger, poverty
Location-1-: Chennai flood relief In Viluppuram, Cuddalore and
Tirunelveli districts in Tamil Nadu
700,000 700,000 0 700,000 *Implementing agency
16 Livelihood Enhancement-
Stitching and Tailoring
Schedule VII, Item (ii)- promoting employment
enhancing vocational skills especially among
women
13.Locations in Madhya Pradesh; 5 Locations in Chattisgarh
4,000,000 3,866,752 0 3,866,752 *Implementing agency
17 Livelihood Enhancement- Beauty and Hair
Care
Schedule VII, Item (ii)- promoting employment
enhancing vocational skills especially among
women
Location-1-: Nagpur, Solapur, Amravati (Maharashtra); Navsari
(Gujarat)
1,710,000 796,980 0 796,980 **Direct
588,244 0 588,244 *Implementing agency
18 Livelihood Enhancement-
Schedule VII, Item (ii)- promoting employment
enhancing vocational skills especially among
women
Location-: Sardarsahar (Rajasthan)
693,525 485,468 0 485,468 *Implementing agency
19 Livelihood Enhancement-
Schedule VII, Item (ii)- promoting employment
enhancing vocational skills especially among
women
Location-: Jaipur and Ajmer (Rajasthan)
957,476 478,738 0 478,738 *Implementing agency
20 Livelihood Enhancement-
Schedule VII, Item (ii)- promoting employment
enhancing vocational skills especially among
women
Location- Belgaum and Shiggaon (in Karnataka)
801,500 801,500 0 801,500 *Implementing agency
21 Livelihood Enhancement-
Schedule VII, Item (ii)- promoting employment
enhancing vocational skills especially among
women
Location- Anthiyur and Gobichettypalayam in Erode (in
Tamil Nadu)
600,000 600,000 0 600,000 *Implementing agency
22 Livelihood Enhancement-
Schedule VII, Item (ii)- promoting employment
enhancing vocational skills especially among
women
Location- Shimoga (Karnataka) 4,000,000 1,911,560 0 1,911,560 **Direct
1,003,569 0 1,003,569 *Implementing agency
23 Livelihood Enhancement-
Schedule VII, Item (ii)- promoting employment
enhancing vocational skills especially among
women
Location-: Khandwa (Madhya Pradesh)
5,995,688 3,944,532 0 3,944,532 *Implementing agency
72Directors’ report

FULLERTON INDIA CSR REPORT FY 16
S. No.
CSR Project or activity Identified
Sector in which the Project is covered
Projects or programmes local area or other specify the state and district where projects or programmes was undertaken
Amount outlay (Budget) project or
programmes wise (J)
Amount spent on the projects or programmes Sub heads
Cumulative expenditure
upto the reporting period (J)
Amount spent: direct
or through implementing
agency*
1. Direct Expenditure on projects
and programmes
(J)
2. Overheads (J)
24 Vocational Training
programme
Schedule VII, Item (ii)- promoting employment
enhancing vocational skills especially among
women
200 locations in 6 states (Maharashtra, Madhya Pradesh,
Tamil Nadu, Karnataka, Rajasthan, Gujarat)
500,000 647,995 0 647,995 Direct
25 Livelihood Enhancement-
Cattle Care Programme
Schedule VII, Item (ii)- Livelihood
Enhancement projects
200 locations in 10 states (Maharashtra, Madhya Pradesh,
Tamil Nadu, Karnataka, Rajasthan, Gujarat, Andhra Pradesh, Punjab,
Haryana, Chhattisgarh)
2,500,000 2,701,847 0 2,701,847 Direct
26 Livelihood Enhancement-
Integrated Livestock
Development
Schedule VII, Item (ii)- Livelihood
Enhancement projects
Locations-: 142 villages in 5 blocks in Hoshangabad (Madhya Pradesh); 65 Villages in 5 blocks of Khandwa (Madhya Pradesh);
37 villages in 5 blocks of Kolhapur (Maharashtra); 41 villages in 5 blocks of Nippani (Karnataka)
3,937,500 3,937,500 0 3,937,500 *Implementing agency
27 Enviornment Sustainability-
Krishi Mitra Programme
Schedule VII, Item (iv)- Conservation of
natural resources and maintaining quality
of soil
Location-1-: 5 blocks in 2 district-Nashik, Ahmednagar (Maharashtra); Location-2-: 2 blocks of Erode district (Tamil
Nadu)
3,000,000 2,889,475 0 2,889,475 *Implementing agency
28 Education Schedule VII, Item (ii)- Promoting
education, including special education and employment
enhancing vocational skills
Location:- Alwar (Rajasthan) 840,000 588,000 0 588,000 *Implementing agency
29 Education Schedule VII, Item (ii)- Promoting
education, including special education and employment
enhancing vocational skills
Location- Shimoga (Karnataka) 310,000 310,000 0 310,000 **Direct
30 Education Schedule VII, Item (ii)- Promoting
education, including special education and employment
enhancing vocational skills
Location- Ahmednagar (Maharashtra)
254,300 254,300 0 223,070 **Direct
31 Administrative cost
0 2,588,692 2,588,692
Grand Total 51,773,831 2,588,692 54,362,523
Annual Report 2016 Fullerton India Credit Company Limited73

S. No.
CSR ProjectName of the
Implementing AgencyDetails
1 Mobile Medical clinics
Udyogini Udyogini is registered as a Society under the Indian Societies Registration Act, 1860. Udyogini was set up to co-ordinate and help poor women, mainly illiterate in remote and backward areas of India to improve their skills as producers and their knowledge of the markets they operate in, so as to ensure long-term returns to build microenterprises and become entrepreneurs
2 Mobile Medical clinics
Madhya Pradesh Voluntary Health
Association
Madhya Pradesh Voluntary Health Association, is the largest health network of Voluntary Organizations in the state of Madhya Pradesh, it is a state level federation of more than 250 voluntary organizations which are engaged in Health and Developmental related activities
3 Mobile Medical clinics
Tamil Nadu Voluntary Health Association
Tamil Nadu Voluntary Health Association, is the largest health network of Voluntary Organizations in the state of Tamil Nadu, it is a state level federation of more than 100 NGO which are engaged in Health and Developmental related activities
4 Vision Care Center-1 & 2
Divine Eye Foundation DEF is a renowned trust (Not for profit), located in Rajahmundry, A.P. Its mission is to provide excellent eye care to all in a caring and Compassionate manner with a focus on extending efficient eye care to the underserved rural poor. DEF is engaged in providing eye care services as a part of its nature of business.
5 Vision Care Center-3 & 4
Royal Commonwealth Society for the Blind
(SIGHTSAVERS)
SIGHTSAVERS is a renowned international not for profit organization, working in developing countries to combat avoidable blindness and promote equal opportunities for disabled people.
6 Vision Care Center- 7
Kanchi Kamakoti Medical Trust (Sankara)
Sankara is a renowned trust (Not for profit), located in Coimbatore, T.N. SEF initiates and drives community eye care activities in India by working with Sankara Eye Care Institutions (SECI), India, which runs the "Gift of Vision" rural outreach programme through Sankara Eye Hospitals. �e Gift of Vision programme is based on an "80/20" model, i.e., four free eye surgeries are performed for each paid surgery. �ousands of rural poor have received free eye surgeries
7 Vision Care Center- 8
Mission for Vision Mission for Vision is a NGO working with partners to combat avoidable blindness and promote a disability inclusive world, MFV works with 21 eye hospitals and centers across 14 states which have performed over 170,000 free eye surgeries annually
8 School Health SHARP (School Health Annual Report
Programme)
SHARP is a NGO that provides India’s largest preventive health programme for school children. �e organization was started in 1998. It addresses the health concerns of school going children in the country by conducting regular health checkups and health awareness sessions and digitizing the health record of each child and making it available online
9 Mid-Day Meal Akshaya Patra Foundation
Akshaya Patra's mission is to eradicate child hunger and promote education for 1.4 under-served children in India by providing nutritious school meals. Akshaya Patra implements the Mid- Day Meal programme in 23 locations of 10 states of India. Each day the Foundation feeds 1.4 million children covering more than 10,000 Government schools. �e Foundation follows both centralized and decentralized kitchen formats to implement the programme
10 Health HelpAge India HelpAge India is a leading registered national level NGO, established in 1978, with a mission “to work for the cause and care of disadvantaged aged persons and to improve their quality of life”. It is a secular, not-for-profit organization registered under the Societies' Registration Act of 1860. Set up in 1978, the organization works to protect the rights of India's elderly and provide relief to them through various interventions and endeavors to make significant changes in the lives of the disadvantaged older persons, so as to enable them to live better and healthier lives.
11 Health St. Jude St. Jude India Child Care Centers currently runs 18 Centers in Mumbai, Delhi, Kolkata, Hyderabad and Jaipur. It provides free accommodation and holistic support to children travelling with their parents for treatment of cancer from villages and small town to cities.
12 Disaster Relief Save the Children One of the leading organizations working in disaster relief during national calamities. Key thematic areas include child health and nutrition, vocational skills and early childhood education
13 Livelihood Enhancement-
Stitching and tailoring
Society for Technology and Action for Rural Advancement (TARA Livelihood Academy)
TARA is part of the Development Alternatives group with its headquarters New Delhi. TLA provides skills to youth, women and community groups with an aim of providing trained workforce to the market. Headquartered in Orcha in Jhansi district of U.P., TLA have good presence in central India.
14 Livelihood Enhancement-
Urmul Setu Sansthan Urmul Setu is a member of Urmul network of organizations, working in western Rajasthan for last 25 years with focus on drought mitigation and disaster management, livelihoods, women empowerment, child rights, early childcare and development, improving access to basic amenities, with priority emphasis on food, fodder and water
* Details of Implementing Agency
74Directors’ report

S. No.
CSR ProjectName of the
Implementing AgencyDetails
15 Livelihood Enhancement-
Vatsalya Vatsalya has been working in Child rehabilitation, Women empowerment and Health including HIV/AIDS. Women empowerment is mainly to enhance their skills for their sustained livelihood. �ese women belong to the deprived and marginalized sections of the community including many women who are in sex trade have now given the alternative opportunity. Vatsalya now has a strong group about 90 women who were once trapped in sex trade but now are free and happily earn their living through a decent means. �ey are trained in Kantha work; a traditional stitch craft and also in tailoring.
16 Livelihood Enhancement-
Centum Foundation Centum Learning is a leading multinational that offers end to end learning and skill building solutions to corporate and public sector enterprises, government with over 1000+ learning and development specialists spread across 20 countries
17 Livelihood Enhancement-
Industree Craft Foundation
Industree Craft Foundation is a Bangalore based organization working towards building sustainable livelihood through market led skill development
18 Livelihood Enhancement-
Anirban Rural Welfare Society
Anirban Rural Welfare Society is a voluntary social service organization for social action and economic development in a integrated way. �e organization was established by a group of committed volunteers from Teachers, Doctors, Social workers, Statistician, for providing assistance and support towards betterment of the landless poor people, who are deprived, exploited and lead to their life in deplorable condition.
19 Livelihood Enhancement-
Society for Technology and Action for Rural
Advancement (TARA Livelihood Academy)
TARA is part of the Development Alternatives group with its headquarters New Delhi. TLA provides skills to youth, women and community groups with an aim of providing trained workforce to the market. Headquartered in Orcha in Jhansi district of U.P., TLA have good presence in central India.
20 Livelihood Enhancement-
Integrated Livestock
Development
J K Trust J.K. Trust is one of the leading organizations working in the animal husbandry and holistic cattle care management with focus on Cattle Breed Improvement through Integrated Livestock Development Centers (ILD). �ey are partnering with the veterinary departments of state government in M.P., Maharashtra, Gujarat and Rajasthan on implementing the ILD model across villages.
21 Enviornment Sustainability-
Krish Mitra Programme
Lokpanchayat, Lokpanchayat is a NGO engaged in community organization for enhancing development based on the principles of participation, sustainability and social justice. �eir major focus is in sustainable agriculture with promotion of organic farming across several villages in Maharashtra
22 Enviornment Sustainability-
Krish Mitra Programme
MYRADA Myrada was started in 1968. Myrada at present is directly managing 18 projects in 20 backward and drought prone Districts of Karnataka, Tamil Nadu and Andhra Pradesh. �ere are other States where it has collaborated with Government, Bilateral and Multilateral Programmes, by contributing to programme design and supporting implementation through regular training, exposure and deputation of staff
23 Education ChildFund India ChildFund India is a child development organization representing the voice of deprived, excluded and vulnerable children in India regardless of their race, creed and gender, since 1951. Presently, we are assisting more than 1.73 million children and families across the country with our unique child-centric intervention programmes
S. No.
CSR ProjectName of the
Implementing AgencyDetails
1 Mobile Medical clinics
Sevamob Ventures Limited
Sevamob is providing primary health care via mobile clinics services to various entities and organizations, it has 24X7 call center for service request and provide advanced care through back office team of doctors
2 Livelihood Enhancement- Beauty and Hair
care
Labour Net Services India Private Limited
LabourNet is one of India’s leading social enterprises focusing on real income increase and productivity of the informal sector by providing vocational education & training services and decent work. �e core purpose of Labournet is to enable livelihood by building a sustainable ecosystem of education, employability and employment and is engaged in providing services to various entities and organizations, in the ordinary course of its business.
3 Livelihood Enhancement-
Edubridge learning pvt ltd
Edubridge is a Mumbai-based training organization started by a group of IIM alumni and professors in October 2009. It has been setup with the vision of fulfilling the skill gap that exists currently between semi-urban/ rural youth and the skill requirements of the high-performing companies. Edubridge is a partner of National Skills Development Corporation (NSDC), a Govt. of India initiative. Edubridge offers certified training programmes for the Retail, BPO, Microfinance, FMCG and Insurance sectors.
4 Education Speakwell skills academy Pvt Ltd
Speakwell Institute for Personal Development and Spoken English is a professionally managed training firm engaged in personality development & effective communication training. Speakwell Institute conducts industry relevant job oriented courses.
**Details of partners in direct implementation
Annual Report 2016 Fullerton India Credit Company Limited75

Assessment perspective Details
Relevance of the Uday initiatives for the community All the Uday projects conducted by Fullerton India under livelihood, health care, environment and education had significant relevance in the overall socio economic development for the communities it worked.
Effectiveness of the Uday initiatives in terms of impact on community
All the Uday projects had clearly defined outcomes and were achieved by the implementing partners. �e projects had a positive feedback from the community.
Efficiency of Uday initiatives �e Uday programmes were cost effective and had effectively used resources across the project. Fullerton India employee volunteers played a key role in the implementation, monitoring of the projects
Sustainability aspect of the all the Uday initiatives for the community
Livelihood focused Uday projects had effective market linkages taking care of the sustainability aspect. Some of the projects under health care, education and environment also had focus on sustainability
6. In case the Company has failed to spend the two per cent of the average net profit of the last three financial years or any part thereof, the Company shall provide the reasons for not spending the amount in its Board report.FY2016 has been a landmark year for Fullerton India’s Uday initiatives, with a range of initiatives undertaken. CSR spends, at
B5.43 crore, were 5x higher than the previous year. Fullerton India’s Uday initiatives under Livelihood advancement (Jeevika), health
care programmes (Niramaya & Jyoti), education (Gurukul) and environment sustainable initiatives (Krishi Mitra & Pashu Vikas) have
benefitted over 1,50,000 households.
A third party assessment of the impact of Fullerton India’s Uday initiatives was conducted and the outcomes are summarized
below:
�e budget allocated for the year comprised a carry-forward from FY2015 of B1.62 crores and a current year allocation of
B4.28 crores. �e total spends for the current year, at B5.43 crores covered the entire value of the current year’s allocations, and,
additionally, spent approximately B1.05 crores of prior year shortfall.
Some of our Uday projects under livelihood advancements were launched on a pilot basis. Based on the successful
implementation of these pilot projects, the scaling up of these initiatives was planned. As these projects required sensitization of
the rural community, the mobilization took more than projected timeframe, increasing the timelines for the pilot project. Hence the
scaling up such initiatives was not feasible in the FY2016 and the same are scheduled for FY2017 and hence there was an unspent
CSR budget of B0.57 crore.
Fullerton India, as a responsible corporate citizen is committed to its social obligation. In its CSR committee meeting held in March
2016, the Company had decided to carry forward the entire unspent of FY2016, amounting to B0.57 crore, to FY2017.
Responsibility StatementWe hereby certify that the implementation and monitoring of Uday Projects are in compliance with the CSR objectives and Policy of
Fullerton India.
Sd/- Sd/-
Shantanu Mitra Gan Chee Yen
(Chief Executive Officer and Managing Director) (Chairman CSR Committee)
Date: May 19, 2016
Place: Mumbai
76Directors’ report
77Annual Report 2016 Fullerton India Credit Company Limited
FinancialSection
Independent Auditor’s Report
Report on the Consolidated Financial StatementsWe have audited the accompanying consolidated financial statements of Fullerton India Credit Company Limited (hereinafter referred to as ‘the Holding Company’) and its subsidiaries (the Holding Company and its subsidiaries together referred to as ‘the Group’), comprising of the consolidated Balance Sheet as at 31 March 2016, the consolidated Statement of Profit and Loss and consolidated Cash Flow Statement for the year then ended, and a summary of significant accounting policies and other explanatory information (hereinafter referred to as ‘the consolidated financial statements’).
Management’s Responsibility for the Consolidated Financial Statements�e Holding Company’s Board of Directors is responsible for the preparation of these consolidated financial statements in terms with the requirement of the Companies Act, 2013 (‘the Act’) that give a true and fair view of the consolidated financial position, consolidated financial performance and consolidated cash flows of the Group in accordance with accounting principles generally accepted in India, including the Accounting Standards specified under Section 133 of the Act, read with Rule 7 of the Companies (Accounts) Rules, 2014. �e respective Board of Directors of the companies included in the Group are responsible for maintenance of adequate accounting records in accordance with the provisions of the Act for safeguarding of the assets of the Group and for preventing and detecting frauds and other irregularities; the selection and application of appropriate accounting policies; making judgments and estimates that are reasonable and prudent; and the design, implementation and maintenance of adequate internal financial control that were operating effectively for ensuring the accuracy and completeness of the accounting records, relevant to the preparation and presentation of the financial statements that give a true and fair view and are free from material misstatement, whether due to fraud or error, which have been used for the purpose of preparation of the consolidated financial statements by the Directors of the Holding Company, as aforesaid.
Auditor’s ResponsibilityOur responsibility is to express an opinion on these consolidated financial statements based on our audit. While conducting the audit, we have taken into account the provisions of the Act, the accounting and auditing standards and matters which are required to be included in the audit report under the provisions of the Act and the Rules made thereunder. We conducted our audit in accordance with the Standards on Auditing, issued by the Institute of Chartered Accountants of India, as specified under Section 143(10) of the Act. �ose Standards require that we comply with ethical requirements and plan and perform the audit to obtain reasonable assurance about whether the financial statements are free from material misstatement.
An audit involves performing procedures to obtain audit evidence about the amounts and disclosures in the consolidated financial statements. �e procedures selected depend on the auditor’s judgment, including the assessment of the risks of material misstatement of the consolidated financial statements, whether due to fraud or error. In making those risk assessments, the auditor considers internal financial control relevant to the Holding Company’s preparation of the consolidated financial statements that give a true and fair view in order to design audit procedures that are appropriate in the circumstances. An audit also includes evaluating the appropriateness of accounting policies used and the reasonableness of the accounting estimates made by the Holding Company’s Board of Directors, as well as evaluating the overall presentation of the consolidated financial statements. We believe that the audit evidence obtained by us and the audit evidence obtained by the other auditors in terms of their reports referred to in paragraph (a) of the Other Matters below, is sufficient and appropriate to provide a basis for our audit opinion on the consolidated financial statements.
OpinionIn our opinion and to the best of our information and according to the explanations given to us, the consolidated financial statements give the information required by the Act in the manner so required and give a true and fair view in conformity with the accounting principles generally accepted in India of the
To the Members of Fullerton India Credit Company Limited
78Consolidated Financials

consolidated state of affairs of the Group, as at 31 March 2016, their consolidated profit, and their consolidated cash flows for the year ended on that date.
Report on Other Legal and Regulatory Requirements1. As required by section 143 (3) of the Act, we report, to the
extent applicable, that:
(a) We and other auditors whose reports we have relied upon have sought and obtained all the information and explanations which to the best of our knowledge and belief were necessary for the purpose of our audit of the aforesaid consolidated financial statements;
(b) In our opinion proper books of account as required by law relating to preparation of the aforesaid consolidation of the financial statements have been kept so far as it appears from our examination of those books and reports of the other auditors;
(c) �e consolidated Balance Sheet, consolidated Statement of Profit and Loss, and consolidated Cash Flow Statement dealt with by this Report are in agreement with the books of account maintained for the purpose of preparation of the consolidated financial statements;
(d) In our opinion, the aforesaid consolidated financial statements comply with the Accounting Standards specified under section 133 of the Act, read with Rule 7 of the Companies (Accounts) Rules, 2014;
(e) On the basis of the written representations received from the directors of the Holding Company as on 31 March 2016 taken on record by the Board of Directors of the Holding Company and the reports of the auditors who are appointed under Section 139 of the Act, of its subsidiary companies incorporated in India, none of the directors of the Group’s companies is disqualified as on 31 March 2016 from being appointed as a director in terms of Section 164 (2) of the Act.
(f) With respect to the adequacy and the operating effectiveness of the internal financial controls over financial reporting of the Holding Company and its subsidiary companies, incorporated in India, refer to our separate report in ‘Annexure 1’ to this report;
(g) With respect to the other matters to be included in the Auditor’s Report in accordance with Rule 11 of the Companies (Audit and Auditors) Rules, 2014, in our opinion and to the best of our information and according to the explanations given to us:
i. �e consolidated financial statements disclose the impact of pending litigations on its consolidated financial position of the Group – Refer Note 30 to the consolidated financial statements;
ii. �e Group did not have any material foreseeable losses in long-term contracts including derivative contracts; and
iii. �ere were no amounts which were required to be transferred to the Investor Education and Protection Fund by the Holding Company and its subsidiaries.
Other Matter(a) �e accompanying consolidated financial statements
include total assets of H64,76,28,104 as at 31 March 2016, and total revenues of H2,31,16,449 and net cash outflows of H5,59,36,635 for the year ended on that date, in respect of two subsidiaries, which have been audited by other auditors, which financial statements, other financial information and auditor’s reports have been furnished to us by the management. Our opinion on the consolidated financial statements, in so far as it relates to the amounts and disclosures included in respect of these subsidiaries, and our report in terms of sub-sections (3) and (11) of Section 143 of the Act, in so far as it relates to the aforesaid subsidiaries, is based solely on the reports of such other auditors.
Our opinion on the consolidated financial statements, and our report on Other Legal and Regulatory Requirements above, is not modified in respect of the above matters with respect to our reliance on the work done and the reports of the other auditors and the financial statements and other financial information certified by the Management.
For S.R. BATLIBOI & CO. LLPICAI Firm’s Registration Number: 301003E/E300005Chartered Accountants
Sd/-per Viren H. MehtaPartnerMembership Number: 048749
Mumbai19 May 2016
79Annual Report 2016 Fullerton India Credit Company Limited

In conjunction with our audit of the consolidated financial statements of Fullerton India Credit Company Limited as of and for the year ended 31 March 2016, we have audited the internal financial controls over financial reporting of Fullerton India Credit Company Limited (hereinafter referred to as the ‘Holding Company’) and its subsidiary companies, which are companies incorporated in India, as of that date.
Management’s Responsibility for Internal Financial Controls�e respective Board of Directors of the Holding Company, its subsidiary companies, which are companies incorporated in India, are responsible for establishing and maintaining internal financial controls based on the internal control over financial reporting criteria established by the Holding Company considering the essential components of internal control stated in the Guidance Note on Audit of Internal Financial Controls Over Financial Reporting issued by the Institute of Chartered Accountants of India. �ese responsibilities include the design, implementation and maintenance of adequate internal financial controls that were operating effectively for ensuring the orderly and efficient conduct of its business, including adherence to the respective company’s policies, the safeguarding of its assets, the prevention and detection of frauds and errors, the accuracy and completeness of the accounting records, and the timely preparation of reliable financial information, as required under the Act.
Auditor’s ResponsibilityOur responsibility is to express an opinion on the company’s internal financial controls over financial reporting based on our audit. We conducted our audit in accordance with the Guidance Note on Audit of Internal Financial Controls Over Financial Reporting (the ‘Guidance Note’) and the Standards on Auditing, both, issued by Institute of Chartered Accountants of India, and deemed to be prescribed under section 143(10) of the Act, to the extent applicable to an audit of internal financial controls. �ose Standards and the Guidance Note require that
we comply with ethical requirements and plan and perform the audit to obtain reasonable assurance about whether adequate internal financial controls over financial reporting was established and maintained and if such controls operated effectively in all material respects.
Our audit involves performing procedures to obtain audit evidence about the adequacy of the internal financial controls system over financial reporting and their operating effectiveness. Our audit of internal financial controls over financial reporting included obtaining an understanding of internal financial controls over financial reporting, assessing the risk that a material weakness exists, and testing and evaluating the design and operating effectiveness of internal control based on the assessed risk. �e procedures selected depend on the auditor’s judgement, including the assessment of the risks of material misstatement of the financial statements, whether due to fraud or error.
We believe that the audit evidence we have obtained and the audit evidence obtained by the other auditors in terms of their reports referred to in the Other Matters paragraph below, is sufficient and appropriate to provide a basis for our audit opinion on the internal financial controls system over financial reporting.
Meaning of Internal Financial Controls Over Financial ReportingA company’s internal financial control over financial reporting is a process designed to provide reasonable assurance regarding the reliability of financial reporting and the preparation of financial statements for external purposes in accordance with generally accepted accounting principles. A company’s internal financial control over financial reporting includes those policies and procedures that (1) pertain to the maintenance of records that, in reasonable detail, accurately and fairly reflect the transactions and dispositions of the assets of the company; (2) provide reasonable assurance that transactions are recorded
Annexure to the independent auditor’s report of even date on the consolidated financial statements of fullerton india credit company limtedReport on the Internal Financial Controls under Clause (i) of Sub-section 3 of Section 143 of the Companies Act, 2013 (‘the Act”)
To the Members of Fullerton India Credit Company Limited
80Consolidated Financials
as necessary to permit preparation of financial statements in accordance with generally accepted accounting principles, and that receipts and expenditures of the company are being made only in accordance with authorisations of management and directors of the company; and (3) provide reasonable assurance regarding prevention or timely detection of unauthorised acquisition, use, or disposition of the company’s assets that could have a material effect on the financial statements.
Inherent Limitations of Internal Financial Controls Over Financial ReportingBecause of the inherent limitations of internal financial controls over financial reporting, including the possibility of collusion or improper management override of controls, material misstatements due to error or fraud may occur and not be detected. Also, projections of any evaluation of the internal financial controls over financial reporting to future periods are subject to the risk that the internal financial control over financial reporting may become inadequate because of changes in conditions, or that the degree of compliance with the policies or procedures may deteriorate.
OpinionIn our opinion, the Holding Company, its subsidiary companies, which are companies incorporated in India, have, maintained in all material respects, an adequate internal financial controls system over financial reporting and such internal financial
controls over financial reporting were operating effectively as at 31 March 2016, based on the internal control over financial reporting criteria established by the Holding Company considering the essential components of internal control stated in the Guidance Note on Audit of Internal Financial Controls Over Financial Reporting issued by the Institute of Chartered Accountants of India.
Other MattersOur report under Section 143(3)(i) of the Act on the adequacy and operating effectiveness of the internal financial controls over financial reporting of the Holding Company, insofar as it relates to subsidiary companies is based on the corresponding reports of the auditors of such subsidiary companies incorporated in India.
For S.R. BATLIBOI & CO. LLPICAI Firm’s Registration Number: 301003E/E300005Chartered Accountants
Sd/-per Viren H. MehtaPartnerMembership Number: 048749
Mumbai19 May 2016
81Annual Report 2016 Fullerton India Credit Company Limited

(B lakhs)
Notes 31 March 2016 31 March 2015
EQUITY AND LIABILITIESShareholders’ funds Share capital 3 192,116 185,866 Reserves and surplus 4 18,929 (29,079)Non-current liabilities Long-term borrowings 5 686,001 489,208 Other long term liabilities 6 8,491 6,515 Long-term provisions 7 13,183 8,057Current liabilities Short-term borrowings 8 121,690 90,415 Other current liabilities 9 301,839 261,078 Short-term provisions 7 2,827 1,937TOTAL 1,345,076 1,013,997ASSETSNon-current assets Fixed assets Tangible assets 10 2,983 2,432 Intangible assets 11 2,040 1,096
Assets under development 10 & 11 389 1,127 Non-current investments 12 5 5 Deferred tax asset (Net) 13 8,613 - Long-term loans and advances 14 772,368 601,793 Other non-current assets 15 8,944 6,240Current assets Current investments 16 92,022 50,684 Trade receivables 17 657 254 Cash and bank balances 18 82,287 55,080 Short-term loans and advances 14 352,850 277,270 Other current assets 15 21,918 18,016TOTAL 1,345,076 1,013,997
Summary of significant accounting policies 2.1
�e accompanying notes are an integral part of the financial statements
As per our report of even date
Consolidated Balance Sheet as at 31 March 2016
S. R. BATLIBOI & CO. LLP For and on behalf of the Board of Directors ofICAI Firm Registration number : 301003E/E300005 Fullerton India Credit Company LimitedChartered Accountants
Sd/- Sd/- Sd/-per Viren H. Mehta Gan Chee Yen Shantanu MitraPartner Chairman CEO and Managing DirectorMembership No. 048749 Sd/- Pankaj Malik Chief Financial Officer and Company Secretary
Place : Mumbai Place : MumbaiDate : 19 May 2016 Date : 19 May 2016
82Consolidated Financials
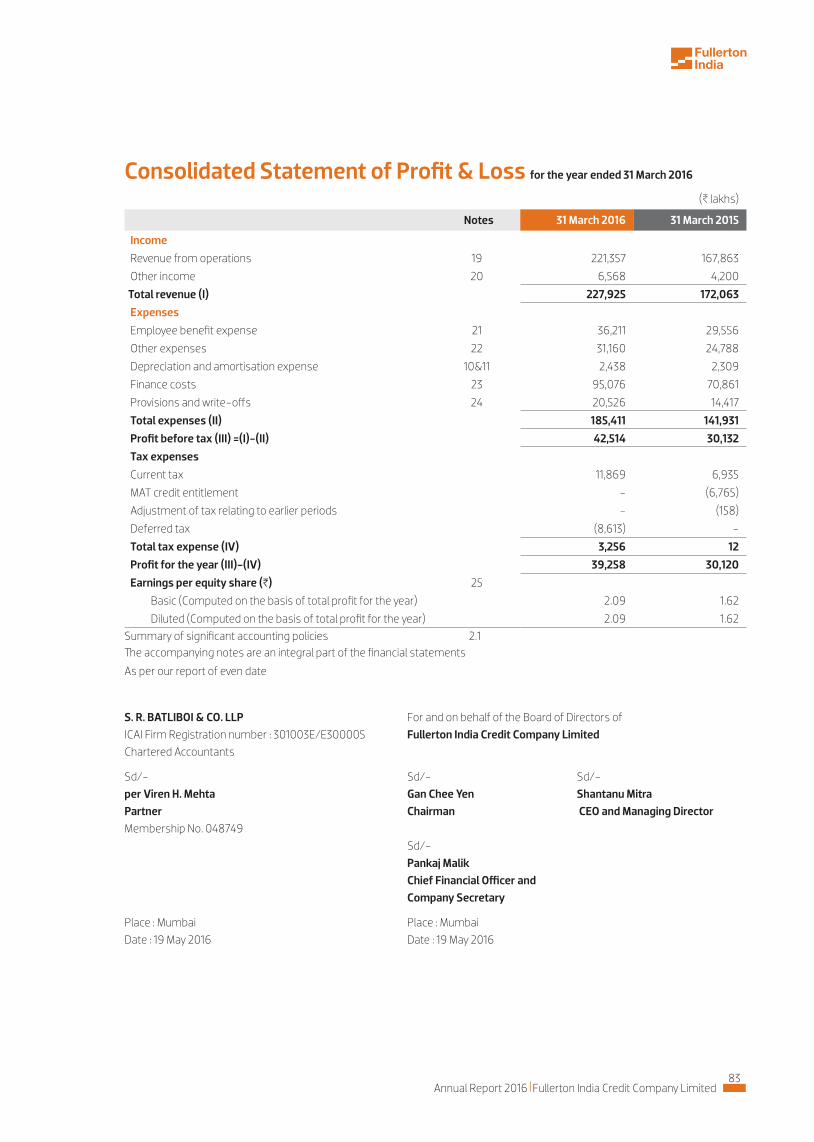
(B lakhs)
Notes 31 March 2016 31 March 2015
Income
Revenue from operations 19 221,357 167,863
Other income 20 6,568 4,200
Total revenue (I) 227,925 172,063
Expenses
Employee benefit expense 21 36,211 29,556
Other expenses 22 31,160 24,788
Depreciation and amortisation expense 10&11 2,438 2,309
Finance costs 23 95,076 70,861
Provisions and write-offs 24 20,526 14,417
Total expenses (II) 185,411 141,931
Profit before tax (III) =(I)-(II) 42,514 30,132
Tax expenses
Current tax 11,869 6,935
MAT credit entitlement - (6,765)
Adjustment of tax relating to earlier periods - (158)
Deferred tax (8,613) -
Total tax expense (IV) 3,256 12
Profit for the year (III)-(IV) 39,258 30,120
Earnings per equity share (H) 25
Basic (Computed on the basis of total profit for the year) 2.09 1.62
Diluted (Computed on the basis of total profit for the year) 2.09 1.62Summary of significant accounting policies 2.1�e accompanying notes are an integral part of the financial statements
As per our report of even date
Consolidated Statement of Profit & Loss for the year ended 31 March 2016
S. R. BATLIBOI & CO. LLP For and on behalf of the Board of Directors ofICAI Firm Registration number : 301003E/E300005 Fullerton India Credit Company LimitedChartered Accountants
Sd/- Sd/- Sd/-per Viren H. Mehta Gan Chee Yen Shantanu MitraPartner Chairman CEO and Managing DirectorMembership No. 048749 Sd/- Pankaj Malik Chief Financial Officer and Company Secretary
Place : Mumbai Place : MumbaiDate : 19 May 2016 Date : 19 May 2016
83Annual Report 2016 Fullerton India Credit Company Limited

Consolidated Cash Flow Statement for the year ended 31 March 2016
(B lakhs)
31 March 2016 31 March 2015
A. Cash flow from operating activities:
Net Profit before taxation 42,514 30,132
Adjustment for computing operating profit before working capital changes:
Depreciation and amortisation 2,438 2,309
Interest on fixed deposits and bonds (5,395) (3,086)
Interest on investments (5,264) (3,418)
Profit on sale of fixed assets (22) (38)
Write off of fixed assets and intangible assets 265 66
Profit on sale of investments (3,918) (1,926)
Unrealised (profit)/loss on investments - 3
Provision for standard/sub standard assets and bad debts written off 20,535 14,417
Provision for employees benefits (179) (53)
Amortisation of ancillary borrowing costs 1,490 1,466
Operating profit before working capital changes 52,464 39,872
Movements in working capital :
(Increase)/decrease in long term loans and advances (182,068) (195,643)
(Increase)/decrease in short term loans and advances (80,182) (65,554)
(Increase)/ decrease in other non current assets (1,500) (2,456)
(Increase)/decrease in other current assets (2,951) (3,737)
(Increase)/decrease in trade receivables (403) 13
Increase/(decrease) in current liabilities 24,527 25,906
Increase/(decrease) in other long term liabilities 1,976 3,008
Increase/(decrease) in short term provisions - (3)
Cash generated from operations (188,136) (198,594)
Income taxes paid (10,615) (6,297)
Net cash from operating activities (A) (198,751) (204,891)
B. Cash flow from investing activities:
Purchase of fixed assets and intangibles (3,674) (2,866)
Proceeds from sale of fixed assets 28 43
Purchase of current investments (2,311,242) (1,201,237)
Sale/maturity of investments 2,278,273 1,197,536
Fixed deposit placed during the year (70,311) (59,109)
Fixed deposit matured during the year 47,154 19,872
Interest received on fixed deposits and bonds 4,274 2,154
Interest received on investments 820 115
Net cash from investing activities (B) (54,678) (43,492)
84Consolidated Financials

(B lakhs)
31 March 2016 31 March 2015
C. Cash flow from financing activities
Proceeds from issuance of share capital (including share premium) 15,000 -
Proceeds from long term borrowings from banks and financial institutions 441,300 361,998
Proceeds from short term borrowings from banks and financial institutions 119,967 168,638
Repayment of long term borrowings from banks and financial institutions (227,564) (143,607)
Repayment of short term borrowings from banks and financial institutions (88,692) (161,435)
Payment of ancillary borrowing costs (2,307) (1,373)
Net cash used in financing activities (C ) 257,704 224,221
Net increase/(decrease) in cash and cash equivalents (A)+(B)+(C) 4,275 (24,162)
Cash and cash equivalents as at the beginning of the year 8,945 33,107
Cash and cash equivalents as at the end of the year 13,220 8,945
(refer note 29 )
Components of cash and cash equivalents as at the end of the year
Cash and cheques on hand 1,127 1,151
With banks - on current account 12,093 7,794
Cash and cash equivalents as at the end of the year 13,220 8,945
Summary of significant accounting policies 2.1
�e accompanying notes are an integral part of the financial statements
As per our report of even date
Consolidated Cash Flow Statement for the year ended 31 March 2016
S. R. BATLIBOI & CO. LLP For and on behalf of the Board of Directors ofICAI Firm Registration number : 301003E/E300005 Fullerton India Credit Company LimitedChartered Accountants
Sd/- Sd/- Sd/-per Viren H. Mehta Gan Chee Yen Shantanu MitraPartner Chairman CEO and Managing DirectorMembership No. 048749 Sd/- Pankaj Malik Chief Financial Officer and Company Secretary
Place : Mumbai Place : MumbaiDate : 19 May 2016 Date : 19 May 2016
85Annual Report 2016 Fullerton India Credit Company Limited

Notes to Financial Statement for the year ended 31 March 2016
(Amount in Rupees Lakhs unless otherwise stated)
1. Corporate information Fullerton India Credit Company Limited (‘FICCL’ or ‘the Company’) is a public limited company domiciled in India and
incorporated under the provisions of Companies Act, 1956. �e Company is a non-banking financial company (‘NBFC’) registered with the Reserve Bank of India (‘RBI’). �e Company provides loans to small and medium enterprises for working capital and growth, loans for commercial vehicles and two-wheelers, home improvement loans, loans against property, personal loans, working capital loans for urban salaried and self-employed and loans for rural livelihood advancement and financing of various rural micro enterprises.
Fullerton India Home Finance Company Limited (‘FIHFCL’) has been incorporated on 12 August 2010, with the main object of providing finance for purchase, repairs, construction, and enlargement, erection of house or apartments or building. �e Company is registered with the National Housing Bank of India (‘NHB’) vide Registration number 07.0122.15 dated 14 July 2015.
2. (a) Basis of Preparation of Consolidated Financial Statements �e Consolidated Financial Statements comprise of the financial statements of FICCL and its subsidiaries (hereinafter
collectively referred to as the ‘Group’).
�e Consolidated Financial Statements have been prepared in accordance with generally accepted accounting principles in India (‘Indian GAAP’). �e Company has prepared these financial statements to comply in all material respects with the Accounting Standards notified under section 133 of the Companies Act, 2013 (‘the Act’) read with rule 7 of the Companies (Accounts) Rules, 2014, and the provisions of the RBI as applicable to an NBFC. �e financial statements have been prepared on an accrual basis and under the historical cost convention except as detailed in note 2.1(i). �e accounting policies adopted in the preparation of financial statements are consistent with those of the previous year.
(b) Principles of Consolidation (i) �e Consolidated Financial Statements are prepared in accordance with Accounting Standard 21 - Consolidated
Financial Statements (AS-21) issued by the Institute of Chartered Accountants of India (ICAI). �e financial statements of the group companies are prepared according to uniform accounting policies, in accordance with accounting principles generally accepted in India. �e effects of inter-company transactions are eliminated on consolidation.
�e financial statements of the Company and its subsidiaries have been combined on a line-by-line basis by adding together like items of assets, liabilities, income and expenses, after eliminating intra-group balances and intra-group transactions resulting in unrealised profits or losses.
�e Consolidated Financial Statements are prepared using uniform accounting policies for like transactions and events in similar circumstances and necessary adjustments required for deviations, if any to the extent possible unless otherwise stated, are made in the Consolidated Financial Statements and are presented in the same manner as the Company’s standalone financial statements.
�e financial statements of the FIHFCL have been prepared in accordance with and in the manner prescribed by National Housing Bank regulations. Due to the lack of homogeneity of the businesses, the financial statements of the FIHFCL have been consolidated, to the extent possible in the format as adopted by the parent, as required by AS-21 and as prescribed under section 133 of Companies Act, 2013.
(ii) �e subsidiary companies considered in preparation of Consolidation Financial Statements are:
Particulars Country of Incorporation
Proportion of ownership as on 31 March 2016
Proportion of ownership as on 31 March 2015
Financial Year ends on
Fullerton India Home Finance Company Limited India 100% 100% March 31
Fullerton India Foundation for Social and Economic Development
India 100% 100% March 31
For the purpose of Consolidated Financial Statements, the results of FICCL and its subsidiaries for the year ended 31 March 2016 have been derived from the respective Company’s audited financials of the year ended 31 March 2016.
86Consolidated Financials
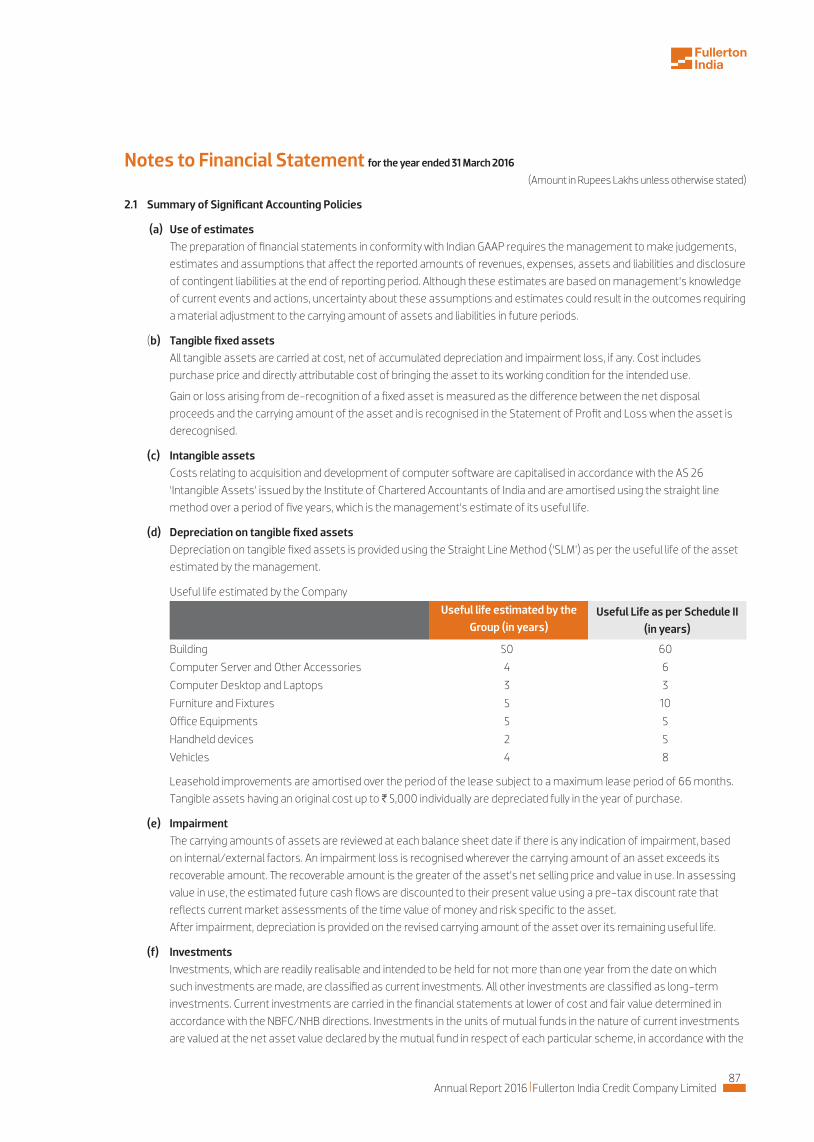
Notes to Financial Statement for the year ended 31 March 2016
(Amount in Rupees Lakhs unless otherwise stated)
2.1 Summary of Significant Accounting Policies
(a) Use of estimates �e preparation of financial statements in conformity with Indian GAAP requires the management to make judgements,
estimates and assumptions that affect the reported amounts of revenues, expenses, assets and liabilities and disclosure of contingent liabilities at the end of reporting period. Although these estimates are based on management’s knowledge of current events and actions, uncertainty about these assumptions and estimates could result in the outcomes requiring a material adjustment to the carrying amount of assets and liabilities in future periods.
(b) Tangible fixed assets All tangible assets are carried at cost, net of accumulated depreciation and impairment loss, if any. Cost includes
purchase price and directly attributable cost of bringing the asset to its working condition for the intended use.
Gain or loss arising from de-recognition of a fixed asset is measured as the difference between the net disposal proceeds and the carrying amount of the asset and is recognised in the Statement of Profit and Loss when the asset is derecognised.
(c) Intangible assets Costs relating to acquisition and development of computer software are capitalised in accordance with the AS 26
‘Intangible Assets’ issued by the Institute of Chartered Accountants of India and are amortised using the straight line method over a period of five years, which is the management’s estimate of its useful life.
(d) Depreciation on tangible fixed assets Depreciation on tangible fixed assets is provided using the Straight Line Method (‘SLM’) as per the useful life of the asset
estimated by the management.
Useful life estimated by the Company
Useful life estimated by the Group (in years)
Useful Life as per Schedule II (in years)
Building 50 60
Computer Server and Other Accessories 4 6
Computer Desktop and Laptops 3 3
Furniture and Fixtures 5 10
Office Equipments 5 5
Handheld devices 2 5
Vehicles 4 8
Leasehold improvements are amortised over the period of the lease subject to a maximum lease period of 66 months. Tangible assets having an original cost up to H 5,000 individually are depreciated fully in the year of purchase.
(e) Impairment �e carrying amounts of assets are reviewed at each balance sheet date if there is any indication of impairment, based
on internal/external factors. An impairment loss is recognised wherever the carrying amount of an asset exceeds its recoverable amount. �e recoverable amount is the greater of the asset’s net selling price and value in use. In assessing value in use, the estimated future cash flows are discounted to their present value using a pre-tax discount rate that reflects current market assessments of the time value of money and risk specific to the asset.
After impairment, depreciation is provided on the revised carrying amount of the asset over its remaining useful life.
(f) Investments Investments, which are readily realisable and intended to be held for not more than one year from the date on which
such investments are made, are classified as current investments. All other investments are classified as long-term investments. Current investments are carried in the financial statements at lower of cost and fair value determined in accordance with the NBFC/NHB directions. Investments in the units of mutual funds in the nature of current investments are valued at the net asset value declared by the mutual fund in respect of each particular scheme, in accordance with the
87Annual Report 2016 Fullerton India Credit Company Limited

NBFC/NHB directions. Long-term investments are carried at cost. However, provision for diminution in value is made to recognise a decline other than temporary in the value of the investments.
(g) Asset classification and Provisioning/write-off of Assets(i) Loans including housing loan are classified as standard and non-performing assets in accordance with Company’s
policy. A loan is classified as NPA, where interest/installment is overdue for a period of 90 days and above, from the day it becomes due.
(ii) Loans are provided for/written off, in accordance with Company’s policy, subject to the minimum provision required as per Non–Banking Financial (Deposit Accepting or Holding) Companies Prudential Norms (Reserve Bank) Directions, 2007 as amended from time to time.
(iii) Housing loans are provided for/written off, in accordance with Company’s policy, subject to the minimum provision required as per the National Housing Bank (NHB) Housing Finance Companies Directions, 2010 as amended from time to time.
(h) Leases Where the Company is the lessor Assets given on operating leases are included in fixed assets. Lease income is recognised in the Statement of Profit
and Loss on a straight-line basis over the lease term. Costs, including depreciation are recognised as an expense in the Statement of Profit and Loss. Initial direct costs such as legal costs, brokerage costs, etc. are recognised immediately in the Statement of Profit and Loss.
Where the Company is the lessee Lease arrangements where the Lessor effectively retains, substantially, all the risks and benefits of ownership of the
leased term, are classified as operating leases. Operating lease payments are recognised as an expense in the Statement of Profit and Loss on a straight-line basis over the lease term.
(i) Revenue recognition Revenue is recognised to the extent that it is probable that the economic benefits will flow to the Company and the
revenue can be reliably measured.
i) Interest Income Interest income on loans given is recognised under the internal rate of return method. Such interest, where installments are overdue for 90 days and above, is recognised only when actually realised. Any
such income, recognised and remaining unrealised after the installments have become overdue for 90 days and above, is reversed.
Interest income on deposits with banks is recognised on a time proportion basis taking into account the amount outstanding and the applicable interest rate.
ii) Income from assignment / securitisation of loans and receivables Profit/premium arising at the time of securitisation / assignment of loan portfolio is amortised over the life of the
underlying loan portfolio/securities and any loss arising therefrom is accounted for immediately. Income from interest strip (excess income spread) is recognised in the statement of profit and loss net of any losses when redeemed in cash. Interest retained under assignment of loan receivables is recognised on realisation basis over the life of the underlying loan portfolio.
iii) Fee income Loan processing fee/document fee/stamp fee are recognised over the term of the loan in proportion to the interest
accrued during the year. For the agreements foreclosed or transferred through assignment/securitisation, the unamortised portion of the fee is recognised as income to the Statement of Profit and Loss at the time of such foreclosure/transfer through assignment.
Additional charges such as penal, dishonour, foreclosure charges, etc. are recognised on realisation basis.
iv) Income on discounted instruments Income on discounted instruments is recognised over the tenor of the instrument on straight line basis.
Notes to Financial Statement for the year ended 31 March 2016
(Amount in Rupees Lakhs unless otherwise stated)
88Consolidated Financials

v) Commission and brokerage income Commission and brokerage income earned for the services rendered are recognised on accrual basis.
vi) Dividend Income Dividend income is recognised when the shareholders’ right to receive payment is established by the balance sheet
date.
vii) Profit/Loss on sale of investments Profit/loss on sale of investments is recognised on trade date basis. On disposal of an investment, the difference
between its carrying amount and net disposal proceeds is charged or credited to the Statement of Profit and Loss.
(j) Foreign currency transactions
i) Initial recognition Foreign currency transactions are recorded at exchange rate prevailing on date of transaction.
ii) Conversion Foreign currency monetary balances are reported using the exchange rate prevailing at the reporting date. Non-monetary balances, which are measured in terms of historical cost denominated in a foreign currency, are
reported using the exchange rate on the date of the transaction.
iii) Exchange differences Exchange differences arising on the settlement of monetary balances or on the restatement of the Company’s
monetary balances at rates different from those at which they were initially recorded during the year, or reported in the previous financial statements, are recognised as income or as expense in the year in which they arise.
(k) Retirement and Other Employee benefits
i) Short Term Employee Benefits All short term employee benefits are accounted on undiscounted basis during the accounting period based on
services rendered by employees.
ii) Defined Contribution Plansa) �e contributions as specified by law are made to the Regional Provident Fund Commissioner and charged to
the Statement of Profit and Loss of the year when the contribution to the respective fund is due. �ere are no other obligations other than contribution payable to the provident fund.
b) Superannuation is provided for on accrual basis, in accordance with the Company’s policy.
iii) Defined Benefit Plans Gratuity liability is provided for on the basis of an actuarial valuation on projected unit credit method made at the end
of each financial year. Actuarial gain or loss is recognised in full in the period in which they occur in the Statement of Profit and Loss.
iv) Leave benefits Accumulated leave balance, which is expected to be utilised within the next twelve months, is treated as short term
employee benefit. �e Company measures the expected cost of such absences as the additional amount that it expects to incur as a result of unused entitlement that has accumulated at the reporting date.
(l) Income taxes Tax expense comprises current and deferred tax. Current income tax is measured at the amount expected to be paid
to the tax authorities in accordance with the Income Tax Act, 1961 enacted in India. �e tax rates and tax laws used to compute the amount are those that are enacted or substantively enacted at the reporting date.
Deferred income taxes reflects the impact of current year timing differences between taxable income and accounting income originating during the current year and reversal of timing differences of earlier years. Deferred tax is measured based on the tax rates and the tax laws enacted or substantively enacted at the balance sheet date. Deferred tax assets
Notes to Financial Statement for the year ended 31 March 2016
(Amount in Rupees Lakhs unless otherwise stated)
89Annual Report 2016 Fullerton India Credit Company Limited

are recognised only to the extent that there is reasonable certainty that sufficient future taxable income will be available against which such deferred tax assets can be realised. In situations where the Company has unabsorbed depreciation or carry forward tax losses, all deferred tax assets are recognised only if there is virtual certainty supported by convincing evidence that they can be realised against future taxable profits.
At each balance sheet date, the Company re-assesses unrecognised deferred tax assets. It recognises unrecognised deferred tax assets to the extent that it has become reasonably certain or virtually certain, as the case may be that sufficient future taxable income will be available against which such deferred tax assets can be realised.
Minimum alternate tax (MAT) paid in a year is charged to the Statement of Profit and Loss as current tax. �e Company recognises MAT credit available as an asset only to the extent that there is convincing evidence that the Company will pay normal income tax during the specified period, i.e., the period for which MAT credit is allowed to be carried forward. In the year in which the Company recognises MAT credit as an asset in accordance with the Guidance Note on Accounting for Credit Available in respect of Minimum Alternative Tax under the Income Tax Act, 1961, the said asset is created by way of credit to the Statement of Profit and Loss and shown as “MAT Credit Entitlement.” �e Company reviews the “MAT credit entitlement” asset at each reporting date and writes down the asset to the extent the Company does not have convincing evidence that it will pay normal tax during the specified period.
(m) Earnings per share Basic earnings per share is calculated by dividing the net profit or loss for the period attributable to equity shareholders
(after deducting attributable taxes) by the weighted average number of equity shares outstanding during the year.
For the purpose of calculating diluted earnings per share, the net profit or loss for the year attributable to equity shareholders and the weighted average number of shares outstanding during the year are adjusted for the effects of all dilutive potential equity shares.
(n) Provisions & Contingencies A provision is recognised when an enterprise has a present obligation as a result of past event; it is probable that an
outflow of resources embodying economic benefits will be required to settle the obligation, in respect of which a reliable estimate can be made. Provisions are not discounted to its present value and are determined based on best estimate required to settle the obligation at the reporting date. �ese estimates are reviewed at each reporting date and adjusted to reflect the current best estimates.
A contingent liability is a possible obligation that arises from past events whose existence will be confirmed by the occurrence or non-occurrence of one or more uncertain future events beyond the control of the Company or a present obligation that is not recognised because it is not probable that an outflow of resources will be required to settle the obligation. A contingent liability also arises in extremely rare cases where there is a liability that cannot be recognised because it cannot be measured reliably. �e Company does not recognise a contingent liability but discloses its existence in the financial statements.
(o) Cash and cash equivalents Cash and cash equivalents for the purpose of cash flow statement comprise cash at bank and in hand and short term
investments with original maturity of three months or less.
(p) Share based payments In case of stock appreciation rights, measurement and disclosure of the employee share-based payment plan is
done in accordance with the Guidance Note on Accounting for Employee Share-based Payments, issued by the ICAI. �e Company measures compensation cost relating to stock appreciation rights using the intrinsic value method. Compensation expense is amortised over the vesting period of the option on a straight line basis.
(q) Borrowing costs Ancillary borrowing costs incurred in connection with the arrangement of borrowings is amortised over the tenure of the
respective borrowings.
Notes to Financial Statement for the year ended 31 March 2016
(Amount in Rupees Lakhs unless otherwise stated)
90Consolidated Financials

(r) Loan origination costs Loan origination costs such as credit verification, contact point verification, agreement stamping and direct selling agents
commission are recognised as expense over the contractual tenor of the loan agreements in proportion to the interest accrued during the year. For the agreements foreclosed or transferred through assignment, the unamortised portion of the loan acquisition costs are recognised as charge to the Statement of Profit and Loss at the time of such foreclosure/transfer through assignment/securitisation.
(s) Operating cycle Assets and Liabilities are classified as current and non-current based on the operating cycle which has been estimated to
be 12 months. All assets and liabilities which are expected to be realised and settled, within a period of 12 months from the date of Balance Sheet have been classified as current and other assets and liabilities are classified as non-current.
(t) Cash flow statement Cash flows are reported using the indirect method, whereby profit/(loss) before extraordinary items and tax is adjusted
for the effects of transactions of non-cash nature and any deferrals or accruals of past or future cash receipts or payments. �e cash flows from operating, investing and financing activities of the Group are segregated based on the available information.
(u) Commercial papers issued Commercial papers issued by the Company are recognised at redemption value net of unamortised finance charges.
�e difference between redemption value and issue value is amortised on a time basis and is disclosed separately under finance charges.
2.2 Change in estimates:
a. During the current year, the Company has revised the estimate of provision on standard assets. Had the Company used the estimate applicable in previous year the provision on standard assets would have been lower by H 1,790 lakhs.
b. During the current year, the Company has revised the estimate of provision on sub-standard assets. Had the Company used the estimate applicable in previous year the provision on sub-standard assets would have been lower by H 1,474 lakhs.
(B lakhs)
Particulars 31 March 2016 31 March 2015
Authorised Shares
2,500,000,000 (31 March 2015: 2,500,000,000) equity shares of H10 each 250,000 250,000
250,000 250,000
Issued, subscribed and fully paid up shares
1,921,161,357 (31 March 2015: 1,858,661,357) equity shares of H10 each 192,116 185,866
192,116 185,866
3. Share Capital
Reconciliation of the shares outstanding at the beginning and at the end of the reporting period
Equity Shares 31 March 2016 31 March 2015
No. of Shares B lakhs No. of Shares B lakhs
At the beginning of the year 1,858,661,357 185,866 1,858,661,357 185,866
Issued during the year 62,500,000 6,250 - -
Outstanding at the end of year 1,921,161,357 192,116 1,858,661,357 185,866
Notes to Financial Statement for the year ended 31 March 2016
(Amount in Rupees Lakhs unless otherwise stated)
91Annual Report 2016 Fullerton India Credit Company Limited

Terms/rights attached to equity shares
�e Company has only one class of equity shares having a par value of H 10 per share. Each holder of equity shares is entitled to one vote per share.
Any Dividend proposed by the Board of Directors is subject to the approval of the shareholders in the ensuing Annual General Meeting. Dividend is declared and paid in Indian Rupees.
In the event of liquidation of the Company, the holders of equity shares will be entitled to receive remaining assets of the Company, after distribution of all the preferential amounts. �e distribution will be in proportion to the number of equity shares held by the shareholders.
Shares held by holding /ultimate holding company and/or their subsidiaries/associates
Out of equity shares issued by the Company, shares held by its holding company, ultimate holding company and their subsidiaries/associates are as below:
(B lakhs)
Particulars 31 March 2016 31 March 2015
Angelica Investments Pte Ltd, Singapore, the holding company and its nominees
1,835,905,000 (31 March 2015: 1,773,405,000) equity shares of H10 each fully paid) 183,591 177,341
Fullerton Financial Holdings Pte Ltd, Singapore,
holding company of Angelica Investments Pte Ltd
85,256,357 (31 March 2015: 85,256,357) equity shares of H10 each fully paid) 8,526 8,526
Shares issued for consideration other than cash
Particulars 31 March 2016 31 March 2015
Equity shares of H 10 each allotted to Fullerton Financial Holdings Pte Ltd.,the holding company of erstwhile Fullerton Enterprises Pvt. Ltd., for consideration other than cash, pursuant to the scheme of Amalgamation approved by the Honorable High Court, Bombay.
85,256,357 85,256,357
Details of shareholders holding more than 5% shares in the Company
31 March 2016 31 March 2015
No. of Shares % holding in the class No. of Shares % holding in the class
Equity shares of H 10 each fully paid
Angelica Investments Pte. Ltd, Singapore, the holding company
1,835,905,000 95.56% 1,773,405,000 95.41%
As per records of the Company, including its register of shareholders/members and other declarations received from shareholders regarding beneficial interest, the above shareholding represents both legal and beneficial ownerships of shares.
Notes to Financial Statement for the year ended 31 March 2016
(Amount in Rupees Lakhs unless otherwise stated)
92Consolidated Financials

(B lakhs)
Particulars 31 March 2016 31 March 2015
General Reserve 96 96
(A) 96 96
Capital Reserve 349 349
(B) 349 349
Securities Premium Account
Balance as per the last financial statements 696 696
Add: Securities premium on issue of shares 8,750 -
Closing Balance (C) 9,446 696
Reserve Fund under Section 45 - IC of the RBI Act, 1934
Balance as per the last financial statements 13,958 7,939
Add: Amount transferred from surplus balance in the
statement of profit and loss 7,952 6,019
Closing Balance (D) 21,910 13,958
(Deficit) in the statement of profit and loss
Balance as per the last financial statements (44,178) (68,279)
Add: Profit for the year 39,258 30,120
Less: Transferred to Statutory Reserve (@ 20% of profit after tax
as required by section 45-IC of �e Reserve Bank of India Act, 1934) (7,952) (6,019)
Net deficit in the statement of profit and loss (E) (12,872) (44,178)
Total reserves and surplus (A+B+C+D+E) 18,929 (29,079)
4. Reserves and Surplus
Notes to Financial Statement for the year ended 31 March 2016
(Amount in Rupees Lakhs unless otherwise stated)
93Annual Report 2016 Fullerton India Credit Company Limited

(B lakhs)
Particulars Non Current portion Current Maturities
31 March 2016 31 March 2015 31 March 2016 31 March 2015
Term Loans
Indian rupee loan from banks (secured)* 350,701 331,908 174,333 101,229
Indian rupee loan from banks (unsecured) - 11,500 11,500 -
Debentures
Debentures (secured)** 273,300 115,800 23,690 88,850
Debentures (unsecured) 62,000 30,000 - 2,500
Total 686,001 489,208 209,523 192,579
�e above amount includes
Secured Borrowings 624,001 447,708 198,023 190,079
Unsecured Borrowings 62,000 41,500 11,500 2,500
Less: Amount disclosed under the head
other current liabilities (refer note 9) - - 209,523 192,579
Total 686,001 489,208 - -
* Indian rupee loan from banks are secured by first pari passu charge over all loan receivables except specific charge on specific loan receivables for one of the financial institution. (Term loan outstanding as on 31 March 2016 : H3,465 Lakhs; 31 March 2015 : H5,097 Lakhs)
** Debentures are secured by first pari passu charge over all loan receivables and immovable property.
5. Long Term Borrowings
Terms of repayment of term loans as on 31 March 2016
Original maturity of loan (in no. of days)
Rate of Interest
Due within 1 Year Due 1 to 2 Year Due 2 to 3 Years More than 3 Years Total
No. of installments
H Lakhs No. of installments
H Lakhs No. of installments
H Lakhs No. of installments
H Lakhs H Lakhs
Monthly repayment schedule
1096-1460 11% - 12% 6 25,000 - - - - - - 25,000
More than 1460 09% - 11% 12 1,632 12 1,632 1 201 - - 3,465
Quarterly repayment schedule
731-1095 09% - 11% 10 8,362 6 4,500 - - - - 12,862
1096-1460 09% - 11% 37 48,873 8 13,750 - - - - 62,623
More than 1460 09% - 11% 29 22,466 50 41,569 50 45,736 69 55,729 165,500
Half yearly repayment schedule
731-1095 09% - 11% 2 3,333 1 1,667 - - - - 5,000
1096-1460 09% - 11% 2 5,000 1 2,500 - - - - 7,500
More than 1460 09% - 11% 11 28,167 18 40,083 21 42,667 25 39,667 150,584
Yearly repayment schedule
1096-1460 09% - 11% 1 5,000 1 5,000 - - - - 10,000
More than 1460 09% - 11% 3 6,500 3 6,500 4 11,500 6 23,000 47,500
Bullet repayment schedule
1096-146009% - 11% 1 11,500 1 15,000 - - - - 26,500
11% - 12% 2 20,000 - - - - - - 20,000
Total 116 185,833 101 132,201 76 100,104 100 118,396 536,534
Notes to Financial Statement for the year ended 31 March 2016
(Amount in Rupees Lakhs unless otherwise stated)
94Consolidated Financials

Terms of repayment of NCD as on 31 March 2016
Original maturity of loan (in no. of days)
Rate of Interest Due within 1 Year Due 1 to 2 Year Due 2 to 3 Year More than 3 Years Total
H Lakhs H Lakhs H Lakhs H Lakhs H Lakhs
Issued at par and redeemable at par
366-73008% - 09% 2,500 3,950 - - 6,450
09% - 11% - 3,350 - - 3,350
731-1095 09% - 11% 8,800 33,000 1,700 - 43,500
1096-146008% - 09% - - 11,500 - 11,500
09% - 11% 11,390 7,500 5,500 - 24,390
More than 1460 09% - 11% 1,000 1,000 32,500 210,300 244,800
11% - 12% - - 11,190 13,810 25,000
Total 23,690 48,800 62,390 224,110 358,990
Terms of repayment of NCD as on 31 March 2015
Original maturity of loan (in no. of days)
Rate of Interest Due within 1 Year Due 1 to 2 Year Due 2 to 3 Year More than 3 Years Total
H Lakhs H Lakhs H Lakhs H Lakhs H Lakhs
Issued at par and redeemable at par
366-73008% - 09% 20,500 - - - 20,500
09% - 11% 750 - - - 750
731-109509% - 11% 23,500 8,800 - - 32,300
11% - 12% 39,100 - - - 39,100
1096-1460 09% - 11% 7,500 18,500 7,500 - 33,500
More than 146009% - 11% - 1,000 1,000 89,000 91,000
11% - 12% - - - 20,000 20,000
Total 91,350 28,300 8,500 109,000 237,150
5. Long Term Borrowings (Contd.)
Terms of repayment of term loans as on 31 March 2015
Original maturity of loan (in no. of days)
Rate of Interest
Due within 1 Year Due 1 to 2 Year Due 2 to 3 Years More than 3 Years Total
No. of installments
H Lakhs No. of installments
H Lakhs No. of installments
H Lakhs No. of installments
H Lakhs H Lakhs
Monthly repayment schedule
1096-1460 09% - 11% - - 6 25,000 - - - - 25,000
More than 1460 11% - 12% 12 1,632 12 1,632 12 1,632 1 201 5,097
Quarterly repayment schedule
366-720 09% - 11% 1 625 - - - - - - 625
731-1095 09% - 11% 6 6,250 8 8,750 2 2,500 - - 17,500
11% - 12% 14 11,271 5 3,237 - - - - 14,508
1096-1460 09% - 11% 23 43,007 30 55,651 9 17,875 - - 116,533
11% - 12% 19 16,944 11 9,097 - - - - 26,041
More than 1460 09% - 11% 2 2,000 16 12,417 20 18,417 26 22,167 55,000
11% -12 % 4 5,000 2 2,500 - - - - 7,500
Half yearly repayment schedule
731-1095 09% - 11% 2 3,333 2 3,333 1 1,667 - - 8,333
1096-1460 09% - 11% 1 2,500 2 5,000 1 2,500 - - 10,000
More than 1460 09% - 11% 3 8,667 10 24,729 12 27,229 19 31,374 91,999
Yearly repayment schedule
1096-1460 09% - 11% - - 1 3,750 1 3,750 - - 7,500
More than 1460 09% - 11% - - 1 2,500 1 2,500 2 5,000 10,000
11% - 12% - - 1 2,500 1 2,500 2 5,000 10,000
Bullet repayment schedule
731-109509% - 11% - - - - 1 7,500 - - 7,500
11% -12 % - - 1 10,000 - - - - 10,000
1096-1460 09% - 11% - - 2 21,500 - - - - 21,500
Total 87 101,229 110 191,596 61 88,070 50 63,742 444,637
Notes to Financial Statement for the year ended 31 March 2016
(Amount in Rupees Lakhs unless otherwise stated)
95Annual Report 2016 Fullerton India Credit Company Limited

Particulars of Secured Redeemable Non-convertible Debentures:
Particulars Face Value (H Lakhs) Quantity Date of Redemption 31 March 2016 31 March 2015
10.45% Series 27C 5 500 3-Nov-2023 2,500 2,500
9.85% Series 24 10 400 22-May-2023 4,000 4,000
10.60% Series 22 10 750 28-Apr-2023 7,500 7,500
9.16% Series-33C 10 230 20-May-2022 2,300 -
10.00% Series 29A-II 5 1,800 30-Dec-2021 9,000 9,000
9.20% Series-32II 10 1,500 28-May-2021 15,000 -
9.22% Series-34BII 10 700 8-Mar-2021 7,000 -
9.05% Series-34F 10 100 18-Jan-2021 1,000 -
9.25% Series-33DIII 10 1,000 30-Dec-2020 10,000 -
9.05% Series-36A 10 1,500 30-Dec-2020 15,000 -
9.50% Series-37 10 4,000 15-Dec-2020 40,000 -
9.10% Series-34DII 10 250 30-Nov-2020 2,500 -
9.05% Series-35 10 1,500 28-Nov-2020 15,000 -
9.85% Series 29A-I 5 1,200 14-Apr-2020 6,000 6,000
9.30% Series 30DII 10 250 29-Jan-2020 2,500 2,500
9.42% Series 30B 10 500 9-Dec-2019 5,000 5,000
9.10% Series-34DI 10 400 29-Nov-2019 4,000 -
9.90% Series 28 5 3,000 24-Jun-2019 15,000 15,000
9.10% Series-32I 10 1,500 28-May-2019 15,000 -
9.30% Series 30DI 10 250 29-Jan-2019 2,500 2,500
10.90% Series 27F 5 1,000 7-Jan-2019 5,000 5,000
8.95% Series-34E 10 150 17-Dec-2018 1,500 -
11.00% Series 27E 5 1,000 10-Dec-2018 5,000 5,000
8.90% Series-34C 10 1,000 15-Oct-2018 10,000 -
9.10% Series-34BI 10 150 7-Sep-2018 1,500 -
9.30% Series 25 10 500 14-Jun-2018 5,000 5,000
9.11% Series-33DII 10 170 25-May-2018 1,700 -
9.50% Series 23 10 1,000 8-May-2018 10,000 10,000
9.05% Series-33A 10 400 30-Apr-2018 4,000 -
10.05% Series 31A 10 500 12-Mar-2018 5,000 5,000
9.20% Series 30C 10 250 23-Jan-2018 2,500 2,500
10.00% Series 20E 10 100 15-Jan-2018 1,000 1,000
9.00% Series-34A 10 1,050 7-Aug-2017 10,500 -
9.11% Series-33F 10 1,250 17-Jul-2017 12,500 -
9.06% Series-33E 10 220 6-Jul-2017 2,200 -
9.05% Series-31C 10 1,000 30-May-2017 10,000 -
9.11% Series-33DI 10 115 24-May-2017 1,150 -
8.98% Series-31B 10 395 11-Apr-2017 3,950 -
10.29% Series 27G 5 360 27-Jan-2017 1,800 1,800
10.00% Series-20D 10 100 15-Jan-2017 1,000 1,000
8.96% Series-33B 10 250 9-Jan-2017 2,500 -
10.80% Series 27D 5 500 7-Nov-2016 2,500 2,500
10.95% Series 27A 5 200 18-Oct-2016 1,000 1,000
10.95% Series 26 5 3,000 7-Oct-2016 7,890 15,000
10.30% Series 27I 5 240 16-May-2016 1,200 1,200
5. Long Term Borrowings (Contd.)
Notes to Financial Statement for the year ended 31 March 2016
(Amount in Rupees Lakhs unless otherwise stated)
96Consolidated Financials

Particulars of Secured Redeemable Non-convertible Debentures:
Particulars Face Value (H Lakhs) Quantity Date of Redemption 31 March 2016 31 March 2015
10.34% Series 27H 5 160 18-Apr-2016 800 800
10.25% Series 27J 5 1,000 18-Apr-2016 5,000 5,000
8.85% Series 29B 5 1,000 18-Jan-2016 - 5,000
10.00% Series 20C 10 100 15-Jan-2016 - 1,000
10.25% Series19 10 750 11-Jan-2016 - 7,500
8.92% Series 30AI 5 2,000 24-Dec-2015 - 10,000
8.83% Series 30AII 5 1,100 18-Dec-2015 - 5,500
10.50% Series 18 10 2,000 11-Dec-2015 - 20,000
11.10% Series 17 10 1,660 4-Sep-2015 - 16,600
11.10% Series16 10 2,000 28-Aug-2015 - 20,000
11.50% Series 14 10 250 21-Aug-2015 - 2,500
10.00% Series 27B 5 150 20-Apr-2015 - 750
Total 296,990 204,650
5. Long Term Borrowings (Contd.)
Particulars of Unsecured Redeemable Non Convertible Debenture (subordinated debt)
Particulars Face Value (H Lakhs) Quantity Date of Redemption 31 March 2016 31 March 2015
9.25% Subdebts_Series 10 10 250 23-Mar-2026 2,500 -
9.30% Subdebts_Series 9II 10 250 25-Feb-2026 2,500 -
9.50% Subdebts_Series 7I 10 1,000 13-Oct-2025 10,000 -
9.50% Subdebts_Series 5I 10 250 10-Jun-2025 2,500 -
9.60% Subdebts Series 4 10 500 26-Dec-2024 5,000 5,000
10.50% Subdebts Series 3 5 1,000 28-Oct-2023 5,000 5,000
9.30% Subdebts_Series 9I 10 250 25-Apr-2023 2,500 -
11.40% Subdebts Series 2C 10 500 28-Oct-2022 5,000 5,000
9.40% Subdebts_Series 7II 10 500 13-Oct-2022 5,000 -
11.40% Subdebts Series 2B 10 400 28-Sep-2022 4,000 4,000
11.40% Subdebts Series 1B 10 481 14-Sep-2022 4,810 4,810
9.40% Subdebts_Series 6II 10 250 3-Aug-2022 2,500 -
9.40% Subdebts_Series 5II 10 200 10-Jun-2022 2,000 -
9.50% Subdebts_Series 8 10 250 25-Jun-2021 2,500 -
11.25% Subdebts Series 2A 10 100 27-Jun-2018 1,000 1,000
11.25% Subdebts Series 1A 10 519 14-Jun-2018 5,190 5,190
Total 62,000 30,000
Particulars of Unsecured Redeemable Non Convertible Debenture
Particulars Face Value (H Lakhs) Quantity Date of Redemption 31 March 2016 31 March 2015
11.40% Series 27 10 250 22-Jan-2016 - 2,500
Total - 2,500
Notes to Financial Statement for the year ended 31 March 2016
(Amount in Rupees Lakhs unless otherwise stated)
97Annual Report 2016 Fullerton India Credit Company Limited

6. Other Long Term Liabilities
(B lakhs)
Particulars 31 March 2016 31 March 2015
Interest accrued but not due on debentures 1,969 497
Employee benefits payable 1,157 753
Unamortised income
Unamortised loan processing fees 5,136 5,015
Unamortised income on securitisation 42 -
Others 187 250
Total 8,491 6,515
(B lakhs)
Particulars Long Term Short Term
31 March 2016 31 March 2015 31 March 2016 31 March 2015
Provision for employee benefits
Provision for gratuity (refer note 33) 10 - 35 170
Provision for superannuation - - - 46
Provision for leave benefits - - 26 34
Other provisions
Provision for standard assets (refer note 2.2 (a)) 5,727 3,477 2,742 1,687
Provision for sub-standard assets (refer note 2.2 (b)) 7,350 4,494 - -
Provision for securitised loans 10 - 24 -
Provision for security deposits 86 86 - -
Total 13,183 8,057 2,827 1,937
7. Provisions
8. Short Term Borrowings(B lakhs)
Particulars 31 March 2016 31 March 2015
Loan repayable on demand
Cash credit from banks (unsecured) 7,503 5
Other loans and advances
Indian rupee loan from banks (secured)* - 1,500
Indian rupee loan from banks (unsecured) 5,000 -
Commercial paper (unsecured) 109,187 88,910
Total 121,690 90,415
�e above amount includes
Secured borrowings - 1,500
Unsecured borrowings 121,690 88,915
Total 121,690 90,415
*Cash Credit from banks and Indian rupee loan from bank is secured by first pari passu charge over all loan receivables
Notes to Financial Statement for the year ended 31 March 2016
(Amount in Rupees Lakhs unless otherwise stated)
98Consolidated Financials

9. Other Current Liabilities(B lakhs)
Particulars 31 March 2016 31 March 2015
Other liabilitiesCurrent maturities of long term borrowings (refer note 5) 209,523 192,579Expenses and other payable
(refer note 34 for details of dues to Micro Small and Medium Enterprises )
9,186 7,052
Employee benefits payable 5,567 4,839Bank balances (Book overdraft) 41,014 32,425Interest accrued but not due On debentures 15,093 11,461 On bank loans 763 359 On others - 1Undisputed statutory dues payable 971 897Payable towards asset assignment / securitisation 4,024 335Others 7,797 5,572Unamortised income Unamortised loan processing fees 7,810 5,558 Unamortised income on securitisation 91 -Total 301,839 261,078
Particulars Office Equipments
Furniture & Fixtures
Computers & Accessories
Leasehold Improvements
Vehicles Land & Building*
Leased Assets
Total
CostAt 1 April 2014 2,678 2,384 4,285 3,392 65 6 96 12,906
Addition 518 232 647 95 65 - 28 1,585
Disposals 431 131 588 219 42 - - 1,411
At 31 March 2015 2,765 2,485 4,344 3,268 88 6 125 13,080Addition 559 458 774 419 - - 13 2,223
Disposals 131 152 157 138 - - - 578
At 31 March 2016 3,193 2,791 4,961 3,549 88 6 138 14,725Depreciation -At 1 April 2014 2,096 1,962 3,669 2,762 65 - 13 10,567
Charge for the year 368 277 443 323 4 - 29 1,445
Disposals 430 124 588 216 42 - - 1,401
At 31 March 2015 2,034 2,115 3,524 2,868 27 - 42 10,611Charge for the year 426 283 579 357 16 - 34 1,696
Disposals 128 146 156 134 - - - 564
At 31 March 2016 2,332 2,252 3,947 3,092 44 - 76 11,743Impairment -At 1 April 2014 8 14 3 13 - - - 38
Additions - - - - - - - -
Charge for the year - - - - - - - -
At 31 March 2015 8 14 3 13 - - - 38Additions - - - - - - - -
Charge/(release) for the year (8) (14) (3) (13) - - - (38)
At 31 March 2016 - - - - - - - -Net BlockAt 31 March 2015 723 356 818 386 61 6 83 2,432At 31 March 2016 860 539 1,014 457 44 6 62 2,983�e Company does not have any other leasehold assets except as disclosed above.
All assets have been recognised at cost
Capital Work in ProgressAt 31 March 2015 38 1 197 2 - - - 237At 31 March 2016 6 2 266 1 - - - 276* Mortgaged as security deposit against secured non-convertible debentures
10. Tangible Assets (H Lakhs)
Notes to Financial Statement for the year ended 31 March 2016
(Amount in Rupees Lakhs unless otherwise stated)
99Annual Report 2016 Fullerton India Credit Company Limited

11. Intangible Assets
12. Non-Current Investments
(B lakhs)
Particulars 31 March 2016 31 March 2015
Non Trade Investments (valued at cost unless stated otherwise)
Investment in equity instruments (unquoted)
a ) Others
50,000 (31 March 2015: 50,000) equity shares of H 10 each 5 5
fully paid-up in Alpha Micro Finance Consultants Private Limited
Net Value 5 5
Aggregate amount of unquoted investments 5 5
(B lakhs)
Particulars 31 March 2016 31 March 2015
Deferred tax liability
Unamortised ancillary cost of borrowings 1,346 1,063
Unamortised loan origination costs 3,184 2,584
Fixed assets: Impact of difference between tax depreciation and depreciation/ amortisation charged for the financial reporting (FIHFCL)
3 -
Gross deferred tax liability (A) 4,533 3,647
13. Deferred Tax Asset (Net)
(B lakhs)
Particulars Computer Software Total
Gross blockAt 1 April 2014 6,094 6,094Additions 384 384Disposals 319 319At 31 March 2015 6,159 6,159Additions 1,939 1,939Disposals 325 325At 31 March 2016 7,774 7,774DepreciationAt 1 April 2014 4,461 4,461Charge for the year 864 864Deductions 263 263At 31 March 2015 5,062 5,062Charge for the year 742 742Deductions 71 71At 31 March 2016 5,733 5,733Net blockAt 31 March 2015 1,096 1,096At 31 March 2016 2,040 2,040Capital Work in ProgressAt 31 March 2015 890 890At 31 March 2016 113 113
Notes to Financial Statement for the year ended 31 March 2016
(Amount in Rupees Lakhs unless otherwise stated)
100Consolidated Financials

(B lakhs)
Particulars Non Current Current
31 March 2016 31 March 2015 31 March 2016 31 March 2015
A Portfolio loans
a. Secured, considered good*
Loans 456,051 328,881 57,432 45,022
b. Secured, considered doubtful**
Loans 16,314 12,722 - -
c. Unsecured, considered good*
Loans 277,784 239,584 293,400 230,803
d. Unsecured, considered doubtful**
Loans 5,178 3,963 - -
Sub-Total 755,327 585,150 350,832 275,826
B Security deposits
Unsecured, considered good 1,594 1,407 102 38
Unsecured, considered doubtful 86 86 - -
Sub-Total 1,680 1,493 102 38
C Advances recoverable in cash or in kind or for value to be received
Unsecured, considered good 645 440 - -
Sub-Total 645 440 - -
14. Loans And Advances
13. Deferred Tax Asset (Net) (Contd.)
(B lakhs)
Particulars 31 March 2016 31 March 2015
Deferred tax assets
Impact of expenditure charged to the statement of profit and loss in the current year but allowed for tax purposes on payment basis
175 284
Fixed assets: Impact of difference between tax depreciation and depreciation/ amortisation charged for the financial reporting
1,853 2,012
Provision for diminution in the value of investments 32 356
Provision for doubtful debts and advances 5,476 3,342
Provision for security deposits 30 30
Unamortised loan processing fees 4,480 3,659
Provision for expenses disallowed as per Income-tax Act, 1961 554 322
Interest income on non-performing loans recognised for tax purposes 554 -
Provision for Gratuity (FIHFCL) 1 -
Unabsorbed carried forward losses (FIHFCL) 78
Gross deferred tax asset (B) 13, 232 10,005
Net deferred tax asset (B-A) 8,699 6,358
Net deferred tax asset recognised (refer notes) 8,613 -
Note:1. For the previous year, the Company did not recognise net deferred tax assets in the absence of virtual certainty supported by
convincing evidence that sufficient taxable income will be available in future years against which such deferred tax asset can be realised.
2. �e subsidiary, FIHFCL, has not recognised net DTA in the absence of virtual certainty supported by convincing evidence that sufficient taxable income will be available in future years against which such deferred tax asset can be realised.
Notes to Financial Statement for the year ended 31 March 2016
(Amount in Rupees Lakhs unless otherwise stated)
101Annual Report 2016 Fullerton India Credit Company Limited

(B lakhs)
Particulars Non Current Current
31 March 2016 31 March 2015 31 March 2016 31 March 2015
D Other loans and advances
Retained interest receivable on securitisation 52 - 106 -
Advance Income Tax (net of provision for tax ) 1,406 370 - -
MAT credit entitlement (refer note 35) 12,677 14,136 - -
Prepaid expenses 16 34 812 638
Loans and advances to employees 7 6 9 9
Others 6 6 989 759
Sub-Total 14,164 14,552 1,916 1,406
E Capital advances
Unsecured, considered good 552 158 - -
Sub-Total 552 158 - -
Total (A+B+C+D+E) 772,368 601,793 352,850 277,270
* Represents standard assets in accordance with Company’s assets classification policy (refer note 2.1(g))
** Represents non-performing assets in accordance with Company’s assets classification policy (refer note 2.1(g))
14. Loans And Advances (Contd.)
(B lakhs)
Particulars Non Current Current
31 March 2016 31 March 2015 31 March 2016 31 March 2015
Non Current bank balances (refer note 18) 224 - - -Unamortised ancillary cost of borrowings 2,707 1,726. 1,183 1,346Unamortised loan origination costs 6,013 4,514 3,188 2,953Interest accrued and due On secured loans - - 542 323 On unsecured loans - - 683 607Interest Accrued but not due On deposits placed with banks - - 2,464 1,406 On government securities - - - 7 On debentures and bonds - - 168 106 On secured loans - - 5,713 3,599 On unsecured loans - - 7,975 7,667Other Assets - - 2 2Total 8,944 6,240 21,918 18,016
15. Other Assets
16. Current Investments(B lakhs)
Particulars 31 March 2016 31 March 2015Current investments (valued at lower of cost and fair value, unless stated otherwise)
a) Quoted: Government securities
Nil (31 March 2015: 5,000) units 8.40 % 2024 Government of India - 522
b) Unquoted: Certificate of deposits
22,500 (31 March 2015: 2,500) units of H 100,000 each of Axis Bank Limited 21,759 2,409
17,500 (31 March 2015: 10,000) units of H 100,000 each of ICICI Bank Limited 16,966 9,469
10,000 (31 March 2015: 2,500) units of H 100,000 each of Canara Bank 9,312 2,465
7,500 (31 March 2015: Nil) units of H 100,000 each of IDBI Bank Limited 7,363 -
2,500 (31 March 2015: Nil) units of H 100,000 each of DCB Bank Limited 2,466 -
5,000 (31 March 2015: Nil) units of H 100,000 each of State Bank of Hyderabad 4,666 -
Nil (31 March 2015: 5,000) units of H 100,000 each of Union Bank of India - 4,928
Nil (31 March 2015: 2,500) units of H 100,000 each of Corporation Bank - 2,477
Nil (31 March 2015: 2,500) units of H 100,000 each of Punjab National Bank - 2,471
Nil (31 March 2015: 2,500) units of H 100,000 each of Kotak Mahindra Bank - 2,366
Notes to Financial Statement for the year ended 31 March 2016
(Amount in Rupees Lakhs unless otherwise stated)
102Consolidated Financials

(B lakhs)
Particulars 31 March 2016 31 March 2015
c) Unquoted: Investment in Commercial Papers
4,000 (31 March 2015: 2,500) units of H 500,000 each of Housing Development Finance Corporation Ltd 19,644 12,286
Nil (31 March 2015: 1,000) units of H 500,000 each of Bajaj Finance Ltd. - 4,878
Nil (31 March 2015: 500) units of H 500,000 each of Tata Capital Ltd. - 2,405
d) Unquoted: Mutual funds (At net asset value)
624,183.35 (31 March 2015: Nil) units of H 10 each in ICICI Prudential Money Market Fund - Direct Growth 1,308 -
218,036.11 (31 March 2015: Nil) units in Birla Sun Life Cash Plus - Growth - Direct Plan 531 -
24,480.17 (31 March 2015: Nil) units DSP BlackRock Liquidity Fund - Direct Plan - Growth 531 -
22,644.38 (31 March 2015: Nil) units in Reliance Liquid Fund - Cash Plan - Direct Plan - Growth 554 -
16,786.28 (31 March 2015: Nil) units in Franklin India Treasury Management Account - Super Institutional - Direct
- Growth
380 -
e) Unquoted: Investment in debentures
150 (31 March 2015: 150) units of 9.84% NCD H1,000,000 each fully paid up in Housing Development Finance
Corporation Ltd
1,510 1,507
250 (31 March 2015: 250) units of 9.75% NCD H1,000,000 each fully paid up in LIC Housing Finance Ltd. 2,525 2,501
250 (31 March 2015: Nil) units of 8.28% NCD H1,000,000 each fully paid up in Rural Electrification Corporation
Limited
2,507 -
f) Unquoted: Investment in preference shares -
Nil (31 March 2015: 9,368,921) 1% preference shares of H 10 each - 937
fully paid-up in Bhartiya Samruddhi Finance Limited
g) Unquoted: Investment in equity shares
668,328 (31 March 2015: 668,328) equity shares of H 10 each 67 67
fully paid-up in SWAWS Credit Corporation India Private Limited
h) Unquoted: Investment in debentures
22,278 (31 March 2015: 22,278) units of H100 each fully paid-up 22 22
12% Optionally Convertible Debentures in SWAWS Credit Corporation India Private Limited
(A) 92,111 51,710
Less: Provision for diminution in value (B) (89) (1,026)
Net Value {(A)-(B)} 92,022 50,684
Aggregate Amount of quoted investment (at Cost Price:Nil , (31 March 2015:H 522)) - 522
Aggregate Amount of unquoted investment (at Cost Price H 89,957, (31 March 2015: H 48,553)) 92,022 50,162
16. Current Investments (Contd.)
(B lakhs)
Particulars Non Current Current
31 March 2016 31 March 2015 31 March 2016 31 March 2015Other receivable
Unsecured, considered good - - 657 254
Total - - 657 254
17. Trade Receivables
Notes to Financial Statement for the year ended 31 March 2016
(Amount in Rupees Lakhs unless otherwise stated)
103Annual Report 2016 Fullerton India Credit Company Limited

19. Revenue From Operations
(B lakhs)
Particulars Year ended 31 March 2016
Year ended 31 March 2015
Interest Income
Interest income on loans 193,234 150,214
Income from asset assignment and securitisation 1,161 453
Interest on bank deposits 5,270 3,042
Interest on investments 5,388 3,500
Other operating revenue
Processing fees 12,049 6,822
Ancillary income from operations 4,255 3,832
Total 221,357 167,863
20. Other Income(B lakhs)
Particulars Year ended 31 March 2016
Year ended 31 March 2015
Profit on sale of investments 3,918 1,941
Profit on sale of fixed assets (net) 22 38
Miscellaneous income 2,628 2,221
Total 6,568 4,200
18. Cash and Bank Balances
(B lakhs)
Particulars Non Current Current
31 March 2016 31 March 2015 31 March 2016 31 March 2015
Cash and cash equivalents:
Cash on hand - - 1,127 1,151
Balances with Banks
- On Current accounts - - 12,093 7,794
(A) - - 13,220 8,945
Other bank balances
- Deposits with original maturity for more than 12 months* 224 - 52,491 20,400
- Deposits with original maturity for more than 3 months* - - 16,576 25,735
but less than 12 months
(B) 224 - 69,067 46,135
224 - 82,287 55,080
Less: amount disclosed under non current assets (refer note15)
(224) - - -
Total ((A)+(B)) - - 82,287 55,080
* H 224 lakhs (31 March 2015 : Nil) pledged as cash collateral in connection with securitisation of loan portfolio
Notes to Financial Statement for the year ended 31 March 2016
(Amount in Rupees Lakhs unless otherwise stated)
104Consolidated Financials

21. Employee Benefit Expense(B lakhs)
Particulars Year ended 31 March 2016
Year ended 31 March 2015
Salaries, bonus and allowances 33,595 27,290Contribution to provident and other funds 1,103 978
Gratuity expense (refer note 33) 351 333
Staff welfare expenses 1,162 955Total 36,211 29,556
22. Other Expenses(B lakhs)
Particulars Year ended 31 March 2016
Year ended 31 March 2015
Printing and stationery 1,003 844Rent 2,714 2,395Rates and taxes 606 276Insurance 36 23Business promotion expenses 1,028 1,399Commission, Brokerage and Lead Generation 6,141 3,249Legal charges 242 164Professional Charges 6,159 4,683Collection expenses 4,145 4,328Courier charges 414 350Repairs and maintenance Office premises 1,446 1,129 Others 727 940Directors' sitting fees 33 14Travelling expenses 1,976 2,079Telecommunication expenses 866 738Payment to auditors (refer details below) 62 42Electricity charges 732 660Security charges 181 159Recruitment expenses 193 143Training expenses 397 283Fees and subscription 37 22Corporate social responsibility expenses 518 94Miscellaneous expenses 1,239 708Write off of fixed assets and intangible assets 265 66Total 31,160 24,788Payment to auditorsAs auditor:Audit fee 41 28Tax audit fee 6 4Limited review 5 5In other capacity:Certification matters 7 4Reimbursement of expenses 3 1
Notes to Financial Statement for the year ended 31 March 2016
(Amount in Rupees Lakhs unless otherwise stated)
105Annual Report 2016 Fullerton India Credit Company Limited

23. Finance Costs(B lakhs)
Particulars Year ended 31 March 2016
Year ended 31 March 2015
Interest
On loans from banks 49,671 32,662
On debentures 31,557 27,360
Premium on redemption of debentures 66 176
Discount on commercial papers 11,449 8,635
Amortisation of ancillary borrowing costs 1,490 1,466
Interest on advance tax - 1
Bank charges and others 844 561
Total 95,076 70,861
24. Provisions and Write Offs(B lakhs)
Particulars Year ended 31 March 2016
Year ended 31 March 2015
Bad debts written off during the year (net of recoveries) 14,371 11,520
Provision against assigned loans 3 (761)
Provision against standard assets 3,305 1,414
Provision against sub standard assets 2,856 2,244
Provision for diminution in value of investments (9) -
Total 20,526 14,417
25. Earnings Per Equity Share(B lakhs)
Particulars Year ended 31 March 2016
Year ended 31 March 2015
Profit after Tax 39,258 30,120
Weighted average number of shares used in computing
basic earnings per share 1,882,568,461 1,858,661,357
Weighted average number of equity shares in calculating
diluted EPS 1,882,568,461 1,858,661,357
Earnings per Share :
Basic (H) 2.09 1.62
Diluted (H) 2.09 1.62
[Nominal value of shares H 10 each (Previous Year : H 10)]
26. Segment Information �e Company operates in a single reportable segment i.e. financing, which has similar risks and returns for the purpose of AS
- 17 on ‘Segment Reporting’ specified under section 133 of the Act, read with rules 7 of Companies (Accounts) Rules, 2014. �e Company operates in single geographical segment, i.e. domestic.
Notes to Financial Statement for the year ended 31 March 2016
(Amount in Rupees Lakhs unless otherwise stated)
106Consolidated Financials

27. Related Party DisclosuresNames and other details of related parties
Ultimate Holding Company Temasek Holdings (Private) Limited
Holding CompaniesAngelica Investments Pte Ltd, Singapore (‘Angelica’)Fullerton Financials Holdings Pte Ltd (Holding Company of Angelica)
Fellow SubsidiaryFullerton Securities & Wealth Advisors Ltd.Fullerton Financial Holdings (International) Pte LtdTemasek International (Private) Limited
Key Management Personnel Mr. Shantanu Mitra, Chief Executive Officer and Managing Director
(B lakhs)
Transactions during the year Holding Companies
Subsidiaries Key Management Personnel
Fellow Subsidiary Total
31 March 2016
31 March 2015
31 March 2016
31 March 2015
31 March 2016
31 March 2015
31 March 2016
31 March 2015
31 March 2016
31 March 2015
Reimbursement for expenses incurred on behalf of the Company
2 3 - - - - 15 35 17 38
Expenses incurred by the Company on behalf of others
- - - - - - - 1 - 1
Issue of Share capital (including securities premium)
15,000 - - - - - - - 15,000 -
Salary and employee benefits
Mr. Shantanu Mitra - - - - 674 720 - - 674 720
28. Leasesa) Where the Company is the lessee: Premises are obtained on operating lease. �e lease term ranges from 11 months to 134 months and are renewable/
cancellable at the option of the Company. Certain lease agreements contain clause for escalation of lease payments. �ere are no restrictions imposed by lease arrangements. �ere are no subleases. Lease payments during the year are charged to the Statement of Profit and Loss.
�e following table sets forth, for the periods indicated, the details of future rentals payable on operating leases.
(B lakhs)
Particulars Year ended 31 March 2016
Year ended 31 March 2015
Operating lease payments recognised during the year 3,063 2,756
Minimum Lease Obligations
Not later than one year 2,755 2,374
Later than one year but not later than five years 7,473 2,327
Later than five years 2,246 533
b) Where the Company is the lessor: �e Company has entered into operating lease arrangement for servers which form part of the tangible assets. �is
lease has a non-cancellable arrangement of 3 years. �is lease contains a clause to enable upward revision of the rental charges on an annual basis according to prevailing market conditions.
�e following table sets forth, for the periods indicated, the details of future rentals receivable on operating leases were company is a lessor:
(B lakhs)
Particulars Year ended 31 March 2016
Year ended 31 March 2015
Operating lease rental recognised during the year 32 31
Minimum Lease Obligations
Not later than one year 35 32
Later than one year but not later than five years 34 53
Later than five years - -
Notes to Financial Statement for the year ended 31 March 2016
(Amount in Rupees Lakhs unless otherwise stated)
107Annual Report 2016 Fullerton India Credit Company Limited

29. Cash and Cash Equivalents for the purpose of Cash Flow Statement
(B lakhs)
Particulars Year ended 31 March 2016
Year ended 31 March 2015
Cash and Bank Balance (refer note 18 ) 82,287 54,039
Less: Other bank balances (refer note 18) (69,067) (45,106)
Balance considered as Cash and Cash Equivalents for Cash Flow Statement 13,220 8,934
30. Contingent liability and Commitmentsa) Contingent liabilities:
(B lakhs)
Description of the Liability Year ended 31 March 2016
Year ended 31 March 2015
Credit enhancement provided by the Company for the loans under securitisation arrangements (including cash collaterals and interest subordination)
282 -
Contingent liability for litigations pending against the Company 36 20
b) Capital and other commitments(i) Estimated amount of contracts remaining to be executed on capital account and not provided for as at 31 March 2016
is H 1,922 Lakhs (31 March 2015: H 775 Lakhs).
(ii) Loans sanctioned not yet disbursed as at 31 March 2016 were H 4,593 Lakhs (31 March 2015: H 5,578 Lakhs).
c) �e Company’s pending litigations, having an impact on the financial position, comprise certain proceedings pending with Income Tax and Service Tax authorities. �e Company has reviewed all such pending litigations and proceedings and has adequately provided wherever considered necessary.
In addition, the Company is involved in other legal proceedings and claims, which have arisen in the ordinary course of business. �e Company’s management does not reasonably expect that these legal actions, when ultimately concluded and determined, will have a material and adverse effect on the Company’s results of operations or financial condition.
31. Expenditure in Foreign Currency
(B lakhs)
Expenditure in Foreign Currency Year ended 31 March 2016
Year ended 31 March 2015
Travelling expenses 21 39
Ancillary borrowing costs 450 -
Training expenses 43 55
Business promotion expenses - 6
Repairs and maintenance 10 10
Directors sitting fees 12 -
Bank charges and Others 1 31
Total 537 141
Notes to Financial Statement for the year ended 31 March 2016
(Amount in Rupees Lakhs unless otherwise stated)
108Consolidated Financials

32. Employee Stock Appreciation Rights �e Company has an Employee Share based payment scheme, under which grants were made as per details provided below:
Grant 1 Grant 2 Grant 3 Grant 4 Grant 5Date of Grant 30 November 2011 1 April 2013 1 April 2013 1 April 2014 1 April 2015Value of the Grant H 568 Lakhs H 706 Lakhs H 741 Lakhs H 750 Lakhs H 800 LakhsPerformance Condition
Achievement of Profit before tax (PBT) and Return on Equity (ROE) targets as per approved business plan
Graded Vesting (subject to achievement of performance condition given above)
Tranche I: 33% vesting on
1 December 2013
Tranche I: 33% vesting on
1 December 2015
Tranche I: 33% vesting on
1 December 2016
Tranche I: 33% vesting on
1 December 2017
Tranche I: 33% vesting on
1 December 2018Tranche II: 33%
vesting on 1 December 2014
Tranche II: 33% vesting on
1 December 2016
Tranche II: 33% vesting on
1 December 2017
Tranche II: 33% vesting on
1 December 2018
Tranche II: 33% vesting on
1 December 2019Tranche III: 34%
vesting on 1 December 2015
Tranche III: 34% vesting on
1 December 2017
Tranche III: 34% vesting on
1 December 2018
Tranche III: 34% vesting on
1 December 2019
Tranche III: 34% vesting on
1 December 2020Vesting period (including performance period)
Tranche I: 2 years Tranche I: 2 years 8 months
Tranche I: 3 years 8 months
Tranche I: 3 years 8 months
Tranche I: 3 years 8 months
Tranche II: 3 years Tranche II: 3 years 8 months
Tranche II: 4 years 8 months
Tranche II: 4 years 8 months
Tranche II: 4 years 8 months
Tranche III: 4 years Tranche III: 4 years 8 months
Tranche III: 5 years 8 months
Tranche III: 5 years 8 months
Tranche III: 5 years 8 months
Exercise period Within 30 days from each vesting date but not later than 2 years from the date of last vesting.
Method of Settlement Cash Payout
�e estimated fair value of the grant at a notional value of H 10 per unit (as at the date of grant) is as below:
Particulars Grant 1 Grant 2 Grant 3 Grant 4 Grant 5
As at 31 March 2016 H 24.97 H 18.22 H 18.22 H 15.52 H 12.54
As at 31 March 2015 H 19.49 H 14.53 H 14.53 H 12.38 Nil
As at 31 March 2014 H 15.36 H 11.74 H 11.74 Nil Nil
As at 31 March 2013 H 12.78 Nil Nil Nil Nil
Exercise price Vest 1 H 12.78 H 14.53 Nil Nil Nil
Exercise price Vest 2 H 15.36 Nil Nil Nil Nil
Exercise price Vest 3 H 19.49 Nil Nil Nil Nil
Fair value is computed using the method provided in the scheme for estimating the valuation of the grant which is linked to the Net Book Value of the business.Adjustment has been made for the resignations during the year ended 31 March 2016 and the consequential impact of forfeiture of the grant.
Notes to Financial Statement for the year ended 31 March 2016
(Amount in Rupees Lakhs unless otherwise stated)
109Annual Report 2016 Fullerton India Credit Company Limited

33. Retirement and Other Employee Benefits �e Company has a defined benefit gratuity plan. Every employee who has completed five years or more of service gets a
gratuity on departure at 15 days salary (last drawn salary) for each completed year of service. �e following tables summaries the components of net benefit expense recognised in the Statement of Profit and Loss and the
amounts recognised in the balance sheet for the plan.
Statement of Profit and LossGratuity expense (recognised in Employee benefit expense):
(B lakhs)
Particulars 31 March 2016 31 March 2015
Current service cost 243 117
Interest cost on benefit obligation 69 54
Expected return on plan assets (56) (27)
Net actuarial (gain)/loss recognised in the year 95 189
Past service cost - -
Net Benefit Expense 351 333
Actual return on plan assets - -
32. Employee Stock Appreciation Rights (Contd.)
�e movement of the stock appreciation rights granted during the year is as under: Year ended 31 March 2016
Particulars (No. of Options) Grant - 1 Grant - 2 Grant - 3 Grant - 4 Grant - 5 Total H Lakhs
Grants outstanding at the beginning of the year 1,399,800 4,920,000 5,030,000 7,300,000 - 18,649,800 1,865
Grants made during the year - - - - 8,000,000 8,000,000 800
Grants forfeited on resignation of employees 34,000 200,500 400,000 950,000 525,000 2,109,500 211
Grants vested 1,108,400 1,590,600 - - - 2,699,000 270
Grants exercised 343,800 551,100 - - - 894,900 89
Grants outstanding – unvested at the end of the year - 3,128,900 4,630,000 6,350,000 7,475,000 21,583,900 2,158
Grants outstanding – vested and exercisable 1,022,000 1,039,500 - - - 2,061,500 206
Expense arising from the grants made till 31 March 2016 (H Lakhs)
87 276 236 236 207 1,041 1,041
Year ended 31 March 2015
Particulars (No. of Options) Grant - 1 Grant - 2 Grant - 3 Grant - 4 Grant - 5 Total H Lakhs
Grants outstanding at the beginning of the year 2,705,000 5,620,000 5,880,000 - - 14,205,000 1,421
Grants made during the year - - - 7,500,000 - 7,500,000 750
Grants forfeited on resignation of employees 335,000 700,000 850,000 200,000 - 2,085,000 209
Grants vested 1,108,800 - - - - 1,108,800 111
Grants exercised 970,200 - - - - 970,200 97
Grants outstanding – unvested at the end of the year 1,142,400 4,920,000 5,030,000 7,300,000 - 18,392,400 1,839
Grants outstanding – vested and exercisable 257,400 - - - - 257,400 26
Expense arising from the grants made till 31 March 2015 (H Lakhs)
97 220 170 199 - 686 686
Notes to Financial Statement for the year ended 31 March 2016
(Amount in Rupees Lakhs unless otherwise stated)
110Consolidated Financials

Balance SheetDetails of Provision for gratuity:
(B lakhs)
Particulars 31 March 2016 31 March 2015
Defined benefit obligation 1,155 861
Fair value of plan assets 1,110 691
Less: Unrecognised Past Service Cost - -
Plan asset/(liability) (45) (170)
Changes in the present value of the defined benefit obligation are as follows:
(B lakhs)
Particulars 31 March 2016 31 March 2015
Opening defined benefit obligation 861 581
Interest cost 69 54
Current service cost 243 117
Transfer (out)/in - -
Benefits paid (99) (556)
Actuarial (gains)/losses on obligation 80 665
Closing defined benefit obligation 1,155 861
33. Retirement and Other Employee Benefits (Contd.)
Changes in the fair value of plan assets are as follows:
(B lakhs)
Particulars 31 March 2016 31 March 2015
Opening fair value of plan assets 691 310
Expected return 56 27
Contributions by employer 477 435
Benefits paid (99) (556)
Actuarial gains/(losses) (15) 475
Closing fair value of plan assets 1,110 691
�e major categories of plan assets as a percentage of the fair value of total plan assets are as follows:
(B lakhs)
Particulars 31 March 2016 31 March 2015
Investments with insurer % 100 100
�e overall expected rate of return on assets is determined based on the market prices prevailing on that date applicable to the period over which obligation is to be settled. �ere has been a significant change in the expected rate of return on assets due to the stock market scenario.
Notes to Financial Statement for the year ended 31 March 2016
(Amount in Rupees Lakhs unless otherwise stated)
111Annual Report 2016 Fullerton India Credit Company Limited

�e principal assumptions used in determining gratuity liability for the Company’s plans are shown below: (B lakhs)
Particulars 31 March 2016 31 March 2015
Discount rate 7.80% 7.99%Expected rate of return on assets 7.80% 7.99%
Employee Turnover Category 1 - For basic upto H 1.2 lakhs Upto 4 yrs 40.50% and 5 yrs & above 2% at each age
Category 1 - For basic upto H 1.2 lakhs Upto 4 yrs 51% and 5 yrs & above 2% at each age
Category 2 - For basic more than H 1.2 lakhs Upto 4 yrs 23.1% and 5 yrs & above 2% at each age
Category 2 - For basic more than H 1.2 lakhs Upto 4 yrs 31% and 5 yrs & above 2% at each age
Future Salary rise 10% 10%
�e estimates of future salary increases, considered in actuarial valuation, take account of inflation, seniority, promotion and other relevant factors, such as supply and demand in the employment market.
Amounts for the current period and previous periods are as follows:(B lakhs)
Particulars 31 March 2016 31 March 2015 31 March 2014 31 March 2013 31 March 2012Defined benefit 1,155 861 581 253 229
Plan assets 1,110 691 310 172 148
Surplus/(deficit) (45) (170) (271) (81) (81)
Experience adjustments on plan liabilities (13) 498 117 64 56
Experience adjustments on plan assets (15) 475 (5) - (7)
34. �e Company identifies suppliers registered under the Micro, Small and Medium Enterprises Development Act, 2006, (MSMED) by obtaining confirmations from all suppliers Based on the information received by the Company, some of the suppliers have confirmed to be registered under MSMED Act, 2006. Accordingly the disclosure relating to amount unpaid as at the year ended together with interest paid/payable is disclosed below:
(B lakhs)
Sr. No.
Particulars Year ended 31 March 2016
Year ended 31 March 2015
1 �e principal amount and the interest due thereon (to be shown separately) remaining unpaid to any supplier as at the end of each accounting year
38 13
2 �e amount of interest paid by the buyer in terms of section 16 of the Micro Small and Medium Enterprise Development Act, 2006, along with the amounts of the payment made to the supplier beyond the appointed day during each accounting year
- -
3 �e amount of interest due and payable for the period of delay in making payment (which have been paid but beyond the appointed day during the year) but without adding the interest specified under Micro Small and Medium Enterprise Development Act, 2006.
- -
4 �e amount of interest accrued and remaining unpaid at the end of each accounting year;
- -
5 �e amount of further interest remaining due and payable even in the succeeding years, until such date when the interest dues as above are actually paid to the small enterprise for the purpose of disallowance as a deductible expenditure under section 23 of the Micro Small and Medium Enterprise Development Act, 2006.
- -
33. Retirement and other employee benefits (Contd.)
Notes to Financial Statement for the year ended 31 March 2016
(Amount in Rupees Lakhs unless otherwise stated)
112Consolidated Financials

35. During the year FICCL has utilised MAT credit entitlement of H 1,427 lakhs against provision for current tax of H11,869 lakhs.
36. �e subsidiary, FIFSED has made an application to the Registrar of Companies for its conversion into a private limited company vide application dated 29 April 2016.
�e outcome of the application is awaited as at the balance sheet date.
37. Additional disclosures required by Schedule III of the Act,
Name of the Entity Net Assets (Total Assets minus Total Liabilities)
Share in Profit or Loss
As % of consolidated
net assets
Amount
(B lakhs)
As % of consolidated
net assets
Amount
(B lakhs)
Parent subsidiariesIndian1) Fullerton India Home Finance Company Limited 2.22% 6,242 -1.27% (499)2) Fullerton India Foundation for Social and Economic Development
0.00% 2 0.00% 1
Total 2.22% 6,244 -1.27% (498)
(B lakhs)
Amount spent in cash
Yet to be paid in cash
Total
i) Construction / acquistion of any asset - - -
ii) On purpose other than (i) above 518 - 518
38. CSR Expenses
i) Gross amount required to be spent by the Group during the year H427 Lakhs ii) Amount spent during the year:
39. �e Group has reclassified/regrouped previous year figures to conform to current year’s classification, where applicable.
For and on behalf of the Board of Directors ofFullerton India Credit Company Limited
Sd/- Sd/-Gan Chee Yen Shantanu Mitra Chairman CEO and Managing Director
Sd/-Pankaj Malik Chief Financial Officer andCompany Secretary
Place : MumbaiDate : 19 May 2016
Notes to Financial Statement for the year ended 31 March 2016
(Amount in Rupees Lakhs unless otherwise stated)
113Annual Report 2016 Fullerton India Credit Company Limited

Independent Auditor’s Report
Report on the Financial StatementsWe have audited the accompanying standalone financial statements of Fullerton India Credit Company Limited (“the Company”), which comprise the Balance Sheet as at 31 March 2016, the Statement of Profit and Loss and Cash Flow Statement for the year then ended, and a summary of significant accounting policies and other explanatory information.
Management’s Responsibility for the Financial Statements�e Company’s Board of Directors is responsible for the matters stated in Section 134(5) of the Companies Act, 2013 (“the Act”) with respect to the preparation of these standalone financial statements that give a true and fair view of the financial position, financial performance and cash flows of the Company in accordance with accounting principles generally accepted in India, including the Accounting Standards specified under section 133 of the Act, read with Rule 7 of the Companies (Accounts) Rules, 2014. �is responsibility also includes maintenance of adequate accounting records in accordance with the provisions of the Act for safeguarding of the assets of the Company and for preventing and detecting frauds and other irregularities; selection and application of appropriate accounting policies; making judgments and estimates that are reasonable and prudent; and the design, implementation and maintenance of adequate internal financial control that were operating effectively for ensuring the accuracy and completeness of the accounting records, relevant to the preparation and presentation of the financial statements that give a true and fair view and are free from material misstatement, whether due to fraud or error.
Auditor’s ResponsibilityOur responsibility is to express an opinion on these standalone financial statements based on our audit. We have taken into account the provisions of the Act, the accounting and auditing
standards and matters which are required to be included in the audit report under the provisions of the Act and the Rules made thereunder. We conducted our audit in accordance with the Standards on Auditing, issued by the Institute of Chartered Accountants of India, as specified under Section 143(10) of the Act. �ose Standards require that we comply with ethical requirements and plan and perform the audit to obtain reasonable assurance about whether the financial statements are free from material misstatement.
An audit involves performing procedures to obtain audit evidence about the amounts and disclosures in the financial statements. �e procedures selected depend on the auditor’s judgment, including the assessment of the risks of material misstatement of the financial statements, whether due to fraud or error. In making those risk assessments, the auditor considers internal financial control relevant to the Company’s preparation of the financial statements that give a true and fair view in order to design audit procedures that are appropriate in the circumstances. An audit also includes evaluating the appropriateness of accounting policies used and the reasonableness of the accounting estimates made by the Company’s Directors, as well as evaluating the overall presentation of the financial statements. We believe that the audit evidence we have obtained is sufficient and appropriate to provide a basis for our audit opinion on the standalone financial statements.
OpinionIn our opinion and to the best of our information and according to the explanations given to us, the standalone financial statements give the information required by the Act in the manner so required and give a true and fair view in conformity with the accounting principles generally accepted in India of the state of affairs of the Company as at 31 March 2016, its profit, and its cash flows for the year ended on that date.
To the Members of Fullerton India Credit Company Limited
114Standalone Financials

Report on Other Legal and Regulatory Requirements1. As required by the Companies (Auditor’s report) Order,
2016 (“the Order”) issued by the Central Government of India in terms of sub-section (11) of section 143 of the Act, we give in the Annexure 1, a statement on the matters specified in paragraphs 3 and 4 of the Order.
2. As required by section 143 (3) of the Act, we report that:
(a) We have sought and obtained all the information and explanations which to the best of our knowledge and belief were necessary for the purpose of our audit;
(b) In our opinion proper books of account as required by law have been kept by the Company so far as it appears from our examination of those books;
(c) �e Balance Sheet, Statement of Profit and Loss, and Cash Flow Statement dealt with by this Report are in agreement with the books of account;
(d) In our opinion, the aforesaid standalone financial statements comply with the Accounting Standards specified under section 133 of the Act, read with Rule 7 of the Companies (Accounts) Rules, 2014;
(e) On the basis of written representations received from the directors as on 31 March 2016, and taken on record by the Board of Directors, none of the directors is disqualified as on 31 March 2016, from being appointed as a director in terms of section 164 (2) of the Act;
(f) With respect to the adequacy of the internal financial controls over financial reporting of the Company and
the operating effectiveness of such controls, refer to our separate Report in Annexure 2 to this report;
(g) With respect to the other matters to be included in the Auditor’s Report in accordance with Rule 11 of the Companies (Audit and Auditors) Rules, 2014, in our opinion and to the best of our information and according to the explanations given to us:
i. �e Company has disclosed the impact of pending litigations on its financial position in its financial statements – Refer Note 30 to the financial statements;
ii. �e Company did not have any long-term contracts, including derivative contracts, for which there were any material foreseeable losses; and
iii. �ere were no amounts which were required to be transferred to the Investor Education and Protection Fund by the Company.
For S.R. BATLIBOI & CO. LLPICAI Firm’s Registration Number: 301003E/E300005Chartered Accountants
Sd/-per Viren H. MehtaPartnerMembership Number: 048749
Mumbai19 May 2016
115Annual Report 2016 Fullerton India Credit Company Limited
Re: Fullerton India Credit Company Limited(i) (a) �e Company has maintained proper records
showing full particulars, including quantitative details and situation of fixed assets.
(b) Fixed assets have been physically verified by the management during the year and no material discrepancies were identified on such verification.
(c) According to the information and explanations given by the management, the title deeds of immovable properties included in fixed assets are held in the name of the Company.
(ii) �e Company’s business does not involve inventories and, accordingly, the requirements under paragraph 3(ii) of the Order are not applicable to the Company and hence not commented upon.
(iii) According to the information and explanations given to us, the Company has not granted any loans, secured or unsecured to companies, firms, Limited Liability Partnerships or other parties covered in the register maintained under section 189 of the Act. Accordingly, the provisions of clause 3 (iii)(a), (b) and (c) of the Order are not applicable to the Company and hence not commented upon.
(iv) In our opinion and according to the information and explanations given to us, there are no loans, investments,
guarantees, and securities granted in respect of which provisions of section 185 and 186 of the Act are applicable and hence not commented upon.
(v) �e Company has not accepted any deposits from the public.
(vi) To the best of our knowledge and as explained, the Central Government has not specified the maintenance of cost records under section 148(1) of the Act, for the products/services of the Company.
(vii) (a) �e Company is generally regular in depositing with appropriate authorities undisputed statutory dues including provident fund, employees’ state insurance, income-tax, sales-tax, service tax, customs duty, excise duty, value added tax, cess and other material statutory dues applicable to it.
(b) According to the information and explanations given to us, no undisputed amounts payable in respect of provident fund, employees’ state insurance, income-tax, service tax, sales-tax, duty of custom, duty of excise, value added tax, cess and other material statutory dues were outstanding, at the year end, for a period of more than six months from the date they became payable.
(c) According to the records of the Company, the dues outstanding of income-tax, sales-tax, service tax,
Annexure referred to in paragraph 1 under the heading “Report on other legal and regulatory requirements” of our report of even date
116Standalone Financials

Name of the Statute Nature of dues Amount under dispute (H)
Due Date Period to which it relates
Forum where dispute is pending
Chapter V of the Finance Act, 1994
Service tax 416,282 Various Dates Various Dates Commissioner of Central Excise (Appeals)
(viii) In our opinion and according to the information and explanations given by the management, the Company has not defaulted in repayment of dues to a financial institution, bank, debenture holders or government.
(ix) According to the information and explanations given by the management, the Company has not raised any money by way of initial public offer or further public offer, hence not commented upon.
Further, monies raised by the Company by way of term loans were applied for the purpose for which those were raised, though idle/surplus funds which were not required for immediate utilisation were gainfully invested in liquid assets payable on demand.
(x) Based upon the audit procedures performed for the purpose of reporting the true and fair view of the financial statements and according to the information and explanations given by the management, we report that no material fraud by the Company or on the Company by the officers and employees of the Company has been noticed or reported during the year.
(xi) According to the information and explanations given by the management, the managerial remuneration has been paid and provided in accordance with the requisite approvals mandated by the provisions of section 197, read with Schedule V to the Act.
(xii) In our opinion, the Company is not a nidhi company. �erefore, the provisions of clause 3(xii) of the Order are not applicable to the Company and hence not commented upon.
(xiii) According to the information and explanations given by the management, transactions with the related parties
are in compliance with section 177 and 188 of the Act where applicable and the details have been disclosed in the notes to the financial statements, as required by the applicable accounting standards.
(xiv) According to the information and explanations given to us and on an overall examination of the balance sheet, the Company has not made any preferential allotment or private placement of shares or fully or partly convertible debentures during the year and hence, reporting requirements under clause 3(xiv) are not applicable to the Company and, not commented upon.
(xv) According to the information and explanations given by the management, the Company has not entered into any non-cash transactions with directors or persons connected with him.
(xvi) According to the information and explanations given to us, we report that the Company has registered as required, under section 45-IA of the Reserve Bank of India Act, 1934.
For S.R. BATLIBOI & CO. LLPICAI Firm’s Registration Number: 301003E/E300005Chartered Accountants
Sd/-per Viren H. MehtaPartnerMembership Number: 048749
Mumbai19 May 2016
duty of custom, duty of excise, value added tax and cess on account of any dispute, are as follows:
117Annual Report 2016 Fullerton India Credit Company Limited

Annexure referred to in paragraph 2 (f) under the heading “Report on other legal and regulatory requirements” of our report of even date
We have audited the internal financial controls over financial reporting of Fullerton India Credit Company Limited (“the Company”) as of 31 March 2016 in conjunction with our audit of the standalone financial statements of the Company for the year ended on that date.
Management’s Responsibility for Internal Financial Controls�e Company’s Management is responsible for establishing and maintaining internal financial controls based on the internal control over financial reporting criteria established by the Company considering the essential components of internal control stated in the Guidance Note on Audit of Internal Financial Controls Over Financial Reporting issued by the Institute of Chartered Accountants of India. �ese responsibilities include the design, implementation and maintenance of adequate internal financial controls that were operating effectively for ensuring the orderly and efficient conduct of its business, including adherence to the Company’s policies, the safeguarding of its assets, the prevention and detection of frauds and errors, the accuracy and completeness of the accounting records, and the timely preparation of reliable financial information, as required under the Act.
Auditor’s ResponsibilityOur responsibility is to express an opinion on the Company’s internal financial controls over financial reporting based on our audit. We conducted our audit in accordance with the Guidance Note on Audit of Internal Financial Controls Over Financial Reporting (the “Guidance Note”) and the Standards on Auditing as specified under section 143(10) of the Act, to the extent applicable to an audit of internal financial controls, both applicable to an audit of Internal Financial Controls and, both issued by the Institute of Chartered Accountants of India. �ose Standards and the Guidance Note require that we comply with ethical requirements and plan and perform the audit to obtain reasonable assurance about whether adequate internal financial controls over financial reporting was established and maintained and if such controls operated effectively in all material respects.
Our audit involves performing procedures to obtain audit evidence about the adequacy of the internal financial controls system over financial reporting and their operating effectiveness. Our audit of internal financial controls over financial reporting included obtaining an understanding of internal financial controls over financial reporting, assessing the risk that a material weakness exists, and testing and evaluating the design and operating effectiveness of internal control based on the assessed risk. �e procedures selected depend on the auditor’s judgement, including the assessment of the risks of material misstatement of the financial statements, whether due to fraud or error.
We believe that the audit evidence we have obtained is sufficient and appropriate to provide a basis for our audit opinion on the internal financial controls system over financial reporting.
Meaning of Internal Financial Controls Over Financial ReportingA company’s internal financial control over financial reporting is a process designed to provide reasonable assurance regarding the reliability of financial reporting and the preparation of financial statements for external purposes in accordance with generally accepted accounting principles. A company’s internal financial control over financial reporting includes those policies and procedures that (1) pertain to the maintenance of records that, in reasonable detail, accurately and fairly reflect the transactions and dispositions of the assets of the company; (2) provide reasonable assurance that transactions are recorded as necessary to permit preparation of financial statements in accordance with generally accepted accounting principles, and that receipts and expenditures of the company are being made only in accordance with authorisations of management and directors of the company; and (3) provide reasonable assurance regarding prevention or timely detection of unauthorised acquisition, use, or disposition of the company’s assets that could have a material effect on the financial statements.
Report on Internal Financial Controls under Clause (i) of Sub-section 3 of Section 143 of the Act
To the Members of Fullerton India Credit Company Limited
118Standalone Financials

Inherent Limitations of Internal Financial Controls Over Financial ReportingBecause of the inherent limitations of internal financial controls over financial reporting, including the possibility of collusion or improper management override of controls, material misstatements due to error or fraud may occur and not be detected. Also, projections of any evaluation of the internal financial controls over financial reporting to future periods are subject to the risk that the internal financial control over financial reporting may become inadequate because of changes in conditions, or that the degree of compliance with the policies or procedures may deteriorate.
OpinionIn our opinion, the Company has, in all material respects, an adequate internal financial controls system over financial reporting and such internal financial controls over financial reporting were operating effectively as at 31 March 2016, based on the internal control over financial reporting criteria
established by the Company considering the essential components of internal control stated in the Guidance Note on Audit of Internal Financial Controls Over Financial Reporting issued by the Institute of Chartered Accountants of India.
For S.R. BATLIBOI & CO. LLPICAI Firm’s Registration Number: 301003E/E300005Chartered Accountants
Sd/-per Viren H. MehtaPartnerMembership Number: 048749
Mumbai19 May 2016
119Annual Report 2016 Fullerton India Credit Company Limited

(B lakhs)
Notes 31 March 2016 31 March 2015
Equity and LiabilitiesShareholders’ funds Share capital 3 192,116 185,866 Reserves and surplus 4 19,377 (29,131)Non-current liabilities Long-term borrowings 5 686,001 489,208 Other long term liabilities 6 8,464 6,515 Long-term provisions 7 13,164 8,057 Current liabilities Short-term borrowings 8 121,690 90,415 Other current liabilities 9 300,996 261,077 Short-term provisions 7 2,826 1,937 TOTAL 1,344,634 1,013,944 AssetsNon-current assets Fixed assets Tangible assets 10 2,949 2,432 Intangible assets 11 2,040 1,096 Assets under development 10 & 11 389 1,127 Non-current investments 12 6,005 1,005 Deferred tax asset (Net) 13 8,613 - Long-term loans and advances 14 769,982 601,792 Other non-current assets 15 8,929 6,240 Current assets Current investments 16 89,496 50,684 Trade receivables 17 657 254 Cash and bank balances 18 80,862 54,051 Short-term loans and advances 14 352,810 277,270 Other current assets 15 21,902 17,993 TOTAL 1,344,634 1,013,944Summary of significant accounting policies 2.1�e accompanying notes are an integral part of the financial statements
As per our report of even date
Balance Sheet as at 31 March 2016
S. R. BATLIBOI & CO. LLP For and on behalf of the Board of Directors ofICAI Firm Registration number : 301003E/E300005 Fullerton India Credit Company LimitedChartered Accountants
Sd/- Sd/- Sd/-per Viren H. Mehta Gan Chee Yen Shantanu MitraPartner Chairman CEO and Managing DirectorMembership No. 048749 Sd/- Pankaj Malik Chief Financial Officer and Company Secretary
Place : Mumbai Place : MumbaiDate : 19 May 2016 Date : 19 May 2016
120Standalone Financials

(B lakhs)
Notes 31 March 2016 31 March 2015
Income
Revenue from operations 19 221,246 167,824
Other income 20 6,448 4,200
Total revenue (I) 227,694 172,024
Expenses
Employee benefit expense 21 35,942 29,556
Other expenses 22 30,712 24,783
Depreciation and amortisation expense 10&11 2,434 2,309
Finance costs 23 95,076 70,860
Provisions and write-offs 24 20,516 14,420
Total expenses (II) 184,680 141,928
Profit before tax (III) =(I)-(II) 43,014 30,096
Tax expenses
Current tax 11,869 6,923
MAT credit entitlement - (6,765)
Adjustment of tax relating to earlier periods - (158)
Deferred tax (8,613) -
Total tax expense (IV) 3,256 -
Profit for the year (III)-(IV) 39,758 30,096
Earnings per equity share ( H) 25
Basic (Computed on the basis of total profit for the year) 2.11 1.62
Diluted (Computed on the basis of total profit for the year) 2.11 1.62 Summary of significant accounting policies 2.1�e accompanying notes are an integral part of the financial statements
As per our report of even date
Statement of Profit & Loss for the Year ended 31 March 2016
S. R. BATLIBOI & CO. LLP For and on behalf of the Board of Directors ofICAI Firm Registration number : 301003E/E300005 Fullerton India Credit Company LimitedChartered Accountants
Sd/- Sd/- Sd/-per Viren H. Mehta Gan Chee Yen Shantanu MitraPartner Chairman CEO and Managing DirectorMembership No. 048749 Sd/- Pankaj Malik Chief Financial Officer and Company Secretary
Place : Mumbai Place : MumbaiDate : 19 May 2016 Date : 19 May 2016
121Annual Report 2016 Fullerton India Credit Company Limited

Cash Flow Statement for the Year ended 31 March 2016
(B lakhs)
31 March 2016 31 March 2015
A. Cash flow from operating activities:
Profit before taxation 43,014 30,096
Adjustment for computing operating profit before working capital changes:
Depreciation and amortisation 2,434 2,309
Interest on fixed deposits and bonds (5,309) (3,086)
Interest on investments (5,264) (3,418)
Profit on sale of fixed assets (22) (38)
Write off of fixed assets and intangible assets 265 66
Profit on sale of investments (3,798) (1,926)
Unrealised (profit)/loss on investments (0) 3
Provision for standard/sub standard assets and bad debts written off 20,526 14,417
Provision for employees benefits (189) (53)
Amortisation of ancillary borrowing costs 1,490 1,466
Operating profit before working capital changes 53,146 39,836
Movements in working capital :
(Increase)/decrease in long term loans and advances (179,694) (195,643)
(Increase)/decrease in short term loans and advances (80,108) (65,554)
(Increase)/ decrease in other non current assets (1,485) (2,456)
(Increase)/decrease in other current assets (2,938) (3,720)
(Increase)/decrease in trade receivables (403) 13
Increase/(decrease) in current liabilities 23,652 25,908
Increase/(decrease) in other long term liabilities 1,950 3,007
Cash generated from operations (185,880) (198,609)
Income taxes paid (10,603) (6,285)
Net cash from operating activities (A) (196,483) (204,894)
B. Cash flow from investing activities:
Purchase of fixed assets and intangibles (3,636) (2,866)
Proceeds from sale of fixed assets 28 43
Investment in subsidiary company (5,000) (800)
Purchase of current investments (2,276,966) (1,201,237)
Sale/maturity of investments 2,246,402 1,197,536
Fixed deposit placed during the year (69,446) (58,071)
Fixed deposit matured during the year 46,125 19,639
Interest received on fixed deposits and bonds 4,168 2,154
Interest received on investments 820 115
Net cash from investing activities (B) (57,505) (43,487)
122Standalone Financials

(B lakhs)
31 March 2016 31 March 2015
C. Cash flow from financing activities
Proceeds from issuance of share capital (including share premium) 15,000 -
Proceeds from long term borrowings from banks and financial institutions 441,300 362,000
Proceeds from short term borrowings from banks and financial institutions 119,967 168,636
Repayment of long term borrowings from banks and financial institutions (227,564) (143,607)
Repayment of short term borrowings from banks and financial institutions (88,692) (161,435)
Payment of ancillary borrowing costs (2,307) (1,373)
Net cash used in financing activities (C ) 257,703 224,221
Net increase/(decrease) in cash and cash equivalents (A)+(B)+(C) 3,715 (24,160)
Cash and cash equivalents as at the beginning of the year 8,945 33,105
Cash and cash equivalents as at the end of the year 12,660 8,945
(refer note 29 )
Components of cash and cash equivalents as at the end of the year
Cash and cheques on hand 1,127 1,151
With banks - on current account 11,533 7,794
Cash and cash equivalents as at the end of the year 12,660 8,945Summary of significant accounting policies 2.1�e accompanying notes are an integral part of the financial statements
As per our report of even date
Cash Flow Statement for the Year ended 31 March 2016
S. R. BATLIBOI & CO. LLP For and on behalf of the Board of Directors ofICAI Firm Registration number : 301003E/E300005 Fullerton India Credit Company LimitedChartered Accountants
Sd/- Sd/- Sd/-per Viren H. Mehta Gan Chee Yen Shantanu MitraPartner Chairman CEO and Managing DirectorMembership No. 048749 Sd/- Pankaj Malik Chief Financial Officer and Company Secretary
Place : Mumbai Place : MumbaiDate : 19 May 2016 Date : 19 May 2016
123Annual Report 2016 Fullerton India Credit Company Limited

1. Corporate Information
Fullerton India Credit Company Limited (‘the Company’) is a public limited company domiciled in India and incorporated under the provisions of Companies Act, 1956. �e Company is a non-banking financial company (‘NBFC’) registered with the Reserve Bank of India (‘RBI’). �e Company provides loans to small and medium enterprises for working capital and growth, loans for commercial vehicles and two-wheelers, home improvement loans, loans against property, personal loans, working capital loans for urban salaried and self-employed and loans for rural livelihood advancement and financing of various rural micro enterprises.
2. Basis of Preparation �e financial statements of the Company have been prepared in accordance with generally accepted accounting principles
in India (‘Indian GAAP’). �e Company has prepared these financial statements to comply in all material respects with the Accounting Standards notified under section 133 of the Companies Act, 2013 (‘the Act’) read with rule 7 of the Companies (Accounts) Rules, 2014, and the provisions of the RBI as applicable to an NBFC. �e financial statements have been prepared on an accrual basis and under the historical cost convention except as detailed in note 2.1(i). �e accounting policies adopted in the preparation of financial statements are consistent with those of the previous year.
2.1 Summary of Significant Accounting Policies
(a) Use of estimates �e preparation of financial statements in conformity with Indian GAAP requires the management to make judgements,
estimates and assumptions that affect the reported amounts of revenues, expenses, assets and liabilities and disclosure of contingent liabilities at the end of reporting period. Although these estimates are based on management’s knowledge of current events and actions, uncertainty about these assumptions and estimates could result in the outcomes requiring a material adjustment to the carrying amount of assets and liabilities in future periods.
(b) Tangible fixed assets All tangible assets are carried at cost, net of accumulated depreciation and impairment loss, if any. Cost includes
purchase price and directly attributable cost of bringing the asset to its working condition for the intended use. Gain or loss arising from de-recognition of a fixed asset is measured as the difference between the net disposal
proceeds and the carrying amount of the asset and is recognised in the Statement of Profit and Loss when the asset is derecognised.
(c) Intangible assets Costs relating to acquisition and development of computer software are capitalised in accordance with the AS 26
‘Intangible Assets’ issued by the Institute of Chartered Accountants of India (‘ICAI’) and are amortised using the straight line method over a period of five years, which is the management’s estimate of its useful life.
(d) Depreciation on tangible fixed assets Depreciation on tangible fixed assets is provided using the Straight Line Method (‘SLM’) as per the useful life of the asset
estimated by the management. Useful life estimated by the Company
Useful life estimated by the Company (in years)
Useful Life as per Schedule II (in years)
Building 50 60
Computer Server and Other Accessories 4 6
Computer Desktop and Laptops 3 3
Furniture and Fixtures 5 10
Office Equipments 5 5
Handheld devices 2 5
Vehicles 4 8
Leasehold improvements are amortised over the period of the lease subject to a maximum lease period of 66 months.
Notes to Financial Statement for the year ended 31 March 2016
(Amount in Rupees Lakhs unless otherwise stated)
124Standalone Financials

Tangible assets having an original cost up to H 5,000 individually are depreciated fully in the year of purchase.
(e) Impairment �e carrying amounts of assets are reviewed at each balance sheet date if there is any indication of impairment, based
on internal/external factors. An impairment loss is recognised wherever the carrying amount of an asset exceeds its recoverable amount. �e recoverable amount is the greater of the asset’s net selling price and value in use. In assessing value in use, the estimated future cash flows are discounted to their present value using a pre-tax discount rate that reflects current market assessments of the time value of money and risk specific to the asset.
After impairment, depreciation is provided on the revised carrying amount of the asset over its remaining useful life.
(f) Investments Investments, which are readily realisable and intended to be held for not more than one year from the date on which
such investments are made, are classified as current investments. All other investments are classified as long-term investments. Current investments are carried in the financial statements at lower of cost and fair value determined in accordance with the NBFC directions. Investments in the units of mutual funds in the nature of current investments are valued at the net asset value declared by the mutual fund in respect of each particular scheme, in accordance with the NBFC directions. Long-term investments are carried at cost. However, provision for diminution in value is made to recognise a decline other than temporary in the value of the investments.
(g) Asset classification and Provisioning/write-off of Assets(i) Loans are classified as standard and non-performing assets in accordance with Company’s policy. A loan is
classified as NPA, where interest/installment is overdue for a period of 90 days and above, from the day it becomes due.
(ii) Loans are provided for/written off, in accordance with Company’s policy, subject to the minimum provision required as per Non–Banking Financial (Deposit Accepting or Holding) Companies Prudential Norms (Reserve Bank) Directions, 2007 as amended from time to time.
(h) Leases Where the Company is the lessor Assets given on operating leases are included in fixed assets. Lease income is recognised in the Statement of Profit
and Loss on a straight-line basis over the lease term. Costs, including depreciation are recognised as an expense in the Statement of Profit and Loss. Initial direct costs such as legal costs, brokerage costs, etc. are recognised immediately in the Statement of Profit and Loss.
Where the Company is the lessee Lease arrangements where the Lessor effectively retains, substantially, all the risks and benefits of ownership of the
leased term, are classified as operating leases. Operating lease payments are recognised as an expense in the Statement of Profit and Loss on a straight-line basis over the lease term.
(i) Revenue recognition Revenue is recognised to the extent that it is probable that the economic benefits will flow to the Company and the
revenue can be reliably measured.
i) Interest Income Interest income on loans given is recognised under the internal rate of return method. Such interest, where installments are overdue for 90 days and above, is recognised only when actually realised. Any
such income, recognised and remaining unrealised after the installments have become overdue for 90 days and above, is reversed.
Interest income on deposits with banks is recognised on a time proportion basis taking into account the amount outstanding and the applicable interest rate.
ii) Income from assignment / securitisation of loans and receivables Profit/premium arising at the time of securitisation / assignment of loan portfolio is amortised over the life of the
underlying loan portfolio/securities and any loss arising therefrom is accounted for immediately. Income from
Notes to Financial Statement for the year ended 31 March 2016
(Amount in Rupees Lakhs unless otherwise stated)
125Annual Report 2016 Fullerton India Credit Company Limited
interest strip (excess income spread) is recognised in the statement of profit and loss net of any losses when redeemed in cash. Interest retained under assignment of loan receivables is recognised on realisation basis over the life of the underlying loan portfolio.
iii) Fee income Loan processing fee/document fee/stamp fee are recognised over the term of the loan in proportion to the interest
accrued during the year. For the agreements foreclosed or transferred through assignment/securitisation, the unamortised portion of the fee is recognised as income to the Statement of Profit and Loss at the time of such foreclosure/transfer through assignment.
Additional charges such as penal, dishonour, foreclosure charges, etc. are recognised on realisation basis.
iv) Income on discounted instruments Income on discounted instruments is recognised over the tenor of the instrument on straight line basis.
v) Commission and brokerage income Commission and brokerage income earned for the services rendered are recognised on accrual basis.
vi) Dividend Income Dividend income is recognised when the shareholders’ right to receive payment is established by the balance sheet
date.
vii) Profit/Loss on sale of investments
Profit/loss on sale of investments is recognised on trade date basis. On disposal of an investment, the difference between its carrying amount and net disposal proceeds is charged or credited to the Statement of Profit and Loss.
(j) Foreign currency transactions
i) Initial recognition Foreign currency transactions are recorded at exchange rate prevailing on date of transaction.
ii) Conversion Foreign currency monetary balances are reported using the exchange rate prevailing at the reporting date. Non-monetary balances, which are measured in terms of historical cost denominated in a foreign currency, are
reported using the exchange rate on the date of the transaction.
iii) Exchange differences Exchange differences arising on the settlement of monetary balances or on the restatement of the Company’s
monetary balances at rates different from those at which they were initially recorded during the year, or reported in the previous financial statements, are recognised as income or as expense in the year in which they arise.
(k) Retirement and Other Employee benefits
i) Short Term Employee Benefits All short term employee benefits are accounted on undiscounted basis during the accounting period based on
services rendered by employees.
ii) Defined Contribution Plansa) �e contributions as specified by law are made to the Regional Provident Fund Commissioner and charged to
the Statement of Profit and Loss of the year when the contribution to the respective fund is due. �ere are no other obligations other than contribution payable to the provident fund.
b) Superannuation is provided for on accrual basis, in accordance with the Company’s policy.
iii) Defined Benefit Plans Gratuity liability is provided for on the basis of an actuarial valuation on projected unit credit method made at the end
of each financial year. Actuarial gain or loss is recognised in full in the period in which they occur in the Statement of Profit and Loss.
Notes to Financial Statement for the year ended 31 March 2016
(Amount in Rupees Lakhs unless otherwise stated)
126Standalone Financials
iv) Leave benefits Accumulated leave balance, which is expected to be utilised within the next twelve months, is treated as short term
employee benefit. �e Company measures the expected cost of such absences as the additional amount that it expects to incur as a result of unused entitlement that has accumulated at the reporting date.
(l) Income taxes
Tax expense comprises current and deferred tax. Current income tax is measured at the amount expected to be paid to the tax authorities in accordance with the Income Tax Act, 1961 enacted in India. �e tax rates and tax laws used to compute the amount are those that are enacted or substantively enacted at the reporting date.
Deferred income taxes reflects the impact of current year timing differences between taxable income and accounting income originating during the current year and reversal of timing differences of earlier years. Deferred tax is measured based on the tax rates and the tax laws enacted or substantively enacted at the balance sheet date. Deferred tax assets are recognised only to the extent that there is reasonable certainty that sufficient future taxable income will be available against which such deferred tax assets can be realised. In situations where the Company has unabsorbed depreciation or carry forward tax losses, all deferred tax assets are recognised only if there is virtual certainty supported by convincing evidence that they can be realised against future taxable profits.
At each balance sheet date, the Company re-assesses unrecognised deferred tax assets. It recognises unrecognised deferred tax assets to the extent that it has become reasonably certain or virtually certain, as the case may be that sufficient future taxable income will be available against which such deferred tax assets can be realised.
Minimum alternate tax (MAT) paid in a year is charged to the Statement of Profit and Loss as current tax. �e Company recognises MAT credit available as an asset only to the extent that there is convincing evidence that the Company will pay normal income tax during the specified period, i.e., the period for which MAT credit is allowed to be carried forward. In the year in which the Company recognises MAT credit as an asset in accordance with the Guidance Note on Accounting for Credit Available in respect of Minimum Alternative Tax under the Income Tax Act, 1961, the said asset is created by way of credit to the Statement of Profit and Loss and shown as “MAT Credit Entitlement.” �e Company reviews the “MAT credit entitlement” asset at each reporting date and writes down the asset to the extent the Company does not have convincing evidence that it will pay normal tax during the specified period.
(m) Earnings per share
Basic earnings per share is calculated by dividing the net profit or loss for the period attributable to equity shareholders (after deducting attributable taxes) by the weighted average number of equity shares outstanding during the year.
For the purpose of calculating diluted earnings per share, the net profit or loss for the year attributable to equity shareholders and the weighted average number of shares outstanding during the year are adjusted for the effects of all dilutive potential equity shares.
(n) Provisions & Contingencies
A provision is recognised when an enterprise has a present obligation as a result of past event; it is probable that an outflow of resources embodying economic benefits will be required to settle the obligation, in respect of which a reliable estimate can be made. Provisions are not discounted to its present value and are determined based on best estimate required to settle the obligation at the reporting date. �ese estimates are reviewed at each reporting date and adjusted to reflect the current best estimates.
A contingent liability is a possible obligation that arises from past events whose existence will be confirmed by the occurrence or non-occurrence of one or more uncertain future events beyond the control of the Company or a present obligation that is not recognised because it is not probable that an outflow of resources will be required to settle the obligation. A contingent liability also arises in extremely rare cases where there is a liability that cannot be recognised because it cannot be measured reliably. �e Company does not recognise a contingent liability but discloses its existence in the financial statements.
Notes to Financial Statement for the year ended 31 March 2016
(Amount in Rupees Lakhs unless otherwise stated)
127Annual Report 2016 Fullerton India Credit Company Limited
(o) Cash and cash equivalents
Cash and cash equivalents for the purpose of cash flow statement comprise cash at bank and in hand and short term investments with original maturity of three months or less.
(p) Share based payments
In case of stock appreciation rights, measurement and disclosure of the employee share-based payment plan is done in accordance with the Guidance Note on Accounting for Employee Share-based Payments, issued by the ICAI. �e Company measures compensation cost relating to stock appreciation rights using the intrinsic value method. Compensation expense is amortised over the vesting period of the option on a straight line basis.
(q) Borrowing costs
Ancillary borrowing costs incurred in connection with the arrangement of borrowings is amortised over the tenure of the respective borrowings.
(r) Loan origination costs
Loan origination costs such as credit verification, contact point verification, agreement stamping and direct selling agents commission are recognised as expense over the contractual tenor of the loan agreements in proportion to the interest accrued during the year. For the agreements foreclosed or transferred through assignment, the unamortised portion of the loan acquisition costs are recognised as charge to the Statement of Profit and Loss at the time of such foreclosure/transfer through assignment/securitisation.
(s) Operating cycle
Assets and Liabilities are classified as current and non-current based on the operating cycle which has been estimated to be 12 months. All assets and liabilities which are expected to be realised and settled, within a period of 12 months from the date of Balance Sheet have been classified as current and other assets and liabilities are classified as non-current.
(t) Cash flow statement
Cash flows are reported using the indirect method, whereby profit/(loss) before extraordinary items and tax is adjusted for the effects of transactions of non-cash nature and any deferrals or accruals of past or future cash receipts or payments. �e cash flows from operating, investing and financing activities of the Company are segregated based on the available information.
(u) Commercial papers issued
Commercial papers issued by the Company are recognised at redemption value net of unamortised finance charges. �e difference between redemption value and issue value is amortised on a time basis and is disclosed separately under finance charges.
2.2 Change in estimates:
a. During the current year, the Company has revised the estimate of provision on standard assets. Had the Company used the estimate applicable in previous year the provision on standard assets would have been lower by H 1,790 lakhs.
b. During the current year, the Company has revised the estimate of provision on sub-standard assets. Had the Company used the estimate applicable in previous year the provision on sub-standard assets would have been lower by H 1,474 lakhs.
Notes to Financial Statement for the year ended 31 March 2016
(Amount in Rupees Lakhs unless otherwise stated)
128Standalone Financials

(B lakhs)
Particulars 31 March 2016 31 March 2015
Authorised Shares
2,500,000,000 (31 March 2015: 2,500,000,000) equity shares of H10 each 250,000 250,000
250,000 250,000
Issued, subscribed and fully paid up shares
1,921,161,357 (31 March 2015: 1,858,661,357) equity shares of H10 each 192,116 185,866
192,116 185,866
3. Share Capital
Reconciliation of the shares outstanding at the beginning and at the end of the reporting year
Equity Shares 31 March 2016 31 March 2015
No. of Shares B Lakhs No. of Shares B Lakhs
At the beginning of the year 1,858,661,357 185,866 1,858,661,357 185,866
Issued during the year 62,500,000 6,250 - -
Outstanding at the end of year 1,921,161,357 192,116 1,858,661,357 185,866
Terms/rights attached to equity shares
�e Company has only one class of equity shares having a par value of H10 per share. Each holder of equity shares is entitled to one vote per share.
Any dividend proposed by the Board of Directors is subject to the approval of the shareholders in the ensuing Annual General Meeting. Dividend is declared and paid in Indian rupees.
In the event of liquidation of the Company, the holders of equity shares will be entitled to receive remaining assets of the Company, after distribution of all the preferential amounts. �e distribution will be in proportion to the number of equity shares held by the shareholders.
Shares held by holding /ultimate holding company and/or their subsidiaries/associates
Out of equity shares issued by the Company, shares held by its holding company, ultimate holding company and their subsidiaries/associates are as below:
(B lakhs)
Particulars 31 March 2016 31 March 2015
Angelica Investments Pte Ltd, Singapore, the holding company and its nominees
1,835,905,000 (31 March 2015: 1,773,405,000) equity shares of H10 each fully paid) 183,591 177,341
Fullerton Financial Holdings Pte Ltd, Singapore,
holding company of Angelica Investments Pte Ltd 8,526 8,526
85,256,357 (31 March 2015: 85,256,357) equity shares of H10 each fully paid)
Shares issued for consideration other than cash
Particulars 31 March 2016 31 March 2015
Equity shares of H10 each allotted to Fullerton Financial Holdings Pte Ltd.,the holding company of erstwhile Fullerton Enterprises Pvt. Ltd., for consideration other than cash, pursuant to the scheme of Amalgamation approved by the Honorable High Court, Bombay.
85,256,357 85,256,357
Notes to Financial Statement for the year ended 31 March 2016
(Amount in Rupees Lakhs unless otherwise stated)
129Annual Report 2016 Fullerton India Credit Company Limited

Details of shareholders holding more than 5% shares in the Company
31 March 2016 31 March 2015
No. of Shares % holding in the class No. of Shares % holding in the class
Equity shares of H10 each fully paid
Angelica Investments Pte. Ltd, Singapore, the holding company
1,835,905,000 95.56% 1,773,405,000 95.41%
As per records of the Company, including its register of shareholders/members and other declarations received from shareholders regarding beneficial interest, the above shareholding represents both legal and beneficial ownerships of shares.
(B lakhs)
Particulars 31 March 2016 31 March 2015
General Reserve 96 96
(A) 96 96
Capital Reserve 349 349
(B) 349 349
Securities Premium Account
Balance as per the last financial statements 696 696
Add: Securities premium on issue of shares 8,750 -
Closing Balance (C) 9,446 696
Reserve Fund under Section 45 - IC of the RBI Act, 1934
Balance as per the last financial statements 13,958 7,939
Add: Amount transferred from surplus balance in the
statement of profit and loss 7,952 6,019
Closing Balance (D) 21,910 13,958
(Deficit) in the statement of profit and loss
Balance as per the last financial statements (44,230) (68,307)
Add: Profit for the year 39,758 30,096
Less: Transferred to Statutory Reserve (@ 20% of profit after tax
as required by section 45-IC of �e Reserve Bank of India Act, 1934) (7,952) (6,019)
Net deficit in the statement of profit and loss (E) (12,424) (44,230)
Total reserves and surplus (A+B+C+D+E) 19,377 (29,131)
4. Reserves and Surplus
Notes to Financial Statement for the year ended 31 March 2016
(Amount in Rupees Lakhs unless otherwise stated)
130Standalone Financials

(B lakhs)
Particulars Non Current portion Current Maturities
31 March 2016 31 March 2015 31 March 2016 31 March 2015
Term Loans
Indian rupee loan from banks (secured)* 350,701 331,908 174,333 101,229
Indian rupee loan from banks (unsecured) - 11,500 11,500 -
Debentures
Debentures (secured)** 273,300 115,800 23,690 88,850
Debentures (unsecured) 62,000 30,000 - 2,500
Total 686,001 489,208 209,523 192,579
�e above amount includes
Secured Borrowings 624,001 447,708 198,023 190,079
Unsecured Borrowings 62,000 41,500 11,500 2,500
Less: Amount disclosed under the head
other current liabilities (refer note 9) - - 209,523 192,579
Total 686,001 489,208 - -
*Indian rupee loan from banks are secured by first pari passu charge over all loan receivables except specific charge on specific loan receivables for one of the financial institution. (Term loan outstanding as on 31 March 2016: H 3,465/- lakh, 31 March 2015: H 5,097/- lakh).
** Debentures are secured by first pari passu charge over all loan receivables and immovable property.
5. Long Term Borrowings
Terms of repayment of term loans as on 31 March 2016
Original maturity of loan
(in no. of days)
Rate of Interest
Due within 1 Year Due 1 to 2 Year Due 2 to 3 Years More than 3 Years Total
No. of installments
H Lakhs No. of installments
H Lakhs No. of installments
H Lakhs No. of installments
H Lakhs H Lakhs
Monthly repayment schedule
1096-1460 11% - 12% 6 25,000 - - - - - - 25,000
More than 1460 09% - 11% 12 1,632 12 1,632 1 201 - - 3,465
Quarterly repayment schedule
731-1095 09% - 11% 10 8,362 6 4,500 - - - - 12,862
1096-1460 09% - 11% 37 48,873 8 13,750 - - - - 62,623
More than 1460 09% - 11% 29 22,466 50 41,569 50 45,736 69 55,729 165,500
Half yearly repayment schedule
731-1095 09% - 11% 2 3,333 1 1,667 - - - - 5,000
1096-1460 09% - 11% 2 5,000 1 2,500 - - - - 7,500
More than 1460 09% - 11% 11 28,167 18 40,083 21 42,667 25 39,667 150,584
Yearly repayment schedule
1096-1460 09% - 11% 1 5,000 1 5,000 - - - - 10,000
More than 1460 09% - 11% 3 6,500 3 6,500 4 11,500 6 23,000 47,500
Bullet repayment schedule
1096-146009% - 11% 1 11,500 1 15,000 - - - - 26,500
11% - 12% 2 20,000 - - - - - - 20,000
Total 116 185,833 101 132,201 76 100,104 100 118,396 536,534
Notes to Financial Statement for the year ended 31 March 2016
(Amount in Rupees Lakhs unless otherwise stated)
131Annual Report 2016 Fullerton India Credit Company Limited
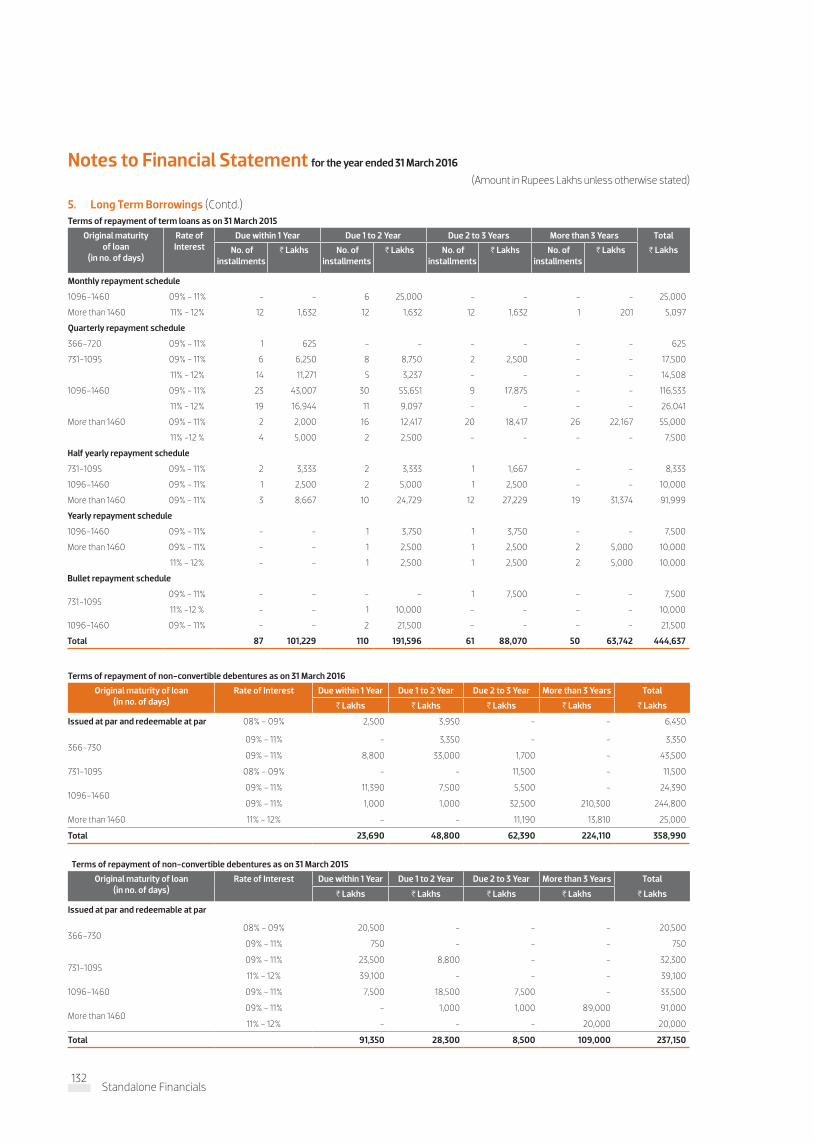
Terms of repayment of non-convertible debentures as on 31 March 2016
Original maturity of loan (in no. of days)
Rate of Interest Due within 1 Year Due 1 to 2 Year Due 2 to 3 Year More than 3 Years Total
H Lakhs H Lakhs H Lakhs H Lakhs H Lakhs
Issued at par and redeemable at par 08% - 09% 2,500 3,950 - - 6,450
366-73009% - 11% - 3,350 - - 3,350
09% - 11% 8,800 33,000 1,700 - 43,500
731-1095 08% - 09% - - 11,500 - 11,500
1096-146009% - 11% 11,390 7,500 5,500 - 24,390
09% - 11% 1,000 1,000 32,500 210,300 244,800
More than 1460 11% - 12% - - 11,190 13,810 25,000
Total 23,690 48,800 62,390 224,110 358,990
Terms of repayment of non-convertible debentures as on 31 March 2015
Original maturity of loan (in no. of days)
Rate of Interest Due within 1 Year Due 1 to 2 Year Due 2 to 3 Year More than 3 Years Total
H Lakhs H Lakhs H Lakhs H Lakhs H Lakhs
Issued at par and redeemable at par
366-73008% - 09% 20,500 - - - 20,500
09% - 11% 750 - - - 750
731-109509% - 11% 23,500 8,800 - - 32,300
11% - 12% 39,100 - - - 39,100
1096-1460 09% - 11% 7,500 18,500 7,500 - 33,500
More than 146009% - 11% - 1,000 1,000 89,000 91,000
11% - 12% - - - 20,000 20,000
Total 91,350 28,300 8,500 109,000 237,150
5. Long Term Borrowings (Contd.)Terms of repayment of term loans as on 31 March 2015
Original maturity of loan
(in no. of days)
Rate of Interest
Due within 1 Year Due 1 to 2 Year Due 2 to 3 Years More than 3 Years Total
No. of installments
H Lakhs No. of installments
H Lakhs No. of installments
H Lakhs No. of installments
H Lakhs H Lakhs
Monthly repayment schedule
1096-1460 09% - 11% - - 6 25,000 - - - - 25,000
More than 1460 11% - 12% 12 1,632 12 1,632 12 1,632 1 201 5,097
Quarterly repayment schedule
366-720 09% - 11% 1 625 - - - - - - 625
731-1095 09% - 11% 6 6,250 8 8,750 2 2,500 - - 17,500
11% - 12% 14 11,271 5 3,237 - - - - 14,508
1096-1460 09% - 11% 23 43,007 30 55,651 9 17,875 - - 116,533
11% - 12% 19 16,944 11 9,097 - - - - 26,041
More than 1460 09% - 11% 2 2,000 16 12,417 20 18,417 26 22,167 55,000
11% -12 % 4 5,000 2 2,500 - - - - 7,500
Half yearly repayment schedule
731-1095 09% - 11% 2 3,333 2 3,333 1 1,667 - - 8,333
1096-1460 09% - 11% 1 2,500 2 5,000 1 2,500 - - 10,000
More than 1460 09% - 11% 3 8,667 10 24,729 12 27,229 19 31,374 91,999
Yearly repayment schedule
1096-1460 09% - 11% - - 1 3,750 1 3,750 - - 7,500
More than 1460 09% - 11% - - 1 2,500 1 2,500 2 5,000 10,000
11% - 12% - - 1 2,500 1 2,500 2 5,000 10,000
Bullet repayment schedule
731-109509% - 11% - - - - 1 7,500 - - 7,500
11% -12 % - - 1 10,000 - - - - 10,000
1096-1460 09% - 11% - - 2 21,500 - - - - 21,500
Total 87 101,229 110 191,596 61 88,070 50 63,742 444,637
Notes to Financial Statement for the year ended 31 March 2016
(Amount in Rupees Lakhs unless otherwise stated)
132Standalone Financials
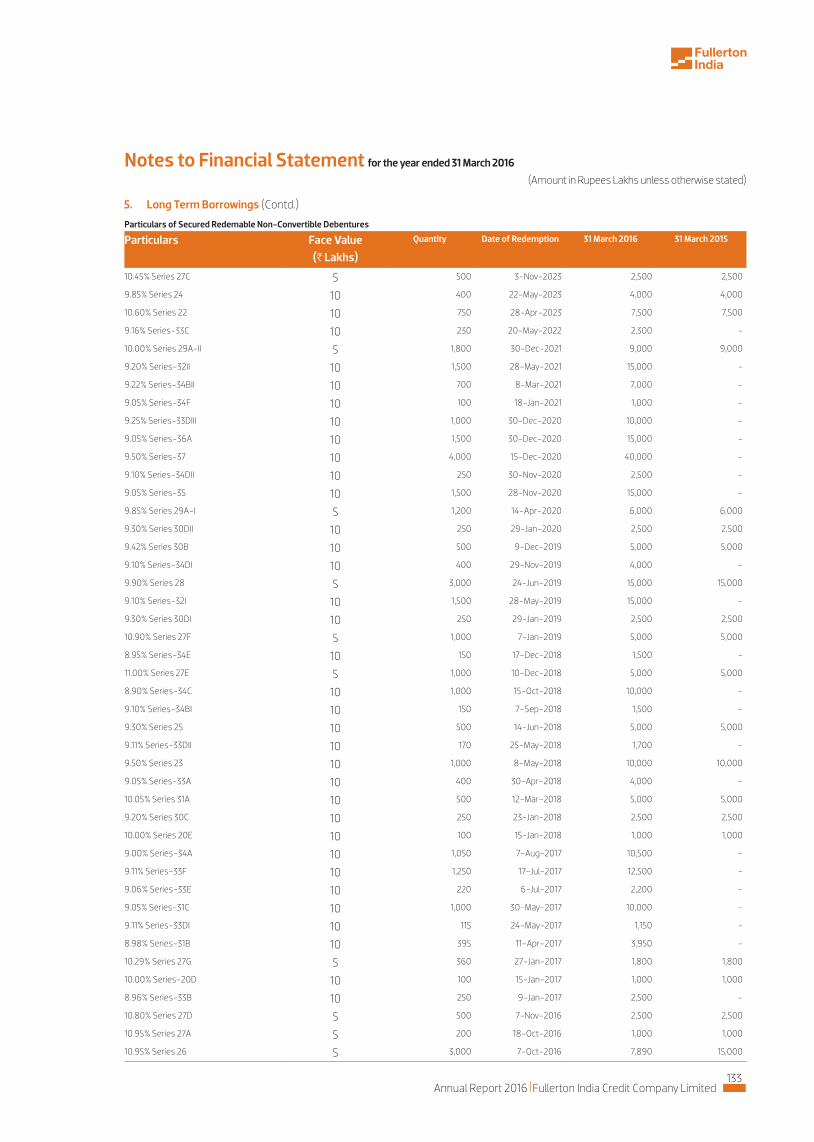
Particulars of Secured Redemable Non-Convertible Debentures
Particulars Face Value (H Lakhs)
Quantity Date of Redemption 31 March 2016 31 March 2015
10.45% Series 27C 5 500 3-Nov-2023 2,500 2,500
9.85% Series 24 10 400 22-May-2023 4,000 4,000
10.60% Series 22 10 750 28-Apr-2023 7,500 7,500
9.16% Series-33C 10 230 20-May-2022 2,300 -
10.00% Series 29A-II 5 1,800 30-Dec-2021 9,000 9,000
9.20% Series-32II 10 1,500 28-May-2021 15,000 -
9.22% Series-34BII 10 700 8-Mar-2021 7,000 -
9.05% Series-34F 10 100 18-Jan-2021 1,000 -
9.25% Series-33DIII 10 1,000 30-Dec-2020 10,000 -
9.05% Series-36A 10 1,500 30-Dec-2020 15,000 -
9.50% Series-37 10 4,000 15-Dec-2020 40,000 -
9.10% Series-34DII 10 250 30-Nov-2020 2,500 -
9.05% Series-35 10 1,500 28-Nov-2020 15,000 -
9.85% Series 29A-I 5 1,200 14-Apr-2020 6,000 6,000
9.30% Series 30DII 10 250 29-Jan-2020 2,500 2,500
9.42% Series 30B 10 500 9-Dec-2019 5,000 5,000
9.10% Series-34DI 10 400 29-Nov-2019 4,000 -
9.90% Series 28 5 3,000 24-Jun-2019 15,000 15,000
9.10% Series-32I 10 1,500 28-May-2019 15,000 -
9.30% Series 30DI 10 250 29-Jan-2019 2,500 2,500
10.90% Series 27F 5 1,000 7-Jan-2019 5,000 5,000
8.95% Series-34E 10 150 17-Dec-2018 1,500 -
11.00% Series 27E 5 1,000 10-Dec-2018 5,000 5,000
8.90% Series-34C 10 1,000 15-Oct-2018 10,000 -
9.10% Series-34BI 10 150 7-Sep-2018 1,500 -
9.30% Series 25 10 500 14-Jun-2018 5,000 5,000
9.11% Series-33DII 10 170 25-May-2018 1,700 -
9.50% Series 23 10 1,000 8-May-2018 10,000 10,000
9.05% Series-33A 10 400 30-Apr-2018 4,000 -
10.05% Series 31A 10 500 12-Mar-2018 5,000 5,000
9.20% Series 30C 10 250 23-Jan-2018 2,500 2,500
10.00% Series 20E 10 100 15-Jan-2018 1,000 1,000
9.00% Series-34A 10 1,050 7-Aug-2017 10,500 -
9.11% Series-33F 10 1,250 17-Jul-2017 12,500 -
9.06% Series-33E 10 220 6-Jul-2017 2,200 -
9.05% Series-31C 10 1,000 30-May-2017 10,000 -
9.11% Series-33DI 10 115 24-May-2017 1,150 -
8.98% Series-31B 10 395 11-Apr-2017 3,950 -
10.29% Series 27G 5 360 27-Jan-2017 1,800 1,800
10.00% Series-20D 10 100 15-Jan-2017 1,000 1,000
8.96% Series-33B 10 250 9-Jan-2017 2,500 -
10.80% Series 27D 5 500 7-Nov-2016 2,500 2,500
10.95% Series 27A 5 200 18-Oct-2016 1,000 1,000
10.95% Series 26 5 3,000 7-Oct-2016 7,890 15,000
5. Long Term Borrowings (Contd.)
Notes to Financial Statement for the year ended 31 March 2016
(Amount in Rupees Lakhs unless otherwise stated)
133Annual Report 2016 Fullerton India Credit Company Limited
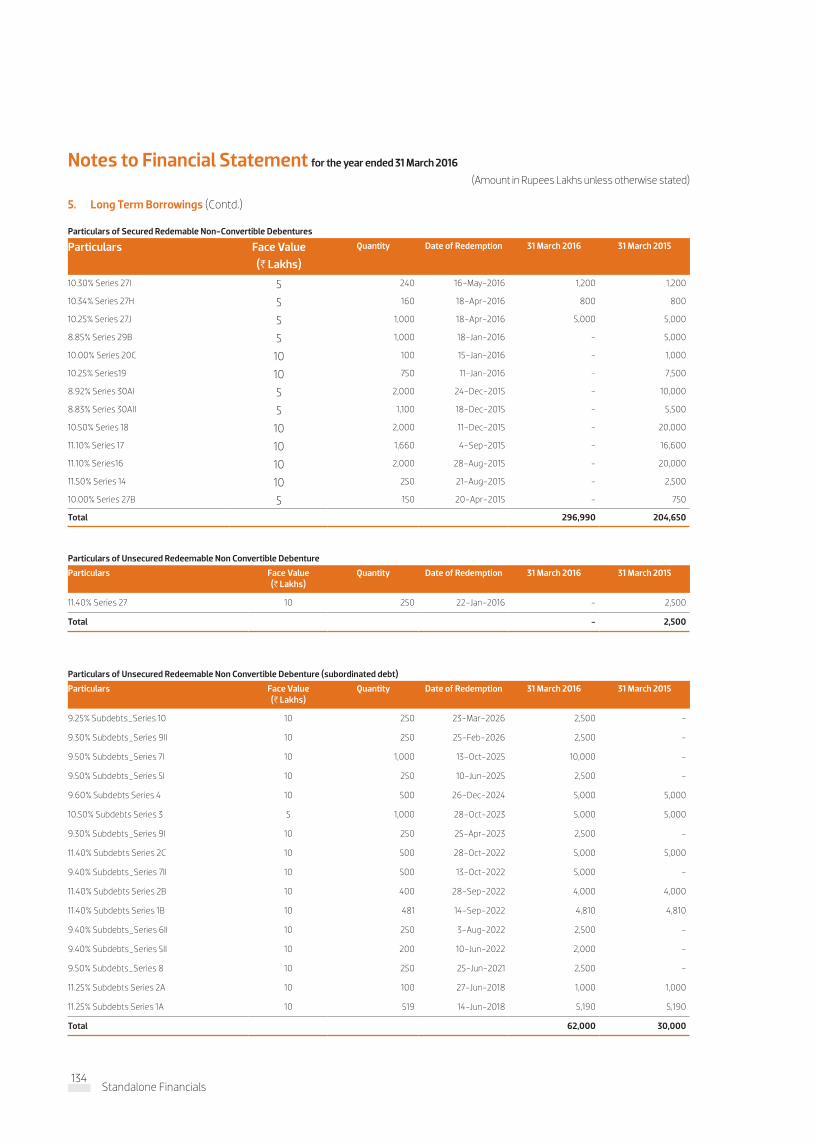
Particulars of Secured Redemable Non-Convertible Debentures
Particulars Face Value (H Lakhs)
Quantity Date of Redemption 31 March 2016 31 March 2015
10.30% Series 27I 5 240 16-May-2016 1,200 1,200
10.34% Series 27H 5 160 18-Apr-2016 800 800
10.25% Series 27J 5 1,000 18-Apr-2016 5,000 5,000
8.85% Series 29B 5 1,000 18-Jan-2016 - 5,000
10.00% Series 20C 10 100 15-Jan-2016 - 1,000
10.25% Series19 10 750 11-Jan-2016 - 7,500
8.92% Series 30AI 5 2,000 24-Dec-2015 - 10,000
8.83% Series 30AII 5 1,100 18-Dec-2015 - 5,500
10.50% Series 18 10 2,000 11-Dec-2015 - 20,000
11.10% Series 17 10 1,660 4-Sep-2015 - 16,600
11.10% Series16 10 2,000 28-Aug-2015 - 20,000
11.50% Series 14 10 250 21-Aug-2015 - 2,500
10.00% Series 27B 5 150 20-Apr-2015 - 750
Total 296,990 204,650
Particulars of Unsecured Redeemable Non Convertible Debenture (subordinated debt)
Particulars Face Value (H Lakhs)
Quantity Date of Redemption 31 March 2016 31 March 2015
9.25% Subdebts_Series 10 10 250 23-Mar-2026 2,500 -
9.30% Subdebts_Series 9II 10 250 25-Feb-2026 2,500 -
9.50% Subdebts_Series 7I 10 1,000 13-Oct-2025 10,000 -
9.50% Subdebts_Series 5I 10 250 10-Jun-2025 2,500 -
9.60% Subdebts Series 4 10 500 26-Dec-2024 5,000 5,000
10.50% Subdebts Series 3 5 1,000 28-Oct-2023 5,000 5,000
9.30% Subdebts_Series 9I 10 250 25-Apr-2023 2,500 -
11.40% Subdebts Series 2C 10 500 28-Oct-2022 5,000 5,000
9.40% Subdebts_Series 7II 10 500 13-Oct-2022 5,000 -
11.40% Subdebts Series 2B 10 400 28-Sep-2022 4,000 4,000
11.40% Subdebts Series 1B 10 481 14-Sep-2022 4,810 4,810
9.40% Subdebts_Series 6II 10 250 3-Aug-2022 2,500 -
9.40% Subdebts_Series 5II 10 200 10-Jun-2022 2,000 -
9.50% Subdebts_Series 8 10 250 25-Jun-2021 2,500 -
11.25% Subdebts Series 2A 10 100 27-Jun-2018 1,000 1,000
11.25% Subdebts Series 1A 10 519 14-Jun-2018 5,190 5,190
Total 62,000 30,000
Particulars of Unsecured Redeemable Non Convertible Debenture
Particulars Face Value (H Lakhs)
Quantity Date of Redemption 31 March 2016 31 March 2015
11.40% Series 27 10 250 22-Jan-2016 - 2,500
Total - 2,500
5. Long Term Borrowings (Contd.)
Notes to Financial Statement for the year ended 31 March 2016
(Amount in Rupees Lakhs unless otherwise stated)
134Standalone Financials
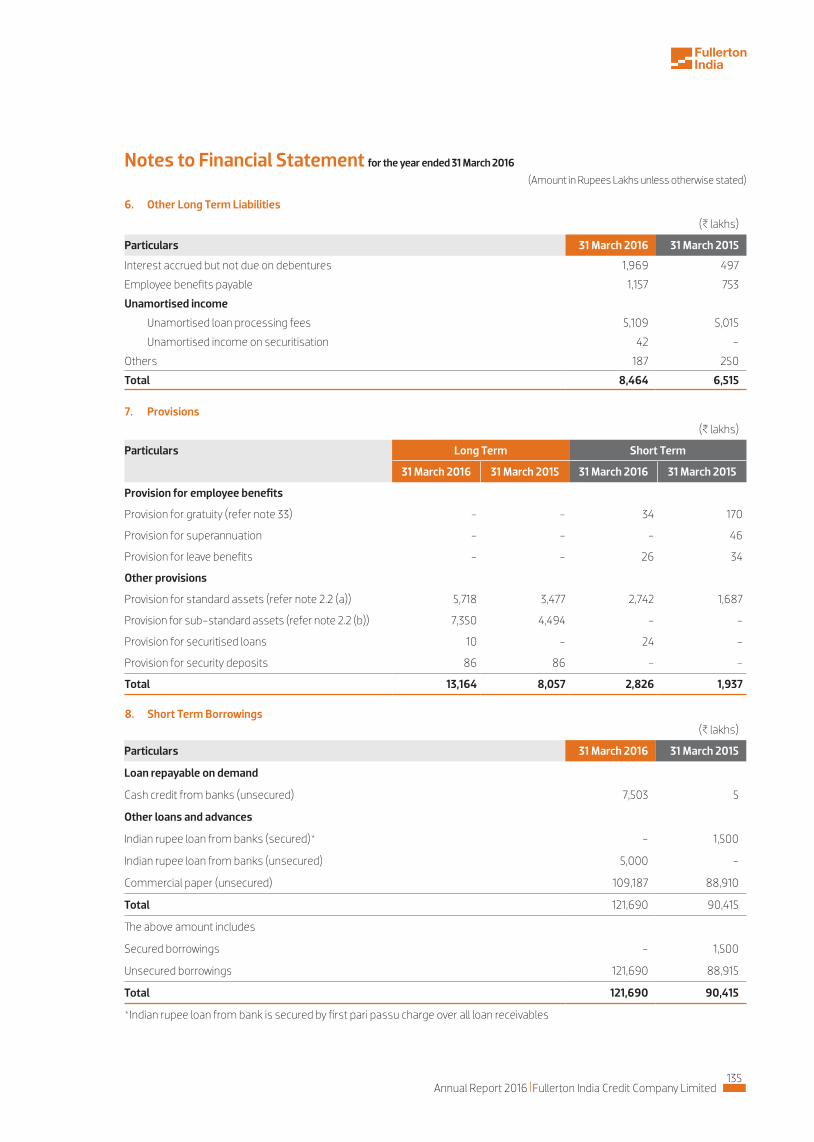
6. Other Long Term Liabilities
(B lakhs)
Particulars 31 March 2016 31 March 2015
Interest accrued but not due on debentures 1,969 497
Employee benefits payable 1,157 753
Unamortised income
Unamortised loan processing fees 5,109 5,015
Unamortised income on securitisation 42 -
Others 187 250
Total 8,464 6,515
(B lakhs)
Particulars Long Term Short Term
31 March 2016 31 March 2015 31 March 2016 31 March 2015
Provision for employee benefits
Provision for gratuity (refer note 33) - - 34 170
Provision for superannuation - - - 46
Provision for leave benefits - - 26 34
Other provisions
Provision for standard assets (refer note 2.2 (a)) 5,718 3,477 2,742 1,687
Provision for sub-standard assets (refer note 2.2 (b)) 7,350 4,494 - -
Provision for securitised loans 10 - 24 -
Provision for security deposits 86 86 - -
Total 13,164 8,057 2,826 1,937
7. Provisions
8. Short Term Borrowings(B lakhs)
Particulars 31 March 2016 31 March 2015
Loan repayable on demand
Cash credit from banks (unsecured) 7,503 5
Other loans and advances
Indian rupee loan from banks (secured)* - 1,500
Indian rupee loan from banks (unsecured) 5,000 -
Commercial paper (unsecured) 109,187 88,910
Total 121,690 90,415
�e above amount includes
Secured borrowings - 1,500
Unsecured borrowings 121,690 88,915
Total 121,690 90,415
*Indian rupee loan from bank is secured by first pari passu charge over all loan receivables
Notes to Financial Statement for the year ended 31 March 2016
(Amount in Rupees Lakhs unless otherwise stated)
135Annual Report 2016 Fullerton India Credit Company Limited

9. Other Current Liabilities(B lakhs)
Particulars 31 March 2016 31 March 2015
Other liabilitiesCurrent maturities of long term borrowings (refer note 5) 209,523 192,579Expenses and other payable
(refer note 34 for details of dues to Micro Small and Medium Enterprises )
9,079 7,051
Employee benefits payable 5,514 4,839Bank balances (Book overdraft) 40,367 32,425Interest accrued but not due On debentures 15,093 11,461 On bank loans 763 359 On others - 1Undisputed statutory dues payable 949 897Payable towards asset assignment / securitisation 4,024 335Others 7,790 5,573Unamortised income Unamortised loan processing fees 7,803 5,558 Unamortised income on securitisation 91 -Total 300,996 261,077
Particulars Office Equipments
Furniture & Fixtures
Computers & Accessories
Leasehold Improvements
Vehicles Land & Building*
Leased Assets
Total
Cost
At 1 April 2014 2,678 2,384 4,285 3,392 65 6 96 12,906
Addition 518 232 647 95 65 - 28 1,585
Disposals 431 131 588 219 42 - - 1,411
At 31 March 2015 2,765 2,485 4,344 3,268 88 6 125 13,080
Addition 559 458 736 419 - - 13 2,186
Disposals 131 152 157 138 - - - 578
At 31 March 2016 3,193 2,791 4,924 3,549 88 6 138 14,688
Depreciation -
At 1 April 2014 2,096 1,962 3,669 2,762 65 - 13 10,567
Charge for the year 368 277 443 323 4 - 29 1,445
Disposals 430 124 588 216 42 - - 1,401
At 31 March 2015 2,034 2,115 3,524 2,868 27 - 42 10,611
Charge for the year 426 283 576 357 16 - 34 1,692
Disposals 128 146 156 134 - - - 564
At 31 March 2016 2,332 2,252 3,943 3,092 44 - 76 11,739
Impairment -
At 1 April 2014 8 14 3 13 - - - 38
Additions - - - - - - - -
Charge for the year - - - - - - - -
At 31 March 2015 8 14 3 13 - - - 38
Additions - - - - - - - -
Charge/(release) for the year (8) (14) (3) (13) - - - (38)
At 31 March 2016 - - - - - - - -
Net Block
At 31 March 2015 723 356 818 386 61 6 83 2,432
At 31 March 2016 860 539 980 457 44 6 62 2,949
�e Company does not have any other leasehold assets except as disclosed above.
All assets have been recognised at cost
Capital Work in Progress
At 31 March 2015 38 1 197 2 - - - 237
At 31 March 2016 6 2 266 1 - - - 276
* Mortgaged as security against secured non-convertible debentures
10. Tangible Assets (B lakhs)
Notes to Financial Statement for the year ended 31 March 2016
(Amount in Rupees Lakhs unless otherwise stated)
136Standalone Financials

11. Intangible Assets
Particulars Computer Software Total
H Lakhs H Lakhs
Gross blockAt 1 April 2014 6,094 6,094Additions 384 384Disposals 319 319At 31 March 2015 6,159 6,159Additions 1,940 1,940Disposals 325 325At 31 March 2016 7,774 7,774DepreciationAt 1 April 2014 4,461 4,461Charge for the year 864 864Deductions 263 263At 31 March 2015 5,062 5,062Charge for the year 742 742Deductions 71 71At 31 March 2016 5,733 5,733Net blockAt 31 March 2015 1,096 1,096At 31 March 2016 2,040 2,040Capital Work in ProgressAt 31 March 2015 890 890At 31 March 2016 113 113
12. Non-Current Investments
(B lakhs)
Particulars 31 March 2016 31 March 2015
Non Trade Investments (valued at cost unless stated otherwise)
Investment in equity instruments (unquoted)
a) Wholly owned subsidiaries
57,619,048 (31 March 2015: 10,000,000) equity shares ofH 10 each 6,000 1,000
fully paid-up in Fullerton India Home Finance Company Limited
23,575 (31 March 2015: 23,575) equity shares ofH 10 each 2 2
fully paid-up in Fullerton India Foundation For Social & Economic Development
b ) Others
50,000 (31 March 2015: 50,000) equity shares of H 10 each 5 5
fully paid-up in Alpha Micro Finance Consultants Private Limited
(A) 6,007 1,007
Less: Provision for diminution in value (B) (2) (2)
Net Value ((A)-(B)) 6,005 1,005
Aggregate amount of unquoted investments 6,007 1,007
Notes to Financial Statement for the year ended 31 March 2016
(Amount in Rupees Lakhs unless otherwise stated)
137Annual Report 2016 Fullerton India Credit Company Limited

(B lakhs)
Particulars Non Current Current
31 March 2016 31 March 2015 31 March 2016 31 March 2015
A Portfolio loans
a. Secured, considered good*
Loans 453,678 328,881 57,382 45,022
b. Secured, considered doubtful**
Loans 16,314 12,722 - -
c. Unsecured, considered good*
Loans 277,784 239,584 293,400 230,803
d. Unsecured, considered doubtful**
Loans 5,178 3,963 - -
Sub-Total 752,954 585,150 350,782 275,826
B Security deposits
Unsecured, considered good 1,594 1,407 102 38
Unsecured, considered doubtful 86 86 - -
Sub-Total 1,680 1,493 102 38
C Advances recoverable in cash or in
kind or for value to be received
Unsecured, considered good 644 440 - -
Sub-Total 644 440 - -
14. Loans And Advances
13. Deferred Tax Asset (Net)(B lakhs)
Particulars 31 March 2016 31 March 2015
Deferred tax liability
Unamortised ancillary cost of borrowings 1,346 1,063
Unamortised loan origination costs 3,179 2,584
Gross deferred tax liability (A) 4,525 3,647
Deferred tax assets
Impact of expenditure charged to the statement of profit and loss in the current year but allowed for tax purposes on payment basis
175 284
Fixed assets: Impact of difference between tax depreciation and depreciation/ amortisation charged for the financial reporting
1,853 2,012
Provision for diminution in the value of investments 32 356
Provision for doubtful debts and advances 5,472 3,342
Provision for security deposits 30 30
Unamortised loan processing fees 4,469 3,659
Provision for expenses disallowed as per Income-tax Act, 1961 554 322
Interest income on non-performing loans recognised
for tax purposes 554 -
Gross deferred tax asset (B) 13,138 10,005
Net deferred tax asset (B-A) 8,613 6,358
Net deferred tax asset recognised* 8,613 -
* For the previous year the Company did not recognise net deferred tax assets in the absense of virtual certainty supported by convincing evidence that sufficient taxable income will be available in future years against which such deferred tax can be realised.
Notes to Financial Statement for the year ended 31 March 2016
(Amount in Rupees Lakhs unless otherwise stated)
138Standalone Financials

(B lakhs)
Particulars Non Current Current
31 March 2016 31 March 2015 31 March 2016 31 March 2015
D Other loans and advances
Retained interest receivable on securitisation 52 - 106 -
Advance Income Tax (net of provision for tax ) 1,394 369 - -
MAT credit entitlement (refer note 35) 12,677 14,136 - -
Prepaid expenses 16 34 807 638
Loans and advances to employees 7 6 9 9
Others 6 6 1,004 759
Sub-Total 14,152 14,551 1,926 1,406
E Capital advances
Unsecured, considered good 552 158 - -
Sub-Total 552 158 - -
Total (A+B+C+D+E) 769,982 601,792 352,810 277,270
* Represents standard assets in accordance with Company’s asset classification policy (refer note 2.1(g))
** Represents non-performing assets in accordance with Company’s asset classification policy (refer note 2.1(g))
14. Loans And Advances (contd.)
(B lakhs)
Particulars Non Current Current
31 March 2016 31 March 2015 31 March 2016 31 March 2015
Non Current bank balances (refer note 18) 224 - - -Unamortised ancillary cost of borrowings 2,707 1,726 1,183 1,346Unamortised loan origination costs 5,998 4,514 3,186 2,953Interest accrued and dueOn secured loans - - 542 323On unsecured loans - - 683 607Interest Accrued but not dueOn deposits placed with banks - - 2,464 1,385On government securities - - - 7On debentures and bonds - - 168 106On secured loans - - 5,701 3,599On unsecured loans - - 7,975 7,667Total 8,929 6,240 21,902 17,993
15. Other Assets
16. Current Investments(B lakhs)
Particulars 31 March 2016 31 March 2015Current investments (valued at lower of cost and fair value, unless stated otherwise)
a) Quoted: Government securities
Nil (31 March 2015: 5,000) units 8.40 % 2024 Government of India - 522
b) Unquoted: Certificate of deposits
22,500 (31 March 2015: 2,500) units of H 100,000 each of Axis Bank Limited 21,759 2,409
17,500 (31 March 2015: 10,000) units of H 100,000 each of ICICI Bank Limited 16,966 9,469
10,000 (31 March 2015: 2,500) units of H 100,000 each of Canara Bank 9,312 2,465
7,500 (31 March 2015: Nil) units of H 100,000 each of IDBI Bank Limited 7,363 -
2,500 (31 March 2015: Nil) units of H 100,000 each of DCB Bank Limited 2,466 -
5,000 (31 March 2015: Nil) units of H 100,000 each of State Bank of Hyderabad 4,666 -
Nil (31 March 2015: 5,000) units of H 100,000 each of Union Bank of India - 4,928
Nil (31 March 2015: 2,500) units of H 100,000 each of Corporation Bank - 2,477
Nil (31 March 2015: 2,500) units of H 100,000 each of Punjab National Bank - 2,471
Nil (31 March 2015: 2,500) units of H 100,000 each of Kotak Mahindra Bank - 2,366
Notes to Financial Statement for the year ended 31 March 2016
(Amount in Rupees Lakhs unless otherwise stated)
139Annual Report 2016 Fullerton India Credit Company Limited

(B lakhs)
Particulars 31 March 2016 31 March 2015c) Unquoted: Investment in Commercial Papers
4,000 (31 March 2015: 2,500) units of H500,000 each of Housing Development Finance Corporation Ltd 19,644 12,286
Nil (31 March 2015: 1,000) units of H500,000 each of Bajaj Finance Ltd. - 4,878
Nil (31 March 2015: 500) units of H500,000 each of Tata Capital Ltd. - 2,405
d) Unquoted: Mutual funds (At net asset value)
371,071.51 (31 March 2015: Nil) units of H 10 each in ICICI Prudential Money Market Fund - Direct Growth 778 -
e) Unquoted: Investment in debentures
150 (31 March 2015: 150) units of 9.84% NCD H1,000,000 each fully paid up in Housing Development Finance Corporation Ltd
1,510 1,507
250 (31 March 2015: 250) units of 9.75% NCD H1,000,000 each fully paid up in LIC Housing Finance Ltd. 2,525 2,501
250 (31 March 2015: Nil) units of 8.28% NCD H1,000,000 each fully paid up in Rural Electrification Corporation Limited
2,507 -
f) Unquoted: Investment in preference shares
Nil (31 March 2015: 9,368,921) 1% preference shares of H 10 each - 937
fully paid-up in Bhartiya Samruddhi Finance Limited
g) Unquoted: Investment in equity shares
668,328 (31 March 2015: 668,328) equity shares of H 10 each 67 67
fully paid-up in SWAWS Credit Corporation India Private Limited
h) Unquoted: Investment in debentures
22,278 (31 March 2015: 22,278) units of H100 each fully paid-up 22 22
12% Optionally Convertible Debentures in SWAWS Credit Corporation India Private Limited
(A) 89,585 51,710
Less: Provision for diminution in value (B) (89) (1,026)
89,496 50,684
Net Value {(A)-(B)} 89,496 50,684
Aggregate Amount of quoted investment (at Cost Price:Nil , (31 March 2015: H 522)) - 522
Aggregate Amount of unquoted investment (at Cost Price H87,434, (31 March 2015: H48,553)) 89,496 50,162
16. Current Investments (contd.)
(B lakhs)
Particulars Non Current Current
31 March 2016 31 March 2015 31 March 2016 31 March 2015
Other receivable
Unsecured, considered good - - 657 254
Total - - 657 254
17. Trade Receivables
(B lakhs)Particulars Non Current Current
31 March 2016 31 March 2015 31 March 2016 31 March 2015
Cash and cash equivalents:
Cash on hand - - 1,127 1,151
Balances with Banks
- On Current accounts - - 11,533 7,794
(A) - - 12,660 8,945
Other bank balances
- Deposits with original maturity for more than 12 months* 224 - 52,491 20,400
- Deposits with original maturity for more than 3 months* - - 15,711 24,706
but less than 12 months
(B) 224 - 68,202 45,106
224 - 80,862 54,051
Less: amount disclosed under non current assets (refer note15) (224) - - -
Total ((A)+(B)) - - 80,862 54,051
* H 224 lakhs (31 March 2015 : Nil) pledged as cash collateral in connection with securitisation of loan portfolio
18. Cash and Bank Balances
Notes to Financial Statement for the year ended 31 March 2016
(Amount in Rupees Lakhs unless otherwise stated)
140Standalone Financials

19. Revenue From Operations
(B lakhs)
Particulars Year ended 31 March 2016
Year ended 31 March 2015
Interest income on loans 193,213 150,214
Income from asset assignment and securitisation 1,161 453
Interest on bank deposits 5,184 3,003
Interest on investments 5,388 3,500
Other operating revenue
Processing fees 12,048 6,822
Ancillary income from operations 4,252 3,832
Total 221,246 167,824
20. Other Income(B lakhs)
Particulars Year ended 31 March 2016
Year ended 31 March 2015
Profit on sale of investments 3,798 1,941
Profit on sale of fixed assets (net) 22 38
Miscellaneous income 2,628 2,221
Total 6,448 4,200
21. Employee Benefit Expense(B lakhs)
Particulars Year ended 31 March 2016
Year ended 31 March 2015
Salaries, bonus and allowances 33,340 27,290
Contribution to provident and other funds 1,094 978
Gratuity expense (refer note 33) 348 333
Staff welfare expenses 1,160 955
Total 35,942 29,556
Notes to Financial Statement for the year ended 31 March 2016
(Amount in Rupees Lakhs unless otherwise stated)
141Annual Report 2016 Fullerton India Credit Company Limited

22. Other Expenses(B lakhs)
Particulars Year ended 31 March 2016
Year ended 31 March 2015
Printing and stationery 1,002 844
Rent 2,712 2,395
Rates and taxes 364 276
Insurance 36 23
Business promotion expenses 995 1,399
Commission, Brokerage and Lead Generation 6,140 3,249
Legal charges 226 164
Professional charges 6,111 4,679
Collection expenses 4,145 4,328
Courier charges 414 350
Repairs and maintenance
Office premises 1,446 1,129
Others 726 940
Directors' sitting fees 28 14
Travelling expenses 1,967 2,079
Telecommunication expenses 866 738
Payment to auditors (refer details below) 52 40
Electricity charges 732 660
Security charges 181 159
Recruitment expenses 181 143
Training expenses 396 283
Fees and subscription 37 22
Corporate social responsibility expenses 518 94
Miscellaneous expenses 1,172 708
Write off of fixed assets and intangible assets 265 66
Total 30,712 24,783
Payment to auditors
As auditor:
Audit fee 34 26
Tax audit fee 5 4
Limited review 5 5
In other capacity:
Certification matters 5 4
Reimbursement of expenses 3 1
Notes to Financial Statement for the year ended 31 March 2016
(Amount in Rupees Lakhs unless otherwise stated)
142Standalone Financials
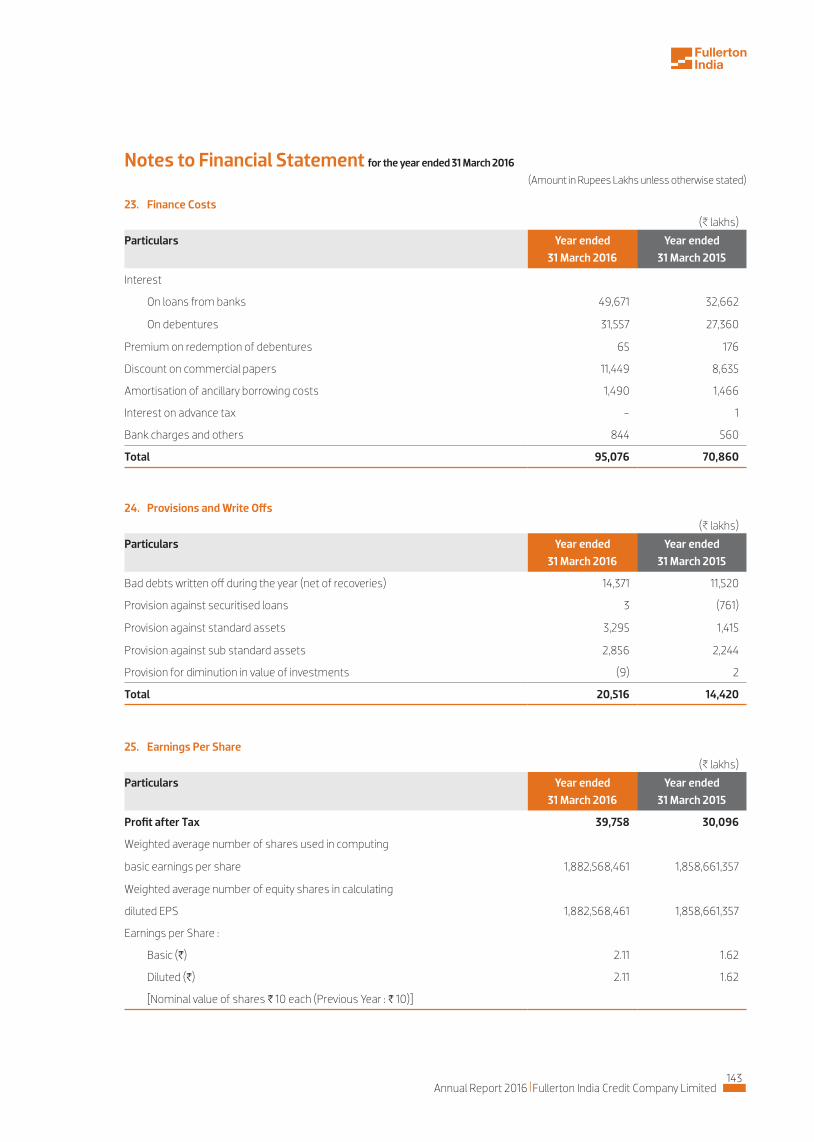
23. Finance Costs(B lakhs)
Particulars Year ended 31 March 2016
Year ended 31 March 2015
Interest
On loans from banks 49,671 32,662
On debentures 31,557 27,360
Premium on redemption of debentures 65 176
Discount on commercial papers 11,449 8,635
Amortisation of ancillary borrowing costs 1,490 1,466
Interest on advance tax - 1
Bank charges and others 844 560
Total 95,076 70,860
24. Provisions and Write Offs(B lakhs)
Particulars Year ended 31 March 2016
Year ended 31 March 2015
Bad debts written off during the year (net of recoveries) 14,371 11,520
Provision against securitised loans 3 (761)
Provision against standard assets 3,295 1,415
Provision against sub standard assets 2,856 2,244
Provision for diminution in value of investments (9) 2
Total 20,516 14,420
25. Earnings Per Share(B lakhs)
Particulars Year ended 31 March 2016
Year ended 31 March 2015
Profit after Tax 39,758 30,096
Weighted average number of shares used in computing
basic earnings per share 1,882,568,461 1,858,661,357
Weighted average number of equity shares in calculating
diluted EPS 1,882,568,461 1,858,661,357
Earnings per Share :
Basic (H) 2.11 1.62
Diluted (H) 2.11 1.62
[Nominal value of shares H 10 each (Previous Year : H 10)]
Notes to Financial Statement for the year ended 31 March 2016
(Amount in Rupees Lakhs unless otherwise stated)
143Annual Report 2016 Fullerton India Credit Company Limited

26. Segment Information �e Company operates in a single reportable segment i.e. financing, which has similar risks and returns for the purpose of AS
- 17 on ‘Segment Reporting’ specified under section 133 of the Act, read with rules 7 of Companies (Accounts) Rules, 2014. �e Company operates in single geographical segment, i.e. domestic.
27. Related Party DisclosuresNames and other details of related parti
Ultimate Holding Company Temasek Holdings (Private) Limited
Holding CompaniesAngelica Investments Pte Ltd, Singapore (‘Angelica’)
Fullerton Financials Holdings Pte Ltd (Holding Company of Angelica)
Fellow Subsidiary
Fullerton Securities & Wealth Advisors Ltd.
Fullerton Financial Holdings (International) Pte Ltd
Temasek International (Private) Limited
SubsidiaryFullerton India Home Finance Company Ltd.
Fullerton India Foundation for Social & Economic Development (Not for profit Company)
Key Management Personnel Mr. Shantanu Mitra, Chief Executive Officer and Managing Director
(B lakhs)
Transactions during the year Holding Companies
Subsidiaries Key Management Personnel
Fellow Subsidiary Total
31 March 2016
31 March 2015
31 March 2016
31 March 2015
31 March 2016
31 March 2015
31 March 2016
31 March 2015
31 March 2016
31 March 2015
Reimbursement for expenses incurred on behalf of the Company
2 3 - - 15 35 17 38
Expenses incurred by the Company on behalf of others
- - - - - - 1 1 1 1
Issue of Share capital (including securities premium)
15,000 - - - - - - - 15,000 -
Investment in equity shares - - 5,000 800 - - - - 5,000 800
Income as per Resource sharing agreement 56 56 -
Salary and employee benefits
Mr. Shantanu Mitra - - - - 674 720 - - 674 720
Balance outstanding at the year end
Investment in equity shares
Fullerton India Home Finance Company Ltd - - 6,000 1,000 - - - - 6,000 1,000
Fullerton India Foundation for Social & Economic Development
- - 2 2 - - - - 2 2
Other Receivables
Fullerton India Home Finance Company Ltd - - 34 - - - - - 34 -
Other Payable
Fullerton India Home Finance Company Ltd - - 6 - - - - - 6 -
Notes to Financial Statement for the year ended 31 March 2016
(Amount in Rupees Lakhs unless otherwise stated)
144Standalone Financials

28. Leasesa) Where the Company is the lessee: Premises are obtained on operating lease. �e lease term ranges from 11 months to 134 months and are renewable/
cancellable at the option of the Company. Certain lease agreements contain clause for escalation of lease payments. �ere are no restrictions imposed by lease arrangements. �ere are no subleases. Lease payments during the year are charged to the Statement of Profit and Loss.
�e following table sets forth, for the periods indicated, the details of future rentals payable on operating leases.
(B lakhs)
Particulars 31 March 2016 31 March 2015
Operating lease payments recognised during the year 3,063 2,756
Minimum Lease Obligations
Not later than one year 2,755 2,374
Later than one year but not later than five years 7,473 2,327
Later than five years 2,246 533
b) Where the Company is the lessor: �e Company has entered into operating lease arrangement for servers which form part of the tangible assets. �is
lease has a non-cancellable arrangement of 3 years. �is lease contains a clause to enable upward revision of the rental charges on an annual basis according to prevailing market conditions.
�e following table sets forth, for the periods indicated, the details of future rentals receivable on operating leases were company is a lessor:
(B lakhs)
Particulars 31 March 2016 31 March 2015
Operating lease rental recognised during the year 32 31
Minimum Lease Obligations
Not later than one year 35 32
Later than one year but not later than five years 34 53
Later than five years - -
Notes to Financial Statement for the year ended 31 March 2016
(Amount in Rupees Lakhs unless otherwise stated)
145Annual Report 2016 Fullerton India Credit Company Limited

29. Cash and Cash Equivalents for the purpose of Cash Flow Statement
(B lakhs)
Particulars 31 March 2016 31 March 2015
Cash and Bank Balance (refer note 18) 80,862 54,051
Less: Other bank balances (refer note 18) (68,202) (45,106)
Balance considered as Cash and Cash Equivalents for Cash Flow Statement 12,660 8,945
30. Contingent liability and commitmentsa) Contingent liabilities:
(B lakhs)
Description of the Liability 31 March 2016 31 March 2015
Credit enhancement provided by the Company for the loans under securitisation arrangements (including cash collaterals and interest subordination)
282 -
Contingent liability for litigations pending against the Company 36 20
b) Capital and other commitments(i) Estimated amount of contracts remaining to be executed on capital account and not provided for as at 31 March 2016
is H 1,922 Lakhs (31 March 2015: H 775 Lakhs).
(ii) Loans sanctioned not yet disbursed as at 31 March 2016 were H 4,501 Lakhs (31 March 2015: H 5,578 Lakhs).
c) �e Company’s pending litigations, having an impact on the financial position, comprise certain proceedings pending with Income Tax and Service Tax authorities. �e Company has reviewed all such pending litigations and proceedings and has adequately provided wherever considered necessary.
In addition, the Company is involved in other legal proceedings and claims, which have arisen in the ordinary course of business. �e Company’s management does not reasonably expect that these legal actions, when ultimately concluded and determined, will have a material and adverse effect on the Company’s results of operations or financial condition.
31. Expenditure in Foreign Currency
(B lakhs)
Expenditure in Foreign Currency 31 March 2016 31 March 2015
Travelling expenses 21 39
Ancillary borrowing costs 450 -
Training expenses 43 55
Business promotion expenses - 6
Repairs and maintenance 10 10
Directors sitting fees 12 -
Bank charges and Others 1 31
Total 537 141
Notes to Financial Statement for the year ended 31 March 2016
(Amount in Rupees Lakhs unless otherwise stated)
146Standalone Financials

32. Employee Stock Appreciation Rights �e Company has an Employee Share based payment scheme, under which grants were made as per details provided below:
Grant 1 Grant 2 Grant 3 Grant 4 Grant 5
Date of Grant 30 November 2011 1 April 2013 1 April 2013 1 April 2014 1 April 2015
Value of the Grant H 568 Lakhs H 706 Lakhs H 741 Lakhs H 750 Lakhs H 800 Lakhs
Performance Condition
Achievement of Profit before tax (PBT) and Return on Equity (ROE) targets as per approved business plan
Graded Vesting (subject to achievement of performance condition given above)
Tranche I: 33% vesting on 1 December 2013
Tranche I: 33% vesting on 1 December 2015
Tranche I: 33% vesting on 1 December 2016
Tranche I: 33% vesting on 1 December 2017
Tranche I: 33% vesting on 1 December 2018
Tranche II: 33% vesting on 1 December 2014
Tranche II: 33% vesting on 1 December 2016
Tranche II: 33% vesting on 1 December 2017
Tranche II: 33% vesting on 1 December 2018
Tranche II: 33% vesting on 1 December 2019
Tranche III: 34% vesting on 1 December 2015
Tranche III: 34% vesting on 1 December 2017
Tranche III: 34% vesting on 1 December 2018
Tranche III: 34% vesting on 1 December 2019
Tranche III: 34% vesting on 1 December 2020
Vesting period (including performance period)
Tranche I: 2 years Tranche I: 2 years 8 months
Tranche I: 3 years 8 months
Tranche I: 3 years 8 months
Tranche I: 3 years 8 months
Tranche II: 3 years Tranche II: 3 years 8 months
Tranche II: 4 years 8 months
Tranche II: 4 years 8 months
Tranche II: 4 years 8 months
Tranche III: 4 years Tranche III: 4 years 8 months
Tranche III: 5 years 8 months
Tranche III: 5 years 8 months
Tranche III: 5 years 8 months
Exercise period Within 30 days from each vesting date but not later than 2 years from the date of last vesting.
Method of Settlement
Cash Payout
�e estimated fair value of the grant at a notional value of H 10 per unit (as at the date of grant) is as below:
Particulars Grant 1 Grant 2 Grant 3 Grant 4 Grant 5
As at 31 March 2016 H 24.97 H 18.22 H 18.22 H 15.52 H 12.54
As at 31 March 2015 H 19.49 H 14.53 H 14.53 H 12.38 Nil
As at 31 March 2014 H 15.36 H 11.74 H 11.74 Nil Nil
As at 31 March 2013 H 12.78 Nil Nil Nil Nil
Exercise price Vest 1 H 12.78 H 14.53 Nil Nil Nil
Exercise price Vest 2 H 15.36 Nil Nil Nil Nil
Exercise price Vest 3 H 19.49 Nil Nil Nil Nil
Fair value is computed using the method provided in the scheme for estimating the valuation of the grant which is linked to the Net Book Value of the business.Adjustment has been made for the resignations during the year ended 31 March 2016 and the consequential impact of forfeiture of the grant.
Notes to Financial Statement for the year ended 31 March 2016
(Amount in Rupees Lakhs unless otherwise stated)
147Annual Report 2016 Fullerton India Credit Company Limited

32. Employee Stock Appreciation Rights (contd.)
33. Retirement and Other Employee Benefits �e Company has a defined benefit gratuity plan. Every employee who has completed five years or more of service gets a
gratuity on departure at 15 days salary (last drawn salary) for each completed year of service. �e following tables summaries the components of net benefit expense recognised in the Statement of Profit and Loss and the
amounts recognised in the balance sheet for the plan.
Statement of Profit and LossGratuity expense (recognised in Employee benefit expense):
(B lakhs)
Particulars 31 March 2016 31 March 2015
Current service cost 239 117
Interest cost on benefit obligation 69 54
Expected return on plan assets (55) (27)
Net actuarial (gain)/loss recognised in the year 95 189
Past service cost - -
Net Benefit Expense 348 333
Actual return on plan assets - -
�e movement of the stock appreciation rights granted during the year is as under: (Year ended 31 March 2016)
Particulars (No. of Options) Grant - 1 Grant - 2 Grant - 3 Grant - 4 Grant - 5 Total H Lakhs
Grants outstanding at the beginning of the year 1,399,800 4,920,000 5,030,000 7,300,000 - 18,649,800 1,865
Grants made during the year - - - - 8,000,000 8,000,000 800
Grants forfeited on resignation of employees 34,000 200,500 400,000 950,000 525,000 2,109,500 211
Grants vested 1,108,400 1,590,600 - - - 2,699,000 270
Grants exercised 343,800 551,100 - - - 894,900 89
Grants outstanding – unvested at the end of the year - 3,128,900 4,630,000 6,350,000 7,475,000 21,583,900 2,158
Grants outstanding – vested and exercisable 1,022,000 1,039,500 - - - 2,061,500 206
Expense arising from the grants made till 31 March 2016 (H Lakhs)
87 276 236 236 207 1,041 1,041
(Year ended 31 March 2015)
Particulars (No. of Options) Grant - 1 Grant - 2 Grant - 3 Grant - 4 Grant - 5 Total H Lakhs
Grants outstanding at the beginning of the year 2,705,000 5,620,000 5,880,000 - - 14,205,000 1,421
Grants made during the year - - - 7,500,000 - 7,500,000 750
Grants forfeited on resignation of employees 335,000 700,000 850,000 200,000 - 2,085,000 209
Grants vested 1,108,800 - - - - 1,108,800 111
Grants exercised 970,200 - - - - 970,200 97
Grants outstanding – unvested at the end of the year 1,142,400 4,920,000 5,030,000 7,300,000 - 18,392,400 1,839
Grants outstanding – vested and exercisable 257,400 - - - - 257,400 26
Expense arising from the grants made till 31 March 2015 (H Lakhs)
97 220 170 199 - 686 686
Notes to Financial Statement for the year ended 31 March 2016
(Amount in Rupees Lakhs unless otherwise stated)
148Standalone Financials

33. Retirement and Other Employee Benefits (contd.)
Balance SheetDetails of Provision for gratuity:
(B lakhs)
Particulars 31 March 2016 31 March 2015
Defined benefit obligation 1,144 861
Fair value of plan assets 1,110 691
Less: Unrecognised Past Service Cost - -
Plan asset/(liability) (34) (170)
Changes in the present value of the defined benefit obligation are as follows:
(B lakhs)
Particulars 31 March 2016 31 March 2015
Opening defined benefit obligation 861 581
Interest cost 69 54
Current service cost 239 117
Transfer (out)/in (6) -
Benefits paid (99) (556)
Actuarial (gains)/losses on obligation 80 665
Closing defined benefit obligation 1,144 861
Changes in the fair value of plan assets are as follows:
(B lakhs)
Particulars 31 March 2016 31 March 2015
Opening fair value of plan assets 691 310
Expected return 55 27
Contributions by employer 477 435
Benefits paid (99) (556)
Actuarial gains/(losses) (15) 475
Closing fair value of plan assets 1,110 691
Notes to Financial Statement for the year ended 31 March 2016
(Amount in Rupees Lakhs unless otherwise stated)
149Annual Report 2016 Fullerton India Credit Company Limited

�e major categories of plan assets as a percentage of the fair value of total plan assets are as follows:
(B lakhs)
Particulars 31 March 2016 31 March 2015
Investments with insurer % 100 100
�e overall expected rate of return on assets is determined based on the market prices prevailing on that date applicable to the period over which obligation is to be settled. �ere has been a significant change in the expected rate of return on assets due to the stock market scenario.
�e principal assumptions used in determining gratuity liability for the Company’s plans are shown below:
(B lakhs)
Particulars 31 March 2016 31 March 2015
Discount rate 7.80% 7.99%
Expected rate of return on assets 7.80% 7.99%
Employee Turnover Category 1 - For basic upto H 1.2 lakhs Upto 4 yrs 40.50% and 5 yrs & above 2% at each age
Category 1 - For basic more than H 1.2 lakhs Upto 4 yrs 23.1% and 5 yrs & above 2% at each age
Category 2 - For basic upto H 1.2 lakhs Upto 4 yrs 51% and 5 yrs & above 2% at each age
Category 2 - For basic more than H 1.2 lakhs Upto 4 yrs 31% and 5 yrs & above 2% at each age
Future Salary rise 10% 10%
�e estimates of future salary increases, considered in actuarial valuation, take account of inflation, seniority, promotion and other relevant factors, such as supply and demand in the employment market.
Amounts for the current period and previous periods are as follows:
(B lakhs)
Particulars 31 March 2016 31 March 2015 31 March 2014 31 March 2013 31 March 2012
Defined benefit obligation 1,144 861 581 253 229
Plan assets 1,110 691 310 172 148
Surplus/(deficit) (34) (170) (271) (81) (81)
Experience adjustments on plan liabilities (13) 498 117 64 56
Experience adjustments on plan assets (15) 475 (5) - (7)
33. Retirement and Other Employee Benefits (contd.)
Notes to Financial Statement for the year ended 31 March 2016
(Amount in Rupees Lakhs unless otherwise stated)
150Standalone Financials

34. �e Company identifies suppliers registered under the Micro, Small and Medium Enterprises Development Act, 2006, (MSMED) by obtaining confirmations from all suppliers. Based on the information received by the Company, some of the suppliers have confirmed to be registered under MSMED Act, 2006. Accordingly the disclosure relating to amount unpaid as at the year ended together with interest paid/payable is disclosed below:
(B lakhs)
Sr. No.
Particulars Year ended 31 March 2016
Year ended 31 March 2015
1 �e principal amount and the interest due thereon (to be shown separately) remaining unpaid to any supplier as at the end of each accounting year
38 13
2 �e amount of interest paid by the buyer in terms of section 16 of the Micro Small and Medium Enterprise Development Act, 2006, along with the amounts of the payment made to the supplier beyond the appointed day during each accounting year
- -
3 �e amount of interest due and payable for the period of delay in making payment (which have been paid but beyond the appointed day during the year) but without adding the interest specified under Micro Small and Medium Enterprise Development Act, 2006.
- -
4 �e amount of interest accrued and remaining unpaid at the end of each accounting year;
- -
5 �e amount of further interest remaining due and payable even in the succeeding years, until such date when the interest dues as above are actually paid to the small enterprise for the purpose of disallowance as a deductible expenditure under section 23 of the Micro Small and Medium Enterprise Development Act, 2006.
- -
35. During the year the company has utilised MAT credit entitlement of H 1,427 lakhs against provision for current tax of H11,869 lakhs.
36. CSR expenses
i) Gross amount required to be spent by the Company during the year H 427 Lakhs
ii) Amount spent during the year:
(B lakhs)
Amount spent in Cash
Yet to be paid in Cash
Total
i) Construction / acquistion of any asset - - -
ii) On purpose other than (i) above 518 - 518
37. As required by the RBI circular no DNBS.PD.CC. No. 256 /03.10.042 / 2011-12 dated 2 March 2012 the details of frauds noticed / reported are as below:
(B lakhs)
Particulars Year ended 31 March 2016
Year ended 31 March 2015
Amount involved 74 187
Amount recovered 22 8
Amount written off/provided 52 179
Balance - -
Notes to Financial Statement for the year ended 31 March 2016
(Amount in Rupees Lakhs unless otherwise stated)
151Annual Report 2016 Fullerton India Credit Company Limited

38.
As re
quire
d by
the
RBI c
ircul
ar n
o. D
NBS
.CO
.PD
.No.
367
/03.
10.0
1/20
13-1
4 da
ted
23 Ja
nuar
y 20
14, t
he d
etai
ls o
f acc
ount
s re
stru
ctur
ed d
urin
g th
e ye
ar e
nded
31 M
arch
201
6 ar
e gi
ven
belo
w:
(B la
khs)
No
Type
of
rest
ruct
urin
gRe
stru
ctur
ing
Acc
ount
as
on 1
Apr
il of
th
e FY
( O
peni
ng F
igur
es)
Fres
h re
stru
ctur
ing
durin
g th
e ye
arD
owng
rada
tions
of R
estr
uctu
red
acco
unts
du
ring
the
FYW
rite-
offs/
sale
/Rec
over
y/ o
f Re
stru
ctur
ed a
ccou
nts
durin
g th
e FY
Res
truc
ture
d ac
coun
ts a
s on
31
Mar
ch o
f the
FY
Ass
et
Clas
sific
atio
nN
o of
br
row
ers
Am
ount
ou
tsta
ndin
gPr
ovis
ion
ther
eon
No
of
brro
wer
sA
mou
nt
outs
tand
ing
as a
t 31 M
arch
20
16
Prov
isio
n th
ereo
nN
o of
br
row
ers
Am
ount
ou
tsta
ndin
g as
at 3
1 Mar
ch
2016
Prov
isio
n th
ereo
nN
o of
br
row
ers
Am
ount
ou
tsta
ndin
gPr
ovis
ion
ther
eon
No
of
brro
wer
sA
mou
nt
outs
tand
ing
Prov
isio
n th
ereo
n
1CD
R
stan
dard
- -
- -
- -
- -
- -
- -
- -
-
Subs
tand
ard
2 5
13 5
13 -
- -
- -
- 1
251
251
1 2
62 2
62
Dou
btfu
l -
- -
- -
- -
- -
- -
- -
- -
Loss
- -
- -
- -
- -
- -
- -
- -
-
Tota
l2
513
513
- -
- -
- -
1 2
51 2
51 1
262
262
2O
ther
s
Stan
dard
- -
- -
- -
- -
- -
- -
- -
-
Subs
tand
ard
- -
- -
- -
- -
- -
- -
- -
-
Dou
btfu
l -
- -
- -
- -
- -
- -
- -
- -
Loss
- -
- -
- -
- -
- -
- -
- -
-
Tota
l -
- -
- -
- -
- -
- -
- -
- -
3Gr
and
Tota
l
Stan
dard
- -
- -
- -
- -
- -
- -
- -
-
Subs
tand
ard
2 5
13 5
13 -
- -
- -
- 1
251
251
1 2
62 2
62
Dou
btfu
l -
- -
- -
- -
- -
- -
- -
- -
Loss
- -
- -
- -
- -
- -
- -
- -
-
Tota
l 2
513
513
- -
- -
- -
1 2
51 2
51 1
262
262
Not
e:
1. �
ere
are
no S
ME
case
s w
hich
hav
e be
en re
stru
ctur
ed d
urin
g th
e ye
ar e
nded
31 M
arch
201
6.
2.
�er
e ha
ve b
een
no u
pgra
datio
ns o
f res
truc
ture
d ad
vanc
es d
urin
g th
e ye
ar e
nded
31 M
arch
201
6.
3.
�er
e w
ere
no re
stru
ctur
ed s
tand
ard
adva
nces
whi
ch c
ease
d to
att
ract
hig
her p
rovi
sion
ing
and/
or a
dditi
onal
risk
wei
ght a
t the
year
end
ed 3
1 Mar
ch 2
016.
4.
�e
outs
tand
ing
amou
nt a
nd n
umbe
r of b
orro
wer
s as
at 3
1 Mar
ch 2
016
is a
fter
con
side
ring
reco
verie
s an
d sa
le o
f ass
ets
durin
g th
e ye
ar.
5.
Addi
tiona
l fac
ilitie
s av
aile
d by
bor
row
ers
in e
xist
ing
rest
ruct
ured
acc
ount
s ar
e di
sclo
sed
unde
r “Fr
esh
rest
ruct
urin
g du
ring
the
year
” and
par
tial r
epay
men
ts in
exi
stin
g re
stru
ctur
ed a
ccou
nts
are
disc
lose
d un
der “
Writ
e-off
s/sa
le/r
ecov
ery
of re
stru
ctur
ed a
ccou
nts”
, how
ever
, for
the
purp
ose
of a
rithm
etic
al a
ccur
acy
the
num
ber o
f exi
stin
g bo
rrow
ers
avai
ling
addi
tiona
l fac
ility
or p
artia
l rep
aym
ents
hav
e no
t bee
n di
sclo
sed.
6.
�e
abov
e ta
ble
pert
ains
to a
dvan
ces
and
does
not
incl
ude
inve
stm
ent i
n sh
ares
whi
ch h
ave
been
fully
pro
vide
d fo
r.
7.
�e
prov
isio
n in
the
abov
e ta
ble
incl
udes
gen
eral
loan
loss
pro
visi
on a
nd o
ther
pro
visi
ons
held
on
the
rest
ruct
ured
adv
ance
s.
8.
For t
he p
urpo
se o
f arit
hmet
ical
acc
urac
y as
requ
ired
by c
ircul
ar, m
ovem
ent i
n pr
ovis
ions
in th
e ex
istin
g re
stru
ctur
ed a
ccou
nt a
s co
mpa
red
to o
peni
ng b
alan
ce is
dis
clos
ed u
nder
col
umn
fres
h re
stru
ctur
ing
(for i
ncre
ase
in
prov
isio
n) a
nd w
rite-
off/s
ale/
reco
very
(for
dec
reas
e in
pro
visi
on) d
urin
g th
e ye
ar a
nd a
re n
ot c
ompa
rabl
e w
ith th
e ad
ditio
nal f
acilit
ies
avai
led
and
part
ial r
ecov
ery
disc
lose
d un
der t
he re
spec
tive
colu
mns
.
Notes to Financial Statement for the year ended 31 March 2016
(Amount in Rupees Lakhs unless otherwise stated)
152Standalone Financials

39. Additional Disclosures required by the RBIi) Capital to Risk Assets Ratio (‘CRAR’)
(B lakhs)
Items Particulars 31 March 2016 31 March 2015
i) CRAR (%) 21.90% 19.55%
ii) CRAR - Tier I Capital (%) 16.14% 15.92%
iii) CRAR - Tier II Capital (%) 5.76% 3.63%
iv) Amount of subordinated debt raised as Tier-II capital 62,000 30,000
v) Amount raised by issue of Perpetual Debt Instruments - -
ii) Details of investments(B lakhs)
Sr No Particulars 31 March 2016 31 March 2015
A Value of Investments
(i) Gross Value of Investments
(a) In India 95,593 52,717
(b) Outside India, - -
(ii) Provisions for Depreciation
(a) In India 91 1,028
(b) Outside India, - -
(iii) Net Value of Investments
(a) In India 95,501 51,689
(b) Outside India, - -
B Movement of provisions held towards depreciation on investments
i) Opening balance 1,028 1,026
ii) Add : Provisions made during the year - 2
iii) Less : Write-off / write-back of excess provisions during the year 937 -
iv) Closing balance 91 1,028
iii) Derivatives �e Company has not entered into any forward rate agreements, interest rate swaps, exchange traded interest rate
derivatives. Hence, no disclosure is made for the same.
iv) Securitisation a. During the year Company has transferred loans through securitisation. �e information on securitisation activity of
the Company as an originator is given below:
Notes to Financial Statement for the year ended 31 March 2016
(Amount in Rupees Lakhs unless otherwise stated)
153Annual Report 2016 Fullerton India Credit Company Limited

iv) Securitisation (contd.)
(B lakhs)
Particulars Year ended 31 March 2016
Year ended 31 March 2015
Total number of loans securitised 751 -
Total book value of the loans securitised 2,243 -
Total book value of the loans securitised including loans placed as collateral 2,243 -
Sale consideration received for the loan asset securitised 2,243 -
Excess interest spread recognised in the statement of profit and loss 11 -
(B lakhs)
Particulars Year ended 31 March 2016
Year ended 31 March 2015
Credit enhancements provided and outstanding (Gross):
Interest subordination 18 -
Cash Collateral 224 -
Corporate Guarantee 40 -
�e information on securitisation of the Company as an originator in respect of outstanding amount of assets securitised under par structure is given below:
(B lakhs)
Particulars Year ended 31 March 2016
Year ended 31 March 2015
No. of SPVs Sponsored by the NBFC for securitisation transactions 1 NIL
Total Amount of securitised assets as per books of the SPVs sponsored by the NBFC 2,243 -
Total amount of exposures retained by the company to comply with MRR as on the date of balance sheet
a) Off-balance sheet exposures -
First loss - -
Others - -
b) On-balance sheet exposures - -
First loss 224 -
Others - -
Amount of exposures to securitisation transactions other than MRR
a) Off-balance sheet exposures
i) Exposure to own Securitisation
First loss - -
Others 40 -
Notes to Financial Statement for the year ended 31 March 2016
(Amount in Rupees Lakhs unless otherwise stated)
154Standalone Financials

(B lakhs)
Particulars Year ended 31 March 2016
Year ended 31 March 2015
ii) Exposure to third party Securitisation transactions
First loss - -
Others - -
b) On-balance sheet exposures
i) Exposure to own securitisation
First loss - -
Others - -
ii) Exposure to third party Securitisation transactions
First loss - -
Others - -
v) Assignment
Details of assignment transactions undertaken by the Company during the year.
(B lakhs)
Particulars Year ended 31 March 2016
Year ended 31 March 2015
No. of accounts 5 -
Aggregate value (net of provisions) of accounts sold 50,949 -
Aggregate consideration 50,949 -
Additional consideration realised in respect of accounts transferred in earlier years - -
Aggregate gain / loss over net book value - -
(B lakhs)
Particulars Upto 30/31 days Over 1 month upto 2 months
Over 2 months upto 3 months
Over 3 months & upto 6 months
Advances* 22,123 32,487 32,636 92,296
(27,834) (25,702) (25,148) (72,628)
Investments** 104,417 2,574 3,558 7,688
(50,684) (45) (1,073) (3,991)
Borrowings 31,653 31,767 41,381 45,696
(3,442) (29,757) (6,004) (71,240)
vi) Asset Liability Management Maturity pattern of certain items of Assets and Liabilities:
Notes to Financial Statement for the year ended 31 March 2016
(Amount in Rupees Lakhs unless otherwise stated)
155Annual Report 2016 Fullerton India Credit Company Limited
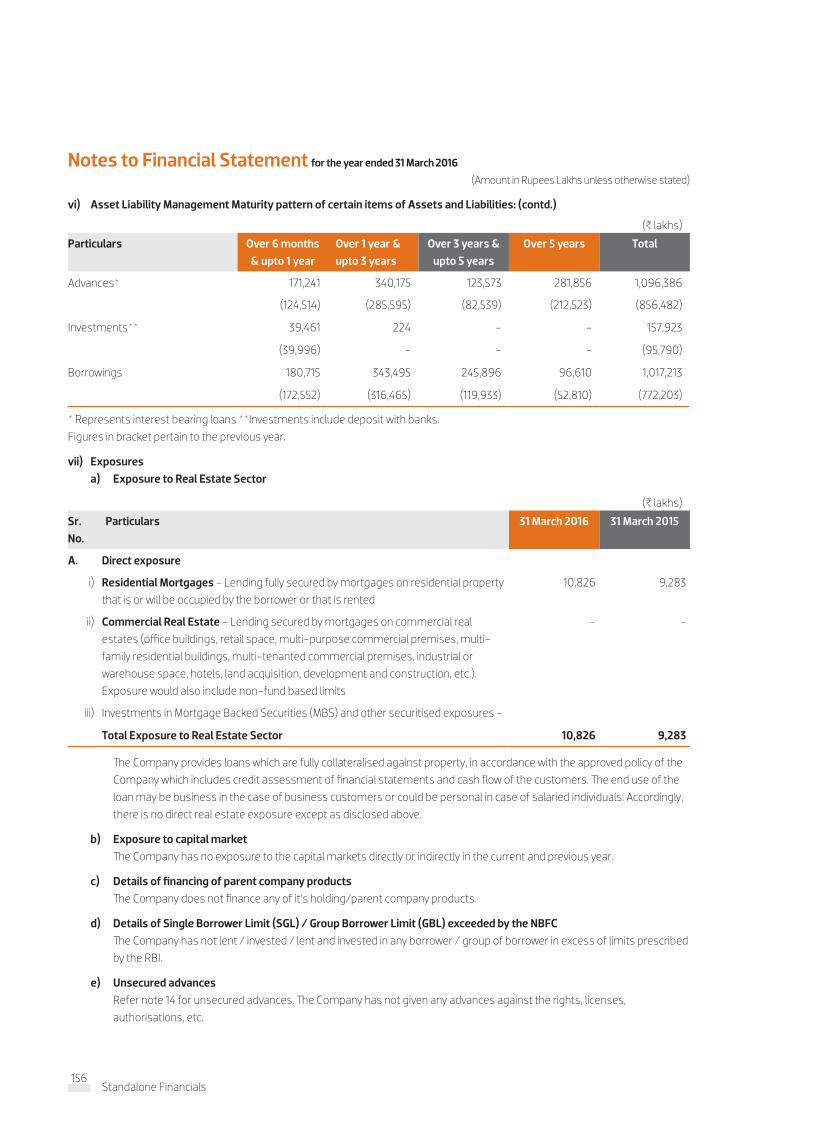
(B lakhs)
Particulars Over 6 months & upto 1 year
Over 1 year & upto 3 years
Over 3 years & upto 5 years
Over 5 years Total
Advances* 171,241 340,175 123,573 281,856 1,096,386
(124,514) (285,595) (82,539) (212,523) (856,482)
Investments** 39,461 224 - - 157,923
(39,996) - - - (95,790)
Borrowings 180,715 343,495 245,896 96,610 1,017,213
(172,552) (316,465) (119,933) (52,810) (772,203)
vi) Asset Liability Management Maturity pattern of certain items of Assets and Liabilities: (contd.)
* Represents interest bearing loans **Investments include deposit with banks.Figures in bracket pertain to the previous year.
vii) Exposuresa) Exposure to Real Estate Sector
(B lakhs)
Sr. No.
Particulars 31 March 2016 31 March 2015
A. Direct exposure
i) Residential Mortgages - Lending fully secured by mortgages on residential property that is or will be occupied by the borrower or that is rented
10,826 9,283
ii) Commercial Real Estate - Lending secured by mortgages on commercial real estates (office buildings, retail space, multi-purpose commercial premises, multi-family residential buildings, multi-tenanted commercial premises, industrial or warehouse space, hotels, land acquisition, development and construction, etc.). Exposure would also include non-fund based limits
- -
iii) Investments in Mortgage Backed Securities (MBS) and other securitised exposures -
Total Exposure to Real Estate Sector 10,826 9,283
�e Company provides loans which are fully collateralised against property, in accordance with the approved policy of the Company which includes credit assessment of financial statements and cash flow of the customers. �e end use of the loan may be business in the case of business customers or could be personal in case of salaried individuals. Accordingly, there is no direct real estate exposure except as disclosed above.
b) Exposure to capital market �e Company has no exposure to the capital markets directly or indirectly in the current and previous year.
c) Details of financing of parent company products �e Company does not finance any of it’s holding/parent company products.
d) Details of Single Borrower Limit (SGL) / Group Borrower Limit (GBL) exceeded by the NBFC �e Company has not lent / invested / lent and invested in any borrower / group of borrower in excess of limits prescribed
by the RBI.
e) Unsecured advances Refer note 14 for unsecured advances. �e Company has not given any advances against the rights, licenses,
authorisations, etc.
Notes to Financial Statement for the year ended 31 March 2016
(Amount in Rupees Lakhs unless otherwise stated)
156Standalone Financials

viii) Registration with other financial sector regulator
(B lakhs)
Name of Regulator Status Registration Details
Insurance Regulatory and Development Authority (IRDA)
Corporate Agent License No. CA0098 Valid till 31 March 2019
ix) No penalties were imposed by RBI and other regulators during the current and previous year.
x) Refer note 27 for related party transactions during the current and previous year.
xi) Ratings assigned by credit rating agencies and migration of ratings during the year
Particulars 2015-2016 2014-2015
ICRA India Rating CARE ICRA India Rating CARE
LT
NCD / SD ICRA AA+with Stable Outlook
IND AA+ with Stable Outlook
AAA ICRA AA+ with Stable Outlook
IND AA+ with Stable Outlook
AAA
TL ICRA AA+with Stable Outlook
IND AA+ with Stable Outlook
- ICRA AA+ with Stable Outlook
IND AA+ with Stable Outlook
-
PTC - AA with Stable Outlook
ST - -
STD ICRA A1+ IND A1+ - ICRA A1+ IND A1+ -
CP ICRA A1+ - - ICRA A1+ - -
Company Ratings -
LT ICRA AA+ with Stable Outlook
IND AA+ with Stable Outlook
- ICRA AA+with Stable Outlook
IND AA+ with Stable Outlook
-
ST ICRA A1+ IND A1+ - ICRA A1+ IND A1+ -
LT – Long Term ST – Short Term NCD – Non Convertible Debentures SD – Subordinated Debt CP – Commercial Paper TL – Term Loan STD – Short Term Debt PTC - Series A PTC’s �ere were no migrations of ratings during the year. All ratings are subject to annual surveillance.
xii) Net Profit or Loss for the period, prior period items and changes in accounting policies. Refer Statement of Profit and Loss for profit or loss in the current and the previous year. �e accounting policies followed in
preparation of financial statements are consistent with those of the previous year.
xiii) Revenue has been recognised in accordance with the revenue recognition policy of the Company and there are no deviations to the same (refer note 2).
xiv) Break up of ‘Provisions and Contingencies’ shown under the head Expenditure in the Statement of Profit and Loss
Notes to Financial Statement for the year ended 31 March 2016
(Amount in Rupees Lakhs unless otherwise stated)
157Annual Report 2016 Fullerton India Credit Company Limited

(B lakhs)
Break up of ‘Provisions and Contingencies’ shown under the head Expenditure in Profit and Loss Account
31 March 2016 31 March 2015
Provisions for depreciation in carrying value of Investment (9) 2
Provision towards non-performing assets 2,856 2,244
Provision made towards income tax* 11,869 6,765
Provision on securitised loans** 3 (761)
Provision for standard assets 3,295 1,415
* Income tax for the previous year was provided under Minimum Alternative Tax (MAT) and the Company had created a MAT credit entitlement for an equal amount. Hence, profit before tax and profit after tax were same and had no impact on the Statement of Profit and Loss. �e amount shown here is the gross amount provided during the previous year.
** Reversal of provision in the previous year was pertaining to assigned loans.
xv) Draw down from reserves
�e Company has not withdrawn any amount from any of the reserves during the year ended 31 March 2016 (Previous year : Nil)
xvi) Concentration of Deposits, Advances, Exposures and NPAs(a) Concentration of Deposits �e Company has not accepted any deposits during the current and previous year. Also there are no outstanding deposit
from earlier years.
(B lakhs)
31 March 2016 31 March 2015
Total advances to twenty largest borrowers 38,110 36,745
Percentage of advances to twenty largest borrowers to total advances of the Company
3% 4%
(b) Concentration of Advances
(B lakhs)
31 March 2016 31 March 2015
Total exposure to twenty largest borrowers / customers 38,712 36,745
Percentage of exposures to twenty largest borrowers / customers to Total Exposure of the Company on borrowers / customers
4% 4%
(c) Concentration of Exposures
(B lakhs)
31 March 2016 31 March 2015
Total Exposure to top four NPA accounts 5,779 4,993
(d) Concentration of Non Performing Accounts
Notes to Financial Statement for the year ended 31 March 2016
(Amount in Rupees Lakhs unless otherwise stated)
158Standalone Financials

(B lakhs)
Sr. No.
Sector Percentage of NPAs to Total Advances in that sector
31 March 2016 31 March 2015
1 Agriculture and allied activities 0.0% 0.0%
2 MSME 3.8% 3.3%
3 Corporate borrowers* 3.9% 4.4%
4 Services 0.0% 0.0%
5 Unsecured personal loans 0.9% 0.8%
6 Auto loans (Commercial Vehicle) 3.3% 4.3%
7 Other personal loans (incl. TW, used car, Loan against property) 3.0% 1.4%
*NPA% shown above are mutually exclusive.
(e) Sector-wise Non performing accounts
xvi) Movement of NPAs, provision, net NPA(B lakhs)
Particulars 31 March 2016 31 March 2015
(i) Net NPA to Net Advances (%) 1.28% 1.41%
(ii) Movement in Gross NPAs
(a) Opening Balance 16,685 10,492
(b) Additions during the year 37,801 33,526
Sub Total (A) 54,486 44,018
(a) Up gradations 2,592 2,117
(b) Recoveries 6,192 5,148
(c) Write-offs 24,210 20,068
Sub Total (B) 32,994 27,333
Gross NPAs as on 31 Mar (A-B) 21,492 16,685
(iii) Movement in provisions for NPAs
(a) Opening balance 4,589 2,346
(b) Provisions made during the year 10,377 5,873
(c) Write off / write back of excess provisions 7,560 3,629
(d) Closing balance 7,406 4,589
(iv) Movement in Net NPAs
(a) Opening balance 12,096 8,146
(b) Additions during the year 27,424 27,653
(c) Reductions during the Year 25,434 23,703
(d) Closing balance 14,086 12,096
Notes to Financial Statement for the year ended 31 March 2016
(Amount in Rupees Lakhs unless otherwise stated)
159Annual Report 2016 Fullerton India Credit Company Limited

xvii) �e Company has not invested in any overseas assets in the current and previous year. Also there are no outstanding investments from earlier years.
xviii) �e Company has not sponsored any off-Balance Sheet SPV in the current and previous year which are required to be consolidated as per accounting norms. Also there are no outstanding investments from earlier years.
xix) Disclosure on complaints
(a) No. of complaints pending at the beginning of the year 169
(b) No. of complaints received during the year 2,967
(c) No. of complaints redressed during the year 3,121
(d) No. of complaints pending at the end of the year 15
40. �e Company does not have any outstanding loan against gold jewellery as at 31 March 2016 (Previous year : HNil)
41. �e Company has reclassified/regrouped previous year figures to conform to current year’s classification, where applicable.
For and on behalf of the Board of Directors ofFullerton India Credit Company Limited
Sd/- Sd/-Gan Chee Yen Shantanu Mitra Chairman CEO and Managing Director
Sd/-Pankaj Malik Chief Financial Officer andCompany Secretary
Place : MumbaiDate : 19 May 2016
Notes to Financial Statement for the year ended 31 March 2016
(Amount in Rupees Lakhs unless otherwise stated)
160Standalone Financials

(As required in terms of Paragraph 13 of the Non-Banking Financial (Deposit Accepting or Holding) Companies Prudential Norms (Reserve Bank of India ) Directions, 2007)
(B lakhs)Sr No
Particulars Amount Outstanding
Amount Overdue
1. Loans and advances availed by the Non Banking Financial Company inclusive of interest accrued thereon but not paid:
(a) Debentures (other than falling within the meaning of public deposits)
Secured 311,302 -
Unsecured 64,749 -
(b) Deferred Credits - -
(c) Term Loans 542,296 -
(d) Inter-corporate loans and borrowing - -
(e) Commercial Paper 109,187 -
(f) Public Deposits - -
(g) Other Loans 7,503 -
2. Break-up of (1)(f) above (Outstanding public deposits inclusive of interest accrued thereon but not paid):
(a) In the form of Unsecured debentures - -
(b) In the form of partly secured debentures i.e. debentures where there is a shortfall in the value of security
- -
(c) Other public deposits - -
Sr No
Particulars Amount Outstanding
3. Break-up of Loans and Advances including bills receivables [other than those included in (4) below] :
(a) Secured 527,375
(b) Unsecured 576,362
4. Break up of Leased Assets and stock on hire and other assets counting towards AFC activities
(i) Lease assets including lease rentals under sundry debtors : -
(a) Finance Lease -
(b) Operating Lease -
(ii) Stock on hire including hire charges under sundry debtors: -
(a) Assets on hire -
(b) Repossessed Assets -
(iii) Other Loans counting towards AFC activities : -
(a) Loans where assets have been repossessed 95
(b) Loans other than (a) above 67,981
Schedule to the Balance Sheet of a Non-Banking Financial Company
161Annual Report 2016 Fullerton India Credit Company Limited

(B lakhs)
Sr No
Particulars Amount Outstanding
5. Break-up of Investments :
Current Investments
1. Quoted:
(i) Shares:
(a) Equity -
(b) Preference -
(ii) Debentures and Bonds -
(iii) Units of mutual funds -
(iv) Government Securities -
(v) Others
2. Unquoted:
(i) Shares:
(a) Equity -
(b) Preference -
(ii) Debentures and Bonds 6,542
(iii) Units of mutual funds 778
(iv) Government Securities -
(v) Others – Certificate of Deposits 62,533
– Commercial papers 19,644
Long Term Investments
1. Quoted:
(i) Shares:
(a) Equity -
(b) Preference -
(ii) Debentures and Bonds -
(iii) Units of mutual funds -
(iv) Government Securities -
(v) Others -
2. Unquoted:
(i) Shares:
(a) Equity 6,005
(b) Preference -
(ii) Debentures and Bonds -
(iii) Units of mutual funds -
(iv) Government Securities -
(v) Others -
Schedule to the Balance Sheet of a Non-Banking Financial Company
162Standalone Financials
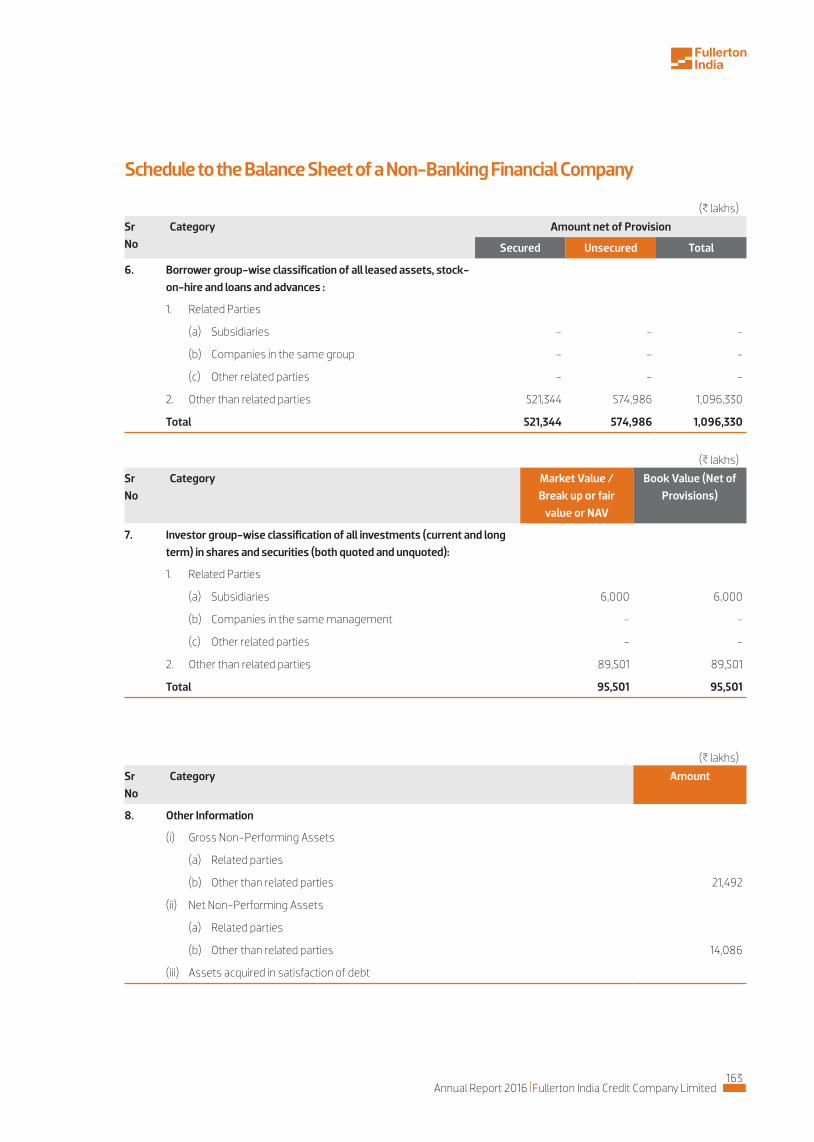
(B lakhs)
Sr No
Category Amount net of Provision
Secured Unsecured Total
6. Borrower group-wise classification of all leased assets, stock-on-hire and loans and advances :
1. Related Parties
(a) Subsidiaries - - -
(b) Companies in the same group - - -
(c) Other related parties - - -
2. Other than related parties 521,344 574,986 1,096,330
Total 521,344 574,986 1,096,330
(B lakhs)
Sr No
Category Market Value / Break up or fair
value or NAV
Book Value (Net of Provisions)
7. Investor group-wise classification of all investments (current and long term) in shares and securities (both quoted and unquoted):
1. Related Parties
(a) Subsidiaries 6,000 6,000
(b) Companies in the same management - -
(c) Other related parties - -
2. Other than related parties 89,501 89,501
Total 95,501 95,501
(B lakhs)
Sr No
Category Amount
8. Other Information
(i) Gross Non-Performing Assets
(a) Related parties
(b) Other than related parties 21,492
(ii) Net Non-Performing Assets
(a) Related parties
(b) Other than related parties 14,086
(iii) Assets acquired in satisfaction of debt
Schedule to the Balance Sheet of a Non-Banking Financial Company
163Annual Report 2016 Fullerton India Credit Company Limited

Statement containing salient features of the financial statement of subsidiaries/associate companies/joint ventures (Pursuant to first proviso to sub-section (3) of section 129 read with rule 5 of Companies (Accounts) Rules, 2014)
Part A : Subsidiaries
Sr No Particulars Fullerton India Home Finance Company Ltd
Fullerton India Foundation for Social & Economic Development
1 Financial years of the subsidiary Company ended on 31 March 2016 31 March 20162 Reporting currency INR INR3 Shares of the subsidiary held on the above date and extent of holding
a) Equity Shares (of H10 each) 57,619,048 23,575b) Extent of holding 100% 100%
4 Net aggregate amount of Profit/(Losses) of the Subsidiary for the period so far as it concerns members of Fullerton India Credit Company Limitedi) Not dealt within the accounts of the Holding Company a) For the financial year of the Subsidiary (49,911,194) 99,276 b) For the previous financial years of the Subsidiary/since it became
the Holding company's subsidiary 4,992,773 (99,276)
ii) Deal within the Holding company's accounts a) For the financial year of the Subsidiary Nil Nil b) For the previous financial years of the Subsidiary/since it became
the Holding company's subsidiaryNil Nil
5 Material changes if any between the end of financial year of the subsidiary company and that of the Holding Company
Nil Nil
6 Additional information on Subsidiary CompaniesShare Capital 576,190,480 235,750Reserves and Surplus (21,108,897) -Total Assets 647,392,354 235,750Total Liabilities 92,310,772 -Investment (except in case of investment in subsidiaries) 252,567,405 -Turnover 23,116,449 -Profit before Taxation (49,911,194) 99,276Provision for Taxation - -Profit after Taxation (49,911,194) 99,276Proposed Dividend (including Dividend Distribution Tax thereon) - -
7 Operation commenced Yes No
No subsidiaries were sold or liquidated during the year.
Part B : Associates and Joint Ventures�e Company does not have associates and joint ventures during the year ended 31 March 2016.
For and on behalf of the Board of Directors ofFullerton India Credit Company Limited
Sd/- Sd/-Gan Chee Yen Shantanu Mitra Chairman CEO and Managing Director
Sd/-Pankaj Malik Chief Financial Officer andCompany Secretary
Place : MumbaiDate : 19 May 2016
164Standalone Financials

Sr. No.
Name of the Policy Web link
1. Corporate Social Responsibility Policy http://www.fullertonindia.com/policy/csr-policy.pdf
2. Whistle Blower Policy http://www.fullertonindia.com/policy/whistle-blower-polic-march-2015.pdf
3. Policy on dealing with Related Party Transactions
http://www.fullertonindia.com/policy/Related-Party-Transaction-Dec-2015.pdf
4. Code of Practices and Procedures to Fair Disclosure of Unpublished Price Sensitive Information
http://www.fullertonindia.com/policy/code-fair-disclosure-upsi-ficcl.pdf
5. Fair Practice Code http://www.fullertonindia.com/policy/Fair-Practices-Code.html
6. Corporate Governance Policy http://www.fullertonindia.com/policy/corporate-governace-policy.html
References to the Important Documents and Policies placed on the website of the Company
To meet the various disclosure requirements under the Companies Act, 2013, SEBI Regulations and RBI Regulations, the weblinks of relevant policies have been provided below:
165Annual Report 2016 Fullerton India Credit Company Limited

Notes

Notes

Notes