full year results, appendix 4e & supporting … · 2015 and $10.4m relating to fy16 up until...
TRANSCRIPT

Level 3, 271 Collins Street, Melbourne VIC 3000 PO Box 274, Flinders Lane VIC 8009
Ph: +61 3 9650 0138 Redbubble Pty Ltd
ABN 11 119 200 592
FULLYEARRESULTS,APPENDIX4E&SUPPORTINGDOCUMENTATION
RedbubblemeetsFY2016IPOforecastandreaffirmsFY2017prospectusguidance
Melbourne,Australia;25August2016:RedbubbleLimited(ASX:RBL)aleadingglobalmarketplaceforindependentartists,todaylodgeditsFullYearResultsReport(Appendix4E)forthefullyearended30June2016(attached).Redbubblereportedfullyearrevenueof$114.6MforFY2016(up61.2%onFY2015)withaGrossProfitof$39M(up61.8%onFY2015)andanEBITDAlossof$8.7M.RedbubbleCEO,MartinHoskingsaid,“ThestrongresultreflectsthesoliddynamicsoftheRedbubblebusiness.Strongrevenuegrowth,improvedmarginsandloweroperatingexpendituregrowthresultedinanEBITDAloss$1.5Mbetterthanforecast.Overallthebusinessisscalingwellwithrevenuegrowthaheadofoperatingexpendituregrowthandwithstablemarginsandlowcustomeracquisitioncosts”.“Basedontheresultsandtheupcomingpipelineofinitiatives,weareaffirmingour2017forecastprovidedatthetimeoftheIPO.”Hewentontosay“RedbubbleisanunusualAustralianlistedcompany,aglobaltechnologyconsumerbusiness.Ourfuturegrowthisnotlimitedbythedomesticmarketwithover90%ofourrevenuefromoffshore.Weparticipateinenormousconsumercategories–onlineaccessories,apparelandhomewares–whereourabilitytogrowisonlylimitedbyourexecutioncapabilities.Wehaveprovenwecandothisinascaleablewaygivenourstrongcashflowmodel.AswemovethroughFY2017weexpecttoberealizingthebenefitsofearlierinvestmentsinthebusinessandmovingtoprofitability.”OperatinghighlightsTherehasbeenstrongimplementationofRedbubble’sgrowthplansduringtheFY2016periodvalidatedbythecontinuedstrongtoplineandgrossprofitgrowth.Throughouttheyear,Redbubblefocusedondeliveringtocorestrategyofstrengtheningthemarketplacedynamic.Duringtheyearto30JuneRedbubble:
• Delivereda‘mobilefirst’digitalproductpipelineasglobaltrendsshifttraffictowardsmobiledevices,including:
• Improvedcheckoutflow,includingnewpaymentoptions• Shoppingcartupgradeincludingnewpaymentoptions• Newhomepageincludingcollectionsofrelevant,popularworks
For
per
sona
l use
onl
y
• Launched12newphysicalproducts,takingthetotalto57(after3productswerediscontinued)
• GrewtheArtistcommunityinlinewithrevenuegrowth• Improvedthequalityandrelevancyofsearchresults• DeployedGermanandFrenchwebsitesaheadofschedule.
About RedbubbleFoundedin2006,Redbubbleisaglobalonlinemarketplace(redbubble.com)poweredbyover400,000independentartists.Redbubble’scommunityofpassionatecreativesselluncommondesignsonhigh-quality,everydayproductssuchasapparel,stationary,housewares,bags,wallartandsoon.ThroughtheRedbubblemarketplaceindependentartistsareabletoprofitfromtheircreativityandreachanewuniverseofadoringfans.Forcustomers,it’stheultimateinself-expression.Asimplebutmeaningfulwaytoshowtheworldwhotheyareandwhattheycareabout.RedbubbleislistedontheASX(RBL.AX)SupportingresourcesRedbubblehascompiledaninformationpackinsupportoftheAppendix4E.Forthisandotherrelevantinformationpleasevisit:shareholders.redbubble.comRedbubblecontactLloydHeinrich–GeneralManagerStrategyandInvestorRelationslloyd.heinrich@redbubble.com
For
per
sona
l use
onl
y

Appendix 4E
i
Redbubble Limited ABN: 11 119 200 592 Year ended 30 June 2016 (Previous corresponding period: Year ended 30 June 2015)
Results for announcement to the market
Dividends
Redbubble Limited has not paid and does not propose to pay dividends for the year ended 30 June 2016 (2015: Nil). There are no dividend or distribution reinvestment plans in operation.
Net tangible assets per security
Other information
Detailed analysis of the results for the year ended 30 June 2016 follows. Further commentary is contained in the Redbubble ASX release announcing the full year financial results, the review of operations in the Directors’ Report accompanying the attached Consolidated Financial Statements and the attached presentation to investors. Other information requiring disclosure to comply with Listing Rule 4.3A is contained in, and should be read in conjunction with, the Consolidated Financial Statements for the year ended 30 June 2016. This report is based on the Consolidated Financial Statements for the year ended 30 June 2016 which has been audited by Ernst & Young with the Independent Auditor’s Report included in the 2016 Consolidated Financial Statements.
For
per
sona
l use
onl
y

Appendix 4E
ii
Appendix 4E Commentary
FY2016 in review Key financial and other metric highlights (year on year comparison)
$m for financial year (unless otherwise indicated) FY15 FY16 % change** Key financial metrics – Income Statement GTV* 88.4 142.9 61.7% Repeat GTV* 28.8 50.7 76.0% Revenue from ordinary activities 71.1 114.6 61.2% Fulfiller expenses 47.0 75.6 60.8% Gross profit* 24.1 39.0 61.8% Gross profit margin (%)* 33.9% 34.0% 0.5% Operating expenses (exclusive of capitalised development costs)
30.1 49.2 57.2%
EBITDA Loss* (inclusive of IPO costs $2.0M) 6.5 10.7 64.2% Loss per security (cents) 0.07 0.13 85.7% Key financial metrics – Balance Sheet (at 30 June) Cash at bank 14.0 42.0 200% Borrowings 15.2 0.0 (100%) Intangible assets (Capitalised development costs) 4.6 7.4 61.5% Net tangible assets per security (cents) (7.4) 15.1 304% Other metrics Site visits (millions) 103.1 147.8 43.4% Conversion rate (% of visits) 1.75% 1.87% 6.9% Average Order Value (AOV) ($ per order) 49.60 52.60 6.0% Selling artists (thousands) 96 154 61.6% Unique customers (millions) 1.44 2.20 52.8% Products (as at 30 June) (number) 48 57 18.8% People (incl. contractors) (as at 30 June) (FTE) 138 182 31.9%
* GTV, Gross profit, Gross profit margin and EBITDA (earnings before interest, tax, depreciation and amortisation) are non-IFRS measures that are presented to provide readers a better understanding of Redbubble’s financial performance and position. The non-IFRS measures are unaudited, however, they have been derived from the audited financial statements. ** % change calculations for key financial metrics based on numbers to nearest thousand dollars ($000).
For
per
sona
l use
onl
y
Appendix 4E
iii
Highlights & commentary
• Gross Transaction Value (GTV), Revenue, Gross Profit and EBITDA Loss for FY16 are in line with or better than the forecast set out in the company’s prospectus issued in May 2016.
• GTV, the total of sales processed through the Redbubble site less refunds, fraudulent transactions and chargebacks, was up $54.5M or 61.7% due to increase in all major metrics:
o Visits were up 44.7M or 43.4% to 147.8M with growth in visits from mobiles (70.9%) significantly outstripping growth from desktop (28.5%) with mobile visits representing 44.5% of total visits for the year.
o Conversion rate up 6.9% to 1.87% despite the increasing incidence of mobile visits which typically convert to sales at a lower rate than those from desktop.
o Average Order Value (AOV) up $3.00 or 6.0% to $52.60 entirely as a result as of the impact of foreign exchange rates. Nominally, AOV was down by 4.2% reflecting product mix with minimal price movements.
• Geographic split of GTV by region is largely unchanged compared to prior year (FY16/ FY15): o Americas 65%/64% o Europe 27%/27% o Oceania 7%/8% o Rest of world 1%/1%
• Revenue (GTV less sales taxes and artists’ margin, adjusted for unearned revenue pending shipment) was up $43.5M or 61.2%.
• Gross profit (Revenue less Fulfiller expenses) as a percentage of Revenue was 34.0% up from 33.9% in the prior year. • Operating expenses of $47.2M (exclusive of costs relating to the IPO) were up 57.2% although the increase slowed
significantly in 2HFY16 (see half-year by half-year analysis below). • Paid marketing expense was $7.7M up 79.8% and generated $45.9M in GTV ($12.3M in gross profit). Total paid
marketing spend was 5.4 cents for every dollar of GTV generated. An analysis of FY16 operating expenses and the extent they were expended to generate growth can be found on slide 39 of the attached Investor Presentation.
• EBITDA Loss (Gross profit less operating expenses) was $8.7 million (before IPO costs) (up from $6.5 million) as the company continued to grow its marketplace. The scaling benefits began to show in the second half of the year.
• Tax expense of $3.4M despite the loss before tax, due largely to the non-recognition of tax losses and R&D offsets totalling $25.9M incurred prior to IPO. This comprises $15.5M of accumulated tax losses and R&D offsets as at June 2015 and $10.4M relating to FY16 up until the IPO.
• IPO completed on 16 May 2016 raising $30.0M of new equity capital and resulting in conversion of $15.5M Cumulative Redeemable Preference Shares and$12.25M of Pre-IPO convertible notes into equity.
• Cash on hand balance at 30 June was $42.0M, up from $14.0M following completion of the IPO. • As at 30 June 2016, the company has no debt.
Key financial and other metric highlights (half year comparison)
Redbubble has a seasonal business which can be best demonstrated by a comparison of key financial and other metrics between 2HFY15, 1HFY16 and 2HFY16. The first half of the financial year incorporates the December quarter which includes not only the Christmas period but also the major online sales days around US Thanksgiving. Redbubble’s December quarter has typically represented about one-third of the full year’s sales (FY16 – 34.3%). This means the first half outperforms the second half on many financial and non-financial metrics, however, the continuing growth of the platform overall can be seen by the comparison of 2HFY16 and the prior corresponding period.
For
per
sona
l use
onl
y

Appendix 4E
iv
$m for half years (unless otherwise indicated)
2HFY15 1HFY16 2HFY16 % change**
2H15 v 2H16 Key financial metrics – Income Statement GTV* 43.6 80.3 62.6 43.6% Repeat GTV* 14.8 27.3 23.5 58.8% Revenue from ordinary activities 34.7 62.3 52.2 50.6% Fulfiller expenses 23.2 41.8 33.7 45.2% Gross profit* 11.5 20.5 18.5 61.4% Gross profit margin* 33.0% 32.9% 35.4% 7.3% Operating expenses (excluding IPO costs and capitalised development costs)
17.6 24.4 22.8 29.8%
EBITDA Loss* 6.4 4.2 6.5 0.9% Other metrics Site visits (million) 54.8 75.2 72.7 32.7% Conversion rate (% of visits) 1.62% 2.00% 1.74% 7.4% Average Order Value (AOV) ($ per order) 49.3 54.2 50.7 2.8% Selling artists (thousands) 76 107 123 62.9% Unique customers (millions) 0.75 1.25 1.01 34.7%
* GTV, Gross profit, Gross profit margin and EBITDA (earnings before interest, tax, depreciation and amortisation) are non-IFRS measures that are presented to provide readers a better understanding of Redbubble’s financial performance and position. The non-IFRS measures are unaudited, however, they have been derived from the audited financial statements. ** % change calculations for key financial metrics based on numbers to nearest thousand dollars ($000).
Highlights & commentary
• GTV, Repeat GTV and Revenue were up 43.6%, 58.8% and 50.4% respectively when compared to prior corresponding period. The major drivers of GTV performance are:
o Visits which were up 32.7% when compared to previous corresponding period; o Conversion rate was up 7.4% when compared to previous corresponding period. The strong increase in
conversion in 1HFY16 is due to the marketplace typically experiencing 2-3x the conversion rates on all devices over the holiday seasons;
o Average Order Value (AOV) was up 2.8% when compared to previous corresponding period. The jump in AOV in 1HFY16 reflects a combination of the normal seasonal effect of higher value orders in the holiday season and the favourable impact of foreign exchange movements.
• Gross profit and gross profit margin were considerably improved as FY2016 progressed and particularly so relative to 2HFY15. The US Thanksgiving and Christmas periods generally adversely impact margins due to increased incidence of returns and costs of expedited shipping. December 2015 was particularly affected by failure of one significant fulfiller to meet its production targets.
For
per
sona
l use
onl
y

Appendix 4E
v
• After allowing for the one-off costs of the IPO ($2.0M), 2HFY16 operating expenses were down when compared to 1HFY16 and up 29.5% when compared to prior corresponding period reflecting a scaling of cost growth compared to revenue growth.
• The number of unique customers transacting on the Redbubble marketplace was up 34.7% when compared with prior corresponding period. The higher 1HFY16 number again reflect the seasonal factor of US Thanksgiving and Christmas.
For
per
sona
l use
onl
y

Contents
Page number Directors’ Report 1
Consolidated Financial Statements 35 Notes to the Consolidated Financial Statements 39
Directors’ Declaration 82 Independent Auditors’ Report 83 Corporate information 85
For
per
sona
l use
onl
y

Directors’ Report
1
Your Directors present their report on the consolidated entity, consisting of Redbubble Limited and the entities it controlled during the year ended 30 June 2016 (referred to hereafter as Redbubble).
Directors
The following persons were directors of the Redbubble during the 2016 financial year (FY2016):
Mr Richard Cawsey
Chair, Non-executive Director
Mr Martin Hosking
Managing Director and Chief Executive Officer (CEO)
Ms Stephanie Tilenius
Non-executive Director
Ms Teresa Engelhard
Non-executive Director
Mr Greg Lockwood
Non-executive Director
Mr Grant Murdoch Non-executive Director (appointed 1 January 2016)
Mr Chris Nunn Non-executive Director (resigned 28 October 2015 to take up role as Chief Financial Officer commencing 1 November 2015)
Principal activities
Redbubble, through its website at Redbubble.com and three foreign language sites, is an online marketplace that facilitates the sale and purchase of art and designs on a range of products between independent creatives and consumers. The products are produced and shipped by third party service providers (i.e., product manufacturers, printers and shipping companies) referred to as fulfillers.
No significant change in the nature of these activities occurred during the year.
Dividends
No dividends were paid or declared since the start of FY2016.
Review of operations
Through FY2016 Redbubble focused on delivering growth by continuing to enhance the marketplace dynamics: attracting more artists, content and customers in a virtuous cycle. The strategy has been successful in delivering top-line Gross Transaction Value (GTV) growth of 61.7% to $142.9 million, revenue growth of 61.2% to $114.6 million and gross profit growth of 61.8% to $39.0 million. Growth in financial outcomes has been supported by growth in the key operating metrics:
• Visits to the site – Up 43% to 147.8 million for the year • Conversion of those visits to purchase – Up 7% to 1.87% of visits • Average Order Value (AOV) – Up 6% to $52.60
For
per
sona
l use
onl
y

Directors’ Report
2
Reflecting general trends in user behavior, over 50% of traffic to the Redbubble marketplace now comes from mobile devices. Significant activity has gone into improving the functionality and performance of the mobile website and growth in mobile visits has been the primary driver of overall growth in visits. Mobile visits tend to convert to sales at a significantly lower rate than those from desktop. Despite this, improvements in the site experience overall, and particularly in mobile, resulted in the increase overall conversion rates. Over the year Redbubble increased the range of physical products, with a particular focus on women’s apparel, including using advanced technology printing of the material before laser cutting it and sewing it. Overall, twelve new products were added:
• Journals • Women’s Fitted Scoop Neck Tee • Women’s V-neck Tee • Women’s Relaxed Fit Tee • Laptop Sleeve • Graphic Tee • Women’s A-Line Dress • Men’s Tri-blend Tee • Women’s Chiffon Top • Women’s Contrast Tank • Men’s Heavy Tee • iPhone Wallet
Three products were discontinued during the year. An expanded and more localised third party fulfillment network has significantly improved the customer experience by enabling shorter delivery times. One new fulfiller and eight new production locations were added to the network during the year. The average delivery time fell from 5.1 business days in June 2015 to 4.2 business days in June 2016. Customer satisfaction as measured by Net Promoter Score increased from 59 in June 2015 to 63 in June 2016. The number of selling artists grew in line with GTV growth with 154,000 artists making sales during the year (a growth of 62%). At year end there were 438,000 artists and 10.2 million works in the Redbubble marketplace. Considerable investment was made into developing the technology and capabilities to launch native language websites in order to increase penetration into non-English markets. A German language site was launched in March and a French language site was launched in June (ahead of plan). A Spanish language site is now in final testing and will be launched in full in the September quarter of FY2017.
For
per
sona
l use
onl
y

Directors’ Report
3
Significant changes in the state of affairs
Redbubble launched its initial public offering (IPO) and listed on the Australian Securities Exchange (ASX) on 16 May 2016. Apart from the IPO and ASX listing, in the Directors’ opinion there have been no significant changes in the state of affairs of Redbubble during the year. Significant events after end of 2016 financial year
In the Directors’ opinion there have been no matters or circumstances arising since the end of the 2016 financial year that has significantly affected, or may significantly affect:
• Redbubble's operations in future financial years; • the results of those operations in future financial years; or • Redbubble's state of affairs in future financial years.
Strategy and likely developments in operations
In FY2017, Redbubble will continue to pursue a strategy of enhancing the marketplace dynamics, focusing in particular on improving the on-site user experience, launching new physical products, increasing delivery speeds, growing artist earnings and strengthening penetration into the German, French and Spanish language markets. On-site user experience: There will be a continuing focus on the mobile experience. Site speed will receive renewed attention as the total content library expands and it becomes increasingly important to serve customers images quickly and seamlessly. Personalisation will be a new theme enabling Redbubble to learn about users (and groups of users) and to serve more relevant content to every unique visitor to the site. A prototype native iOS application, with different capabilities than the core experience, will also be trialed. New products: A strong flow of new product is in the pipeline for FY2017 with a focus on homewares and art categories for the first half of the year. At this stage, it is anticipated the second half focus will be line extensions to the existing apparel categories, offering customers greater choice and better value. Supply chain enhancements: In the first half of FY2017 there will be a focus on delivering greater direct-to-garment print capacity in core markets (specifically West Coast of the USA and Canada) for peak Christmas demand as well as more homewares capability including bringing on new fulfillers. The second half will likely bring additional fulfillers including for wall art and associated print products and homewares in Europe. Artist community: The main focus this year will be on enhancing the ability of artists to drive traffic from social networks by improving the set of tools available to them to easily share new works, promotions and special activities on the Redbubble platform. Work will also continue on piracy protection for artists and further automation of artist authentication. New markets: After full roll-out of the Spanish site early in FY2017, the new markets team will be concentrating on bedding down the three new sites (German, French and Spanish) and driving deeper penetration into these new markets.
For
per
sona
l use
onl
y

Directors’ Report
4
Change in Key Management Personnel (KMP) during FY2016 and since the end of that financial year
• Vanessa Freeman was appointed as Chief People and Culture Officer with effect from 25 August 2015. • Chris Nunn was appointed as the Chief Financial Officer with effect from 1 November 2015 (following his resignation
as a Director and Chair of Redbubble’s Audit & Risk Committee). • Victor Kovalev was appointed as the Chief Technology Officer with effect from 14 December 2015. Governance and risk
Redbubble is committed to strong and effective governance frameworks. Redbubble’s corporate governance policies are described in the Redbubble Corporate Governance Statement - available in the Corporate Governance section of Redbubble’s Investor Centre: shareholders.redbubble.com The Company is committed to managing its risks in an integrated, systematic and practical manner. The overall objective of risk management is to assist the Company to achieve its objectives by appropriately considering both threats and opportunities, and making informed decisions. The Audit and Risk Committee oversees the process for identification and management of risk in the Company, as described in the Redbubble Corporate Governance Statement. The Company Secretaries are responsible for providing oversight of the risk management framework and assurance on the management of significant risks to the CEO and the Board. The Company’s risk management framework, responsibilities and accountabilities are aligned with the Company’s business model. A statement of the Company’s risk management policy is provided in the Redbubble Corporate Governance Statement. The key organisational controls within the risk management framework help to shape the strategies, capabilities and culture of the organisation, identify and address vulnerabilities, strengthen the system of internal controls and build a more resilient organisation. The Company also has a risk register with risk profiles populated across various functions within the organisation.
Information on directors
Mr Richard Cawsey Non�executive Director and Chair of the Board Chair of Nomination Committee Member of Audit and Risk Committee
Richard Cawsey has a 27�year track record of building high�performing organisations in Australia, Europe, North America and Asia. in addition to chairing Redbubble, he is the executive chair of Denali Venture Partners, a team of advisers and execution partners that help fast growing companies realise their potential. Richard has held a number of board and senior executive roles for ASX listed companies including OAMPS Ltd (as a non�executive director), Centrepoint Alliance Ltd (as the managing director and CEO), Advance Property Management Ltd (as chair) and Wealthpoint ltd (as chair). As the managing director and CEO of Centrepoint Alliance ltd, Richard drove the cultural and organisational transformation required to survive as a listed finance company during the global financial crisis. At St. George Bank (then Australia’s 5th largest), as group executive investment services, Richard created a new division and played a significant role in the bank’s restructure and increased profit and growth by over 25%. In Asia for Morgan Stanley, as a managing director, Richard had success in both starting and growing a number of businesses. Richard has a Bachelor of Commerce (Hons) degree from Australian National University and is a graduate of the Australian Institute of Company Directors.
For
per
sona
l use
onl
y

Directors’ Report
5
Mr Martin Hosking CEO and Managing Director Member of Nomination Committee Martin Hosking has spent 20 years scaling Australian technology companies. He is a co�founder of Redbubble and became the CEO and Managing Director in July 2010. Previously, Martin was the chair of Aconex, a SaaS provider to construction firms, and Southern Innovation, a digital pulse processing solution. He was instrumental in the development and subsequent listing on the NASDAQ of search company, LookSmart. Martin started his career as a diplomat with the Australian Department of Foreign Affairs and Trade before joining McKinsey & Company, serving clients focusing on emerging technologies. Martin has a Bachelor of Arts (Hons – First class) degree from the University of Melbourne and an MBA (with distinction) from Melbourne Business School, where he has also lectured. Martin is a graduate of the Australian Institute of Company Directors. Ms Teresa Engelhard Independent Non�executive Director Chair of Remuneration Committee Teresa Engelhard is a Silicon Valley transplant with 20 years of experience working with growth technology companies as a director, executive and venture capitalist. Teresa has served on over 10 boards and in addition to being a Non�executive director of Redbubble, is currently a non�executive director of Planet Innovation, Ltd. and StartupAUS. Teresa also serves on the Entrepreneurs’ Programme Committee for the Australian Government, a sub�committee of the Innovation Australia Board. Teresa transitioned to a non�executive director path following six years as a managing partner with Jolimont Capital in Melbourne, where she was responsible for the investment in Next Window, which received an Australian Private Equity & Venture Capital Association Limited chairman’s award in 2010 for outstanding exit performance. Prior to moving to Australia, Teresa worked as a c�level executive at both private and public IT companies and as a venture capitalist with Mohr Davidow Ventures in California. Teresa spent the early years of her career at McKinsey & Company in Los Angeles. She has a Bachelor of Science (Hons) degree from the California Institute of Technology and an MBA from Stanford University. Teresa is a graduate of the Australian Institute of Company Directors.
For
per
sona
l use
onl
y

Directors’ Report
6
Ms Stephanie Tilenius Independent Non�executive Director Member of Remuneration Committee Member of Nomination Committee Stephanie Tilenius has been an executive�in�residence at Kleiner Perkins Caufield & Byers, a venture capital firm, since June 2012, primarily focusing on companies within its digital growth fund. From February 2010 until June 2012, Stephanie was a vice president of global commerce and payments at Google, Inc., where she oversaw digital commerce, product search and payments. Prior to joining Google, Stephanie was at eBay, Inc. from March 2001 until October 2009, where she progressed to senior vice president of eBay.com global products. Stephanie was also a co�founder of PlanetRx.com and has worked at other technology and business enterprises. Stephanie has served as a director of Coach, a NYSE�listed luxury accessories brand, since August 2012, and as a director of Seagate Technology since October 2014. She is also on the board of Tradesy, and is the chair of the advisory board of the Harvard Business School California Research Center. Stephanie holds a Bachelor of Arts degree and a Master’s degree in International Finance from Brandeis University, Massachusetts, and an MBA from Harvard University, Massachusetts. Mr Greg Lockwood Independent Non�executive Director Member of Audit and Risk Committee Greg Lockwood was appointed as a Non�executive Director with effect from June 2015. Greg is a partner of Piton Capital, which is a shareholder in Redbubble. In 1999, Greg founded UBS Capital’s early stage venture investing activities in Europe. Subsequently, he co�founded Piton Capital, the London�based venture capital fund specialising in marketplaces and business models with network effects. Prior to his venture capital activities, Greg worked in telecommunications corporate finance with UBS in London and Zurich and held operating roles in classified media publishing in Toronto. Greg has an Honours Business degree from the University of Western Ontario, and a Master’s degree in management from the Kellogg Graduate School of Management.
For
per
sona
l use
onl
y

Directors’ Report
7
Mr Grant Murdoch Independent Non�executive Director Chair of Audit and Risk Committee Member of Remuneration Committee Grant Murdoch joined the Board as an independent Non�executive Director and Chair of the Audit and Risk Committee in January 2016. Grant has subsequently joined the Remuneration Committee. Grant has more than 37 years’ chartered accounting experience. From 2004 to 2011, Grant led the corporate finance team for Ernst & Young Queensland and was an audit and corporate finance partner with Deloitte from 1980 to 2000. Grant has extensive experience in providing advice in relation to mergers, acquisitions, takeovers, corporate restructures, share issues, pre�acquisition pricing due diligence advice, expert reports for capital raisings and initial public offerings. Grant is currently a director and the chair of the audit committees for each of ALS limited (formerly Campbell Brothers), QIC limited and OFX limited (previously Ozforex Limited). He is a senator of the University of Queensland (as well as chair of the risk committee and a member of the finance committee), an adjunct professor at the University of Queensland Business School and a director of UQ Holdings Limited. Grant has a Master’s degree in Commerce (Honours) from the University of Canterbury, New Zealand, is a graduate of the Kellogg Advanced Executive Program and the Advanced Leadership Program at North Western University and a fellow of the Institute of Chartered Accountants in Australia (as well as past chair at the Queensland committee and a member of the national professional standards committee) and of the Australian Institute of Company Directors and is a member of the AICD Queensland State Council. Company Secretaries
Redbubble’s Company Secretaries are Ms Corina Davis (located in the United States) and Mr Paul Gordon (located in Australia). Ms Corina Davis General Counsel and Company Secretary (US) Corina Davis joined Redbubble in 2012 and oversees the company’s legal function. Corina has a wide range of cross�functional experience with particular expertise in copyright and trademark law, litigation, compliance and risk management. Before joining Redbubble, Corina practiced law in Los Angeles and New York City at Milstein Adelman, McCurdy & Fuller and Mendes & Mount. Corina is an active member of the Women’s General Counsel Network and the San Francisco General Counsel Group. Corina holds a Bachelor of Arts degree from the University of Michigan, Ann Arbor and a Juris Doctor degree from the University of San Diego School of Law, California. Mr Paul Gordon Regional Counsel and Company Secretary (Australia) Paul Gordon joined Redbubble in early 2015. Paul has broad corporate and commercial legal experience, gained in-house and in top-tier law firms in Australia, the UK and New Zealand. Before joining Redbubble, Paul was the General Counsel at ASX-listed REA Group Ltd, operator of realestate.com.au. Before that Paul was a Senior Corporate Associate at Nabarro in the UK and also practiced at Hogan Lovells (UK) and Chapman Tripp (NZ). Paul holds a Bachelor of Laws (Honours), Masters of Commerce from the University of Canterbury, New Zealand, and is currently completing a Diploma in Applied Corporate Governance.
For
per
sona
l use
onl
y

Directors’ Report
8
Meetings of directors
Retirement, election, continuation in office of directors
Under Redbubble’s constitution, directors cannot serve beyond three years or the third Annual General Meeting (AGM) after their appointment, whichever is longer, without submitting for re-election by the Company. A retiring Director is eligible for re-election without needing to give any prior notice of an intention to submit for re-election and holds office as a Director (subject to re-election) until the end of the general meeting at which the Director retires.
The Redbubble Senior Leadership Team
Mr Martin Hosking, Chief Executive Officer
See above. Mr Barry Newstead, Chief Operating Officer
Barry Newstead joined Redbubble in 2013 and has executive responsibility for Redbubble’s web product, technology, physical product development, new markets and strategy teams. Barry has held internet focused executive roles at the Wikimedia Foundation (which runs Wikipedia) and Australia Post. Earlier he was a strategy consultant with the Boston Consulting Group and the Bridgespan Group. He has worked extensively in North America, Asia, Europe and Australia. Barry has a Bachelor’s degree from Ivey Business School, Canada, and a Master’s degree in Public Policy from Harvard University, USA. Barry is a graduate of the Australian Institute of Company Directors. Mr Chris Nunn, Chief Financial Officer
Before Chris Nunn’s appointment as Chief Financial Officer (CFO) in November 2015, Chris served as a Non-executive Director and Chair of the Audit and Risk Committee of Redbubble from April 2015. Chris has more than 28 years of experience in the financial services and property funds management industries, and has spent most of the past 21 years as the senior finance executive working with and reporting to the boards of ASX listed companies and property trusts. Chris is a Chartered Accountant, a Graduate of the Australian Institute of Company Directors and has a Bachelor of Science (Economics) degree from Loughborough University, United Kingdom.
For
per
sona
l use
onl
y
Directors’ Report
9
Mr Robert Baumert, Chief Fulfilment and Analytics Officer
Rob Baumert joined Redbubble in April 2010 as head of operations and finance. In August 2011, he moved to San Francisco to establish Redbubble’s United States operations, and has recently returned to Melbourne to continue in his role as head of Supply Chain, Logistics, Customer Support and Business Intelligence. Originally trained as a chemical engineer, Rob completed his MBA at the Melbourne Business School and has held various senior roles in the fuel cell and e-commerce industries in North America and Australia. Ms Corina Davis, General Counsel and Company Secretary
Corina Davis joined Redbubble in 2012 and oversees the Company’s legal function. Corina has a wide range of cross-functional experience with particular expertise in copyright and trademark law, litigation, compliance and risk management. Before joining Redbubble, Corina practiced law in Los Angeles and New York City at Milstein Adelman, McCurdy & Fuller and Mendes & Mount. Corina is an active member of the Women’s General Counsel Network and the San Francisco General Counsel Group. Corina holds a Bachelor of Arts degree from the University of Michigan, Ann Arbor and a Juris Doctor degree from the University of San Diego School of Law, California. Ms Vanessa Freeman, Chief People and Culture Officer
Vanessa Freeman joined Redbubble as Chief People and Culture Officer in August 2015. Vanessa previously held senior human resources and strategy roles at Pacific Brands. Vanessa began her career with the New Zealand Trade Development Board in New York before joining McKinsey & Company, London, where she focused on corporate strategy, post-merger management and operational transformation. Vanessa has Bachelor of Arts and Bachelor of Commerce degrees from Auckland University and an MBA from Stanford University, California.
Mr Victor Kovalev, Chief Technology Officer
Victor Kovalev joined Redbubble in December 2015 as Chief Technology Officer. Previously, he led Indiegogo's technical team as vice president of engineering. Prior to that, Victor held technical leadership roles at Yelp (as head of mobile, business owner portal, Yelp platform for fulfiller transactions and partner APIs) and also VMware – having gone through both of their initial public offerings. His professional expertise is in building driven cultures to foster radical innovation through rapid scaling. Victor holds Bachelor of Science in Computer Engineering and Master of Science in Computer Science degrees from Georgia Institute of Technology and is a partner at a California-based non-profit artist accelerator, Zoo Labs.
For
per
sona
l use
onl
y

Directors’ Report
10
Details of share options and performance rights
The table that follows shows:
(i) the total number of unissued ordinary shares under options, performance rights and warrants, as at the date of this Report and as at 30 June 2016 (including Directors, Executives and staff);
(ii) details of options and performance rights granted to Directors during or since the end of the 2016 financial year and total options and performance rights of these individuals at the date of this Report; and
(iii) options exercised (and ordinary shares issued) as a result of exercise of options.
Holders of options, performance rights or warrants do not, by virtue of their holdings, have any pre-emptive right to participate in any share issue of the Company or any related body corporate. Indemnification and Insurance of officers
Redbubble has entered into Deeds of Indemnity with all Redbubble Limited directors in accordance with the Redbubble constitution. During the 2016 financial year, Redbubble paid a premium to insure the directors, officers and managers of Redbubble and its controlled entities. The insurance contract requires that the amount of the premium paid is confidential.
For
per
sona
l use
onl
y
Directors’ Report
11
Proceedings against the Company
As at the date of this Report, there are current lawsuits filed against members of the Redbubble Group that relate to alleged intellectual property infringement and/or breach of consumer laws. It is not possible for the Company to provide any reliable assessment of the likely quantum of damages that may become payable upon an adverse finding under any of the actions. No trial dates have been set for any of the actions and therefore it is not practicable to state the timing of any payment that may arise from an adverse finding. The Company considers that it is only possible but not probable that any of the actions will succeed. The Company does not consider that any of the current actions are likely to have a material adverse effect on the business or financial position of the Company. The Company is not aware of any other current or threatened civil litigation proceedings, arbitration proceedings, administration appeals, or criminal or governmental prosecutions in which the Company or other members of the Redbubble Group are directly or indirectly concerned. CEO and CFO declaration
The CEO and CFO have provided a written statement to the Board in accordance with Section 295A of the Corporations Act. With regard to the financial records and systems of risk management and internal compliance in this written statement, the Board received assurance from the CEO and CFO that the declaration was founded on a sound system of risk management and internal control, and that the system was operating effectively in all material aspects in relation to the reporting of financial risks. Remuneration Report
The Remuneration Report is set out on pages 14 to 34 and forms part of the Directors’ Report for the financial year ended 30 June 2016. Rounding of Amounts
The amounts contained in the Financial Report have been rounded to the nearest $1,000 (where rounding is applicable) where noted ($000) under the option available to the Company under ASIC Class Order 2016/191. The Company is an entity to which the Class Order applies. Auditor
EY Australia was appointed as Redbubble’s Auditor on 25 November 2014 and continues in office in accordance with section 327 of the Corporations Act 2001. To the extent permitted by law, the Company has agreed to indemnify EY Australia, as part of the terms of its audit engagement agreement against claims by third parties arising from the audit (for an unspecified amount). No payment has been made to indemnify EY during or since the end of the 2016 financial year. F
or p
erso
nal u
se o
nly

Directors’ Report
12
Non-audit services
During the year EY performed other services in addition to its audit responsibilities. The Directors are satisfied that the provision of non-audit services by EY during the reporting period did not compromise the auditor independence requirements set out in the Corporations Act. All non-audit services were subject to the Company’s External Auditor Policy and do not undermine the general principles relating to auditor independence set out in APES 110 Code of Ethics for Professional Accountants as they did not involve reviewing or auditing the auditor’s own work, acting in a management or decision-making capacity for the Company, or jointly sharing risks and rewards. Details of the amounts paid to the auditor of the Company and its related practices for non-audit services provided throughout the FY2016 and FY2015 financial years are as set out below.
Auditor’s Independence Declaration
A copy of the Auditor’s Independence Declaration, as required under section 307C of the Corporations Act, is set out on page 13. The Auditor’s Independence Declaration forms part of the Directors’ Report.
For
per
sona
l use
onl
y
Independent Auditors’ Declaration
13
For
per
sona
l use
onl
y
Remuneration Report (audited)
14
Letter from Remuneration Committee
Dear Shareholder, To complement the first public Remuneration Report by Redbubble, this introductory letter provides background on Redbubble’s remuneration policies. Redbubble is pursuing a valuable mission: to create the world’s largest marketplace for independent artists, bringing more creativity in the world. This mission is long-term and audacious. The Company is well advanced but building on the established position requires continued scalable growth. If the company is successful, significant shareholder value will be created and Redbubble will establish itself as an iconic Australian technology company. Redbubble remuneration policies from the Board and CEO down are aligned to the mission and its long-term nature. Given the inevitable uncertainties, we have sought to craft policies that create an alignment of interests with long-term share value creation. Specifically, we opt to provide:
• Base level fixed compensation that is at market for the position • Short-term incentives, for KMP, based on achievement of specific Key Performance Indicators (KPIs) • Long-term incentives, across the organisation, in the form of stock options granted at no less than the share-price
at time of grant and vesting out over 4 years.
These practices have served Redbubble well. In the five years prior to its listing, trailing twelve-month GTV, which is a sum total of all successful transactions on the platform, including taxes and artist margin, excluding refunds, fraud and chargebacks, expressed in Australian dollars, has grown from under $10 million to over $140 million and the share price Compound Annual Growth Rate (CAGR) has been 65%. Along the way, competitors, backed by some of Silicon Valley’s best venture firms, have been outpaced by Redbubble. Application of these practices has allowed Redbubble to recruit and retain a strong board, executive team and exceptional employees. These practices have ensured that all parties are aligned on long-term share value price accretion and participate in the value created. As we look to FY 2017 we are intending on moving further to bolster the focus on long-term shareholder value creation by increasing the importance of stock options in all remuneration packages. Such options only becoming valuable with share value growth and with Redbubble now publically listed, share value is more apparent and useful in attracting, retaining and motivating all parties. The existing practices reflect the motivations and intentions of the CEO and co-founder, Martin Hosking to create a mission driven company of enduring value. His own shareholding in the Company, at ~25% ensures alignment between his interests and those of other shareholders. His own compensation is based on the same methodology as used for other executives. With welcome and appreciation for both new and continuing shareholders, Your Remuneration Committee,
Teresa Engelhard (Chair), Grant Murdoch (member) and Stephanie Tilenius (member)
For
per
sona
l use
onl
y

Remuneration Report (audited)
15
Contents
1. Remuneration report overview 2. Overview of executive remuneration 3. Performance & executive remuneration outcomes in FY2016 4. How remuneration is governed 5. Overview of non-executive director remuneration 6. Executive statutory reporting for FY2016 7. Equity instruments held by KMP 8. Equity grants outstanding 9. Loans, transactions and other balances with KMP and their related parties
1. Remuneration Report overview
The Directors of Redbubble Limited present the Remuneration Report (the Report) for the Company for the financial year ended 30 June 2016. This Report forms part of the Director’s Report and has been audited in accordance with section 300A of the Corporations Act 2001. The report details the remuneration arrangements for KMP. KMP are those persons who, directly or indirectly, have authority and responsibility for planning, directing and controlling the major activities of the Company. The table below outlines the KMP of the Group and their movements during FY2016.
Key Management Personnel
Name Position
Non-executive directors Richard Cawsey Chair, Non-executive director
Teresa Engelhard Non-executive director
Greg Lockwood Non-executive director
Grant Murdoch Non-executive director (appointed 1 January 2016)
Chris Nunn Non-executive director (resigned 28 October 2015)
Stephanie Tilenius Non-executive director
Executive director Martin Hosking Managing Director and Chief Executive Officer (CEO)
Other key management personnel
Rob Baumert Chief Fulfilment and Analytics Officer (CF&AO - effective 1 November 2015, CFO up to 31 October 2015)
Corina Davis General Counsel and Company Secretary (US)
Vanessa Freeman Chief People and Culture Officer (CP&CO - appointed 24 August 2015)
Victor Kovalev Chief Technology Officer (CTO - appointed 14 December 2015)
Barry Newstead Chief Operating Officer (COO)
Chris Nunn Chief Financial Officer (CFO - appointed 1 November 2015)
For
per
sona
l use
onl
y

Remuneration Report (audited)
16
2. Overview of executive remuneration
2.1 What is Redbubble’s remuneration strategy?
Redbubble’s remuneration strategy is based on three principles: • The creation of enduring value • Motivating and rewarding an engaged ownership mindset • Aligning remuneration to shareholder value growth Redbubble’s remuneration framework is designed to attract, motivate and retain qualified and experienced leaders; to fairly remunerate executives for their contribution to Redbubble; and to reward high performance and shareholder value growth. Redbubble’s executive remuneration framework has higher at risk and equity components than Australian and global peers (discussed below). Redbubble aims to set annual remuneration (fixed plus Short Term Incentives (STI)) below the 50th percentile. Total remuneration potential is above the 50th percentile if target share price appreciation over four years is realised. Executive remuneration levels are reviewed annually by the Remuneration Committee with reference to both Redbubble’s remuneration strategy, company performance and external benchmarks. As a high-growth, online marketplace, Redbubble benchmarks itself against Australian and global peers. For Australian based roles, the primary source of remuneration benchmarking is a group of Australian listed companies in the technology sector with similar values for market capitalisation, employee headcount and revenue. For the CEO and Australian-based KMP remuneration levels for comparable roles in Silicon Valley are also taken into account. For US-based KMP, the primary source of remuneration benchmarking is a group of US-based private and public companies in consumer internet sector also with similar market capitalisation, revenue levels and headcount. 2.2 How does Redbubble’s remuneration strategy take into account shareholders’ interests?
Redbubble remuneration strategy is aligned with long-term shareholder value growth through the use of four-year option grants for Long Term Incentives (LTIs) and measurable KPIs which determine STI awards. The company-wide KPI goals for the organisation in FY 2016 were GTV and repeat GTV growth as drivers of company valuation and Redbubble’s share price. In addition, effective recruiting and staff satisfaction, measured via participation in the Great Place to Work (GPTW) survey, and organisational integration are part of the personal KPIs. The survey is conducted annually by The Great Place to Work Institute and is published in BRW magazine. 2.3 Elements of remuneration
The remuneration of the CEO and KMP are set out in section 6 (Statutory and Share-based reporting). Redbubble provides an appropriate and competitive mix of remuneration components with an emphasis on value derived from share price growth and a long-term focus. The three components of Redbubble’s remuneration framework post listing are Fixed Remuneration, STIs and LTIs.
For
per
sona
l use
onl
y

Remuneration Report (audited)
17
Fixed remuneration
The fixed component comprises base salary, allowances and superannuation (or foreign equivalent). Fixed remuneration is designed to reward for:
• The scope of the executive’s role • The executive’s skills, experience and qualifications • Individual performance
Total fixed remuneration (TFR) is set to reflect the market for a comparable role. TFR for KMP is generally targeted at or below median levels compared to similar roles at comparator companies. Short term incentives
STI awards are granted under the Company’s Short Term Incentive Plan (STI Plan). The STI benefit for a participant is subject to the achievement of company and personal KPIs. Where targets are achieved and a participant receives an STI benefit, a portion of the benefit is given in the form of cash, with the remainder given in the form of performance rights under the Company’s Employee Equity Plan with a 2 year deferral. The Redbubble Board retains discretion in approving STI cash payments and equity. Under the Company’s STI Plan, executives have the opportunity to earn an annual incentive award which is delivered in cash and Performance Rights. The terms of the STI Plan are set out below. It is anticipated that the terms of the STI awards will be reviewed and, if considered appropriate, amended on an annual basis. The aim of the STI program at Redbubble is to set, focus and align the organisation to actionable and measurable annual targets. While it is the smallest component of remuneration in terms of relative magnitude, the STI targets are key drivers of share price value, so an explicit outcome of performance against STI targets is a parallel increase in LTI value. Annual remuneration (fixed + STI)
Due to higher than typical, albeit at risk, LTI potential, annual remuneration for KMP is generally targeted below median levels compared to similar roles at comparator companies.
Who is eligible? Invitation to participate in the STI Plan is at the discretion of the CEO. Participation is limited to executives who can materially impact the financial and operational performance of the Company. A participant must have six or more months’ active employment to be eligible to receive an STI benefit in respect of a particular financial year. A participant’s STI benefit will be pro-rated where they have not been actively employed (or participating in the STI Plan) for the whole of the financial year.
For
per
sona
l use
onl
y
Remuneration Report (audited)
18
How is performance measured?
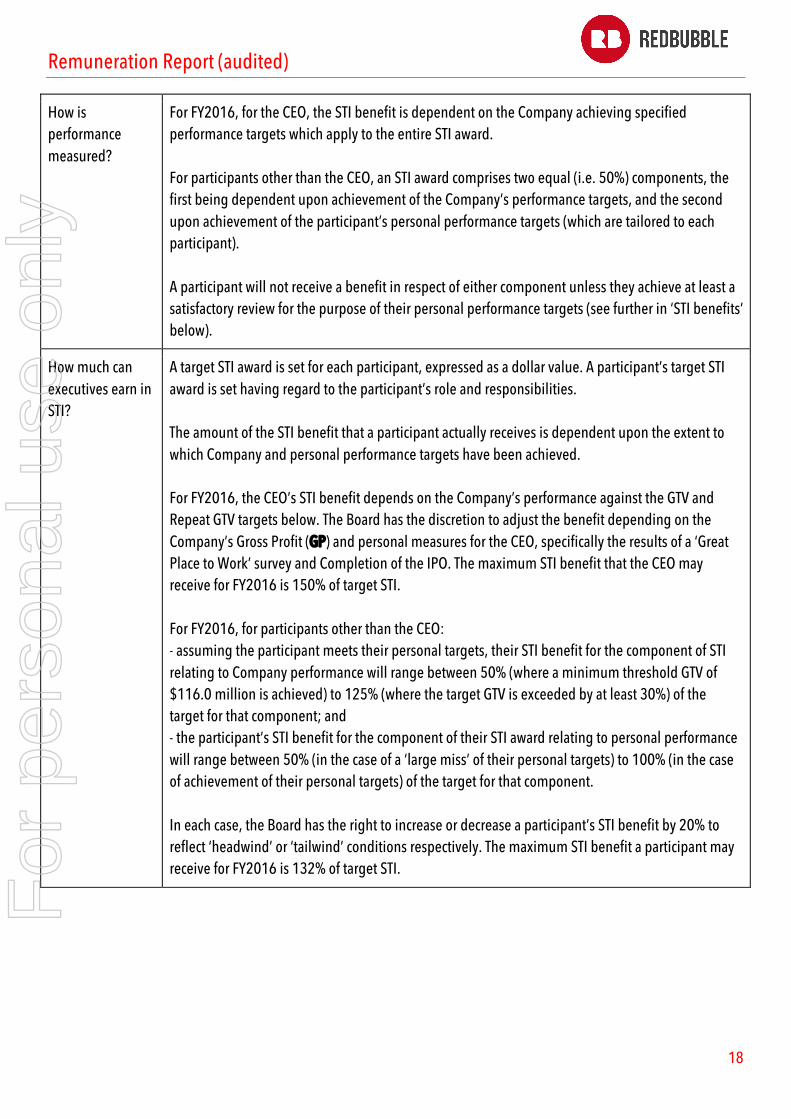
For FY2016, for the CEO, the STI benefit is dependent on the Company achieving specified performance targets which apply to the entire STI award. For participants other than the CEO, an STI award comprises two equal (i.e. 50%) components, the first being dependent upon achievement of the Company’s performance targets, and the second upon achievement of the participant’s personal performance targets (which are tailored to each participant). A participant will not receive a benefit in respect of either component unless they achieve at least a satisfactory review for the purpose of their personal performance targets (see further in ‘STI benefits’ below).
How much can executives earn in STI?
A target STI award is set for each participant, expressed as a dollar value. A participant’s target STI award is set having regard to the participant’s role and responsibilities. The amount of the STI benefit that a participant actually receives is dependent upon the extent to which Company and personal performance targets have been achieved. For FY2016, the CEO’s STI benefit depends on the Company’s performance against the GTV and Repeat GTV targets below. The Board has the discretion to adjust the benefit depending on the Company’s Gross Profit (GP) and personal measures for the CEO, specifically the results of a ‘Great Place to Work’ survey and Completion of the IPO. The maximum STI benefit that the CEO may receive for FY2016 is 150% of target STI. For FY2016, for participants other than the CEO: - assuming the participant meets their personal targets, their STI benefit for the component of STI relating to Company performance will range between 50% (where a minimum threshold GTV of $116.0 million is achieved) to 125% (where the target GTV is exceeded by at least 30%) of the target for that component; and - the participant’s STI benefit for the component of their STI award relating to personal performance will range between 50% (in the case of a ‘large miss’ of their personal targets) to 100% (in the case of achievement of their personal targets) of the target for that component. In each case, the Board has the right to increase or decrease a participant’s STI benefit by 20% to reflect ‘headwind’ or ‘tailwind’ conditions respectively. The maximum STI benefit a participant may receive for FY2016 is 132% of target STI.
F
or p
erso
nal u
se o
nly

Remuneration Report (audited)
19
How is an STI benefit provided
An STI benefit will be delivered partly in cash and partly in the form of $Nil price options and Performance Rights granted under one of the Employee Equity Plans. For FY2016, the CEO will receive 60% of any STI benefit in cash and 40% in the form of Performance Rights. Other participants who joined the Company:
• prior to the start of FY2016 will receive two thirds of their STI benefits in cash and one third in the form of Performance Rights; and
• after the start of FY2016 will receive half of their STI benefits in cash and half in the form of Performance Rights.
When is it paid? The STI award is determined after the end of the financial year following a review of performance over the year against the STI performance measures by the CEO (and in the case of the CEO, by the Board). The Board approves the final STI award based on this assessment of performance.
Deferral terms In calculating the number of Performance Rights to be granted, the dollar value of the relevant component of the STI benefit will be divided by the Volume Weighted Average Price (VWAP) over a representative 5-day period. The board retains the right to review the VWAP period for extraordinary events that are considered to have distorted the VWAP. All Performance Rights will be subject to time based vesting conditions with 50% of Performance Rights comprised in a particular award vesting one year after their date of allocation and the remaining 50% vesting two years after their date of allocation
What happens if an executive leaves?
If an executive voluntarily resigns from Redbubble, or has their employment with the Redbubble group terminated for poor performance or misconduct, prior to the relevant vesting date, no STI is awarded for that year. Similarly, any unvested deferred STI is forfeited, unless otherwise determined by the Board. The Board has the discretion to accelerate vesting of Performance Rights and may exert this discretion in certain cases (for example due to the death or disablement of a participant or a change of control of the Company).
Long term incentives
LTIs, in the form of stock options that vest over four years are the remuneration differentiator at Redbubble. All executives have received LTI awards in the form of Options or Performance Rights that vest over multiple years. Redbubble LTI plans have a 4-year vesting schedule and the realisable value of the options is 100% at risk. All Redbubble executives have received LTI awards, in the form of Options or Performance Rights that vest over multiple years. LTI grants are made to executives to align remuneration with the creation of shareholder value over the long-term.
For
per
sona
l use
onl
y

Remuneration Report (audited)
20
How is it paid? KMP receive share options or performance rights in accordance with Redbubble’s employee equity plan
How much can executives earn?
The value KMP will realise from LTI grants will depend on the appreciation of Redbubble’s share price over four years.
How much is at risk?
Redbubble’s LTIs are 4 year vesting options with the strike price set at the market value at time of issue. If Redbubble’s share price does not increase or if it declines from the exercise price at issuance, the LTI will be worthless, thus it is effectively 100% at risk relative to share price performance.
What happens if an executive leaves?
If an executive resigns or is terminated for cause, any unvested LTI awards are forfeited, unless otherwise determined by the Board. The treatment of unvested and vested and unexercised awards will be determined by the Board with reference to the circumstances of cessation.
2.4 Changes in FY2016
The Board introduced deferred component of STI in FY2016 to better align the STI plan to shareholder value. 3. Performance and executive remuneration outcomes in FY2016
A key underlying principle of the Group’s executive remuneration framework is that the remuneration levels should be linked to Group performance. The Group’s key financial measures of performance over the last 5 years are summarised in the table below.
GTV less sales taxes and artists’ margin, adjusted for unearned revenue pending shipment, equals Group's revenue. Revenue has consistently been approximately 80% of GTV. The growth in the Group’s revenue and GTV not its earnings has been the significant driver in the share price appreciation. The Company listed on the ASX on 16 May 2015 so limited trading history exists, however, the Company’s offer price of $1.33 at Listing represents a CAGR of 65% in its valuation from $0.11 5 years ago. F
or p
erso
nal u
se o
nly

Remuneration Report (audited)
21
3.1 Performance against STI measures
A combination of financial and non-financial measures are used to measure performance for STI awards. Redbubble performance against those measures is as follows for FY2016:
In assessing holistically the performance of KMP in FY2016, the Board has used its discretion to award 100% of target STI. In making this decision the Board considered: higher than forecasted earnings before interest, tax, depreciation and amortisation (EBITDA) and GP, and significantly higher than targeted GPTW survey improvements. The STI award as a percent of maximum potential STI was 67% for the CEO and 76% for other KMP. 4. How remuneration is governed
4.1 Remuneration Committee role
The Committee is responsible for reviewing and advising the Board on remuneration policies and practices. The Committee also reviews and advises the Board on the design and implementation of short and long term incentive performance packages, superannuation entitlements, termination entitlements and fringe benefits policies. The remuneration of Directors, the CEO, KMP, managers and team members is reviewed by the Remuneration Committee which then provides recommendations to the Board. The members of the Committee during FY2016 were: Teresa Engelhard (Committee Chair), Stephanie Tilenius, Grant Murdoch (appointed 1 January 2016) and Chris Nunn (ceased 28 October 2015 upon appointment as CFO). 4.2 Use of remuneration advisors
The Committee obtains independent advice from remuneration consultants, Hewitt Associates Pty Ltd on the appropriateness of remuneration based trends in the US and Australia. Both Hewitt Associates Pty Ltd and the Committee are satisfied the advice is free from undue influence from the KMP to whom the remuneration recommendations apply. The Remuneration Committee engaged remuneration advisors to provide remuneration recommendations leading up to Redbubble’s IPO. The remuneration advisors provided market remuneration data and recommendations on the remuneration mix and quantum for senior executives.
For
per
sona
l use
onl
y

Remuneration Report (audited)
22
The remuneration advisor’s recommendations were provided to Redbubble as an input into decision-making only. The Remuneration Committee considered the recommendations, along with other factors, in making its remuneration decisions. Hewitt Associates Pty Ltd was paid a fees of $40,000 for the remuneration recommendations. 4.3 Clawback of remuneration
In the event of serious misconduct or a material misstatement of the Group’s financial statements, the Board has the discretion to reduce, cancel or clawback any unvested STI or LTI. 4.4 Executive employment agreements
CEO and Managing Director
The Company has entered into an employment agreement contract dated 10 August 2006 with Martin Hosking, the Company’s CEO and Managing Director, to govern his employment with Redbubble. The table below summarises the remuneration arrangements of the CEO.
Martin’s contract provides that he will receive an amount of fixed annual remuneration, which amount is subject to review by the Company. His fixed annual remuneration is currently $395,120 per annum (inclusive of 9.5% employer superannuation contribution).
For
per
sona
l use
onl
y
Remuneration Report (audited)
23
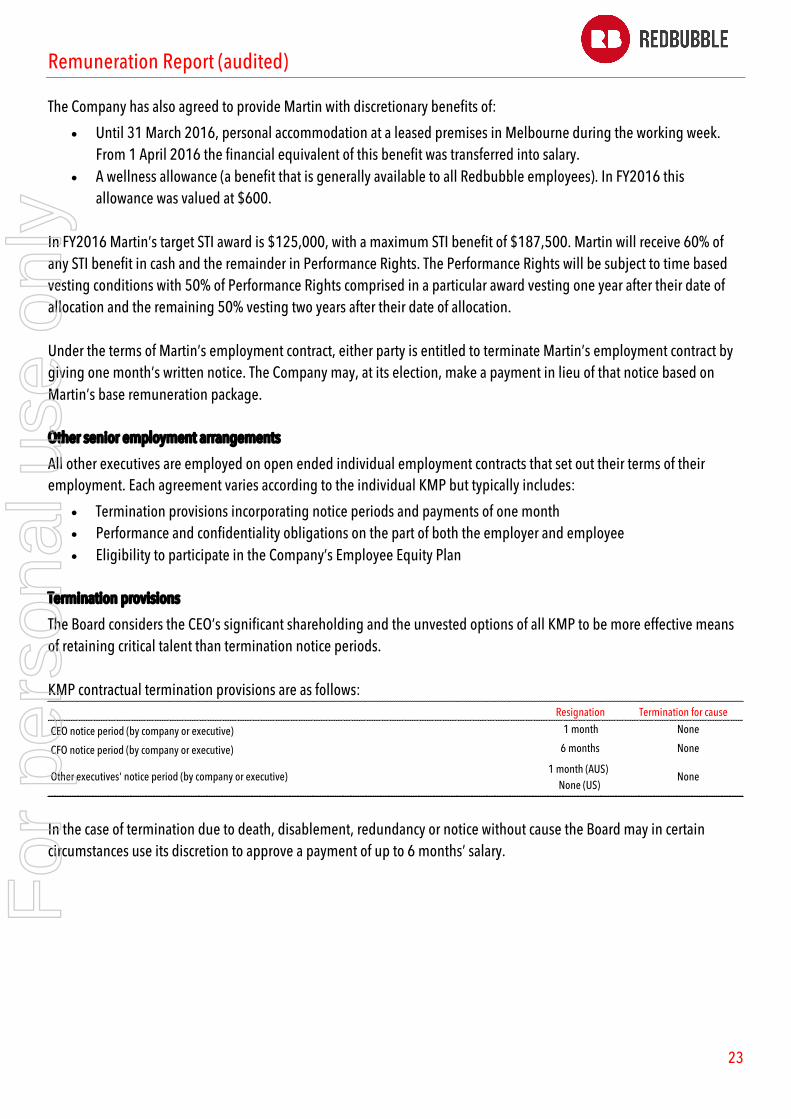
The Company has also agreed to provide Martin with discretionary benefits of:
• Until 31 March 2016, personal accommodation at a leased premises in Melbourne during the working week. From 1 April 2016 the financial equivalent of this benefit was transferred into salary.
• A wellness allowance (a benefit that is generally available to all Redbubble employees). In FY2016 this allowance was valued at $600.
In FY2016 Martin’s target STI award is $125,000, with a maximum STI benefit of $187,500. Martin will receive 60% of any STI benefit in cash and the remainder in Performance Rights. The Performance Rights will be subject to time based vesting conditions with 50% of Performance Rights comprised in a particular award vesting one year after their date of allocation and the remaining 50% vesting two years after their date of allocation. Under the terms of Martin’s employment contract, either party is entitled to terminate Martin’s employment contract by giving one month’s written notice. The Company may, at its election, make a payment in lieu of that notice based on Martin’s base remuneration package. Other senior employment arrangements
All other executives are employed on open ended individual employment contracts that set out their terms of their employment. Each agreement varies according to the individual KMP but typically includes:
• Termination provisions incorporating notice periods and payments of one month • Performance and confidentiality obligations on the part of both the employer and employee • Eligibility to participate in the Company’s Employee Equity Plan
Termination provisions
The Board considers the CEO’s significant shareholding and the unvested options of all KMP to be more effective means of retaining critical talent than termination notice periods. KMP contractual termination provisions are as follows:
In the case of termination due to death, disablement, redundancy or notice without cause the Board may in certain circumstances use its discretion to approve a payment of up to 6 months’ salary.
Resignation Termination for cause
CEO notice period (by company or executive) 1 month None
CFO notice period (by company or executive) 6 months None
Other executives' notice period (by company or executive)1 month (AUS)
None (US)None
For
per
sona
l use
onl
y
Remuneration Report (audited)
24
5. Overview of non-executive Director (NED) remuneration
Redbubble’s NED policy is designed to attract and retain high calibre directors who can discharge the roles and responsibilities required in terms of good governance, strong oversight, independence and strong alignment of interests with long-term shareholder value creation. NED remuneration reflect the demands and responsibilities of the directors. The Remuneration Committee reviews NED remuneration against comparable companies. The Board also considers advice from external advisors when undertaking the review process. NED remuneration reflects the directors’ board and committee activities. Directors are also to be reimbursed for all reasonable travelling and other expenses properly incurred by them in attending Board meetings or any meetings of committees of Directors, in attending any general meetings of the Company or otherwise in connection with the business or affairs of the Company. Directors may be paid such additional or special remuneration if they, with the approval of the Board, perform any extra services or make special exertions for the benefit of the Company. There are no retirement benefit schemes for Directors, other than statutory superannuation contributions. Maximum aggregate NED fee pool
The total amount paid to all Directors for their services must not exceed in aggregate in any financial year the amount fixed by shareholders in a general meeting. Upon establishment this amount has been fixed by the Board in accordance with the Constitution at $1,200,000. Any changes to this amount in future will require approval by shareholders in a general meeting in accordance with the ASX Listing Rules.
For
per
sona
l use
onl
y

Remuneration Report (audited)
25
6. Statutory and share-based reporting
6.1 Executive KMP remuneration for the year ended 30 June 2016
For
per
sona
l use
onl
y

Remuneration Report (audited)
26
6.2 NED remuneration for the year ended 30 June 2016
For
per
sona
l use
onl
y
Remuneration Report (audited)
27
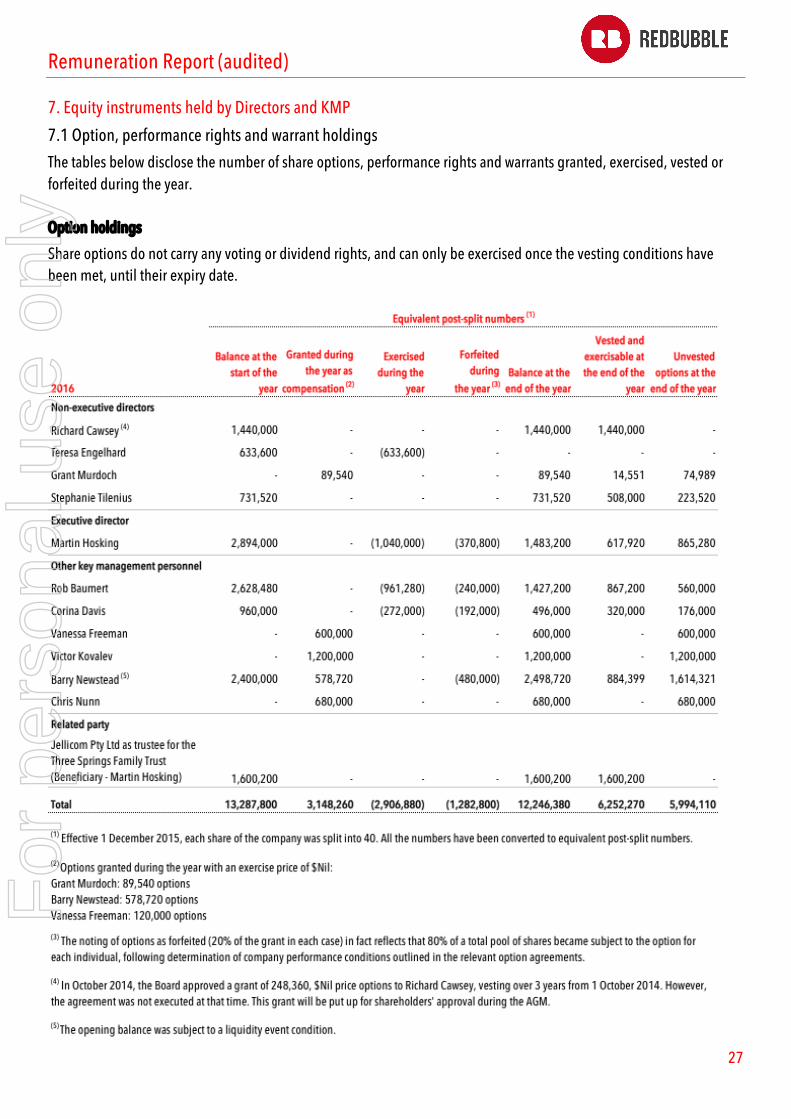
7. Equity instruments held by Directors and KMP
7.1 Option, performance rights and warrant holdings
The tables below disclose the number of share options, performance rights and warrants granted, exercised, vested or forfeited during the year.
Option holdings
Share options do not carry any voting or dividend rights, and can only be exercised once the vesting conditions have been met, until their expiry date.
For
per
sona
l use
onl
y

Remuneration Report (audited)
28
Performance rights holdings
Performance rights do not carry any voting or dividend rights. The liquidity event condition for the performance rights is satisfied on 16 November 2016, 6 months after the date of the IPO, whereupon a proportion of the rights will fully vest by reference to time-based vesting schedules.
For
per
sona
l use
onl
y
Remuneration Report (audited)
29
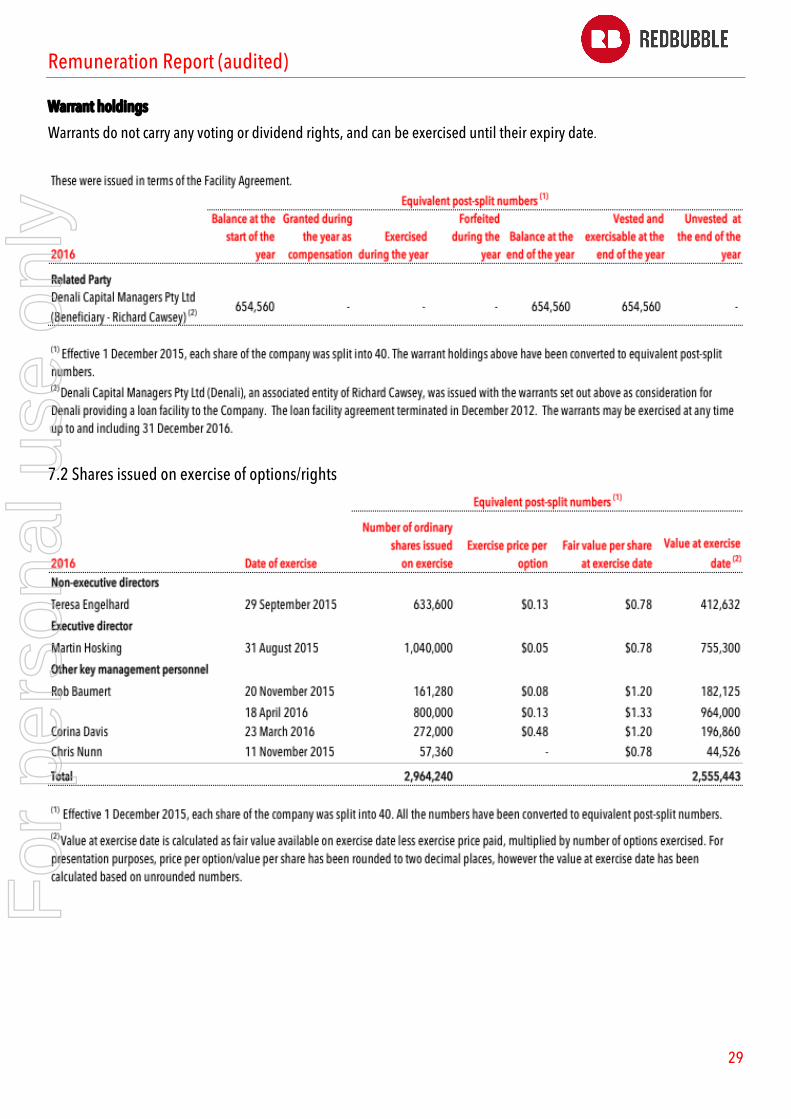
Warrant holdings
Warrants do not carry any voting or dividend rights, and can be exercised until their expiry date.
7.2 Shares issued on exercise of options/rights
F
or p
erso
nal u
se o
nly
Remuneration Report (audited)
30
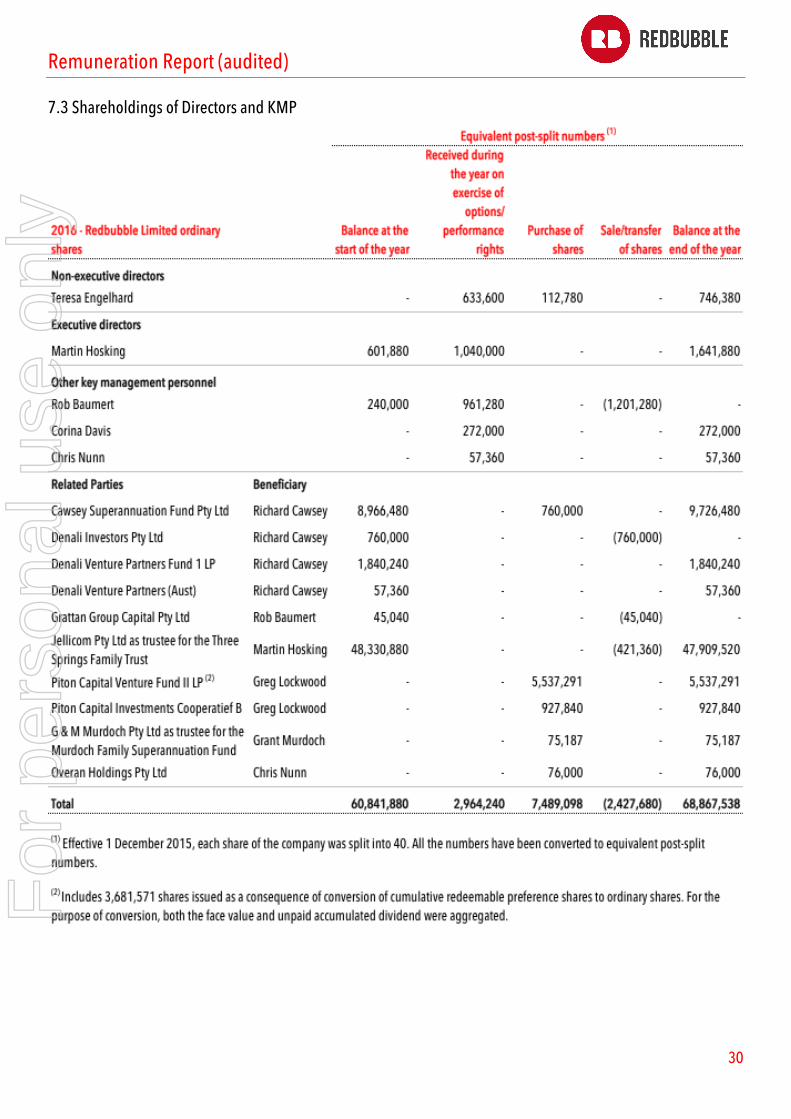
7.3 Shareholdings of Directors and KMP
For
per
sona
l use
onl
y

Remuneration Report (audited)
31
8. Equity grants outstanding
F
or p
erso
nal u
se o
nly

Remuneration Report (audited)
32
For
per
sona
l use
onl
y

Remuneration Report (audited)
33
For
per
sona
l use
onl
y

Remuneration Report (audited)
34
9. Loans, transactions and other balances with KMP and their related parties
9.1 Other transactions with KMP
Richard Cawsey, the Chair of the Board, is a partner of Denali Venture Partners. Denali Venture Partners has provided various consulting services to the Group for which fees of $50,000 were paid. The consulting fees are based on the time and service provided and the rates are equivalent to other similarly sized entities. As at 30 June 2016, there was no balance outstanding towards the consulting fees. Chris Nunn (CFO), is a director of Elite Executive Services Pty Ltd, which provided executive relocation services to the employees of Redbubble during the year for which the fees totaled $12,710. The fees are based on the time and service provided and the rates are equivalent to other similarly sized entities. At the year end, the balance outstanding was $1,865. Rob Baumert (CF&AO), exercised a part of his options and sold the related shares during the year ended 30 June 2016, resulting in a receivable balance of $79,000 in relation to exercise and withholding taxes on the sale. As at year end, the balance stands recovered. The Directors’ Report is made in accordance with a resolution of the Directors of the Company.
Richard Cawsey Chairman Melbourne 25 August 2016
For
per
sona
l use
onl
y

Consolidated financial statements
35
Consolidated statement of comprehensive income for the year ended 30 June 2016
For
per
sona
l use
onl
y

Consolidated financial statements
36
Consolidated balance sheet as at 30 June 2016
For
per
sona
l use
onl
y
Consolidated financial statements
37
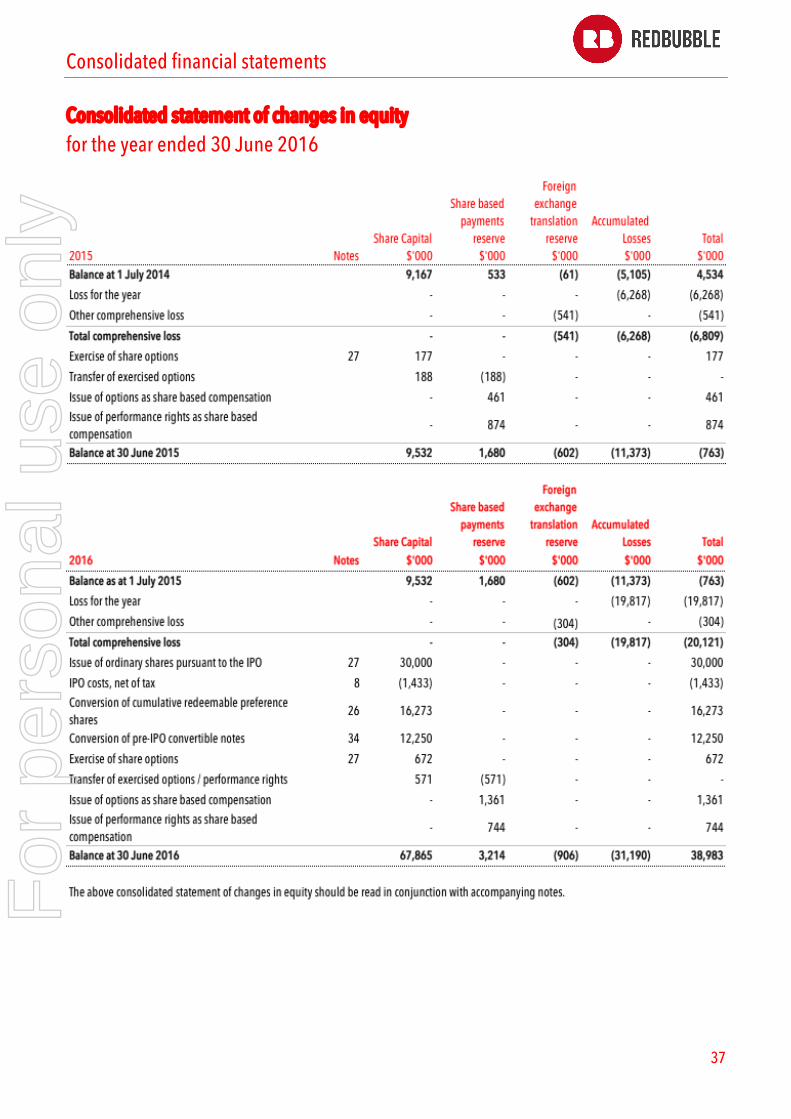
Consolidated statement of changes in equity for the year ended 30 June 2016
F
or p
erso
nal u
se o
nly

Consolidated financial statements
38
Consolidated statement of cash flows for the year ended 30 June 2016
For
per
sona
l use
onl
y
Notes to the consolidated financial statements for the year ended 30 June 2016
39
1. Corporate information
The consolidated financial statements of Redbubble Limited for the year ended 30 June 2016 were authorised for issue by a resolution of the Directors on 25 August 2016. The financial report covers Redbubble Limited and its controlled entities as the consolidated group (the Group). Redbubble Limited is the ultimate parent company, the parent entity, of the Group. Redbubble Limited (the Company) is a for profit company limited by shares, incorporated and domiciled in Australia, whose shares are publicly traded on the Australian Stock Exchange. The Company completed an Initial Public Offering (IPO) on 16 May 2016 totalling $39.83 million, which included $30.0 million from a primary issue (note 27). The Group is a global online marketplace for independent artists.
2. Summary of significant accounting policies
The principal accounting policies adopted in the preparation of these consolidated financial statements are set out below. These policies have been consistently applied to all the years presented, unless otherwise stated. (a) Basis of preparation
These general purpose financial statements have been prepared in accordance with Australian Accounting Standards and interpretations issued by the Australian Accounting Standards Board and the Corporations Act 2001. The financial report is presented in Australian dollars and all the values are rounded to the nearest thousand dollars ($000) unless otherwise stated as disclosed in note 2(w). (i) Compliance with IFRS The consolidated financial statements comply with International Financial Reporting Standards (IFRS) as issued by the International Accounting Standards Board (IASB). (ii) Historical cost convention These financial statements have been prepared under the historical cost convention. (iii) Critical accounting estimates The preparation of financial statements requires the use of certain critical accounting estimates. It also requires management to exercise its judgment in the process of applying the Group’s accounting policies. The areas involving a higher degree of judgment or complexity, or the areas where assumptions and estimates are significant to the financial statements are disclosed in note 3.
For
per
sona
l use
onl
y

Notes to the consolidated financial statements for the year ended 30 June 2016
40
(b) Principles of consolidation �
Subsidiaries are all entities over which the Group has control. Control is established when the Group is exposed to, or has rights to variable returns from its involvement with the entity and has the ability to affect those returns through its power to direct the relevant activities of the entity. Subsidiaries are fully consolidated from the date on which the Group gains control. They would be deconsolidated from the date that control ceases. A list of the subsidiaries is provided in note 29 to the financial statements. Intercompany transactions, balances and unrealised gains or losses on transactions between Group entities are fully eliminated on consolidation. Accounting policies of subsidiaries have been changed where necessary to ensure consistency with the policies adopted by the Group.
(c) Foreign currency transaction
(i) Functional and presentation currency
The functional currency of each of the Group's entities is the currency of the primary economic environment in which that entity operates. The consolidated financial statements are presented in Australian dollars which is the parent entity's functional and presentation currency. (ii) Transaction and balances
Transactions in foreign currencies are initially recorded by the Group’s entities at their respective functional currency spot rates at the date the transaction first qualifies for recognition. At the end of the reporting period: • Foreign currency monetary items are translated using the closing exchange rate;
• Non-monetary items that are measured at historical cost are translated using the exchange rate at the date of the transaction; and �
• Non-monetary items that are measured at fair value are translated using the exchange rate at the date when fair value was determined. �
Exchange differences arising on the settlement of monetary items or on translating monetary items at exchange rates different from those at which they were translated on initial recognition or in prior reporting periods are recognised through profit or loss, except where they relate to an item of other comprehensive income.
For
per
sona
l use
onl
y
Notes to the consolidated financial statements for the year ended 30 June 2016
41
(iii) Group companies
The results and financial position of all the Group entities that have a functional currency different from the presentation currency are translated into the presentation currency (none of which has the currency of a hyperinflationary economy) as follows:
• Assets and liabilities for each balance sheet are translated at the closing exchange rate at the date of that balance sheet;
• Income and expenses for each income statement and statement of comprehensive income are translated at average exchange rates; and
• All resulting exchange differences are recognised in other comprehensive income.
(d) Revenue recognition
(i) Revenue from rendering of services
The Group provides an internet based marketplace platform and associated logistics services to facilitate the sale of goods from artists to those who want to purchase goods bearing the artists’ designs. Artists display and sell art via the Group’s website. The Group aggregates demand from the buyers to support preferential relationships between third party suppliers, fulfillers and drop shippers and the artists, using the Group’s platform.
Revenue from services provided in connection with facilitating the sale of goods is recognised when the amount can be measured reliably at the value of the consideration received or receivable. The Group is acting as the artists’ agent in arranging for the selling of the artist’s goods to customers. The amounts collected on behalf of artists are not recognised in the income statement. The revenue recognised by the Group is effectively the cost of fulfilment and shipment plus the Group’s margin. Amounts disclosed as revenue are net of trade discounts, returns, rebates, taxes and fraud. (ii) Interest income
Interest income is recognised on a time proportion basis using the effective interest method (EIR). The EIR is the rate that exactly discounts the estimated future cash receipts over the expected life of the financial instrument or a shorter period, where appropriate, to the net carrying amount of the financial asset. (e) Government grants
Grants from government are recognised at the fair value when there is reasonable assurance that the grant will be received and the Group has complied with the required conditions. Grants relating to expense items are recognised as income over the periods necessary to match the grant to costs they are compensating.
For
per
sona
l use
onl
y
Notes to the consolidated financial statements for the year ended 30 June 2016
42
(f) Income tax
The tax expense recognised in the statement of comprehensive income relates to current income tax expense plus deferred tax expense (being the movement in deferred tax assets and liabilities and unused tax losses during the year). Current tax is the amount of income taxes payable (recoverable) in respect of the taxable profit (tax loss) for the year and is measured at the amount expected to be paid to (recovered from) the taxation authorities, using the tax rates (and tax laws) that have been enacted or substantively enacted by the end of the reporting period. Deferred tax is provided on temporary differences which are determined by comparing the carrying amounts of tax bases of assets and liabilities to the carrying amounts in the consolidated financial statements. Deferred tax assets and liabilities are measured at the tax rates that are expected to apply to the period when the asset is realised or the liability is settled, based on tax rates (and tax laws) that have been enacted or substantively enacted by the end of the reporting period. Deferred tax assets are recognised for all deductible temporary differences and unused tax losses to the extent: • it is probable that future taxable profits will be available against which the deductible temporary differences
and losses can be utilised
• the likelihood of continuing to meet the relevant definitions of “same business” are met
• there are no changes in tax legislation that adversely affect the ability to realise the deferred tax asset benefits.
Current tax assets and liabilities are offset where there is a legally enforceable right to set off the recognised amounts and there is an intention either to settle on a net basis or to realise the asset and settle the liability simultaneously. � Deferred tax assets and liabilities are offset where there is or would be a legal right to set off current tax assets against current tax liabilities and the deferred tax assets and the deferred tax liabilities relate to income taxes levied by the same taxation authority on either the same taxable entity or different taxable entities which intend either to settle current tax liabilities and assets on a net basis, or to realise the assets and settle the liabilities simultaneously in each future period in which significant amounts of deferred tax liabilities or assets are expected to be settled or recovered. Current and deferred tax is recognised as income or an expense and included in profit or loss for the period except where the tax arises from a transaction which is recognised in other comprehensive income or equity, in which case the tax is recognised in other comprehensive income or equity respectively. �
For
per
sona
l use
onl
y

Notes to the consolidated financial statements for the year ended 30 June 2016
43
(g) Property, plant and equipment Plant and equipment is measured on a cost basis and is therefore carried at cost less accumulated depreciation and any accumulated impairment losses. Depreciation
The depreciable amount of all fixed assets is depreciated on a straight-line basis over the asset’s useful life to the Group commencing from the time the asset is held ready for use. Leasehold improvements are depreciated over the shorter of either the unexpired period of the lease or the estimated useful lives of the improvements. The depreciation rates used for each class of depreciable asset are shown below� Class of Fixed Assets Useful life Leasehold improvements Life of lease Computer equipment 3 years Furniture and equipment 2-5 years At the end of each annual reporting period, the depreciation method, useful life and residual value of each asset is reviewed. Any revisions are accounted for prospectively as a change in estimate. (h) Intangible assets other than goodwill
Capitalised development costs
Expenditure during the research phase of a project is recognised as an expense when incurred. Development costs are capitalised only when technical feasibility studies identify that the project is expected to deliver future economic benefits and these benefits can be measured reliably. Capitalised development costs have a finite useful life and are amortised on a straight-line basis based on the future economic benefits over the useful life of the project, typically between 2 to 3 years. �
(i) Impairment of non-financial assets
At the end of each reporting period, the Group assesses whether there is any indication that an asset may be impaired. If such an indication exists, an impairment test is carried out on the asset by comparing the recoverable amount of the asset, being the higher of the asset’s fair value less costs to dispose, and value in use, to the asset's carrying amount.
Any excess of the asset’s carrying amount over its recoverable amount is recognised immediately in profit or loss, unless the asset is carried at a revalued amount in accordance with another Standard (e.g. in accordance with the revaluation model in AASB 116: Property, Plant and Equipment). Any impairment loss of a revalued asset is treated as a revaluation decrease in accordance with that other Standard.
For
per
sona
l use
onl
y

Notes to the consolidated financial statements for the year ended 30 June 2016
44
Where it is not possible to estimate the recoverable amount of an individual asset, the Group estimates the recoverable amount of the cash-generating unit to which the asset belongs. (j) Inventories
Inventories of packaging materials are measured at the lower of cost and net realisable value. Cost of inventory is determined using the first-in-first-out basis and are net of any rebates and discounts received. Net realisable value is the estimated selling price in the ordinary course of business, less the estimated costs of completion and the costs necessary to make the sale. Net realisable value is estimated using the most reliable evidence available at the reporting date and inventory is written down through an obsolescence provision if necessary. � (k) Financial assets
Loans, trade and other receivables and other financial assets do not include derivative financial assets without fixed or determinable payments that are quoted in an active market. After initial recognition, loans and trade and other receivables are measured at amortised cost using the effective interest method. Any change in their value is recognised in profit or loss. Collectability of financial assets is reviewed on an ongoing basis. Financial assets which are known to be uncollectible are written off by reducing the carrying amount directly. (l) Cash and cash equivalents
Cash and cash equivalents comprises cash on hand and short term deposits which are readily convertible to known amounts of cash and which are subject to an insignificant risk of change in value. (m) Trade and other payables
Trade and other payables represent the liabilities for goods and services received by the Group that remain unpaid at the end of the reporting period. The balance is recognised as a current liability with the amounts normally paid within 30 days of recognition of the liability. � (n) Employee benefits
(i) Wages, salaries, annual and long service leave Provision is made for the Group's liability for employee benefits arising from services rendered by employees to the end of the reporting period. Employee benefits that are expected to be settled within one year have been measured at the amounts expected to be paid when the liability is settled.
For
per
sona
l use
onl
y

Notes to the consolidated financial statements for the year ended 30 June 2016
45
Employee benefits expected to be settled more than twelve months after the end of the reporting period have been measured at the present value of the estimated future cash outflows to be made for those benefits. In determining the liability, consideration is given to employee wage increases and the probability that the employee may satisfy vesting requirements. Cash flows are discounted using market yields on corporate bonds with terms to maturity that match the expected timing of cash flows. Changes in the measurement of the liability are recognised in profit or loss. Employee benefits are presented as current liabilities in the balance sheet if the Group does not have an unconditional right to defer settlement of the liability for at least 12 months after the reporting date regardless of the classification of the liability for measurement purposes under AASB 119. (ii) Defined contribution schemes
Obligations for contributions to defined contribution superannuation plans are recognised as an employee benefit expense in profit or loss in the periods in which services are provided by employees.
(iii) Termination benefits
Termination benefits are those benefits paid to an employee as a result of either the Group’s decision to terminate an employee’s employment before the normal retirement date or an employee’s decision to accept an offer of benefits in exchange for the termination of employment. Termination benefits are recorded as a provision when the Group can no longer withdraw the offer of those benefits. (o) Leases
Lease payments for operating leases, where substantially all of the risks and benefits remain with the lessor, are charged as expenses on a straight-line basis over the life of the lease term. (p) Goods and Services Tax (GST), Value Added Tax (VAT) and Sales Tax
Revenue, expenses and assets are recognised net of the amount of goods and services tax (GST), value added tax (VAT) and sales tax, except where the amount of GST, VAT and sales tax incurred is not recoverable from the Australian Taxation Office (ATO) or other similar International bodies. Receivables and payable are stated inclusive of GST, VAT and sales tax, where applicable. The net amount of GST, VAT and sales tax recoverable from, or payable to, the ATO or other similar International bodies, is included as part of receivables or payables in the statement of financial position.
For
per
sona
l use
onl
y

Notes to the consolidated financial statements for the year ended 30 June 2016
46
The statement of cash flows includes cash on a gross basis and the GST, VAT and sales tax component of cash flows arising from investing and financing activities which is recoverable from, or payable to, the taxation authority is classified as operating cash flows. USA operations are subject to sales tax and UK operations are subject to VAT. � (q) Equity-settled compensation
The Group operates equity-settled share-based payment employee share and option schemes. The fair value of the equity to which employees become entitled is measured at grant date and recognised as an expense over the vesting period, with a corresponding increase to an equity account. The fair value of options is ascertained using a Black-Scholes pricing model which incorporates all market vesting conditions. The amount to be expensed is determined by reference to the fair value of the options or shares granted, this expense takes into account any market performance conditions and the impact of any non-vesting conditions but ignores the effect of any service and non-market performance vesting conditions. Non-market vesting conditions are taken into account when considering the number of options expected to vest and at the end of each reporting period, the Group revisits its estimate. Revisions to the prior period estimate are recognised in profit or loss and equity. � The fair value of performance rights is determined in accordance with the fair market value of the shares available at the grant date. Up to the date of Listing, the fair value of shares was ascertained by carrying out an independent valuation.
(r) Borrowings
Borrowings are initially recognised at fair value, net of transaction costs incurred. Borrowings are subsequently measured at amortised cost. Any difference between the proceeds (net of transaction costs) and the redemption amount is recognised in the profit or loss over the period of borrowings using the effective interest method. Fees paid on the establishment of loan facilities, which are not an incremental cost relating to the actual draw-down of the facility, are recognised as transaction costs of the loan to the extent that it is probable that some or all the facility will be drawn down. In this case, the fee is deferred until the draw down occurs. To the extent there is no evidence that it is probable that some or all of the facility will be drawn down, the fee is amortised on a straight-line basis over the term of the facility. Borrowings are classified as current liabilities unless the Group has an unconditional right to defer settlement of the liability for at least 12 months after the reporting period. F
or p
erso
nal u
se o
nly

Notes to the consolidated financial statements for the year ended 30 June 2016
47
(s) Earnings per share
(i) Basic earnings per share
Basic earnings per share is calculated by dividing:
• the profit attributable to owners of the Company, excluding any cost of servicing equity other than ordinary shares;
• by the weighted average number of ordinary shares outstanding during the financial year.
(ii) Diluted earnings per share
Diluted earnings per share adjusts the figures used in the determination of basic earnings per share to take into account:
• the after income tax effect of interest and other financing costs associated with the dilutive potential ordinary shares;
• the weighted average number of shares assumed to have been issued for no consideration in relation to the dilutive potential ordinary shares.
(t) Parent entity financial information
The financial information for the parent entity, Redbubble Limited, disclosed in note 30 has been prepared on the same basis as the consolidated financial statements except investments in subsidiaries. They are accounted for at cost in the financial statements of the parent entity. (u) Segment reporting Operating segments are reported in a manner consistent with internal reporting provided to the chief operating decision makers, who provide the strategic direction and management oversight of the Group in terms of monitoring results and approving strategic planning for the business. Given that the internal reporting provided is not disaggregated in a way that identifies any unique reportable segments, the Group has identified being a global online marketplace as its only operating segment.
(v) Comparative amounts
Comparatives are consistent with prior years, unless otherwise stated. Where a change in comparatives would also affect the opening retained earnings previously presented in a comparative period, an opening statement of financial position at the earliest date of the comparative period would be presented. (w) Rounding of amounts
The Company is of the kind referred to in class order 2016/191, issued by the Australian Securities and Investments Commission, relating to the “rounding off” of amounts in the financial statements. Amounts in the financial statements have been rounded off in accordance with the class order to the nearest thousand dollars or in certain other cases, nearest dollars, unless otherwise stated.
For
per
sona
l use
onl
y

Notes to the consolidated financial statements for the year ended 30 June 2016
48
3. Critical accounting estimates and judgements
Estimates and judgments are continually evaluated and are based on historical experience and other factors, including expectations of future events that may have a financial impact on the entity and that are believed to be reasonable under circumstances. The Group makes estimates and assumptions concerning the future which may not equal the related actual results. These are discussed below.
(i) Revenue recognition principal versus agent
The Group is acting as the artists’ agent in arranging for the selling of the artist’s goods to customers for accounting purposes only. The amounts collected on behalf of artists are not recognised in the income statement. The revenue recognised by the Group is effectively the cost of fulfilment and shipping plus Group’s margin. Given the nature of the relationship between the Group and product fulfillers and the associated risks and rewards, the Group has determined, for accounting purposes only, that it is acting as a principal with respect to fulfillers as opposed to as an agent.
(ii) Development costs – capitalisation, valuation and impairment
Expenditure during the research phase of a project is recognised as an expense when incurred. Development costs are capitalised only when technical feasibility studies identify that the project is expected to deliver future economic benefits and these benefits can be measured reliably. Determining the feasibility of the project and the likelihood of the project delivering future economic benefits, which can be measured reliably, is a significant management estimate and judgement. Capitalised development costs have a finite useful life and are amortised on a systematic basis based on the future economic benefits over the useful life of the project, typically between 2 to 3 years and are considered for impairment at each reporting date. Refer to note 23 for more details.
(iii) Recognition of deferred tax assets
Deferred income taxes arise from temporary differences between the tax and financial statement recognition of revenue and expense, the incurrence of tax losses and entitlement to non-refundable tax offsets. In evaluating the Group’s ability to recover deferred tax assets within the jurisdiction from which they arise, the Group considers all available positive and negative evidence, including probability of achieving appropriate continuity of ownership levels, likelihood of meeting relevant definitions of “same business”, scheduled reversals of deferred tax liabilities, projected future taxable income and results of recent operations. This evaluation requires significant management judgment. Refer to note 13 for more details.
For
per
sona
l use
onl
y

Notes to the consolidated financial statements for the year ended 30 June 2016
49
(iv) Share-based payments
Equity-settled share-based payments with employees are measured at the fair value of the equity instrument at the grant date. Fair value of options is measured by using a Black-Scholes model and fair value of performance rights is measured by using the fair value of shares available at the grant date. Up to the date of Listing, the fair value of shares was determined by carrying out an independent valuation. Refer to notes 5 and 35 for more details.
(v) USA sales tax
The Group currently collects and remits sales tax on sales made via the Redbubble website to customers in the US state of California. Management believes a sales tax nexus may exist due to its own offices being situated in that state. Significant management judgement is required to determine if nexus exists in other states. Management has determined that no taxes are payable in relation to sales in other states.
For
per
sona
l use
onl
y

Notes to the consolidated financial statements for the year ended 30 June 2016
50
4. Fulfiller expenses
5. Employee and contractor costs
6. Marketing expenses
7. Operations and administration
2016 2015$'000 $'000
Fulfiller expenses (1) 75,575 46,998
Total fulfiller expenses 75,575 46,998
(1) Fulfiller expenses comprise of product and printing, shipping and transaction costs and are equivalent to cost of goods sold.
2016 2015$'000 $'000
Salary costs 16,819 10,745
Contractor costs 4,575 1,958
Share-based payments and other long-term incentives 2,105 1,340
Superannuation costs and other pension related costs (1) 1,197 705
Total employee and contractor costs 24,696 14,748
(1) Includes contribution to 401K funds, which is the superannuation equivalent for the USA subsidiary.
2016 2015$'000 $'000
Paid marketing 7,661 4,260
Other marketing expenses 2,125 2,269
Total marketing expenses 9,786 6,529
2016 2015$'000 $'000
Technology infrastructure and software costs 4,352 2,071
IPO costs (note 8) 2,011 -
Travel expenses 1,480 998
Rental expense on operating leases 1,208 991
Recruiting expenses 1,009 1,098
Other operations and administration expenses 4,701 3,618
Total operations and administration 14,761 8,776 For
per
sona
l use
onl
y
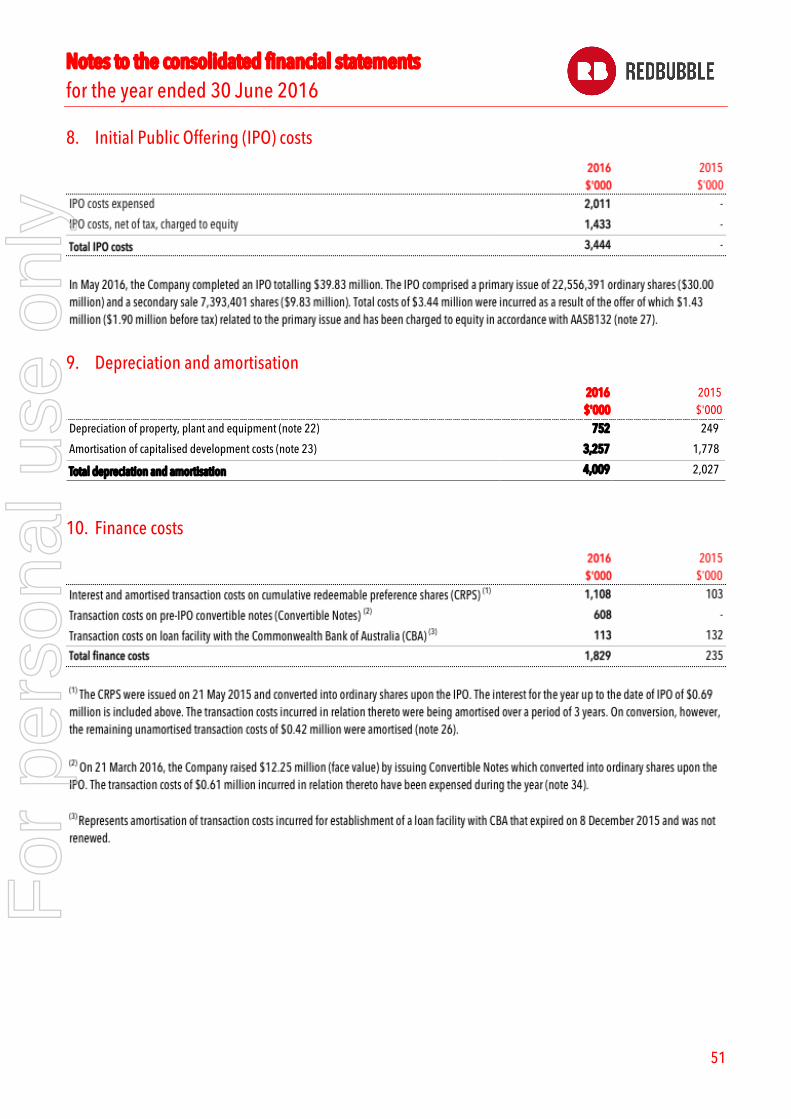
Notes to the consolidated financial statements for the year ended 30 June 2016
51
8. Initial Public Offering (IPO) costs
9. Depreciation and amortisation
10. Finance costs
2016 2015$'000 $'000
Depreciation of property, plant and equipment (note 22) 752 249
Amortisation of capitalised development costs (note 23) 3,257 1,778
Total depreciation and amortisation 4,009 2,027
For
per
sona
l use
onl
y
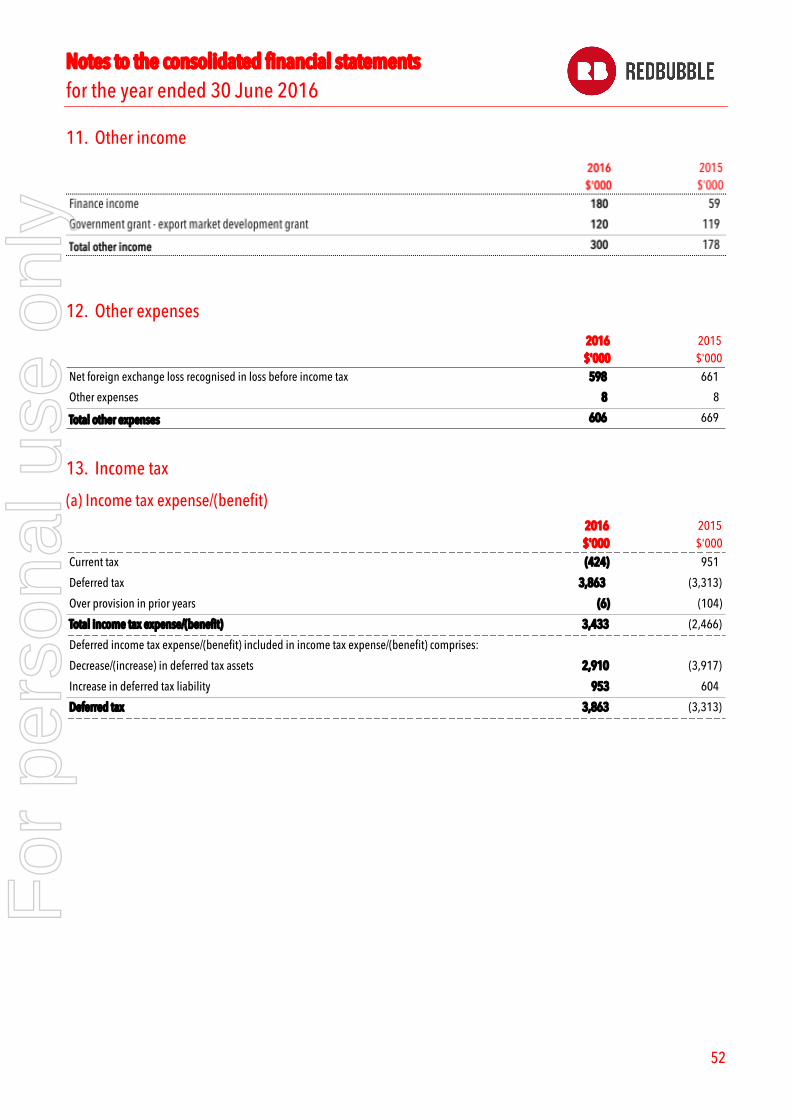
Notes to the consolidated financial statements for the year ended 30 June 2016
52
11. Other income
12. Other expenses
13. Income tax
(a) Income tax expense/(benefit)
2016 2015$'000 $'000
598 661
8 8
Total other expenses 606 669
Net foreign exchange loss recognised in loss before income tax
Other expenses
2016$'000
2015$'000
Current tax (424) 951
Deferred tax 3,863 (3,313)
Over provision in prior years (6) (104)
Total income tax expense/(benefit) 3,433 (2,466)
Deferred income tax expense/(benefit) included in income tax expense/(benefit) comprises:
Decrease/(increase) in deferred tax assets 2,910 (3,917)
Increase in deferred tax liability 953 604
Deferred tax 3,863 (3,313)
For
per
sona
l use
onl
y

Notes to the consolidated financial statements for the year ended 30 June 2016
53
13. Income tax (continued) (b) Numerical reconciliation of income tax expense/(benefit) to prima facie tax payable
2016$'000
2015$'000
Loss from ordinary activities before income tax expense/(benefit) (16,384) (8,734)
Income tax calculated @ 30% (4,915) (2,620)
Tax effect of amounts that are not deductible/(taxable) in calculating income tax:
Tax effect of non-allowable items 153 206
Tax effect of US tax rate 14 28
Unrecognised tax losses and research and development tax offsets 7,764 -
Recognition of previously unrecognised deferred tax assets in the US subsidiary (475) -
US income tax benefit due to exercise/disposition of employee stock options (401) -
Research and development 923 (311)
Share-based payments 475 252
Other non-deductible/non-assessable items 115 89
Income tax adjusted for permanent differences:
Effect of movements in foreign exchange (214) (6)
Over provision in prior year (6) (104)
Income tax expense/(benefit) attributable to loss from ordinary activities 3,433 (2,466)
For
per
sona
l use
onl
y
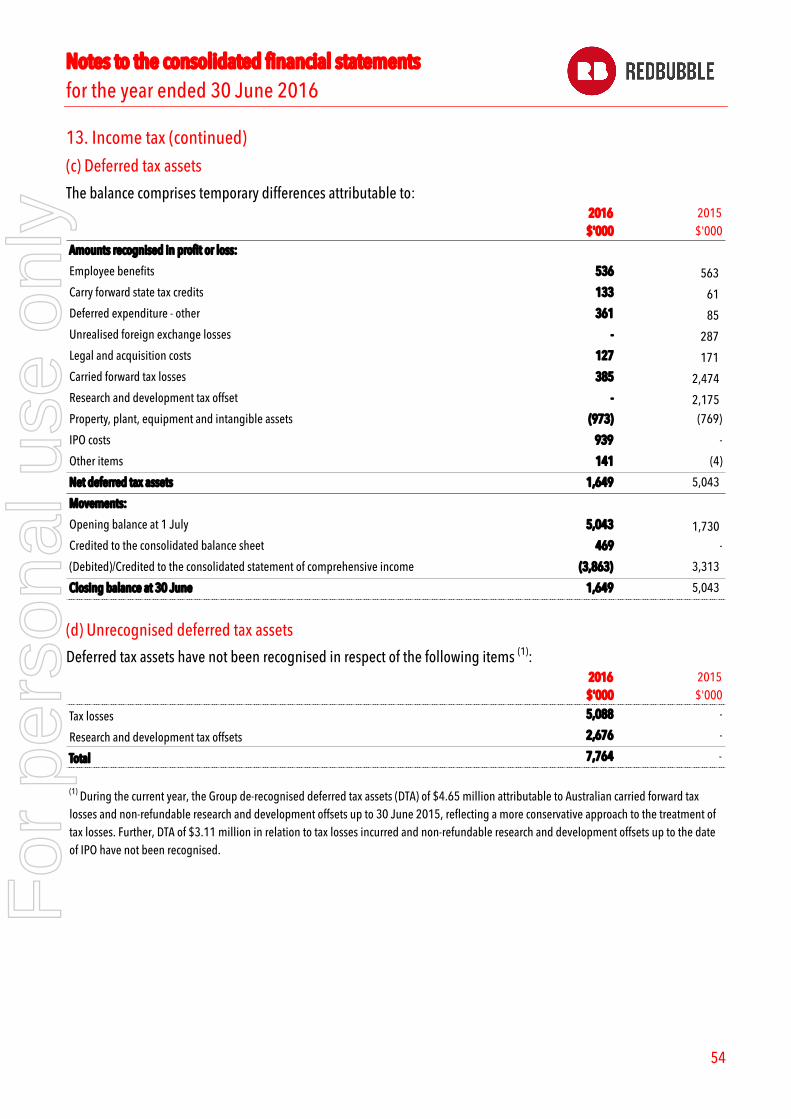
Notes to the consolidated financial statements for the year ended 30 June 2016
54
13. Income tax (continued) (c) Deferred tax assets
The balance comprises temporary differences attributable to:
(d) Unrecognised deferred tax assets
Deferred tax assets have not been recognised in respect of the following items (1):
2016$'000
2015$'000
Amounts recognised in profit or loss:
Employee benefits 536 563 Carry forward state tax credits 133 61 Deferred expenditure - other 361 85 Unrealised foreign exchange losses - 287 Legal and acquisition costs 127 171 Carried forward tax losses 385 2,474 Research and development tax offset - 2,175 Property, plant, equipment and intangible assets (973) (769)
IPO costs 939 -
Other items 141 (4)
Net deferred tax assets 1,649 5,043
Movements:
Opening balance at 1 July 5,043 1,730 Credited to the consolidated balance sheet 469 -
(Debited)/Credited to the consolidated statement of comprehensive income (3,863) 3,313
Closing balance at 30 June 1,649 5,043
2016$'000
2015$'000
Tax losses 5,088 -
Research and development tax offsets 2,676 -
Total 7,764 -
(1) During the current year, the Group de-recognised deferred tax assets (DTA) of $4.65 million attributable to Australian carried forward tax losses and non-refundable research and development offsets up to 30 June 2015, reflecting a more conservative approach to the treatment of tax losses. Further, DTA of $3.11 million in relation to tax losses incurred and non-refundable research and development offsets up to the date of IPO have not been recognised.
For
per
sona
l use
onl
y
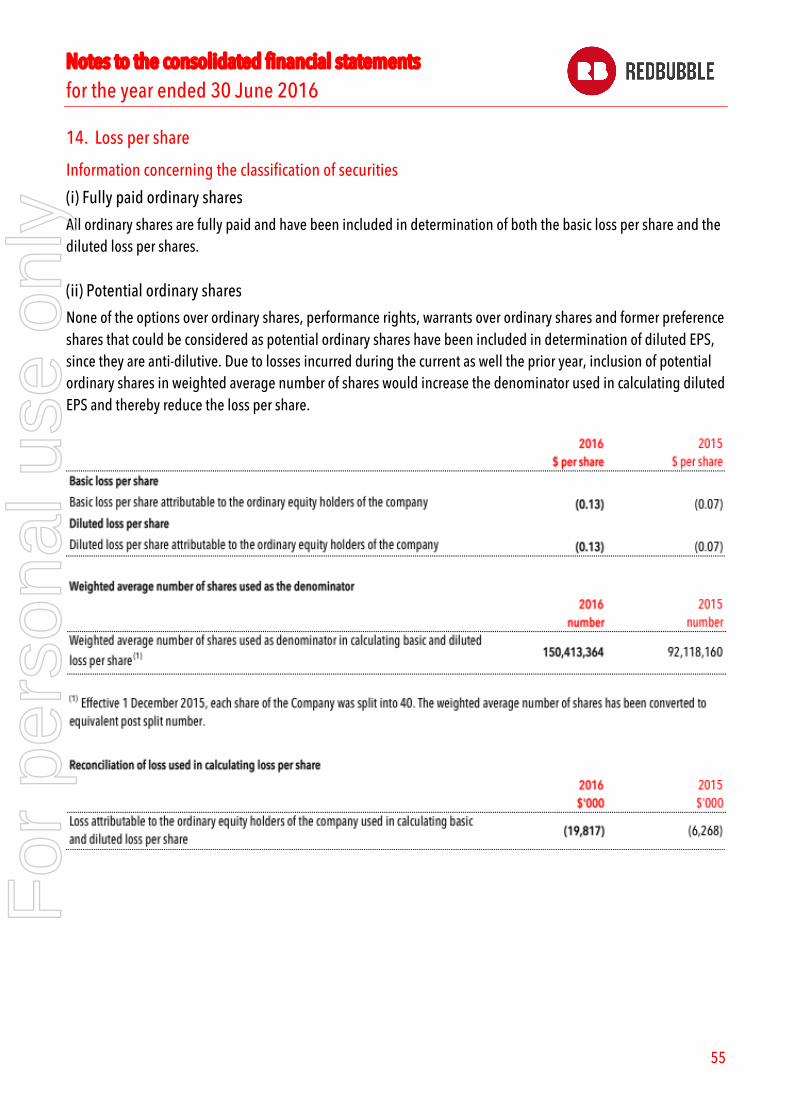
Notes to the consolidated financial statements for the year ended 30 June 2016
55
14. Loss per share
Information concerning the classification of securities
(i) Fully paid ordinary shares
All ordinary shares are fully paid and have been included in determination of both the basic loss per share and the diluted loss per shares. (ii) Potential ordinary shares
None of the options over ordinary shares, performance rights, warrants over ordinary shares and former preference shares that could be considered as potential ordinary shares have been included in determination of diluted EPS, since they are anti-dilutive. Due to losses incurred during the current as well the prior year, inclusion of potential ordinary shares in weighted average number of shares would increase the denominator used in calculating diluted EPS and thereby reduce the loss per share.
For
per
sona
l use
onl
y

Notes to the consolidated financial statements for the year ended 30 June 2016
56
15. Cash and cash equivalents
16. Reconciliation of loss for the year to net cash (outflow)/inflow from operating activities
2016$'000
2015$'000
Cash at bank and on hand 20,977 3,974
Fixed term bank deposits (1) 21,000 10,000
Total cash and cash equivalents 41,977 13,974
(1) Fixed term bank deposits attract interest at normal term deposit rates. They are placed for a period of 1-3 months and are not subject to any risk of change of values.
For
per
sona
l use
onl
y

Notes to the consolidated financial statements for the year ended 30 June 2016
57
17. Financial risk management
This note explains the Group’s financial risk management and how the exposure to these risks affects the Group’s future financial performance. The Group’s risk management is carried out by the senior management through delegation from the Board of Directors. The Board oversees and monitors senior management’s implementation of the Group’s risk management framework. This is based on recommendations from the Audit & Risk Committee, where appropriate. The risk management framework includes policies and procedures approved by the Board and managed by internal legal counsel and the finance function. The Group holds the following financial instruments:
The carrying value of the assets and liabilities disclosed in the table closely approximates or equals their fair value. Cash and cash equivalents (note 15) and security held with banks (note 20) attract variable interest rates. All other financial assets and liabilities are non-interest bearing. (a) Market risk
Foreign exchange risk
The Group collects funds from customers in five currencies (USD, AUD, EUR, CAD and GBP) and maintains bank accounts in these currencies. The Group has liabilities to vendors or artists in these currencies. The Group settles its liabilities in the native currency hence creating a natural hedge. Any surplus funds are converted to AUD or USD based operating accounts when management feels it is prudent to do so. During the year, the Group began to employ European suppliers for European sales. The Group is progressively localising fulfilment which will further aid in the natural hedge.
For
per
sona
l use
onl
y
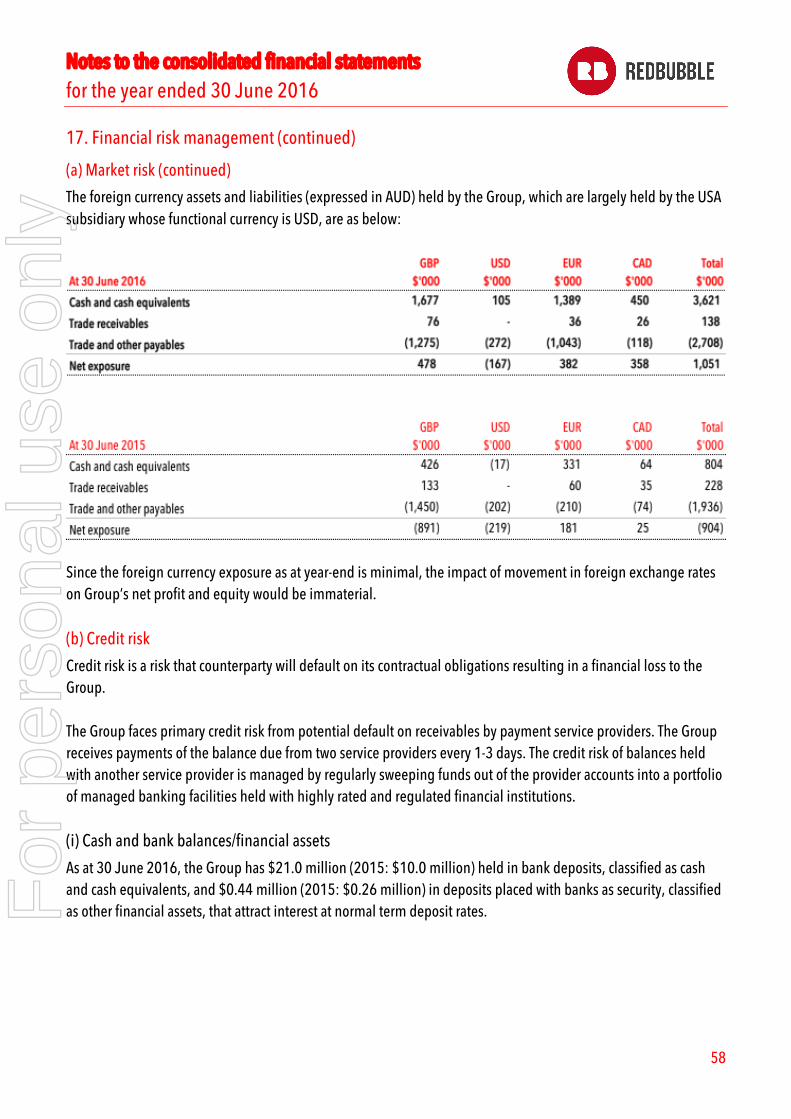
Notes to the consolidated financial statements for the year ended 30 June 2016
58
17. Financial risk management (continued)
(a) Market risk (continued)
The foreign currency assets and liabilities (expressed in AUD) held by the Group, which are largely held by the USA subsidiary whose functional currency is USD, are as below:
Since the foreign currency exposure as at year-end is minimal, the impact of movement in foreign exchange rates on Group’s net profit and equity would be immaterial.
(b) Credit risk
Credit risk is a risk that counterparty will default on its contractual obligations resulting in a financial loss to the Group. The Group faces primary credit risk from potential default on receivables by payment service providers. The Group receives payments of the balance due from two service providers every 1-3 days. The credit risk of balances held with another service provider is managed by regularly sweeping funds out of the provider accounts into a portfolio of managed banking facilities held with highly rated and regulated financial institutions. (i) Cash and bank balances/financial assets
As at 30 June 2016, the Group has $21.0 million (2015: $10.0 million) held in bank deposits, classified as cash and cash equivalents, and $0.44 million (2015: $0.26 million) in deposits placed with banks as security, classified as other financial assets, that attract interest at normal term deposit rates.
For
per
sona
l use
onl
y
Notes to the consolidated financial statements for the year ended 30 June 2016
59
17. Financial risk management (continued)
(b) Credit risk (continued)
The Group’s bank accounts are predominantly non-interest bearing accounts. In Australia, funds in excess of the short-term liquidity requirements are moved to savings account that attracts interest at normal bank rates on balances over $0.01 million. The financial assets include certain other operational deposits over and above the deposits placed with banks as security. The banks with which the accounts are maintained/deposits are placed are reputable financial institutions and hence, the credit risk is considered low. Further, the balances are not concentrated with any one bank.
(ii) Trade receivables
The Group is not exposed to any significant credit risk on account of trade receivables. The Group accepts payments either via credit card, Paypal or Amazon payments. In any case, the Group ensures that cash is received up front prior to the product being manufactured. The trade receivables balance as at 30 June 2016 represents amounts receivable from two of these payment service providers. It is believed that the credit risk from collections from payment service providers is minimal. The Group does encounter credit card fraud, which is typical for the industry. Such fraud has been immaterial to the Group. (c) Liquidity risk
Prudent liquidity risk management implies maintaining sufficient cash and ensuring that all term deposits can be converted to funds in accordance with forecast cash usage. Due to the dynamic nature of the underlying business, flexibility in funding is maintained by ensuring ready access to the cash reserves of the business. Term deposits classified as cash and cash equivalents are placed for a period of 1 to 3 months. These can be withdrawn prematurely but may incur a minor penalty in the form of reduced interest earned. During the year, the Group raised $12.25 million by issuing pre-IPO convertible notes (note 34) that were converted into ordinary shares upon IPO. Further, the Group raised $30 million through the IPO (note 27). All financial liabilities are current and anticipated to be repaid over the normal payment terms, usually 30 days. F
or p
erso
nal u
se o
nly

Notes to the consolidated financial statements for the year ended 30 June 2016
60
17. Financial risk management (continued)
(c) Liquidity risk (continued)
(i) Financial arrangements
The Group had no borrowing facilities at the end of reporting period.
The cumulative redeemable preference shares were converted into ordinary shares upon the IPO (note 26).
(ii) Maturities of financial liabilities
The following table summarises the maturity profile of the Group’s financial liabilities based on contractual undiscounted payments.
F
or p
erso
nal u
se o
nly

Notes to the consolidated financial statements for the year ended 30 June 2016
61
17. Financial risk management (continued)
(c) Liquidity risk (continued)
The Group’s policy is to maintain a capital structure for the business which ensures sufficient liquidity, provides support for business operations, maintains shareholder confidence and positions the business for future growth. The Group manages its capital structure and makes adjustments in light of changes in economic conditions. The ongoing maintenance of the Group’s policy is characterised by ongoing cash flow forecast analysis and detailed budgeting processes which, combined with continual development of banking relationships, is directed at providing a sound financial positioning for the Group’s operations and financial management activities. The Group is not subject to externally imposed capital requirements. The Group complied with all the bank lending requirements to maintain the loan facility during the prior year and this year until the facility expired in December 2015.
18. Trade and other receivables
(a) Impairment
None of the above balances are impaired or past due. (b) Ageing of net trade receivables from due date
(c) Credit risk and fair value
The Group has no significant concentration of credit risk with respect to any single counterparty or group of counterparties. Refer to note 17 for more information on the risk management policy of the group. The carrying amount of trade and other receivables is considered a reasonable approximation of fair value due to the short-term nature of the balances. The maximum exposure to credit risk at the reporting date is the carrying amount of each class of receivable in the financial statements.
(d) Collateral held as security
The Group does not hold any collateral in relation to these receivables.
For
per
sona
l use
onl
y
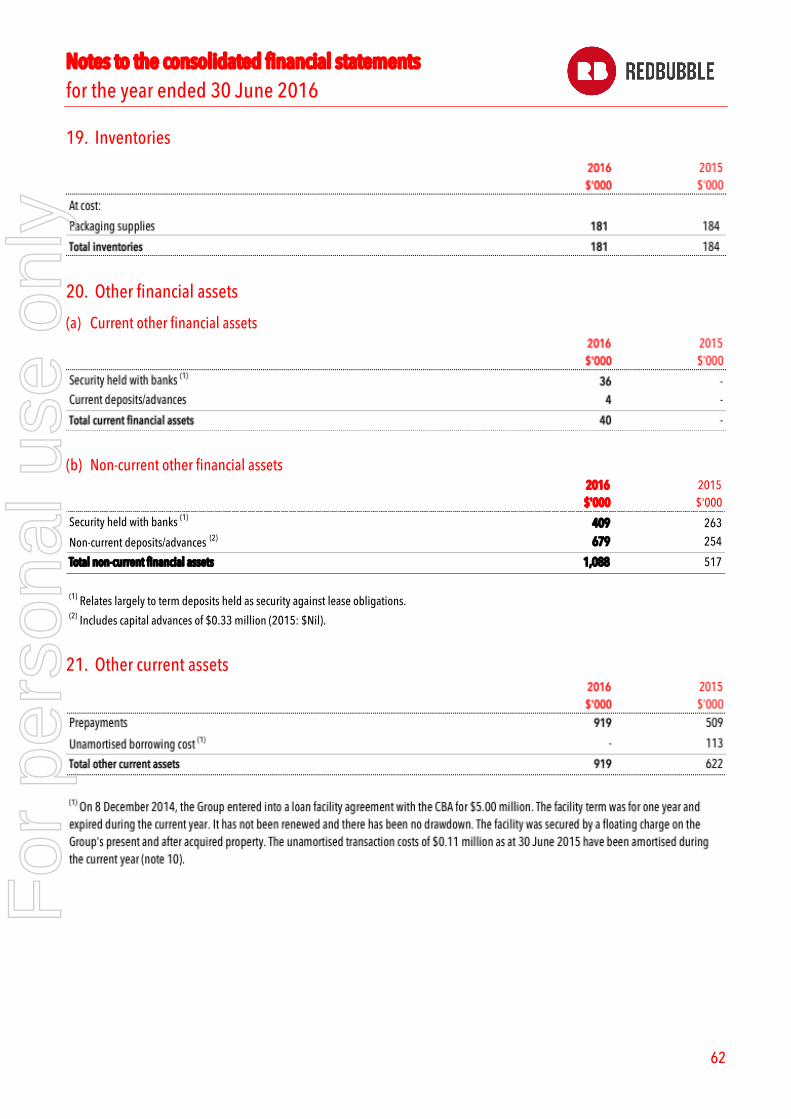
Notes to the consolidated financial statements for the year ended 30 June 2016
62
19. Inventories
20. Other financial assets
(a) Current other financial assets
(b) Non-current other financial assets
21. Other current assets
2016$'000
2015$'000
Security held with banks (1) 409 263
Non-current deposits/advances (2) 679 254
Total non-current financial assets 1,088 517
(1) Relates largely to term deposits held as security against lease obligations.(2) Includes capital advances of $0.33 million (2015: $Nil).
For
per
sona
l use
onl
y
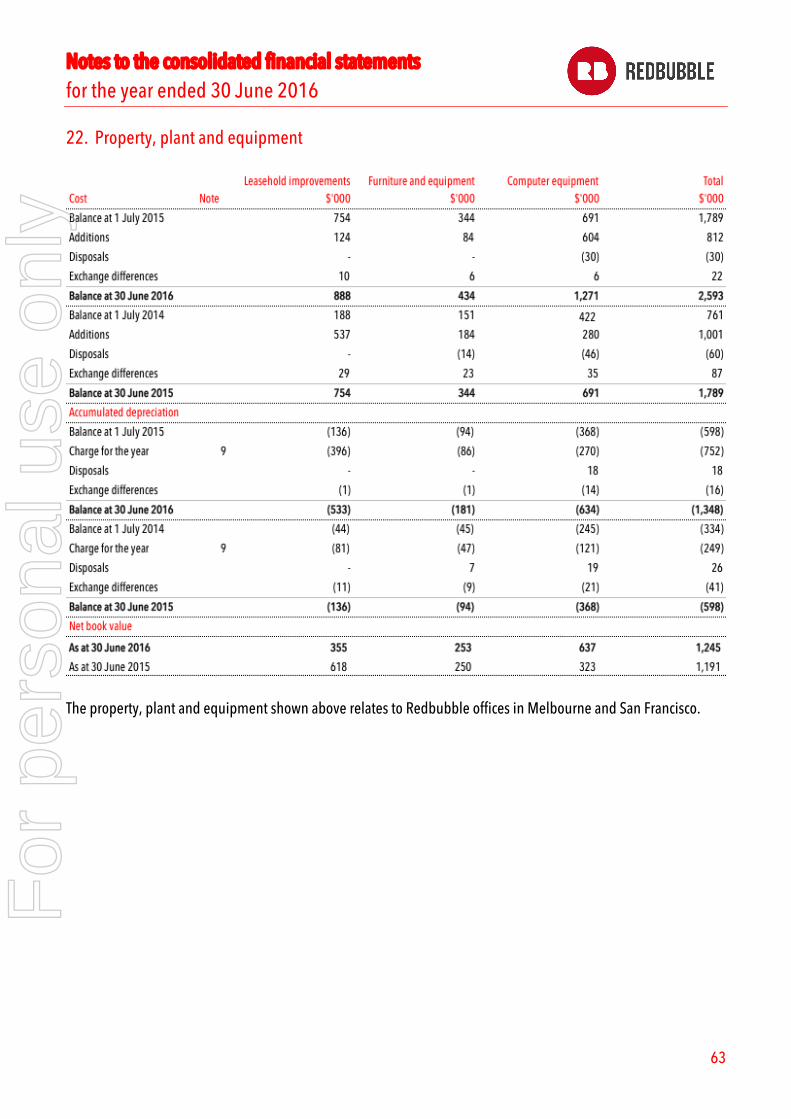
Notes to the consolidated financial statements for the year ended 30 June 2016
63
22. Property, plant and equipment
The property, plant and equipment shown above relates to Redbubble offices in Melbourne and San Francisco.
For
per
sona
l use
onl
y

Notes to the consolidated financial statements for the year ended 30 June 2016
64
23. Intangible Assets
Development costs are capitalised only when technical feasibility studies identify that the project is expected to deliver future economic benefits and these benefits can be measured reliably. The development costs have finite useful lives typically between 2 to 3 years with a weighted average of 2.2 years.
Capitalised development costs
Cost Note $'000
Balance at 1 July 2015 7,434
Additions 6,121
Disposals (72)
Exchange differences 30
Balance at 30 June 2016 13,513
Balance at 1 July 2014 3,157
Additions 4,216
Disposals -
Exchange differences 61
Balance at 30 June 2015 7,434
Accumulated amortisation
Balance at 1 July 2015 (2,843)
Charge for the year 9 (3,257)
Disposals 2
Exchange differences 1
Balance at 30 June 2016 (6,097)
Balance at 1 July 2014 (1,044)
Charge for the year 9 (1,778)
Disposals -
Exchange differences (21)
Balance at 30 June 2015 (2,843)
Net book value
As at 30 June 2016 7,416
As at 30 June 2015 4,591
For
per
sona
l use
onl
y

Notes to the consolidated financial statements for the year ended 30 June 2016
65
24. Trade and other payables
25. Employee benefit liabilities
(a) Current employee benefit liabilities
(b) Non-current employee benefit liability
(c) Unrecognised contingent liabilities
The are no unrecognised contingent liabilities as at 30 June 2016 (2015: $Nil).
26. Non-current borrowings
F
or p
erso
nal u
se o
nly

Notes to the consolidated financial statements for the year ended 30 June 2016
66
27. Contributed equity
(a) Share capital
(b) Movements in ordinary share capital
For
per
sona
l use
onl
y
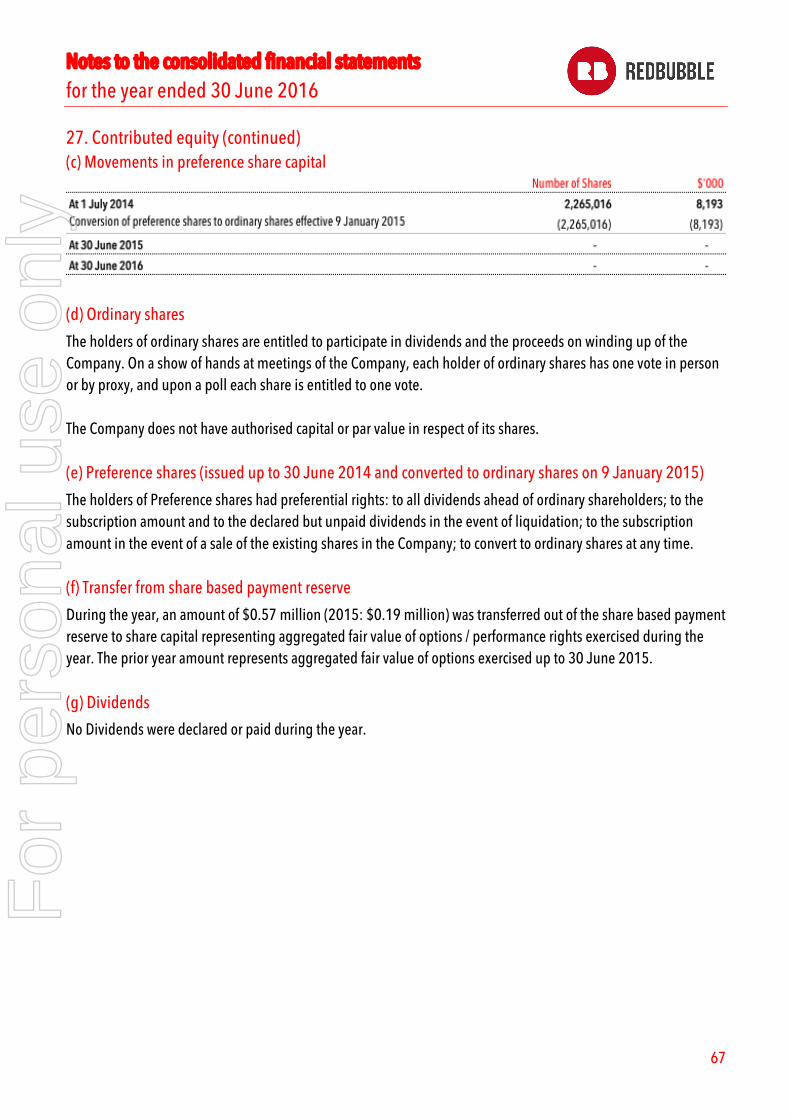
Notes to the consolidated financial statements for the year ended 30 June 2016
67
27. Contributed equity (continued)
(c) Movements in preference share capital
(d) Ordinary shares
The holders of ordinary shares are entitled to participate in dividends and the proceeds on winding up of the Company. On a show of hands at meetings of the Company, each holder of ordinary shares has one vote in person or by proxy, and upon a poll each share is entitled to one vote. The Company does not have authorised capital or par value in respect of its shares. (e) Preference shares (issued up to 30 June 2014 and converted to ordinary shares on 9 January 2015)
The holders of Preference shares had preferential rights: to all dividends ahead of ordinary shareholders; to the subscription amount and to the declared but unpaid dividends in the event of liquidation; to the subscription amount in the event of a sale of the existing shares in the Company; to convert to ordinary shares at any time. (f) Transfer from share based payment reserve
During the year, an amount of $0.57 million (2015: $0.19 million) was transferred out of the share based payment reserve to share capital representing aggregated fair value of options / performance rights exercised during the year. The prior year amount represents aggregated fair value of options exercised up to 30 June 2015. (g) Dividends
No Dividends were declared or paid during the year.
For
per
sona
l use
onl
y
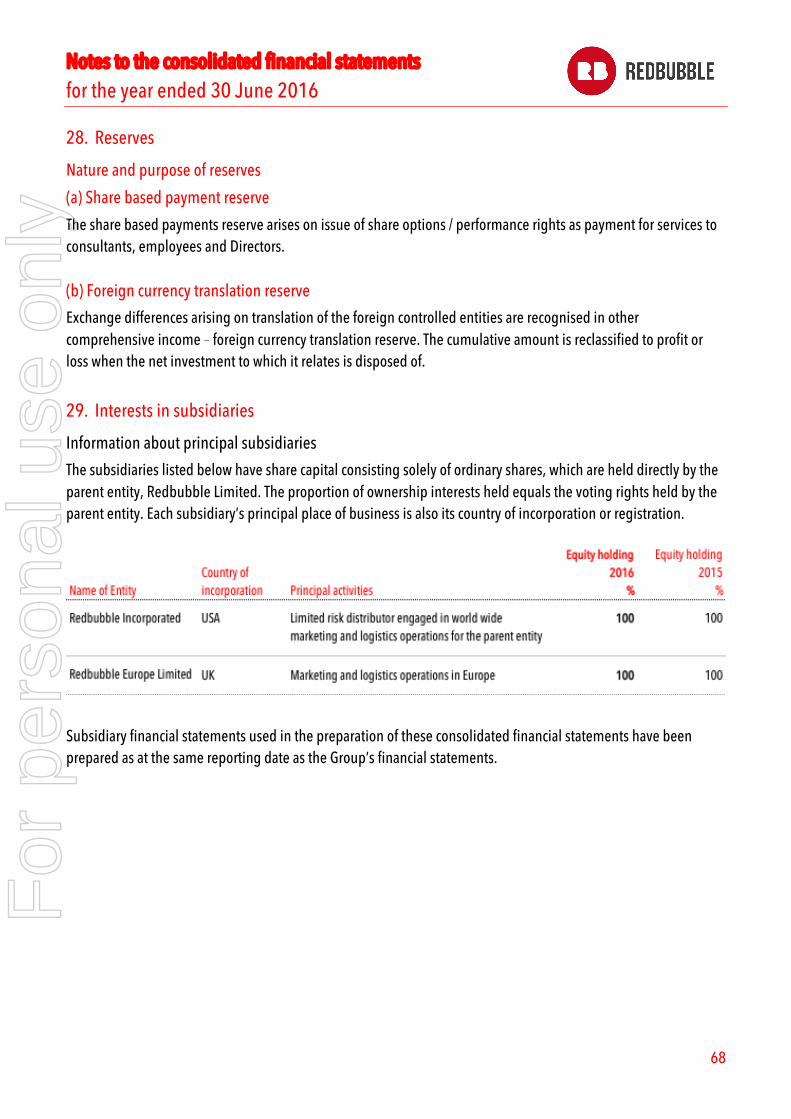
Notes to the consolidated financial statements for the year ended 30 June 2016
68
28. Reserves
Nature and purpose of reserves
(a) Share based payment reserve
The share based payments reserve arises on issue of share options / performance rights as payment for services to consultants, employees and Directors. (b) Foreign currency translation reserve
Exchange differences arising on translation of the foreign controlled entities are recognised in other comprehensive income ‑ foreign currency translation reserve. The cumulative amount is reclassified to profit or loss when the net investment to which it relates is disposed of.
29. Interests in subsidiaries
Information about principal subsidiaries
The subsidiaries listed below have share capital consisting solely of ordinary shares, which are held directly by the parent entity, Redbubble Limited. The proportion of ownership interests held equals the voting rights held by the parent entity. Each subsidiary’s principal place of business is also its country of incorporation or registration.
Subsidiary financial statements used in the preparation of these consolidated financial statements have been prepared as at the same reporting date as the Group’s financial statements.
For
per
sona
l use
onl
y

Notes to the consolidated financial statements for the year ended 30 June 2016
69
30. Parent entity financial information
The following information has been extracted from the books and records of the parent entity, Redbubble Limited and has been prepared in accordance with accounting standards.
(a) Summary financial information
(b) Guarantees entered into by the parent entity
The parent entity has not entered into any guarantees as at 30 June 2016 (2015: $Nil).
(c) Contingent liabilities of the parent entity
As at the date of these financial statements there are current lawsuits filed against entities within the Group that relate to alleged intellectual property infringement and/or breach of consumer laws. It is not possible for the Company to provide any reliable assessment of the likely quantum of damages that may become payable upon an adverse finding under any of the claims. No trial dates have been set for any of the claims and therefore it is not practicable to state the timing of any payment that may arise from an adverse finding. The Company considers that it is only possible but not probable that any action will succeed and accordingly no provision for any liability has been made in these financial statements.
For
per
sona
l use
onl
y

Notes to the consolidated financial statements for the year ended 30 June 2016
70
30. Parent entity financial information (continued) (c) Contingent liabilities of the parent entity (continued)
The Company does not consider that any of the current actions are likely to have a material adverse effect on the business or financial position of the Company.
(d) Contractual commitments As at 30 June 2016, the parent entity had contractual commitments for minimum lease payments in relation to non-cancellable operating leases totalling to $4.67 million (2015: $0.56 million). There was a capital commitment towards leasehold improvements as at 30 June 2016 of $0.58 million (2015: $Nil).
31. Contingent liabilities
As at the date of these financial statements there are current lawsuits filed against entities within the Group that relate to alleged intellectual property infringement and/or breach of consumer laws. It is not possible for the Group to provide any reliable assessment of the likely quantum of damages that may become payable upon an adverse finding under any of the claims. No trial dates have been set for any of the claims and therefore it is not practicable to state the timing of any payment that may arise from an adverse finding. The Group considers that it is only possible but not probable that any action will succeed and accordingly no provision for any liability has been made in these financial statements. The Group does not consider that any of the current actions are likely to have a material adverse effect on the business or financial position of the Group.
32. Commitments for expenditure
(a) Capital commitments
The Group had a capital commitment towards leasehold improvements of $0.58 million as at 30 June 2016 (2015: $Nil). (b) Other commitments
The Group had no other material commitments as at 30 June 2016 (2015: $Nil). F
or p
erso
nal u
se o
nly

Notes to the consolidated financial statements for the year ended 30 June 2016
71
32. Commitments for expenditure (continued)
(c) Lease commitments
Operating leases Commitments for minimum lease payments in relation non-cancellable operating leases are payable as follows:
The Group leases offices under non-cancellable operating leases for periods ranging within 2 to 6 years, with rent payable monthly in advance. The leases have varying terms, escalation clauses and renewal rights. Rental provisions within the lease agreement provide for increase in the minimum lease payments as contracted.
33. Events occurring after the balance sheet date
The financial report was authorised for issue on 25 August 2016 by the board of Directors. There have been no significant events after the balance sheet date that require disclosure.
34. Pre-IPO convertible notes
On 21 March 2016, the Group raised $12.25 million (face value) by issue of Pre-IPO Convertible Notes (Convertible Notes) and incurred transactions costs of $0.61 million. These were converted into ordinary shares upon the IPO (note 27) at a price of $1.197 and 10,233,919 ordinary shares were issued.
For
per
sona
l use
onl
y

Notes to the consolidated financial statements for the year ended 30 June 2016
72
35. Share-based payments
Options over ordinary shares
In September 2015, the Group introduced the “Redbubble Equity Incentive Plan”. Under this plan options over ordinary shares may be granted to Redbubble Limited board members, employees (including senior executives) and contractors. The options are subject to service conditions and have a predetermined time-based vesting schedule. The grantees of options under this Plan may exercise vested options at any time before the earlier of: (a) a specified expiry date (generally 10 years from the grant date); and (b) 90 days after ceasing to be a Director, employee or contractor for Redbubble Limited. Some of the options already granted have a zero exercise price, so as to be akin to performance rights (or restricted stock units). During FY 2015, options were granted under the “2014 Option Plan”. Options granted prior to that were governed by individual agreements with the relevant participants, (i.e. not subject to centralised equity plan rules such as the 2014 Option Plan or Redbubble Equity Incentive Plan) and do not have performance targets. Executive options for FY 2015
These were granted in FY 2015 as a short-term incentive (STI) to senior executives of the Group under the 2014 Option Plan. The number of options granted to participants was subject to: achievement of certain performance-based conditions in relation to the Group's Sales and Gross Profit targets or organic visit growth targets; and personal performance assessment. The options have a predetermined time-based vesting schedule and grantees may exercise the options for a further set number of years after the options are vested. Performance rights
Up to the end of FY 2015, performance rights were granted under the Restricted Share and Performance Rights Plan to all employees including senior executives, consultants and board members. Two grants were made under this plan during the current year. Once granted, the rights have a predetermined time-based vesting schedule. All the performance rights are subject to service conditions, a liquidity event condition and share trading restrictions. The liquidity event condition will be met during FY2017 on the date 6 months after the date of the IPO and hence, none of the performance rights vest until then.
For
per
sona
l use
onl
y

Notes to the consolidated financial statements for the year ended 30 June 2016
73
35. Share based payments (continued)
Executive STI for FY2016 - Options and Performance Rights
The Company has contracted with executives who can materially impact the financial and operational performance of the Group to pay an STI benefit under the “Redbubble SLT Short Term Incentive (STI) Plan”. The STI benefits for the current year are subject to: achievement of certain performance-based requirements in relation to the Group's Gross Transaction Value (GTV) and Repeat GTV; and personal performance assessment in the current year. The value of the STI is part cash and part equity, with the split depending on the date the executive joined the Company. The equity component will consist of options with a zero exercise price for executives employed by Redbubble Limited and performance rights for executives employed by Redbubble Inc. The options for Redbubble Limited executives will be granted under the Redbubble Equity Incentive Plan. The performance rights for Redbubble Inc. executives will be granted under the “Restricted Share and Performance Rights Plan”. The target dollar value of the grants has been determined during the current year but the grants will be made in FY 2017, calculated by dividing the dollar value by the volume weighted average price over a representative 5 day period. Warrants over ordinary shares (previously over preference shares)
Warrants over preference shares were issued in FY 2012 to Denali Capital Managers Pty Ltd, an entity related to Richard Cawsey, the Chair of the Board, under terms of a loan facility agreement in addition to the interest thereon. The loan facility terminated on 31 December 2012. The Warrants were converted to Warrants over ordinary shares when the Company was converted from a private company to a public company on 9 January 2015.
For
per
sona
l use
onl
y
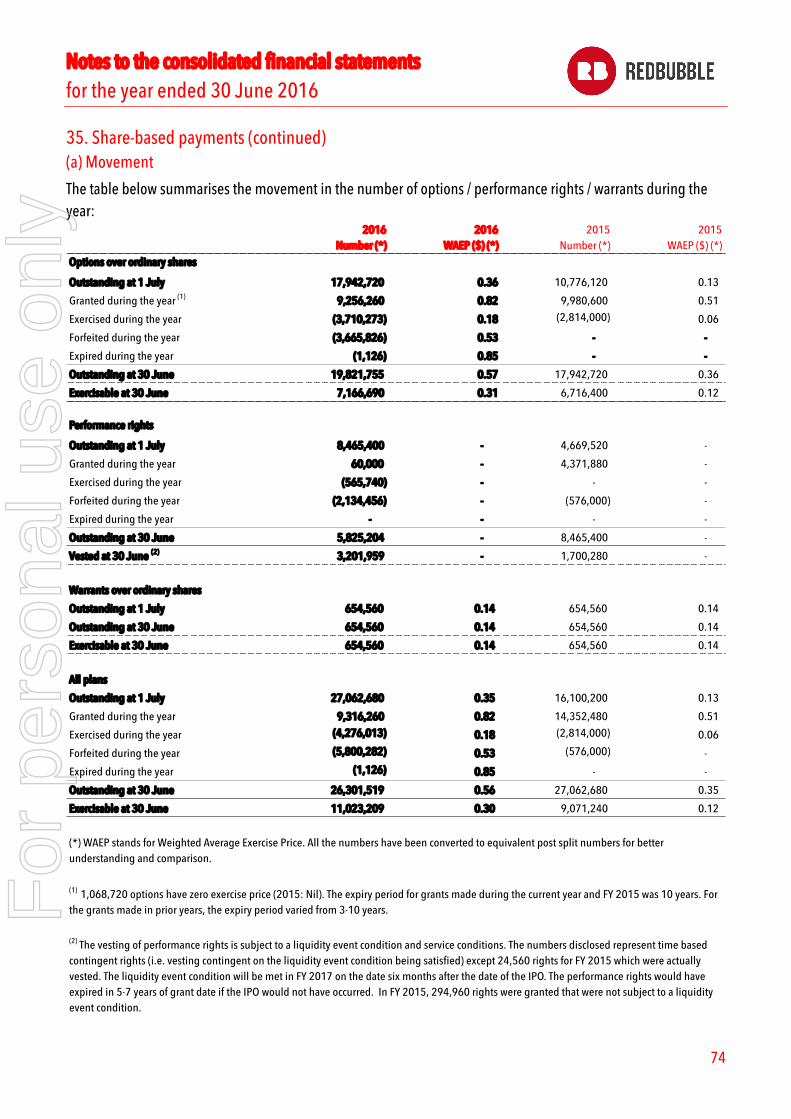
Notes to the consolidated financial statements for the year ended 30 June 2016
74
35. Share-based payments (continued)
(a) Movement
The table below summarises the movement in the number of options / performance rights / warrants during the year:
2016 2016 2015 2015Number (*) WAEP ($) (*) Number (*) WAEP ($) (*)
Options over ordinary shares
Outstanding at 1 July 17,942,720 0.36 10,776,120 0.13
Granted during the year (1) 9,256,260 0.82 9,980,600 0.51
Exercised during the year (3,710,273) 0.18 (2,814,000) 0.06
Forfeited during the year (3,665,826) 0.53 - -
Expired during the year (1,126) 0.85 - -
Outstanding at 30 June 19,821,755 0.57 17,942,720 0.36
Exercisable at 30 June 7,166,690 0.31 6,716,400 0.12
Performance rights
Outstanding at 1 July 8,465,400 - 4,669,520 -
Granted during the year 60,000 - 4,371,880 -
Exercised during the year (565,740) - - -
Forfeited during the year (2,134,456) - (576,000) -
Expired during the year - - - -
Outstanding at 30 June 5,825,204 - 8,465,400 -
Vested at 30 June (2) 3,201,959 - 1,700,280 -
Warrants over ordinary shares
Outstanding at 1 July 654,560 0.14 654,560 0.14
Outstanding at 30 June 654,560 0.14 654,560 0.14
Exercisable at 30 June 654,560 0.14 654,560 0.14
All plans
Outstanding at 1 July 27,062,680 0.35 16,100,200 0.13
Granted during the year 9,316,260 0.82 14,352,480 0.51
Exercised during the year (4,276,013) 0.18 (2,814,000) 0.06
Forfeited during the year (5,800,282) 0.53 (576,000) -
Expired during the year (1,126) 0.85 - -
Outstanding at 30 June 26,301,519 0.56 27,062,680 0.35
Exercisable at 30 June 11,023,209 0.30 9,071,240 0.12
(1) 1,068,720 options have zero exercise price (2015: Nil). The expiry period for grants made during the current year and FY 2015 was 10 years. For the grants made in prior years, the expiry period varied from 3-10 years.
(2) The vesting of performance rights is subject to a liquidity event condition and service conditions. The numbers disclosed represent time based contingent rights (i.e. vesting contingent on the liquidity event condition being satisfied) except 24,560 rights for FY 2015 which were actually vested. The liquidity event condition will be met in FY 2017 on the date six months after the date of the IPO. The performance rights would have expired in 5-7 years of grant date if the IPO would not have occurred. In FY 2015, 294,960 rights were granted that were not subject to a liquidity event condition.
(*) WAEP stands for Weighted Average Exercise Price. All the numbers have been converted to equivalent post split numbers for better understanding and comparison.
For
per
sona
l use
onl
y
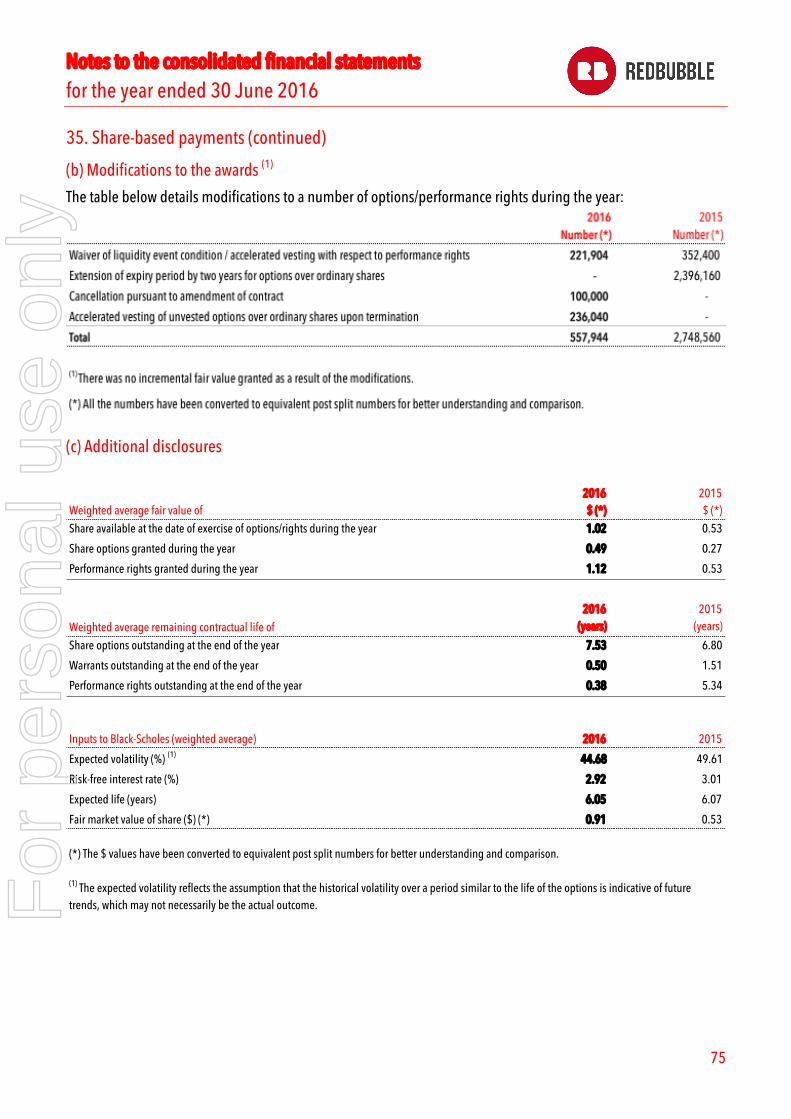
Notes to the consolidated financial statements for the year ended 30 June 2016
75
35. Share-based payments (continued)
(b) Modifications to the awards (1)
The table below details modifications to a number of options/performance rights during the year:
(c) Additional disclosures
Weighted average fair value of2016$ (*)
2015$ (*)
Share available at the date of exercise of options/rights during the year 1.02 0.53
Share options granted during the year 0.49 0.27
Performance rights granted during the year 1.12 0.53
Weighted average remaining contractual life of2016
(years)2015
(years)
Share options outstanding at the end of the year 7.53 6.80
Warrants outstanding at the end of the year 0.50 1.51
Performance rights outstanding at the end of the year 0.38 5.34
Inputs to Black-Scholes (weighted average) 2016 2015
Expected volatility (%) (1) 44.68 49.61
Risk-free interest rate (%) 2.92 3.01
Expected life (years) 6.05 6.07
Fair market value of share ($) (*) 0.91 0.53
(*) The $ values have been converted to equivalent post split numbers for better understanding and comparison.
(1) The expected volatility reflects the assumption that the historical volatility over a period similar to the life of the options is indicative of future trends, which may not necessarily be the actual outcome.F
or p
erso
nal u
se o
nly
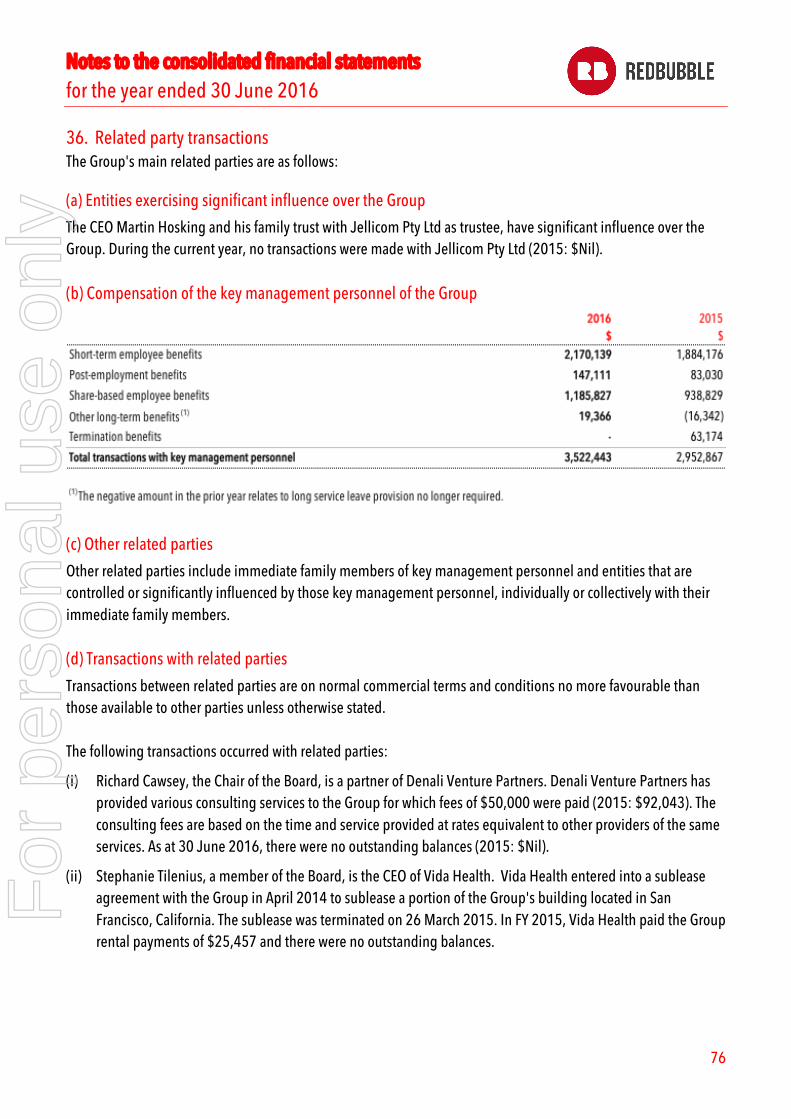
Notes to the consolidated financial statements for the year ended 30 June 2016
76
36. Related party transactions
The Group's main related parties are as follows:
(a) Entities exercising significant influence over the Group
The CEO Martin Hosking and his family trust with Jellicom Pty Ltd as trustee, have significant influence over the Group. During the current year, no transactions were made with Jellicom Pty Ltd (2015: $Nil). (b) Compensation of the key management personnel of the Group
(c) Other related parties
Other related parties include immediate family members of key management personnel and entities that are controlled or significantly influenced by those key management personnel, individually or collectively with their immediate family members. (d) Transactions with related parties
Transactions between related parties are on normal commercial terms and conditions no more favourable than those available to other parties unless otherwise stated. The following transactions occurred with related parties:
(i) Richard Cawsey, the Chair of the Board, is a partner of Denali Venture Partners. Denali Venture Partners has provided various consulting services to the Group for which fees of $50,000 were paid (2015: $92,043). The consulting fees are based on the time and service provided at rates equivalent to other providers of the same services. As at 30 June 2016, there were no outstanding balances (2015: $Nil).
(ii) Stephanie Tilenius, a member of the Board, is the CEO of Vida Health. Vida Health entered into a sublease agreement with the Group in April 2014 to sublease a portion of the Group's building located in San Francisco, California. The sublease was terminated on 26 March 2015. In FY 2015, Vida Health paid the Group rental payments of $25,457 and there were no outstanding balances.
For
per
sona
l use
onl
y
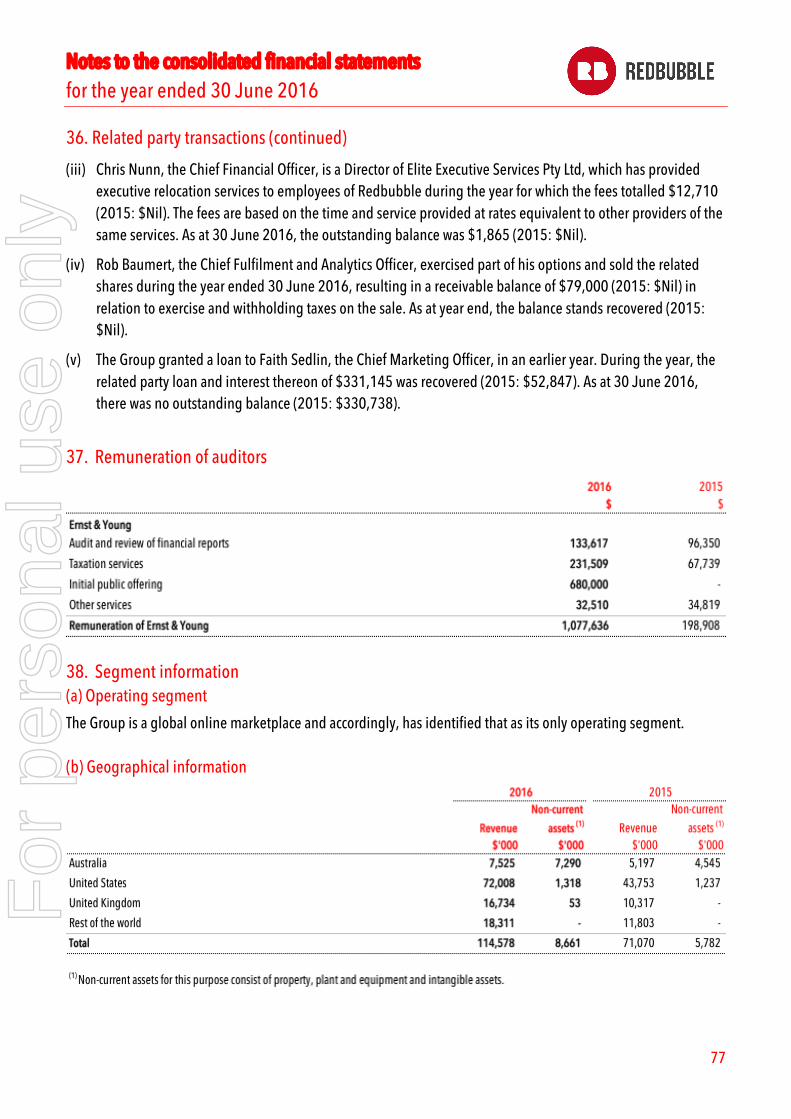
Notes to the consolidated financial statements for the year ended 30 June 2016
77
36. Related party transactions (continued)
(iii) Chris Nunn, the Chief Financial Officer, is a Director of Elite Executive Services Pty Ltd, which has provided executive relocation services to employees of Redbubble during the year for which the fees totalled $12,710 (2015: $Nil). The fees are based on the time and service provided at rates equivalent to other providers of the same services. As at 30 June 2016, the outstanding balance was $1,865 (2015: $Nil).
(iv) Rob Baumert, the Chief Fulfilment and Analytics Officer, exercised part of his options and sold the related shares during the year ended 30 June 2016, resulting in a receivable balance of $79,000 (2015: $Nil) in relation to exercise and withholding taxes on the sale. As at year end, the balance stands recovered (2015: $Nil).
(v) The Group granted a loan to Faith Sedlin, the Chief Marketing Officer, in an earlier year. During the year, the related party loan and interest thereon of $331,145 was recovered (2015: $52,847). As at 30 June 2016, there was no outstanding balance (2015: $330,738).
37. Remuneration of auditors
38. Segment information (a) Operating segment
The Group is a global online marketplace and accordingly, has identified that as its only operating segment. (b) Geographical information
For
per
sona
l use
onl
y
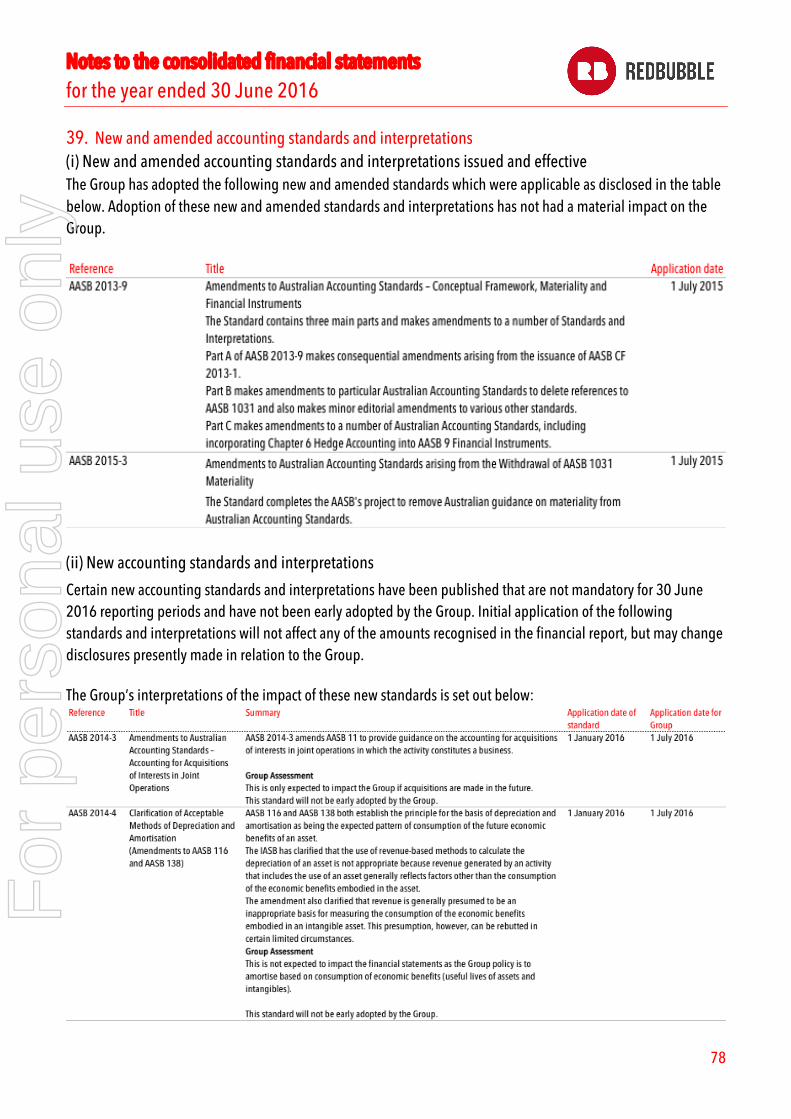
Notes to the consolidated financial statements for the year ended 30 June 2016
78
39. New and amended accounting standards and interpretations (i) New and amended accounting standards and interpretations issued and effective The Group has adopted the following new and amended standards which were applicable as disclosed in the table below. Adoption of these new and amended standards and interpretations has not had a material impact on the Group.
(ii) New accounting standards and interpretations
Certain new accounting standards and interpretations have been published that are not mandatory for 30 June 2016 reporting periods and have not been early adopted by the Group. Initial application of the following standards and interpretations will not affect any of the amounts recognised in the financial report, but may change disclosures presently made in relation to the Group.
The Group’s interpretations of the impact of these new standards is set out below:
For
per
sona
l use
onl
y

Notes to the consolidated financial statements for the year ended 30 June 2016
79
39. New and amended accounting standards and interpretations (continued)
For
per
sona
l use
onl
y
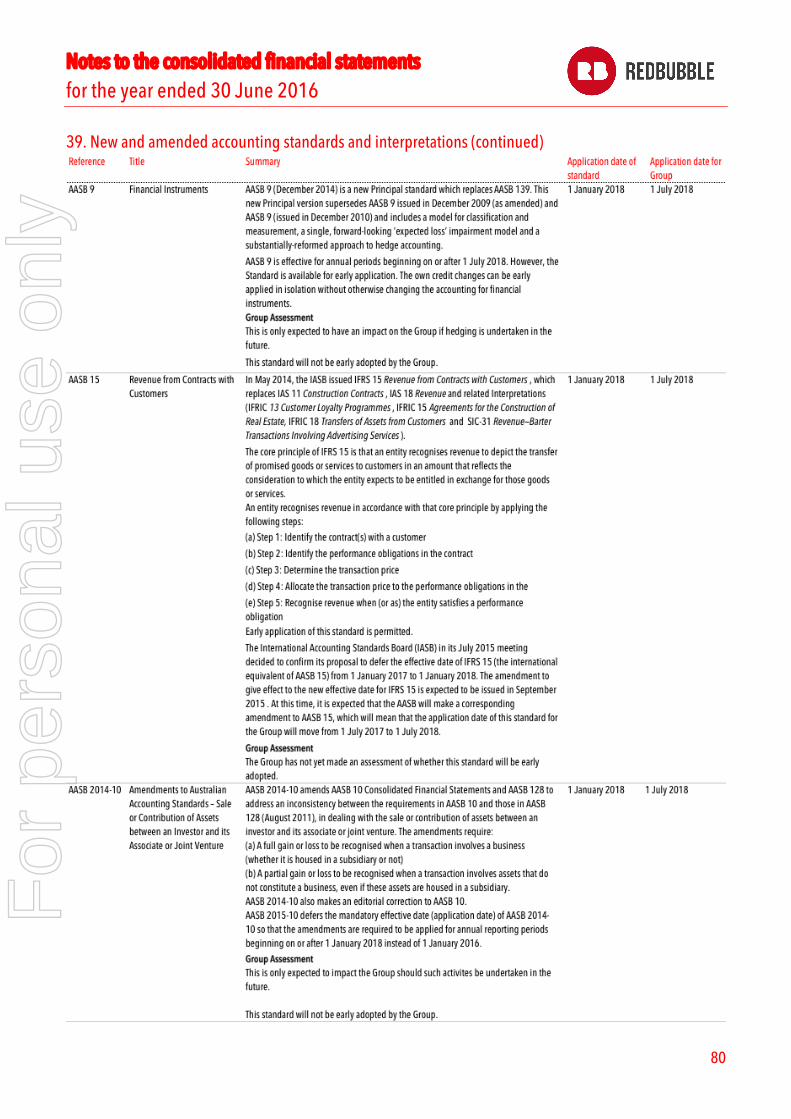
Notes to the consolidated financial statements for the year ended 30 June 2016
80
39. New and amended accounting standards and interpretations (continued)
For
per
sona
l use
onl
y
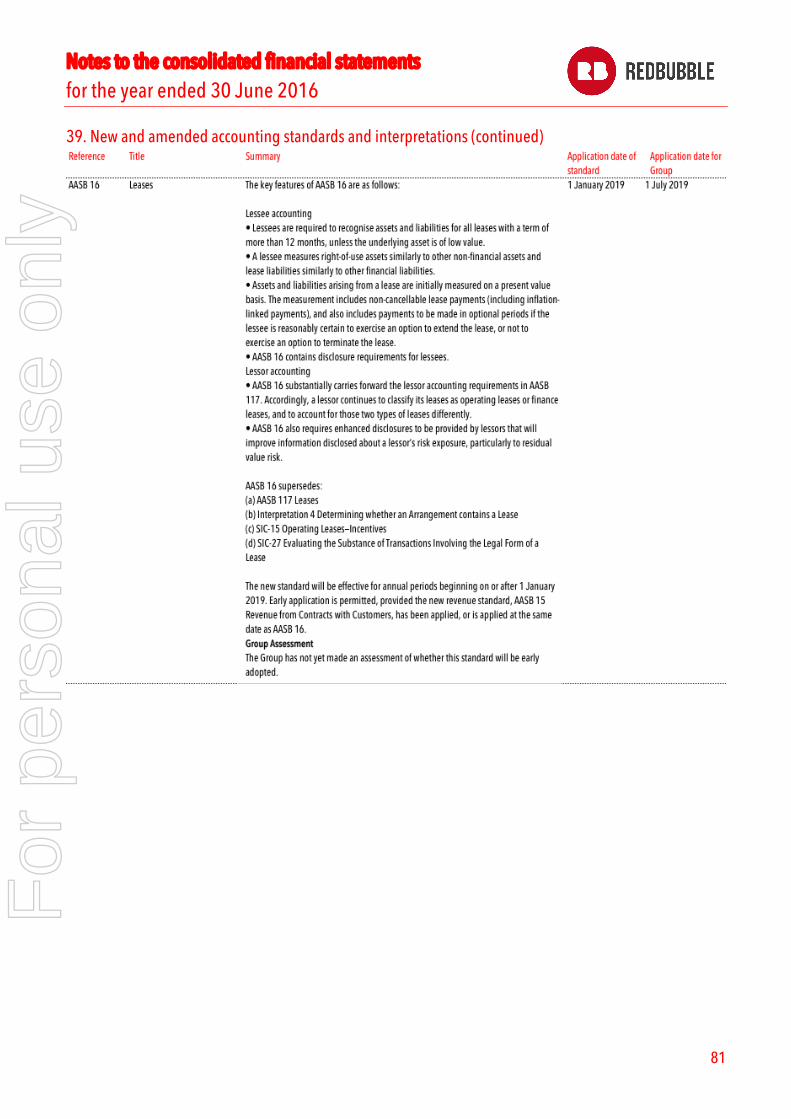
Notes to the consolidated financial statements for the year ended 30 June 2016
81
39. New and amended accounting standards and interpretations (continued)
For
per
sona
l use
onl
y

Directors’ Declaration
82
In accordance with a resolution of the Directors of Redbubble Limited, we state that in the Directors’ opinion:�
(a) the financial statements and notes set out on pages 35-81 are in accordance with the Corporations Act 2001, including:
(i) complying with Accounting Standards, the Corporations Regulations 2001 and other mandatory professional reporting requirements; and
(ii) giving a true and fair view of the consolidated entity’s financial position as at 30 June 2016 and of its performance for the financial year ended on that date; and
(b) there are reasonable grounds to believe that Redbubble Limited will be able to pay its debts as and when they become due and payable. Note 2(a) confirms that the financial statements also comply with International Financial Reporting Standards as issued by the International Accounting Standards Board. The Directors have been given the declarations by the Managing Director & Chief Executive Officer and Chief Financial Officer required by Section 295A of the Corporations Act 2001.
Richard Cawsey Martin Hosking Chairman Chief Executive Officer Melbourne Melbourne 25 August 2016 25 August 2016
For
per
sona
l use
onl
y
Independent Auditors’ Report
83
For
per
sona
l use
onl
y

Independent Auditors’ Report
84
For
per
sona
l use
onl
y
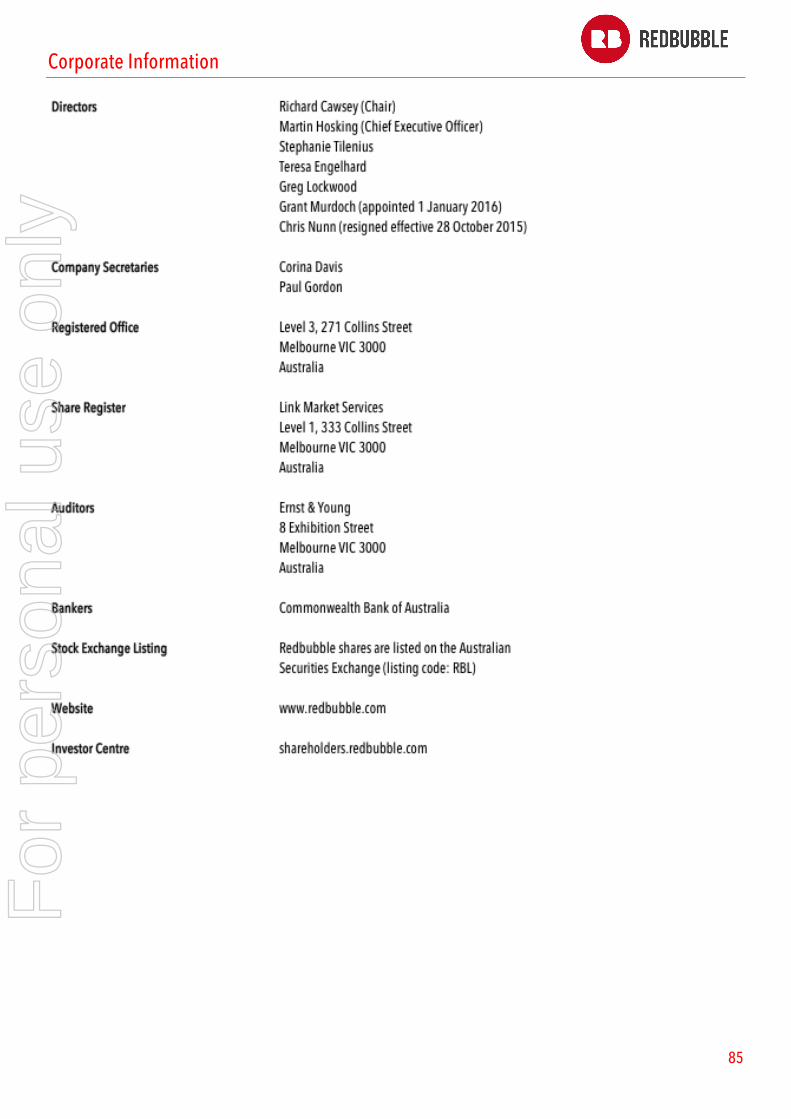
Corporate Information
85
For
per
sona
l use
onl
y