full year results 2001 - nestlé global · full year results 2001. 2 28.02.2002/conf.call ... 10.9%...
TRANSCRIPT

Conference call, February 2002Conference call, February 2002
FULL YEAR RESULTS 2001FULL YEAR RESULTS 2001
228.02.2002/Conf.call
This presentation contains forward looking statements which reflect Management’s current views and estimates. The forward looking statements involve certain risks and uncertainties that could cause actual results to differ materially from those contained in the forward looking statements. Potential risks and uncertainties include such factors as general economic conditions, foreign exchange fluctuations, competitive product and pricing pressures and regulatory developments.

328.02.2002/Conf.call
Agenda
Key achievements & figures Income statementCash flowBalance sheetUse of funds

428.02.2002/Conf.call
Agenda
Key achievements & figuresIncome statementCash flowBalance sheetUse of funds
528.02.2002/Conf.call
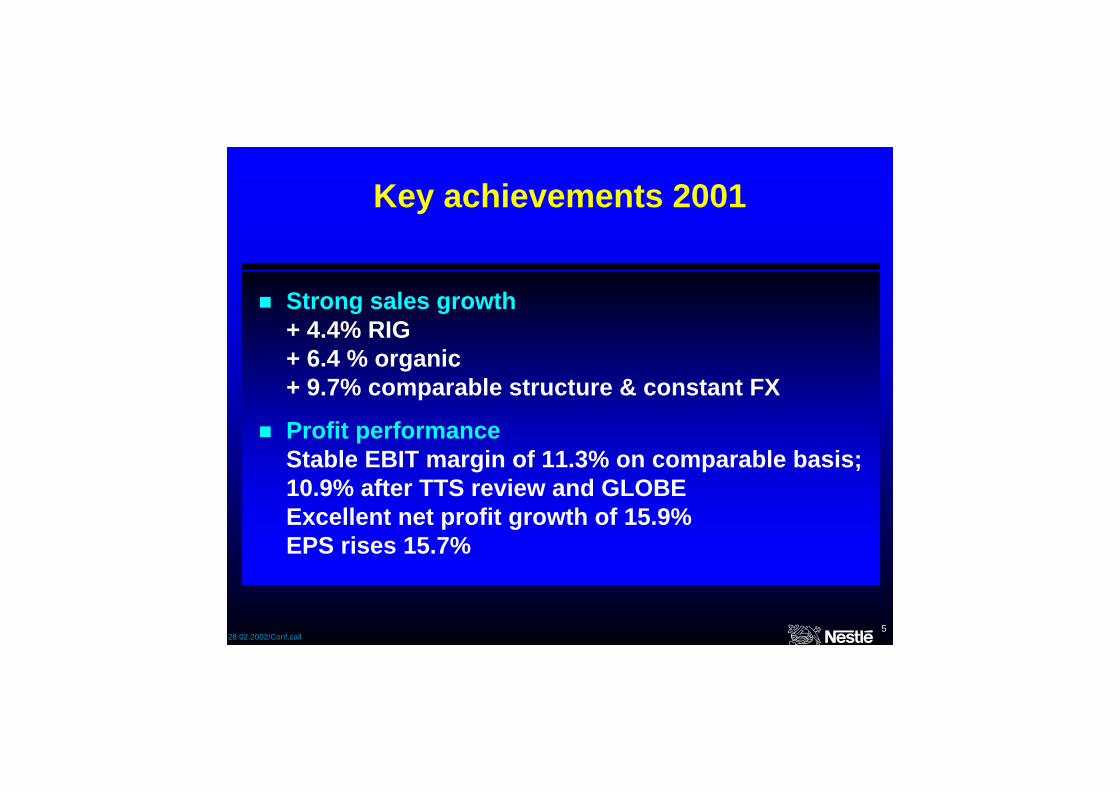
Key achievements 2001
Strong sales growth+ 4.4% RIG+ 6.4 % organic+ 9.7% comparable structure & constant FX
Profit performanceStable EBIT margin of 11.3% on comparable basis; 10.9% after TTS review and GLOBEExcellent net profit growth of 15.9% EPS rises 15.7%

628.02.2002/Conf.call
Key figures 2000 and 2001
* adjusted for share split . TTS figures are illustrative.
ChangeCHF mio. 2000 % 2001 % %
Sales 81'422 100 84'698 100 4.0 EBITDA 12'516 15.4 12'444 14.7 (0.6)
ex TTS - - - 15.2EBITA 9'600 11.8 9'713 11.5 1.2
ex TTS - - - 11.9Trading profit (EBIT) 9'186 11.3 9'218 10.9 0.4
ex TTS - - - 11.3Net profit 5'763 7.1 6'681 7.9 15.9
ex TTS - - - 8.2Earnings per share (CHF) 14.91* 17.25 15.7

728.02.2002/Conf.call
Agenda
Key achievements & figures Income statementCash flowBalance sheetUse of funds

828.02.2002/Conf.call
Drivers of sales growthJanuary - December 2001 : CHF 84.7 billion
Sales growth at comparable structure and constant exchange rates: + 9.7%
REAL INTERNAL GROWTH (RIG)
Selling price increases and others
Acquisitions minus divestitures
Variation of exchange rates- 4.7%
5.3%
- 1.0%
4.4%
+ 4.0%
TTS 0
928.02.2002/Conf.call
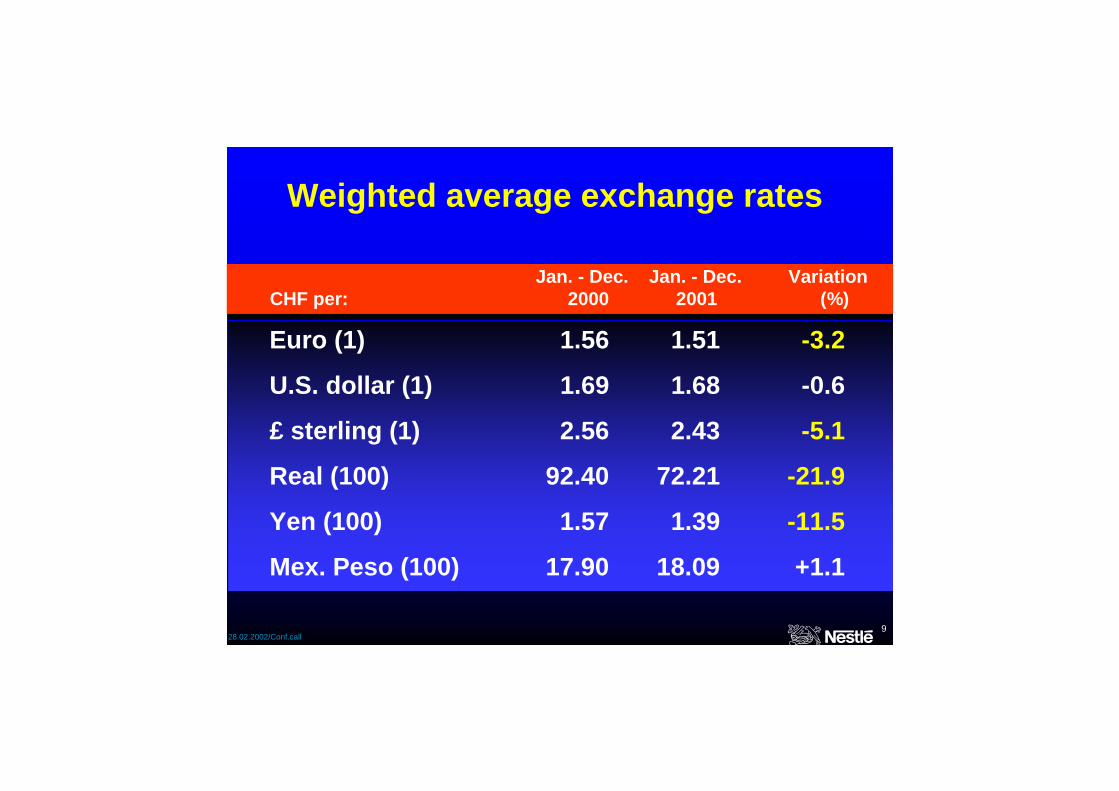
Euro (1) 1.56 1.51 -3.2
U.S. dollar (1) 1.69 1.68 -0.6
£ sterling (1) 2.56 2.43 -5.1
Real (100) 92.40 72.21 -21.9
Yen (100) 1.57 1.39 -11.5
Mex. Peso (100) 17.90 18.09 +1.1
Weighted average exchange rates
Jan. - Dec. Jan. - Dec. Variation CHF per: 2000 2001 (%)

1028.02.2002/Conf.call
Sales and profitability by management responsibilities and geographic area
FoodEurope 26.3 2.75 10.5 26.7 2.78 10.4Americas 25.5 3.50 13.7 26.6 3.53
13.3AOA 15.7 2.67 17.0 15.5 2.60 16.8
Other 13.9 2.02 14.5 15.9 2.15 13.5* Calculation based on non-rounded figures for sales. The % variations are influenced not only by the
evolution of sales volumes, but also by acquisitions and divestitures, exchange rate fluctuations,and changes in selling prices.
# 2001 % margin negatively impacted by TTS review
2000 2001 CHF bio. Sales Profit Margin* Sales Profit Margin*#
% %
1128.02.2002/Conf.call
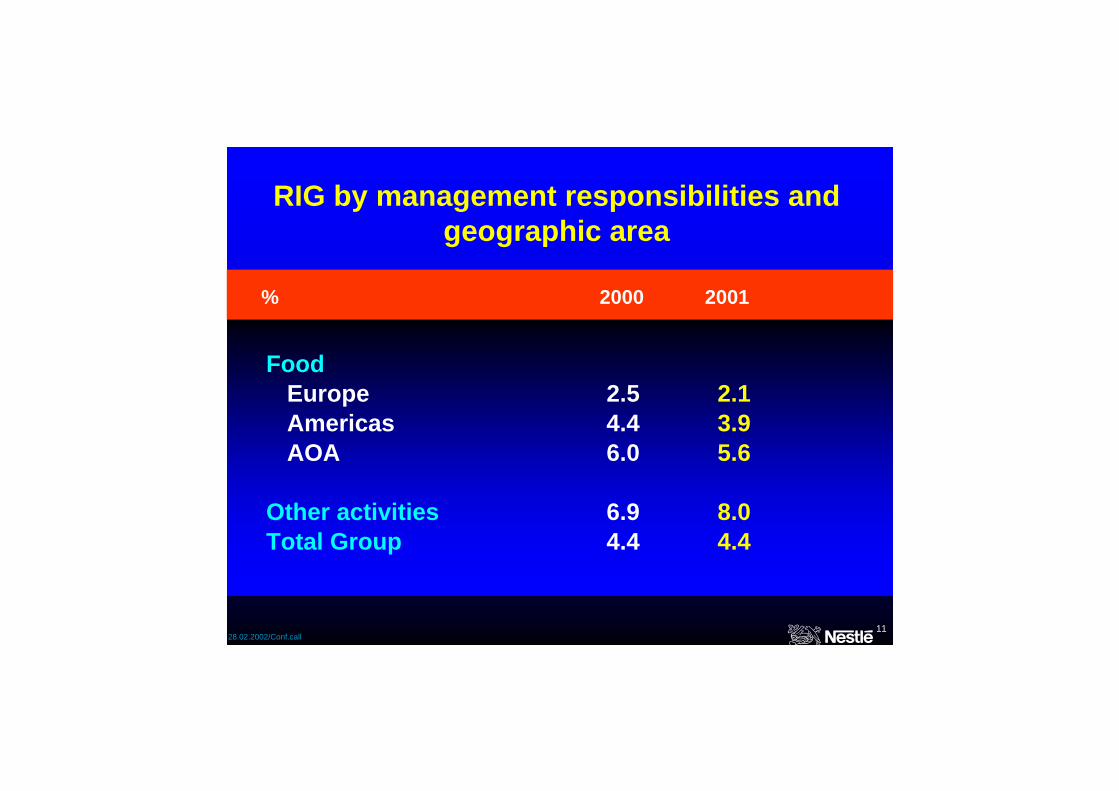
RIG by management responsibilities and geographic area
FoodEurope 2.5 2.1Americas 4.4 3.9AOA 6.0 5.6
Other activities 6.9 8.0Total Group 4.4 4.4
% 2000 2001
1228.02.2002/Conf.call
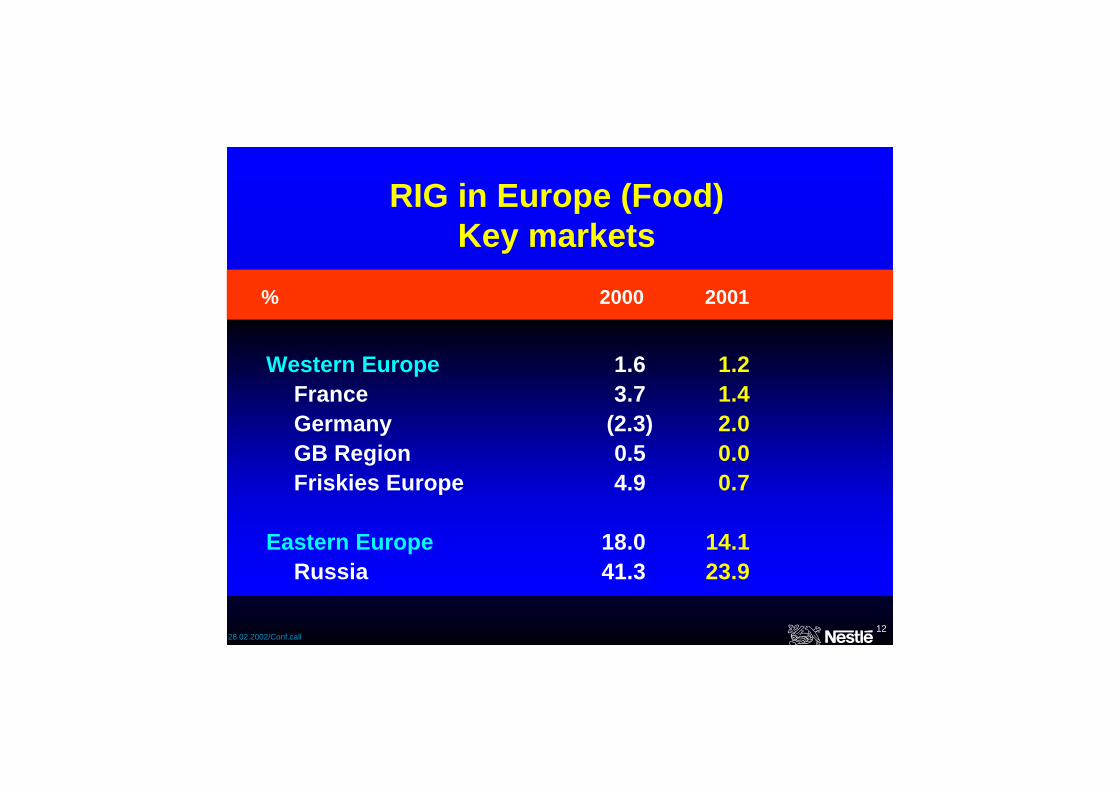
RIG in Europe (Food)Key markets
Western Europe 1.6 1.2France 3.7 1.4Germany (2.3) 2.0GB Region 0.5 0.0Friskies Europe 4.9 0.7
Eastern Europe 18.0 14.1Russia 41.3 23.9
% 2000 2001
1328.02.2002/Conf.call
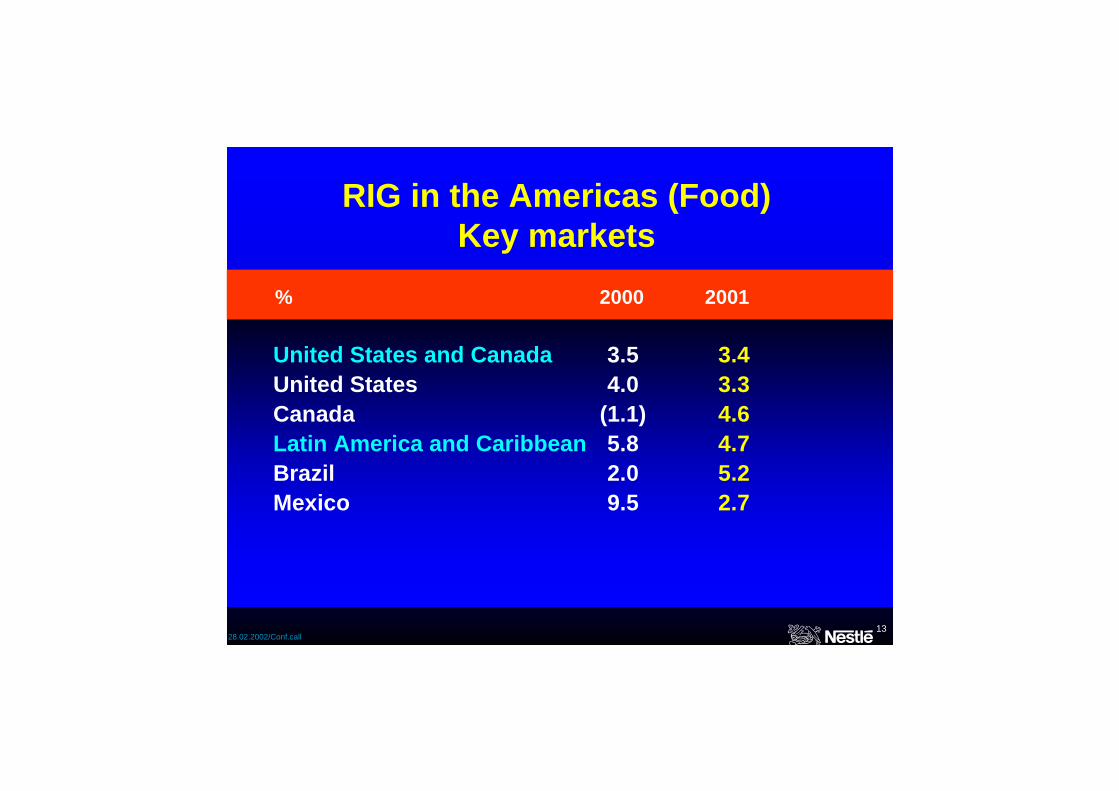
RIG in the Americas (Food)Key markets
United States and Canada 3.5 3.4United States 4.0 3.3Canada (1.1) 4.6Latin America and Caribbean 5.8 4.7Brazil 2.0 5.2Mexico 9.5 2.7
% 2000 2001
1428.02.2002/Conf.call
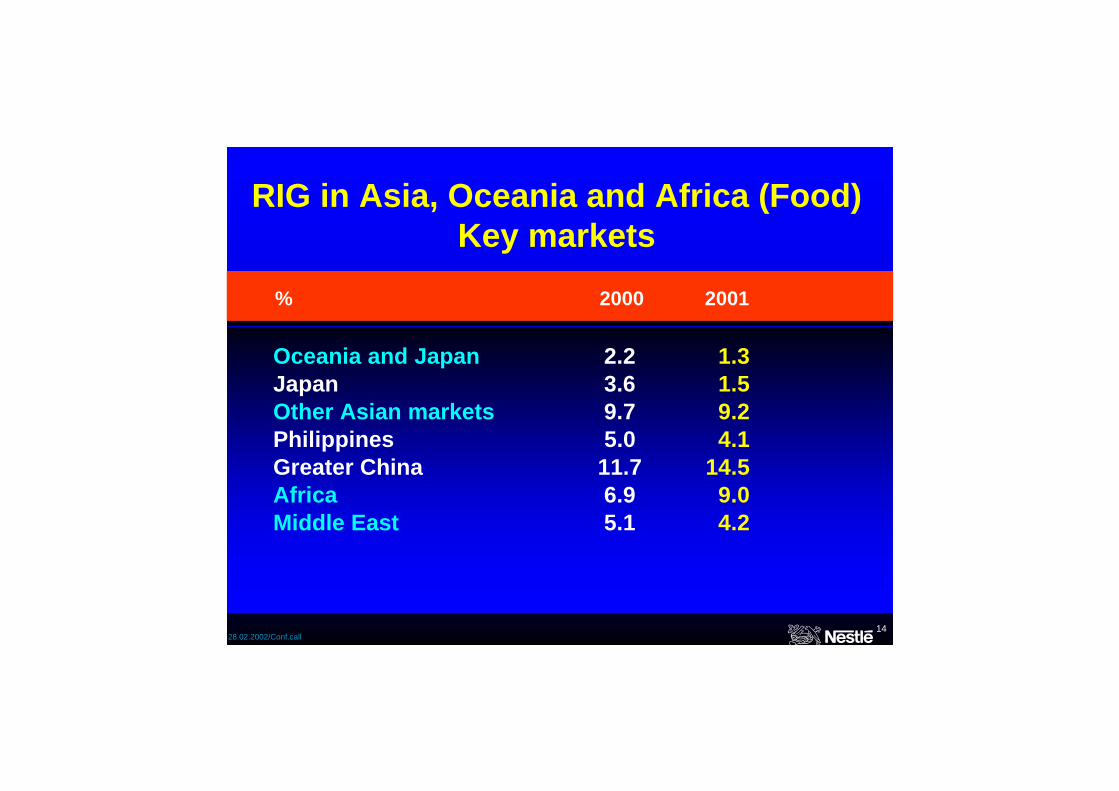
RIG in Asia, Oceania and Africa (Food)Key markets
Oceania and Japan 2.2 1.3Japan 3.6 1.5Other Asian markets 9.7 9.2Philippines 5.0 4.1Greater China 11.7 14.5Africa 6.9 9.0Middle East 5.1 4.2
% 2000 2001

1528.02.2002/Conf.call
RIG in Mineral Water (CHF 8.9 bio.)
United States (Bottled) 10.0 16.3Europe 2.2 2.2Asia 16.2 27.5Total Water (excl. Trinks) 5.4 9.1
Trinks 6.6 (1.3)Total Water (incl. Trinks) 5.7 7.1
% 2000 2001

1628.02.2002/Conf.call
RIG in Alcon and JVs
Alcon (CHF 4.6 bio) 7.1 9.2
Joint Ventures (CHF 1.2 bio) 8.2 8.2Galderma 15.7 6.1CPW 4.7 9.3
% 2000 2001

1728.02.2002/Conf.call
Sales and profitability by product group
Beverages 23.0 4.32 18.7 24.0 4.26 17.7
Milk products, 22.0 2.62 11.9 23.0 2.57 11.2nutrition, ice cream
Prep. dishes... 20.6 1.95 9.4 21.3 2.03 9.5& petcare
Chocolate, 11.0 1.17 10.6 11.2 1.23 11.0confect. & bisc.
Pharmaceutical 4.8 1.21 25.3 5.2 1.26 24.4
2000 2001 CHF bio. Sales Profit Margin* Sales Profit Margin *#
% %
* Calculation based on non-rounded figures for sales. The % variations are influenced not only by the evolution of sales volumes, but also by acquisitions and divestitures, exchange rate fluctuations, and changes in selling prices.# 2001 % margin negatively impacted by TTS review
1828.02.2002/Conf.call
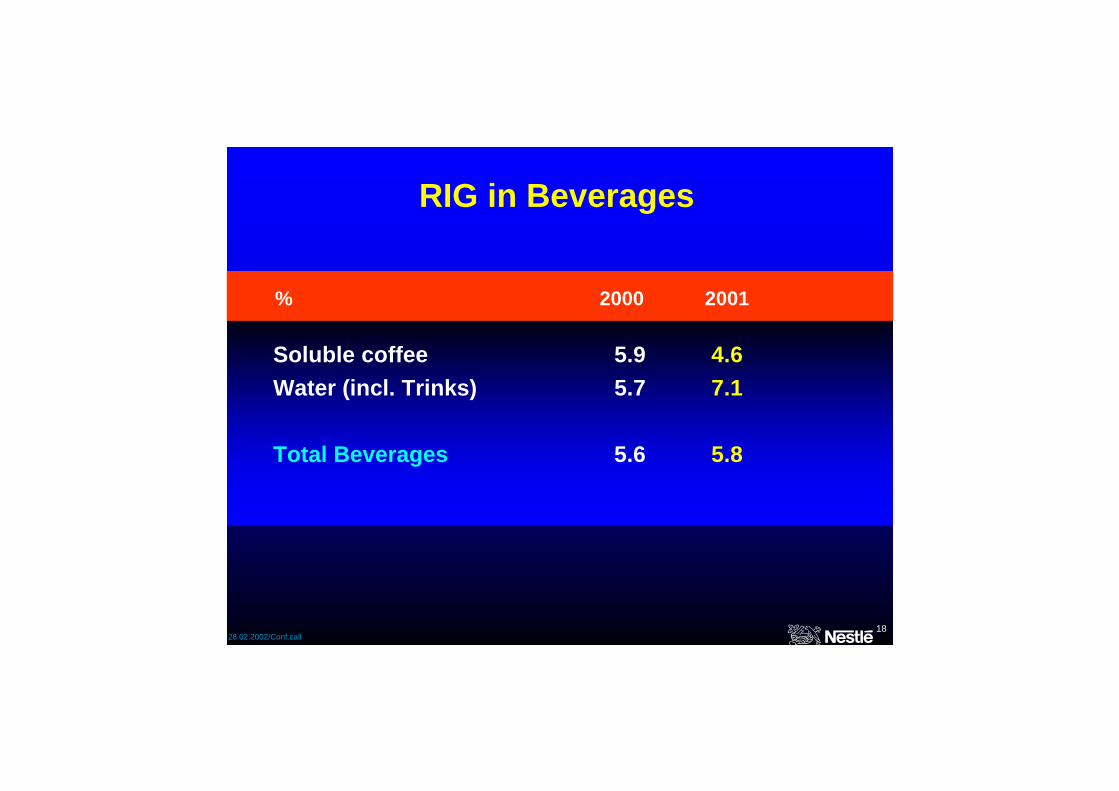
RIG in Beverages
Soluble coffee 5.9 4.6Water (incl. Trinks) 5.7 7.1
Total Beverages 5.6 5.8
% 2000 2001
1928.02.2002/Conf.call
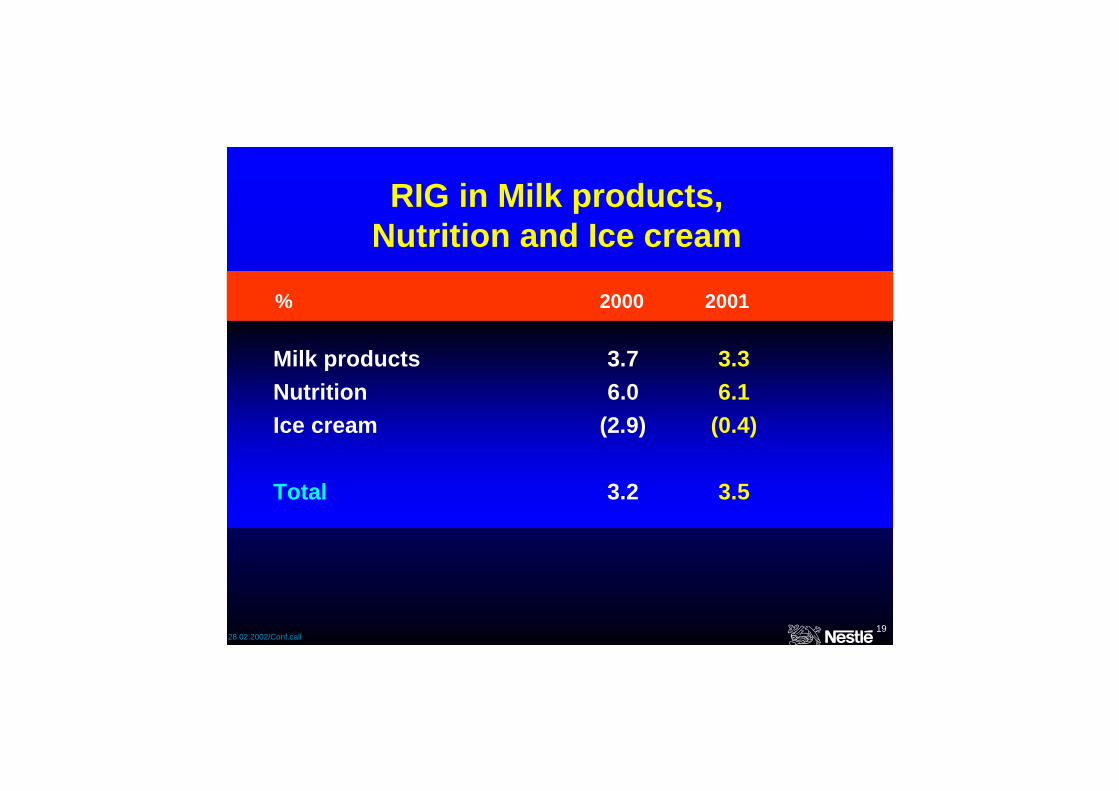
RIG in Milk products,Nutrition and Ice cream
Milk products 3.7 3.3Nutrition 6.0 6.1Ice cream (2.9) (0.4)
Total 3.2 3.5
% 2000 2001

2028.02.2002/Conf.call
RIG in Prepared dishes,Cooking aids and Petcare
Frozen and chilled 6.9 4.2Culinary and others 2.7 4.1Petcare 2.4 0.1
Total 4.0 2.9
% 2000 2001
2128.02.2002/Conf.call
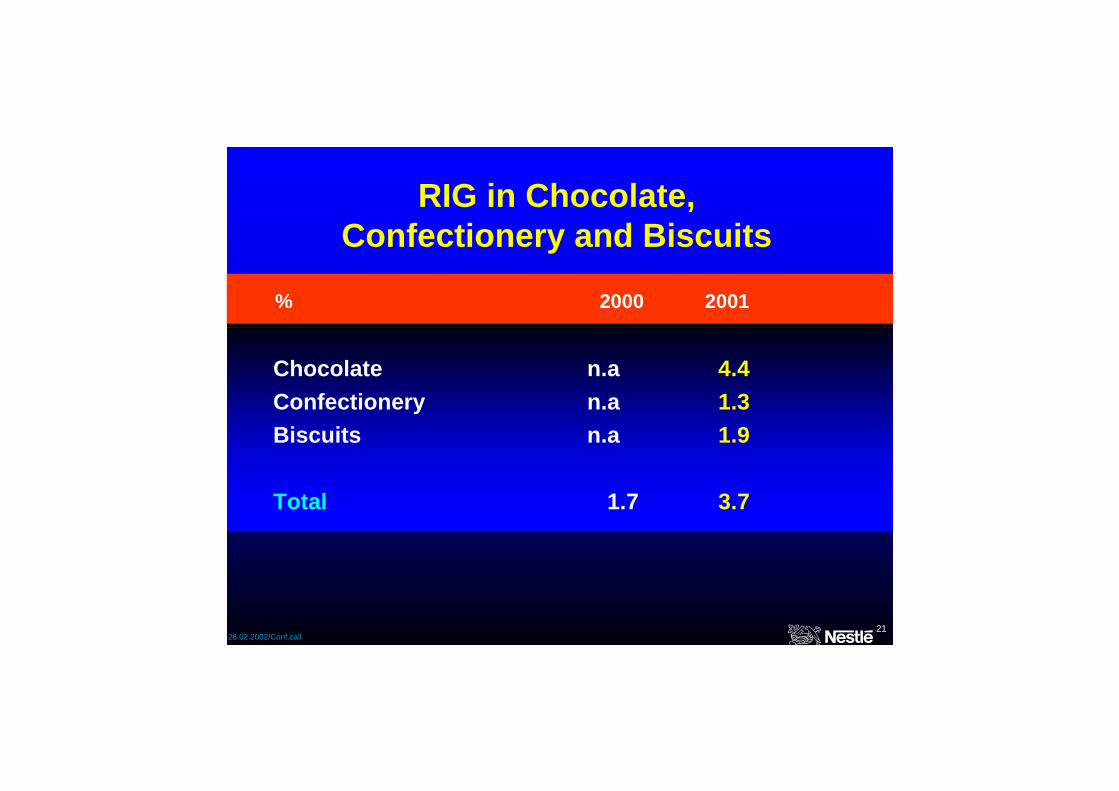
RIG in Chocolate,Confectionery and Biscuits
Chocolate n.a 4.4Confectionery n.a 1.3Biscuits n.a 1.9
Total 1.7 3.7
% 2000 2001

2228.02.2002/Conf.call
RIG in FoodServices
FoodServices 8.7 2.4
% 2000 2001
2328.02.2002/Conf.call
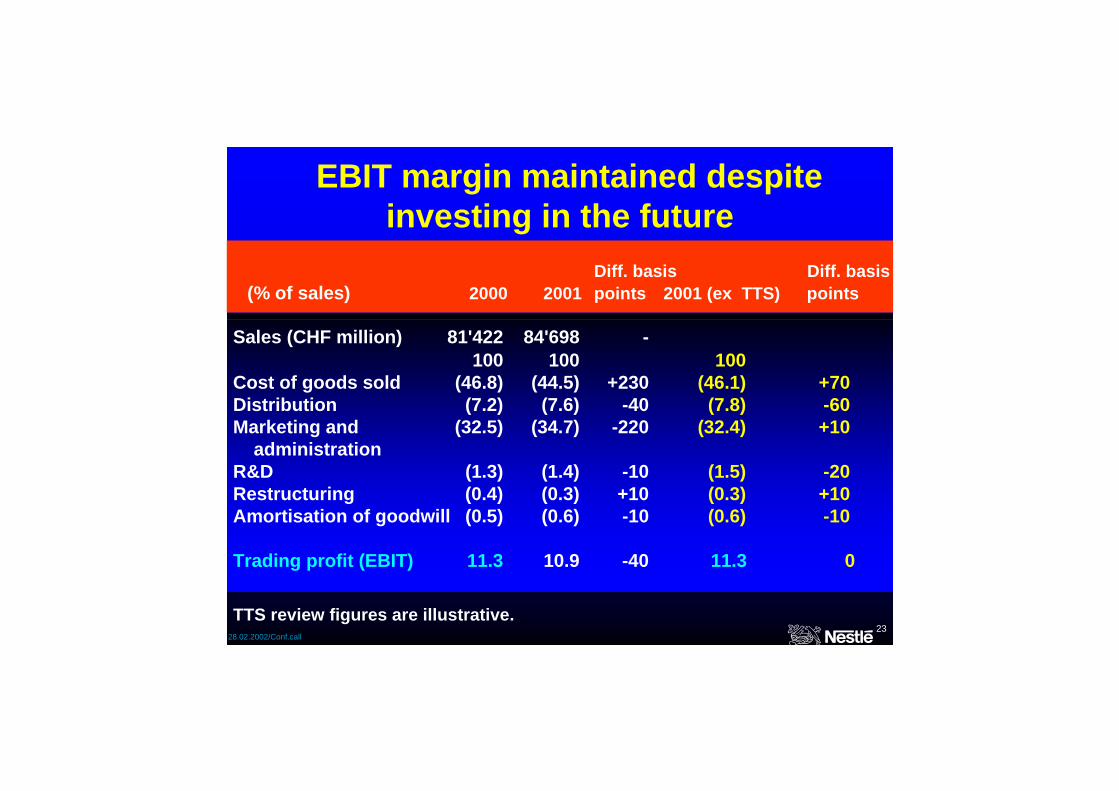
Sales (CHF million) 81'422 84'698 -100 100 100
Cost of goods sold (46.8) (44.5) +230 (46.1) +70Distribution (7.2) (7.6) -40 (7.8) -60Marketing and (32.5) (34.7) -220 (32.4) +10
administrationR&D (1.3) (1.4) -10 (1.5) -20Restructuring (0.4) (0.3) +10 (0.3) +10Amortisation of goodwill (0.5) (0.6) -10 (0.6) -10
Trading profit (EBIT) 11.3 10.9 -40 11.3 0
EBIT margin maintained despite investing in the future
Diff. basis Diff. basis(% of sales) 2000 2001 points 2001 (ex TTS) points
TTS review figures are illustrative.

2428.02.2002/Conf.call
Marketing investment continues -administrative costs fall
ActualCHF bio. % change %of sales
2000 2001 2000 2001
Marketing expenses 19.5 22.7 16.4 23.9 26.8excl. TTS review 19.5 19.9 2.0 23.9 24.2
Administration 7.0 6.7 (4.1) 8.6 7.9
TTS review figures are illustrative. Calculations based on non-rounded figures

2528.02.2002/Conf.call
Net profit - major improvement
Trading profit (EBIT) 11.3 10.9 -40 11.3 0
Net financing cost (0.9) (0.5) +40 (0.5) +40Net non-trading expenses (0.1) (0.1) (0.1)Taxes (3.4) (2.8) +60 (3.0) +40Outside interests (0.3) (0.2) +10 (0.2) +10Associated companies 0.5 0.6 +10 0.7 +20Net profit 7.1 7.9 +80 8.2 +110
Tax as % of pre-tax profit 33.1 27.7 +540
Diff. basis Diff. basis(%of sales) 2000 2001 points 2001 (ex TTS) points
TTS review figures are illustrative. Calculations based on non-rounded figures.

2628.02.2002/Conf.call
Agenda
Key achievements & figures Income statementCash flowBalance sheetUse of funds
2728.02.2002/Conf.call
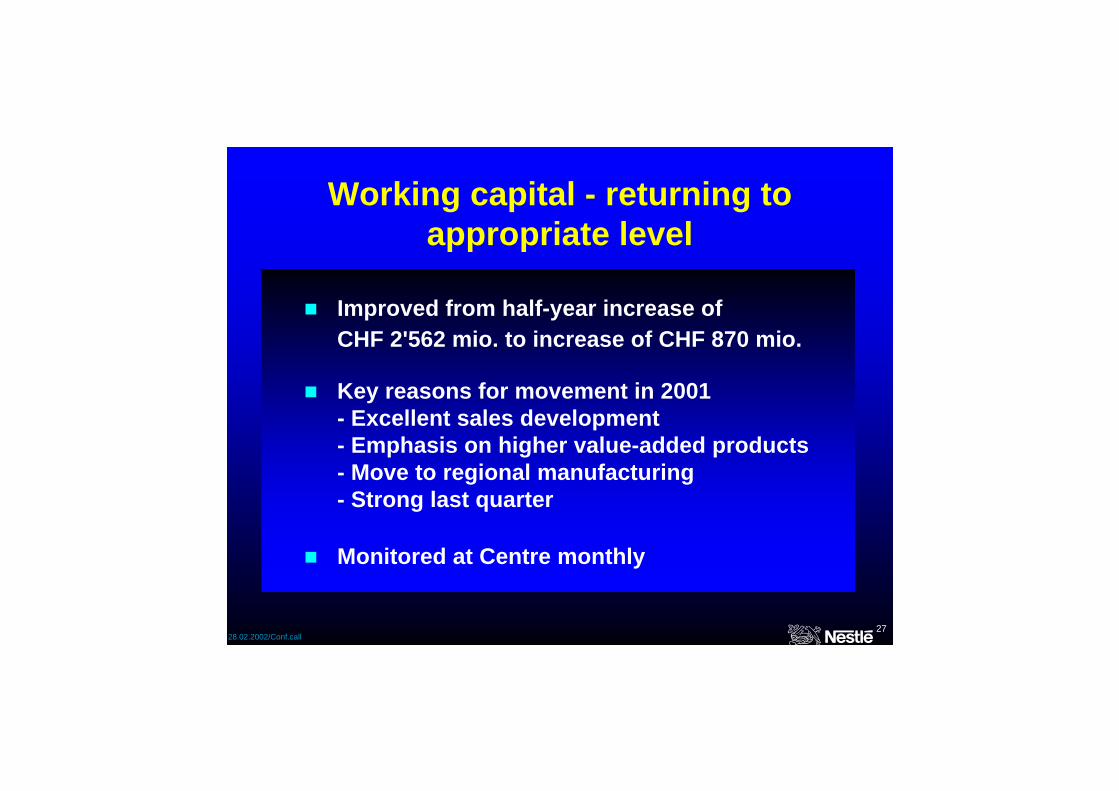
Improved from half-year increase of CHF 2'562 mio. to increase of CHF 870 mio.
Key reasons for movement in 2001- Excellent sales development- Emphasis on higher value-added products- Move to regional manufacturing- Strong last quarter
Monitored at Centre monthly
Working capital - returning to appropriate level

2828.02.2002/Conf.call
Healthy cash flow
9172691 4390 3706
5501 5599 4938
0
2000
4000
6000
8000
10000
1995 1996 1997 1998 1999 2000 2001
Free cash flow Operating Cash Flow (OCF)
CHF mio.
3839
5633
74016372
81878851 8614

2928.02.2002/Conf.call
Agenda
Key achievements & figures Income statementCash flowBalance sheetUse of funds

3028.02.2002/Conf.call
Gross tangible fixed assets 43'519 45'093
Less : accumulated depreciation (24'894) (25'195)
Net tangible fixed assets 18'625 19'898
Tangible fixed assets
CHF mio. 31.12.2000 31.12.2001

3128.02.2002/Conf.call
Return on average allocated assets*
FoodEurope 20.2 21.9Americas 33.6 32.9Asia, Oceania and Africa 38.7 37.7
Other activities 26.6 25.9
* Per Note 1 "Segmental information"
% 2000 2001
3228.02.2002/Conf.call
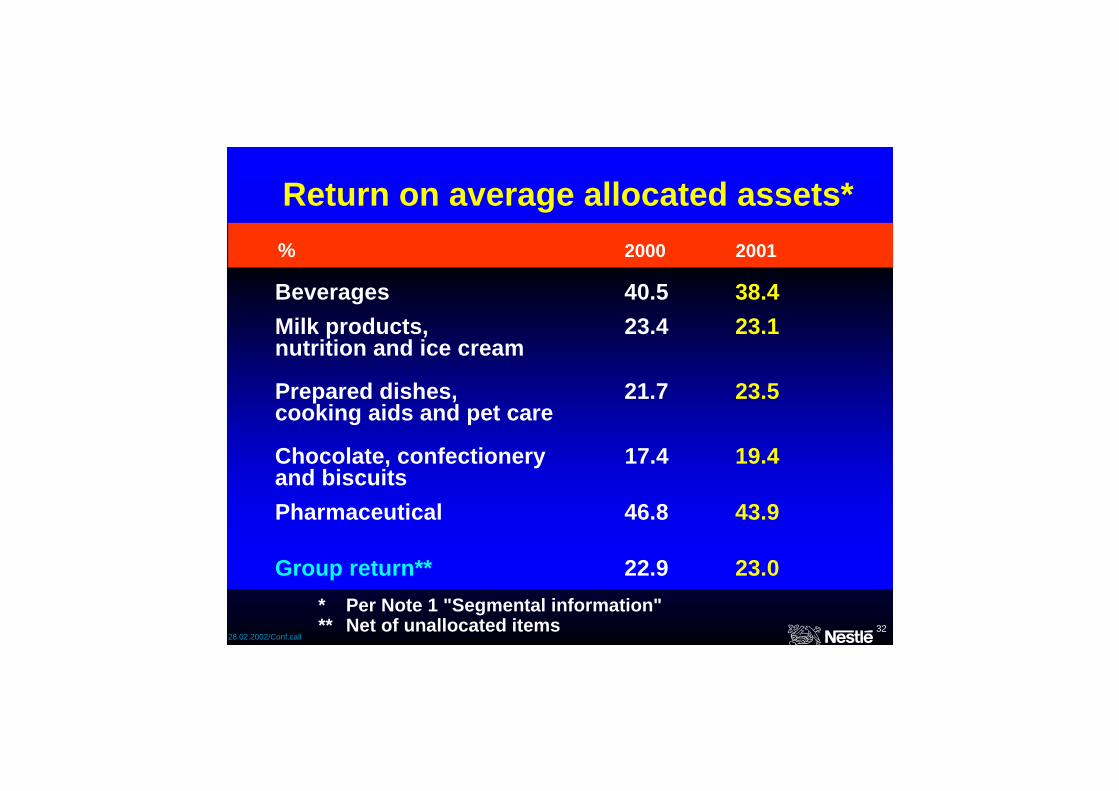
Return on average allocated assets*
* Per Note 1 "Segmental information"** Net of unallocated items
Beverages 40.5 38.4Milk products, 23.4 23.1nutrition and ice cream
Prepared dishes, 21.7 23.5cooking aids and pet care
Chocolate, confectionery 17.4 19.4and biscuitsPharmaceutical 46.8 43.9
Group return** 22.9 23.0
% 2000 2001

3328.02.2002/Conf.call
Agenda
Key achievements & figures Income statementCash flowBalance sheetUse of funds

3428.02.2002/Conf.call
AcquisitionsRalston Purina US Petcare 5.0 bio.Ice Cream Partners US Ice cream 1.1 bio.Water Eur, AOA,AMS Retail & Home 400 mio.
and officeDivestitures
Minag Germany Water 250 mio.David & Sons US Confectionery 160 mio.
Major acquisitions and divestments in 2001
Annual salesCompany Country Business (CHF)

3528.02.2002/Conf.call
The Ralston Purina transaction
Has added net debt of USD 10.3 bio. (CHF 17.3 bio. at 1.68 CHF vs. USD)
Favourable impact on WACC

3628.02.2002/Conf.call
Capital expenditure supports growth
25382815
3191 3093 3029 3056 30543261
2806
33053611
3061
4.34.15.5 5.6 5.9 5.4 5.3 5.4 5.0 4.7 4.3 3.8
0
500
1000
1500
2000
2500
3000
3500
4000
1990 1991 1992 1993 1994 1995 1996 1997 1998 1999 2000 20010
5
10
15
CHF mio. % of sales

3728.02.2002/Conf.call
Net indebtedness* up"AAA" maintained
* Total financial liabilities minus liquid assets.Liquid assets do not include the carrying value of treasury shares(CHF 2.8 bio. at year-end 2001)
CHF billion
H1 H2 H1 H2 H1 H2 H1 H21998 1999 2000 2001
6.03.0
6.69.5
6.2 5.2
19.4
9.1
0
4
8
12
16
20
24

3828.02.2002/Conf.call
Capital gain on partial IPO of Alcon (no material impact on taxes expected)
Realignment of the Group's Petcare assets to realise announced synergies, including US Distribution Network
Rationalisation of asset base triggered by increased globalisation and regionalisation of our businesses and implementation of Globe
Treatment of goodwill amortisation currently under review by IAS
Non recurring events anticipated for 2002
