full-year report 2017 - asx · profit after tax of $1.82 million for the year ended 30 june 2017....
TRANSCRIPT

Full-Year Report 2017 Financial Year Ended 30 June 2017
(Previous corresponding period: financial year ended 30 June 2016)
For
per
sona
l use
onl
y

Delivering emergency medical solutions dedicated to improving patient outcomes
For
per
sona
l use
onl
y

Annual Financial Report 2017 1
Full-Year Report 2017 Financial Year Ended 30 June 2017
(Previous corresponding period: financial year ended 30 June 2016)
For
per
sona
l use
onl
y
Medical Developments International Limited2
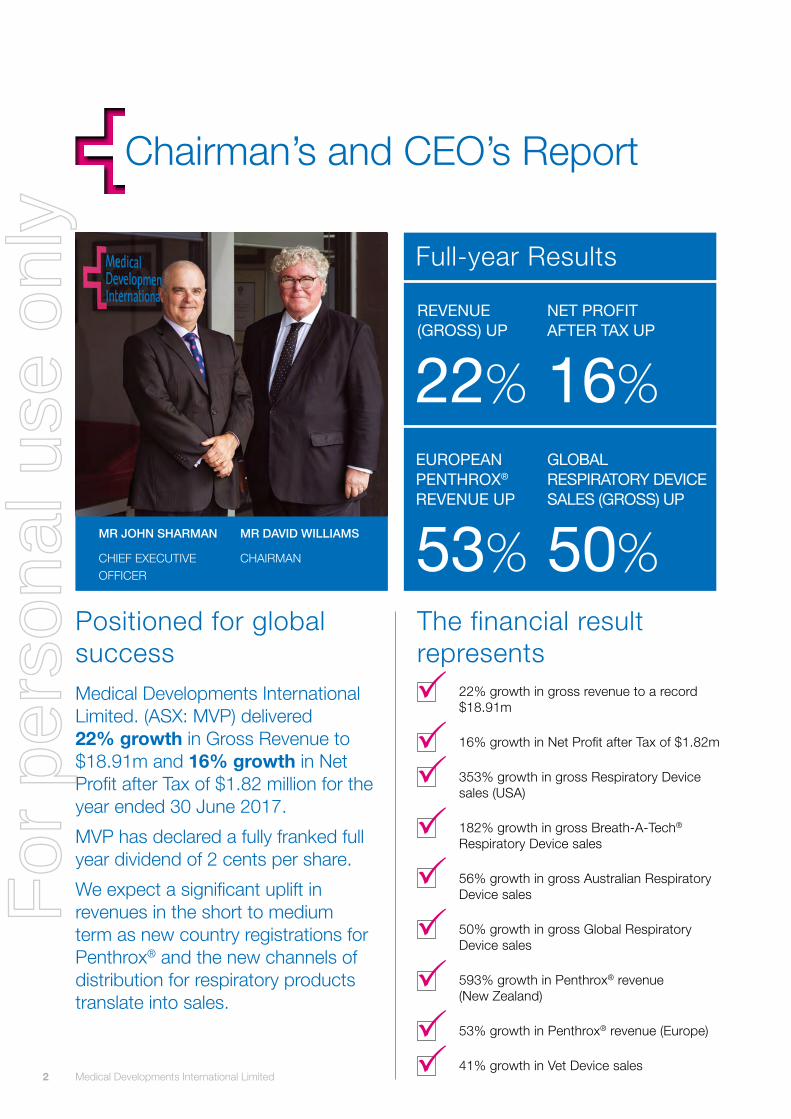
MR DAVID WILLIAMS
CHAIRMAN
MR JOHN SHARMAN
CHIEF EXECUTIVE OFFICER
Chairman’s and CEO’s Report
Positioned for global success Medical Developments International Limited. (ASX: MVP) delivered 22% growth in Gross Revenue to $18.91m and 16% growth in Net Profit after Tax of $1.82 million for the year ended 30 June 2017.
MVP has declared a fully franked full year dividend of 2 cents per share.
We expect a significant uplift in revenues in the short to medium term as new country registrations for Penthrox® and the new channels of distribution for respiratory products translate into sales.
The financial result represents
22% growth in gross revenue to a record $18.91m
16% growth in Net Profit after Tax of $1.82m
353% growth in gross Respiratory Device sales (USA)
182% growth in gross Breath-A-Tech® Respiratory Device sales
56% growth in gross Australian Respiratory Device sales
50% growth in gross Global Respiratory Device sales
593% growth in Penthrox® revenue (New Zealand)
53% growth in Penthrox® revenue (Europe)
41% growth in Vet Device sales
22% 16%
53% 50%
REVENUE (GROSS) UP
NET PROFIT AFTER TAX UP
EUROPEAN PENTHROX® REVENUE UP
GLOBAL RESPIRATORY DEVICE SALES (GROSS) UP
Full-year Results
For
per
sona
l use
onl
y

Annual Financial Report 2017 3
The future of MVPOur ambition is to make Penthrox® a main stream analgesic of choice around the world and our Respiratory Devices global leaders in their field.
Over the next 12 months we expect to:
• Have Penthrox® approved for sale in more than 37 countries arround the world;
• Begin production in our manufacturing facility;
• Conclude additional distribution partnerships for Penthrox® and Respiratory Devices for new countries;
• Advance work on producing new manufacturing technologies for small molecule pharmaceuticals; and
• Continue our clinical program focussed on:
• gathering the clinical data needed to open an IND and submit a ‘New Drug Application’ to the Food & Drug Administration in the USA; and
• extending the indication for use of Penthrox® globally.
Over the next few years our global market approvals and ‘indication extensions’ are expected to deliver strong growth for our company. We are targeting new market approvals in 22 European countries over the next 6 months and 37 new countries in total over the next 12 months. In addition, we expect to have completed our pre-clinical work and opened our IND in the USA. Our planned launches for Penthrox® are detailed below.
Our initiative to develop new production technologies is progressing as well as we could have hoped for and we have identified three potential products so far which we think will deliver value to shareholders.
We have an increasing portfolio of submitted Patent Applications protecting Penthrox® and our manufacturing technology which, of itself, should revolutionise the way we make Penthrox® in the future.
Our work to get Penthrox® approved for sale in the USA is progressing on schedule. Our clinical program has begun and we had an excellent meeting with the FDA in May, which has given us renewed confidence. In our view, Penthrox® has the capability to be a significant ‘non opioid’ analgesic across the USA.
Our portfolio of respiratory devices is growing and we are delivering good sales growth. The opportunities across the world for our respiratory devices, and especially in the USA in the shorter term, are significant. We are well on the way to delivering on these expectations.
We look forward to reporting our progress and successes.
“These results are ahead of the significantgrowth in new country
registrations expected in the short term and US market
penetration of our respiratory products.”
Penthrox launch and planned launch milestones
LaunchandPlannedLaunchMilestones
3
2020PlanLaunch:§ USA
2020PlanLaunch:§ Russia
Pre2000 2010 2015 2020
2014Launched:§ South
Africa
2016Launched:§ Ireland§ UAE§ UK
2017PlanLaunch:
§ France§ Belgium§ Mexico§ Taiwan§ Jordan§ Iraq
1975Launched:§ Australia
2010Launched:§ Azerbaijan§ Georgia§ Ukraine
2011Launched:§ Guatemala
2011Launched:§ Kazakhstan
2002Launched:§ New Zealand
2009Launched:§ Moldova
2015Launched:§ Singapore
2018&2019PlanLaunch:§ Canada§ Germany§ Italy§ Spain§ Switzerland§ Portugal§ Austria§ SouthKorea§ Netherlands§ Denmark§ Luxemburg§ Czech
Republic§ Poland§ Hungary§ Slovakia§ Macedonia§ Albania§ Montenegro§ Kosovo
2018&2019PlanLaunch:§ Slovenia§ Croatia§ Serbia§ Greece§ Malta§ Norway§ Sweden§ Liechtenstein§ Monaco§ SaudiArabia§ SanMarino§ Bosnia§ VaticanCity§ Herzegovina§ Andorra
Penthrox® launch and planned launch milestones
For
per
sona
l use
onl
y

Medical Developments International Limited4
Key Achievements for FY17
First sales of Penthrox® in France and Belgium
Second shipment of Penthrox® sold into France, UK and Ireland
National Reimbursement of Penthrox® in France
Progress towards regulatory approval for Penthrox® in 22 European countries
Regulatory approval in the UAE
Regulatory approval and first sales in Taiwan
Distribution deal signed with Purdue Pharma in Canada
Distribution deal signed with BL&H Co Ltd Corporation in Korea
Distribution deal signed with Lancet in Russia
Received upfront payments from Korea and Canada
Registration underway for Penthrox® to be approved in Canada
Two new Global Patent Applications for Penthrox® Inhalers
Enrolled first patient in Penthrox® Post Authorisation Safety Study in Europe
Launched Paediatric trial in the United Kingdom and Ireland
Commenced pre-clinical and clinical work for FDA approval
Commenced pre-clinical and clinical work for Penthrox® indication extensions
Regulatory submissions ongoing in Saudi Arabia, Hong Kong, Mexico, South Korea, Iraq and Jordon
Further regulatory submissions expected for another 20+ countries in the next 12 months
Penthrox®
Achieved reimbursement status from insurance companies across the USA
Launched Space Chamber Plus® range into circa 11,000 pharmacies in the USA
353% growth in gross Respiratory Device revenue (USA)
Global sales growth of 50% (gross)
Record sales and continued growth for Australia’s number 1 brand: Breath-A-Tech®
Sales growth of 32% in UK and Europe
Sales growth of 23% in New Zealand
Patent Application for new respiratory device
Launch of six new respiratory products
Respiratory Medical Devices
For
per
sona
l use
onl
y

Annual Financial Report 2017 5
Construction of Global Penthrox® Manufacturing Facility in Scoresby completed on time and on budget
Improvement in manufacturing costs and efficiency
Debt free
Received R&D Tax Incentive concession of $245,000
Signed deal with the CSIRO to develop new manufacturing technologies
Continued investment in clinical development programs and trials
MVP has 9 Patent and Patent applications
MVP has Trademarks in over 30 countries
Ongoing fully franked interim and full year dividends
Other
Penthrox® DevelopmentsPenthrox® was launched in the French and Belgium markets in February 2017 and feedback from these markets is very positive. These launches were milestone events and in preparation for the launches, MVP received and delivered its largest ever single order for Penthrox®. Since launch, MVP has delivered its second order for the French market.
In the UK and Ireland, our distributor is making good progress and in June 2017, MVP supplied its second order post launch in the UK and Ireland. Galen continue to grow Penthrox® sales into hospitals in the UK and Ireland. 56 hospitals have now approved Penthrox® into formulary listing and are using the product. These include six of the eleven Major Trauma Centres in the UK and we expect another to approve the use of Penthrox® in the coming months.
The guidelines for the use of Penthrox® in Ambulance services throughout Ireland were approved by PHECC in May. Penthrox® is available for use in all Ambulance Services in Ireland and will be rolled out across the country once training of Emergency Medical Technicians, Paramedics and Advanced Paramedics is completed which is expected before the end of the year.
The Joint Royal College Ambulance Liaison Committee (‘JRCALC’) is expected to issue updated pain management guidelines by October. Penthrox® is expected to be listed in these guidelines for all ambulance services. Our distributor has advised us that four Ambulance Trusts are already actively engaging in protocol assessments for the use of Penthrox® in anticipation of the guideline listing for Penthrox®.
Our target is to achieve formulary approval in 160 hospitals. It is estimated that 60% of trauma cases in the UK are seen by the top 30% of hospitals. The below tables highlight our progress.
Penthrox®UK and Ireland formulary approvals
Feb-16 Feb-17 Feb-18 Feb-17 Mar-17 Apr-17 May-17 Jun-17 Jul-17Aug-16 Aug-170 0
2020
34
56
2720
45
70
95
120
145
63
80
100
126
143
79
40
60
80
100
120
140
160
Hos
pita
l For
mul
arie
s
No.
of C
usto
mer
s
Target Formulary approvals
Target formulary approvalwithin the next three months
Formulary approval obtained
Penthrox® UK and Ireland formulary approval
Penthrox®UK and Ireland formulary approvals
Feb-16 Feb-17 Feb-18 Feb-17 Mar-17 Apr-17 May-17 Jun-17 Jul-17Aug-16 Aug-170 0
2020
34
56
2720
45
70
95
120
145
63
80
100
126
143
79
40
60
80
100
120
140
160
Hos
pita
l For
mul
arie
s
No.
of C
usto
mer
s
Target Formulary approvals
Target formulary approvalwithin the next three months
Formulary approval obtained
Penthrox® French Customers
For
per
sona
l use
onl
y

Medical Developments International Limited6
Penthrox® is making excellent progress in France. In market sales and formulary approvals are growing at a much quicker rate than the UK, where the formulary approval process is long and arduous. We summarise the progress our partner is making in France as follows:
• They are targeting formulary approval in 350 hospitals
• They have already submitted 250 formulary applications
• They have achieved 99 formulary approvals in France
• They have 21 rejected formulary applications
• 143 hospitals have ordered Penthrox® in France
• About 50% of customers who have ordered Penthrox® have already re-ordered
We are confident Penthrox® will be a very significant drug in France and more importantly, we are confident our partners in Europe are well placed to deliver aggressive sales growth over the coming years.
In November 2016 MVP’s European Partner submitted an application to the United Kingdom’s Medicines & Healthcare products Regulatory Agency (MHRA) under the Decentralised Procedure to have Penthrox® approved for sale in Germany, Italy, Spain, Sweden, Switzerland, Finland, Austria, Denmark, Poland, Portugal, Bulgaria, Croatia, Cyprus, Czech Republic, Estonia, Latvia, Lithuania, Luxemburg, Romania, Slovakia and Slovenia. We are currently ahead of our target dates and have responded in full to the questions raised by the regulatory agencies as part of the day 105 ‘stop clock’. We do not expect any further issues to be raised from here and the approval and
closure of the decentralised procedure is expected before the end of calendar year 2017. National approvals for the sale of Penthrox® will follow for each country and sales are expected to commence during H2 FY18.
In addition, ‘National Regulatory Applications’ are expected to be filed with the relevant agencies in the Netherlands, Greece, Macedonia, Serbia, Albania, Liechtenstein, Montenegro, Kosovo, San Marino, Vatican City, Bosnia and Herzegovina, Andorra and Monaco in due course. Approvals to sell Penthrox® in these countries are expected during FY18 and beyond.
Elsewhere in the world our regulatory submissions to Mexico, Iran, Hong Kong, Saudi Arabia, Iraq, Jordan and Korea are progressing.
In all, MVP is working towards approvals to sell Penthrox® in another 37 countries over the next 12 to 18 months.
MVP finalised licensing and distribution deals in Korea and Canada during the half year and received milestone payments. A new licensing and distribution deal was also signed in Russia in April 2017.
Penthrox® sales to New Zealand grew 593% stemming from the decision during the year by New Zealand’s leading provider of Ambulance Services, St John Ambulance, to change their clinical practice and guidelines such that “Entonox (Nitrous Oxide) was discontinued with Penthrox® the sole inhaled analgesic administered”.
Penthrox® was approved for sale by the Food and Drug Administration in Taiwan and we made our first sale into Taiwan in March 2017.
Table 2
Expected approvals for Penthrox® over the next 12 to 18 months
Czech Republic PolandSlovakiaMacedoniaAlbaniaMontenegroKosovoSloveniaCroatiaSerbiaGreeceMaltaNorwayAndorraItaly Germany Sweden SwitzerlandMexico
PortugalSpain Saudi Arabia Hong KongJordanIraqCanadaAustriaSouth KoreaNetherlandsDenmarkLuxemburgLiechtensteinMonacoSan MarinoBosniaVatican CityHerzegovina
Expected approvals for Penthrox® over the next 12 to 18 months
For
per
sona
l use
onl
y

Annual Financial Report 2017 7
United States of America
Recent developments in the USA around opioid addiction and abuse make the clinical need and market opportunity for Penthrox® very attractive. Given the public and legislative bias expressed by the USA government and its Food Drug Administration (FDA) against the use of opioids, Penthrox® as a non-opioid / non-narcotic, fast acting, safe, easy to
use, store and administer acute pain drug offers an attractive alternative.
In May 2017, MVP met with the FDA to discuss and confirm our proposed regulatory program designed to have Penthrox® approved for sale in the USA. That meeting was very positive and MVP now has a clear understanding of the support and requirements the FDA has in terms of approving Penthrox® for sale in the USA. MVP is proceeding with its development program comprising a number of clinical and non-clinical studies. The clinical and non-clinical work in several cases repeats work done and we are confident the data collected will reconfirm what we already know and what has already been accepted previously by various regulators in Europe and elsewhere in the world.
We estimate the work needed to submit a New Drug Application (NDA) in the USA will be completed within two and a half years, at a cost of $US15 million.
Most importantly, we expect to submit our application to have our Investigational New Drug applications accepted early in calendar year 2018.
We are also planning to submit a ‘Fast Track’ application to the FDA at the time of our IND submission. The ‘Fast Track’ application is a process designed to facilitate the development, and expedite the review of drugs to treat
serious conditions and fill an unmet medical need in the USA. The purpose is to get important new drugs to the patient earlier. After our meeting at the FDA we are of the view that a Fast Track application to get Penthrox® approved in the USA is appropriate.
The program of work and timeframes (excluding any Fast Track) is illustrated below:
Respiratory DevelopmentsOur respiratory device business continues to grow strongly. Overall gross revenue from respiratory devices grew 50%.
Sales of respiratory devices in the Australian market grew 56% (gross), with our Breath-A-Tech® branded range of Space Chambers and respiratory products continuing to exceed expectations (up 182% yoy), reinforcing MVP as market leader in Australia.
Gross sales into the USA market grew 353% and we continue to build our business in that market. We incurred several ‘promotional and start up offer’ expenses during the year which we do not expect to continue. Since we finalised our distribution deals with McKesson, AmerisourceBergen and Cardinal Health, MVP’s Space Chamber Plus® range of devices and masks can be found in over 11,000 pharmacies across the USA. We completed ‘ranging’ deals in FY17 with each of Walmart, Kmart, Costco, Price Chopper, Sams Club and Independent Pharmacy Co-Op. These deals represent a critical ‘footprint’ within the USA retail pharmacy market. We expect additional pharmacy distribution deals over the next 12 months. We are well on the way to establishing ourselves as a major supplier of Respiratory Devices in the USA. We
Penthrox® clinical program for USAFuture of Penthrox®
2017 2018 2019 2020
IND Toxicology: - 2 by 28 Day Repeat Dose studies - General validation and assay studies to support existing data
FDA meeting
Safety Pharmacology: - General functional Observational Battery studies to support existing data
IND submissionto FDA
Repeat dose and dose rangingHealthy Volunteer Trial
FDA meeting
Phase III & NDAPharmacokinetics andToxicology Studies: - General studies to support existing data
Pre NDAmeetingwith FDA
Submit NDA toUS FDA
Launch In USA
FDA Approval
IND Pharmacokinetics: - General In Vitro studies to support existing data
Additional Phase III to supportexisting Phase III studies and data
Penthrox® clinical program for USA
For
per
sona
l use
onl
y

Medical Developments International Limited8
expect to deliver significant sales growth in that market in the years ahead.
Sales into Europe and the UK grew 32% and this region continues to make a significant contribution to the profits of our business.
Sales of respiratory devices to New Zealand grew 23%. This growth reflects consumers buying our medical devices outside of the fully rebated Pharmac reimbursement program and is testimony to the quality and performance of our products.
Clinical DevelopmentsMVP continues to invest heavily in our clinical and research programs. Our ambition is to extend the use of Penthrox® into Acute Pain applications including Surgical Procedures, Breakthrough Pain and ultimately Home Use. Together with our partners we have begun developing clinical programs to expand the indication for use of Penthrox® to acute pain procedures in the European Union. The benefit of this extension will be available to both our partners in Europe and, more importantly, it will provide essential clinical data to have the market opportunity for Penthrox® extended in jurisdictions worldwide. By way of example we believe the market for Surgical Procedures is bigger than the global opportunity for Penthrox® in Trauma Pain, our traditional market.
During the period, a number of important studies were completed and published or were ongoing including:
New publications:
• Gaskell AL, Jephcott CG, et al. Self-administered methoxyflurane for procedural analgesia: experience in a tertiary Australasian centre: Anaesthesia 2016;
• Frangos J, Mikkonnen A, et al. Derivation of an occupational exposure limit for an inhalation analgesic methoxyflurane (Penthrox®) Regulatory Toxicology and Pharmacology;
• Hey P, Shan J, et al. Inhaled methoxyflurane (Penthrox®) improves tolerability and success of nasogastric probe insertion for esophageal physiological studies: a pilot study. Journal of Gastroenterology and Hepatology 2016;
• Nguyen NQ, Burgess J, et al. Effects of Penthrox® on Psychomotor Function in Humans: Psychomotor and cognitive effects of 15-minute inhalation of methoxyflurane in healthy volunteers: implication for post-colonoscopy care A Randomized Placebo Trial. Endoscopy International Open 2016;
• Oxer H. Vital Signs Stability during Methoxyflurane Analgesia: Effects of Penthrox® (methoxyflurane) as an analgesic on cardiovascular and respiratory functions in
the pre-hospital setting. Journal of Military and Veterans’ Health 2016;
• Coffey F, Dissmann P et al. Methoxyflurane Analgesia in Adult Patients in the Emergency Department: A Subgroup Analysis of a Randomized, Double-blind, Placebo-controlled Study (STOP!). Adv Ther 2016;
• Blair HA and Frampton JE. Methoxyflurane: A Review in Trauma Pain. Clin Drug Investig 2016;
• Dayan A. Analgesic Use of Inhaled Methoxyflurane: Evaluation of its Potential Nephrotoxicity. Human and Experimental Toxicology 2015.
Completed study:
• Comparison of Inhalational Methoxyflurane (Penthrox®) And Intramuscular Tramadol for Prehospital Analgesia. (Singapore Emergency Ambulance Service). The trial found Penthrox® was superior to IM Tramadol in terms of analgesic efficacy and speed of onset as well as administration.
On-going studies:
• TRUS-biopsy: A phase III double-blind placebo-controlled randomised trial of methoxyflurane with periprostatic local anaesthesia to reduce the discomfort of transrectal ultrasound-guided prostate biopsy (Pain-Free TRUS B).
• PASS – A Post Authorisation Safety Study designed to track any adverse events to the users of Penthrox® in Europe. The study is scheduled to last two years and the data gathered will be extremely valuable in existing and prospective Penthrox® markets around the world.
• A randomised, double-blind, multicentre, placebo controlled study to evaluate the safety and efficacy of methoxyflurane (Penthrox®) for the treatment of acute pain in children and adolescents from 6 to less than 18 years of age (presenting to an Emergency Department with minor trauma) MEOF-002. This study is designed to be both European and USA compliant which if successful will extend the use of Penthrox® to the paediatric population in Europe and then hopefully in the USA. The study launched in May 2017.
Apart from the USA studies, MVP and its partners are also planning:
• Before-After Implementation Study Comparing the Effectiveness of Nurse Initiated Pain Protocol with Self- Administered Inhaled Analgesia in the Emergency Department (SingHealth);
• Open randomised clinical trial to compare speed of pain relief between methoxyflurane and standard of care for treating patients with trauma pain in Spanish emergency units. (MVP Partner);
For
per
sona
l use
onl
y

Annual Financial Report 2017 9
• Efficacy and safety of Penthrox® for the moderate to severe acute pain in patients with biliary colic. (MVP Partner) – draft synopsis available;
• Mountain rescue study in Italy (MVP Partner) – planning stages.
These studies will extend the body of safety and efficacy data for Penthrox® in adults and children and enable MVP to leverage the outcome of these studies in the proposed New Drug Application (NDA) to the USA and registrations elsewhere in the world.
Our longer-term ambition is to gather sufficient clinical and safety data to extend the use of Penthrox® into:
a) minor surgical procedures;
b) breakthrough post-operative and cancer pain;
c) repeat use scenarios; and ultimately;
d) home use.
Product DevelopmentDuring the period MVP filed two separate Patent Applications protecting its new Penthrox® delivery device technology. In total, we have filed six Patent Applications to protect Penthrox®.
MVP filed one additional Patent Application to protect a new respiratory device developed by MVP.
MVP expects to submit additional patent applications as we extend our respiratory product offering in the future.
Commercial Developments
New Manufacturing Facility
Our new purpose built state of the art manufacturing facility in Scoresby was completed during the year with the facility currently undergoing final validation. The facility will house MVP’s commercial scale plant for the new methoxyflurane manufacturing process and also houses state of the art R&D product testing laboratories. The new plant will accommodate medium to long term forecasted demand and is expected to come online later in CY 2017.
CSIRO Project
During the year MVP entered into an agreement with the CSIRO to further develop our manufacturing technology and capability for application to other small molecule pharmaceuticals. This agreement extends MVP’s existing partnership with the CSIRO. Our collective ambition is to develop the next generation of manufacturing technologies to make ‘small molecule’ pharmaceutical products at a significantly reduced cost and improved quality, compared with traditional processes. This project is progressing well and showing encouraging early signs. The initial assessment and investigations indicate there are at least three new molecules that we should be able to manufacture using our technology. These molecules are in billion dollar markets and relate to the areas of chronic and mild pain medication, and asthma and COPD medication.
Opening of our new manufacturing facility in Scoresby
For
per
sona
l use
onl
y
Medical Developments International Limited10
MR DAVID WILLIAMS
CHAIRMAN
+61 414 383 593
MR JOHN SHARMAN
CHIEF EXECUTIVE OFFICER
+61 3 9547 1888
Penthrox®: Rest of World
MVP continues to negotiate with interested parties from around the world in terms of registering and selling Penthrox®. A number of key markets are drawing strong interest and we are encouraged by the responses we are getting from interested parties looking to partner Penthrox® in the USA. We are confident new distribution deals and registrations will be achieved in due course.
VetOur Vet business grew 41% in FY17 as MVP continues to win new orders from China and South-East Asia.
FY17 Full Year Financial Result Our full year result has delivered gross revenue growth of 22% and Net profit after tax growth of 16%.
Operating Expenses grew 13% for the period. However, the results include a number of one off expenses such as a foreign exchange loss of $0.200m, expenses relating to the launch of new product in the USA, expenses relating to the approval of Penthrox® in Europe and costs relating the new manufacturing facility. We estimate these costs total another $0.350m. We estimate these non-recurring costs total $0.550m for the year.
MVP continues to invest in our business and people. MVP has employed an additional 26 people since the beginning of 2016 to cater for the workload resulting from the ongoing registration activity and planned new market launches over the next 12 to18 months. We are now well placed for the future and do not expect further significant investment.
MVP continues to invest in clinical studies, research and development and product development. Some of these expenses have capitalised to intangible assets where appropriate and the remainder has been taken directly to the profit and loss.
MVP recorded $1.9m as revenue from the amortisation of upfront and milestone payments received as at 30 June 2017. In line with accounting practices these receipts are required to be amortised over the contract term.
We received a $0.245 million R&D tax incentive refund during the year and a further $0.424 million is expected in the coming months in relation to FY17.
DividendThe Board of Directors has declared a fully franked full year dividend of 2 cents per share to the holders of fully paid ordinary shares as at the record date of 1 September 2017 to be paid to shareholders on 6 October 2017. A Dividend Reinvestment Plan is again being offered.
Thank youWe would like to thank our staff, our trading partners and shareholders for their efforts and support and look forward to further success in FY18 and beyond.
Further information
For
per
sona
l use
onl
y
11
Product Portfolio
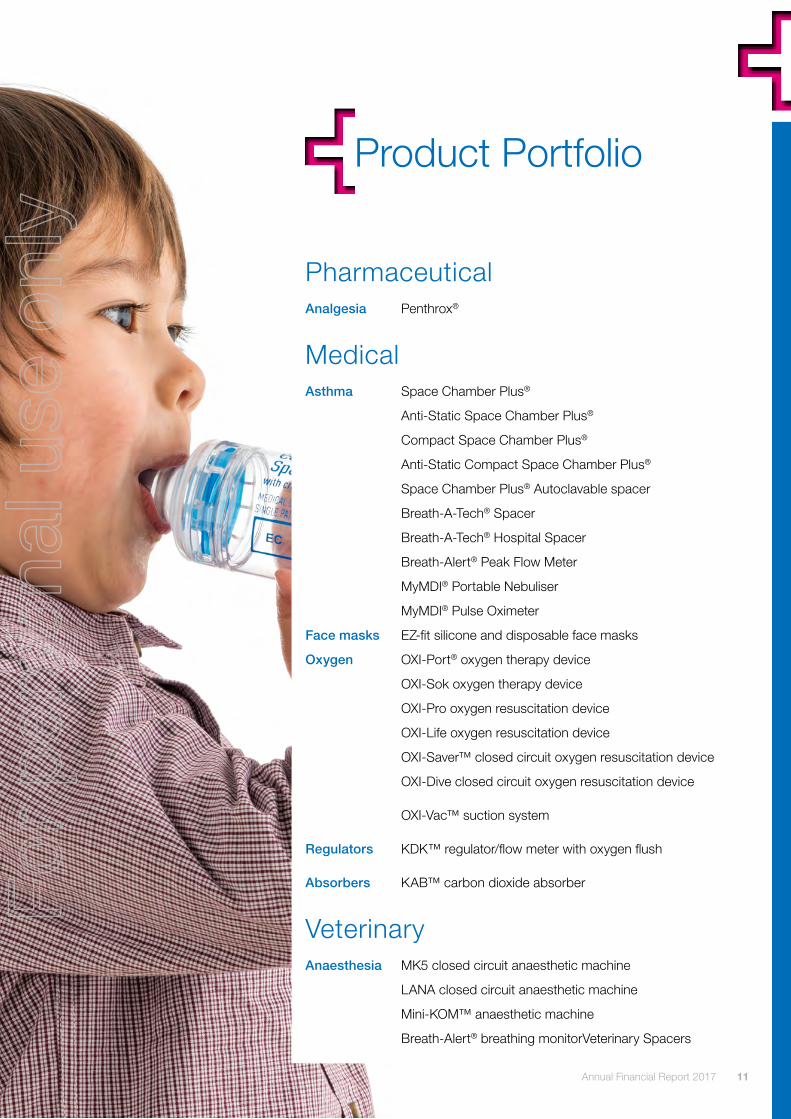
PharmaceuticalAnalgesia Penthrox®
MedicalAsthma Space Chamber Plus®
Anti-Static Space Chamber Plus®
Compact Space Chamber Plus®
Anti-Static Compact Space Chamber Plus®
Space Chamber Plus® Autoclavable spacer
Breath-A-Tech® Spacer
Breath-A-Tech® Hospital Spacer
Breath-Alert® Peak Flow Meter
MyMDI® Portable Nebuliser
MyMDI® Pulse Oximeter
Face masks EZ-fit silicone and disposable face masks
Oxygen OXI-Port® oxygen therapy device
OXI-Sok oxygen therapy device
OXI-Pro oxygen resuscitation device
OXI-Life oxygen resuscitation device
OXI-Saver™ closed circuit oxygen resuscitation device
OXI-Dive closed circuit oxygen resuscitation device
OXI-Vac™ suction system
Regulators KDK™ regulator/flow meter with oxygen flush
Absorbers KAB™ carbon dioxide absorber
VeterinaryAnaesthesia MK5 closed circuit anaesthetic machine
LANA closed circuit anaesthetic machine
Mini-KOM™ anaesthetic machine
Breath-Alert® breathing monitorVeterinary Spacers
Annual Financial Report 2017
For
per
sona
l use
onl
y

MVP is a world leader in the management of acute and procedural pain
Building our Business
MVP manufactures its world leading inhaled analgesic from its premises in Springvale, Victoria, Australia. MVP is the sole manufacturer of the active molecule worldwide and continues to develop new markets and applications for the iconic brand Penthrox®. Penthrox® continues to be used as a ‘first line’ product for the treatment of pain in trauma by all Ambulance Services in Australia and New Zealand. MVP continues the promotional focus into the Australian Ambulance services ensuring that the strong positioning of Penthrox® is maintained. Moving forward, the strategy is to continue to broaden the range of customers (hospitals, general practice, dental and cosmetic) domestically and continue to grow the countries that can be served by Penthrox®. In FY17 Penthrox® was successfully launched into France and Belgium. With a number of countries to come online in FY18.
Product Suite
MVP is continuing to develop additional formulations of Penthrox® to provide improved convenience, utility and value for its customers. This includes investing in the product development of a next generation Penthrox® inhalers.
Pharmaceuticals
Medical Developments International Limited12
For
per
sona
l use
onl
y

Annual Financial Report 2017 13
Building our product range
MVP’s focus in FY18 will be to add to our established product range, to build on the solid foundation that has been established with our current partnerships in Australia and overseas. At the same time MVP will develop new collaborations for future growth. Core to the growth is the development of new and improved models of:
• Asthma/COPD Space Chambers
• Penthrox® Inhaler
• Peak Flow Meters
• Portable Nebulisers
• Pulse Oximeter
• Face Masks
• Tourniquets
• Emergency Medicine consumable equipment
Asthma Devices
MVP’s Asthma devices business has been strong for many years and continues to provide solid sales and profit.
The success of this business over recent years has been due to four factors:
• The strength of the Allersearch brand in Australian Hospitals and Pharmacies through our distribution partner
• The growth of the OAPL sales in Hospitals and Pharmacies within Australia
• The acquisition and strong growth of the Breath-A-Tech® range
• Growing sales of our range of Asthma products through established international partners and new customers. Of particular note is the ongoing growth in respiratory sales in the USA with MVP products now in approximately 11,000 pharmacies across the USA.
Product Development
MVP’s Space Chamber is well known in the market place as the ‘Rolls Royce’ brand and it offers the greatest opportunity for future growth in the Asthma devices market. To assist in future growth MVP has developed new and improved Space Chambers to assist with product differentiation and local and international penetration.
Medical devices
For
per
sona
l use
onl
y

Safe, precision engineering and custom design kits and accessories
MVP manufactures a range of oxygen therapy and resuscitation equipment, providing healthcare professionals and trained personnel with the ability to administer oxygen to patients in an emergency situation. These devices range from basic through to advanced systems of delivering oxygen therapy or resuscitation.
Product Suite
• OXI-Port® oxygen therapy device
• OXI-Sok oxygen therapy device
• OXI-Pro oxygen resuscitation device
• OXI-Life oxygen resuscitation device
• OXI-Saver™ closed circuit oxygen resuscitation device
• OXI-Dive closed circuit oxygen resuscitation device
• OXI-Vac™ suction system
These products are all custom assembled and tested at MVP’s TGA approved manufacturing facilities in Melbourne, Australia.
The Market
The MVP’s oxygen equipment is purchased and used by:
• Ambulance services
• Fire brigades
• Lifesaving clubs
• Military
• First aid organisations
• Dental markets
Oxygen & other Medical equipment
Medical Developments International Limited14
For
per
sona
l use
onl
y

MVP re-invigorates its Veterinary product range
Products
• Anaesthetic machines
• Vaporisers
• Breathing monitors
• Veterinary Spacers
The Market
MVP offers a range of open and closed circuit anaesthetic machines to the veterinary market, which are popularly known as Komesaroff anaesthetic machines. MVP has developed a unique market position regarding the design, manufacture and supply of closed circuit anaesthetic machines to this particular niche market in Europe.
Whilst the majority of MDI’s veterinary products continue to be sold in Europe through our distributor, Kruuse (one of Europe’s largest veterinary distribution companies), the launch of a new machine, and with a new catalogue veterinary sales continue to grow. MVP expect to expand its growth into Asia through various distributors.
New Product Development
MVP’s Breath-Alert® breathing monitor (Mark IV) continued to sell well on new but simple selling features such as size (smaller unit), ease of use and battery longevity. Through new products, a specifically tailored catalogue and promotion via our Australian distributor will assist future sales growth.
Veterinary
Annual Financial Report 2017 15
For
per
sona
l use
onl
y

Medical Developments International Limited
Mr David WilliamsNon-Executive Chairman Managing Director of Kidder Williams Ltd, with over 30 years’ experience in the investment banking sector. He is also Chairman of PolyNovo Ltd. Mr Williams is Chairman of the Remuneration and Nominations Committee.
Mr Max JohnstonNon-Executive Director Mr Johnston is a non-executive director of Polynovo Limited and a former non-executive Director and Chairman of Probiotec Limited and a former non-executive Director of Enero Group Limited. For 11 years he was President and Chief Executive Officer of Johnson & Johnson Pacific and an Executive Director of Johnson & Johnson. Mr Johnston has also held several prominent industry roles as a past President of ACCORD Australasia Limited, a former Vice Chairman of the Australian Food and Grocery Council and a former member of the board of ASMI. Mr Johnston has had extensive overseas experience during his career in leading businesses in Western and Central-Eastern Europe, Africa as well as Asia-Pacific. Mr Johnston is also a member of the MDI Audit & Risk Committee.
Dr Harry Oxer AM
Non-Executive Director Dr Oxer is a Medical Consultant to MDI and St John Ambulance in Western Australia. Dr Oxer was a long-time member of the State Executive for St John Ambulance (WA) until his retirement in rotation in 2012, and was the previous Medical Director for twenty-six years. He has taught, lectured and published extensively over the years, both nationally and internationally. Dr Oxer is also a past Chairman of the Australian Resuscitation Council and has a major interest in resuscitation, oxygen therapy and pain relief.
Mr Philip PowellNon-Executive Director Mr Powell, a Chartered Accountant, has an extensive finance background and commenced working in investment banking in 1996 at Hambros Corporate Finance following ten years industry experience in senior finance roles with ASX listed public company OAMPS Limited. Prior to these roles, he worked for ten years within the Assurance Division at Arthur Andersen & Co.
From January 2006 to July 2013 he was a Director at Corporate Finance Advisory firm Kidder Williams. Philip is also a Non-executive Director of PolyNovo Limited (ASX: PNV).
Philip is Chairman of MDI’s Audit and Risk Committee.
Mr Leon HoareNon-Executive Director Mr Hoare is the Managing Director of Lohmann & Rauscher Australia/New Zealand (ANZ), a private EU based medical device company. Previously he was Managing Director of Smith & Nephew ANZ, which is one of the company’s largest global subsidiaries outside the USA. Until 2014 he served as President of Smith & Nephew’s Asia Pacific Advanced Wound Management (AWM) business for 5 years. He was also a member of the Global Executive Management for the AWM Division. In his 24 years with Smith & Nephew, he also held roles in Marketing, Divisional and General Management.
24 Medical Developments International Limited Mr Hoare’s career also included a senior role at Bristol-Myers Squibb in surgical products, and Vice-Chair of Australia’s peak medical device body, Medical Technology Association of Australia.
He is also a Non-Executive Director of PolyNovo Limited (ASX: PNV).
Mr Allan McCallumNon-Executive Director Mr McCallum has over 20 years’ public companies experience including an ASX 50 company and has served on numerous committees including: Audit, Remuneration & Nomination, and as an Independent Director on Related Parties (Governance) Committees. Mr McCallum is a member of the Remuneration and Nominations Committee. He is also Chairman of Tassal Group Ltd and Cann Group Limited.
Board of Directors
The above-named directors held office during and since the end of the financial year. 16
For
per
sona
l use
onl
y

Annual Financial Report 2017 17
Full-Year Report 2017 Financial Year Ended 30 June 2017
(Previous corresponding period: financial year ended 30 June 2016)
For
per
sona
l use
onl
y

Medical Developments International Limited18
Contents
Directors’ Report 19
Independence Declaration to the Directors of Medical Developments International Limited 32
Independent Auditor’s Report to the Members of Medical Developments International Limited 33
Directors’ Declaration 37
Consolidated Statement of Profit or Loss and Other Comprehensive Income for the Financial Year 38 Ended 30 June 2017
Consolidated Statement of Financial Position as at 30 June 2017 39
Consolidated Statement of Changes in Equity for the Financial Year Ended 30 June 2017 40
Consolidated Statement of Cash Flows for the Financial Year Ended 30 June 2017 41
Notes to the Financial Statements for the Financial Year Ended 30 June 2017 42
For
per
sona
l use
onl
y
Annual Financial Report 2017 19
Directors’ Report
The directors of Medical Developments International Limited (‘MDI’) herewith submit the annual financial report of the company for the financial year ended 30 June 2017. In order to comply with the provisions of the Corporations Act 2001, the directors report as follows:
Information about the DirectorsThe names and particulars of the directors of the company during or since the end of the financial year are:
Mr D J Williams, B.Ec (Hons), M.Ec, FAICD
Non-Executive Chairman (since 16 September 2003)
Managing Director of Kidder Williams Ltd, with over 30 years’ experience in the investment banking sector. He is also Chairman of PolyNovo Ltd. Mr Williams is Chairman of the Remuneration and Nominations Committee.
Mr A D McCallum, Dip.Ag Science, FAICD
Non-Executive Director (since 27 October 2003)
Mr McCallum has over 20 years’ public companies experience including an ASX 50 company and has served on numerous committees including: Audit, Remuneration & Nomination, and as an Independent Director on Related Parties (Governance) Committees. Mr McCallum is a member of the Remuneration and Nominations Committee. He is also Chairman of Tassal Group Ltd and Cann Group Limited.
Dr H F Oxer, AM, ASM, KStJ
MA (Hons), MB.BChir (Cantab), MRCS.LRCP, DA, FFARCS, FRCA, FFARACS, FANZCA, FACAP, DipDHM
Non-Executive Director (since 28 December 2006)
Dr Oxer is a Medical Consultant to MDI and St John Ambulance in Western Australia. Dr Oxer was a long-time
member of the State Executive for St John Ambulance (WA) until his retirement in rotation in 2012, and was the previous Medical Director for twenty-six years. He has taught, lectured and published extensively over the years, both nationally and internationally. Dr Oxer is also a past Chairman of the Australian Resuscitation Council and has a major interest in resuscitation, oxygen therapy and pain relief.
Mr R M Johnston
Non-Executive Director (since 5 November 2012)
Mr Johnston is a non-executive director of Polynovo Limited and a former non-executive Director and Chairman of Probiotec Limited and a former non-executive Director of Enero Group Limited. For 11 years he was President and Chief Executive Officer of Johnson & Johnson Pacific and an Executive Director of Johnson & Johnson. Mr Johnston has also held several prominent industry roles as a past President of ACCORD Australasia Limited, a former Vice Chairman of the Australian Food and Grocery Council and a former member of the board of ASMI. Mr Johnston has had extensive overseas experience during his career in leading businesses in Western and Central-Eastern Europe, Africa as well as Asia-Pacific. Mr Johnston is also a member of the MDI Audit & Risk Committee.
Mr L Hoare, AssocDipAppSc (Orth), GradDipBus, GAICD
Non-Executive Director (since 27 September 2013)
Mr Hoare is the Managing Director of Lohmann & Rauscher Australia/New Zealand (ANZ), a private EU based medical device company. Previously he was Managing Director of Smith & Nephew ANZ, which is one of the company’s largest global subsidiaries outside the USA. Until 2014 he served as President of Smith & Nephew’s Asia Pacific Advanced Wound Management (AWM) business for 5 years. He was also a member of the Global Executive Management for the AWM Division. In his 24 years with Smith & Nephew, he also held roles in Marketing, Divisional and General Management.
For
per
sona
l use
onl
y

Medical Developments International Limited20
Mr Hoare’s career also included a senior role at Bristol-Myers Squibb in surgical products, and Vice-Chair of Australia’s peak medical device body, Medical Technology Association of Australia.
He is also a Non-Executive Director of PolyNovo Limited (ASX: PNV).
Mr P J Powell, B.Com (Hons) ACA, F Fin, MAICD
Non-Executive Director (since 17 December 2014)
Mr Powell, a Chartered Accountant, has an extensive finance background and commenced working in investment banking in 1996 at Hambros Corporate Finance following ten years industry experience in senior finance roles with ASX listed public company OAMPS Limited. Prior to these roles, he worked for ten years within the Assurance Division at Arthur Andersen & Co.
From January 2006 to July 2013 he was a Director at Corporate Finance Advisory firm Kidder Williams. Philip is also a Non-executive Director of PolyNovo Limited (ASX: PNV).
Philip is Chairman of MDI’s Audit and Risk Committee.
The above-named directors held office during and since the end of the financial year.
Directorships of other listed companiesDirectorships of other listed companies held by the directors in the 3 years immediately before the end of the financial year are as follows:
Name CompanyPeriod of Directorship
David Williams
Polynovo Limited (Chairman)
Since 13 March 2014
IDT Australia Limited Until 19 May 2015
Allan McCallum
Tassal Group Ltd (Chairman)
Since October 2003
Cann Group Limited (Chairman)
Since 5 May 2017
Max Johnston
Probiotec LtdUntil 28 November 2016
Enero Group Limited Since March 2011
Polynovo Limited Since 13 May 2014
Philip Powell Polynovo Limited Since 13 May 2014
Leon Hoare Polynovo LimitedSince 27 January 2016
Company Secretary
Mr Mark Edwards, CA.
Mr Edwards is also the Group Financial Controller of the company.
Principal Activities
The company’s principal activities during the course of the financial year were the manufacture and distribution of a pharmaceutical drug and medical and veterinary equipment.
Review of OperationsPenthrox® DevelopmentsPenthrox® was launched in the French and Belgium markets in February 2017 and feedback from these markets is very positive. These launches were milestone events and in preparation for the launches, MVP received and delivered its largest ever single order for Penthrox®. Since launch, MVP has delivered its second order for the French market.
In the UK and Ireland, our distributor is making good progress and in June 2017, MVP supplied its second order post launch in the UK and Ireland. Galen continue to grow Penthrox® sales into hospitals in the UK and Ireland. 56 hospitals have now approved Penthrox® into formulary listing and are using the product. These include six of the eleven Major Trauma Centres in the UK and we expect another to approve the use of Penthrox® in the coming months.
The guidelines for the use of Penthrox® in Ambulance services throughout Ireland were approved by PHECC in May. Penthrox® is available for use in all Ambulance Services in Ireland and will be rolled out across the country once training of Emergency Medical Technicians, Paramedics and Advanced Paramedics is completed which is expected before the end of the year.
The Joint Royal College Ambulance Liaison Committee (‘JRCALC’) is expected to issue updated pain management guidelines by October. Penthrox® is expected to be listed in these guidelines for all ambulance services. Our distributor has advised us that four Ambulance Trusts are already actively engaging in protocol assessments for the use of Penthrox® in anticipation of the guideline listing for Penthrox®.
Our target is to achieve formulary approval in 160 hospitals. It is estimated that 60% of trauma cases in the UK are seen by the top 30% of hospitals.
Penthrox® is making excellent progress in France. In market sales and formulary approvals are growing at a much quicker
For
per
sona
l use
onl
y

Annual Financial Report 2017 21
rate than the UK, where the formulary approval process is long and arduous. We summarise the progress our partner is making in France as follows:
• They are targeting formulary approval in 350 hospitals.
• They have already submitted 250 formulary applications.
• They have achieved 99 formulary approvals in France.
• They have 21 rejected formulary applications.
• 143 hospitals have ordered Penthrox® in France.
• About 50% of customers who have ordered Penthrox® have already re-ordered.
We are confident Penthrox® will be a very significant drug in France and more importantly, we are confident our partners in Europe are well placed to deliver aggressive sales growth over the coming years.
In November 2016 MVP’s European Partner submitted an application to the United Kingdom’s Medicines & Healthcare products Regulatory Agency (MHRA) under the Decentralised Procedure to have Penthrox® approved for sale in Germany, Italy, Spain, Sweden, Switzerland, Finland, Austria, Denmark, Poland, Portugal, Bulgaria, Croatia, Cyprus, Czech Republic, Estonia, Latvia, Lithuania, Luxemburg, Romania, Slovakia and Slovenia. We are currently ahead of our target dates and have responded in full to the questions raised by the regulatory agencies as part of the day 105 ‘stop clock’. We do not expect any further issues to be raised from here and the approval and closure of the decentralised procedure is expected before the end of calendar year 2017. National approvals for the sale of Penthrox® will follow for each country and sales are expected to commence during H2 FY18.
In addition, ‘National Regulatory Applications’ are expected to be filed with the relevant agencies in the Netherlands, Greece, Macedonia, Serbia, Albania, Liechtenstein, Montenegro, Kosovo, San Marino, Vatican City, Bosnia and Herzegovina, Andorra and Monaco in due course. Approvals to sell Penthrox® in these countries are expected during FY18 and beyond.
Elsewhere in the world our regulatory submissions to Mexico, Iran, Hong Kong, Saudi Arabia, Iraq, Jordan and Korea are progressing.
In all, MVP is working towards approvals to sell Penthrox® in another 37 countries over the next 12 to 18 months.
MVP finalised licensing and distribution deals in Korea and Canada during the half year and received milestone payments. A new licensing and distribution deal was also signed in Russia in April 2017.
Penthrox® sales to New Zealand grew 593% stemming from the decision during the year by New Zealand’s leading provider of Ambulance Services, St John Ambulance,
to change their clinical practice and guidelines such that “Entonox (Nitrous Oxide) was discontinued with Penthrox® the sole inhaled analgesic administered”.
Penthrox® was approved for sale by the Food and Drug Administration in Taiwan and we made our first sale into Taiwan in March 2017.
United States of America
Recent developments in the USA around opioid addiction and abuse make the clinical need and market opportunity for Penthrox® very attractive. Given the public and legislative bias expressed by the USA government and its Food Drug Administration (FDA) against the use of opioids, Penthrox® as a non-opioid / non-narcotic, fast acting, safe, easy to use, store and administer acute pain drug offers an attractive alternative.
In May 2017, MVP met with the FDA to discuss and confirm our proposed regulatory program designed to have Penthrox® approved for sale in the USA. That meeting was very positive and MVP now has a clearer understanding of the support and requirements the FDA has in terms of approving Penthrox® for sale in the USA. MVP is proceeding with its development program comprising a number of clinical and non-clinical studies. The clinical and non-clinical work in several cases repeats work done and we are confident the data collected will reconfirm what we already know and what has already been previously accepted by various regulators elsewhere in the world.
We estimate the work needed to submit a New Drug Application (NDA) in the USA will be completed within two and a half years, at a cost of $US15 million.
Most importantly, we expect to submit our application to have our Investigational New Drug applications accepted early in calendar year 2018.
We are also planning to submit a ‘Fast Track’ application to the FDA at the time of our IND submission. The ‘Fast Track’ application is a process designed to facilitate the development, and expedite the review of drugs to treat serious conditions and fill an unmet medical need in the USA. The purpose is to get important new drugs to the patient earlier. After our meeting at the FDA we are of the view that a Fast Track application to get Penthrox® approved in the USA is appropriate.
Respiratory DevelopmentsOur respiratory device business continues to grow strongly. Overall gross revenue from respiratory devices grew 50%.
Sales of respiratory devices in the Australian market grew 56% (gross), with our Breath-A-Tech® branded range of
For
per
sona
l use
onl
y

Medical Developments International Limited22
Space Chambers and respiratory products continuing to exceed expectations (up 182% yoy), reinforcing MVP as market leader in Australia.
Gross sales into the USA market grew 353% and we continue to build our business in that market. We incurred several ‘promotional and start up offer’ expenses during the year which we do not expect to continue. Since we finalised our distribution deals with McKesson, AmerisourceBergen and Cardinal Health, MVP’s Space Chamber Plus range of devices and masks can be found in over 11,000 pharmacies across the USA. We completed ‘ranging’ deals in FY17 with each of Walmart, Kmart, Costco, Price Chopper, Sams Club and Independent Pharmacy Co-Op. These deals represent a critical ‘footprint’ within the USA retail pharmacy market. We expect additional pharmacy distribution deals over the next 12 months. We are well on the way to establishing ourselves as a major supplier of Respiratory Devices in the USA. We expect to deliver significant sales growth in that market in the years ahead.
Sales into Europe and the UK grew 32% and this region continues to make a significant contribution to the profits of our business.
Sales of respiratory devices to New Zealand grew 23%. This growth reflects consumers buying our medical devices outside of the fully rebated Pharmac reimbursement program and is testimony to the quality and performance of our products.
Clinical DevelopmentsMVP continues to invest heavily in our clinical and research programs. Our ambition is to extend the use of Penthrox® into Acute Pain applications including Surgical Procedures, Breakthrough Pain and ultimately Home Use. Together with our partners we have begun developing clinical programs to expand the indication for use of Penthrox® to acute pain procedures in the European Union. The benefit of this extension will be available to both our partners in Europe and, more importantly, it will provide essential clinical data to have the market opportunity for Penthrox® extended in jurisdictions worldwide. By way of example we believe the market for Surgical Procedures is bigger than the global opportunity for Penthrox® in Trauma Pain, our traditional market.
During the period, a number of important studies were completed and published or were ongoing including:
New publications:
• Gaskell AL, Jephcott CG, et al. Self-administered methoxyflurane for procedural analgesia: experience in a tertiary Australasian centre: Anaesthesia 2016;
• Frangos J, Mikkonnen A, et al. Derivation of an occupational exposure limit for an inhalation analgesic
methoxyflurane (Penthrox®) Regulatory Toxicology and Pharmacology;
• Hey P, Shan J, et al. Inhaled methoxyflurane (Penthrox®) improves tolerability and success of nasogastric probe insertion for esophageal physiological studies: a pilot study. Journal of Gastroenterology and Hepatology 2016;
• Nguyen NQ, Burgess J, et al. Effects of Penthrox® on Psychomotor Function in Humans: Psychomotor and cognitive effects of 15-minute inhalation of methoxyflurane in healthy volunteers: implication for post-colonoscopy care A Randomized Placebo Trial. Endoscopy International Open 2016;
• Oxer H. Vital Signs Stability during Methoxyflurane Analgesia: Effects of Penthrox® (methoxyflurane) as an analgesic on cardiovascular and respiratory functions in the pre-hospital setting. Journal of Military and Veterans’ Health 2016;
• Coffey F, Dissmann P et al. Methoxyflurane Analgesia in Adult Patients in the Emergency Department: A Subgroup Analysis of a Randomized, Double-blind, Placebo-controlled Study (STOP!). Adv Ther 2016;
• Blair HA and Frampton JE. Methoxyflurane: A Review in Trauma Pain. Clin Drug Investig 2016;
• Dayan A. Analgesic Use of Inhaled Methoxyflurane: Evaluation of its Potential Nephrotoxicity. Human and Experimental Toxicology 2015.
Completed study:
• Comparison of Inhalational Methoxyflurane (Penthrox®) And Intramuscular Tramadol for Prehospital Analgesia. (Singapore Emergency Ambulance Service). The trial found Penthrox was superior to IM Tramadol in terms of analgesic efficacy and speed of onset as well as administration.
On-going studies:
• TRUS-biopsy: A phase III double-blind placebo-controlled randomised trial of methoxyflurane with periprostatic local anaesthesia to reduce the discomfort of transrectal ultrasound-guided prostate biopsy (Pain-Free TRUS B).
• PASS – A Post Authorisation Safety Study designed to track any adverse events to the users of Penthrox in Europe. The study is scheduled to last two years and the data gathered will be extremely valuable in existing and prospective Penthrox markets around the world.
• A randomised, double-blind, multicentre, placebo controlled study to evaluate the safety and efficacy of methoxyflurane (Penthrox®) for the treatment of acute pain in children and adolescents from 6 to less than 18 years of age (presenting to an Emergency Department with minor trauma) MEOF-002. This study is designed
For
per
sona
l use
onl
y

Annual Financial Report 2017 23
to be both European and USA compliant which if successful will extend the use of Penthrox® to the paediatric population in Europe and then hopefully in the USA. The study launched in May 2017.
Apart from the USA studies, MVP and its partners are also planning:
• Before-After Implementation Study Comparing the Effectiveness of Nurse Initiated Pain Protocol with Self- Administered Inhaled Analgesia in the Emergency Department (SingHealth);
• Open randomised clinical trial to compare speed of pain relief between methoxyflurane and standard of care for treating patients with trauma pain in Spanish emergency units. (MVP Partner);
• Efficacy and safety of Penthrox® for the moderate to severe acute pain in patients with biliary colic. (MVP Partner) – draft synopsis available;
• Mountain rescue study in Italy (MVP Partner) – planning stages.
These studies will extend the body of safety and efficacy data for Penthrox® in adults and children and enable MVP to leverage the outcome of these studies in the proposed New Drug Application (NDA) to the USA and registrations elsewhere in the world.
Our longer-term ambition is to gather sufficient clinical and safety data to extend the use of Penthrox® into:
a) minor surgical procedures;
b) breakthrough post-operative and cancer pain;
c) repeat use scenarios; and ultimately
d) home use.
Product DevelopmentsDuring the period MVP filed two separate Patent Applications protecting its new Penthrox® delivery device technology. In total, we have filed six Patent Applications to protect Penthrox®.
MVP filed one additional Patent Application to protect a new respiratory device.
MVP expects to submit additional patent applications as we extend our respiratory product offering in the future.
Commercial Developments
New Manufacturing Facility
Our new purpose built state of the art manufacturing facility in Scoresby was completed during the year with the facility
currently undergoing final validation. The facility will house MVP’s commercial scale plant for the new methoxyflurane manufacturing process and also houses state of the art R&D product testing laboratories. The new plant will accommodate medium to long term forecast demand and is expected to come online later in CY2017.
CSIRO Project
During the year MVP entered into an agreement with the CSIRO to further develop our manufacturing technology and capability for application to other small molecule pharmaceuticals. This agreement extends MVP’s existing partnership with the CSIRO. Our collective ambition is to develop the next generation of manufacturing technologies to make ‘small molecule’ pharmaceutical products at a significantly reduced cost and improved quality, compared with traditional processes. This project is progressing well and showing encouraging early signs. The initial assessment and investigations indicate there are at least three new molecules that we should be able to manufacture using our technology. These molecules are in billion dollar markets and relate to the areas of chronic and mild pain medication, and asthma and COPD medication.
Penthrox®: Rest of World
MVP continues to negotiate with interested parties from around the world in terms of registering and selling Penthrox®. A number of key markets are drawing strong interest and we are encouraged by the responses we are getting from interested parties looking to partner Penthrox® in the USA. We are confident new distribution deals and registrations will be achieved in due course.
VetOur Vet business grew 41% in FY17 as MVP continues to win new orders from China and South-East Asia.
FY17 Full Year Financial ResultOur full year result has delivered gross revenue growth of 22% and Net profit after tax growth of 16%.
Operating Expenses grew 13% for the period. However, the results include a number of one off expenses such as a foreign exchange loss of $0.200m, expenses relating to the launch of new product in the USA, expenses relating to the approval of Penthrox® in Europe and costs relating the new manufacturing facility. We estimate these costs total another $0.350m. We estimate these non-recurring costs total $0.550m for the year.
MVP continues to invest in our business and people. MVP has employed an additional 26 people since the beginning
For
per
sona
l use
onl
y

Medical Developments International Limited24
of 2016 to cater for the workload resulting from the ongoing registration activity and planned new market launches over the next 12 to 18 months. We are now well placed for the future and do not expect further significant investment.
MVP continues to invest in clinical studies, research and development and product development. Some of these expenses have capitalised to intangible assets where appropriate and the remainder has been taken directly to the profit and loss.
We expect a significant uplift in revenue in the medium term as new country registrations for Penthrox® translate into sales and the new channels of distribution for asthma devices translate into further sales growth.
MVP recorded $1.9m as revenue from the amortisation of upfront and milestone payments received as at 30 June 2017. In line with accounting practices these receipts are required to be amortised over the contract term.
We received a $0.245 million R&D tax incentive refund during the year and a further $0.424 million is expected in the coming months in relation to FY17.
DividendThe Board of Directors has declared a fully franked full year dividend of 2 cents per share to the holders of fully paid ordinary shares as at the record date of 1 September 2017 to be paid to shareholders on 6 October 2017. A Dividend Reinvestment Plan is again being offered.
Financial Position
The capital structure of the Group remained stable during the period.
• Interest bearing liabilities at 30 June 2017 total $0.429m; and
• The debt facility available to the company was unused as at 30 June 2017 and the company has extended this facility post 30 June 2017 (refer subsequent events below).
Changes in State of Affairs
During the financial year there was no significant change in the state of affairs of the company other than that referred to in the financial statements or notes thereto.
Subsequent Events
In August 2017, the Company signed an unconditional Term Sheet with its financiers to extend its Bank Bill Facility. The initial facility for $5m was due to expire in October 2018. The new facility will increase to $11m and will extend to August 2019.
On the 18th August 2017 the Board of Directors declared a fully franked final dividend of 2 cents per share to the
holders of fully paid ordinary shares as at the record date of 1 September 2017, to be paid to the shareholders on the 6 October 2017. Refer below for further details.
There has not been any other matter or circumstance that has arisen that has significantly affected, or may significantly affect the operations of the company, the results of those operations, or the state of affairs of the company in future years.
Dividends
The Board of Directors is pleased to declare a Final Dividend of 2 cents per share fully-franked.
MVP intends to implement a Dividend Reinvestment Plan which will allow shareholders to use the proceeds from the Full Year Dividend to purchase MVP shares at a 5% discount to the volume weighted average price of all of the company’s fully paid shares sold on the ASX during the 10 trading days immediately before the record date.
The timetable for the Final Dividend for the year ended 30 June 2017 is:
Key dates Event
18 August 2017 Declaration of Final Dividend
1 September 2017 Record Date for eligible shareholders to receive dividend
22 September 2017 Date for shareholders to elect to participate in Dividend Reinvestment Plan
6 October 2017 Payment Date
Indemnification of Officers and Auditors
During the financial year, the company paid a premium in respect of a contract insuring the directors of the company (as named above) and all executive officers of the company against a liability incurred as such a director, secretary or executive officer to the extent permitted by the Corporations Act 2001. The contract of insurance prohibits disclosure of the nature of the liability and the amount of the premium.
The company has not otherwise, during or since the end of the financial year, indemnified or agreed to indemnify an officer or auditor of the company against a liability incurred as such an officer or auditor.
Directors’ Meetings
The following table sets out the number of directors’ meetings (including meetings of committees of directors) held during the financial year and the number of meetings attended by each director (while they were a director or committee member). During the financial year, 9 Board meetings, two Audit and Risk Committee meetings and one Remuneration and Nominations committee meeting were held.
For
per
sona
l use
onl
y

Annual Financial Report 2017 25
Directors’ Shareholdings
The following table sets out each director’s relevant interest in shares as at the date of this report.
Directors hold no options over shares as at 30 June 2017.
Fully paid shares
D.J. Williams 17,970,388
A.D. McCallum 384,671
H.F. Oxer 193,118
M. Johnston 30,365
L. Hoare 10,121
P.J. Powell 255,157
Board of Directors Audit & Risk CommitteeRemuneration & Nominations
Committee
Held Attended Held Attended Held Attended
D.J. Williams 9 9 - - 1 1
A.D. McCallum 9 9 - - 1 1
H.F. Oxer 9 7 - - - -
M. Johnston 9 9 2 2 - -
L. Hoare 9 9 - - - -
P.J. Powell 9 9 2 2 - -
Audited Remuneration Report
This remuneration report, which forms part of the directors’ report, sets out information about the remuneration of Medical Developments International Limited’s key management personnel for the financial year ended 30 June 2017. The term ‘key management personnel’ refers to those persons having authority and responsibility for planning, directing and controlling the activities of the consolidated entity, directly or indirectly, including any director (whether executive or otherwise) of the consolidated entity. The prescribed details for each person covered by this report are detailed below under the following headings:
• Key management personnel
• Remuneration policy
• Relationship between the remuneration policy and company performance
• Remuneration of key management personnel
• Key terms of employment contracts.
Key Management Personnel Details
`The company’s key management personnel consist of the following directors and executives:
The directors of the company during or since the end of the financial year were:
• D.J. Williams (Chairman, Non-executive)
• H. F. Oxer (Non-executive)
• A.D. McCallum (Non-executive)
• R.M. Johnston (Non-executive)
• L. Hoare (Non-executive)
• P. Powell (Non-executive)
The company executives during or since the end of the financial year were:
• J. Sharman (Chief Executive Officer)
• M. Edwards (Company Secretary)
Except as noted, the named persons held their current position for the whole of the financial year and since the end of the financial year.F
or p
erso
nal u
se o
nly

Medical Developments International Limited26
Key management personnel equity holdings – fully paid ordinary shares
2017Balance at
30 June 2016 No.
Issued during the year via DRP
No.
Received on exercise of options
No.
Net Other Change
No.
Balance at 30 June 2017
No.
D.J. Williams * 17,809,855 139,115 - 21,418 17,970,388
A.D. McCallum 381,690 2,981 - - 384,671
H.F. Oxer 191,622 1,496 - - 193,118
M. Johnston 30,131 234 - - 30,365
L. Hoare 10,043 78 - - 10,121
P.J. Powell 253,180 1,977 - - 255,157
J. Sharman 28,683 1,629 800,000 (320,000) 510,312
M. Edwards - - - - -
18,705,204 147,510 800,000 (298,582) 19,354,132
* Mr. Williams acquired 30,000 shares during the year and ceased being trustee for 8,582 shares owned by Saul Williams
2016Balance at
30 June 2015 No.
Issued during the year via DRP
No.
Net Other Change
No.
Balance at 30 June 2016
No.
D.J. Williams 23,371,990 77,865 (5,640,000) 17,809,855
A.D. McCallum 477,497 1,668 (97,475) 381,690
H.F. Oxer 207,013 909 (16,300) 191,622
M. Johnston 30,000 131 - 30,131
L. Hoare 10,000 43 - 10,043
P.J. Powell 352,074 1,106 (100,000) 253,180
J. Sharman 109,230 125 (80,672) 28,683
M. Edwards - - - -
24,557,804 81,847 (5,934,447) 18,705,204
Key management personnel share option plan
In the prior year (on 18 January 2016) the company announced it has agreed to a Long-Term Incentive Plan ‘LTIP’ with Mr. John Sharman, the CEO of Medical Developments International Limited to encourage his long-term commitment to the business.
The key plan features are summarised as follows:
• A grant of 400,000 options with a strike price of $2.50 but vesting only when the MVP share price has been above $4.50 at all times for 60 continuous ASX Trading days. These options were due to expire on 28 February 2017, however vested and were exercised on 10 August 2016;
• A grant of 400,000 options with a strike price of $2.50 but vesting only when the MVP share price has been above $5.50 for 60 continuous ASX Trading days. These options were due to expire on 30 September 2017, however vested and were exercised on 5 October 2016; and
• A grant of 200,000 options with a strike price of $2.50 but vesting only when reimbursement is approved for Penthrox® in Germany or Registration is approved in Germany (whichever occurs first). These options expired on 31 December 2016.
Each share option converted into one ordinary share of Medical Developments Limited on exercise. No amounts are paid or payable by the recipient on the receipt of the option nor are they tradeable at any time. The options carried neither rights to dividends or voting rights.
Under the terms of the plan, all outstanding options were to be cancelled if Mr. Sharman leaves or is otherwise no longer employed at MVP for any reason. When the LTIP delivers an entitlement to an equity interest via the prevailing share price hurdle, Mr. Sharman will have 3 months to exercise the relevant options, after which the relevant options will lapse. In each case, 60% of the new shares issued by exercising options will be escrowed for a period of 12 months from issue date.
For
per
sona
l use
onl
y

Annual Financial Report 2017 27
There has been no alteration to the terms and conditions of the above share based payment arrangement since grant date. There has been no further issue of options in the year ended 30 June 2017.
2017 Balance at 30 June
2016 No.
Granted as remuneration
No.Exercised
No.Lapsed
No.
Balance at 30 June
2017 No.
Balance vested at 30 June
2017 but not
exercised No.
Balance not vested at 30 June
2017 N0.
Options vested during
the year No.
J. Sharman 1,000,000 - (800,000) (200,000) - - - -
2016Balance at 30
June 2015 No.
Granted as remuneration
No.
Balance at 30 June 2016
No.
Balance vested at 30
June 2016 but not exercised
No.
Balance not vested at 30 June 2016
No.
Options vested during the year
No.
J. Sharman - 1,000,000 1,000,000 400,000 600,000 400,000
Share options made to Mr. Sharman were made in accordance with the provisions of the employee share option plan. The above represented the only existing options over shares as at 30 June 2016. All vested options are exercisable. These options do not have the right, by virtue of the option, to participate in share issues or interest issue of the company.
Issuing Entity TrancheNumber of shares
under optionClass of shares
Exercise price of option
Expiry date of options
Medical Developments International Ltd 1 400,000 Ordinary $2.50 28-Feb-17
Medical Developments International Ltd 2 400,000 Ordinary $2.50 30-Sep-17
Medical Developments International Ltd 3 200,000 Ordinary $2.50 31-Dec-16
1,000,000
Tranche 1 – was exercised on 10 August 2016. Tranche 2 – was exercised on 5 October 2016. Tranche 3 – Lapsed on 31 December 2016.
Remuneration Policy
The board continues to set remuneration at a level that will attract directors and executives of high calibre. The two key elements are:
• base salary and fees, which are determined by reference to the market rate based on payments at similar sized companies in the industry; and
• Performance incentives, which have two components – short term incentives based on achieving key performance indicators during the year and payable in cash, and long-term incentives payable in equity, the value of which depends on the share price of the company.
The remuneration and nominations committee, comprised of D.J. Williams and A.D. McCallum, determines the salary package of the CEO of the company and reviews the
compensation of the non-executive directors on an annual basis. Changes are approved by the board as a whole.
Relationship between the Remuneration Policy and Company Performance
The board aims to ensure there is a strong link between company performance and remuneration and believes that the use of performance incentives ensures that company performance is reflected in the quantum of payments made to executives. Performance metrics are selected to ensure that the interests of management are aligned with those of shareholders. For short term incentives, key metrics are NPAT (net profit after tax), used to directly link company earnings and cash bonuses and other operational measures, the achievement of which provides the basis for future growth and profitability.
For
per
sona
l use
onl
y

Medical Developments International Limited28
The table and graph below depict the company’s earnings for the current financial year and the previous seven financial years, which demonstrate that the company has been consistently profitable.
2010 2011 2012 2013 2014 2015 2016 2017
3,000
2,500
2,000
1,500
1,000
500
0
$’00
0
Net Profit After Tax 2010-2017
The following table shows the company’s share prices for the current financial year and the previous seven financial years.
2010 2011 2012 2013 2014 2015 2016 2017
Share price - start ($) 0.18 0.22 0.40 0.79 1.27 1.32 2.68 6.10
Share price - end ($) 0.22 0.40 0.79 1.27 1.32 2.68 6.10 4.95
Interim Dividend (cps)* - - 3.00 3.00 - - 2.00 2.00
Final Dividend (cps)* - 3.00 3.00 2.00 - - 2.00 2.00
Basic Earnings per Share (cps) 1.70 3.40 5.10 4.10 1.50 2.65 2.70 3.10
Diluted Earnings per Share (cps) 1.70 3.40 5.10 4.10 1.50 2.65 2.65 3.10
*Franked to 100% at 30% corporate income tax rate.
Dividends
A further 2c full franked dividend per fully paid ordinary share has been declared for the full year.
Elements of director and executive remuneration
Remuneration packages contain the following key elements:
1. Primary benefits – salary/fees and cash bonuses
2. Post-employment benefits – superannuation
3. Equity – rights to shares granted under the Chief Executive Officer Long Term Incentive Plan (CEO LTIP).
For
per
sona
l use
onl
y

Annual Financial Report 2017 29
The following table discloses the remuneration of the directors of the company in 2017:
2017Short-Term Employee
BenefitsPost
Employment
Long-term employee benefits
Share-Based Payments Total
Salary & Fees $
Bonus $
Superannuation $
Long service leave
$
Options & Rights
$ $
Directors
D.J. Williams 50,493 - 22,797 - - 73,290
A.D. McCallum 41,096 - 3,904 - - 45,000
H.F. Oxer 41,096 - 3,904 - - 45,000
M. Johnston 41,096 - 3,904 - - 45,000
L. Hoare 41,096 - 3,904 - - 45,000
P.J. Powell 31,096 - 12,954 - - 44,050
245,973 - 51,367 - - 297,340
2017Short-Term Employee
BenefitsPost
Employment
Long-term employee benefits
Share-Based Payments Total
Remuneration Linked to
performance
Salary & Fees
$Bonus
$Superannuation
$
Long service leave
$
Options & Rights
$ $
Executives
J. Sharman (Chief Executive Officer)
299,834 162,500 25,166 14,425 13,399 515,324 32%
M. Edwards (Company Secretary)
154,642 4,566 15,125 581 - 174,914 3%
454,476 167,066 40,290 15,006 13,399 690,238
Both Mr Sharman and Mr Edwards remuneration comprised a performance related component of $162,500 and $4,566 respectively. No directors remuneration contained a performance related component.
(i) The value of the options granted to Mr Sharman as part of his remuneration was calculated at grant date using a Monte Carlo simulation pricing model. The model estimates the achievement of the vesting hurdles and calculated the present value of the payoff on vesting. This value is amortised over potential vesting period and disclosed as part of remuneration for the financial year with an adjustment made to remuneration expense for any options vesting earlier or probable to do so.
For
per
sona
l use
onl
y

Medical Developments International Limited30
The following table discloses the remuneration of the directors of the company in 2016:
2016Short-Term Employee
BenefitsPost
Employment
Long-term employee benefits
Share-Based Payments Total
Salary & Fees $
Bonus $
Superannuation $
Long service leave
$
Options & Rights
$ $
Directors
D.J. Williams 61,644 - 5,856 - - 67,500
A.D. McCallum 37,671 - 3,579 - - 41,250
H.F. Oxer 37,671 - 3,579 - - 41,250
M. Johnston 37,671 - 3,579 - - 41,250
L. Hoare 37,671 - 3,579 - - 41,250
P.J. Powell 19,671 - 19,869 - - 39,540
231,999 - 40,041 - - 272,040
The following table discloses the remuneration of the key executives of the company in 2016:
2016Short-Term Employee
BenefitsPost
Employment
Long-term employee benefits
Share-Based Payments Total
Remuneration Linked to
performance
Salary & Fees
$Bonus
$Superannuation
$
Long service leave
$
Options & Rights
$ $
Executives
J. Sharman (Chief Executive Officer)
290,664 30,000 26,314 14,425 318,185 679,588 4%
M. Edwards (Company Secretary)
145,453 4,566 14,207 581 - 164,807 3%
436,117 34,566 40,521 15,006 318,185 844,395
No key management personnel appointed during the period received a payment as part of his or her consideration for agreeing to hold the position.
Elements of remuneration related to performance
Fees paid to non-executive directors are not directly tied to performance. Salaries paid to the key executives are also not directly tied to performance. The short term and long-term incentive programmes are directly related to performance, and the conditions and assessment methods are explained below.
Short-term incentives
The determination and approval of any potential bonuses is at the discretion of the Board.
During the 2017 financial year, discretionary bonuses totalling $167,066 (2016: $34,566) were determined and approved by the Remuneration and Nominations Committee in relation to key management personnel in respect of their performance in the 2016 financial year.
Contracts for services
Mr Sharman is employed under an open-ended contract with a notice period of three months. The contract does not provide for any termination payments beyond payment for the notice period and any accrued annual leave.
For
per
sona
l use
onl
y

Annual Financial Report 2017 31
Mr Edwards is employed under an open-ended contract with a notice period of four weeks. The contract does not provide for any termination payments beyond payment for the notice period and any accrued annual leave.
Non-audit services
The directors are satisfied that the provision of non-audit services, during the year, by the auditor (or by another person or firm on the auditor’s behalf) is compatible with the general standard of independence for auditors imposed by the Corporations Act 2001. The non-audit services related to the provision of taxation and other accounting and assurance services and totalled $26,075. The directors do not believe that the provision of advice of this nature compromises the general principles relating to auditor’s independence, as set out by the Institute of Chartered Accountants in Australia.
Details of amounts paid or payable to the auditor for non-audit services provided during the year by the auditor are outlined in note 7 to the financial statements.
Auditor’s independence declaration
The auditor’s independence declaration is included on page 32 of the annual report.
Rounding off of amounts
The Company is a Company of the kind referred to in ASIC Corporations (rounding in Financial/Director’s Reports) Instrument 2016/191 dated 24 March 2016, and in accordance with that Corporations Instrument, amounts in the directors’ report and the financial statements are rounded off to the nearest thousand dollars, unless otherwise indicated.
Signed in accordance with a resolution of the directors made pursuant to s.298(2) of the Corporations Act 2001.
On behalf of the directors.
David Williams
Chairman
Melbourne, 18 August 2017
For
per
sona
l use
onl
y

Medical Developments International Limited32
For
per
sona
l use
onl
y

33Annual Financial Report 2017
For
per
sona
l use
onl
y

34 Medical Developments International Limited
For
per
sona
l use
onl
y

35Annual Financial Report 2017
For
per
sona
l use
onl
y

36 Medical Developments International Limited
For
per
sona
l use
onl
y

Annual Financial Report 2017 37
Directors’ DeclarationThe directors declare that:
a) in the directors’ opinion, there are reasonable grounds to believe that the company will be able to pay its debts as and when they become due and payable;
b) in the directors’ opinion, the attached financial statements and notes thereto are in accordance with the Corporations Act 2001, including compliance with accounting standards and giving a true and fair view of the financial position and performance of the consolidated entity;
c) the attached financial statements are in compliance with International Financial Reporting Standards, as stated in note 1 of the financial statements; and
d) the directors have been given the declarations required by s.295A of the Corporations Act 2001.
Signed in accordance with a resolution of the directors made pursuant to s.295(5) of the Corporations Act 2001.
On behalf of the Directors
David Williams
Chairman
Melbourne, 18 August 2017
For
per
sona
l use
onl
y
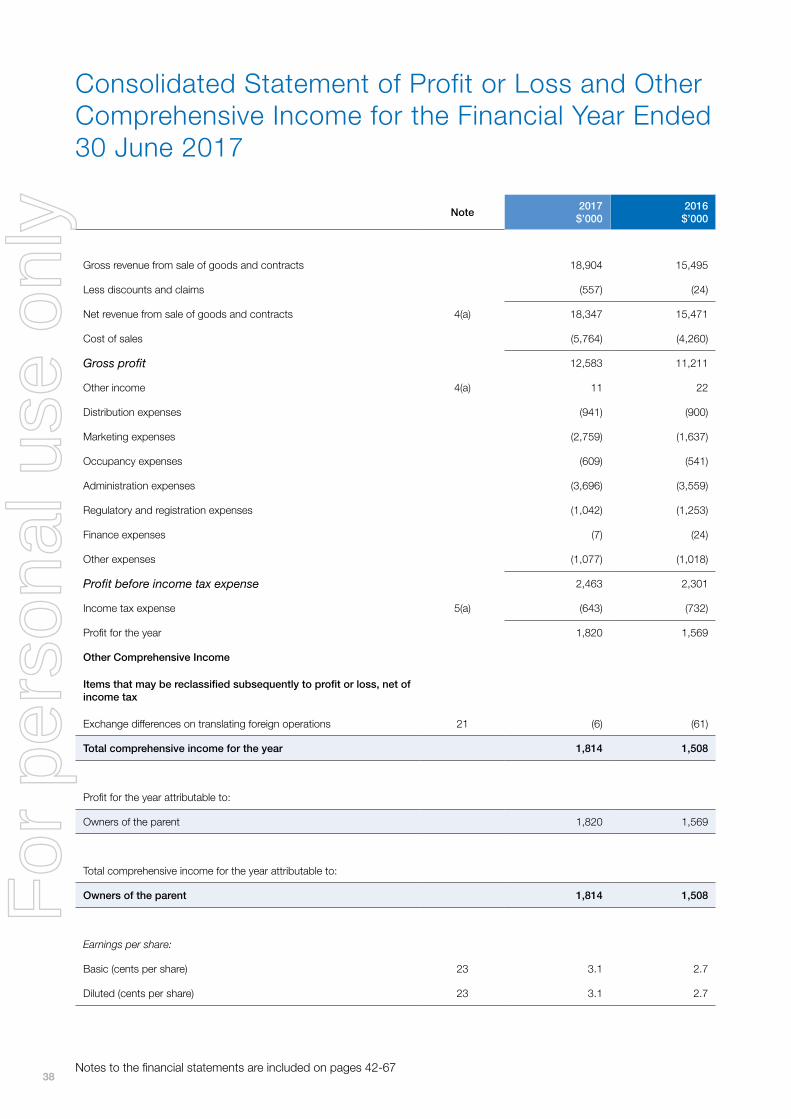
38
Consolidated Statement of Profit or Loss and Other Comprehensive Income for the Financial Year Ended 30 June 2017
Note2017 $’000
2016 $’000
Gross revenue from sale of goods and contracts 18,904 15,495
Less discounts and claims (557) (24)
Net revenue from sale of goods and contracts 4(a) 18,347 15,471
Cost of sales (5,764) (4,260)
Gross profit 12,583 11,211
Other income 4(a) 11 22
Distribution expenses (941) (900)
Marketing expenses (2,759) (1,637)
Occupancy expenses (609) (541)
Administration expenses (3,696) (3,559)
Regulatory and registration expenses (1,042) (1,253)
Finance expenses (7) (24)
Other expenses (1,077) (1,018)
Profit before income tax expense 2,463 2,301
Income tax expense 5(a) (643) (732)
Profit for the year 1,820 1,569
Other Comprehensive Income
Items that may be reclassified subsequently to profit or loss, net of income tax
Exchange differences on translating foreign operations 21 (6) (61)
Total comprehensive income for the year 1,814 1,508
Profit for the year attributable to:
Owners of the parent 1,820 1,569
Total comprehensive income for the year attributable to:
Owners of the parent 1,814 1,508
Earnings per share:
Basic (cents per share) 23 3.1 2.7
Diluted (cents per share) 23 3.1 2.7
Notes to the financial statements are included on pages 42-67
For
per
sona
l use
onl
y

Annual Financial Report 2017 39
Consolidated Statement of Financial Position as at 30 June 2017
Note30 June 2017
$’000 30 June 2016
$’000
Current Assets
Cash and cash equivalents 29(a) 1,691 5,620
Trade and other receivables 8 5,232 7,520
Inventories 9 2,424 2,667
Current tax receivable 5(c) 209 -
Other 10 323 244
Total Current Assets 9,879 16,051
Non-Current Assets
Property, plant and equipment 12 6,637 2,614
Deferred tax assets 5(d) 1,282 1,928
Goodwill 13 8,874 8,874
Other intangible assets 14 15,092 11,772
Total Non-Current Assets 31,885 25,188
Total Assets 41,764 41,239
Current Liabilities
Trade and other payables 15 2,737 2,518
Borrowings 16 146 143
Provisions 17 346 254
Current tax liabilities 5(c) - 4,124
Other 19 2,077 1,772
Total Current Liabilities 5,306 8,811
Non-Current Liabilities
Borrowings 16 283 338
Provisions 18 159 114
Other 19 14,416 12,951
Total Non-Current Liabilities 14,858 13,403
Total Liabilities 20,164 22,214
Net Assets 21,600 19,025
Equity
Issued capital 20 15,008 11,916
Reserves 21 264 257
Retained earnings 22 6,328 6,852
Total Equity 21,600 19,025
Notes to the financial statements are included on pages 42-67
For
per
sona
l use
onl
y

Medical Developments International Limited40
Consolidated Statement of Changes in Equity for the Financial Year Ended 30 June 2017
2017 Issued capital $’000
Retained earnings
$’000
Employee equity settled benefits reserve $’000
Foreign currency
translation reserve $’000
Total $’000
Opening balance 11,916 6,852 318 (61) 19,025
Profit for the year - 1,820 - - 1,820
Other comprehensive income for the year, net of income tax - - - (6) (6)
Total comprehensive income for the year - 1,820 - (6) 1,814
Share based payments - - 13 - 13
Dividends paid - (2,344) - - (2,344)
Shares issue as part of ESS 2,000 - - - 2,000
Dividends reinvested in the form of shares 1,107 - - - 1,107
Equity raising costs (15) - - - (15)
Closing balance 15,008 6,328 331 (67) 21,600
Financial Year Ended 30 June 2016
2016 Issued capital $’000
Retained earnings
$’000
Employee equity settled benefits reserve $’000
Foreign currency
translation reserve $’000
Total $’000
Opening balance 10,946 6,440 - 21 17,407
Profit for the year - 1,569 - - 1,569
Other comprehensive income for the year, net of income tax - - - (82) (82)
Total comprehensive income for the year - 1,569 - (82) 1,487
Share based payments - - 318 - 318
Dividends paid - (1,157) - - (1,157)
Shares issue related to business acquisition 440 - - - 440
Dividends reinvested in the form of shares 534 - - - 534
Equity raising costs (4) - - - (4)
Closing balance 11,916 6,852 318 (61) 19,025
Notes to the financial statements are included on pages 42-67
For
per
sona
l use
onl
y

Annual Financial Report 2017 41
Consolidated Statement of Cash Flows for the Financial Year Ended 30 June 2017
Note2017 $’000
2016 $’000
Cash flows from operating activities
Receipts from customers 14,704 12,689
Payments to suppliers and employees (14,049) (11,050)
Receipts from government grants 347 -
Upfront and milestone payments received 7,350 10,858
Interest paid (7) (24)
Income tax paid (4,334) (406)
Net cash generated by operating activities 29(b) 4,011 12,067
Cash flows from investing activities
Interest received 11 22
Payments for plant and equipment (4,353) (1,421)
Payments for other intangible assets (4,324) (2,724)
Payments for business acquisition - (2,029)
Net cash used in investing activities (8,666) (6,152)
Cash flows from financing activities
Dividends paid (net of DRP) 24 (1,238) (623)
Proceeds from the issue of shares 2,000 -
Share issue transaction costs (15) (4)
Payments for hire purchase finance 16 (52) (92)
Repayment of borrowings 16 - (538)
Net cash generated by/(used in) financing activities 695 (1,257)
Net (decrease)/increase in cash and cash equivalents (3,960) 4,658
Cash and cash equivalents at the beginning of the financial year 5,620 954
Effects of exchange rate changes on the balance of cash held in foreign currencies
31 8
Cash and cash equivalents at the end of the financial year 29(a) 1,691 5,620
Notes to the financial statements are included on pages 42-67
For
per
sona
l use
onl
y

Medical Developments International Limited42
1. Significant accounting policies
Statement of Compliance
The financial report is a general purpose financial report which has been prepared in accordance with the Corporations Act 2001, Australian Accounting Standards and Interpretations, and complies with other requirements of the law.
The financial statements comprise the consolidated financial statements of the Group.
For the purposes of preparing the consolidated financial statements, the Company is a for-profit entity. Accounting Standards include Australian Accounting Standards. Compliance with Australian Accounting Standards ensures that the financial statements and notes of the company comply with International Financial Reporting Standards (‘IFRS’).
The financial statements were authorised for issue by the directors on 18 August 2017.
Basis of Preparation
The consolidated financial statements have been prepared on the basis of historical cost, except for certain non-current assets and financial instruments that are measured at revalued amounts or fair values, as explained in the accounting policies below. Historical cost is generally based on the fair values of the consideration given in exchange for goods and services. All amounts are presented in Australian dollars, unless otherwise noted.
Fair value is the price that would be received to sell an asset or paid to transfer a liability in an orderly transaction between market participants at the measurement date, regardless of whether that price is directly observable or estimated using another valuation technique. In estimating the fair value of an asset or a liability, the Group takes into account the characteristics of the asset or liability if market participants would take those characteristics into account when pricing the asset or liability at the measurement date. Fair value
for measurement and/or disclosure purposes in these consolidated financial statements is determined on such a basis, except for share-based payment transactions that are within the scope of AASB 2, leasing transactions that are within the scope of AASB 117, and measurements that have some similarities to fair value but are not fair value, such as net realisable value in AASB 2 or value in use in AASB 136.
In addition, for financial reporting purposes, fair value measurements are categorised into Level 1, 2 or 3 based on the degree to which the inputs to the fair value measurements are observable and the significance of the inputs to the fair value measurement in its entirety, which are described as follows:
• Level 1 inputs are quoted prices (unadjusted) in active markets for identical assets or liabilities that the entity can access at the measurement date;
• Level 2 inputs are inputs, other than quoted prices included within Level 1, that are observable for the asset or liability, either directly or indirectly; and
• Level 3 inputs are unobservable inputs for the asset or liability.
The company is a company of the kind referred to in ASIC Class Order 98/0100, dated 10 July 1998, and in accordance with that Class Order amounts in the financial report are rounded off to the nearest thousand dollars, unless otherwise noted.
Basis of consolidation
The consolidated financial statements incorporate the financial statements of the Company and entities (including special purpose entities) controlled by the Company (its subsidiaries). Control is achieved where the Company has the power to govern the financial and operating policies of an entity so as to obtain benefits from its activities.
Income and expense of subsidiaries acquired or disposed of during the year are included in the consolidated statement of profit or loss and other comprehensive income from the effective date of acquisition and up to the effective date of disposal, as appropriate. Total comprehensive income of subsidiaries is attributed to the owners of the Company and
Notes to the Financial Statements for the Financial Year Ended 30 June 2017
For
per
sona
l use
onl
y

Annual Financial Report 2017 43
Not
es to
the
Fina
ncia
l Sta
tem
ents
to the non-controlling interests even if this results in the non-controlling interests having a deficit balance.
Where necessary, adjustments are made to the financial statements of subsidiaries to bring their accounting policies into line with those used by other members of the Group.
All intra-group transactions, balances, income and expenses are eliminated in full on consolidation.
Changes in the Group’s ownership interests in subsidiaries that do not result in the Group losing control are accounted for as equity transactions. The carrying amounts of the Group’s interests and the non-controlling interests are adjusted to reflect the changes in their relative interests in the subsidiaries. Any difference between the amount by which the non-controlling interests are adjusted and the fair value of the consideration paid or received is recognised directly in equity and attributed to owners of the Company.
Significant accounting policies
The following significant accounting policies have been adopted in the preparation and presentation of the financial report:
(a) Borrowings
Borrowings are recorded initially at fair value, net of transaction costs.
Subsequent to initial recognition, borrowings are measured at amortised cost with any difference between the initial recognised amount and the redemption value being recognised in profit and loss over the period of the borrowing using the effective interest rate method.
(b) Cash and cash equivalents
Cash and cash equivalents comprise cash on hand, cash in banks and investments in money market instruments, net of outstanding bank overdrafts.
(c) Employee benefits
A liability is recognised for benefits accruing to employees in respect of wages and salaries, annual leave, long service leave, and sick leave when it is probable that settlement will be required and they are capable of being measured reliably.
Liabilities recognised in respect of wages and salaries, annual leave and sick leave expected to be settled within 12 months, are measured at their nominal values using the remuneration rate expected to apply at the time of settlement.
Liabilities recognised in respect of annual leave and long service leave which are not expected to be settled within 12 months are measured using an estimate of the present value of the future cash outflows to be made by the company in respect of services provided by employees up to reporting date.
(d) Financial assets
Loans and receivables
Trade receivables, loans, and other receivables that have fixed or determinable payments that are not quoted in an active market are classified as ‘loans and receivables’. Loans and receivables are measured at amortised cost using the effective interest rate method less impairment.
Interest income is recognised by applying the effective interest rate.
Impairment of financial assets
Financial assets, other than those at fair value through profit and loss, are assessed for indicators of impairment at each balance sheet date. Financial assets are impaired where there is objective evidence that as a result of one or more events that occurred after the initial recognition of the financial asset, the estimated future cash flows of the investment have been impacted.
(e) Financial instruments issued by the company
Debt and equity instruments
Debt and equity instruments are classified as either liabilities or as equity in accordance with the substance of the contractual arrangement.
Transaction costs on the issue of equity instruments
Transaction costs arising on the issue of equity instruments are recognised directly in equity as a reduction of the proceeds of the equity instruments to which they relate. Transaction costs are the costs that are incurred directly in connection with the issue of those equity instruments and would not have been incurred had those instruments not been issued.
Interest and dividends
Interest and dividends are classified as expenses or as distributions of profit consistent with the balance sheet classification of the related debt or equity instruments or component parts of compound instruments.
(f) Foreign currency
The individual financial statements of each group entity are presented in the currency of the primary economic environment in which the entity operates (its functional currency). For the purpose of the consolidated financial statements, the results and financial position of each group entity are expressed in Australian dollars (‘$’), which is the functional currency of the Company and the presentation currency for the consolidated financial statements.
In preparing the financial statements of each individual group entity, transactions in currencies other than the entity’s functional currency (foreign currencies) are recognised at the rates of exchange prevailing at the dates of the transactions. At the end of each reporting period, monetary items denominated in foreign currencies are retranslated at
For
per
sona
l use
onl
y

Medical Developments International Limited44
the rates prevailing at that date. Non-monetary items carried at fair value that are denominated in foreign currencies are retranslated at the rates prevailing at the date when the fair value was determined. Non-monetary items that are measured in terms of historical cost in a foreign currency are not retranslated.
Exchange differences on monetary items are recognised in profit or loss in the period in which they arise, except for:
• exchange differences on foreign currency borrowings relating to assets under construction for future productive use, which are included in the cost of those assets when they are regarded as an adjustment to interest costs on those foreign currency borrowings;
• exchange differences on transactions entered into in order to hedge certain foreign currency risks below for hedging accounting policies; and
• exchange differences on monetary items receivable from or payable to a foreign operation for which settlement is neither planned nor likely to occur (therefore forming part of the net investment in the foreign operation), which are recognised initially in other comprehensive income and reclassified from equity to profit or loss on repayment of the monetary items.
For the purpose of presenting consolidated financial statements, the assets and liabilities of the Group’s foreign operations are translated into Australian dollars using exchange rates prevailing at the end of the reporting period. Income and expense items are translated at the average exchange rates for the period, unless exchange rates fluctuated significantly during that period, in which case the exchange rates at the dates of the transactions are used. Exchange differences arising, if any, are recognised in other comprehensive income and accumulated in equity (attributed to non-controlling interests as appropriate).
(g) Goods and services tax
Revenues, expenses and assets are recognised net of the amount of goods and services tax (GST), except:
• where the amount of GST incurred is not recoverable from the taxation authority, it is recognised as part of the cost of acquisition of an asset or as part of an item of expense; or
• for receivables and payables which are recognised inclusive of GST.
The net amount of GST recoverable from, or payable to, the taxation authority is included as part of receivables or payables.
Cash flows are included in the Consolidated Statement of Cash Flows on a gross basis. The GST component of cash flows arising from investing and financing activities which is recoverable from, or payable to, the taxation authority is classified as operating cash flows.
(h) Goodwill
Goodwill, representing the excess of the cost of acquisition over the fair value of the identifiable net assets acquired, is recognised as an asset and not amortised but tested for impairment annually and whenever there is an indication that the goodwill may be impaired. Any impairment is recognised immediately in the Consolidated Statement of Profit or Loss and Other Comprehensive Income and is not subsequently reversed. Refer also to note 1(j).
(i) Government grants
Government grants are assistance by the government in the form of transfers of resources to the company in return for past or future compliance with certain conditions relating to the operating activities of the company. Government grants include government assistance where there are no conditions specifically relating to the operating activities of the company other than the requirement to operate in certain regions or industry sectors.
Government grants relating to income are recognised as income over the periods necessary to match them with the related costs. Government grants that are receivable as compensation for expenses or losses already incurred or for the purpose of giving immediate financial support to the company with no future related costs are recognised as income of the period in which it becomes receivable.
Government grants relating to assets are treated as deferred income and recognised in the profit and loss over the expected useful lives of the assets concerned.
(j) Impairment of assets
At each reporting date, the company reviews the carrying amounts of its tangible and intangible assets to determine whether there is any indication that those assets have suffered an impairment loss. If any such indication exists, the recoverable amount of the asset is estimated in order to determine the extent of the impairment loss (if any). Where the asset does not generate cash flows that are independent from other assets, the company estimates the recoverable amount of the cash generating unit to which the asset belongs.
Goodwill, intangible assets with indefinite useful lives and intangible assets not yet available for use are tested for impairment annually and whenever there is an indication that the asset may be impaired. An impairment of goodwill is not subsequently reversed. Recoverable amount is the higher of fair value less costs to sell and value in use. In assessing value in use, the estimated future cash flows are discounted to their present value using a pre-tax discount rate that reflects current market assessments of the time value of money and the risks specific to the asset for which the estimates of future cash flows have not been adjusted.
If the recoverable amount of an asset (or cash-generating unit) is estimated to be less than its carrying amount, the
For
per
sona
l use
onl
y

Annual Financial Report 2017 45
carrying amount of the asset (or cash-generating unit) is reduced to its recoverable amount. An impairment loss is recognised in the Consolidated Statement of Profit or Loss and Other Comprehensive Income immediately, unless the relevant asset is carried at fair value, in which case the impairment loss is treated as a revaluation decrease.
Where an impairment loss (other than Goodwill) subsequently reverses, the carrying amount of the asset (or cash generating unit) is increased to the revised estimate of its recoverable amount, but only to the extent that the increased carrying amount does not exceed the carrying amount that would have been determined had no impairment loss been recognised for the asset (or cash-generating unit) in prior years. A reversal of an impairment loss is recognised in profit or loss immediately, unless the relevant asset is carried at fair value, in which case the reversal of the impairment loss is treated as a revaluation increase.
(k) Income tax
Current tax
Current tax is calculated by reference to the amount of income taxes payable or recoverable in respect of the taxable profit or loss for the period. It is calculated using tax rates and tax laws that have been enacted or substantively enacted by reporting date. Current tax for current and prior periods is recognised as a liability (or asset) to the extent that it is unpaid (or refundable).
Where the Group qualifies for the research and development tax incentive refund (at 45%), this reduces the current tax expense recognised in profit and loss for the period.
Deferred tax
Deferred tax is accounted for using the comprehensive balance sheet liability method in respect of temporary differences arising from differences between the carrying amount of assets and liabilities in the financial statements and the corresponding tax base of those items.
In principle, deferred tax liabilities are recognised for all taxable temporary differences. Deferred tax assets are recognised to the extent that it is probable that sufficient taxable amounts will be available against which deductible temporary differences or unused tax losses and tax offsets can be utilised. However, deferred tax assets and liabilities are not recognised if the temporary differences giving rise to them arise from the initial recognition of assets and liabilities (other than as a result of a business combination) which affects neither taxable income nor accounting profit. Furthermore, a deferred tax liability is not recognised in relation to taxable temporary differences arising from goodwill.
Deferred tax assets and liabilities are measured at the tax rates that are expected to apply to the period(s) when the asset and liability giving rise to them are realised or settled,
based on tax rates (and tax laws) that have been enacted or substantively enacted by reporting date. The measurement of deferred tax liabilities and assets reflects the tax consequences that would follow from the manner in which the company expects, at the reporting date, to recover or settle the carrying amount of its assets and liabilities.
Deferred tax assets and liabilities are offset when they relate to income taxes levied by the same taxation authority and the company intends to settle its current tax assets and liabilities on a net basis.
Current and deferred tax for the period
Current and deferred tax is recognised as an expense or income in the Consolidated Statement of Profit or Loss and Other Comprehensive Income, except when it relates to items credited or debited directly to equity, in which case the deferred tax is also recognised directly in equity, or where it arises from the initial accounting for a business combination, in which case it is taken into account in the determination of goodwill or excess.
(l) Intangible assets
Patents, trademarks and licenses
Patents, trademarks and licenses are recorded at cost less accumulated amortisation and impairment. Amortisation is charged on a straight-line basis over their estimated useful lives of 10 years. The estimated useful life and amortisation method is reviewed at the end of each annual reporting period.
Research and development costs
Expenditure on research activities is recognised as an expense in the period in which it is incurred. Where no internally-generated intangible asset can be recognised, development expenditure is recognised as an expense in the period as incurred.
An intangible asset arising from development (or from the development phase of an internal project) is recognised if, and only if, all of the following are demonstrated:
• the technical feasibility of completing the intangible asset so that it will be available for use or sale;
• the intention to complete the intangible asset and use or sell it;
• the ability to use or sell the intangible asset;
• how the intangible asset will generate probable future economic benefits;
• the availability of adequate technical, financial and other resources to complete the development and to use or sell the intangible asset; and
• the ability to measure reliably the expenditure attributable to the intangible asset during its development.
For
per
sona
l use
onl
y

Medical Developments International Limited46
Internally-generated intangible assets in respect of development costs are stated at cost less accumulated amortisation and impairment, and are amortised on a straight-line basis over their estimated useful life of 5 years commencing from the date that revenue results.
Registration costs
Items of expenditure on registrations are capitalised to the extent that such costs can be measured reliably, future economic benefits are attributable to the expenditure, and it is probable that such future economic benefits will eventuate.
Any capitalised registration costs are amortised over a period of 5 - 20 years in which the corresponding benefits are expected to arise, commencing from commercial sales to any of the countries for which the registration costs contributed to a successful registration.
The unamortised balance of registration costs capitalised in previous periods is reviewed regularly at each reporting date, to ensure the criteria for deferral continue to be met. Where such costs are no longer recoverable, they are written off as an expense in the Consolidated Statement of Profit or Loss and Other Comprehensive Income.
Brandnames
Brandnames arising on acquisition of a business are carried at cost as established at the date of acquisition of the business less any applicable impairment charge (if any). They are not amortised but subject to annual tests for impairment. For the purposes of impairment testing, brandnames are allocated to the relevant Group cash generating unit to which they relate.
(m) Inventories
Inventories are valued at the lower of cost and net realisable value. Costs, including an appropriate portion of fixed and variable overhead expenses, are assigned to inventory on hand by the method most appropriate to each particular class of inventory, with the majority being valued on a first in first out basis. Net realisable value represents the estimated selling price less all estimated costs of completion and costs to be incurred in marketing, selling and distribution.
(n) Leases
Leases are classified as finance leases whenever the terms of the lease transfer substantially all the risks and rewards of ownership to the lessee. The company currently does not have any finance leases. All other leases are classified as operating leases.
Operating lease payments are recognised as an expense on a straight-line basis over the lease term, except where another systematic basis is more representative of the time pattern in which economic benefits from the leased asset are consumed.
(o) Financial Liabilities
Trade payables and other accounts payable are classified as financial liabilities and are recognised when the company becomes obliged to make future payments resulting from the purchase of goods and services. Financial liabilities are initially measured at fair value, net of transaction costs.
Financial liabilities are subsequently measured at amortised cost using the effective interest rate method, with interest expense recognised on an effective yield basis.
The effective interest rate method is a method of calculating the amortised cost of a financial liability and of allocating interest expense over the relevant period. The effective interest rate is the rate that exactly discounts estimated future cash payments through the expected life of the financial liability, or where appropriate, a shorter period.
(p) Plant and equipment
Plant and equipment and leasehold improvements are stated at cost less accumulated depreciation and impairment. Cost includes expenditure that is directly attributable to the acquisition of the item. In the event that settlement of all or part of the purchase consideration is deferred, cost is determined by discounting the amounts payable in the future to their present value as at the date of the acquisition. Other than the charge over the groups assets held in relation to the bank bill loan, all other assets are not encumbered by any additional charge or mortgage.
Depreciation
Depreciation is provided on plant and equipment and is calculated on a straight-line basis so as to write off the cost of each asset over its expected useful life to its estimated residual value. Leasehold improvements are depreciated over the period of the lease or estimated useful life, whichever is the shorter, using the straight-line method. The estimated useful lives, residual values and depreciation method are reviewed at the end of each annual reporting period.
The following estimated useful lives are used in the calculation of depreciation:
Leasehold improvements 5 years Plant and equipment 4 -10 years
(q) Provisions
Provisions are recognised when the Group has a present obligation, the future sacrifice of economic benefits is probable, and the amount of the provision can be measured reliably.
The amount recognised as a provision is the best estimate of the consideration required to settle the present obligation at reporting date, taking into account the risks and uncertainties surrounding the obligation. Where a provision is measured using the cashflows estimated to settle the
For
per
sona
l use
onl
y

Annual Financial Report 2017 47
present obligation, its carrying amount is the present value of those cashflows.
When some or all of the economic benefits required to settle a provision are expected to be recovered from a third party, the receivable is recognised as an asset if it is probable that recovery will be received and the amount of the receivable can be measured reliably.
Dividends
A liability is recognised for dividends when they have been declared, determined or publicly recommended by the directors on or before the reporting date.
(r) Revenue recognition
Sale of goods
Revenue from the sale of goods is recognised when the company has transferred to the buyer the significant risks and rewards of ownership of the goods. Settlement and volume discounts granted to customers are accounted as offsets against sales. Management is assessing the impact on the above of the new AASB 15 ‘Revenue from Contracts with customers’ accounting standard with no material changes anticipated.
Interest income
Interest income is recognised on a time proportionate basis that takes into account the effective yield on the financial asset.
(s) Share based payments
Equity-settled share-based payments granted are measured at fair value at the date of grant. Fair value is measured by use of a Monte Carlo valuation model.
The fair value determined at the grant date of the equity-settled share-based payments is expensed on a straight-line basis over the vesting period, based on the company’s estimate of options that will eventually vest. Details regarding the fair value of equity-settle share based transactions are set out in note 32.
The fair value determined at the grant date of the equity settled share based payments is expensed on a straight line based over the vesting period, based on the Group’s estimated of equity instruments that will eventually vest, with a corresponding increase in equity. At the end of the reporting period, the Group revises its estimate of the number of equity instruments expected to vest and the impact of any revision on the original estimates is also recognised in the profit and loss.
(t) Research and development recoveries
R&D tax credits receivable as compensation for expenses or losses already incurred by the Company with no future related costs are recognised in profit or loss in the period in which they are quantified and become receivable.
The company applies the income tax approach for the accounting and presentation of the R&D tax credit. Accordingly, the tax benefit is presented as a reduction of income tax expense in the Statement of Profit or loss and other Comprehensive Income.
(u) Application of new and revised Accounting Standards
In the current year, the Group has applied an amendment to AASBs issued by the Australian Accounting Standards Board (AASB) that are mandatorily effective for an accounting period that begins on or after 1 July 2016, and therefore relevant for the current year end:
• AASB 1057 Application of Australian Accounting Standards and AASB 2015-9 Amendments to Australian Accounting Standards - Scope and Application Paragraphs;
• AASB 2014-4 Amendments to Australian Accounting Standards - Clarification of Acceptable Methods of Depreciation and Amortisation;
• AASB 2015-1 Amendments to Australian Accounting Standards - Annual Improvements to Australian Accounting Standards 2012-2014 Cycle; and
• AASB 2015-2 Amendments to Australian Accounting Standards - Disclosure Initiative: Amendments to MSB 101.
The application of these amendment does not have any material impact on the disclosures or the amounts recognised in the Group’s consolidated financial statements.
Changes in accounting policy since the most recent interim financial report
In accordance with AASB138 ‘Intangible Assets’, the Group has voluntarily changed its account policy in relation to capitalising deferred registration costs during the current year. The Group now capitalises specific internal labour time spent on select Regulatory and Clinical Development projects, rather than expensing them to the income statement which has been the historical practice. This change in policy is being applied from 1 July 2016 and has resulted in the capitalisation of approximately $431,823 of time over the 12-month period. This includes $205,085 of internal labour cost that was initially expensed in the interim financial Report for the 6 months ended 31 December 2016 and has now been restated and capitalised for the full year.
For
per
sona
l use
onl
y

Medical Developments International Limited48
Standards and Interpretations in issue not yet adopted
At the date of authorisation of the financial statements, the Standards and Interpretations that were issued but not yet effective are listed below. The Company does not expect that upon adoption that there will be any significant impact on the financial statements.
Standard/InterpretationEffective for annual reporting periods beginning on or after
Expected to be initially applied in the financial year ending
AASB 9 ‘Financial Instruments’ 1 January 2018 30 June 2019
AASB 15 ‘Revenue from Contracts with Customers’, AASB 2014-5 ‘Amendments to Australian Accounting Standards arising from AASB 15’, AASB 2015-8 ‘Amendments to Australian Accounting Standards – Effective Date of AASB 15’, and AASB 2016-3 ‘Amendments to Australian Accounting Standards – Clarifications to AASB 15’
1 January 2018 30 June 2019
AASB Interpretation 22 ‘Foreign Currency Transactions and Advance Consideration’
1 January 2018 30 June 2019
AASB 16 ‘Leases’ 30 June 2020
AASB 2017-2 ‘Amendments to Australian Accounting Standards - Further Annual Improvements 2014-2016 Cycle’
1 January 2018 30 June 2019
AASB 2016-1 ‘Amendments to Australian Accounting Standards – Recognition of Deferred Tax Assets for Unrealised Losses’
1 January 2017 30 June 2018
AASB 2016-2 ‘Amendments to Australian Accounting Standards – Disclosure Initiative: Amendments to AASB 107’
1 January 2017 30 June 2018
AASB 2015-10 ‘Amendments to Australian Accounting Standards – Effective Date of Amendments to AASB 10 and AASB 128’
1 January 2018 30 June 2019
AASB 2016-2 ‘Amendments to Australian Accounting Standards – Disclosure Initiative: Amendments to AASB 107’
1 January 2017 30 June 2018
For
per
sona
l use
onl
y
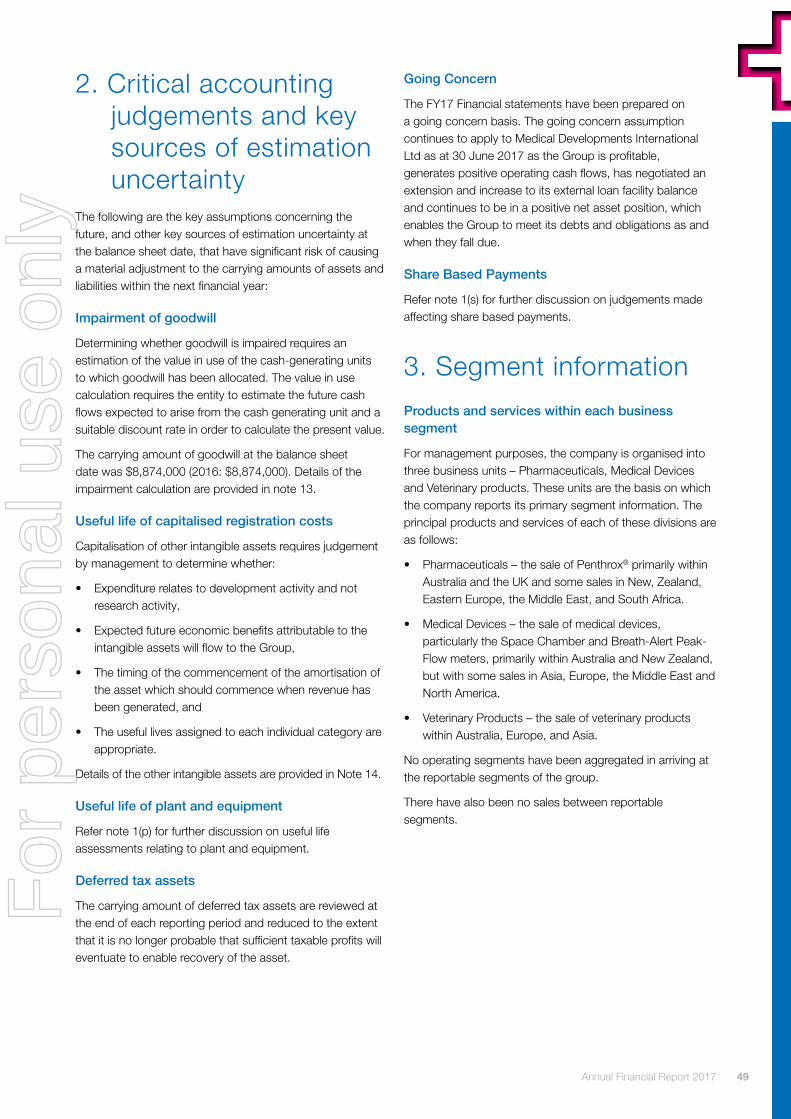
Annual Financial Report 2017 49
2. Critical accounting judgements and key sources of estimation uncertainty
The following are the key assumptions concerning the future, and other key sources of estimation uncertainty at the balance sheet date, that have significant risk of causing a material adjustment to the carrying amounts of assets and liabilities within the next financial year:
Impairment of goodwill
Determining whether goodwill is impaired requires an estimation of the value in use of the cash-generating units to which goodwill has been allocated. The value in use calculation requires the entity to estimate the future cash flows expected to arise from the cash generating unit and a suitable discount rate in order to calculate the present value.
The carrying amount of goodwill at the balance sheet date was $8,874,000 (2016: $8,874,000). Details of the impairment calculation are provided in note 13.
Useful life of capitalised registration costs
Capitalisation of other intangible assets requires judgement by management to determine whether:
• Expenditure relates to development activity and not research activity,
• Expected future economic benefits attributable to the intangible assets will flow to the Group,
• The timing of the commencement of the amortisation of the asset which should commence when revenue has been generated, and
• The useful lives assigned to each individual category are appropriate.
Details of the other intangible assets are provided in Note 14.
Useful life of plant and equipment
Refer note 1(p) for further discussion on useful life assessments relating to plant and equipment.
Deferred tax assets
The carrying amount of deferred tax assets are reviewed at the end of each reporting period and reduced to the extent that it is no longer probable that sufficient taxable profits will eventuate to enable recovery of the asset.
Going Concern
The FY17 Financial statements have been prepared on a going concern basis. The going concern assumption continues to apply to Medical Developments International Ltd as at 30 June 2017 as the Group is profitable, generates positive operating cash flows, has negotiated an extension and increase to its external loan facility balance and continues to be in a positive net asset position, which enables the Group to meet its debts and obligations as and when they fall due.
Share Based Payments
Refer note 1(s) for further discussion on judgements made affecting share based payments.
3. Segment information
Products and services within each business segment
For management purposes, the company is organised into three business units – Pharmaceuticals, Medical Devices and Veterinary products. These units are the basis on which the company reports its primary segment information. The principal products and services of each of these divisions are as follows:
• Pharmaceuticals – the sale of Penthrox® primarily within Australia and the UK and some sales in New, Zealand, Eastern Europe, the Middle East, and South Africa.
• Medical Devices – the sale of medical devices, particularly the Space Chamber and Breath-Alert Peak-Flow meters, primarily within Australia and New Zealand, but with some sales in Asia, Europe, the Middle East and North America.
• Veterinary Products – the sale of veterinary products within Australia, Europe, and Asia.
No operating segments have been aggregated in arriving at the reportable segments of the group.
There have also been no sales between reportable segments.
For
per
sona
l use
onl
y

Medical Developments International Limited50
Segment revenues and results
Pharmaceuticals Medical EquipmentVeterinary Equipment
Unallocated Total
2017 $’000
2016 $’000
2017 $’000
2016 $’000
2017 $’000
2016 $’000
2017 $’000
2016 $’000
2017 $’000
2016 $’000
Revenues
External revenue (gross) 11,029 10,043 7,195 4,967 680 485 18,904 15,495
Sales discounts and claims - - (557) (24) - - (557) (24)
Total external revenue (net) 11,029 10,043 6,638 4,943 680 485 - - 18,347 15,471
Results
Segment results 5,288 4,782 712 589 244 186 6,244 5,557
Unallocated (2,452) (2,159) (2,452) (2,159)
Profit before interest, income tax Depreciation & Amortisation
5,288 4,782 712 589 244 186 (2,452) (2,159) 3,792 3,398
Depreciation & Amortisation (1,086) (868) (143) (129) (16) (15) (88) (83) (1,333) (1,095)
Profit before interest and tax 4,202 3,914 569 460 228 171 (2,540) (2,242) 2,459 2,303
Net Interest 4,202 4 (2) 4 (2)
Profit before income tax expense
(2,536) (2,244) 2,463 2,301
Income tax expense (643) (732) (643) (732)
Net profit for the period from continuing operations
(3,179) (2,976) 1,820 1,569
Assets and Liabilities
Assets 26,415 22,319 9,813 9,736 1,063 1,064 4,473 8,120 41,764 41,239
Liabilities - - - - - - 20,164 22,214 20,164 22,214
Other Segment Information
Acquisition of segment assets 8,141 3,630 481 211 64 29 728 274 9,414 4,144
The accounting policies of the reportable segments are the same as the Group’s accounting policies described in Note 1. This is the measure reported to the chief operating decision maker for the purposes of resource allocation and assessment of segment performance.
Liabilities are not disclosed per segment as it is not possible to track these on a segment basis.
Revenue from major products and services
Revenue from major products and services has not been presented as it is not considered practicable to do so.
Geographical information
The Group operates in two principal geographical areas: Australia (country of domicile); and ‘International’ comprising predominately Europe, North America, Middle East, Asia and South Africa.
The Group’s revenue from continuing operations from external customers and information about its non-current assets by location of assets are detailed below:
Geographical Information
Revenue from external customers 2017
$’000 %
Revenue from external customers 2016
$’000 %
Australia 10,557 55.8 9,147 59.0
International 8,347 44.2 6,348 41.0
18,904 100.0 15,495 100.0
For
per
sona
l use
onl
y

Annual Financial Report 2017 51
The Group’s non-current assets by location are detailed below:
Non-Current Segment AssetsAustralia
$’000Overseas
$’000Total $’000
Leasehold improvements at cost 200 - 200
Plant and equipment at cost 6,159 278 6,437
Goodwill at gross carrying amount 8,874 - 8,874
Other intangible assets at cost 15,092 - 15,092
Deferred tax asset 1,195 87 1,282
31,520 365 31,885
Information about major customers
The Group had no individual customers who contributed 10% or more to the Group’s total 2017 sales revenue.
4. Items included in profit and loss
2017 $’000
2016 $’000
(a) Revenue and other income
Gross revenue from sale of goods 17,003 14,397
Sales discounts and claims (557) (24)
Upfront and milestone income 1,901 1,098
Total Revenue (net) 18,347 15,471
Interest revenue - bank deposits 11 22
18,358 15,493
(b) Expense items included in profit and loss
Profit before income tax has been arrived at after charging the following expenses:
Depreciation of non-current assets (330) (286)
Amortisation of non-current assets (1,004) (810)
Research & development costs immediately expensed (111) (77)
Operating lease rental expenses - minimum lease payments (321) (292)
Share based payments (equity settled) (13) (318)
Loss on foreign currency transactions (196) (48)
Finance Expenses
Interest on bank loans - (10)
Interest on other loans/hire purchase arrangements (7) (14)
(7) (24)
Employee benefit expense:
Short-term employee benefits (3,893) (3,058)
Superannuation contributions (525) (426)
For
per
sona
l use
onl
y

Medical Developments International Limited52
5. Income Taxes
2017 $’000
2016 $’000
(a) Income tax recognised in profit or loss
Tax expense comprises:
Current tax expense 589 685
Adjustments recognised in the current year in relation to the current tax of prior year 54 47
Deferred tax expense relating to the origination and reversal of temporary differences - -
Total tax expense 643 732
The prima facie income tax expense on pre-tax accounting profit reconciles to the income tax expense in the financial statements as follows:
Profit from operations 2,463 2,301
Income tax calculated at 30% 739 690
Research & development expense (133) (82)
Effect of expenses that are not deductible in determining taxable profit 6 99
Adjustments recognised in the current year in relation to the current tax of prior year 54 47
Effect of profit or loss items eliminated on consolidation (11) (11)
Effect of different tax rates of subsidiaries operating in other jurisdictions (12) (11)
Income tax expense recognised in the Statement of Profit or Loss and Other Comprehensive Income
643 732
The tax rate used in the above reconciliation is the corporate tax rate of 30% payable by Australian corporate entities on taxable profits under Australian tax law. There has been no change in the corporate tax rate when compared with the previous reporting period.
(b) Income tax recognised directly in equity
No current and deferred tax amounts have been charged directly to equity during the period (2016: $nil)
(c) Current tax assets/liabilities
Income tax receivable/(payable) 209 (4,124)
MVP has received substantial upfront payments during the current year and for tax purposes these are deemed as assessable on a cash received basis or when unconditional entitlement arises. This has resulted in the recognition of a net deferred tax asset.
(d) Deferred tax asset (non-current)
Temporary differences 1,282 1,928
(e) Deferred tax liabilities
Temporary differences - -For
per
sona
l use
onl
y

Annual Financial Report 2017 53
2017Opening balance
$’000
Charged to income
$’000
Closing balance
$’000
Deferred tax assets/(liabilities):
Accrued expenses 135 (4) 131
Deferred revenue 4,417 531 4,948
Other assets - - -
Other Intangibles (2,998) (1,105) (4,103)
Property, Plant & Equipment 8 (6) 2
Provisions 209 67 276
Tax losses 87 (36) 51
Unrealised foreign exchange losses 70 (93) (23)
1,928 (646) 1,282
2016Opening balance
$’000
Charged to income
$’000
Closing balance
$’000
Deferred tax assets/(liabilities):
Accrued expenses 192 (57) 135
Deferred revenue 95 4,322 4,417
Other assets (2) 2 -
Other Intangibles (2,027) (971) (2,998)
Property, Plant & Equipment 12 (4) 8
Provisions 142 67 209
Tax losses - 87 87
Unrealised foreign exchange losses 28 42 70
(1,560) 3,488 1,928
6. Key management personnel compensationThe aggregate compensation of the key management personnel of the company and the Group is set out below:
2017 $’000
2016 $’000
Short-term employee benefits 867 703
Post employment benefits 92 81
Long term employee benefits 15 15
Share based payments 13 318
987 1,117 For
per
sona
l use
onl
y

Medical Developments International Limited54
7. Remuneration of auditors
2017 $
2016 $
Auditor of the parent entity
Audit or review of the financial report
82,685 84,530
Taxation services 20,675 36,875
Other services 5,400 50,000
108,760 171,405
The auditor of the entity is Deloitte Touche Tohmatsu. The other services relate to additional assurance services.
8. Current receivables
2017 $’000
2016 $’000
Trade receivables 5,122 3,396
Other debtors - 4,032
Allowance for doubtful debts - -
GST recoverable 110 92
5,232 7,520
The average credit period on sales of goods to domestic customers is 30 days, international customers 60 days. No interest is charged on trade receivables.
Included in the trade receivable balance are debtors with a carrying amount of $109,640 (2016: $124,323) which are past due at the reporting date for which the Group has not provided as there has not been a significant change in credit quality and the amounts are still considered recoverable. The Group does not hold any collateral over these balances.
Ageing of past due but not impaired
2017 $’000
2016 $’000
60-90 days 26 48
> 90 days 83 76
Total 109 124
In determining the recoverability of trade receivables, the Group considers any change in the credit quality of the trade receivable from the date the credit was initially granted up to the reporting date. The concentration of credit risk is limited due to the fact that the customer base is large and unrelated.
The directors believe that there is no further credit provision required in excess of the allowance for doubtful debts.
9. Current inventories
2017 $’000
2016 $’000
Raw materials:
At cost 1,115 1,041
Work in progress:
At cost 331 480
Finished goods:
At cost 978 1,166
Provision for obsolesence - (20)
2,424 2,667
The provision for obsolescence at 30 June 2016 represented predominantly obsolete packing materials.
10. Other current assets
2017 $’000
2016 $’000
Prepayments 319 244
Other receivables 4 -
323 244
For
per
sona
l use
onl
y

Annual Financial Report 2017 55
11. Subsidiaries Details of the Group’s subsidiaries at the end of the reporting period are as follows.
Name of Subsidiary Principle activityPlace of incorporation and operation
Proportion of ownership interest and voting power held by the Group
30 June 2017 30 June 2016
Medical Developments UK Limited
Distribution of medical devices
United Kingdom 100% 100%
Medical Developments USA Inc.
Distribution of medical devices
United States of America
100% 100%
12. Property, plant & equipment
Leasehold improvements
at cost $’000
Manufacturing Facility
Plant and equipment at
cost $’000
Total $’000
Gross carrying amount
Balance at 30 June 2015 619 - 3,437 4,056
Additions 44 - 1,376 1,420
Disposals (248) - (4) (252)
Balance at 30 June 2016 415 - 4,809 5,224
Additions 80 - 4,273 4,353
Transfers - 3,818 (3,818) -
Disposals - - - -
Balance at 30 June 2017 495 3,818 5,264 9,577
Accumulated depreciation
Balance at 30 June 2015 (368) - (2,166) (2,534)
Depreciation expense (75) - (210) (285)
Disposals 205 - 4 209
Balance at 30 June 2016 (238) - (2,372) (2,610)
Depreciation expense (57) - (273) (330)
Disposals - - - -
Balance at 30 June 2017 (295) - (2,645) (2,940)
Net book value
As at 30 June 2016 177 - 2,437 2,614
As at 30 June 2017 200 3,818 2,619 6,637
The manufacturing facility is in the final stages of validation as at 30 June 2017 and is therefore not yet being depreciated.
For
per
sona
l use
onl
y

Medical Developments International Limited56
13. Goodwill
2017 $’000
2016 $’000
Gross carrying amount
Balance at beginning of financial year 8,874 7,368
Additions - 1,506
Balance at end of financial year 8,874 8,874
Net book value
Balance at beginning of financial year 8,874 7,368
Balance at end of financial year 8,874 8,874
During the year, the company assessed the recoverable amount of goodwill and determined that there was no impairment (2016: $nil).
Allocation of goodwill to cash-generating units
Goodwill has been allocated for impairment testing purposes to three individual cash-generating units: pharmaceutical business, medical devices business and veterinary equipment business. The carrying amount of goodwill allocated to cash-generating units is as follows:
2017 $’000
2016 $’000
Pharmaceuticals 3,808 3,808
Medical devices 4,485 4,485
Veterinary equipment 581 581
8,874 8,874
The recoverable amount of all three cash-generating units is based on a value in use calculation for each unit which uses cash flow projections based on a five-year projection period and terminal value. The Board of Directors approved financial budget for the following year is used to determine the cash flows for year 1.
Recoverable amount testing has been based on EBITDA growth rates for years 2-5 of:
Pharmaceuticals: 12.5% based on expansion into new markets
Medical devices: 15% based on expansion of existing markets
Veterinary equipment: 7.5% based on expansion of existing markets
A terminal value after 5 years based on a long-term growth rate of 2.5%, and a pre-tax discount rate of 14.64% per annum (2016: 12.24% per annum) have been used to calculate the carrying value of the intangible assets.
The key assumptions used in the value in use calculations for all units are:
• EBITDA growth – described above; and
• Gross margin – it is assumed that gross margin of the Pharmaceutical & Medical Devices segments will be maintained following investment and activities aimed at improvement in the manufacturing process and procedures.
Management believes that any reasonably possible change in the key assumptions on which the recoverable amount for each of the three units is based would not cause the carrying amounts to exceed their recoverable amounts.
For
per
sona
l use
onl
y

Annual Financial Report 2017 57
14. Other intangible assets
2017 Development $’000
Patents & trademarks
$’000
Capitalised registration
costs $’000
Brandnames $’000
Other $’000
Total $’000
Gross carrying amount
Balance at 30 June 2015 1,593 448 7,642 - 63 9,746
Additions 381 118 1,644 738 581 3,462
Balance at 30 June 2016 1,974 566 9,286 738 644 13,208
Additions 47 189 3,865 - 223 4,324
Balance at 30 June 2017 2,021 755 13,151 738 867 17,532
Accumulated amortisation
Balance at 30 June 2015 (119) (177) (330) - - (626)
Amortisation expense (87) (49) (621) - (53) (810)
Balance at 30 June 2016 (206) (226) (951) - (53) (1,436)
Amortisation expense (88) (65) (762) - (89) (1,004)
Balance at 30 June 2017 (294) (291) (1,713) - (142) (2,440)
Net book value
As at 30 June 2016 1,768 340 8,335 738 591 11,772
As at 30 June 2017 1,727 464 11,438 738 725 15,092
The amortisation charge for the year of $1,004,000 (2016: $810,000) has been included in administration expenses. For an explanation of amortisation periods refer Note 1(l).
15. Current trade and other payables
2017 $’000
2016 $’000
Trade payables (i) 1,785 1,989
Accrued expenses 899 491
Employee benefits payable 51 37
PAYG witholding tax payable 2 1
2,737 2,518
(i) The average credit period on purchase of goods is 30 days. No interest is charged on trade payables. The company has financial risk management policies in place to ensure that all payables are paid within the credit timeframe.
16. Borrowings
2017 $’000
2016 $’000
Secured - at amortised cost
Hire Purchase (i) 39 82
Hire Purchase (ii) 17 37
Bank Bill (iii) - -
Other (iv) 373 362
429 481
Current 146 143
Non-current 283 338
429 481
For
per
sona
l use
onl
y

Medical Developments International Limited58
Summary of borrowing arrangements
(i) On 1 March 2013 the Group entered into a commercial loan agreement to fund the purchase of a new bottling station. The current weighted-average effective interest rate on the loan is 6.78% p.a. The agreement is secured by a registered charge over the equipment.
(ii) On 4 September 2013 the Group entered into a Hire Purchase Agreement in relation to plant and equipment. The term is 5 years and the current weighted average effective interest rate on the loan is 6.45%. The agreement is secured by a registered charge over the equipment financed.
(iii) The Bank Bill Facility with a variable interest rate and 90 day roll over period was renegotiated during the year. As at 30 June 2017, the facility is unused. The Bank Bill is secured by a registered charge over all of the Group’s assets.
(iv) On 29 June 2012, the group entered into an agreement with the Commonwealth Scientific and Industrial Research Organisation (‘CSIRO’) to fund the development of a new production process for the pain relieving ingredient used in Penthrox®. Funding is receivable at the commencement of each of three stages of development and is payable over a three year term upon the completion of the relevant stage. As at 30 June 2017, the stage 1a and 1b are complete. Should MDI default on the loan, CSIRO has the option to convert the debt into shares in MDI at fair market value. This funding is interest-free until the first anniversary of the completion of stages 1a and 2 and is then calculated at the Westpac Bank Lending Rate at the date the relevant note was issued, plus 2%. The funding for stage 2 is interest free.
(v) The Group has an overdraft facility of $200,000. As at 30 June 2017, this remains unused.
17. Current provisions
2017 $’000
2016 $’000
Employee benefits 346 254
18. Non-current provisions
2017 $’000
2016 $’000
Employee benefits 159 114 The company has 53.00 full time equivalent employees at 30 June 2017 (2016: 42.35)
19. Other liabilities
2017 $’000
2016 $’000
Revenue received in advance 15,886 14,431
Unearned government grant income
607 292
16,493 14,723
Current 2,077 1,772
Non-current 14,416 12,951
16,493 14,723
MVP has received additional upfront and milestone payments during the current year. For accounting purposes these non-refundable payments are deferred and amortised into the income statement over the term of the agreement to which the payments relate. As at 30 June 2017 $15.886m remains unamortised.
Unearned government grant income represents funds received through the Commercial Ready Programme from the Federal Government and Futures Industries Manufacturing Program of the Victorian State Government.
For
per
sona
l use
onl
y

Annual Financial Report 2017 59
20. Issued Capital
20(a) Fully paid ordinary shares
2017 No.
2017 $’000
2016 No.
2016 $’000
Fully paid ordinary shares
Balance at beginning of financial year 57,960,056 11,916 57,725,143 10,946
Shares Issued - Business Acquisition - - 117,894 440
Shares Issued - Dividends Reinvestment Plan 215,120 1,107 117,019 534
Share issued - Employee Share Scheme 800,000 2,000 - -
Capital raising costs - (15) - (4)
Balance at end of financial year 58,975,176 15,008 57,960,056 11,916
Fully paid ordinary shares carry one vote per share and carry the right to dividends.
20(b) Share options granted under the CEO Long Term Incentive Plan
At 30 June 2017, there are no options over ordinary shares of the Company. Share options granted to the CEO carry no rights to dividends and no voting rights.
21. Reserves
2017 $’000
2016 $’000
(a) Foreign currency translation reserve
Balance at beginning of year (61) 21
Exchange differences arising on translating the foreign operations
(6) (82)
Balance at end of year (67) (61)
Exchange differences relating to the translation of the results and net assets of the Group’s foreign operations from their functional currencies to the Group’s presentation currency (i.e. Australian dollars) are recognised directly in other comprehensive income and accumulated in the foreign currency translation reserve. Gains and losses on hedging instruments that are designated as hedging instruments for hedges of net investments in foreign operations are included in the foreign currency translation reserve. Exchange differences previously accumulated in the foreign currency translation reserve (in respect of translating both the net assets of foreign operations and hedges of foreign operations) are reclassified to profit or loss on the disposal of the foreign operation.
2017 $’000
2016 $’000
(b) Employee equity-settled benefits reserve
Balance at beginning of year 318 -
Share-based payment recognised 13 318
Balance at end of year 331 318
The above equity settled employee benefits reserve related to share options granted by the company to its CEO under its employee share option plan. Further information about share-based payments to employees is set out in note 32.
22. Retained earnings
2017 $’000
2016 $’000
Balance at beginning of financial year 6,852 6,440
Dividends paid (2,344) (1,157)
Net profit attributable to members 1,820 1,569
Balance at end of financial year 6,328 6,852
23. Earnings per share
2017 Cents
per share
2016 Cents
per share
Basic earnings per share 3.1 2.7
Diluted earnings per share 3.1 2.7
For
per
sona
l use
onl
y

Medical Developments International Limited60
Basic earnings per share
The earnings and weighted average number of ordinary shares used in the calculation of basic earnings per share are as follows:
2017 $’000
2016 $’000
Earnings 1,820 1,569
2017 No.
2016 No.
Weighted average number of ordinary shares
58,711,471 58,033,622
Diluted earnings per share
Earnings used in the basic earnings per share calculation are identical to those used for the diluted earnings per share calculation. There are no potentially dilutive options outstanding as at 30 June 2017.
2017 No.
2016 No.
Weighted average number of ordinary shares used in the calculation of basic EPS
58,711,471 57,798,709
Shares deemed to be issued for CEO LTIP - Tranche 1 and 2
- 340,844
Weighted average number of ordinary shares for diluted EPS
58,711,471 58,139,553
24. DividendsAn interim dividend of 2 cents per share was declared and paid in the current year and a final dividend of 2 cents per share was declared in respect of the full year ended 30 June 2017.
The interim dividend paid during the 30 June 2017 year resulted in the company paying dividends of $641,000 and the balance of $536,000 issued as shares under the Dividend Reinvestment Plan.
The 2016 full year dividend paid during the 30 June 2017 year resulted in the company paying dividends of $596,000 and the balance of $571,000 issued as shares under the Dividend Reinvestment Plan
2017 2016
cents per share
$’000cents per
share$’000
Recognised amounts
Fully paid ordinary shares
Interim dividend - fully franked 2.0 1,167 2.0 1,157
2016 full year dividend - fully franked 2.0 1,177 - -
4.0 2,344 2.0 1,157
Unrecognised amounts
Fully paid ordinary shares
Final dividend - fully franked 2.0 1,180 2.0 1,167
1,180 1,167
2017 $’000
2016 $’000
Adjusted franking account balance 3,127 4,134
For
per
sona
l use
onl
y

Annual Financial Report 2017 61
25. Operating leasesOperating leases primarily relate to factory leases with remaining lease terms ranging from 1.5 to 8.5 years. The company does not have the option to purchase the leased asset at the expiry of the lease period.
2017 $’000
2016 $’000
Non cancellable operating lease payments:
Not longer than 1 year 373 108
Longer than 1 year and not longer than 5 years
1,348 1,331
Greater than 5 years 1,203 1,540
2,924 2,979
26. Commitments for expenditure
(a) Capital expenditure commitments
There were no capital expenditure commitments at 30 June 2017.
27. Related party disclosures
There were no related party transactions during the 2017 financial year.
Balances and transactions between the Company and its subsidiaries which are related parties of the company have been eliminated on consolidation and are not disclosed in this note.
28. Subsequent eventsIn August 2017, the Company signed an unconditional Term Sheet with its financiers to extend its Bank Bill Facility. The initial facility for $5m was due to expire in October 2018. The new facility will increase to $11m and will extend to August 2019.
On the 18th August 2017 the Board of Directors declared a fully franked final dividend of 2 cents per share to the holders of fully paid ordinary shares as at the record date of 1 September 2017, to be paid to the shareholders on the 6 October 2017. This dividend has not been included as a liability in these financial statements.
There has not been no other matter or circumstance that has arisen that has significantly affected, or may significantly affect the operations of the company, the results of those operations, or the state of affairs of the company in future years.
For
per
sona
l use
onl
y

Medical Developments International Limited62
29. Notes to the Consolidated Statement of Cash Flows
2017 $’000
2016 $’000
(a) Reconciliation of cash and cash equivalents
For the purposes of the Consolidated Statement of Cash Flows, cash includes cash on hand and in banks. Cash at the end of the financial year as shown in the Consolidated Statement of Cash Flows is reconciled to the related item in the Statement of Financial Position as follows:
Cash and cash equivalents 1,691 5,620
1,691 5,620
(b) Reconciliation of profit for the period to net cash flows from operating activities
Profit for the period 1,820 1,569
Interest received (11) (22)
Depreciation and amortisation of non-current assets 1,334 1,096
Net unrealised foreign exchange (gain)/loss (53) 202
Share based payments 13 318
Loss on disposal of property, plant and equipment - 6
Increase/(decrease) in tax payable (4,333) 3,830
Decrease/(increase) in deferred tax asset 646 (3,488)
Movements in working capital
Decrease/(increase) in assets:
Current receivables 2,288 (5,701)
Current inventories 243 (780)
Other current assets (79) (69)
Increase/(decrease) in liabilities:
Current payables 219 1,258
Current provisions 92 39
Other liabilities 1,787 13,789
Non-current provisions 45 21
Net cash from operating activities 4,011 12,067
(c) Financing facilities
Unsecured bank overdraft facility, reviewed annually and payable at call:
Amount unused 200 200
200 200
Bank bill facility with a 90 day roll over period:
Amount used - -
Amount unused 4,440 2,960
4,440 2,960
For
per
sona
l use
onl
y

Annual Financial Report 2017 63
30. Financial Instruments
(a) Capital risk management
The Group manages its capital to ensure that it will be able to continue as a going concern while maximising the return to stakeholders. The Group does not enter into or trade financial instruments, including derivatives, for speculative purposes.
The capital structure of the Group consists of net debt (borrowings as detailed in note 16) and equity of the Group (comprising issued capital, reserves, retained earnings, and cash and cash equivalents as detailed in notes 20, 21, 22, and 29(a), respectively).
The Group’s Audit and Risk Committee reviews the capital structure of the Group on a semi-annual basis. As part of this review, the committee considers the cost of capital and the risks associated with each class of capital. The gearing ratio at 30 June 2017 is -6% (see below).
2017 $’000
2016 $’000
Debt (i) 429 481
Cash and bank balances (1,691) (5,620)
Net debt / (cash) (1,262) (5,139)
Equity (ii) 21,600 19,025
Net debt to equity ratio -6% -27%
(i) Debt is defined as long-term and short-term borrowings as described in note 16.
(ii) Equity includes all capital and reserves of the group that are managed as capital.
The bank bill facility includes financial covenants whereby the operating leverage ratio must be no higher than 2.50 times. Monitoring of said covenants is performed monthly by management and signed off bi-annually by management.
There have been no breaches in the current year and there are no forecasted breaches for forthcoming periods.
(b) Significant accounting policies
Details of significant accounting policies and methods adopted, including the criteria for recognition, the basis of measurement and the basis on which revenues and expenses are recognised, in respect of each class of financial asset, financial liability and equity instrument are disclosed in note 1 to the financial statements.
These policies were consistent throughout the current year and the prior year.
(c) Financial risk management objectives
The Group’s finance function provides services to the business, co-ordinates access to domestic and international financial markets, monitors and manages financial risks relating to the operations of the Group. These risks include market risk (including currency risk, fair value interest rate risk and price risk), credit risk, liquidity risk and cash flow interest rate risk.
(d) Credit risk management
Credit risk refers to the risk that a counter party will default on its contractual obligations resulting in financial loss to the Group. The Group has adopted a policy of only dealing with creditworthy counterparties. The Group’s exposure is continually monitored and the aggregate value of transactions concluded is spread amongst approved counterparties.
Trade receivables consist of a large number of customers. Ongoing credit evaluation is performed on the financial condition of these accounts receivable and advance payments are requested where deemed appropriate.
The carrying amount of financial assets recorded in the financial statements, net of any allowance for losses, represents the Group’s maximum exposure to credit risk without taking account of the value of any collateral or other security obtained.
Apart from the three largest customers of the Group (refer to Notes 3 and 8), the Group does not have significant credit risk exposure to any single counterparty or any group of counterparties having similar characteristics. The Group defines counterparties as having similar characteristics if they are related entities. Concentration of credit risk to any other counterparty did not exceed 5% of gross monetary assets at any time during the year.
(e) Foreign currency risk management
The Group undertakes certain transactions denominated in foreign currencies, hence exposures to exchange rate fluctuations arise.
The carrying amount of the Group’s foreign currency denominated monetary assets and monetary liabilities at the reporting date is as follows:
Liabilities Assets
2017 $’000
2016 $’000
2017 $’000
2016 $’000
USD 723 1,160 1,765 5,872
GBP 162 524 1,271 1,249
NZD - - 253 -
EUR - 1 148 92
CND - 5 17 84
885 1,690 3,455 7,297
For
per
sona
l use
onl
y

Medical Developments International Limited64
Amounts of exposure are not currently significant and as such forward contracts and currency swap agreements are not used.
Foreign currency sensitivity analysis
The Group predominantly trades in Australian dollars (AUD), but has limited exposure to the US dollar (USD) and Great Britain Pound (GBP) based on a portion of its overseas sales and purchases.
The following table details the Group’s sensitivity to a 10% increase and decrease in the Australian Dollar against the USD and GBP. 10% is the sensitivity rate used when assessing foreign currency risk internally by key management and represents management’s assessment of the possible change in foreign currency rates. The sensitivity analysis includes only outstanding foreign currency denominated monetary items and adjusts their translation at the period end for a 10% change in foreign currency rates. A positive number indicates an increase in profit or loss where the Australian Dollar strengthens against the respective currency. For a weakening of the Australian Dollar against the respective currency there would be an equal and opposite impact on the profit.
USD Impact
2017 $’000
2016 $’000
Profit or Loss (104) (471)
GBP Impact
2017 $’000
2016 $’000
Profit or Loss (111) (72)
This is attributable to the exposure outstanding on USD and GBP receivables and payables at year end in the Group. The exposure to movement in NZD, EUR, and CAD is not deemed to be significant.
(f) Fair value of financial instruments
The Directors consider that the carrying amount of financial assets and liabilities recorded at amortised cost in the financial statements approximates their respective net fair values, determined in accordance with the accounting policies disclosed in note 1 to the financial statements.
The Group does not recognise any financial instruments that are measured subsequent to initial recognition at fair value.
(g) Interest rate risk management
The Group is exposed to interest rate risk as it holds cash at floating interest rates. The following table details the Group’s exposure to interest rate risk as at 30 June 2017 and 30 June 2016.
2017Variable interest rate maturity
Average interest rate
%
Less than 1 year $’000
1 to 5 years $’000
More than 5 years $’000
Non-interest bearing $’000
Total $’000
Financial assets - -
Cash 0.02% 1,691 - - - 1,691
Receivables - - - - 5,232 5,232
1,691 - - 5,232 6,923
Financial liabilities - -
Payables - - - - 2,737 2,737
Borrowings 5.04% 146 283 - - 429
146 283 - 2,737 3,166For
per
sona
l use
onl
y

Annual Financial Report 2017 65
2016Variable interest rate maturity
Average interest rate
%
Less than 1 year $’000
1 to 5 years $’000
More than 5 years $’000
Non-interest bearing $’000
Total $’000
Financial assets
Cash 0.03% 5,620 - - - 5,620
Receivables - - - - 7,520 7,520
5,620 - - 7,520 13,140
Financial liabilities
Payables - - - - 2,518 2,518
Borrowings 5.43% 143 338 - - 481
143 338 - 2,518 2,999
The following table details the Group’s sensitivity to a 50 basis point increase or decrease in interest rates.
Interest rate risk table
2017 $’000
2016 $’000
Profit or Loss 6 26
(h) Liquidity risk management
The Group manages liquidity risk by maintaining adequate cash reserves, banking facilities and reserve borrowing facilities by continuously monitoring forecast and actual cash flows and matching the maturity profiles of financial assets and liabilities.
Liquidity risk table
The following table details the Group’s remaining contractual maturity for its non-derivative financial liabilities. The table has been drawn up based on the undiscounted cash flows of financial liabilities based on the earliest date on which the Group can be required to pay. The table includes the principal cash flows.
Weighted average effective
interest rate %
Less than 1 year $’000
1 to 5 years $’000
More than 5 years $’000
Total $’000
2017
Payables - 2,737 - - 2,737
Borrowings 5.04% 146 283 - 429
2,883 283 - 3,166
2016
Payables - 2,518 - - 2,518
Borrowings 5.43% 143 338 - 481
2,661 338 - 2,999 For
per
sona
l use
onl
y

Medical Developments International Limited66
31. Parent Entity Information
The accounting policies of the parent entity, which have been applied in determining the financial information shown below, are the same as those applied in the consolidated financial statements.
Refer to note 1 for a summary of the significant accounting policies relating to the Group.
Financial Position
30 June 2017 $’000
30 June 2016 $’000
Assets
Current Assets 10,003 16,419
Non-Current Assets 31,828 25,093
Total Assets 41,831 41,512
Liabilities
Current Liabilities 3,090 6,958
Non-Current Liabilities 16,934 15,175
Total Liabilities 20,024 22,133
Equity
Issued capital 15,008 11,916
Reserves 332 318
Retained earnings 6,467 7,145
Total Equity 21,807 19,379
Financial Performance
2017 $’000
2016 $’000
Profit for the year 1,666 1,443
Dividends paid (2,344) (1,157)
Other comprehensive income - -
Total comprehesive income (678) 286
The commitments of the parent are the same as those of the overall consolidated group.
32. Employee share option plan
32.1 CEO share option plan
The following share-based payment arrangement was introduced in the 30 June 2016 year and vested and exercise or lapsed during the current reporting period.
On 18 January 2016 the company announced it has agreed to a Long Term Incentive Plan “LTIP” with Mr. John Sharman, the CEO of Medical Developments International Limited to encourage his long term commitment to the business.
The key plan features are summarised as follows:
• A grant of 400,000 options with a strike price of $2.50 but vesting only when the MVP share price has been above $4.50 at all times for 60 continuous ASX Trading days. These options vested and were exercised on 10 August 2016.
• A grant of 400,000 options with a strike price of $2.50 but vesting only when the MVP share price has been above $5.50 for 60 continuous ASX Trading days. These options vested and were exercised on 5 October 2016; and
• A grant of 200,000 options with a strike price of $2.50 but vesting only when reimbursement is approved for Penthrox® in Germany or Registration is approved in Germany (whichever occurs first). These options lapsed and expired on 31 December 2016.
Each share option converts into one ordinarily share of Medical Developments Limited on exercise. No amounts are paid or payable by the recipient on the receipt of the option nor are they tradeable at any time. The options carried neither rights to dividends or voting rights.
Under the terms of the plan, all outstanding options will be cancelled if Mr. Sharman leaves or is otherwise no longer employed at MVP. When the LTIP delivers an entitlement to an equity interest via the prevailing share price hurdle, Mr. Sharman will have 3 months to exercise the relevant options, after which the relevant options will lapse. In each case, 60% of the new shares issued by exercising options will be escrowed for a period of 12 months from issue date.
There has been no alteration to the terms and conditions of the above share based payment arrangement since grant date.F
or p
erso
nal u
se o
nly
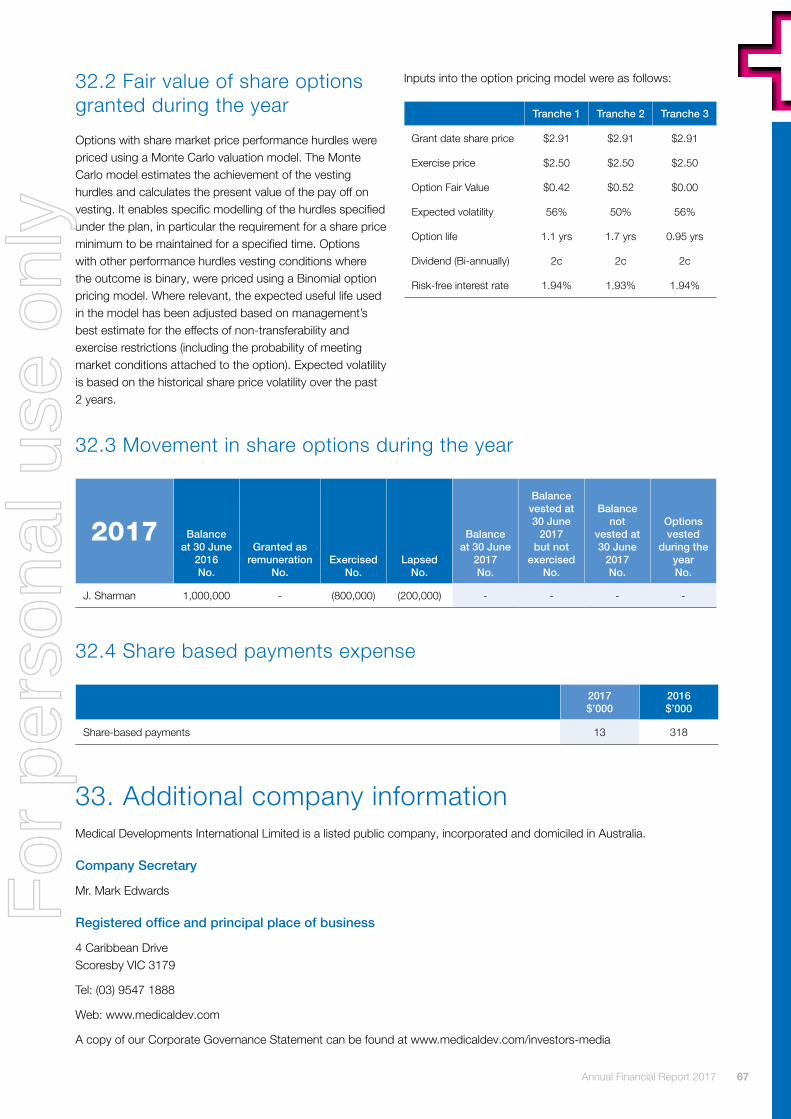
Annual Financial Report 2017 67
32.2 Fair value of share options granted during the year
Options with share market price performance hurdles were priced using a Monte Carlo valuation model. The Monte Carlo model estimates the achievement of the vesting hurdles and calculates the present value of the pay off on vesting. It enables specific modelling of the hurdles specified under the plan, in particular the requirement for a share price minimum to be maintained for a specified time. Options with other performance hurdles vesting conditions where the outcome is binary, were priced using a Binomial option pricing model. Where relevant, the expected useful life used in the model has been adjusted based on management’s best estimate for the effects of non-transferability and exercise restrictions (including the probability of meeting market conditions attached to the option). Expected volatility is based on the historical share price volatility over the past 2 years.
Inputs into the option pricing model were as follows:
Tranche 1 Tranche 2 Tranche 3
Grant date share price $2.91 $2.91 $2.91
Exercise price $2.50 $2.50 $2.50
Option Fair Value $0.42 $0.52 $0.00
Expected volatility 56% 50% 56%
Option life 1.1 yrs 1.7 yrs 0.95 yrs
Dividend (Bi-annually) 2c 2c 2c
Risk-free interest rate 1.94% 1.93% 1.94%
32.3 Movement in share options during the year
2017 Balance at 30 June
2016 No.
Granted as remuneration
No.Exercised
No.Lapsed
No.
Balance at 30 June
2017 No.
Balance vested at 30 June
2017 but not
exercised No.
Balance not
vested at 30 June
2017 No.
Options vested
during the year No.
J. Sharman 1,000,000 - (800,000) (200,000) - - - -
32.4 Share based payments expense
2017 $’000
2016 $’000
Share-based payments 13 318
33. Additional company informationMedical Developments International Limited is a listed public company, incorporated and domiciled in Australia.
Company Secretary
Mr. Mark Edwards
Registered office and principal place of business
4 Caribbean Drive Scoresby VIC 3179
Tel: (03) 9547 1888
Web: www.medicaldev.com
A copy of our Corporate Governance Statement can be found at www.medicaldev.com/investors-media
For
per
sona
l use
onl
y

Medical Developments International Limited68
Additional Stock Exchange Information as at 31 August 2017
Number of holders of equity securities
Ordinary share capital
58,975,176 fully paid ordinary shares held by 3,320 individual shareholders. All issued ordinary shares carry one vote per share.
Distribution of holders of equity securities
Fully paid ordinary shares
1 – 1,000 1,140
1,001 – 5,000 1,299
5,001 – 10,000 390
10,001 – 100,000 439
100,001 and over 52
3,320
Holding less than a marketable parcel 93
SUBSTANTIAL SHAREHOLDERS Number %
MR DAVID JOHN WILLIAMS 17,970,388 30.47
TWENTY LARGEST HOLDERS OF EQUITY SECURITIES Number %
MR DAVID JOHN WILLIAMS 17,970,388 30.47
HSBC CUSTODY NOMINEES 6,158,271 10.44
J P MORGAN NOMINEES AUSTRALIA 1,674,490 2.84
DR RUSSELL KAY HANCOCK 1,614,214 2.74
NATIONAL NOMINEES LIMITED 1,567,101 2.66
LUJETA PTY LTD 891,256 1.51
MR ALISTAIR DAVID STRONG 630,000 1.07
SANDHURST TRUSTEES 532,423 0.90
MR JOHN SHARMAN 510,312 0.87
HSBC CUSTODY NOMINEES 417,905 0.71
SANDHURST TRUSTEES 416,014 0.71
LONCETA PTY LTD 396,410 0.67
MULLACAM PTY LTD 384,671 0.65
IMAJ PTY LTD 375,000 0.64
MIRRABOOKA INVESTMENTS LIMITED 370,000 0.63
MR RAYMOND WILLIAM WALTER & MR ALEXANDER SCOTT HAGAN 357,000 0.61
BNP PARIBAS NOMS PTY LTD 346,677 0.59
MR MICHAEL GERARD SUGERMAN 300,000 0.51
HOLLYWIND PTY LTD 270,000 0.46
PNSF PTY LTD 255,157 0.43
For
per
sona
l use
onl
y

For
per
sona
l use
onl
y

Full-Year Report 2017 Financial Year Ended 30 June 2017
(Previous corresponding period: financial year ended 30 June 2016)
For
per
sona
l use
onl
y