full year 2016 results - air france · pdf filefull year 2016 results ... the board of...
TRANSCRIPT
Free translation into English for convenience only - French version prevails
Website: www.airfranceklm.com
1
16th February 2017
Full Year 2016 results
FULL YEAR 2016 Results in line with target, main KPIs show improvement Operating income at 1,049 million euros, up 269 million and up 558 million
excluding currency effects Net result group share at 792 million euros, up 674 million. Continuous decrease in ex-fuel unit costs at constant currency and pension costs,
down 1.0% in line with target and down 1.7% excluding strike impact and profit-sharing expenses
Free cash flow after disposals of 693 million euros contributing to a further 652 million euro decrease in net debt
Adjusted net debt / EBITDAR ratio of 2.9x, an improvement of 0.5 points compared to 31 December 2015
93.4 million passengers carried, up 4.0%
OUTLOOK High level of uncertainty regarding unit revenue and fuel price due to geopolitical,
economical and airline industry capacity environment Resilient start to 2017 Smart growth in passenger operations, an increase in available seat kilometres of
between 3.0% and 3.5% at Group level in 2017 Continued focus on unit cost reduction, targeting a minimum of 1.5% in 2017 at
constant currency, fuel price and pension expense Based on current forward prices and the hedge portfolio, a fuel bill increase limited
to 100 million dollars in 2017 Maintaining strict capex discipline, targeting positive free cash flow before disposals
in 2017 Further net debt reduction, adjusted net debt / EBITDAR ratio below 2.5x mid cycle
by end 2020
The Board of Directors of Air France-KLM, chaired by Jean-Marc Janaillac, met on 15th February 2017 to approve the accounts for the Full Year 2016.
Jean-Marc Janaillac made the following comments: "Within a contrasting environment, Air France-KLM delivered an improvement in its 2016 results, reflecting the initiatives and efforts of its employees and the loyalty of customers. While the fall in the oil price significantly reduced the Group’s costs, the geopolitical context, competition and industry overcapacity all resulted in lower unit revenues. With Trust Together, our strategic project, we are resolutely committed to regaining the offensive, reinforcing our ability to innovate and improving our competitiveness. In an economic and geopolitical context that remains very uncertain, and faced with aggressive competition, the status quo is not an option."
2
Key data
Fourth Quarter Full Year
2016 2015* Change 2016 2015* Change
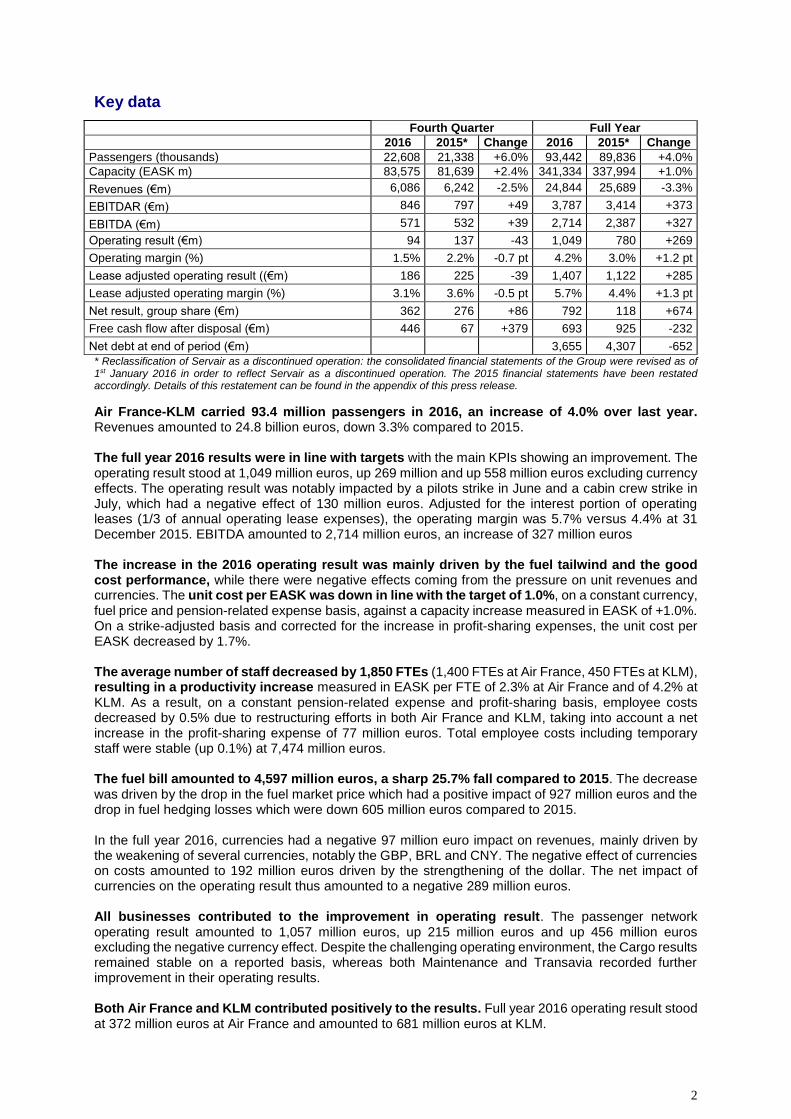
Passengers (thousands) 22,608 21,338 +6.0% 93,442 89,836 +4.0%
Capacity (EASK m) 83,575 81,639 +2.4% 341,334 337,994 +1.0%
Revenues (€m) 6,086 6,242 -2.5% 24,844 25,689 -3.3%
EBITDAR (€m) 846 797 +49 3,787 3,414 +373
EBITDA (€m) 571 532 +39 2,714 2,387 +327
Operating result (€m) 94 137 -43 1,049 780 +269
Operating margin (%) 1.5% 2.2% -0.7 pt 4.2% 3.0% +1.2 pt
Lease adjusted operating result ((€m) 186 225 -39 1,407 1,122 +285
Lease adjusted operating margin (%) 3.1% 3.6% -0.5 pt 5.7% 4.4% +1.3 pt
Net result, group share (€m) 362 276 +86 792 118 +674
Free cash flow after disposal (€m) 446 67 +379 693 925 -232
Net debt at end of period (€m) 3,655 4,307 -652
* Reclassification of Servair as a discontinued operation: the consolidated financial statements of the Group were revised as of 1st January 2016 in order to reflect Servair as a discontinued operation. The 2015 financial statements have been restated accordingly. Details of this restatement can be found in the appendix of this press release.
Air France-KLM carried 93.4 million passengers in 2016, an increase of 4.0% over last year. Revenues amounted to 24.8 billion euros, down 3.3% compared to 2015. The full year 2016 results were in line with targets with the main KPIs showing an improvement. The operating result stood at 1,049 million euros, up 269 million and up 558 million euros excluding currency effects. The operating result was notably impacted by a pilots strike in June and a cabin crew strike in July, which had a negative effect of 130 million euros. Adjusted for the interest portion of operating leases (1/3 of annual operating lease expenses), the operating margin was 5.7% versus 4.4% at 31 December 2015. EBITDA amounted to 2,714 million euros, an increase of 327 million euros The increase in the 2016 operating result was mainly driven by the fuel tailwind and the good cost performance, while there were negative effects coming from the pressure on unit revenues and currencies. The unit cost per EASK was down in line with the target of 1.0%, on a constant currency, fuel price and pension-related expense basis, against a capacity increase measured in EASK of +1.0%. On a strike-adjusted basis and corrected for the increase in profit-sharing expenses, the unit cost per EASK decreased by 1.7%. The average number of staff decreased by 1,850 FTEs (1,400 FTEs at Air France, 450 FTEs at KLM), resulting in a productivity increase measured in EASK per FTE of 2.3% at Air France and of 4.2% at KLM. As a result, on a constant pension-related expense and profit-sharing basis, employee costs decreased by 0.5% due to restructuring efforts in both Air France and KLM, taking into account a net increase in the profit-sharing expense of 77 million euros. Total employee costs including temporary staff were stable (up 0.1%) at 7,474 million euros. The fuel bill amounted to 4,597 million euros, a sharp 25.7% fall compared to 2015. The decrease was driven by the drop in the fuel market price which had a positive impact of 927 million euros and the drop in fuel hedging losses which were down 605 million euros compared to 2015. In the full year 2016, currencies had a negative 97 million euro impact on revenues, mainly driven by the weakening of several currencies, notably the GBP, BRL and CNY. The negative effect of currencies on costs amounted to 192 million euros driven by the strengthening of the dollar. The net impact of currencies on the operating result thus amounted to a negative 289 million euros. All businesses contributed to the improvement in operating result. The passenger network operating result amounted to 1,057 million euros, up 215 million euros and up 456 million euros excluding the negative currency effect. Despite the challenging operating environment, the Cargo results remained stable on a reported basis, whereas both Maintenance and Transavia recorded further improvement in their operating results. Both Air France and KLM contributed positively to the results. Full year 2016 operating result stood at 372 million euros at Air France and amounted to 681 million euros at KLM.

3
Full Year
Operating result per airline (€m) 2016 2015* Change
Air France 372 426 -54
Operating Margin (%) 2.4% 2.6% -0.2 pt
KLM 681 384 +297
Operating Margin (%) 6.9% 3.9% +3.0 pt
* Reclassification of Servair as a discontinued operation. Sum of individual airline results does not add up to Air France-KLM total due to intercompany eliminations at Group level
Passenger network business
Fourth Quarter Full Year
Passenger network 2016 2015 Change 2016 2015 Change
Passengers (thousands) 19,768 19,156 +3.2% 80,163 79,016 +1.5%
Capacity (ASK m) 68,912 67,634 +1.9% 278,807 276,897 +0.7%
Traffic (RPK m) 58,427 56,719 +3.0% 238,183 235,715 +1.0%
Load factor 84.8% 83.9% +0.9 pt 85.4% 85.1% +0.3 pt
Total passenger revenues (€m) 4,799 4,983 -3.7% 19,682 20,541 -4.2%
Scheduled passenger revenues (€m) 4,599 4,787 -3.9% 18,849 19,707 -4.4%
Unit revenue per ASK (€ cts) 6.67 7.08 -5.7% 6.76 7.12 -5.0%
Unit revenue per RPK (€ cts) 7.87 8.44 -6.7% 7.91 8.36 -5.3%
Unit cost per ASK (€ cts) 6.57 6.85 -4.1% 6.38 6.81 -6.3%
Operating result (€m) 74 156 -82 1,057 842 +215
Of which long-haul (estimated) 1,320 1,070 +250
Of which medium-haul hub feeding (est.) -220 -160 -60
Of which medium-haul point-to-point (est.) -50 -70 +20
A strong passenger network performance with relatively resilient unit revenues. Strict capacity discipline (available seat kilometer (ASK) up by 0.7%) and active yield management limited the downward pressure on unit revenue, particular on premium traffic, whose long-haul unit revenue declined by 1.4%. Ancillary revenues (paid options) were up by 12% amounting to 515 million euros. On the long-haul network, capacity measured in ASKs was up 0.6%, while unit revenue was down 4.7% excluding currency impact. In addition to the soft local flows to France as a result of terrorism, the capacity-demand imbalances observed on different parts of the network caused additional downward pressure on unit revenues. Nevertheless, the estimated long-haul operating result was up 250 million euros to 1,320 million euros. On the medium-haul hub feeding activity, capacity increased by 2.0%, whereas unit revenues decreased by 5.4% excluding currency. The medium-haul network was particularly impacted by the weak local flows to France affecting the operating result which decreased by 60 million euros. As planned, medium-haul point-to-point capacity was further reduced by 3.9%, leading to an improvement in unit revenues of 1.0%, contributing to the 20 million euros improvement in the point-to-point operating result.
4
Cargo business
Fourth Quarter Full Year
Cargo 2016 2015 Change 2016 2015 Change
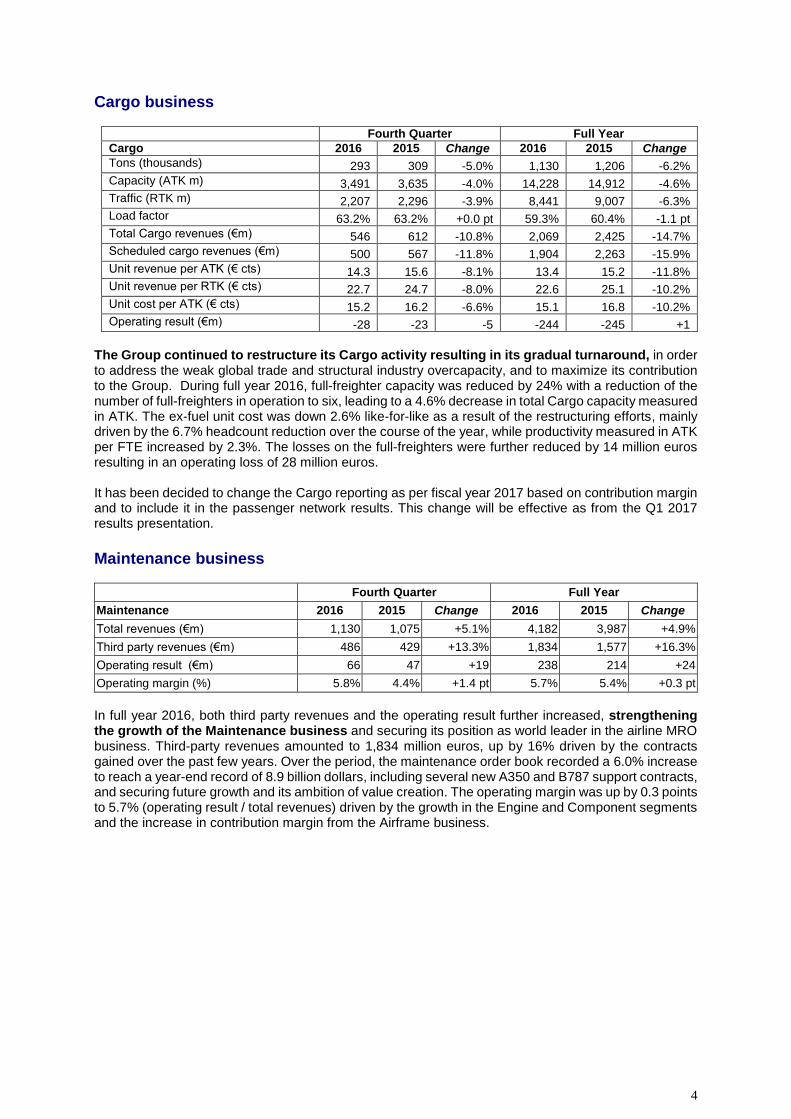
Tons (thousands) 293 309 -5.0% 1,130 1,206 -6.2%
Capacity (ATK m) 3,491 3,635 -4.0% 14,228 14,912 -4.6%
Traffic (RTK m) 2,207 2,296 -3.9% 8,441 9,007 -6.3%
Load factor 63.2% 63.2% +0.0 pt 59.3% 60.4% -1.1 pt
Total Cargo revenues (€m) 546 612 -10.8% 2,069 2,425 -14.7%
Scheduled cargo revenues (€m) 500 567 -11.8% 1,904 2,263 -15.9%
Unit revenue per ATK (€ cts) 14.3 15.6 -8.1% 13.4 15.2 -11.8%
Unit revenue per RTK (€ cts) 22.7 24.7 -8.0% 22.6 25.1 -10.2%
Unit cost per ATK (€ cts) 15.2 16.2 -6.6% 15.1 16.8 -10.2%
Operating result (€m) -28 -23 -5 -244 -245 +1
The Group continued to restructure its Cargo activity resulting in its gradual turnaround, in order to address the weak global trade and structural industry overcapacity, and to maximize its contribution to the Group. During full year 2016, full-freighter capacity was reduced by 24% with a reduction of the number of full-freighters in operation to six, leading to a 4.6% decrease in total Cargo capacity measured in ATK. The ex-fuel unit cost was down 2.6% like-for-like as a result of the restructuring efforts, mainly driven by the 6.7% headcount reduction over the course of the year, while productivity measured in ATK per FTE increased by 2.3%. The losses on the full-freighters were further reduced by 14 million euros resulting in an operating loss of 28 million euros. It has been decided to change the Cargo reporting as per fiscal year 2017 based on contribution margin and to include it in the passenger network results. This change will be effective as from the Q1 2017 results presentation.
Maintenance business
Fourth Quarter Full Year
Maintenance 2016 2015 Change 2016 2015 Change
Total revenues (€m) 1,130 1,075 +5.1% 4,182 3,987 +4.9%
Third party revenues (€m) 486 429 +13.3% 1,834 1,577 +16.3%
Operating result (€m) 66 47 +19 238 214 +24
Operating margin (%) 5.8% 4.4% +1.4 pt 5.7% 5.4% +0.3 pt
In full year 2016, both third party revenues and the operating result further increased, strengthening the growth of the Maintenance business and securing its position as world leader in the airline MRO business. Third-party revenues amounted to 1,834 million euros, up by 16% driven by the contracts gained over the past few years. Over the period, the maintenance order book recorded a 6.0% increase to reach a year-end record of 8.9 billion dollars, including several new A350 and B787 support contracts, and securing future growth and its ambition of value creation. The operating margin was up by 0.3 points to 5.7% (operating result / total revenues) driven by the growth in the Engine and Component segments and the increase in contribution margin from the Airframe business.
5
Transavia
Fourth Quarter Full Year
Transavia 2016 2015 Change 2016 2015 Change
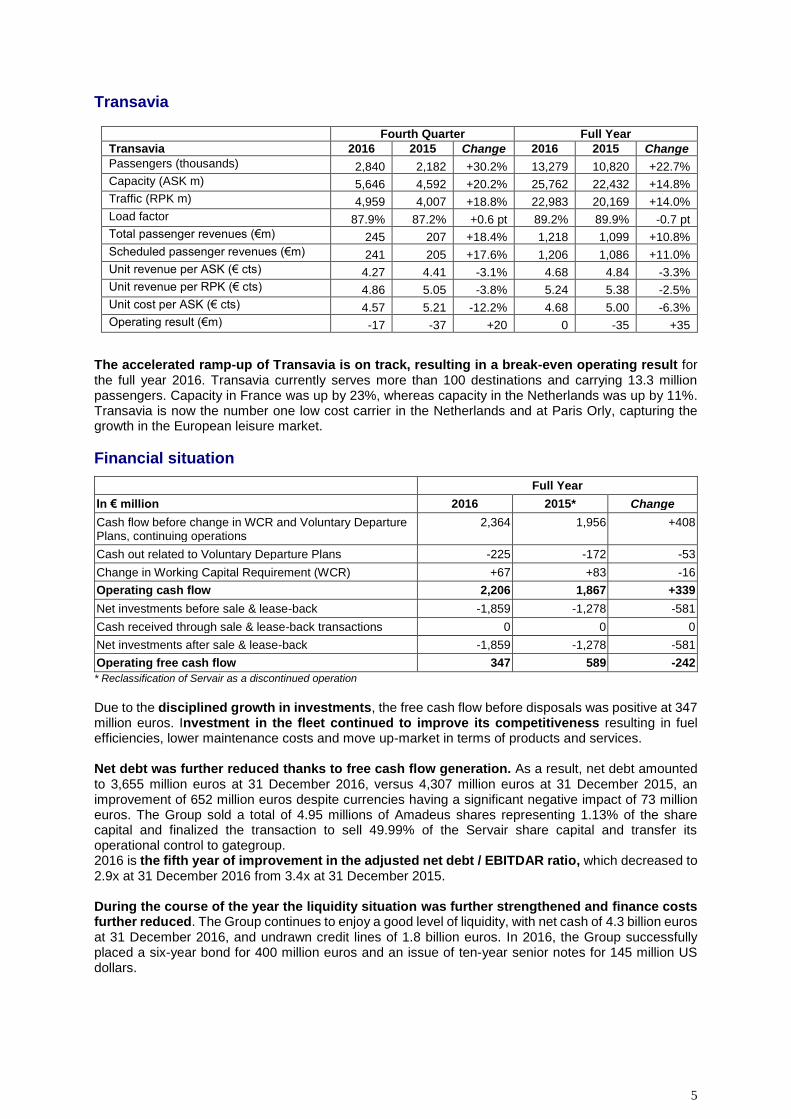
Passengers (thousands) 2,840 2,182 +30.2% 13,279 10,820 +22.7%
Capacity (ASK m) 5,646 4,592 +20.2% 25,762 22,432 +14.8%
Traffic (RPK m) 4,959 4,007 +18.8% 22,983 20,169 +14.0%
Load factor 87.9% 87.2% +0.6 pt 89.2% 89.9% -0.7 pt
Total passenger revenues (€m) 245 207 +18.4% 1,218 1,099 +10.8%
Scheduled passenger revenues (€m) 241 205 +17.6% 1,206 1,086 +11.0%
Unit revenue per ASK (€ cts) 4.27 4.41 -3.1% 4.68 4.84 -3.3%
Unit revenue per RPK (€ cts) 4.86 5.05 -3.8% 5.24 5.38 -2.5%
Unit cost per ASK (€ cts) 4.57 5.21 -12.2% 4.68 5.00 -6.3%
Operating result (€m) -17 -37 +20 0 -35 +35
The accelerated ramp-up of Transavia is on track, resulting in a break-even operating result for the full year 2016. Transavia currently serves more than 100 destinations and carrying 13.3 million passengers. Capacity in France was up by 23%, whereas capacity in the Netherlands was up by 11%. Transavia is now the number one low cost carrier in the Netherlands and at Paris Orly, capturing the growth in the European leisure market.
Financial situation
Full Year
In € million 2016 2015* Change
Cash flow before change in WCR and Voluntary Departure Plans, continuing operations
2,364 1,956 +408
Cash out related to Voluntary Departure Plans -225 -172 -53
Change in Working Capital Requirement (WCR) +67 +83 -16
Operating cash flow 2,206 1,867 +339
Net investments before sale & lease-back -1,859 -1,278 -581
Cash received through sale & lease-back transactions 0 0 0
Net investments after sale & lease-back -1,859 -1,278 -581
Operating free cash flow 347 589 -242
* Reclassification of Servair as a discontinued operation
Due to the disciplined growth in investments, the free cash flow before disposals was positive at 347 million euros. Investment in the fleet continued to improve its competitiveness resulting in fuel efficiencies, lower maintenance costs and move up-market in terms of products and services. Net debt was further reduced thanks to free cash flow generation. As a result, net debt amounted to 3,655 million euros at 31 December 2016, versus 4,307 million euros at 31 December 2015, an improvement of 652 million euros despite currencies having a significant negative impact of 73 million euros. The Group sold a total of 4.95 millions of Amadeus shares representing 1.13% of the share capital and finalized the transaction to sell 49.99% of the Servair share capital and transfer its operational control to gategroup. 2016 is the fifth year of improvement in the adjusted net debt / EBITDAR ratio, which decreased to 2.9x at 31 December 2016 from 3.4x at 31 December 2015. During the course of the year the liquidity situation was further strengthened and finance costs further reduced. The Group continues to enjoy a good level of liquidity, with net cash of 4.3 billion euros at 31 December 2016, and undrawn credit lines of 1.8 billion euros. In 2016, the Group successfully placed a six-year bond for 400 million euros and an issue of ten-year senior notes for 145 million US dollars.
6
Outlook The global context remains highly uncertain regarding the geopolitical and economic environment in which we operate, fuel prices and the ongoing overcapacity on several markets, resulting in pressure on unit revenues. However the January traffic statistics and forward bookings indicates a resilient start to the new year. In January 2017 the unit revenue was down by only 0.7% at constant currency for the passenger network and down only 0.6% at constant currency for Transavia. The Group is targeting a growth for the passenger group (Air France, KLM and Transavia) of between 3.0% and 3.5% measured in ASKs for 2017 in order to regain the offensive in long-haul and to improve the performance in medium-haul. To improve its competitiveness, the Group plans to act on all levels by pursuing and amplifying the initiatives already under way in terms of unit cost reduction. The unit cost reduction target for 2017 is in excess of 1.5% at constant currency, fuel price and pension related expenses. Based on the forward curve of 27 January 2017, the Full Year 2017 fuel bill is expected to increase by 100 million dollars compared to 2016 and to reach 4.9 billion euros1, and the Full Year 2018 fuel bill is expected to increase to 5.0 billion euros2. Regarding the balance sheet, the Group is maintaining strict capex discipline, targeting positive free cash flow before disposals. The 2017 investment plan stands at between 1.7 billion euros and 2.2 billion euros. The Group is pursuing a further reduction in net debt, targeting an adjusted net debt to EBITDAR below 2.5x mid cycle by the end of 2020. We plan to present the comprehensive Trust Together vision at the forthcoming Investor Day, scheduled for 12 May 2017.
1 2017 average Brent price of USD 56, average jet fuel market price of USD 535 per ton, average exchange rate of USD 1.07 per euro 2 2018 average Brent price of USD 56, average jet fuel market price of USD 555 per ton, average exchange rate of USD 1.07 per euro

7
*****
The audit procedures for the consolidated accounts have taken place. The certification report will be published following the completion of the procedures necessary for the filing of the Registration Document. The results presentation is available at www.airfranceklm.com on 16 February 2017 from 7:15 am CET. An Analysts’ Meeting hosted by Mr Janaillac (CEO) and Mr Gagey (CFO) will be held on 16 February 2017 at 08.30 CET at the Pullman Paris Tour Eiffel hotel, 18, avenue de Suffren (75015 Paris). A live webcast of the Analysts’ Meeting will also be available on the website (password AFKL). To connect to the conference call, please dial:
France: +33 (0)1 76 77 25 06
Netherlands: +31 (0)20 703 8261
United Kingdom: +44 (0)203 043 2002
USA: +1 719-325-2226 Confirmation Code: 8241239
Investor relations
Press
Marie-Agnès de Peslouan +33 1 41 56 56 00 Head of Investor Relations Tel : +33 1 49 89 52 59 Email: [email protected]
Dirk Voermans Senior manager, Investor Relations Tel : +33 1 49 89 52 60 Email: [email protected]

8
INCOME STATEMENT
* Reclassification of Servair as a discontinued operation
Fourth Quarter Full Year
In millions euros 2016 2015* Change 2016 2015* Change
Sales 6,086 6,242 -2.5% 24,844 25,689 -3.3%
Other revenues 1 1 0.0% 2 2 0.0%
Revenues 6,087 6,243 -2.5% 24,846 25,691 -3.3%
Aircraft fuel -1,090 -1,363 -20.0% -4,597 -6,183 -25.7%
Chartering costs -100 -105 -4.8% -424 -430 -1.4%
Landing fees and en route charges -463 -469 -1.3% -1,900 -1,947 -2.4%
Catering -109 -112 -2.7% -445 -462 -3.7%
Handling charges and other operating costs -369 -389 -5.1% -1,565 -1,536 1.9%
Aircraft maintenance costs -622 -715 -13.0% -2,469 -2,372 4.1%
Commercial and distribution costs -215 -193 11.4% -905 -896 1.0%
Other external expenses -498 -480 3.8% -1,958 -1,942 0.8%
Salaries and related costs -1,931 -1,882 2.6% -7,474 -7,464 0.1%
Taxes other than income taxes -39 -35 11.4% -164 -155 5.8%
Other income and expenses 195 297 -34.3% 842 1,110 -24.1%
EBITDAR 846 797 6.1% 3,787 3,414 10.9%
Aircraft operating lease costs -275 -265 3.8% -1,073 -1,027 4.5%
EBITDA 571 532 7.3% 2,714 2,387 13.7%
Amortization, depreciation and provisions -477 -395 20.8% -1,665 -1,607 3.6%
INCOME FROM CURRENT OPERATIONS 94 137 -31.4% 1,049 780 34.5%
Sales of aircraft equipment 5 0 na 21 -5 nm
Other non-current income and expenses 153 217 -29.5% 46 305 -84.9%
INCOME FROM OPERATING ACTIVITIES 252 354 -28.8% 1,116 1,080 3.3%
Income from cash and cash equivalents 10 15 -33.3% 49 62 -21.0%
Cost of financial debt -72 -81 -11.1% -309 -372 -16.9%
Net cost of financial debt -62 -66 -6.1% -260 -310 -16.1%
Other financial income and expenses 45 6 -650% -33 -604 94.5%
INCOME BEFORE TAX 235 294 -20.1% 823 166 N/A
Income taxes -128 -25 412% -294 -30 880%
NET INCOME OF CONSOLIDATED COMPANIES 107 269 -60.2% 529 136 289%
Share of profits (losses) of associates -10 2 Na -7 -35 -80%
INCOME FROM CONTINUING OPERATIONS 97 271 -64.2% 522 101 417%
Net income from discontinued operations 256 9 nm 270 26 939%
NET INCOME FOR THE PERIOD 353 280 26.1% 792 127 524%
Minority interest 9 -4 na 0 -9 nm
NET INCOME FOR THE PERIOD - GROUP 362 276 31.2% 792 118 571%
9
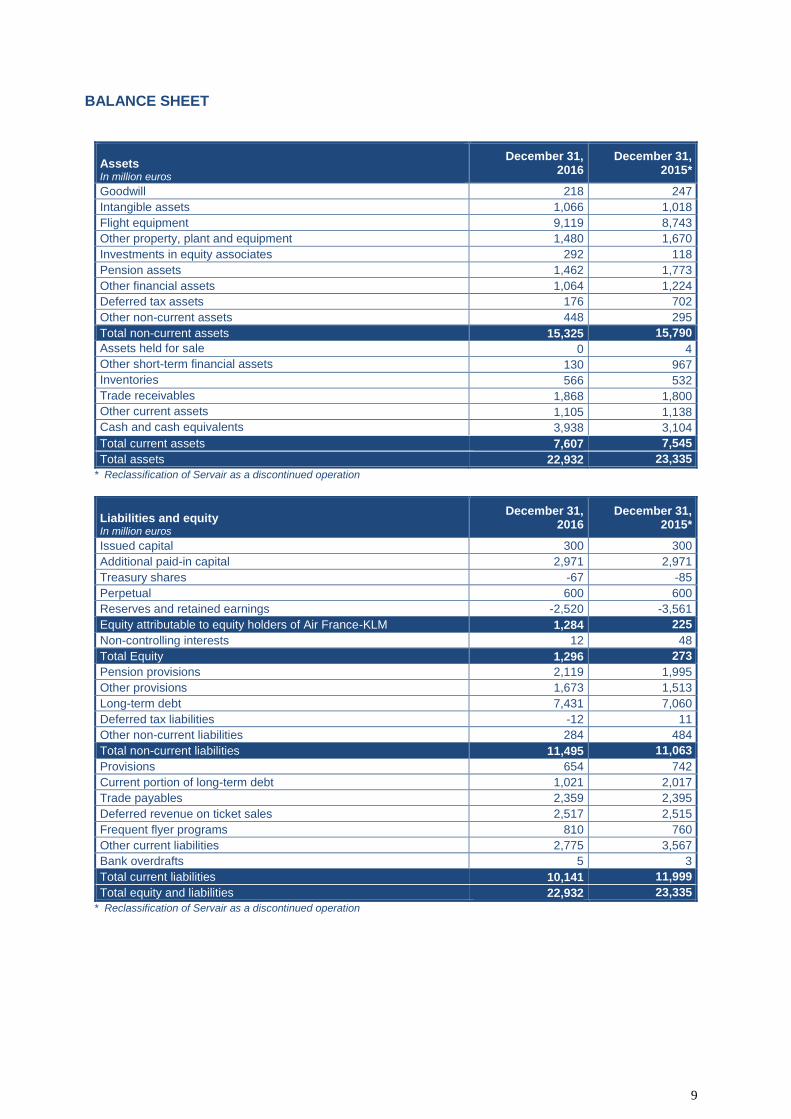
BALANCE SHEET
Assets In million euros
December 31, 2016
December 31, 2015*
Goodwill 218 247
Intangible assets 1,066 1,018
Flight equipment 9,119 8,743
Other property, plant and equipment 1,480 1,670
Investments in equity associates 292 118
Pension assets 1,462 1,773
Other financial assets 1,064 1,224
Deferred tax assets 176 702
Other non-current assets 448 295
Total non-current assets 15,325 15,790
Assets held for sale 0 4
Other short-term financial assets 130 967
Inventories 566 532
Trade receivables 1,868 1,800
Other current assets 1,105 1,138
Cash and cash equivalents 3,938 3,104
Total current assets 7,607 7,545
Total assets 22,932 23,335
* Reclassification of Servair as a discontinued operation
Liabilities and equity In million euros
December 31, 2016
December 31, 2015*
Issued capital 300 300
Additional paid-in capital 2,971 2,971
Treasury shares -67 -85
Perpetual 600 600
Reserves and retained earnings -2,520 -3,561
Equity attributable to equity holders of Air France-KLM 1,284 225
Non-controlling interests 12 48
Total Equity 1,296 273
Pension provisions 2,119 1,995
Other provisions 1,673 1,513
Long-term debt 7,431 7,060
Deferred tax liabilities -12 11
Other non-current liabilities 284 484
Total non-current liabilities 11,495 11,063
Provisions 654 742
Current portion of long-term debt 1,021 2,017
Trade payables 2,359 2,395
Deferred revenue on ticket sales 2,517 2,515
Frequent flyer programs 810 760
Other current liabilities 2,775 3,567
Bank overdrafts 5 3
Total current liabilities 10,141 11,999
Total equity and liabilities 22,932 23,335
* Reclassification of Servair as a discontinued operation
10
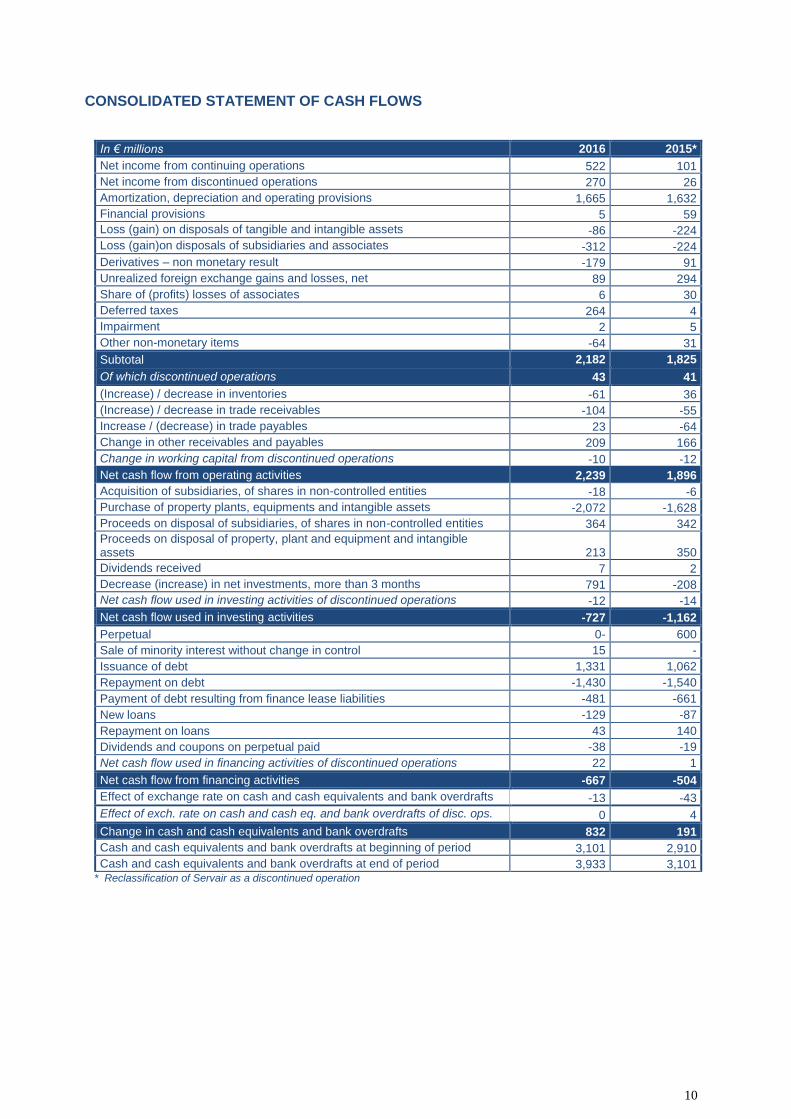
CONSOLIDATED STATEMENT OF CASH FLOWS
In € millions 2016 2015*
Net income from continuing operations 522 101
Net income from discontinued operations 270 26
Amortization, depreciation and operating provisions 1,665 1,632
Financial provisions 5 59
Loss (gain) on disposals of tangible and intangible assets -86 -224
Loss (gain)on disposals of subsidiaries and associates -312 -224
Derivatives – non monetary result -179 91
Unrealized foreign exchange gains and losses, net 89 294
Share of (profits) losses of associates 6 30
Deferred taxes 264 4
Impairment 2 5
Other non-monetary items -64 31
Subtotal 2,182 1,825
Of which discontinued operations 43 41
(Increase) / decrease in inventories -61 36
(Increase) / decrease in trade receivables -104 -55
Increase / (decrease) in trade payables 23 -64
Change in other receivables and payables 209 166
Change in working capital from discontinued operations -10 -12
Net cash flow from operating activities 2,239 1,896
Acquisition of subsidiaries, of shares in non-controlled entities -18 -6
Purchase of property plants, equipments and intangible assets -2,072 -1,628
Proceeds on disposal of subsidiaries, of shares in non-controlled entities 364 342
Proceeds on disposal of property, plant and equipment and intangible assets 213 350
Dividends received 7 2
Decrease (increase) in net investments, more than 3 months 791 -208
Net cash flow used in investing activities of discontinued operations -12 -14
Net cash flow used in investing activities -727 -1,162
Perpetual 0- 600
Sale of minority interest without change in control 15 -
Issuance of debt 1,331 1,062
Repayment on debt -1,430 -1,540
Payment of debt resulting from finance lease liabilities -481 -661
New loans -129 -87
Repayment on loans 43 140
Dividends and coupons on perpetual paid -38 -19
Net cash flow used in financing activities of discontinued operations 22 1
Net cash flow from financing activities -667 -504
Effect of exchange rate on cash and cash equivalents and bank overdrafts -13 -43
Effect of exch. rate on cash and cash eq. and bank overdrafts of disc. ops. 0 4
Change in cash and cash equivalents and bank overdrafts 832 191
Cash and cash equivalents and bank overdrafts at beginning of period 3,101 2,910
Cash and cash equivalents and bank overdrafts at end of period 3,933 3,101 * Reclassification of Servair as a discontinued operation

11
KEY FINANCIAL INDICATORS
EBITDA and EBITDAR
In million euros Q4 2016 Q4 2015* FY 2016 FY 2015*
Income/(loss) from current operations 94 137 1,049 780
Amortization, depreciation and provisions 476 395 1,665 1,607
EBITDA 571 532 2,714 2,387
Aircraft operating lease costs 276 265 1,073 1,027
EBITDAR 846 797 3,787 3,414
* Reclassification of Servair as a discontinued operation
Restated net result, group share
In million euros Q4 2016 Q4 2015* FY 2016 FY 2015*
Net income/(loss), Group share (in €m) 362 276 792 118
Net income/(loss) from discontinued operations (in €m) (256) (9) (270) (26)
Unrealized foreign exchange gains and losses, net (in €m) (32) 26 89 294
Change in fair value of financial assets and liabilities (derivatives) (in €m) (48) (67) (179) 91
Non-current income and expenses (in €m) (158) (217) (67) (300)
Depreciation of shares available for sale (in €m) 0 3 0 16
De-recognition of deferred tax assets (in €m) 44 0 44 0
Restated net income/(loss), group share (in €m) (88) 12 409 193
Restated net income/(loss) per share (in €) -0.32 0.02 1.30 0.59
* Reclassification of Servair as a discontinued operation
Return on capital employed (ROCE)
In million euros 31 Dec.
2016 31 Dec. 2015*
31 Dec. 2015*
31 Dec. 2014
Goodwill and intangible assets 1,284 1,265 1,265 1,252
Flight equipment 9,119 8,743 8,743 8,728
Other property, plant and equipment 1,480 1,670 1,670 1,750
Investments in equity associates 292 118 118 139
Financial assets excluding shares available for sale, marketable securities and financial deposits 224 225 225 152
Provisions, excluding pension, cargo litigation and restructuring (1,706) (1,558) (1,558) (1,434)
WCR, excluding market value of derivatives (5,317) (5,125) (5,125) (4,928)
Capital employed before operating leases 5,376 5,338 5,338 5,659
Operating leases x7 7,511 7,189
Average capital employed (A) 12,868 12,688
Adjusted results from current operations 1,414 1,129
- Dividends received (2) (2)
- Share of profits (losses) of associates (7) (35)
- Tax recognized in the adjusted net result (250) (30)
Adjusted result from current operations after tax (B) 1,155 1,062
ROCE, trailing 12 months (B/A) 9.0% 8.4%
* Reclassification of Servair as a discontinued operation

12
Net debt
Balance sheet at (In million euros)
31 December 2016
31 December 2015*
Current and non-current financial debt 8,452 9,077
Deposits on aircraft under finance lease (336) -453
Financial assets pledged (OCEANE swap) 0 -393
Currency hedge on financial debt (49) -40
Accrued interest (89) -95
Gross financial debt (A) 7,978 8,096
Cash and cash equivalents 3,938 3,104
Marketable securities 53 466
Cash pledges 50 18
Deposits (bonds) 298 204
Bank overdrafts (5) (3)
Other (11) 0
Net cash (B) 4,323 3,789
Net debt (A) – (B) 3,655 4,307
* Reclassification of Servair as a discontinued operation
Adjusted net debt and adjusted net debt/EBITDAR ratio
31 December 2016
31 December 2015*
Net debt (in €m) 3,655 4,307
Aircraft operating leases x 7 (in €m) 7,511 7,189
Adjusted net debt (in €m) 11,166 11,496
EBITDAR (in €m) 3,787 3,414
Adjusted net debt/EBITDAR ratio 2.9 x 3.4 x
* Reclassification of Servair as a discontinued operation
Operating free cash flow
In million euros 2016 2015*
Net cash flow from operating activities, continued operations 2,206 1,867
Investment in property, plant, equipment and intangible assets (2,072) (1,628)
Proceeds on disposal of property, plant, equipment and intangible assets 213 350
Operating free cash flow, excluding discontinued operations 347 589
Disposals 346 336
Operating free cash after disposal 693 925
* Operating free cash flow is including the LHR slot sale in October 2015, which is accounted for in net investments as intangible asset disposal
Lease adjusted operating result
In million euros Q4 2016 Q4 2015* FY 2016 FY 2015*
Operating result 94 137 1,049 780
Aircraft operating leases x 1/3 92 88 358 342
Lease adjusted operating result 186 225 1,407 1,122
Lease adjusted operating margin 3.1% 3.6% 5.7% 4.4%
* Reclassification of Servair as a discontinued operation

13
Unit cost: net cost per EASK
Q4 2016 Q4 2015* FY 2016 FY 2015*
Revenues (in €m) 6,086 6,242 24,844 25,689
Income/(loss) from current operations (in €m) 94 137 1,049 780
Total operating expense (in €m) (5,992) (6,105) (23,795) (24,909)
Passenger network business – other revenues (in €m) 200 196 833 834
Cargo business – other revenues (in €m) 46 45 165 162
Third-party revenues in the maintenance business (in €m) 486 429 1,834 1,577
Transavia - other revenues (in €m) 4 2 12 13
Third-party revenues of other businesses (in €m) 10 11 41 47
Net cost (in €m) 5,246 5,422 20,910 22,276
Capacity produced, reported in EASK 83,575 81,639 341,334 337,994
Net cost per EASK (in € cents per EASK) 6.28 6.64 6.13 6.59
Gross change -5.5% -7.0%
Currency effect on net costs (in €m) 59 188
Change at constant currency -6.5% -7.8%
Fuel price effect (in €m) (274) (1,531)
Change on a constant currency and fuel price basis -1.6% -1.1%
Change in pension-related expenses (in €m) -18 -28
Net cost per EASK on a constant currency, fuel price and pension-related expenses basis (in € cents per EASK)
6.28 6.35 6.13 6.18
Change on a constant currency, fuel price and pension-related expenses basis
-1.3% -1.0%
* Reclassification of Servair as a discontinued operation
INDIVIDUAL AIRLINE RESULTS
Air France
Q4 2016 Q4 2015* Change FY 2016 FY 2015* Change
Revenue (€m) 3,836 3,952 -2.9% 15,414 16,099 -4.3%
EBITDA (€m) 393 364 +29 1,514 1,465 +49
Operating result (€m) 46 102 -56 372 426 -54
Operating margin 1.2% 2.6% -1.4 pt 2.4% 2.6% -0.2 pt
Operating cash flow before WCR and restructuring cash out (€m) 406 326 +80 1,441 1,315 +126
Operating cash flow (before WCR and restructuring) margin 10.6% 8.2% +2.3 pt 9.3% 8.2% +1.2 pt
* Reclassification of Servair as a discontinued operation
KLM
Q4 2016 Q4 2015* Change FY 2016 FY 2015* Change
Revenue (€m) 2,370 2,378 -0.3% 9,800 9,905 -1.1%
EBITDA (€m) 177 169 +8 1,189 911 +278
Operating result (€m) 52 39 +13 681 384 +297
Operating margin 2.2% 1.6% +0.6 pt 6.9% 3.9% +3.0 pt
Operating cash flow before WCR and restructuring cash out (€m) 166 129 +37 1,054 746 +308
Operating cash flow (before WCR and restructuring) margin 7.0% 5.4% +1.6 pt 10.8% 7.5% +3.2 pt
NB: Sum of individual airline results does not add up to Air France-KLM total due to intercompany eliminations at Group level. .
14
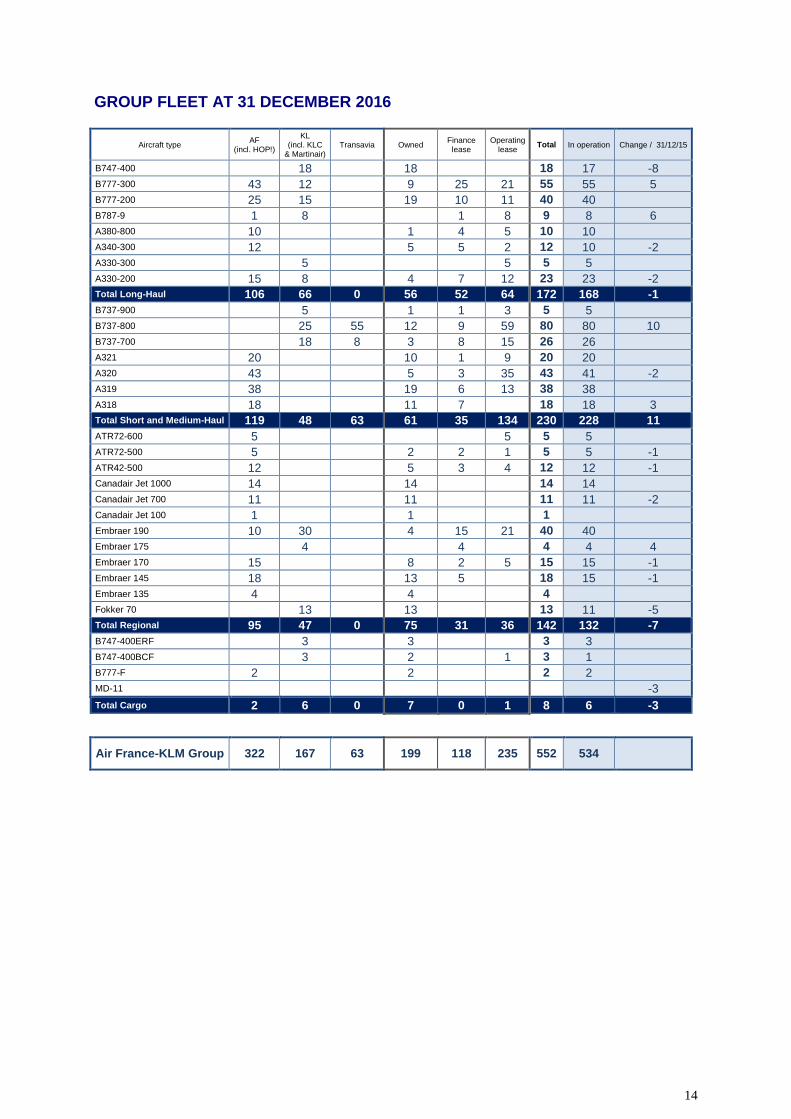
GROUP FLEET AT 31 DECEMBER 2016
Aircraft type AF
(incl. HOP!)
KL (incl. KLC
& Martinair) Transavia Owned
Finance lease
Operating lease
Total In operation Change / 31/12/15
B747-400 18 18 18 17 -8
B777-300 43 12 9 25 21 55 55 5
B777-200 25 15 19 10 11 40 40
B787-9 1 8 1 8 9 8 6
A380-800 10 1 4 5 10 10
A340-300 12 5 5 2 12 10 -2
A330-300 5 5 5 5
A330-200 15 8 4 7 12 23 23 -2
Total Long-Haul 106 66 0 56 52 64 172 168 -1
B737-900 5 1 1 3 5 5
B737-800 25 55 12 9 59 80 80 10
B737-700 18 8 3 8 15 26 26
A321 20 10 1 9 20 20
A320 43 5 3 35 43 41 -2
A319 38 19 6 13 38 38
A318 18 11 7 18 18 3
Total Short and Medium-Haul 119 48 63 61 35 134 230 228 11
ATR72-600 5 5 5 5
ATR72-500 5 2 2 1 5 5 -1
ATR42-500 12 5 3 4 12 12 -1
Canadair Jet 1000 14 14 14 14
Canadair Jet 700 11 11 11 11 -2
Canadair Jet 100 1 1 1
Embraer 190 10 30 4 15 21 40 40
Embraer 175 4 4 4 4 4
Embraer 170 15 8 2 5 15 15 -1
Embraer 145 18 13 5 18 15 -1
Embraer 135 4 4 4
Fokker 70 13 13 13 11 -5
Total Regional 95 47 0 75 31 36 142 132 -7
B747-400ERF 3 3 3 3
B747-400BCF 3 2 1 3 1
B777-F 2 2 2 2
MD-11 -3
Total Cargo 2 6 0 7 0 1 8 6 -3
Air France-KLM Group 322 167 63 199 118 235 552 534