full year 2012 earnings · reserves as of jan. 1, 2012 net flows market forex scope reserves as of...
TRANSCRIPT

Full Year 2012
Earnings
February 21, 2013
Appendices

B2 – AXA FY12 Earnings – February 21, 2013
Table of content
Property & Casualty
Group
Life & Savings
Asset Management
Balance sheet
Business overview
Embedded Value and Cash Flows

B3 – AXA FY12 Earnings – February 21, 2013
FY12 APE by business
Well balanced business mix
G/A Protection
& Health
40%
G/A Savings
17%
Mutual Funds
& other
11%
Unit-Linked
32%
Life & Savings – Scope overview
Global footprint
FY12 APE by channel
Strong proprietary networks
FY12 APE by geography
UK
9%
Asia-Pacific (incl. Japan)
24%
NORCEE
18%
France
22%
MedLA
7%
Total: Euro 6,170 million
Agents & salaried
sales force
47%
Brokers - IFAs
34%
Partnerships
19%
US
20%
Total: Euro 6,170 million
Total: Euro 6,170 million
B4 – AXA FY12 Earnings – February 21, 2013
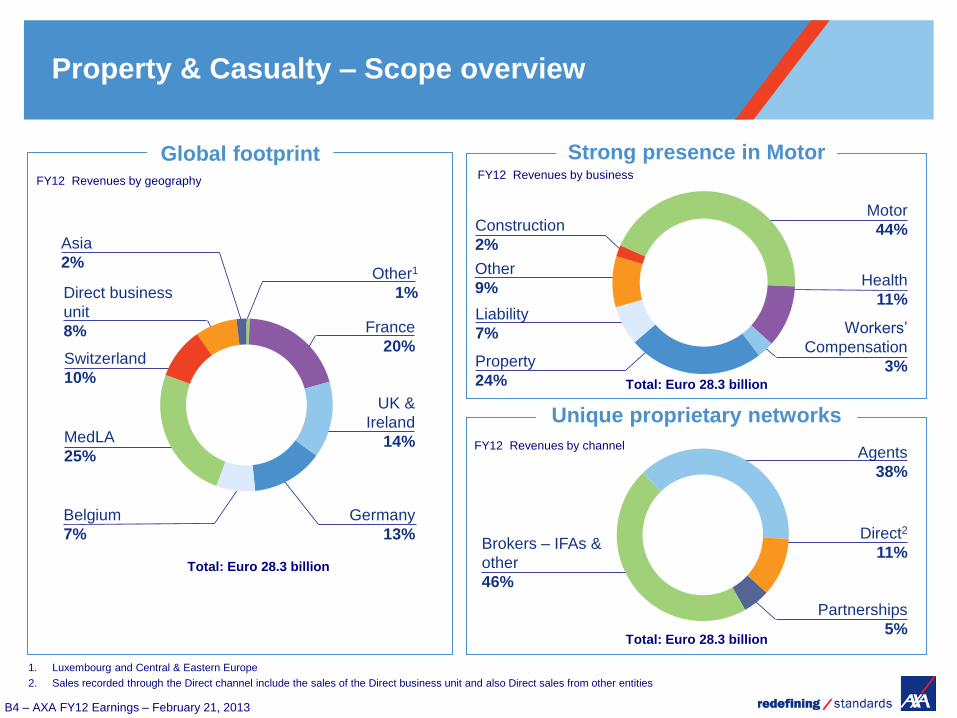
Motor
44%
Health
11%
Property
24%
Construction
2%
Direct2
11% Brokers – IFAs &
other
46%
Agents
38%
Partnerships
5%
Germany
13%
Switzerland
10%
MedLA
25%
France
20%
UK &
Ireland
14%
Belgium
7%
Direct business
unit
8%
Other1
1%
Property & Casualty – Scope overview
FY12 Revenues by channel
Unique proprietary networks
Strong presence in Motor
FY12 Revenues by geography
Total: Euro 28.3 billion
Total: Euro 28.3 billion
Total: Euro 28.3 billion
Asia
2%
FY12 Revenues by business
1. Luxembourg and Central & Eastern Europe
2. Sales recorded through the Direct channel include the sales of the Direct business unit and also Direct sales from other entities
Global footprint
Other
9%
Workers’
Compensation
3%
Liability
7%
B5 – AXA FY12 Earnings – February 21, 2013
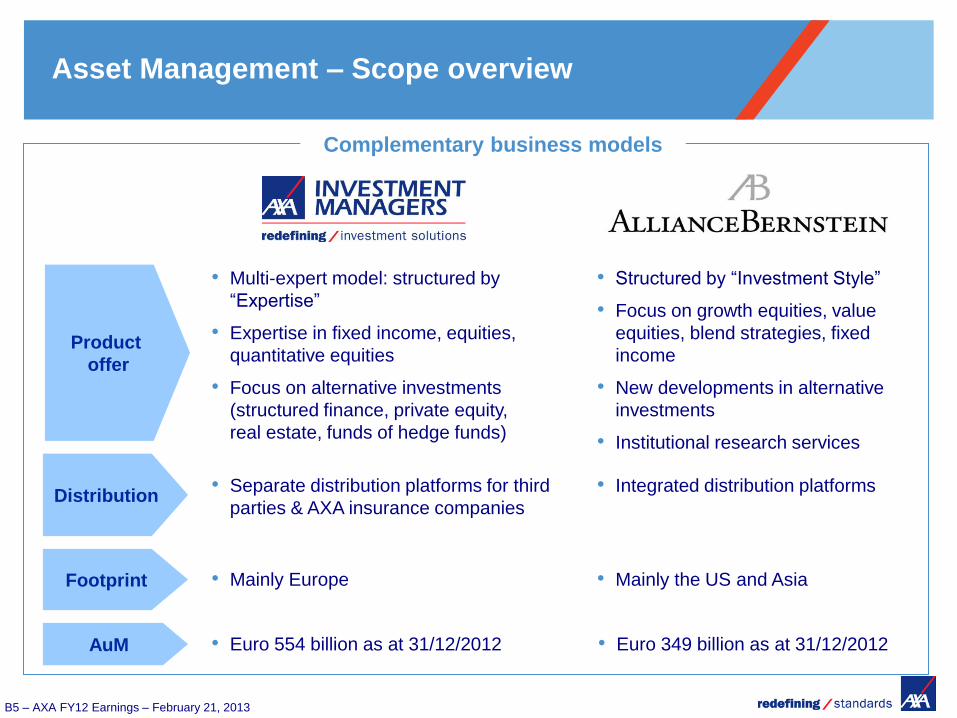
Asset Management – Scope overview
Complementary business models
• Multi-expert model: structured by
“Expertise”
• Expertise in fixed income, equities,
quantitative equities
• Focus on alternative investments
(structured finance, private equity,
real estate, funds of hedge funds)
• Structured by “Investment Style”
• Focus on growth equities, value
equities, blend strategies, fixed
income
• New developments in alternative
investments
• Institutional research services
• Separate distribution platforms for third
parties & AXA insurance companies
• Integrated distribution platforms
• Mainly Europe • Mainly the US and Asia
Product
offer
Distribution
Footprint
• Euro 554 billion as at 31/12/2012 AuM • Euro 349 billion as at 31/12/2012

B6 – AXA FY12 Earnings – February 21, 2013
Table of content
Property & Casualty
Group
Life & Savings
Asset Management
Balance sheet
Business overview
Embedded Value and Cash Flows

B7 – AXA FY12 Earnings – February 21, 2013
Revenues
Revenues by segment
Asset Management
In Euro million FY11
International Insurance
Banking & Holdings
FY12
Revenues
Property & Casualty
Life & Savings
Reported
basis Comparable
basis
52,431
55,016
+5%
+3%
27,046
28,315
+5%
+3%
3,269
3,343
+2%
-3%
2,876
2,987
+4%
+3%
485
466
-4%
-3%
86,107
90,126
+5%
+2%

B8 – AXA FY12 Earnings – February 21, 2013
In Euro million
Underlying Earnings
FY113 FY12 Reported
change
Change at
constant
Forex
Life & Savings 2,138 2,635 +23% +19%
United States 235 522 +122% +107%
France 620 706 +14% +14%
NORCEE1 649 594 -8% -10%
UK -6 -17 +173% +158%
Asia-Pacific (incl. Japan) 575 712 +24% +14%
MedLA 102 162 +60% +60%
Other2 -36 -44 +23% +23%
Property & Casualty 1,848 1,895 +3% +1%
NORCEE1 807 945 +17% +16%
France 496 486 -2% -2%
MedLA 353 232 -34% -35%
UK & Ireland 211 154 -27% -29%
Asia 13 23 +79% +66%
Direct -33 54 n.a. n.a.
International Insurance 276 167 -40% -37%
Asset Management 321 382 +19% +14%
AllianceBernstein 106 159 +50% +39%
AXA IM 215 223 +4% +1%
Banking 32 5 -86% -86%
Holdings -843 -833 +1% +1%
Total 3,772 4,251 +13% +9%
Underlying Earnings by region
1. Northern, Central & Eastern Europe: Germany, Belgium, Switzerland, Central and Eastern Europe, Luxembourg and Russia (Property & Casualty only)
2. Other correspond to Architas, Family Protect and AXA Global Distributors
3. Restated for the change in accounting methodology on deferred acquisition costs (DAC) adopted retrospectively as at January 1, 2012

B9 – AXA FY12 Earnings – February 21, 2013
From Underlying Earnings to Net Income
Net realized capital gains/losses
Realized capital gains
In Euro million FY11*
Impairments
Hedging of equity portfolio
FY12
Adjusted Earnings
Underlying Earnings
Net realized capital
gains/(losses)
FY12
Restructuring costs
Net Income
of which impact from other assets
of which impact from equities &
alternative investments (2)
of which impact from interest rates and
credit spreads (1)
In Euro million FY11*
Adjusted Earnings
Change in fair value
(1) More favorable mark-to-market of interest rate derivatives
(2) Notably from private equity
(3) FY11: mainly Euro 902 million exceptional realized gains on the sale of AXA Canada, Euro 798 million from exceptional realized gains on the sale of the 15.6% stake in Taikang Life and Euro 626 million exceptional realized gains on the AXA APH transaction.
(4) FY11: mainly Euro -943m goodwill reduction attributable to US Accumulator Variable Annuity book of business.
Exceptional and discontinued
operations(3)
of which Forex impacts
Key drivers of change in Net income
3,772 4,251
(312) 297
682 815
(840) (283)
(154) (235)
3,460 4,548
3,460 4,548
110 45
(22) 71
32 54
41 61
58 (140)
2,069 (94)
(281) (244)
(1,167) (103)
4,190 4,152
* Restated for the change in accounting methodology on deferred acquisition costs
(DAC) adopted retrospectively as at January 1, 2012
Intangibles amortization and
other(4)

B10 – AXA FY12 Earnings – February 21, 2013
FY12 key sensitivities
Equities
Interest rates
Corporate spreads
• -25%
• +25%
• -100 bps
• +100 bps
• -75 bps
• +75 bps
o/w
Impairments
net of hedges
Net Income
In Euro billion
Net Unrealized
Capital Gains
and Losses
P&L Balance sheet
- 0.2 - 0.2 - 1.4
0.0 - 0.1 + 1.7
+ 0.8 + 8.2
- 0.3 - 7.6
+ 0.2 + 1.6
- 0.2 - 1.6
B11 – AXA FY12 Earnings – February 21, 2013
Table of content
Property & Casualty
Group
Life & Savings
Asset Management
Balance sheet
Business overview
Embedded Value and Cash Flows

B12 – AXA FY12 Earnings – February 21, 2013
Life & Savings
Revenues, new business volumes and profitability
Underlying earnings margin analysis
Underlying earnings margin analysis by product
1
2
3
page B13
page B14
page B20

B13 – AXA FY12 Earnings – February 21, 2013
United States
+8%
L&S Net inflows
Changes are on a comparable basis
In Euro billion
FY12 L&S revenues by region
L&S – Revenues and net inflows 1
MedLA
+1%
France
+1%
Asia Pacific (incl. Japan)
+6%
UK
+20%
NORCEE
-1%
Total: Euro 55.0 billion
Net flows by business
In Euro billion FY11 FY12
G/A Protection & Health +4.3 +4.8
G/A Savings -3.7 -3.9
Unit-Linked +2.4 +2.8
Mutual funds & other +0.2 +0.2
Total +3.3 +3.9
13.7
11.2
0.6 8.7
15.8
4.8
Net flows by country/region
In Euro billion FY11 FY12
France +0.7 +1.1
NORCEE +2.2 +1.5
United States -0.7 -0.2
United Kingdom +0.7 +0.2
Asia Pacific (incl. Japan) +2.2 +3.3
MedLA -1.9 -2.0
Total +3.3 +3.9
of which mature markets +1.5 +2.5
of which high growth markets +1.8 +1.5

B14 – AXA FY12 Earnings – February 21, 2013
L&S – Underlying earnings margin analysis
1. Changes are adjusted for Forex and scope effects related to sale of Bluefin, portfolios transferred to Resolution in November 2011, AXA APH transaction, ICBC-AXA transaction and the change in reporting period in Asia
2. Life & Savings gross written premiums and mutual fund sales. 3. Tax rate increased from 19% in FY11 to 21% in FY12 mainly due to unfavorable country mix, partly offset by higher tax one-offs which amounted to Euro 172 million in FY12 vs. Euro
143 million in FY11
Expenses Gross Margin
In Euro million
Margin on revenues2
Margin on assets
Technical margin
Acquisition expenses
Admin. Expenses
FY12 Comp.
Change1 In Euro million FY12 Comp.
Change1
Minority interest
Tax3
VBI amortization
+ -
-
2
UE from associates +
4,955 +2% -3,972 +14%
5,065 +5% -2,885 -1%
357 n.a. -179 -27%
86 +99%
Pre-tax underlying earnings +23%
Euro 3,426 million
-713 +30%
-78 n.a.
Underlying earnings +19%
Euro 2,635 million
(vs. Euro -205 million in FY11)

B15 – AXA FY12 Earnings – February 21, 2013
L&S – Margin analysis Details of margin on revenues
1. Life & Savings gross written premiums and mutual fund fees
x
Average margin on L&S revenues1
Life & Savings revenues1
Margin on revenues1
Changes are on a comparable basis
Margin on revenues
2
Detail by product
G/A Protection & Health: 14.7%
G/A Savings: 3.0%
Unit-Linked: 4.2%
Mutual funds & other: 9.3%
-2% business mix
+1% country mix
9.0% 0%
Euro 4,955 million +2%
Euro 55,016 million +3%

B16 – AXA FY12 Earnings – February 21, 2013
Unit-Linked average reserves
In Euro billion
Reserves as of Jan. 1, 2012
Net flows
Market
Forex
Scope
Reserves as of Dec. 31, 2012
L&S – Margin analysis Details of margin on Unit-Linked assets
Unit-Linked management fees
Margin on assets1
Average management fees on Unit-Linked reserves
Unit-Linked management fees
General account investment margin
x
135
+3
+12
-1
0
148
Changes are on a comparable basis
2
+
1. Including other fees (mainly mutual
funds and broker fees) of Euro 302 million
(-1% vs. FY11)
0% business mix
-2% country mix
147 bps -2%
Euro 2,066 million 0%
Euro 5,065 million +5% Euro 140 billion +2%
Euro 2,697 million +10%
B17 – AXA FY12 Earnings – February 21, 2013
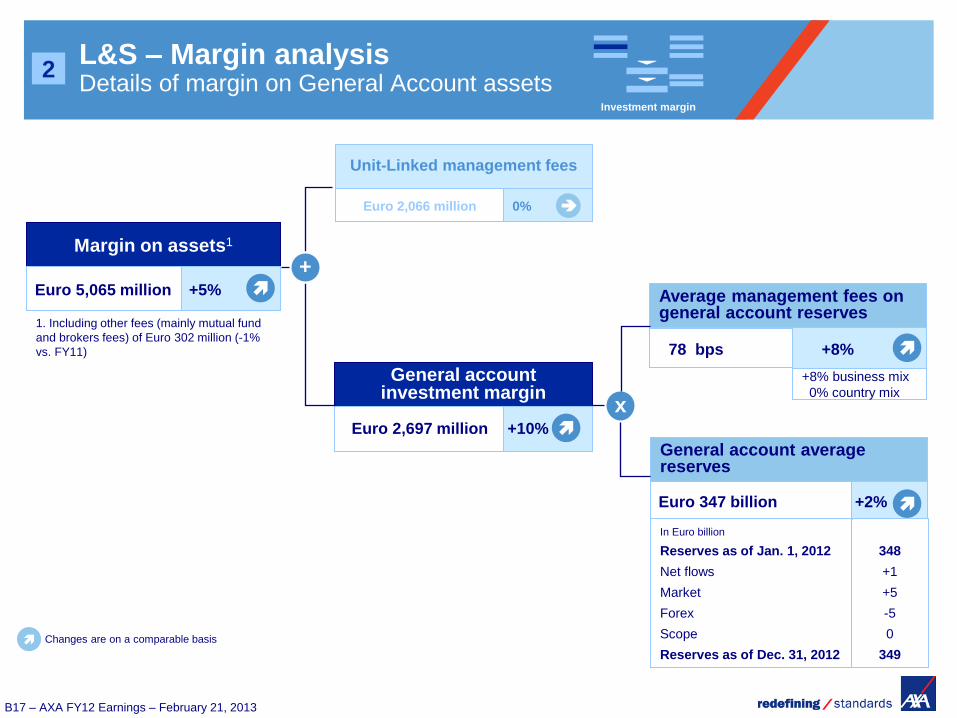
L&S – Margin analysis Details of margin on General Account assets
General account investment margin
Average management fees on general account reserves
General account average reserves
Investment margin
Unit-Linked management fees
Margin on assets1
+
x
In Euro billion
Reserves as of Jan. 1, 2012
Net flows
Market
Forex
Scope
Reserves as of Dec. 31, 2012
348
+1
+5
-5
0
349
2
Changes are on a comparable basis
1. Including other fees (mainly mutual fund
and brokers fees) of Euro 302 million (-1%
vs. FY11)
Euro 2,066 million 0%
Euro 5,065 million +5%
78 bps +8%
Euro 2,697 million +10%
Euro 347 billion +2%
+8% business mix
0% country mix

B18 – AXA FY12 Earnings – February 21, 2013
L&S – Margin analysis Details of technical margin
Technical margin
Technical margin
+
GMxB Variable Annuity margin
Mortality & morbidity margin and other1
In Euro million
Basis
Volatility (equity and interest rates)
Other
Reserve adjustments due to policyholder behavior, management actions including premium suspension and model refinements/assumptions, and refined reserving framework
-51
-249
-342
-401
1. Claims paid, maturities and surrenders
Changes are on a comparable basis
2
(vs. Euro -1,657 million in FY11)
Euro 1,400 million -6%
Euro 357 million n.a.
Euro -1,043 million -41%
(vs. Euro -205 million in FY11)

B19 – AXA FY12 Earnings – February 21, 2013
In Euro million
FY11 FY12
In Euro million FY12 GMxB VA technical margin evolution mainly explained by:
• Euro +0.3 billion driven by lower VA GMxB reserve adjustments,
including premium suspension on old contracts in the US and other
model and assumption refinements, and refined reserving framework
• Euro +0.2 billion improvement in VA GMxB hedging result, mainly in
the US due to decreased volatility and basis losses
Euro -0.4 billion net Underlying
Earnings impact
Gross mortality, morbidity &
surrender margin (pre-tax)
Gross GMxB Variable Annuity
technical margin (pre-tax, pre-DAC)
2 L&S – Margin analysis Focus on gross technical margin
1,4001,452
FY12 FY11
-1,043
-1,657
FY12 mortality, morbidity & surrender margin evolution mainly
explained by:
• Euro +0.1 billion in G/A Protection & Health mainly driven by more
favorable reserve development in France and non repeat of the 2011
Great East Japan earthquake impact
• Euro -0.1 billion in G/A Savings mainly due to the non repeat of 2011
favorable exceptional mortality and disability experience in
Switzerland
• Euro -0.1 billion in Unit-Linked mainly resulting from unfavorable
mortality experience in the US

B20 – AXA FY12 Earnings – February 21, 2013
L&S – FY12 Underlying Earnings by business
G/A Protection & Health
Euro million
Unit-Linked
Pre-tax Underlying Earnings
FY12
G/A Savings
Mutual funds & Other
Tax and minority interest
Underlying Earnings
% change on comp. basis
3
Changes are adjusted for Forex and scope effects related to sale of Bluefin, portfolios transferred to Resolution in November 2011, AXA APH transaction, ICBC-AXA transaction and the change in reporting period in Asia
2,201 2,273 0%
553 692 +25%
-4 504 n.a.
9 -44 n.a.
2,759 3,426 +23%
-621 -791
2,138 2,635 +19%
FY111
1. Restated for the change in accounting methodology on deferred acquisition costs (DAC) adopted retrospectively as at January 1, 2012

B21 – AXA FY12 Earnings – February 21, 2013
G/A Protection
& Health G/A Savings Unit-Linked
Mutual Funds &
Other
Margin on revenues
L&S – FY12 Margin analysis by business
Investment margin
Management fees
Technical margin & Other
Gross margin
Acquisition
Expenses
Pre-tax UE
Admin Exp.
& Other
3
9%
% of GWP
78 bps
of avge G/A reserves
147 bps
of avge UL reserves
Main profit drivers
3,786 360 660
867 1,613 177
0 0 2,066
1,381 -49 -929
6,034 1,924 1,974 444 10,376
-1,373 -625 -820 -159 -2,978
-2,388 -606 -650 -328 -3,972
2,273 692 504 -44 3,426
In Euro million

B22 – AXA FY12 Earnings – February 21, 2013
L&S –Margin analysis by business G/A Protection & Health
Technical result
Protection & Health GWP
Protection & Health
Combined ratio (in %)
In Euro million FY12
x
Net technical result
Net investment margin
Protection & Health
Average reserves
Protection & Health
investment spread
In Euro million FY12
x
Investment margin
+
Comp.
change Comp.
change
3
25,706 +2%
155,885 +2%
94.7% +0.6 pt
56 bps +6 bps
1,406 -8%
867 +14%
Pre-tax underlying earnings 0%
Euro 2,273 million
Changes are adjusted for Forex and scope effects related to sale of Bluefin, portfolios transferred to Resolution in November 2011, AXA APH transaction, ICBC-AXA transaction and the change in reporting period in Asia

B23 – AXA FY12 Earnings – February 21, 2013
L&S – Margin analysis by business G/A Savings
FY12 In Euro million
FY12
x x
+
Technical margin
& Other
FY12
Acquisition costs Administrative
expenses & Other -
G/A Savings
Gross revenues
Margin on
G/A Savings revenues
Margin on revenues
G/A Savings
average reserves
G/A Savings
Investment spread
Investment margin
Comp.
change
Comp.
change
Comp.
change
3
11,950 -12% 190,941 +3%
3.0% +0.5 bp 84 bps +4 bps
360 +4% 1,613 +7%
-49 n.a.
Gross margin +1%
Euro 1,924 million
-606 -6%
-625 -11%
Pre-tax underlying earnings +25%
Euro 692 million
(vs. Euro +52 million in FY11)
Changes are adjusted for Forex and scope effects related to sale of Bluefin, portfolios transferred to Resolution in November 2011, AXA APH transaction, ICBC-AXA transaction and the change in reporting period in Asia

B24 – AXA FY12 Earnings – February 21, 2013
Margin on revenues
L&S – Margin analysis by business Unit-Linked
FY12 FY12
x x
+
Technical margin
& Other
FY12
Investment margin
258
o/w GMxB VA margin
Acquisition costs Administrative
expenses & Other -
Unit-Linked
Gross revenues
Average margin on
Unit-Linked revenues
Unit-Linked
Average reserve
Unit-Linked average
Management fees
Unit-Linked
Management fees
Comp.
change
Comp.
change
Comp.
change
In Euro million
3
(vs. Euro -336 million in FY11*)
(vs. Euro -1,504 million in FY11)
* Restated for the change in accounting methodology on deferred acquisition costs (DAC) adopted retrospectively as at January 1, 2012
15,759 +19% 140,102 +2%
4.2% +0.2 pt 147 bps -2%
660 +24% 2,066 0%
-929 n.a.
-1,043 -41%
177 +12%
Gross margin +70%
Euro 1,974 million
-650 n.a.
-820 -6%
Pre-tax underlying earnings n.a.
Euro 504 million
Changes are adjusted for Forex and scope effects related to sale of Bluefin, portfolios transferred to Resolution in November 2011, AXA APH transaction, ICBC-AXA transaction and the change in reporting period in Asia

B25 – AXA FY12 Earnings – February 21, 2013
Focus on US VA GMxB Refined hedging and reserving approach and strengthened policyholder behavior assumptions
1. Long term view of interest rates set at 3% based on post crisis 10-15 year
duration swap market observations and extended duration of the business due to
low lapse rates
2. Underlying earnings impact is net of DAC and tax
Refined hedging and reserving approach
• Market consistent valuation of annuity at point of
annuitization
• IFRS GMxB reserve calculated by discounting future
value of annuity and death benefits at flat 3%1
Change in IFRS reserve remains fully booked through
Underlying Earnings in the same accounting period
Reduces interest rate sensitivity of IFRS
reserve by 25%
Positioned for greater upside in rising
interest rates
Future lapse rates after the surrender charge period have
an interest-sensitive dynamic function and are floored at
1.5% to 2.5%, for deep “in-the-money” policies
Prudent policyholder behavior assumptions
Pro-rata partial withdrawals have an interest-sensitive
dynamic function that reduces pro-rata withdrawals by
30% in low interest rate environment
Expected to reduce the risk of future
significant reserve strengthening
from policyholder behavior
Euro -470 million on
Underlying Earnings2 150bps reduction in lapse floor
Euro -130 million on
Underlying Earnings2
Reduce dynamic pro-rata partial
withdrawals by 70%
Limited downside risk:

B26 – AXA FY12 Earnings – February 21, 2013
Table of content
Property & Casualty
Group
Life & Savings
Asset Management
Balance sheet
Business overview
Embedded Value and Cash Flows
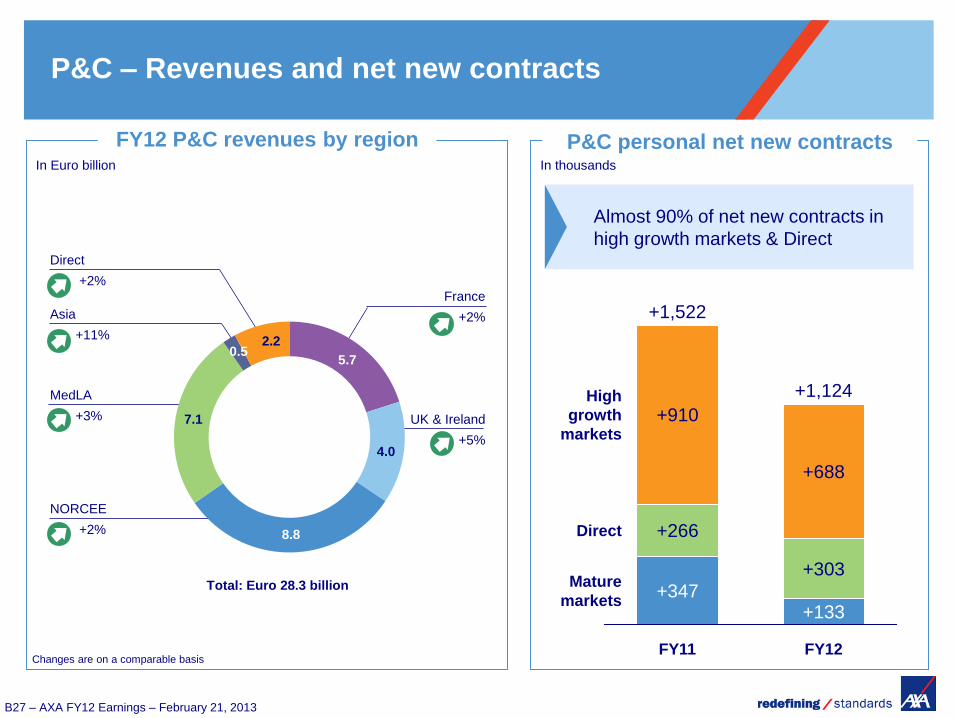
B27 – AXA FY12 Earnings – February 21, 2013
UK & Ireland
+5%
Asia
+11%
France
+2%
NORCEE
+2%
MedLA
+3%
Direct
+2%
P&C personal net new contracts In thousands
Changes are on a comparable basis
In Euro billion
FY12 P&C revenues by region
5.7
7.1
2.2 0.5
8.8
4.0
Almost 90% of net new contracts in
high growth markets & Direct
P&C – Revenues and net new contracts
Total: Euro 28.3 billion +347
+266
+910
Mature
markets
Direct
High
growth
markets
FY12
+1,124
+133
+303
+688
FY11
+1,522

B28 – AXA FY12 Earnings – February 21, 2013
4. Tax rate increased at 31% vs. 28% in FY11, reflecting
higher pre-tax underlying earnings and lower tax one-offs.
Underlying earnings
Euro 1,895 million
Pre-tax underlying earnings
Euro 2,722 million
P&C – Underlying Earnings analysis
Minority interest +11 n.a.
Tax4 -838 +11%
Net technical result
Revenues
Combined ratio1 (in %)
28,315 +3%
97.6% -0.3 pt
In Euro million FY12 Comp.
Change
x
Net technical result2 673 +19%
Net investment income
Average P&C assets
Average asset yield3
55,430 +1%
3.6% -3%
In Euro million FY12 Comp.
Change
x
Net investment income 2,007 -2%
+
-
+2%
+1%
1. Combined ratio calculated based on gross earned premiums
2. Technical result net of expenses
3. Net of interests credited to P&C reserves relating to annuities.
Gross asset yield was 3.9%
UE from associates 43 +10% +

B29 – AXA FY12 Earnings – February 21, 2013
Combined Ratio -0.1 pt
Loss Ratio (%)
-0.2 pt
-0.1 pt change on a comparable basis
-0.2 pt change on a comparable basis
Changes are on a reported basis
Expense Ratio (%)
P&C – Details on Combined Ratio
26.8% 26.3%
Expense
Ratio
Loss
Ratio
FY12
97.6%
26.8%
70.8%
FY11
97.9%
27.0%
70.9% FY12
70.8%
Prior year
reserve
dev.
+0.5 pt
Nat Cat
-0.3 pt
Current
accident
year
-0.3 pt
FY11
70.9%
FY12
26.8%
Adm.
Expenses
-0.2 pt
Acq.
expenses
0.0 pt
FY11
27.0%

B30 – AXA FY12 Earnings – February 21, 2013
P&C – Focus on reserve developments
Prior year reserve development level
(in % of gross earned premiums)
Reserving ratio (Net technical reserves/Net earned premiums)
Note: FY04 to FY09 figures do not exclude Canadian operations
FY10
3.1%
FY08
5.4%
FY07
2.7%
FY06
1.4%
FY05
0.9%
FY04
0.3%
FY12
1.2%
FY09
5.4%
FY11
1.7%
186%
FY09
187% 186%
FY11
187%
FY10 FY12 FY08
187%
FY07
194%
FY06
186%
FY05
193%
FY04
193%

B31 – AXA FY12 Earnings – February 21, 2013
Personal Motor Personal non motor
Total P&C
Total commercial lines incl. Construction & Work. Comp.
P&C – Details on current year loss ratios
1. Other includes opening adjustments, changes in mix, claims handling costs, reinsurance impact excl. Nat Cat, other changes in reserves, Forex and scope
-1.7pts
Nat Cat
-0.2pt
FY11
Current
loss ratio
77.1%
FY12
Current
loss ratio
75.4%
Other
+1.8pts
Frequency &
severity
-1.7pts
Price effect FY12
Current
loss ratio
64.5%
Other
+1.1pts
Frequency &
severity
+1.4pts
Price effect
-2.3pts
Nat Cat
-0.4pt
FY11
Current
loss ratio
64.8%
1 1
Price effect
-2.0pts
Nat Cat
-0.1pt
FY11
Current
loss ratio
74.2%
FY12
Current
loss ratio
74.5%
Other
+1.0pt
Frequency &
severity
+1.5pts
1 FY12
Current
loss ratio
72.0%
Other
+1.1pts
Frequency &
severity
+0.4pt
Price effect
-1.8pts
Nat Cat
-0.3pt
FY11
Current
loss ratio
72.6%
1

B32 – AXA FY12 Earnings – February 21, 2013
Table of content
Property & Casualty
Group
Life & Savings
Asset Management
Balance sheet
Business overview
Embedded Value and Cash Flows

B33 – AXA FY12 Earnings – February 21, 2013
Underlying earnings
Euro 382 million
Expenses Margin
In Euro million
Asset Management fees 2,850 -4%
Distribution revenues 493 +5%
Asset Management
expenses -2,248 -9%1
Distribution expenses -495 +9%
FY12 Comp.
Change In Euro million FY12
Comp.
Change
Minority int.& other -139 +19%
Tax2 -189 +23%
+ -
Pre-tax underlying earnings
Euro 710 million
-
+14%
+13%
Investment result 107 -1%1
AM - Underlying Earnings Details of Asset Management margin analysis
1. Changes are restated from deferred compensation benefits variances that have zero net P&L impact with impacts in investment results fully offset in expenses (Euro -14 million impact
in FY11 and Euro +12 million in FY12).
2. Tax rate up from 25% in FY11 to 27% in FY12

B34 – AXA FY12 Earnings – February 21, 2013
AM – Underlying Earnings Details on Asset Management revenues
Average Asset Management fees
on Assets under Management
33 bps -4%
Average Assets under
Management
Euro 870 billion 0%
Asset Management fees
Euro 2,850 million -4%
x
In Euro billion
AUM as of Jan. 1, 2012
Net inflows
o/w AllianceBernstein
o/w AXA IM
Market & other
Forex
Scope
AUM as of Dec. 31, 2012
847
-1
-4
+3
+73
-3
-13
903
o/w performance fees (Euro 137 million, +14%)
o/w research fees (Euro 321 million, -5%)
Changes are on a comparable basis

B35 – AXA FY12 Earnings – February 21, 2013
Table of content
Property & Casualty
Group
Life & Savings
Asset Management
Balance sheet
Business overview
Embedded Value and Cash Flows

B36 – AXA FY12 Earnings – February 21, 2013
Balance sheet
General accounts invested assets
1.1 Government bonds & related
1.2 Corporate bonds
1.3 CDS
1.4 ABS
1.5 Equity
1.6 Real Estate
1.7 Hedge Funds
1.8 Private Equity
1.9 Mortgage loans
Solvency
Net financial debt
1
2
3
Page B37
page B38
page B39
page B42
page B43
page B47
page B49
page B50
page B51
page B52
Page B56
Page B60

B37 – AXA FY12 Earnings – February 21, 2013
General Account invested assets
Fixed income 384 82% 404 82%
o/w govies and related 207 44% 219 45%
o/w Corporate bonds 148 32% 151 31%
o/w Asset backed securities 8 2% 9 2%
o/w Mortgage loans & other 1 22 5% 25 5%
Cash 29 6% 28 6%
Listed equities 14 3% 15 3%
Real Estate 22 5% 23 5%
Alternative Investments2 13 3% 15 3%
Policy loans 6 1% 6 1%
Total Insurance Invested Assets3 467 100% 491 100%
Changes in asset allocation
• Net inflows, investment income and
maturities: invested mainly in corporate
and government bonds
• Mark to market: fixed income assets
benefiting from interest rates decrease and
general spread tightening across most
major European govies
Invested assets (100%) In Euro billion
% % FY12 FY11
1. Mortgage loans & other include residential loans (Euro 12 billion), commercial & agricultural loans (Euro 10 billion) and Agency Pools (Euro 3 billion)
2. Mainly Private Equity and Hedge Funds
3. FY12 invested assets referenced in page 57 of the financial supplement are Euro 677 billion, which include notably Euro 147 billion of Unit-linked contracts and Euro 34
billion related to the banking segment

B38 – AXA FY12 Earnings – February 21, 2013
The Netherlands
2%
Italy
8%
P&C
~11%
L&S
~87%
Other2
~2%
Austria
3% Spain
3%
US
6%
Belgium
13%
France
24%
Breakdown by geography
Total: Euro 219 billion As of Dec 31, 2012
Japan
12%
Germany
12%
Switzerland
7%
Other
~7% Supranational institutions
3%
1. Gross of tax and policyholders’ participation
2. Other includes International Insurance and Holdings segments
Breakdown by segment
Government bonds and related 1.1
Gross1 unrealized capital
gains and losses
10.2
25.3
FY11 FY12
In Euro billion

B39 – AXA FY12 Earnings – February 21, 2013
A
~41%
AAA
~8%
Industrial
7%
Communications
9%
Total: Euro 151 billion
Consumer
cyclical
5%
Consumer non-cyclical
12%
Banks
34%
Other financials
10%
Utilities
9%
Energy
5%
Basic materials
5% Other
2%
Corporate bonds 1.2
Single A range
Other2
~2%
Breakdown by segment
P&C
~14%
L&S
~84%
Gross1 unrealized capital gains and losses
9.2
3.0
FY12 FY11
In Euro billion
BBB
~29%
AA
~11%
Other
~11%
1. Gross of tax and policyholders’ participation
2. Other includes International Insurance and Holdings segments
Breakdown by industry
Technology
2%
As of Dec 31, 2012

B40 – AXA FY12 Earnings – February 21, 2013
Gross market
value
in Euro billion
Senior debt Sub debt
Total Secured
Non
secured
Lower
Tier 2
Upper
Tier 2 Tier 1 Preferred
United States 0.2 7.2 1.9 0.0 0.1 0.0 9.3
France 2.7 3.2 1.1 0.0 0.0 0.0 7.0
Netherlands 2.7 2.6 0.3 0.0 0.1 0.0 5.7
Spain 4.0 0.7 0.2 0.0 0.0 0.0 4.9
UK 0.8 2.8 0.8 0.0 0.2 0.0 4.6
Germany 2.7 0.3 0.9 0.5 0.2 0.0 4.5
Australia 0.8 2.5 0.2 0.0 0.1 0.0 3.7
Italy 1.0 1.3 0.1 0.0 0.0 0.0 2.3
Switzerland 0.6 1.4 0.1 0.0 0.0 0.0 2.2
Sweden 0.4 1.3 0.1 0.0 0.1 0.0 1.9
Norway 0.5 0.5 0.0 0.0 0.0 0.0 1.0
Canada 0.3 0.5 0.0 0.0 0.0 0.0 0.8
Other1 0.7 1.8 0.2 0.1 0.0 0.0 2.9
TOTAL 17.3 25.9 6.0 0.6 0.9 0.0 50.8
1. More than 30 countries
Focus on banking corporate bonds 1.2
As of Dec 31, 2012

B41 – AXA FY12 Earnings – February 21, 2013
Euro billion
As of December 31, 2012 US UK Japan Germany Switzerland France Other1 Total
P NP NP NP P NP P NP P NP P NP P NP
AAA 0 0 0 1 3 1 2 1 3 1 0 0 9 4
AA 1 2 0 3 1 0 2 0 3 1 2 1 9 7
A 3 9 1 7 5 1 6 1 12 5 6 4 32 29
BBB 3 9 1 2 4 1 4 1 9 4 4 2 24 20
Below invest. grade 0 1 0 0 2 0 2 0 2 1 0 1 6 4
Non rated 0 0 0 0 1 0 2 0 1 0 1 2 5 3
Total 7 20 3 14 16 4 17 3 30 13 14 11 84 67
Corporate bonds breakdown by country (including CDS)
P = Participating NP = Non-participating
1. Including Belgium, AXA MPS, Spain, Italy, Asia Pacific (exc. Japan), Other
1.2

B42 – AXA FY12 Earnings – February 21, 2013
• CDS mainly used as alternative to investment grade corporate bonds
• Overlay strategy: synthetically replicate corporate bonds by selling CDS on top of government
bonds to enhance return
• NBT strategy: buy credit derivatives on corporate names to form negative basis trade
Euro million
Overlay strategy
Net notional as of
Dec 31, 2012
NBT strategy
Net notional as of
Dec 31, 2012
Total
Net notional as of
Dec 31, 2012
AAA 161 - 161
AA 828 (35) 793
A 2,765 (348) 2,417
BBB 1,663 (4,097) (2,434)
Below invest. grade 47 (1,105) (1,057)
Non rated (13) (83) (95)
Total 5,451 (5,666) (215)
Corporate bonds: focus on CDS 1.3
Represents
total market
value of
Euro -207 million
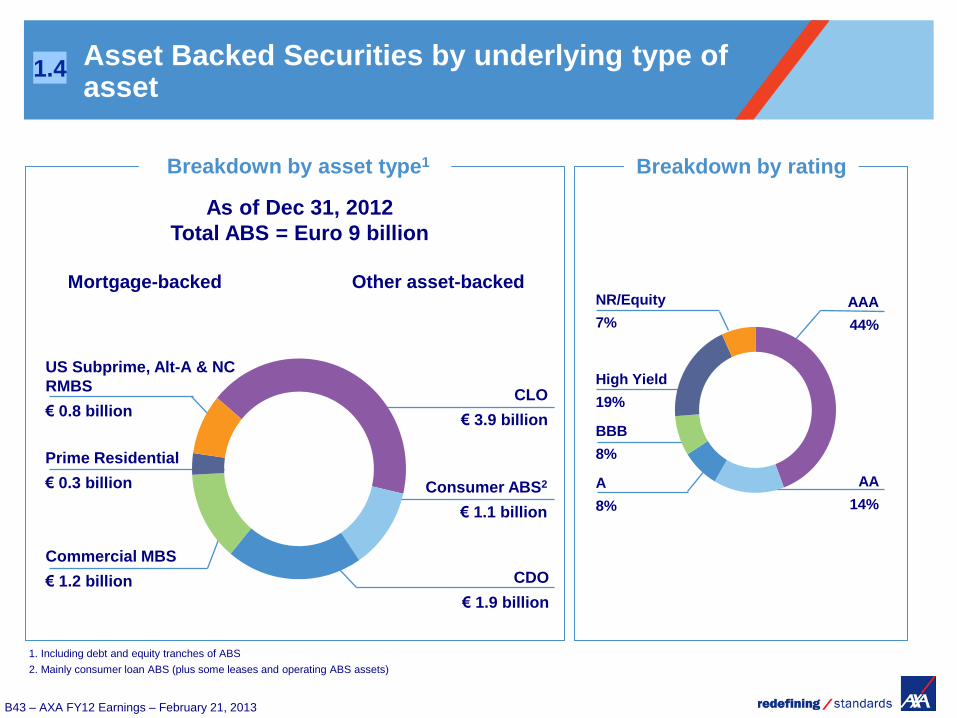
B43 – AXA FY12 Earnings – February 21, 2013
High Yield
19%
BBB
8%
AA
14%
AAA
44%
1. Including debt and equity tranches of ABS
2. Mainly consumer loan ABS (plus some leases and operating ABS assets)
CDO
€ 1.9 billion
Consumer ABS2
€ 1.1 billion
CLO
€ 3.9 billion
Commercial MBS
€ 1.2 billion
US Subprime, Alt-A & NC
RMBS
€ 0.8 billion
Prime Residential
€ 0.3 billion
Mortgage-backed Other asset-backed
As of Dec 31, 2012
Total ABS = Euro 9 billion
Asset Backed Securities by underlying type of asset
Breakdown by asset type1 Breakdown by rating
1.4
A
8%
NR/Equity
7%

B44 – AXA FY12 Earnings – February 21, 2013
Credit risk management: ABS investments
Group ABS Exposure Asset values
In Euro million 31/12/2011 31/12/12 31/12/2011 31/12/12
Mortgage-backed
Prime Residential 494 291 80% 88%
Commercial MBS 1,323 1,210 59% 61%
UK & NC RMBS 108 122 57% 71%
US Subprime 676 673 45% 52%
US Alt-A 36 20 27% 52%
Other asset-backed
Consumer ABS 934 1,096 88% 95%
CLO 3,195 3,928 84% 87%
Investment Grade CDO 1,070 1,588 70% 91%
High-Yield CDO 63 46 48% 55%
Structured Finance CDO 25 42 20% 28%
Other CDO 167 223 43% 79%
Total 8,092 9,239 71% 79%
1.4
Group ABS exposure increased mainly driven by:
• Market effect of Euro 1 billion mainly driven by performance of CMBS and Investment Grade
CDO’s
• Net flows of Euro 0.3 billion, comprised of Euro 2.4 billion of purchases mainly on CLO’s and
Consumer ABS, and Euro 2.1 billion of sales and redemptions
• Minor evolution of scope of Euro -0.1 billion and forex impact of Euro -0.1 billion

B45 – AXA FY12 Earnings – February 21, 2013
Euro million
As of December 31, 2012
(unless indicated)
Prime Residential
MBS Commercial MBS UK & NC RMBS
US Subprime
RMBS US Alt-A RMBS
% of par @ 31/12/09 89% 75% 59% 42% 14%
% of par @ 31/12/10 87% 69% 65% 51% 21%
% of par @ 31/12/11 80% 59% 57% 45% 27%
% of par @ 31/12/12 88% 61% 71% 52% 52%
AAA 165 110 13 3 0
AA 74 53 65 24 0
A 21 229 10 100 2
BBB 14 262 1 48 1
Below invst. Grade 12 555 28 495 17
Equity / Non rated 6 - 5 3 0
Value 291 1,210 122 673 20
Shareholder Exposure 72% 86% 77% 38% 79%
OCI1 57% 84% 43% 92% 82%
P&L 43% 16% 57% 8% 18%
Focus on Mortgage-Backed Securities
1. Fair value changes of assets classified as available for sale are recognized in the OCI component in shareholders’ equity.
1.4

B46 – AXA FY12 Earnings – February 21, 2013
Euro million
As of December 31, 2012
Investment
grade
High
Yield
Structured
Finance
Other
CDOs Total
AAA 1,076 - 2 10 1,088
AA 20 - 1 55 76
A 2 7 - 8 17
BBB 12 15 - 4 31
Below invst. grade 401 11 17 10 438
Equity / Non rated 77 13 22 137 248
Value 1,588 46 42 223 1,899 Shareholder Exposure 40% 82% 85% 68% 45%
OCI1 2% 64% 85% 60% 13%
P&L 98% 36% 15% 40% 87%
Focus on CDO
1. Fair value changes of assets classified as available for sale are recognized in the OCI component in shareholders equity.
1.4
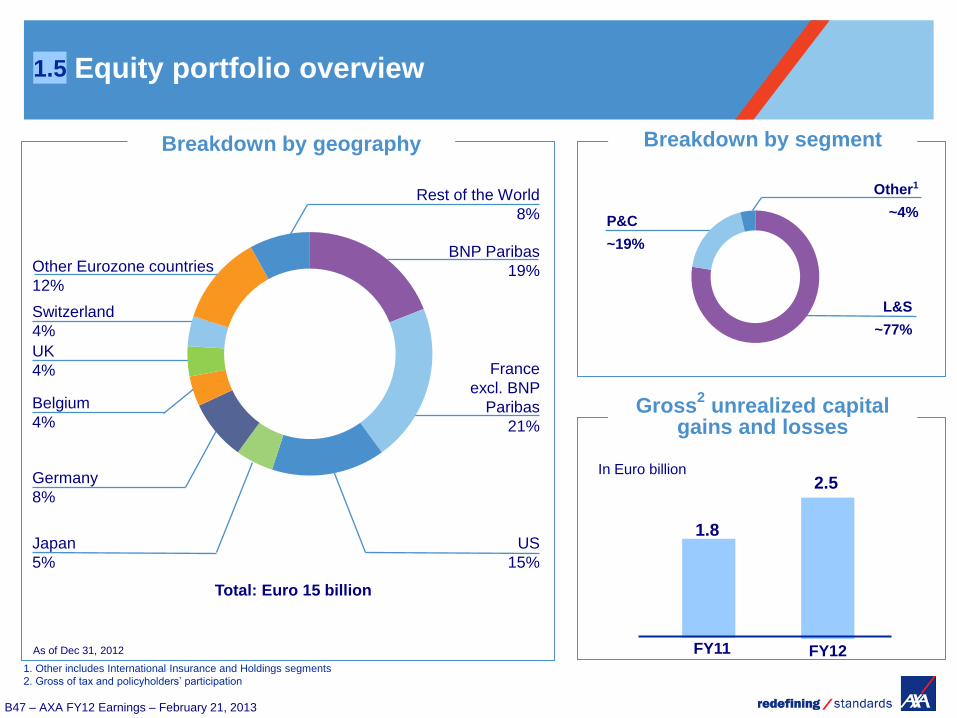
B47 – AXA FY12 Earnings – February 21, 2013
Belgium
4%
Germany
8%
Switzerland
4%
Japan
5%
UK
4%
P&C
~19%
L&S
~77%
Other1
~4%
France
excl. BNP
Paribas
21%
Breakdown by geography
Total: Euro 15 billion
US
15%
Rest of the World
8%
Breakdown by segment
Equity portfolio overview
Gross2 unrealized capital
gains and losses
1.8
FY12 FY11
In Euro billion
1. Other includes International Insurance and Holdings segments
2. Gross of tax and policyholders’ participation
BNP Paribas
19%
1.5
2.5
As of Dec 31, 2012
Other Eurozone countries
12%
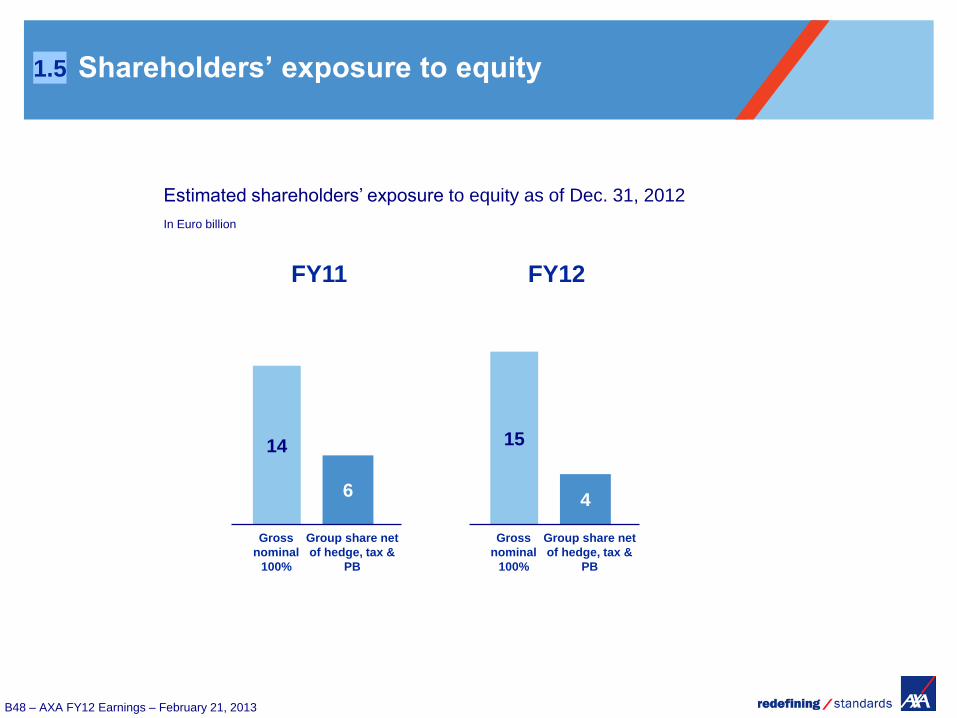
B48 – AXA FY12 Earnings – February 21, 2013
Estimated shareholders’ exposure to equity as of Dec. 31, 2012
In Euro billion
Shareholders’ exposure to equity
15
1.5
4
Gross
nominal
100%
Group share net
of hedge, tax &
PB
FY12
14
6
Gross
nominal
100%
Group share net
of hedge, tax &
PB
FY11
B49 – AXA FY12 Earnings – February 21, 2013
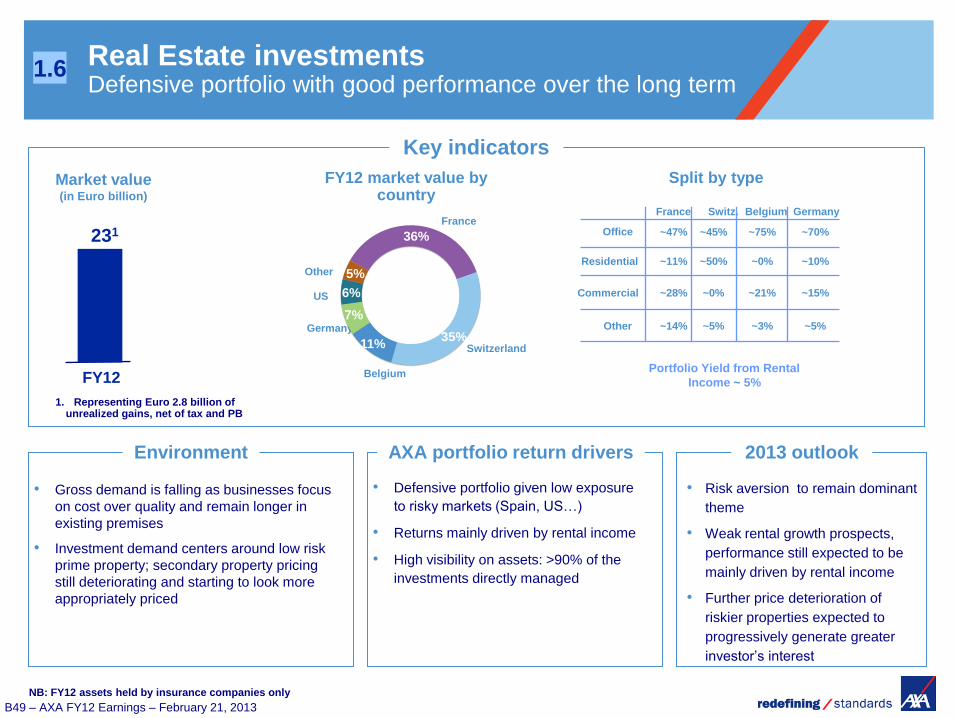
Real Estate investments Defensive portfolio with good performance over the long term
1.6
Key indicators
Market value (in Euro billion)
FY12
231
FY12 market value by country
2013 outlook
• Risk aversion to remain dominant
theme
• Weak rental growth prospects,
performance still expected to be
mainly driven by rental income
• Further price deterioration of
riskier properties expected to
progressively generate greater
investor’s interest
• Gross demand is falling as businesses focus
on cost over quality and remain longer in
existing premises
• Investment demand centers around low risk
prime property; secondary property pricing
still deteriorating and starting to look more
appropriately priced
Environment AXA portfolio return drivers
• Defensive portfolio given low exposure
to risky markets (Spain, US…)
• Returns mainly driven by rental income
• High visibility on assets: >90% of the
investments directly managed
Switzerland
France
US
Germany
Belgium
Other
Office
Residential
France Switz. Belgium Germany
~47%
~11%
~45%
~50%
~75%
~0%
~70%
~10%
1. Representing Euro 2.8 billion of unrealized gains, net of tax and PB
Split by type
Commercial
Other
~28%
~14%
~0%
~5%
~21%
~3%
~15%
~5%
Portfolio Yield from Rental
Income ~ 5%
NB: FY12 assets held by insurance companies only
36%
35%11%
7%
6%
5%

B50 – AXA FY12 Earnings – February 21, 2013
Hedge Fund investments Diversified portfolio of hedge funds
1.7
FY12
4
Exposure and concentration risk
• Mostly management of diversified funds of hedge funds
• Top 10 fund managers represent ~40% of portfolio market value
• Comprised of 10 strategic categories, with the largest strategy representing ~20% of
the portfolio
• Liquid portfolios
Market value (in Euro billion)
Key indicators
Industry Environment 2013 Outlook
Positive growth and new all-time high in AUM
Most new money directed to large well-established managers
New inflows mainly originating from US institutions, while EU and Asian inflows remain weak
Positive performance in 2012, after a challenging start in the first half
Diversified Funds strategy (~87% of book): focus on low volatility and uncorrelated returns
2012 performance in-line with benchmark1, but experienced lower volatility due to market neutral positioning
Well balanced 2012 strategy contribution driven by Fixed Income Arbitrage, quantitative equity market neutral and credit funds.
Tail Equity Diversifier strategy (~13% of book): focus on tail hedge strategy, sharp downturn protection
2012 Performance down ~14% , as product expected to decline when markets rallied in Q1 and second half of 2012
AXA portfolio performance
Improved macro environment given substantial monetary policy support, improving US housing market, less risk of EU zone break-up and stronger growth figures from China
Focus on quantitative equity market neutral & trading oriented credit funds to generate uncorrelated positive returns
2013 might become a more favourable environment for global macro funds due to the improved, more stable market environment
(1) Benchmark: HFRI FOF Conservative EUR Index – up approx. 3% in 2H12

B51 – AXA FY12 Earnings – February 21, 2013
8%
70%
14%
9%
55%34%
4%7%
Private Equity investments Diversified portfolio built over the long run
1.8
• Valuations slightly
increased in FY12
• Private equity saw
strong performance in
FY12, with US market
volumes back to pre-
crisis level
Breakdown by geography
Europe
US
Asia
Breakdown by expertise
Other
Buyout
Venture Mezzanine
Infrastructure
Market value (in Euro billion)
Environment
FY12
• Gold award for “Best French Mid and
Upper Mid-Market LBO Fund”– Private
Equity Exchange Awards
• “Best French LBO team” – Magazine
des Affaires
• “Deal of the year – Transport”
Infrastructure Journal, PFI Awards
• “French LBO Mid-Cap Team of the
Year” – Capital Finance Awards
• “French Lender of the Year, 1st in 200-
500m Euro Enterprise Value, 1st in
Mezzanine Debt Category” – Private
Equity Magazine
8
2012 Awards
• Diversified portfolio: counter-cyclical fields of
expertise (Infrastructure and Mezzanine) and exposure to quality buy-outs
• 46% Direct: high quality portfolio • 54% Funds of Funds: very active monitoring
• In FY12, valuations and distributions increased across all expertise
• Direct portfolio (no default / repayment issues) • Funds of Funds portfolio (underlying companies
continue deleveraging) • Exit of portfolio investments realized at high
multiples
• Active private equity activity
(both investments and
disposals) in both Direct and
Funds of Funds
• AXA Private Equity still a
buyer with no pressure to
sell assets.
• Targets: anti-cyclical
companies, resilient to crisis,
portfolio of funds
Key indicators
NB: Assets held by insurance companies only
Outlook AXA portfolio return drivers
B52 – AXA FY12 Earnings – February 21, 2013
27%
22%
37%
7%7%
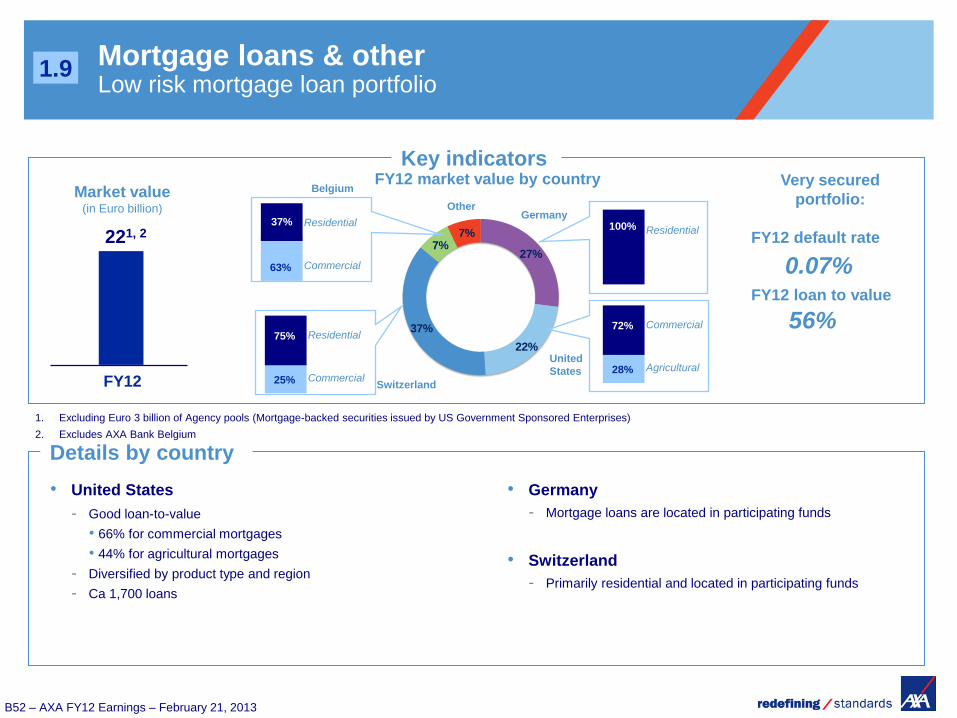
Mortgage loans & other Low risk mortgage loan portfolio
Key indicators
Details by country
• United States
- Good loan-to-value
• 66% for commercial mortgages
• 44% for agricultural mortgages
- Diversified by product type and region
- Ca 1,700 loans
FY12
221, 2
Very secured
portfolio:
FY12 default rate
FY12 loan to value
Agricultural
Commercial 72%
28%
Residential 100%
United
States
Switzerland
Germany Other
• Germany
- Mortgage loans are located in participating funds
• Switzerland
- Primarily residential and located in participating funds
0.07%
56%
Market value (in Euro billion)
FY12 market value by country
1. Excluding Euro 3 billion of Agency pools (Mortgage-backed securities issued by US Government Sponsored Enterprises)
2. Excludes AXA Bank Belgium
1.9
Commercial
Residential 75%
25%
Belgium
Commercial
Residential 37%
63%

B53 – AXA FY12 Earnings – February 21, 2013
1.2 6.8
1.5
0.9
5.2
3.1
FY11*
2.8
FY12
11.2
Focus on net unrealized capital gains
Balance sheet net unrealized
capital gains1
Off balance sheet net
unrealized capital gains In Euro billion In Euro billion
2.0
France Germany Belgium Switzerland Japan US Eurozone
peripheral
countries
0.0
0.7
1.7
0.2
1.0 0.6
Other
(mainly
Netherlands and
Austria)
0.5
Net unrealized capital gains on Government bonds by issuer
Corporate bonds
Equities
Government bonds
3.2
FY11* FY12
3.5
Real Estate and loans2
* Restated for the change in accounting methodology on deferred acquisition costs (DAC) adopted retrospectively as at January 1, 2012
1. Excluding Forex, minority interests and other
2. Excluding net unrealized gains on bank loans. Total off-balance sheet net unrealized gains, including net unrealized gains on bank loans, amounted to €4.6bn in FY12 vs. €4.3bn
in FY11

B54 – AXA FY12 Earnings – February 21, 2013
Focus on exposure to Eurozone peripheral countries government bonds
Exposure by issuer
De-risking actions in 1H12 benefited from tightening of sovereign spreads
Reinvestment in Italy and Ireland in 2H12 in short to mid-term maturities
AFS OCI
in Euro billion
Gross book value
Dec. 31, 2011
Gross book value
June 30, 2012
Gross book value
December 31, 2012
Gross market value
December 31, 2012
Italy 16.1 14.7 16.4 16.7
Spain 8.5 7.7 7.6 7.3
Ireland 1.1 1.0 2.7 2.8
Portugal 2.0 0.9 0.9 0.7
Greece 0.3 0 0 0
TOTAL 28.1 24.4 27.6 27.5
Or Euro 13.0 billion
with AXA MPS JV at
Group share

B55 – AXA FY12 Earnings – February 21, 2013
3.0% 4.3%
Asset & Liability Management Life & Savings investment spreads for main entities
Belgium
AXA MPS
L&S average
guaranteed rate
Reinvestment yield on
L&S fixed income assets
• G/A reserves: Euro 26 billion
• Significant reduction in guaranteed rate
during 2H12, after 1H12 exceptional
sales campaign
• G/A reserves: Euro 13 billion
• G/A deemphasized, focus on Unit-
Linked and Protection businesses
Yield on total L&S
asset base
0.9%
4.3%
0.0%
3.2%
3.4% 4.1%
1.7%
3.0%
FY12
1.6%1 2.4%
FY12
FY12
2.1% 3.4%
1.4%
3.5%
FY12
210bps
Germany
• G/A reserves: Euro 55 billion
• Asset portfolio well diversified with long
investment horizon (8 to 9 years) and
with limited reinvestments in Bunds
FY12 FY12
130bps 70bps
FY12
France
• G/A reserves: Euro 95 billion
• G/A Savings new business sales with
long term guarantees stopped in 1998
FY12
320bps 340bps
New business Inforce
Switzerland (Group Life)
• G/A reserves: Euro 36 billion
• Protection components making products
very profitable
FY12
FY12
70bps 40bps
2.2% 2.6%
1.5% 2.2%
130bps
80bps 130bps
1. Reflects current guaranteed rate in 2013

B56 – AXA FY12 Earnings – February 21, 2013
Solvency I
Solvency I ratio at 233%
In Euro billion
Solvency I
Sensitivities
Ratio as of December 31, 2012 233%
Interest rate +100bps 176%
Interest rate -100bps 292%
Equity markets -25% 226%
Equity markets +25% 245%
Corporate spreads +75 bps 221%
On fixed income assets, the combination of sensitivity impacts from interest
rates increase and widening corporate spreads is capped at -79 pts of solvency
2
FY12
233%
FX & other URGL Underlying
Earnings
FY11
188%
127%
171%
FY08
182%
FY10 FY09
+18 pts
+40 pts
-13 pts
Of which +32 pts on fixed income assets
2132
Requirement
Surplus
44
FY11
24
FY12
24
56

B57 – AXA FY12 Earnings – February 21, 2013
Solvency I reconciliation to shareholders’ equity
- 26
+ 2
56
Available financial resources(1)
In Euro billion
56
+ 4
- 2
+ 10
(1): AXA is not a financial conglomerate but its solvency margin is nevertheless reduced by the amount of its equity interests in credit institutions, investment companies or financial
institutions if the Group holds more than 20% in the mentioned entities. These stakes are deducted in “Other” for a total €-4.0 billion
(2): All subordinated debt (including undated already booked in shareholders’ equity) is admitted up to 50% of requirements
(3): And loans
(4): Notably includes gross up of tax and policyholder participation of net unrealized gains on investments minus net consolidated book value in financial services (see (1)) and Zillmer
adjustment)
+ 8
+ 4
2
Available capital
SH equity 100%
Intangibles
Admitted sub debt (2)
Locally admitted assets
Real estate(3)
Dividend to be paid
Other(4)
Pension benefit

B58 – AXA FY12 Earnings – February 21, 2013
FY12 operating return
FY11 dividend payment
Market impact net of liquidity
premium**
Model changes
Increase in capital requirements from
business evolution, forex & other
FY11
206%
Economic solvency ratio*
FY12
183%
Economic solvency rollforward
+26 pts
-7 pts
-2 pts
+10 pts
-4 pts
Refinement in the economic parameters
modeling, notably improvement in yield
curve modeling in line with Solvency 2
framework
+6 pts
+6 pts
of which
*with US equivalence
** as defined in QIS5
Improvement of inflation risk modeling
Improvement in credit modeling
-2 pts
2
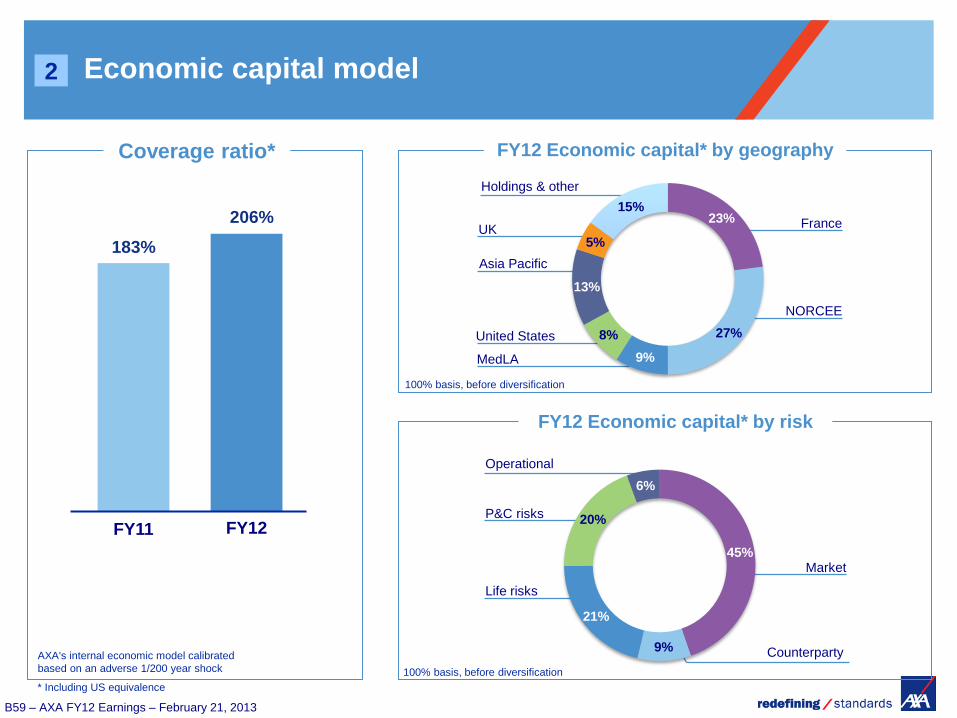
B59 – AXA FY12 Earnings – February 21, 2013
Economic capital model
Coverage ratio*
183%
FY11
206%
FY12
United States
UK France
NORCEE
MedLA
FY12 Economic capital* by geography
Holdings & other
FY12 Economic capital* by risk
100% basis, before diversification
Asia Pacific
2
100% basis, before diversification
AXA's internal economic model calibrated
based on an adverse 1/200 year shock
P&C risks
Market
Counterparty
Operational
Life risks
43%
29%
6%
23%
27%
9%
8%
13%
5%
15%
45%
9%
21%
20%
6%
* Including US equivalence

B60 – AXA FY12 Earnings – February 21, 2013
Net financial debt Long-term maturities
TSS = undated deeply subordinated notes
TSDI = undated subordinated notes
Senior debt
Subordinated debt
In Euro billion
3
In Euro billion
Economic maturity breakdown
Total net debt In Euro billion
Contractual maturity breakdown
Undated subordinated debt
Senior debt
Subordinated debt*
Cash
1.0 0.8 1.0 0.2 0.3
2.1
0.2 3.2
0.9 0.4
0.2 1.3
4.4
1.0 0.8
2012 2013 2014 2015 2016-2020 2021-2025 2026-2040 Undated
1.0 0.8 1.0 0.2 0.3
2.1 0.2 1.9
2.2
0.4
1.6
6.2
2012 2013 2014 2015 2016-2020 2021-2025 2026-2040 Undated
• Undrawn credit lines Euro 12 billion
• Cash & cash equivalent Euro 30 billion
* Including Euro -0.1 billion of reversal of mark-to-market on interest rates derivatives vs. Euro -0.3 billion in FY11
FY12
13.0
5.1
3.3
6.9
7.8
FY11
13.4
4.5
3.3
6.8
7.8

B61 – AXA FY12 Earnings – February 21, 2013
Table of content
Property & Casualty
Group
Life & Savings
Asset Management
Balance sheet
Business overview
Embedded Value and Cash Flows
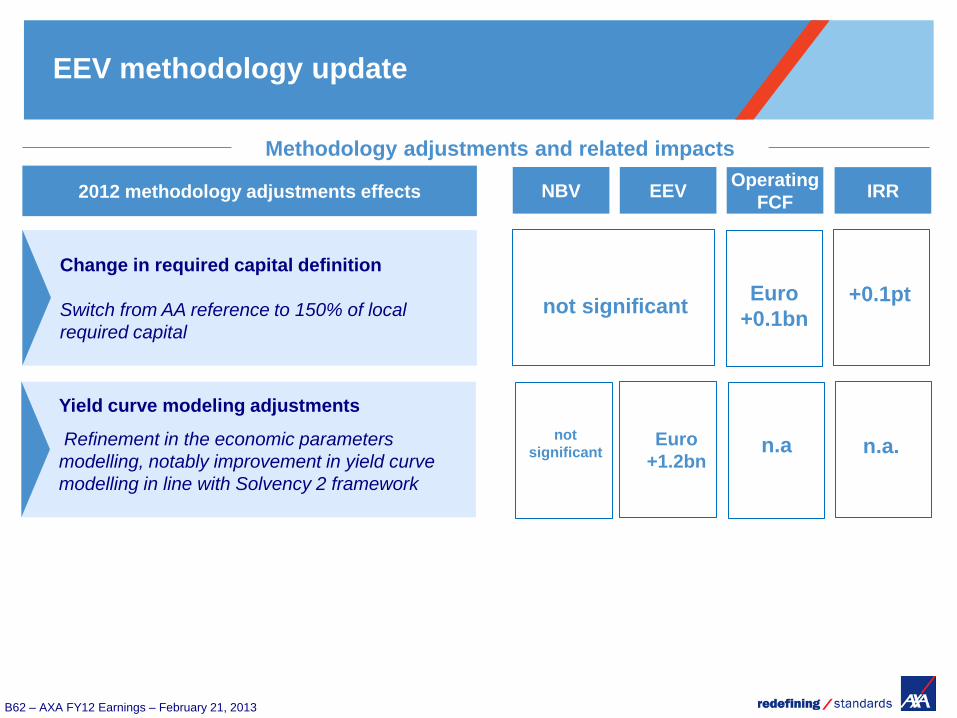
B62 – AXA FY12 Earnings – February 21, 2013
Change in required capital definition
Switch from AA reference to 150% of local
required capital
Yield curve modeling adjustments
Refinement in the economic parameters
modelling, notably improvement in yield curve
modelling in line with Solvency 2 framework
NBV
Methodology adjustments and related impacts
EEV 2012 methodology adjustments effects
EEV methodology update
Operating
FCF IRR
Euro
+1.2bn
Euro
+0.1bn +0.1pt
n.a n.a.
not significant
not
significant

B63 – AXA FY12 Earnings – February 21, 2013
L&S
EV = VIF + ANAV
Required
capital
(included in ANAV)
Opening (FY11) 38.2 17.1 21.1 16.0
Modeling adj., FX
& scope 0.2 1.7 (1.5) (0.6)
Existing business
contribution 3.7 (0.1) 3.8 (0.5)
New business
value 1.9 3.2 (1.3) 0.9
Operational
variances* (0.9) (0.2) (0.7) (0.1)
Economic
variances 1.6 0.9 0.7 0.0
Capital flows and
other (0.5) (0.0) (0.4) (0.0)
Closing (FY12) 44.2 22.6 21.6 15.6
In Euro billion
Life & Savings Embedded Value
2.2
FY12
1.8
FY11**
Life & Savings operating Free Cash Flows
2012 Life & Savings Free Cash Flow
breakdown
-1.3
In-force
capital
release
+0.5
Expected
exiting
business
contribution
3.8
2012 L&S
operating
Free Cash
Flow
2.2
New
business
required
capital
-0.9
New business
strain
*Operational variances include actuarial and tax assumptions, expense and modeling of
participating and adjustable credited rates business
** Not restated for the change in required capital methodology

B64 – AXA FY12 Earnings – February 21, 2013
L&S Embedded Value key sensitivities
Key sensitivities
Impact on L&S
NBV
Impact on L&S
EEV
Euro
million %
Euro
million %
Sensitivity to equity markets
10% increase
+75
+4%
+1,211
+3%
10% decrease -89 -5% -1,271 -3%
Sensitivity to interest rates
Upward 100bps parallel shift
+88
+5%
+2,360
+5%
Downward 100bps parallel shift -237 -12% -5,107 -12%
Sensitivity to volatility
25% increase in volatility on equity markets
-42
-2%
-614
-1%
25% increase in volatility on bonds -99 -5% -981 -2%

B65 – AXA FY12 Earnings – February 21, 2013
L&S – IRR and new business investments
US
Euro million
France
APE
UK
NB IRR1
Japan
New business investments2
MedLA
NORCEE
Total
o/w Germany
o/w Switzerland
o/w Belgium
FY11
APE NB IRR1 New business investments2
FY12
1. New Business Internal Rate of Return
2. New business strain + New business required capital
3. Hong Kong, South-East Asia, India & China
Asia excl. Japan3
1,378 8.9% (595)
1,244 13.2% (288)
535 4.3% (196)
598 11.8% (330)
1,139 10.4% (406)
454 9.5% (130)
374 13.3% (97)
175 8.9% (87)
402 14.4% (118)
871 32.1% (245)
6,170 12.5% (2,177)
1,340 8.7% (592)
1,018 10.7% (291)
535 7.7% (146)
463 11.7% (242)
1,289 8.8% (559)
506 8.3% (236)
397 9.4% (94)
173 7.9% (87)
432 10.6% (182)
656 34.7% (170)
5,733 11.5% (2,182)
B66 – AXA FY12 Earnings – February 21, 2013
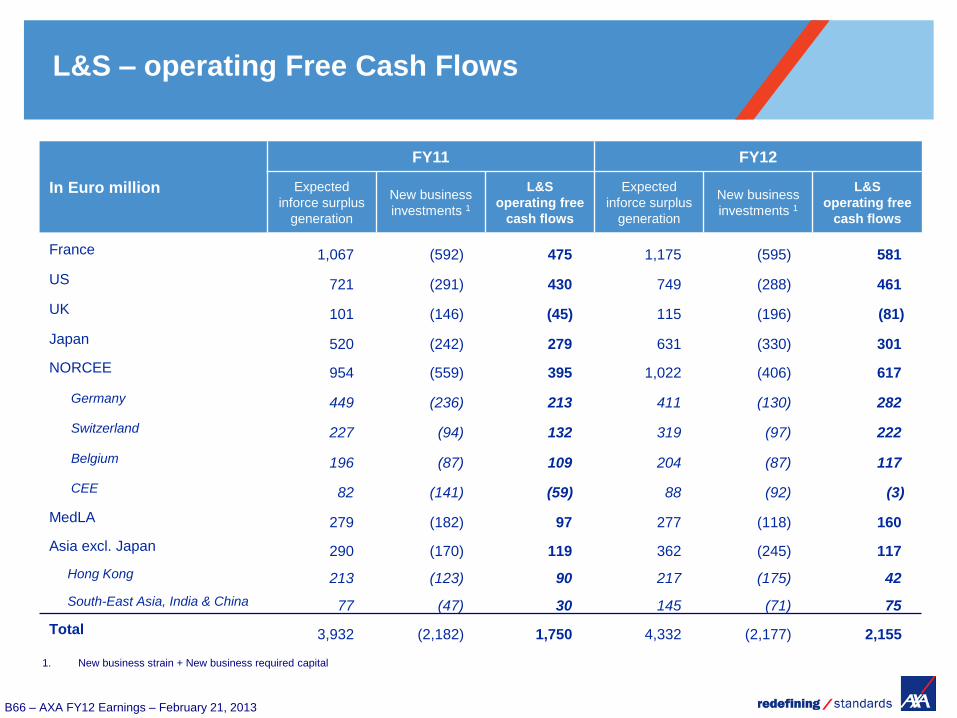
L&S – operating Free Cash Flows
In Euro million
FY11 FY12
Expected
inforce surplus
generation
New business
investments 1
L&S
operating free
cash flows
Expected
inforce surplus
generation
New business
investments 1
L&S
operating free
cash flows
France 1,067 (592) 475 1,175 (595) 581
US 721 (291) 430 749 (288) 461
UK 101 (146) (45) 115 (196) (81)
Japan 520 (242) 279 631 (330) 301
NORCEE 954 (559) 395 1,022 (406) 617
Germany 449 (236) 213 411 (130) 282
Switzerland 227 (94) 132 319 (97) 222
Belgium 196 (87) 109 204 (87) 117
CEE 82 (141) (59) 88 (92) (3)
MedLA 279 (182) 97 277 (118) 160
Asia excl. Japan 290 (170) 119 362 (245) 117
Hong Kong 213 (123) 90 217 (175) 42
South-East Asia, India & China 77 (47) 30 145 (71) 75
Total 3,932 (2,182) 1,750 4,332 (2,177) 2,155
1. New business strain + New business required capital

B67 – AXA FY12 Earnings – February 21, 2013
Life & Savings Free Cash Flows emergence from inforce and new business
Expected undiscounted cash
flows from 2012 inforce
Expected undiscounted cash
flows from 2012 New Business
Euro billion Euro billion
Euro 20 billion undiscounted free cash flows expected to be released from 2012 inforce over 5 years
On top of this, expected free cash flow generation from inforce should be boosted by:
• Actions to improve value of the existing book
• Actions to release more capital from the existing book
Years Years
New business
investments
20
15
10
5
0
31-35 26-30 21-25 16-20 11-15 6-10 1-5
2,0
1,5
1,0
0,5
0,0
-0,5
-1,0
-1,5
-2,0
-2,5 -2.2
2012 1-5 6-10 11-15 16-20 21-25 26-30 31-35