full-season and double-crop soybean response to … · william h. frame wade e. thomason may 20,...
TRANSCRIPT
Full-Season and Double-Crop Soybean Response to Potassium Fertilizer
Anna Elizabeth Stewart
Thesis submitted to the faculty of the Virginia Polytechnic Institute and State University in
partial fulfillment of the requirements for the degree of
Master of Science
In
Crop and Soil Environmental Sciences
David L. Holshouser, Chair
Mark S. Reiter
William H. Frame
Wade E. Thomason
May 20, 2015
Suffolk, Virginia
Keywords: soybean, potassium, double-cropping, wheat
Full–Season and Double-Crop Soybean Response to Potassium Fertilizer
Anna Elizabeth Stewart
ABSTRACT
Demand for potassium (K) increases with increasing soybean yield. Little research has
been conducted on soybean response to K on coastal plain and piedmont soils of Virginia,
especially in double-crop systems. Nineteen full-season and 14 double-crop soybean experiments
were conducted in 2013 and 2014 in Virginia and northeastern North Carolina to determine full-
season and double-crop soybean (with wheat straw remaining or removed) response to soil test K
and K fertilizer application rates. Field moist, air dried, and oven dry soil test K extraction
techniques were also compared to predict responsiveness of sites to K applications. Potassium
fertilizer increased yield in five of 19 full-season experiments and one of 14 double-crop
experiments. Full-season soybean yield plateaued at 88% relative yield and soil test K value of
38.8 mg K kg-1. Full-season plant K critical concentrations were 18.2 g K kg-1 for V5 and 24.6 g
K kg-1 for R2. Although critical concentrations could not be determined for double-crop soybean,
V5 and R2 concentrations ranged from 17.6 to 35.6 g K kg-1 or 13.2 to 28.1 K kg-1
, respectively,
most of which were within or above accepted sufficiency levels. Eight of 13 sites resulted in
greater soil K concentrations when alternative soil drying methods were compared to air-dry
methods. However, differences were not consistent and no single method was superior for these
soils. More data is needed for double-crop soybean systems due to lack of response and lack of
low soil test K sites in these experiments.

iii
Dedication
I would like dedicate this thesis to four of the most important men in my life: my fiancé
Jordan, my Daddy, my Umpa, and my Uncle Phil. You each have a very special place in my
heart and without your constant encouragement and inspiration, I could not have made it.
Thank you for pushing me to finish graduate school and telling me the truth when I needed to
hear it, even when I did not want to. And special thanks to Jordan, for our after midnight talks
when I couldn’t sleep and our early morning talks while I was on the way to my research plots.
I cannot wait for the rest of our lives together!

iv
Acknowledgements
I have been blessed with the opportunity to work with some amazing people throughout
the past two years. Without them, the project could not have continued. Thank you Jordan for
coming into my life at the right time. We have a special relationship built around faith, hope
and love. Thanks for dealing with the longs nights of me writing and being there for me when I
finally decided to take a break. I can’t wait until we say “I Do.” Thank you to my parents,
Charles and Sarah, for the constant support and encouragement. Oh, and thanks for keeping my
precious dog while I spent time in Suffolk! To my brothers, Umpa, and Uncle Phil, thanks for
giving me an ear to listen and encouraging me to keep pursuing my dreams. To my Grandma,
Granny and Serita, thanks for the constant supply of food; whether it be homemade soup,
chicken salad, cake or pies, it was well appreciated on those days I had no time to cook! To my
Raleigh crew, thanks Dr. Dunphy, Dr. Havlin, Dr. Jordan, Lewis Braswell, Bryan Hicks, Matt
Inman, Matthew Vann, NC Crop Improvement Staff, along with many others, for pushing me to
go to graduate school. To my Blacksburg crew, Austin Brown, Emily Ott, Amanda Middleton
and Ben Averitt, thanks for long nights studying or doing stats work as well as the friendship
from each of you. To Mindy Herman, Brittany Manning, Jessica Burgess and Kate Teague,
thanks for the chats, cards and phone calls as well as your support through these few years.
To Bobby and Debbie Ashburn and Billy and Michelle Taylor, thanks for making me feel
like I had family even when mine was four hours away. Bobby, thanks for the encouraging
talks and juice and cookies. And special thanks to you and Miss Debbie for coming to the
rescue when I locked my keys in a building and for our fun dinners at George’s, Amici’s and
Ruby Tuesday. Billy, thanks for putting up with my ‘stubborn, hardheaded…self’ and helping
me realize somehow, just somehow, I would make it through. Thanks to you and Michelle for

v
welcoming me into your home for visits and dinner as well as Friday night church softball
games.
Thank you to both of my major professors, Drs. David Holshouser and Mark Reiter. You
both have helped me so much throughout the past two years and I thank you for your support.
This project was perfect for an aspiring Cooperative Extension Agent due to constant contact
with farmers and other agents. I hope I can utilize my newly obtained skills as I start my career
in Plymouth, NC. Thank you for helping me stay on track and passing your knowledge of
soybeans and soil fertility on to me. And thanks for the many edits while writing. You have
taught me to be more attentive and focused on detail.
To my remaining committee members; Drs Hunter Frame and Wade Thomason, I have
enjoyed time spent with you and have expanded my agronomy experience through your
knowledge and expertise. Dr. Frame, thanks for the encouragement as well as the reminders
that we could make it through things, no matter how hard. Thank you both for your positive
feedback and constructive criticism on my writing and research. It has helped me determine
areas to improve and given insight into how I could make things better.
A special thanks is needed to the dedicated farm managers, Extension agents and
consultants who helped coordinate many tests for me; as well as the farmers who agreed to have
these experiments on their farms. Thank Bobby Ashburn at Tidewater AREC, Tommy Custis at
Eastern Shore AREC and Bob Pitman at Eastern Virginia AREC for answering my questions
when I was not on the farm and spraying my plots when necessary. And Bob, even though my
plot was not on station, thanks for checking on the radio tower for me and getting weather data
when I needed it. Thanks to agents Taylor Clarke, Roy Flanagan, David Moore, Keith
Balderson, Todd Scott, Scott Reiter, Watson Lawrence, Paul Smith and consultant, Tim

vi
Woodward for the constant communication and assistance in monitoring my plots throughout
North Carolina and Virginia.
To the TAREC soybean crew, I still owe you a whole lot of pies and cakes! It was hard
being 6 hours away in class while y’all were sampling and harvesting my plots each fall but
with constant communication, we made it work. Thanks for the many hours on the road and
thanks for grinding over 2000 plant samples and taking more cores of soil than I care to count!
Y’all helped make the long hot days in the field or grinding room a little more bearable and
made me realize I was the one with the accent and not you! Mr. Ed, special thanks to you for
my reality talk that first summer. As you can see, I stuck it out and made it through grad
school, good grades and all! Mike, thanks for your constant support and encouragement as I
learned how to perform research. Kevin, thanks for taking time from your research to help me
with mine. JT, Collin, and Jake, thanks for helping on the countless soil and plant samples as
well as grinding soil and tissue samples. Oh, and Jake, remember this year when taking soil
samples to turn the probe clockwise so you don’t lose any more tips. Nathan, thanks for
enduring long days in field, taking samples in Culpeper in the rain, and sorry for pulling that
awfully cruel joke on you the day of the Luke Bryan concert! Billy, thanks for keeping us
straight in the field and reminding me to take a step back and analyze the situation before
jumping to a conclusion.
To the Eastern Shore AREC crew, thanks John, Kim and Penney for helping with my
thousands of digestions and soil samples. You made it a little easier on me by putting your time
and effort into getting the work done when I couldn’t be present. To the Tidewater AREC
faculty as a whole, thanks to each and every one of you for your support and help throughout
these past two years. If I needed a question answered or had an issue, I always had somebody

vii
to turn to. To Debbie, Carolyn, and Pam, thanks for the help ordering things, mailing, faxing
and being there for me when I needed another woman to talk to. Thanks to the pathology
program for allowing us use lab equipment and lending technical support when sending samples
off. Thanks to Judy Keister, Sabrina Allen, Rachel Saville and Dr. Lee Daniels, in Smyth Hall
in Blacksburg for providing me answers and support on many occasions.
Finally, I would like to thank the Virginia Soybean Board for funding my research from
2013 to 2014. Without your financial support, this project wouldn’t have been possible. I
appreciate the opportunity to represent the Board in my research. Although I will not be
working in Virginia, I look forward to using the knowledge and skills I gained throughout this
experience.
viii
Table of Contents
Abstract .......................................................................................................................................... ii
Dedication ..................................................................................................................................... iii
Acknowledgements ....................................................................................................................... iv
Table of Contents ........................................................................................................................ viii
List of Tables ................................................................................................................................ xi
List of Figures ............................................................................................................................. xiv
Chapter 1. Introduction and Justification ...................................................................................... 1
References .......................................................................................................................... 8
Chapter 2. Full-Season Soybean Response to Potassium on Coastal Plain and Piedmont Soils of
Virginia
Abstract ............................................................................................................................ 11
Introduction ...................................................................................................................... 11
Materials and Methods ..................................................................................................... 15
Results and Discussion .................................................................................................... 18
Soil Testing........................................................................................................... 18
Yield ..................................................................................................................... 18
V5 Tissue Analysis ............................................................................................... 21
R2 Tissue Analysis ............................................................................................... 21
Fertilizer Calibration ........................................................................................... 22
Conclusions ...................................................................................................................... 22
References ........................................................................................................................ 24

ix
Chapter 3. Double-Crop Soybean Response to Potassium on Coastal Plain and Piedmont Soils
of Virginia
Abstract ............................................................................................................................ 39
Introduction ...................................................................................................................... 39
Materials and Methods ..................................................................................................... 43
Results and Discussion ................................................................................................... .47
Soil Testing........................................................................................................... 47
Wheat Straw ......................................................................................................... 48
Soybean Yield ....................................................................................................... 49
V5 Tissue Analysis ............................................................................................... 51
R2 Tissue Analysis ............................................................................................... 51
Fertilizer Calibration ........................................................................................... 52
Conclusions ...................................................................................................................... 52
References ........................................................................................................................ 54
Chapter 4. Comparison of different soil preparations prior to analysis compared to air-dried soil
preparation currently used in Virginia.
Abstract ............................................................................................................................ 69
Introduction ...................................................................................................................... 69
Materials and Methods ..................................................................................................... 72
Results and Discussion .................................................................................................... 73
Statistical Analysis ............................................................................................... 73
Air-dry then oven-dry ........................................................................................... 74
Field moist then oven-dry .................................................................................... 74

x
Variation among methods .................................................................................... 74
Conclusions ...................................................................................................................... 75
References ........................................................................................................................ 76
APPENDIX A. Daily rainfall and temperature of 2013 and 2014 full-season and double-crop
sites in North Carolina and Virginia ........................................................................................... 79
xi
List of Tables
Chapter 2.
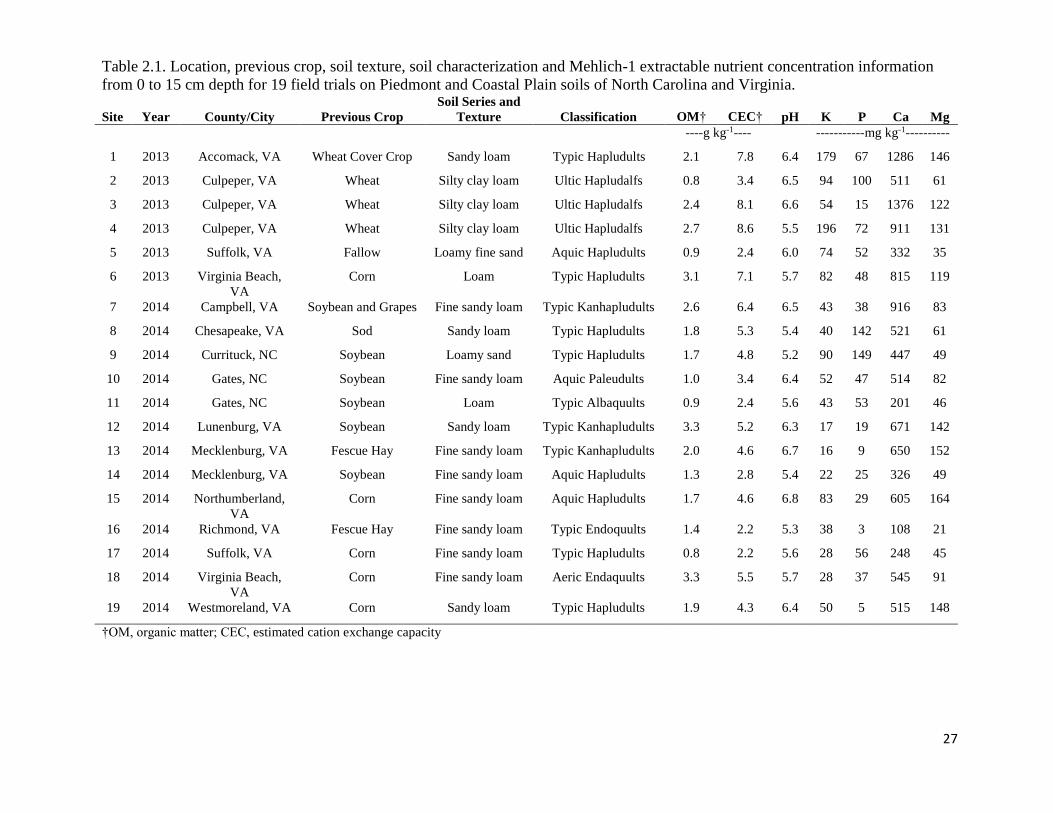
Table 2.1 – Location, previous crop, soil texture, soil characterization and Mehlich-1 extractable
nutrient concentration information from 0 to 15 cm depth for 19 field trials on Piedmont
and Coastal Plain soils of North Carolina and Virginia ................................................... 27
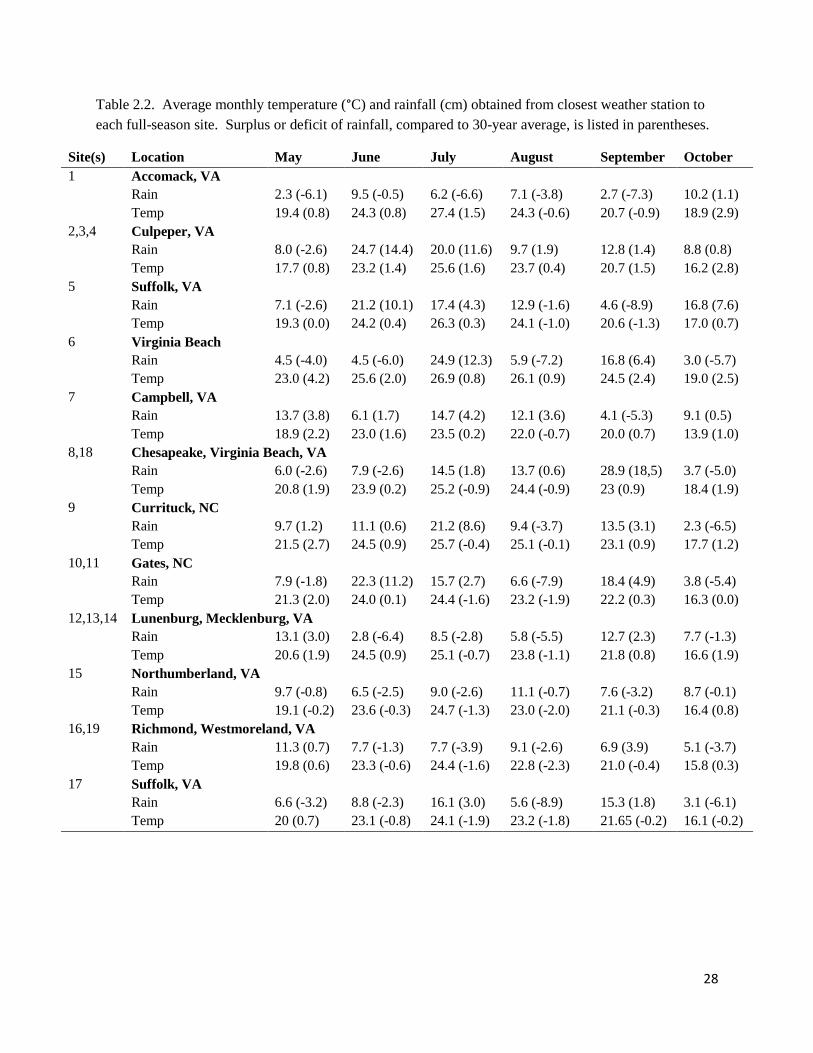
Table 2.2 – Average monthly temperature (°C) and rainfall (cm) obtained from closest weather
station to each full-season site. Surplus or deficit of rainfall, compared to 30-year
average, is listed in parentheses. ...................................................................................... 28
Table 2.3 – Average Mehlich-I extractable K, standard error and estimated CEC at three
sampling depths for 19 sites of full season soybean studies in Piedmont and Coastal Plain
soils of North Carolina and Virginia ................................................................................ 29
Table 2.4 – Full-season soybean actual and relative yields as affected by K fertilizer rate at 19
site years on Coastal Plain and Piedmont soils in North Carolina and Virginia .............. 30
Table 2.5 – Mean actual whole plant K concentration at V5 growth stage of soybean as affected
by K fertilizer rates at 19 sites on Coastal Plain and Piedmont soils in North Carolina and
Virginia. ........................................................................................................................... 31
Table 2.6 – Mean actual trifoliate K concentration at R2 growth stage of soybean as affected by
K fertilizer rates at 19 sites on Coastal Plain and Piedmont soils in North Carolina and
Virginia. ........................................................................................................................... 32
xii
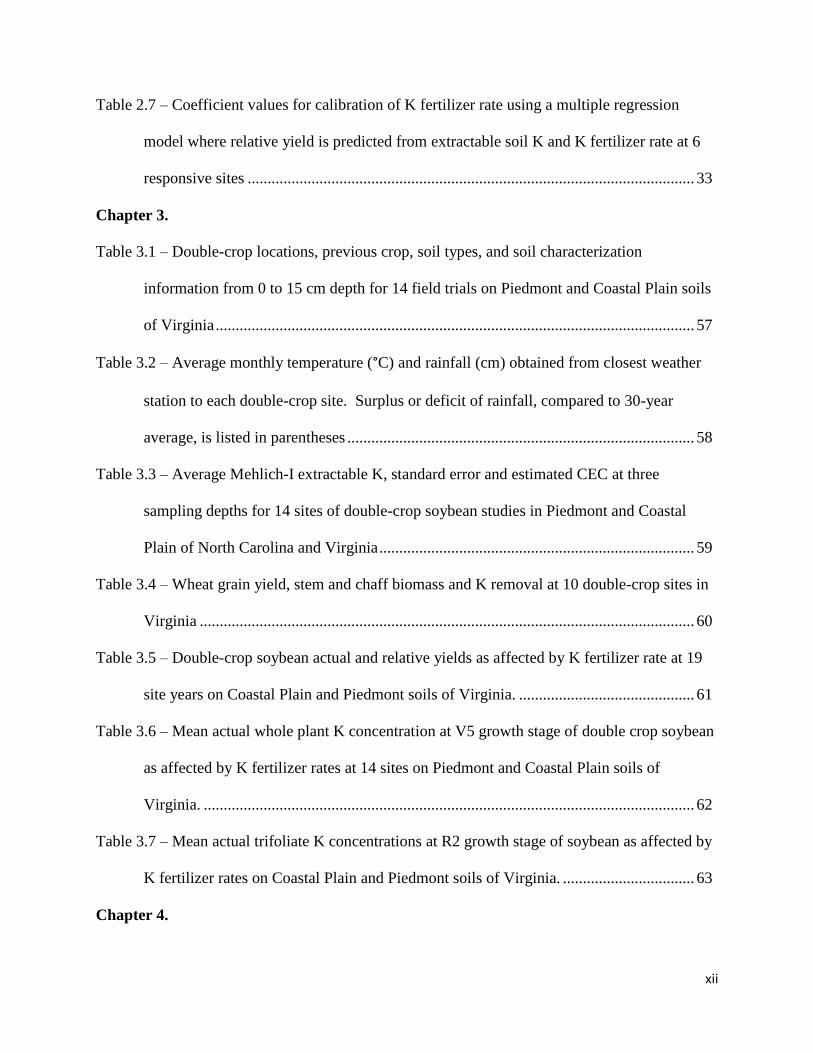
Table 2.7 – Coefficient values for calibration of K fertilizer rate using a multiple regression
model where relative yield is predicted from extractable soil K and K fertilizer rate at 6
responsive sites ................................................................................................................ 33
Chapter 3.
Table 3.1 – Double-crop locations, previous crop, soil types, and soil characterization
information from 0 to 15 cm depth for 14 field trials on Piedmont and Coastal Plain soils
of Virginia ........................................................................................................................ 57
Table 3.2 – Average monthly temperature (°C) and rainfall (cm) obtained from closest weather
station to each double-crop site. Surplus or deficit of rainfall, compared to 30-year
average, is listed in parentheses ....................................................................................... 58
Table 3.3 – Average Mehlich-I extractable K, standard error and estimated CEC at three
sampling depths for 14 sites of double-crop soybean studies in Piedmont and Coastal
Plain of North Carolina and Virginia ............................................................................... 59
Table 3.4 – Wheat grain yield, stem and chaff biomass and K removal at 10 double-crop sites in
Virginia ............................................................................................................................ 60
Table 3.5 – Double-crop soybean actual and relative yields as affected by K fertilizer rate at 19
site years on Coastal Plain and Piedmont soils of Virginia. ............................................ 61
Table 3.6 – Mean actual whole plant K concentration at V5 growth stage of double crop soybean
as affected by K fertilizer rates at 14 sites on Piedmont and Coastal Plain soils of
Virginia. ........................................................................................................................... 62
Table 3.7 – Mean actual trifoliate K concentrations at R2 growth stage of soybean as affected by
K fertilizer rates on Coastal Plain and Piedmont soils of Virginia. ................................. 63
Chapter 4.

xiii
Table 4.1 – Analysis of K fluctuation under four soil drying conditions and analysis using
Mehlich-1-extractant solution. Soil samples were collected in May within 2 weeks of
soybean planting. ............................................................................................................. 77
Table 4.2 – Virginia Tech soil test levels (mg K kg-1) and current fertilizer recommendations for
potassium (K2O) fertilizer ................................................................................................ 78

xiv
List of Figures
Chapter 2.
Fig. 2.1 – Relative soybean yield for each replication regressed against Mehlich-1 extractable
soil K as predicted with a quadratic or linear plateau model. The classification of a site as
responsive (P < 0.10) or non-responsive (P > 0.10) was based on single degree of
freedom contrasts that indicate whether the yield of fertilized plots was different from the
non-fertilized control. ...................................................................................................... 34
Fig. 2.2 – Relative soybean yield averaged across treatments regressed against V5 K
concentration as predicted with a quadratic or linear plateau model. The classification of
a site as responsive (P < 0.10) or non-responsive (P > 0.10) was based on single degree of
freedom contrasts that indicate whether the yield of fertilized plots was different from the
non-fertilized control. ...................................................................................................... 35
Fig. 2.3 – Relative soybean yield regressed against R2 K concentration as predicted with a
quadratic or linear plateau model. The classification of a site as responsive (P < 0.10) or
non-responsive (P > 0.10) was based on single degree of freedom contrasts that indicate
whether the yield of fertilized plots was different from the non-fertilized control. ........ 36
Fig. 2.4 – Calibration of K fertilizer rate (kg ha-1) where minimum K fertilizer rate needed to
maximize yield is compared to the corresponding STK (mg K kg-1) for responsive sites
only. Neither linear nor quadratic responses were significant ........................................ 37
Fig. 2.5 – Calibration of K fertilizer rate using a multiple regression model where relative yield is
predicted from extractable soil K and K fertilizer rate. Coefficient values for the
regression model are listed in Table 2.7. ......................................................................... 38

xv
Chapter 3.
Fig. 3.1 – Wheat K removal of K2O in straw and chaff based on STK level. The classification
of a site as responsive (P < 0.10) and non-responsive sites (P > 0.10) was based on single
degree of freedom contrasts that indicate whether yield of fertilized plots was different
than that of non-fertilized control. ................................................................................... 64
Fig. 3.2 – Soybean yield response to potassium application rate as predicted with a quadratic
model at P < 0.001 for sites 11 (a) and 12 (b).................................................................. 65
Fig. 3.3 – Relative soybean yield of straw remaining (a) or removed (b) for each replication
regressed against Mehlich-1 extractable soil K as predicted with a quadratic model.
Nonlinear regression was not significant for either data set. The classification of a site as
responsive (P < 0.10) and non-responsive sites (P > 0.10) was based on single degree of
freedom contrasts that indicate whether the yield of fertilized plots was different from the
non-fertilized control ....................................................................................................... 66
Fig. 3.4 – Relative soybean yield of straw remaining (a) or removed (b) for each replication
averaged across treatments versus V5 K. Neither quadratic, linear nor nonlinear models
were significant. The classification of a site as responsive (P < 0.10) and non-responsive
sites (P > 0.10) was based on single degree of freedom contrasts that indicate whether the
V5 concentration of fertilized plots was different from the non-fertilized control. ......... 67
Fig. 3.5 – Relative soybean yield of straw remaining (a) or removed (b) for each replication
versus R2 K. Neither quadratic, linear nor nonlinear models were significant. The
classification of a site as responsive (P < 0.10) and non-responsive sites (P > 0.10) was
determined from single degree of freedom contrasts that indicate whether the R2
concentration of fertilized plots was different from the non-fertilized control. .............. 68
xvi
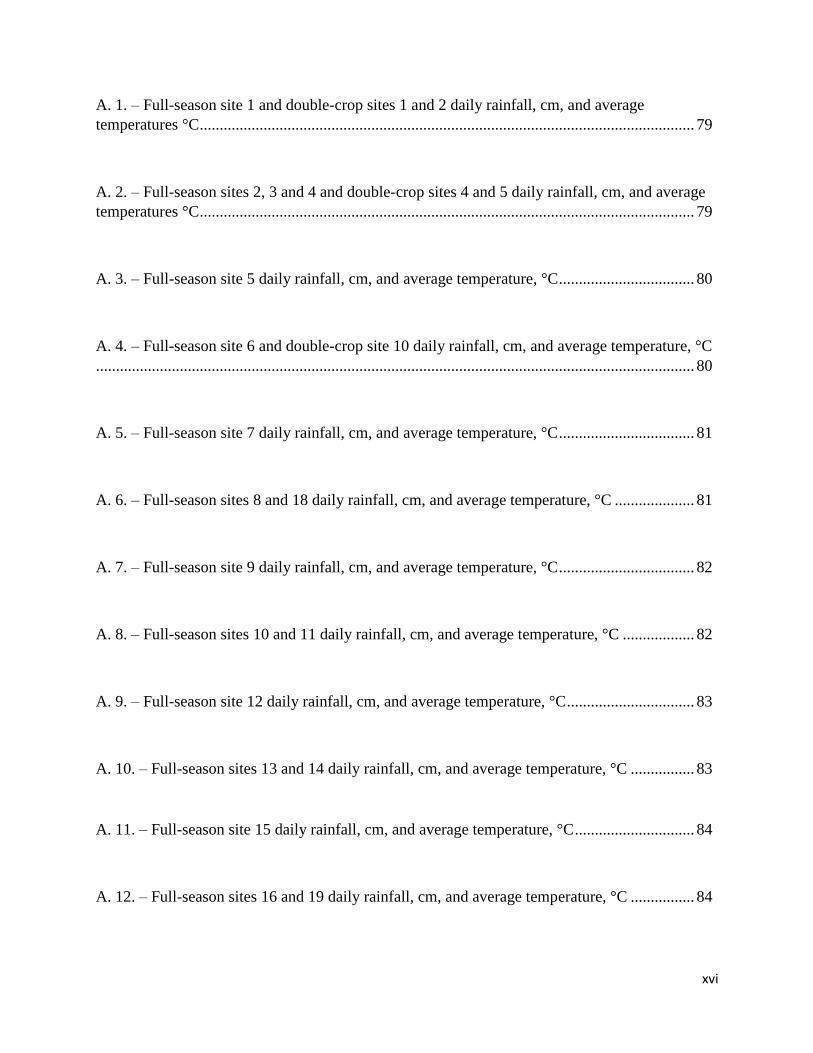
A. 1. – Full-season site 1 and double-crop sites 1 and 2 daily rainfall, cm, and average
temperatures °C ............................................................................................................................ 79
A. 2. – Full-season sites 2, 3 and 4 and double-crop sites 4 and 5 daily rainfall, cm, and average
temperatures °C ............................................................................................................................ 79
A. 3. – Full-season site 5 daily rainfall, cm, and average temperature, °C .................................. 80
A. 4. – Full-season site 6 and double-crop site 10 daily rainfall, cm, and average temperature, °C
...................................................................................................................................................... 80
A. 5. – Full-season site 7 daily rainfall, cm, and average temperature, °C .................................. 81
A. 6. – Full-season sites 8 and 18 daily rainfall, cm, and average temperature, °C .................... 81
A. 7. – Full-season site 9 daily rainfall, cm, and average temperature, °C .................................. 82
A. 8. – Full-season sites 10 and 11 daily rainfall, cm, and average temperature, °C .................. 82
A. 9. – Full-season site 12 daily rainfall, cm, and average temperature, °C ................................ 83
A. 10. – Full-season sites 13 and 14 daily rainfall, cm, and average temperature, °C ................ 83
A. 11. – Full-season site 15 daily rainfall, cm, and average temperature, °C .............................. 84
A. 12. – Full-season sites 16 and 19 daily rainfall, cm, and average temperature, °C ................ 84

xvii
A. 13. – Full-season site 17 and double-crop sites 13 and 14 daily rainfall, cm, and average
temperature, °C ............................................................................................................................ 85
A. 14. – Double-crop sites 3, 6, and 7 daily rainfall, cm, and average temperature, °C............. 85
A. 15. – Double-crop sites 8 and 9 daily rainfall, cm, and average temperature, °C................... 86
A. 16. – Double-crop sites 11 and 12 daily rainfall, cm, and average temperature, °C .............. 86

1
Chapter 1 – Introduction and Justification
Soybean [Glycine max (L.) Merr.] production systems in the Mid-Atlantic, U.S.A.
include full-season (April or May planted) or double-crop (June or July planted; following small
grain harvest). Double-crop systems are often more profitable on a hectare basis than
monoculture soybean systems because they allow two crops to be grown and harvested in a
single year (Farno et al., 2002). Farmers in the Mid-Atlantic harvested 1,314,419 hectares of
soybean in 2013, 42% of which were double-crop (NASS, 2015). Five-year average yield for
full-season and double-crop soybean in the Mid-Atlantic was 2,620 kg ha-1, compared to a five-
year average yield of 1,400 kg ha-1 in 1965 and an average of 112,859 hectares of soybean
harvested from 1961 to 1965. Soybean production and yield have nearly doubled in the past 50
years and current Virginia Cooperative Extension recommendations for potassium (K) fertilizer
may also need to be increased for soybean in order to keep up with increased yield and increased
nutrient demand.
With the double-crop system, straw remaining from small grain harvest may be left on
the field or harvested for additional uses. Wheat straw provides ground cover that can hold
topsoil in place and limits runoff of soil, chemicals and fertilizer to surface water. In addition,
straw left on the ground can be decomposed into soil organic material and release nutrients to the
succeeding soybean crop. However, some farmers remove the straw after the small grain is
harvested, and thereby remove nutrients that would have been returned to the soil. The
contribution of wheat straw to soil organic matter and nutrient content and the effects of straw
harvest and retention have on soybean yield is unclear and needs further study.
Potassium is a vital soil nutrient for soybean and required in the second greatest amount,
following nitrogen. Being a structural component of soil minerals, K is not always in a plant

2
available form. Potassium is present in the mineral form (90-98 % soil K), slowly available form
(1-10 % soil K) and exchangeable and solution form (0.1-2 % soil K). Therefore, regular K
fertilization is necessary to prevent nutrient deficiencies in the soil because soils are often unable
to supply the K necessary for high yielding crops. Still, there is a continuous cycle of K from
primary materials to slowly available and exchangeable forms (Havlin et al., 2005). Over time,
unharvested plant residue can degrade and return nutrients to the soil. Soil nutrient levels will
increase if nutrient applications exceed the crop removal.
Potassium fertilizer is typically applied as a broadcast granular blend using muriate of
potash. In some cases, it is applied in a band near the seed. Buah et al. (2000) found that surface
broadcast K fertilization is equal or superior to subsurface band placement. Surface fertilizer
application is therefore a method of preference. Varied responses to broadcast fertilizer were
observed based on initial soil K concentration. Soils with lower K concentration had greater
increase of K concentration after broadcast application whereas medium and high K testing soils
were had little to no increase in soil K concentration (Yin and Vyn, 2003).
Soil testing is an important aspect of plant nutrient management and can help determine
soil K levels. However, Yin and Vyn (2003), Fernandez et al., (2008) and Evanylo (1991)
sampled soil K at multiple layers and found that soil in the surface 0-5 cm has significantly
greater K concentration than that at 10-20 cm. Soybean roots can reach depths greater than the
average sampling depth (0 to 15 cm) for row crops and it may be necessary to determine the
concentration of K throughout the whole root region in order to know the total exchangeable K
available for plant uptake.
Attoe and Truog (1946), showed the relation of K fertilizer needed to the remaining
amount exchangeable K is log Y = k log X + c, where Y is amount exchangeable K, X is
3
application rate, and k and c are constants determined by extent of fixation. However, research
performed by Iowa State University during the 1960s and 1970s found that testing field-moist
(not dried) soil samples gave a better estimate of K. Drying soils increased K concentrations,
leading to lower than necessary K fertilizer recommendations (Mallarino, 2012). Grava et al
(1961) determined that both air and oven dry samples have increased exchangeable K compared
to field moist samples. When K fertilizer was applied at rates of 0, 269 and 538 kg K2O ha-1,
average exchangeable K content were 36.5, 31.0 and 14.2 g K kg-1greater than field moist soils,
respectively, after air drying and 55.1, 42.9 and 23.7 g K kg-1greater than field moist soils,
respectively, after oven drying than. Low K testing soils will generally lead to a greater
difference between field moist and dry soil analysis (Grava et al., 1961).
Potassium is one of the most abundant cations in plants and is associated with many
physiological processes supporting growth and development (Fagaria, 2009; Havlin et al., 2004;
Shingles and McCarty, 1994; Talbott et al., 1998; Tiwari, 2001). Potassium is mainly found in
the cytoplasm and cell vacuole where K regulates stomatal functions, activates enzymes, and
maintains osmotic balance. Potassium also plays a vital role in photosynthesis and supports sink
tissues and transport of nutrients throughout the plant. Potassium ions aid photosynthesis by
maintaining charge balance at the site of ATP production. Potassium deficient plants have a
reduced rate of ATP production, which leads to increased respiration and slower growth and
development (Fagaria, 2009; Havlin et al., 2004). Lower available K levels can lead to a
reduction in the number of leaves produced as well as a reduction in the size of the leaves and
the amount of canopy closure. Reduced leaf area causes less sunlight interception; which leads
to reduced photosynthetic activity and an overall yield reduction (Tiwari, 2001). However,

4
canopy closure and reduction of sunlight interception is dependent upon row spacing of soybean
plants.
In addition to photosynthesis, inadequate K can reduce plant protein metabolism.
Potassium has a beneficial effect on symbiotic N2 fixation by affecting the number, fresh weight,
and size of nodules or by affecting the amount of nitrogen fixed per unit time and mass of the
nodule (Munson, 1985; Fagaria, 2009). The authors also stated that soybean plants that are well
supplied with K produce more dry matter and are capable of accumulating more nitrogen.
Soybean plants that receive sufficient K are able to synthesize more carbohydrates and
eventually accumulate more N. Potassium deficient soybeans are also susceptible to pod and
stem blight caused by [Diaporthesojae L.] Higher rates of K may decrease disease incidence in
some crops. Potassium deficiency symptoms in soybeans include chlorosis and necrosis of leaf
edges. Because K is mobile, deficiency symptoms first appear in lower leaves and move toward
the top of the plant (Munson, 1985; Fagaria, 2009).
In Arkansas, a study consisting of 34 site-years was conducted on silt loam soils that
ranged from 46 to 167 mg Mehlich-3 extractable K kg-1 (Slaton et al., 2010). Soybean
responded positively to K applications (applied at 0 to 148 kg K ha-1) to all sites where Mehlich-
3-extractable K was less than 91 mg K kg-1 and nine of 15 sites where extractable K ranged from
91 to 130 K kg-1. According to a study by Clover and Mallarino (2012) in Iowa, potassium
fertilization increased soybean yields when applied at 71 to 117 kg K ha-1 at four of ten sites. On
average, soybean responded linearly to K rate up to 103 kg K ha-1. Soybean also responded to K
applied to corn in the previous growing season at 3 of 10 sites, where the linear yield response
continued up to 168 kg K ha-1, which was the greatest K rate used.

5
An Ontario study comparing three fertilizer placement methods, two conservation tillage
systems, and two soybean row widths found that critical leaf K concentration for maximum seed
yield of conservation-till soybean was determined to be approximately 24.3 g kg-1 (Yin and Vyn,
2004). Clover and Mallarino (2012) determined that critical leaf K concentration for soybean
was 17.6 to 20.0 g K kg-1 for maximum yield. In comparison, current Virginia Cooperative
Extension recommendations suggests a leaf K sufficiency range between 17.5 and 25 g K kg-1
(Donahue, 2000)
Plant tissue sampling during the growing season may be used to determine at which
periods of growth and development nutrients are utilized. It can also be used to diagnose in-
season nutrient deficiencies. Potassium applications of 100 kg K ha-1, applied as potassium
chloride, KCl, increased soybean leaf K concentrations by 5.1 to 8.0 g kg-1 (Yin and Vyn, 2004).
Coale and Grove (1991) determined K content using atomic absorption spectrometry of whole
soybean plants at R1 (first flower), R5 (0.3 cm seed in top four nodes), and R7 (one mature pod
on the plant) (Fehr and Caviness, 1971). Total accumulation of potassium under high K fertility
(88+ mg K kg-1) was increased by 87, 144, and 125 % at R1, R5, and R7, respectively. Total dry
matter was not affected by K fertility and it is thought that total K accumulation was due to
differences in K tissue concentration.
Potassium concentration can also affect the seed components, including oil, protein and
starch. Seed composition can be affected by fertilizer rates, which ultimately affect germination
and vigor. Yin and Vyn (2003) determined that seed K concentration levels increased from 1.3
to 2.7 g kg-1 with K fertilizer application. The data suggested that higher seed K concentrations
might have significant influence on other seed attributes since K is widely involved in plant
metabolic activities as an enzyme activator.

6
The 4R’s of plant nutrition, developed by the International Plant Nutrition Institute,
represent a holistic approach to fertilizer management practices. The 4R’s include: right source,
right rate, right time, and right place (IFA Task Force, 2009). The framework shows how
achieving social, economic, and environmental goals can be managed by proper fertilization. It
is important to utilize the 4R’s when making recommendations for fertilizer. Right source
represents correct rates of fertilizer and balanced nutrient management plans. Right rate of
fertilizer can be ensured by soil testing, understanding crop nutrient removal, and plant tissue
analysis. Right time and right place ensure crop nutrient uptake is optimal and plant injury is
limited. It is important to apply site-specific rates of K based on changes in K levels between or
within fields; therefore, enhancing productivity and environmental quality on the farm,
landscape, and ecosystem. Proper rate of application prevents excess buildup of nutrients as well
as less runoff of fertilizer into water systems which help enhance environmental quality.
The importance of potassium in soybean fertilization is made obvious by previous research
results. Potassium fertilization of soybean increased K content in the plant and improved
metabolic and photosynthetic processes. Although there has been significant research performed
in Iowa, Arkansas, and the Mid-West, research applicable to the Mid-Atlantic is lacking.
Research pertinent to the Mid-Atlantic region would influence whether or not current K fertilizer
recommendations for full-season and double-crop soybeans need adjustment. The objective of
this study was to determine full-season yield response to soil test K and K fertilizer application
rates on Coastal Plain and Piedmont soils of Virginia and northeast North Carolina.

7
Objectives
1. Determine full-season and double-crop soybean (with straw remaining or removed) response
to soil test K and K fertilizer rates on Coastal Plain and Piedmont soils of Virginia and North
Carolina.
Specifically:
a. Correlate relative yield, V5-stage plant K concentration, and R2-stage trifoliate leaf K
concentration with Mehlich-1 extractable soil K.
b. Establish critical tissue K concentrations for V5 and R2-stage soybean.
c. Quantify the K fertilizer rates required to maximize soybean yield at various soil test K
levels.
2. Determine if moist soil analysis provides better relationship with soil test K levels when
compared to air and oven-dry soil analysis.
8
References
Attoe, O.J. and E. Troug. 1946. Exchangeable and acid-soluble potassium as regards to
availability and reciprocal relationships. Soil Sci. Soc. Amer. Proc. 10:81-81.
Buah, S. J., T.A. Polito and R. Killorn. 2000. No-tillage soybean response to banded and
broadcast and direct and residual fertilizer phosphorus and potassium
applications. Agron.J. 92:657-662.
Coale, F.J. and J.H. Grove. 1991. Potassium utilization by no-till full-season and double-crop
soybean. Agron.J. 83:190-194.
Clover, M.W. and A.P. Mallarino. 2012. Corn and soybean tissue potassium content responses
to potassium fertilization and relationships with grain yield. Soil Sci. Soc. Am. J. 77:630-
642.
Donohue, S.J. 2000. Soil testing and plant analysis. In D.E. Brann, D.L. Holshouser, and G.L.
Mullins, editors, Agronomy Handbook. Virginia Cooperative Ext. publ. 424-100,
Blacksburg, VA. pp. 75-86.
Evanylo, G.K. 1991. Potassium fertilization of doublecropped wheat and soybean under two
tillage systems. J. Prod. Agric. 4:55-562.
Fageria, N.K. 2009. Potassium. In: N.K. Faeria, editor, The use of nutrients in crop plants.
CRC Press, Boca Raton, FL. pp. 121-164.
Farno, L.A., L.H. Edwards, K. Keim, and F.M. Epplin. 2002. Economic analysis of soybean-
wheat cropping systems. Online Crop Management Doi: 10.1094/CM-2002-0816-01-RS.
Fehr, W.R. and C.E. Caviness. 1977. Stages of soybean development. Spec. Rep. 80. Iowa
Agric. Home Econ. Exp. Stn., Iowa State Univ., Ames, IA.

9
Fernandez, F. G., Brouder, S.M, Beyrouty, C.A., Volenec and J.J. Hoyum, R.2008. Assessment
of plant-available potassium for no-till, rain fed soybean. Soil Sci. Soc. Am. J. 72:1085-
1095.
Grava, J., G.E. Spalding and A.C. Caldwell. 1961. Effect of drying upon the amounts of easily
extractable potassium and phosphorus in nicollet clay loam. Ag. J. 53:4.
Havlin, J. L., J.D. Beaton, S.L. Tisdale and W.L. Nelson. 2004. Potassium soil fertility and
fertilizers: an introduction to nutrient management. Upper Saddle River, NJ: Pearson,
Prentince Hall, 2005. 199-218.
Mallarino, A.P. 2012. The moist soil test for potassium and other nutrients: what's it all
about? Iowa State University Extension. Integrated Crop Management News.
Munson, Robert D. editor. 1985. Potassium in agriculture. ASA, CSA, SSA. Madison,
Wisconsin.
National Agricultural Statistics Service. 2012. Acreage. USDA, NASS. 15-16.
Shingles, R. and R.E. McCarty. 1994. Direct measure of ATP-dependent proton concentration
changes and characterization of a K+ -stimulated ATPase in pea chloroplast inner
envelope vesicles. Plant Physiol. 106:731-737.
Slaton, N. A., B.R. Golden, R.E. DeLong and M. Mozaffari. 2010. Correlation and calibration of
soil potassium availability with soybean yield and trifoliate potassium. Soil Sci. Soc. Am.
J. 74:1642-1651.
Talbott, L.D., S.M. Assmann and E. Zeiger. 1998. Potassium and sucrose in guard cell
osmoregulation. In: D.C. Oosterhuis and G.A. Berkowitz, editors, Fronteirs in Potassium
Nutrition: New Perspectives on the Effects of Potassium on Physiology of Plants. Potash

10
and Phosphate Institute, Norcross, GA; and Potash and Phosphate Institute of Canada,
Saskatoon, Canada pp 53-62.
Tiwari, S.P., O.P. Joshi, A.K. Vyas, and S.D. Billore. 2001. Potassium nutrition in yield and
quality improvement of soybean. 307-320 www.ipipotash.org
Yin, X. and T.J. Vyn. 2003. Potassium placement effects on yield and seed composition of no-till
soybean seeded in alternate row widths. Agron. J. 95:126-132.
Yin, X. and T.J. Vyn.2004. Critical leaf potassium concentrations for yield and seed quality of
conservation-till soybean. Soil Sci. Soc. Am. J. 6:1626-1634.
11
Chapter 2 – Full-Season Soybean Response to Potassium on Coastal Plain and Piedmont
Soils of Virginia
ABSTRACT
Adequate potassium (K) nutrition is vital to high-yielding soybean [Glycine max (L.)
Merr.] on Piedmont and Coastal Plain soils of the Mid-Atlantic region of the U.S.A., but fertility
recommendations are dated and may need revising to match demand of current high-yielding
soybean systems. Nineteen full-season soybean experiments were conducted during 2013 and
2014 in Virginia and northeastern North Carolina to correlate relative yield, V5-stage plant K
concentration, and R2-stage trifoliate leaf K concentration with Mehlich-1 extractable soil K;
establish critical tissue K concentrations for V5 and R2-stage soybean; and determine K fertilizer
rate for maximum yield. Initial soil samples were taken prior to broadcasting across each
replication. Potassium application rates were 0, 28, 56, 112, 168 and 224 kg K2O ha-1 within two
weeks of planting. Mehlich-1 extractable soil K ranged from 16 to 196 mg K kg-1. Relative
soybean yield of control plots ranged from 20 to 95%. Potassium application increased soybean
yield at five sites with soil test K levels less than 40 mg K kg-1. Yield declined with increasing K
rate at one site. Critical soil test K was 38.8 mg K kg-1 with a relative yield of 88% at all sites.
Critical V5 concentration was 18.2 g K kg-1 and critical R2 concentration was 24.6 g K kg-1.
These data indicated that current Virginia extension K fertilizer recommendations for soybean
are sufficient under the environmental conditions experienced in this study.
Introduction
Potassium (K) is the one of the most important nutrients for high-yielding soybean
[Glycine max (L.) Merr.]. Except for nitrogen, soybean requires more K than any other nutrient
and affects plant water relations, enzyme activation, and photosynthetic processes (Fagaria,

12
2009, Havlin et al., 2004, Shingles and McCarty, 1994, Talbott et al., 1998, Tiwari, 2001). Soil
K is not always in plant available form and regular fertilization is necessary to provide nutrients
for crop uptake (Havlin et al., 2004). Current K fertilizer recommendations in the Mid-Atlantic
U.S.A. are dated and may be inadequate to supply the fertilizer demand of higher yielding
soybean. In 2013, farmers in the region harvested 1,314,419 hectares of soybean with a five-
year average yield of 2,620 kg ha-1 (NASS, 2015). There has been little K research conducted
with soybean in the Mid-Atlantic region, which is dominated by low cation exchange capacity
(CEC) and low water-holding-capacity soils. The most recent research was conducted by
Heckman and Kamprath (1995) on sandy loam and loamy sand soils in Clayton, NC, similar to
soils found in the coastal plain of Virginia. In contrast, K research in soybean was recently
performed by Slaton et al. (2010) in Arkansas and Clover and Mallarino (2012) in Iowa. In both
studies, broadcast K fertilizer was necessary to increase plant K concentration as well as grain
yield. Soil testing prior to fertilizer application and tissue testing at V5 and R2 was used to
determine soil nutrient levels and plant K concentration at critical growth stages.
Potassium fertilizer application is necessary in nutrient limited soils to improve plant
metabolic processes and increase soybean grain yield (Munson, 1985; Clover and Mallarino,
2012). In Arkansas, a study containing 34 site-years was conducted on silt loam soils containing
46 to 167 mg K kg-1 (Slaton et al., 2010). Soybean responded positively to K applications
(applied at 0 to 148 kg K ha-1) at all sites where Mehlich-3-extractable K was less than 91 mg K
kg-1 and nine of 15 sites where extractable K ranged from 91 to 130 mg K kg-1. In an Iowa
study, K fertilization increased soybean yields when applied at rates of 71 to 117 kg K ha-1 at
four of ten sites. On average, soybean yield responded linearly to K fertilizer application rates
up to 103 kg K ha-1. Soybean also responded to K applied to corn [Zea mays (L.) Merr.] in the
13
previous growing season at three of 10 sites, where the linear yield response continued up to 168
kg K ha-1, which was the maximum K fertilizer rate used (Clover and Mallarino, 2012).
Although the Arkansas and Iowa research found relationships between soil test levels and
response of soybean to K fertilization rate, soil types in those studies differ greatly than those
found in the Mid-Atlantic region.
While soil testing is an important aspect of plant nutrient management and can help
determine soil K levels, sampling only from the surface of a soil may result in erroneous K
fertilizer recommendations. Yin and Vyn (2003) and Fernandez et al. (2008) sampled soil K at
multiple horizon depths and found that soil in the surface 0 to 5 cm has significantly greater K
concentration than that at 10 to 20 cm. In contrast, Evanylo (1991) suggested that leaching and
accumulation of K at depths greater than 46 cm were responsible for the lack of response of no-
till double-crop soybean to K fertilization. In that research, a Bojac loamy sand contained 96 (H-
), 118 (H), or 106 (H) mg K ha-1 at 0 to 15, 15 to 30 and 30 to 46 cm depths, concentrations that
should have occasionally resulted in a yield response. The author further suggested that the rate
of K fertilizer should be adjusted with the amount of K found in the argillic horizon (subsurface
horizon with significantly higher percentage of phyllosilicate clay than the overlaying soil
material), the depth of which can vary greatly in coastal plain soils (Schaetzl and Anderson,
2005). Soybean roots can reach depths greater than the average sampling depth (0 to 15 cm for
row crops) and it may be necessary to determine the concentration of K throughout the entire
rooting zone in order to account for the total exchangeable K available for plant uptake. This is
especially important in low CEC coastal plain and piedmont soils that are subject to leaching.
Tissue sampling can be a good indicator of nutrient status in plants. An Ontario study
comparing three fertilizer placement methods, two conservation tillage systems, and two soybean

14
row widths found that critical leaf K concentration at growth stage R1 (beginning bloom) (Fehr
and Caviness, 1971) for maximum seed yield was approximately 24.3 g kg-1 (Yin and Vyn,
2004). In that study, K was applied at 100 kg K ha-1 as muriate of potash (KCl) and increased
soybean leaf K concentrations by 5.1 to 8.0 g kg-1 (Yin and Vyn, 2003). In comparison, Clover
and Mallarino (2012) determined that critical leaf K concentration for soybean at R1 was 17.6 to
20.0 g K kg-1 for maximum yield. Coale and Grove (1991) determined K content using atomic
absorption spectrometry of whole soybean plants at R1. Total accumulation of K under high K
fertility (88+ mg K kg-1 soil) was increased by 87 % at that soybean stage. Total dry matter was
not affected by K fertility; therefore, total K accumulation was due to differences in K tissue
concentration.
Seed composition may also be affected by fertilizer rates, which can affect germination
and vigor. Yin and Vyn (2003) determined that seed K concentrations increased from 1.3 to 2.7
g kg-1 with K fertilizer applications. However, yield was not responsive in that study. Seed K
concentrations might have significant influence on other seed attributes since K is widely
involved in plant metabolic activities as an enzyme activator (Munson, 1985).
Results from previous research showed the importance of K in a soybean fertilization
program. Potassium fertilization increased K content in the plant, improved metabolic processes,
and in some cases increased yield (Clover and Mallarino, 2012, Coale and Grove, 1991, Yin and
Vyn (2003). However, research is needed in coastal plain and piedmont soils to obtain data
applicable to the Mid-Atlantic growing region. Results from this research can then be used to
determine if K fertilizer recommendations in Virginia are adequate or are in need of revision. It
is our hypothesis that following current Virginia K fertilizer recommendations will result in little
to no deficiency or yield loss. We also hypothesize that yield will be maximized at soil K levels

15
between 38 to 88 mg K kg-1 (medium soil test K category) and that plant tissue K sufficiency
range will be between 17.5 and 25 g kg-1, according to current Virginia recommendations
(Donohue, 2001). The objective of this study was to determine full-season response to soil test
K (STK) and K fertilization rates on Coastal Plain or Piedmont soils of Virginia and northeast
North Carolina. Specifically, we will: 1) Correlate relative yield, V5-stage plant K
concentration, and R2-stage trifoliate leaf K concentration with Mehlich-1 extractable soil K; 2)
Establish critical tissue K concentrations for V5 and R2-stage soybean; and 3) calibrate K
fertilization rate for maximum yield.
Materials and Methods
Nineteen field trials were conducted on soils representative of the Piedmont and Coastal
Plain regions of Virginia and the northeastern Coastal Plain of North Carolina during 2013 and
2014 (Table 2.1). Maturity group IV or V soybeans were planted in conventional or no-till full-
season systems (May-planted) with farmer owned or small plot equipment in 19- or 38-cm rows.
Most test sites followed a two- or three-year crop rotation and previous crops included corn,
soybean, or wheat [Triticum aestivum (L) Merr.]. Site seven in Campbell County was taken out
of grape [Vitis vinifera. (L.) Merr.] production in 2013 and planted in soybean in 2014. There
were also a few sites that were either previously fallowed or sown to grass sod or fescue
[Festuca arundinacea. (L.) Merr.] hay crops (Table 2.1). In general, cultural practices and pest
management followed North Carolina or Virginia Cooperative Extension recommendations. All
sites were dry land and rainfall was near or above the 30-year average for most months in most
locations in 2013 and near average in 2014 (Table 2.2).
Within two weeks of soybean planting and before fertilizer was applied, four composite
soil samples per experiment (1 per replicate) consisting of 12 cores were collected at depths of 0
16
to 15, 15 to 30, or 30 to 60 cm within each replication. Soil samples were air-dried, ground, and
sent to Virginia Tech soil testing laboratory for analysis using Mehlich I extraction procedures,
which is the routine method used at that laboratory. Five grams of sieved, air-dried soil were
placed into a 150 mL extraction flask, then 25 mL of Mehlich I extracting solution (0.05 M
H2SO4 + 0.05 M HCl) was added and shook for 5 minutes on a reciprocating shaker set at 180
opm. The sample was filtered through a Whatman no. 2 filter paper and analyzed using
inductively coupled plasma spectrometry (Helmke and Sparks, 1996). Table 2.3 lists average
soil test K, estimated CEC and standard error for each site at the three sampling depths.
Each experiment was designed as a randomized complete block with four replications.
Individual plot size was 3.8 m wide and 14.6 m long. After soil was sampled, K fertilizer was
broadcast by hand on the surface of the soil (not incorporated) at 0, 28, 56, 112, 168, or 224 kg K
ha-1 using granular muriate of potash (0-0-60). To ensure that other nutrients were non-limiting,
fertilizer containing only those limiting nutrients was applied at the same time if needed and
plants were monitored for deficiency symptoms other than K throughout the growing season.
To determine K concentration in the plant, tissue samples were taken at V5 (5th trifoliate)
and R2 (full bloom), (Fehr and Caviness, 1977). At V5, samples consisted of 10 plants cut at
ground level at random locations from each plot in 2013 and 1 m of row of whole plants cut at
ground level from each plot in 2014. Twenty uppermost, fully developed soybean trifoliate
leaves were randomly collected at the R2 stage from each plot in 2013 and 2014. Plant tissue for
all V5 plants and R2 leaves were dried at 60° C and then ground using a Wiley Mill grinder with
a 0.5 mm screen. Samples were then digested using nitric acid and hydrogen peroxide (EPA
3050 B) and then analyzed at Virginia Tech soil testing laboratory using inductively coupled
atomic plasma mass spectrometry (ICAP).

17
Soybean was harvested at full maturity (R8) after seed moisture approached 130 g H2O
kg-1 seed using a small plot research combine equipped with scale and moisture tester. In 2013,
plots were harvested with a 1.2 m-combine head, collecting seed from rows two through four in
30 cm-row tests and rows two through seven in 19 cm-row tests. In 2014, plots were harvested
with a 1.5 m-combine head, collecting seed from rows two through five in 38-cm row
experiments and rows two through nine in 19-cm experiments. Seed yield was adjusted to 130 g
H2O kg-1.
Data were subjected to analysis of variance using the PROC GLM procedure of SAS.
Fixed effects were K fertilizer rates and random effects were replications. A single degree of
freedom contrast comparing the yield of soybean receiving no K against the average yield of
soybean fertilized with K was performed to classify each site-year as responsive or unresponsive
to K fertilization. Yield responses were interpreted as significant at P < 0.10.
Soil test K concentrations were highly variable between replications at some sites;
therefore, STK and relative yields were not averaged over replications to perform regression
analysis. To obtain relative yields, the yield of the unfertilized control (0 kg K2O ha-1) within
each replication were divided by the highest yielding treatment receiving potassium fertilizer and
multiplying by 100. Linear and quadratic relationships between relative seed yields and STK,
V5 plant tissue, and R2-stage trifoliate-leaf tissue were defined using the PROC REG procedures
of SAS. The Student’s residual (<-2.5 and >2.5) and Cook’s D statistics were used to identify
outlying and influential observations, respectively. The outlying or influential observations were
omitted from the dataset when appropriate and the model refit. Linear-plateau models were also
fit to the same data using the PROC NLIN procedure of SAS. From these relationships,
maximum relative yields were defined as 5% less than the predicted maximum for quadratic
18
models or as the maximum value of each dependent variable defined by the predicted plateau of
linear or quadratic-plateau models. When applicable, maximum yield definitions were used to
identify the critical soil K availability index or tissue K concentration.
Calibration of K rates needed to maximize soybean yield were performed using linear
and non-linear regression techniques. The minimum K fertilizer rate to maximize yield,
determined by using Fisher’s protected LSD at P <0.10 for each site-year was regressed against
the corresponding STK. Calibration was also performed with multiple regression techniques that
included linear and quadratic terms for the STK and K fertilizer rate. For this calibration,
relative yields were determined by dividing the treatment means by the highest yielding
treatment mean in the test, then multiplying by 100. A significance level of P = 0.10 was used to
include or exclude terms from the model.
Results and Discussion
Soil Testing
Soil test K at 0 to 15 cm depth ranged from 16 to 196 mg K kg-1 across the 19 sites
(Tables 2.1 and 2.3). In general, STK decreased with depth (Table 2.3). However, STK
increased with depth at sites 10 and 17. Higher STK concentrations at a deeper depth may
indicate that the cation exchange capacity (CEC) of sandy textured soils was not adequate to
hold the K nutrients and leaching occurred until a finer textured and higher CEC soil layer was
reached (Evanylo, 1991). The CEC values at these sites were very low throughout the profile;
therefore, leaching of K out of the topsoil would be likely.
Yield
Soybean yield increased over the unfertilized control at only five of the 19 sites (Table
2.4). In addition, yield decreased with K2O fertilizer rate at site 5. There is no explanation as to

19
why yield decreased at site 5, except that yield varied substantially within the site or this site may
represent a false positive. Still, yield of control plots (0 kg K2O ha-1 applied) was greater when
compared to treated plots in three of four replications.
Soil test K at the 0 to 15 cm sampling depth from the sites that responded positively to
K20 fertilizer was 40, 17, 16, 22 and 28 mg K kg-1 soil at sites 8, 12, 13, 14 and 18 respectively
(Table 2.1). A positive yield response was expected 40 to 85% of the time as the soils contained
very little Mehlich-1 extractable K (Donahue, 2000). The remaining unresponsive sites had STK
values ranging from 28 to 196 mg K kg-1, two of which were classified as low, seven of which
were classified as medium, and four classified as high. Yield response to K fertilizer is expected
in low STK soils and sometimes in medium STK soils but almost never in high STK soils
(Donahue, 2000). Therefore, many sites were not expected to differ from the control due to high
STK levels, but a yield increase was expected on low and some of the medium testing sites. At
sites 10 and 17, STK increased at the 30 to 60 cm depth which explains why those sites did not
respond to K2O fertilizer (Table 2.2). Regardless, these results do not appear to reflect the
current guidelines. In our study, 26 % of sites were yield responsive to K2O fertilizer compared
to results from Iowa where four of 10 sites (40 %) responded positively to K2O fertilizer (Clover
and Mallarino, 2013) and from silt loam soils in Arkansas where 21 of 34 sites (62 %) responded
positively to K2O (Slaton et al., 2010). In Iowa, Bray extractable K of the responsive sites
ranged from 130 to 154 mg K kg-1. In Arkansas, Mehlich-3 extractable K of the responsive sites
ranged from 41 to 131 kg K ha-1. It is possible that lower CEC soils of the Coastal Plain and
Piedmont regions of Virginia and northeastern North Carolina respond very differently from the
Midwestern and silty loam soils of Arkansas. Regardless, maximum average yield occurred
20
when 112 kg K2O ha-1 was applied at sites 12 and 18, 168 kg K2O ha-1 at site 14, and 224 kg K2O
ha-1at sites 8 and 13 (Table 2.4).
Another explanation for the lack of response to K2O fertilizer may be high STK
variability between replicates within some experiments in this study, as shown by the standard
errors in Table 2.3. For example, average 0 to 15 cm STK at site 7 was 37 mg K kg-1 with a
standard error of 14.4, average 15 to 30 cm STK was 16 mg K kg-1 soil with a standard error of
5.42 and average 30 to 60 cm STK was 29 mg K kg-1 soil with a standard error of 14.26. Sites 6,
12, 17, 18, and 19 also had relatively high standard errors. Due to this variability within some
experiments, four control (0 mg K ha-1) relative yields, calculated by using the greatest yield
within each replication, and the four corresponding STK values was used in the regression
analysis instead of using relative yields and STK values that were averaged across replicates.
The no-fertilizer control relative yields were regressed against STK values to investigate soil
supply nutrient sufficiency (Fig. 2.1). Relative soybean yield increased at a diminishing rate to a
maximum relative yield of 98% at 108 mg K kg-1 STK according to the quadratic model. Using
the definition of maximum yield (maximum yield predicted minus 5%), the critical STK
concentration to produce 93% relative yield was 88 mg K kg-1. Nonlinear regression of these
data indicated that relative yield reached a maximum of 88% at STK value of 38.8 mg K kg-1, a
value much lower than the quadratic model (Fig. 2.1). These critical points are much lower
when compared to Slaton et al. (2010), where soybean yield was maximized at a relative yield of
95% when STK was 153 mg K kg-1 (Mehlich-3) when using a quadratic response and at 92%
relative yield when STK was 108 mg K kg-1 (Mehlich-3) when using a linear plateau model.
That research also showed that STK explained 76 to 79% of the yield variability among soils, but
STK only explained 36 to 52% of the STK variability in these experiments.

21
V5 Tissue Analysis
Total K uptake in the soybean plant at the V5 growth stage was positively correlated with
K fertilizer additions in eleven of nineteen sites, even though there was no consistent yield
response at seven of those sites (Tables 2.4 and 2.5). Although a yield response was not always
realized, the soybean plants were taking up and utilizing soil applied K fertilizer for growth and
development. The linear plateau model relating relative yield to V5 K uptake indicated a critical
V5 plant K concentration to be 18.2 g K kg-1 (Fig. 2.2). After that plant concentration, relative
yield plateaued around 80%. Using the quadratic model, the maximum relative yield was 80%
when V5 plant K concentration was near 25 mg K kg-1. Although the R2 value of the linear
plateau and quadratic model (both 0.25) was low, critical V5 plant K concentration falls within
or above the sufficiency range (15 to 22.5 g K kg-1) for young soybean, as determined by Sabbe
et al. 2011 and Bryson et. al, 2014.
R2 Tissue Analysis
Plant K concentrations at R2 increased in response to K fertilizer application at all but
four sites, two of which (8, 10) were non-significant with P-values of 0.1027 and 0.1328,
respectively, (Table 2.6). The linear plateau model (Fig. 2.3) estimated critical R2 trifoliate K
concentration for maximum relative yield of 82% to be 24.6 g K kg-1, which is comparable to
Yin and Vyn (2002) and greater than Clover and Mallarino (2012). In contrast to Farmaha et al.
(2012), R2 soybean in this study has a greater critical concentration than V5 soybean. The
quadratic response (Fig. 2.3) of relative yield to R2 K concentration was similar to the linear
plateau model of relative yield to R2 K concentration.

22
Fertilizer Calibration
Regression analysis for calibration of the minimum fertilizer rate necessary to maximize
yield at various STK levels was not significant with the quadratic model (P = 0.3412) but only
slightly non-significant in the linear model (P= 0.1146) (Fig. 2.4). The second fertilizer
calibration curve was developed to determine how much K fertilizer is necessary based on STK
levels in order to achieve optimum yield (Fig. 2.5). In general, more fertilizer is needed to
increase yield at low STK levels. For example, at STK levels of 50 mg K kg-1, 25 kg ha-1 K2O
fertilizer would produce 90% relative yield but if 100 kg ha-1 K2O fertilizer were applied, relative
yield would be near 100%. At a soil test level of 20 mg K kg-1, an application of 25 kg K2O ha-1
would produce 50% relative yield where 200 kg K2O ha-1 would be necessary to produce near
100% relative yield.
Conclusions
Potassium fertilization increased soybean yield at only five of 19 sites in this study.
Yield response was expected at all of those sites when 0 to 15 cm STK was ≤40 mg K kg-1.
Yield was expected to increase with K fertilizer at four other sites where STK ranged from 28 to
43 mg K kg-1, but no yield increase was observed. Variability in measured soil test K levels
between replications at some locations may have distorted these results, but non-linear regression
of STK and 0 K rate controls using all data (not just average values over replicates) also
indicated no yield increase with K fertilizer if STK was greater than 38.8 mg K kg-1. These data
did support our hypotheses that current Virginia K fertilizer recommendations will result in little
to no yield loss and that yield will be maximized at STK levels between 38 to 88 mg K kg-1.
Plant tissue analysis also supported our hypothesis that plant tissue K sufficiency at R2 will

23
range between 17.5 and 25 g kg-1. Four of five yield-responsive sites were responsive to K
fertilizer at R2 as well. The multiple regression calibration follows current Virginia Cooperative
Extension recommendation guidelines and is similar to the linear plateau model shown in Fig.
2.1. At low STK levels, greater amounts of fertilizer are necessary to maximize yield and
prevent deficiency. Critical STK for yield response to K was 38.8 mg K kg-1 and 88% relative
yield.
Overall, our results indicated that K is an important soybean nutrient and regular K
fertilization is necessary to prevent yield loss and in some soil types with low to medium STK
levels. Most sites had sufficient rainfall in 2013 and 2014 which could have alleviated plant
stress that is typical in hot, dry summers. In drier years, plants have less access to soil K and
therefore could benefit from extra K fertilizer being applied. Therefore, more data is needed in
future years, with different weather patterns, to determine if current extension recommendations
are indeed sufficient.

24
References
Bryson, G.M., H.A. Mills, D.N. Sasseville, J.B. Jones, Jr., and A.V. Barker. 2014. Plant
analysis handbook III. Micro-Macro Publishing. Athens, GA.
Clover, M.W. and A.P. Mallarino. 2012. Corn and soybean tissue potassium content responses
to potassium fertilization and relationships with grain yield. Soil Sci. Soc. Am. J. 77:630-
642.
Coale, F. J. and J.H. Grove. 1991. Potassium utilization by no-till full-season and double-crop
soybean. Agron. J, 83, 190-194.
Donohue, S.J. 2000. Soil testing and plant analysis. In D.E. Brann, D.L. Holshouser, and G.L.
Mullins, editors, Agronomy Handbook. Virginia Cooperative Ext. publ. 424-100,
Blacksburg, VA. pp. 75-86.
Evanylo, G.K. 1991. Potassium fertilization of doublecropped wheat and soybean under two
tillage systems. J. Prod. Agric. 4:55-562.
Fageria, N.K. 2009. Potassium. In: N.K. Faeria, editor, The use of nutrients in crop plants.
CRC Press, Boca Raton, FL. pp. 121-164.
Fehr, W.R. and C.E. Caviness. 1977. Stages of soybean development. Spec. Rep. 80. Iowa
Agric. Home Econ. Exp. Stn., Iowa State Univ., Ames, IA.
Fernandez, F. G., Brouder, S.M, Beyrouty, C.A., Volenec and J.J. Hoyum, R.2008. Assessment
of plant-available potassium for no-till, rain fed soybean. Soil Sci. Soc. Am. J. 72:1085-
1095.
25
Havlin, J. L., J.D. Beaton, S.L. Tisdale and W.L. Nelson. 2004. Potassium soil fertility and
fertilizers: an introduction to nutrient management. Upper Saddle River, NJ: Pearson,
Prentince Hall, 2005. 199-218.
Heckman, J.R., E.J. Kamprath. 1995. Potassium accumulation and soybean yield related to
potassium fertilizer rate and placement. Communication in soil science and plant
analysis. 26:1&2, 123-143.
Helmke, P.A., and D.L. Sparks. 1996. Lithium, sodium, potassium, rubidium and cesium. In:
J.M. Bigham, editor-in-chief, Methods of soil analysis: part 3, chemical methods. SSSA,
Madison, WI. p. 563-569.
Mallarino, A. P., R.J. Oltmans, J.R. Prater, C.X. Villavicencio, and L.B. Thompson, 2011.
Nutrient uptake by corn and soybean, removal, and recycling with crop residue. 2011
Integrated Crop Management Conference - Iowa State University, 103-113 Ames, IA.
Munson, Robert D. editor. 1985. Potassium in agriculture. Madison, Wisconsin: Hanway, J.J.,
Johnson, J.W. Potassium Nutrition of Soybeans. ASA, CSA, SSA.
National Agricultural Statistics Service. 2012. Acreage. USDA, NASS. 15-16.
Sabbe, W.E., G.M. Lessman, and P.F. Bell. 2011. Soybean. In C.R. Campbell, editor,
Reference sufficiency ranges for plant analysis in the southern region of the Unite States.
South. Coop. Serv. Bull. 394. South. Reg. Agric. Exp. Stn., NC. p. 33-34.
SAS Institute. 2013. SAS v. 9.4. SAS Inst, Cary, NC.
Shingles, R. and R.E. McCarty. 1994. Direct measure of ATP-dependent proton concentration
changes and characterization of a K+ -stimulated ATPase in pea chloroplast inner
envelope vesicles. Plant Physiol 106:731-737.
26
Slaton, N. A., B.R. Golden, R.E. DeLong and M. Mozaffari. 2010. Correlation and calibration of
soil potassium availability with soybean yield and trifoliate potassium. Soil Sci. Soc. Am.
J. 74:1642-1651.
Talbott, L.D., S.M. Assmann and E. Zeiger. 1998. Potassium and sucrose in guard cell
osmoregulation. In: Oosterhuis DM and Berkowitz GA (editors) Frontiers in Potassium
Nutrition: New Perspectives on the Effects of Potassium on Physiology of Plants. Potash
and Phosphate Institute, Norcross, GA; and Potash and Phosphate Institute of Canada,
Saskatoon, Canada pp 53-62.
Tiwari, S. P., O.P. Joshi, A.K. Vyas and S.D. Billore. 2001. Potassium nutrition in yield and
quality improvement of soybean. 307-320 www.ipipotash.org
Yin, X. and T.J. Vyn. 2003. Potassium placement effects on yield and seed composition of no-till
soybean seeded in alternate row widths. Agron. J, 95, 126-132.
Yin, X. and T.J.Vyn. 2004. Critical Leaf Potassium Concentrations for Yield and Seed Quality
of Conservation-Till Soybean. Soil Sci. Soc. Am. J. 6:1626-1634.
27
Table 2.1. Location, previous crop, soil texture, soil characterization and Mehlich-1 extractable nutrient concentration information
from 0 to 15 cm depth for 19 field trials on Piedmont and Coastal Plain soils of North Carolina and Virginia.
Site Year County/City Previous Crop
Soil Series and
Texture Classification OM† CEC† pH K P Ca Mg
----g kg-1---- -----------mg kg-1----------
1 2013 Accomack, VA Wheat Cover Crop Sandy loam Typic Hapludults 2.1 7.8 6.4 179 67 1286 146
2 2013 Culpeper, VA Wheat Silty clay loam Ultic Hapludalfs 0.8 3.4 6.5 94 100 511 61
3 2013 Culpeper, VA Wheat Silty clay loam Ultic Hapludalfs 2.4 8.1 6.6 54 15 1376 122
4 2013 Culpeper, VA Wheat Silty clay loam Ultic Hapludalfs 2.7 8.6 5.5 196 72 911 131
5 2013 Suffolk, VA Fallow Loamy fine sand Aquic Hapludults 0.9 2.4 6.0 74 52 332 35
6 2013 Virginia Beach,
VA
Corn Loam Typic Hapludults 3.1 7.1 5.7 82 48 815 119
7 2014 Campbell, VA Soybean and Grapes Fine sandy loam Typic Kanhapludults 2.6 6.4 6.5 43 38 916 83
8 2014 Chesapeake, VA Sod Sandy loam Typic Hapludults 1.8 5.3 5.4 40 142 521 61
9 2014 Currituck, NC Soybean Loamy sand Typic Hapludults 1.7 4.8 5.2 90 149 447 49
10 2014 Gates, NC Soybean Fine sandy loam Aquic Paleudults 1.0 3.4 6.4 52 47 514 82
11 2014 Gates, NC Soybean Loam Typic Albaquults 0.9 2.4 5.6 43 53 201 46
12 2014 Lunenburg, VA Soybean Sandy loam Typic Kanhapludults 3.3 5.2 6.3 17 19 671 142
13 2014 Mecklenburg, VA Fescue Hay Fine sandy loam Typic Kanhapludults 2.0 4.6 6.7 16 9 650 152
14 2014 Mecklenburg, VA Soybean Fine sandy loam Aquic Hapludults 1.3 2.8 5.4 22 25 326 49
15 2014 Northumberland,
VA
Corn Fine sandy loam Aquic Hapludults 1.7 4.6 6.8 83 29 605 164
16 2014 Richmond, VA Fescue Hay Fine sandy loam Typic Endoquults 1.4 2.2 5.3 38 3 108 21
17 2014 Suffolk, VA Corn Fine sandy loam Typic Hapludults 0.8 2.2 5.6 28 56 248 45
18 2014 Virginia Beach,
VA
Corn Fine sandy loam Aeric Endaquults 3.3 5.5 5.7 28 37 545 91
19 2014 Westmoreland, VA Corn Sandy loam Typic Hapludults 1.9 4.3 6.4 50 5 515 148
†OM, organic matter; CEC, estimated cation exchange capacity
28
Table 2.2. Average monthly temperature (°C) and rainfall (cm) obtained from closest weather station to
each full-season site. Surplus or deficit of rainfall, compared to 30-year average, is listed in parentheses.
Site(s) Location May June July August September October
1 Accomack, VA
Rain 2.3 (-6.1) 9.5 (-0.5) 6.2 (-6.6) 7.1 (-3.8) 2.7 (-7.3) 10.2 (1.1)
Temp 19.4 (0.8) 24.3 (0.8) 27.4 (1.5) 24.3 (-0.6) 20.7 (-0.9) 18.9 (2.9)
2,3,4 Culpeper, VA
Rain 8.0 (-2.6) 24.7 (14.4) 20.0 (11.6) 9.7 (1.9) 12.8 (1.4) 8.8 (0.8)
Temp 17.7 (0.8) 23.2 (1.4) 25.6 (1.6) 23.7 (0.4) 20.7 (1.5) 16.2 (2.8)
5 Suffolk, VA
Rain 7.1 (-2.6) 21.2 (10.1) 17.4 (4.3) 12.9 (-1.6) 4.6 (-8.9) 16.8 (7.6)
Temp 19.3 (0.0) 24.2 (0.4) 26.3 (0.3) 24.1 (-1.0) 20.6 (-1.3) 17.0 (0.7)
6 Virginia Beach
Rain 4.5 (-4.0) 4.5 (-6.0) 24.9 (12.3) 5.9 (-7.2) 16.8 (6.4) 3.0 (-5.7)
Temp 23.0 (4.2) 25.6 (2.0) 26.9 (0.8) 26.1 (0.9) 24.5 (2.4) 19.0 (2.5)
7 Campbell, VA
Rain 13.7 (3.8) 6.1 (1.7) 14.7 (4.2) 12.1 (3.6) 4.1 (-5.3) 9.1 (0.5)
Temp 18.9 (2.2) 23.0 (1.6) 23.5 (0.2) 22.0 (-0.7) 20.0 (0.7) 13.9 (1.0)
8,18 Chesapeake, Virginia Beach, VA
Rain 6.0 (-2.6) 7.9 (-2.6) 14.5 (1.8) 13.7 (0.6) 28.9 (18,5) 3.7 (-5.0)
Temp 20.8 (1.9) 23.9 (0.2) 25.2 (-0.9) 24.4 (-0.9) 23 (0.9) 18.4 (1.9)
9 Currituck, NC
Rain 9.7 (1.2) 11.1 (0.6) 21.2 (8.6) 9.4 (-3.7) 13.5 (3.1) 2.3 (-6.5)
Temp 21.5 (2.7) 24.5 (0.9) 25.7 (-0.4) 25.1 (-0.1) 23.1 (0.9) 17.7 (1.2)
10,11 Gates, NC
Rain 7.9 (-1.8) 22.3 (11.2) 15.7 (2.7) 6.6 (-7.9) 18.4 (4.9) 3.8 (-5.4)
Temp 21.3 (2.0) 24.0 (0.1) 24.4 (-1.6) 23.2 (-1.9) 22.2 (0.3) 16.3 (0.0)
12,13,14 Lunenburg, Mecklenburg, VA
Rain 13.1 (3.0) 2.8 (-6.4) 8.5 (-2.8) 5.8 (-5.5) 12.7 (2.3) 7.7 (-1.3)
Temp 20.6 (1.9) 24.5 (0.9) 25.1 (-0.7) 23.8 (-1.1) 21.8 (0.8) 16.6 (1.9)
15 Northumberland, VA
Rain 9.7 (-0.8) 6.5 (-2.5) 9.0 (-2.6) 11.1 (-0.7) 7.6 (-3.2) 8.7 (-0.1)
Temp 19.1 (-0.2) 23.6 (-0.3) 24.7 (-1.3) 23.0 (-2.0) 21.1 (-0.3) 16.4 (0.8)
16,19 Richmond, Westmoreland, VA
Rain 11.3 (0.7) 7.7 (-1.3) 7.7 (-3.9) 9.1 (-2.6) 6.9 (3.9) 5.1 (-3.7)
Temp 19.8 (0.6) 23.3 (-0.6) 24.4 (-1.6) 22.8 (-2.3) 21.0 (-0.4) 15.8 (0.3)
17 Suffolk, VA
Rain 6.6 (-3.2) 8.8 (-2.3) 16.1 (3.0) 5.6 (-8.9) 15.3 (1.8) 3.1 (-6.1)
Temp 20 (0.7) 23.1 (-0.8) 24.1 (-1.9) 23.2 (-1.8) 21.65 (-0.2) 16.1 (-0.2)

29
Table 2.3. Average Mehlich-I extractable K, standard error and estimated CEC at three sampling
depths for 19 sites of full season soybean studies in Piedmont and Coastal Plain soils of North
Carolina and Virginia
Site Year County/City 0-15 cm 15-30 cm 30-60 cm
CEC† Soil K ‡ CEC† Soil K ‡ CEC† Soil K ‡
g kg-1 mg K kg- g kg-1 mg K kg-1 g kg-1 mg K kg-1 1 2013 Accomack, VA 8.8 179 ± 13.5 7.7 85 ± 8.9 6.2 46 ± 5.8
2 2013 Culpeper, VA 3.4 94 ± 6.0 2.8 66 ± 6.8 3.1 69 ± 6.8
3 2013 Culpeper, VA 8.1 54 ± 3.0 6.3 24 ± 1.7 7.6 19 ± 1.7
4 2013 Culpeper, VA 8.6 196 ± 11.3 7.7 134 ± 7.3 6.6 105 ± 14.6
5 2013 Suffolk, VA 2.4 74 ± 2.0 2.1 52 ± 3.1 2.1 60 ± 4.8
6 2013 Virginia Beach, VA 7.1 82 ± 8.9 4.0 38 ± 2.9 3.6 36 ± 9.8
7 2014 Campbell, VA 6.4 37 ± 14.4 4.7 16 ± 5.4 4.2 29 ± 14.3
8 2014 Chesapeake, VA 5.3 40 ± 2.7 4.2 31 ± 1.9 3.4 28 ± 2.5
9 2014 Currituck, NC 4.8 90 ± 3.1 4.1 69 ± 2.1 3.7 60 ± 2.4
10 2014 Gates, NC 3.4 52 ± 4.1 2.8 50 ± 0.9 3.6 72 ± 5.0
11 2014 Gates, NC 2.4 43 ± 2.1 1.9 32 ± 1.5 1.4 27 ± 2.4
12 2014 Lunenburg, VA 5.2 17 ± 1.3 4.1 13 ± 1.4 4.4 9 ± 0.5
13 2014 Mecklenburg, VA 4.6 16 ± 2.0 3.3 11 ± 1.1 3.8 11 ± 1.0
14 2014 Mecklenburg, VA 2.8 22 ± 0.5 1.8 13 ± 1.0 2.9 14 ± 1.7
15 2014 Northumberland, VA 4.6 83 ± 5.5 3.2 76 ± 7.4 3.5 74 ± 7.8
16 2014 Richmond, VA 2.3 38 ± 1.9 1.4 25 ± 2.2 1.8 27 ± 1.9
17 2014 Suffolk, VA 2.2 28 ± 4.4 1.6 29 ± 1.9 1.4 43 ± 0.8
18 2014 Virginia Beach, VA 5.5 28 ± 4.4 3.3 17 ± 1.0 1.7 16 ± 1.4
19 2014 Westmoreland, VA 4.3 50 ± 9.0 4.1 33 ± 6.1 4.3 27 ± 3.9
† CEC – Cation Exchange Capacity
‡ Soil K concentration, mg K kg-1 ± Standard Error

30
Table 2.4. Full-season soybean actual and relative yields as affected by K fertilizer rate at 19 site years
on Coastal Plain and Piedmont soils in North Carolina and Virginia
K2O Fertilizer Rate, kg ha-1
Site RY† 0 28 56 112 168 224 Sdf ‡ LSD
-%- -------------------------------kg ha-1-------------------------------
1 92 3496 3629 3785 3597 3238 3506 0.686 NS § 2 72 3366 4093 3823 3224 3921 3616 0.3744 NS 3 93 3737 3800 3433 3495 3815 3401 0.4413 NS 4 93 4334 4085 3888 4436 3920 3683 0.2706 NS 5 95 3486 2956 2939 2872 2989 2509 0.0061 450 6 86 3915 4076 4014 3991 3851 4097 0.7363 NS 7 77 2735 2996 3078 2605 2917 3492 0.4525 NS 8 78 3194 3463 3614 3697 3914 3996 <.0001 185 9 79 2450 2990 2196 2765 2289 2507 0.7986 NS 10 94 4839 4782 4134 4245 4971 4839 0.3875 NS 11 86 3221 3023 2955 3259 2841 3079 0.5929 NS 12 20 581 1327 2031 2591 2578 2559 <.0001 252 13 32 1227 1465 2155 3034 3238 3871 0.0006 750 14 36 1056 1414 1624 1933 2492 2480 0.0014 541 15 93 4869 5025 4947 4806 4778 4813 0.9789 NS 16 75 1754 1889 1907 1898 1838 1881 0.5615 NS 17 66 1457 1534 1785 2012 2216 1762 0.4625 NS 18 71 2703 2504 3134 3579 3159 3374 0.0876 553 19 92 3329 3299 3352 3242 3337 3434 0.9713 NS
† RY, relative yield of soybean receiving no K fertilizer compared to maximum numerical yield of
soybean receiving K fertilizer
‡ sdf, single-degree-of-freedom contrast P value comparing the yield of soybean receiving no K to the
yield of soybean receiving K
§ NS, not significant (P>0.10)

31
Table 2.5. Mean actual whole plant K concentration at V5 growth stage of soybean as affected
by K fertilizer rates at 19 sites on Coastal Plain and Piedmont soils in North Carolina and
Virginia.
K2O Fertilizer Rate, kg ha-1
Site 0 28 56 112 168 224 Sdf† LSD
----------------g K kg-1----------------
1 26.3 26.4 27.0 27.4 27.7 26.1 0.2944 NS‡
2 14.0 9.9 10.0 16.3 16.3 13.5 0.7618 NS
3 28.0 25.5 26.6 26.1 22.8 24.9 0.2187 NS
4 21.9 24.0 24.4 25.9 26.5 25.9 0.0204 3.0
5 23.1 22.7 22.9 24.3 25.0 24.5 0.6003 NS
6 19.2 18.8 23.8 22.0 22.1 23.0 0.0605 3.0
7 18.4 18.1 19.7 17.8 24.3 22.1 0.3251 NS
8 12.2 15.4 17.9 16.9 17.7 19.1 0.0012 3.0
9 33.0 33.2 34.1 32.5 35.1 35.1 0.3576 NS
10 19.1 23.2 20.4 25.1 27.8 28.0 0.001 3.2
11 18.7 17.7 21.5 21.3 22.5 24.8 0.1096 NS
12 5.0 11.0 13.9 13.0 17.0 20.0 <.0001 3.0
13 10.1 16.1 20.2 21.8 27.8 27.7 0.0008 6.8
14 12.2 16.8 22.7 25.7 26.0 29.6 <.0001 3.7
15 26.9 28.0 28.7 27.1 28.1 26.5 0.4835 NS
16 22.6 23.0 24.5 28.0 26.8 24.5 0.0195 2.4
17 14.9 20.7 21.6 21.1 26.5 27.5 <.0001 3.5
18 13.1 17.1 18.0 18.8 19.0 21.0 0.0242 5.1
19 22.2 26.9 27.8 28.9 30.8 28.1 0.0026 3.9
†sdf, single-degree-of-freedom contrast P value comparing the
concentration of soybean receiving no K to the concentration of soybean
receiving K
‡NS, not significant (P>0.10)

32
Table 2.6. Mean actual trifoliate K concentration at R2 growth stage of soybean as affected by K
fertilizer rates at 19 sites on Coastal Plain and Piedmont soils in North Carolina and Virginia.
K2O Fertilizer Rate, kg ha-1
Site 0 28 56 112 168 224 Sdf† LSD
----------------g K kg-1---------------- 1 24.7 25.2 24.6 25.8 25.4 25.7 0.3510 NS 2 14.9 15.7 16.3 17.1 17.5 20.0 0.0721 2.9 3 28.9 30.1 28.7 27.9 28.2 28.6 0.8976 NS 4 26.6 27.7 28.3 30.6 29.6 30.4 0.029 2.6 5 17.8 19.2 19.3 20.0 20.0 20.1 0.0071 1.4 6 18.7 19.6 22.8 24.0 22.1 24.0 0.0342 3.7 7 13.5 17.7 18.3 19.5 19.2 19.5 0.0042 3.4 8 19.4 21.0 21.3 21.6 25.1 22.1 0.1027 NS 9 23.1 24.6 24.0 23.7 24.5 23.5 0.0911 1.2
10 21.2 23.2 22.0 22.2 25.2 25.1 0.1328 NS 11 16.4 18.7 19.4 20.1 20.9 24.1 0.0002 2.0 12 7.8 14.6 19.6 18.3 17.6 22.0 <.0001 4.5 13 8.7 16.3 18.3 19.3 21.2 23.4 <.0001 2.0 14 18.1 19.2 21.7 23.1 24.0 26.0 0.0058 3.3 15 26.8 28.0 28.0 27.4 30.1 28.8 0.0054 1.2 16 25.3 25.6 26.8 26.9 28.6 28.0 0.0334 1.8 17 16.3 20.1 18.3 20.1 23.1 23.0 0.0021 2.8 18 20.7 22.5 22.6 24.0 25.0 24.8 0.0731 3.9 19 18.1 20.0 20.6 22.1 23.4 24.1 <.0001 1.7
† sdf, single-degree-of-freedom contrast P value comparing the
concentration of soybean receiving no K to the concentration of
soybean receiving K

33
Table 2.7. Coefficient values for calibration of K fertilizer rate using a multiple regression
model where relative yield is predicted from extractable soil K and K fertilizer rate at 6
responsive sites
Source DF Type III SS Mean Square F Value Pr>F
Soil K 0-15 cm 1 4805.74 7805.74 68.97 <.0001
Fertilizer Rate 1 4028.72 4028.72 57.82 <.0001
Soil K*Soil K 1 2132.04 2132.04 30.60 <.0001
Fertilizer*Fertilizer 1 371.15 371.15 5.53 0.0281
Soil K *Fertilizer 1 5042.84 5042.84 72.38 <.0001

34
Figure 2.1. Relative soybean yield for each replication regressed against Mehlich-1 extractable
soil K as predicted with a quadratic or linear plateau model. The classification of a site as
responsive (P < 0.10) or non-responsive (P > 0.10) was based on single degree of freedom
contrasts that indicate whether the yield of fertilized plots was different from the non-fertilized
control.
0
20
40
60
80
100
120
140
0 50 100 150 200 250
Re
lati
ve Y
ield
Soil mg K kg-1
Responsive 2013
Unresponsive 2013
Responsive 2014
Unresponsive 2014Q: y= -0.0033x2+0.9072x+38.10
R2=0.3631LP: y = -2.5 + 2.4x for x < 38.75
R2 = 0.5172
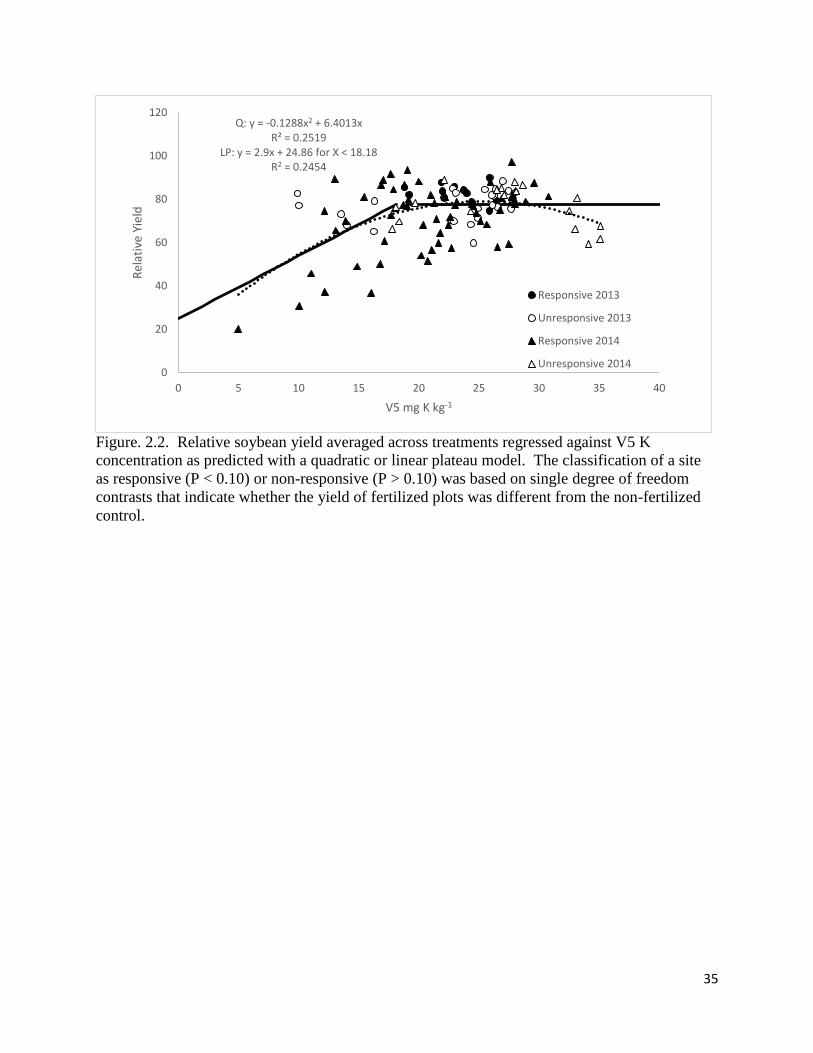
35
Figure. 2.2. Relative soybean yield averaged across treatments regressed against V5 K
concentration as predicted with a quadratic or linear plateau model. The classification of a site
as responsive (P < 0.10) or non-responsive (P > 0.10) was based on single degree of freedom
contrasts that indicate whether the yield of fertilized plots was different from the non-fertilized
control.
Q: y = -0.1288x2 + 6.4013xR² = 0.2519
LP: y = 2.9x + 24.86 for X < 18.18R2 = 0.2454
0
20
40
60
80
100
120
0 5 10 15 20 25 30 35 40
Rel
ativ
e Yi
eld
V5 mg K kg-1
Responsive 2013
Unresponsive 2013
Responsive 2014
Unresponsive 2014

36
Figure 2.3. Relative soybean yield regressed against R2 K concentration as predicted with a
quadratic or linear plateau model. The classification of a site as responsive (P < 0.10) or non-
responsive (P > 0.10) was based on single degree of freedom contrasts that indicate whether the
yield of fertilized plots was different from the non-fertilized control.
Q: y = -0.1244x2 + 6.9919x - 17.087R² = 0.3759
LP: y =2.3x + 25.84 for X < 24.59R2 = 0.2479
0
20
40
60
80
100
120
0 5 10 15 20 25 30 35
Rel
ativ
e Yi
eld
R2 mg K kg-1
Responsive 2013
Unresponsive 2013
Responsive 2014
Unresponsive 2014
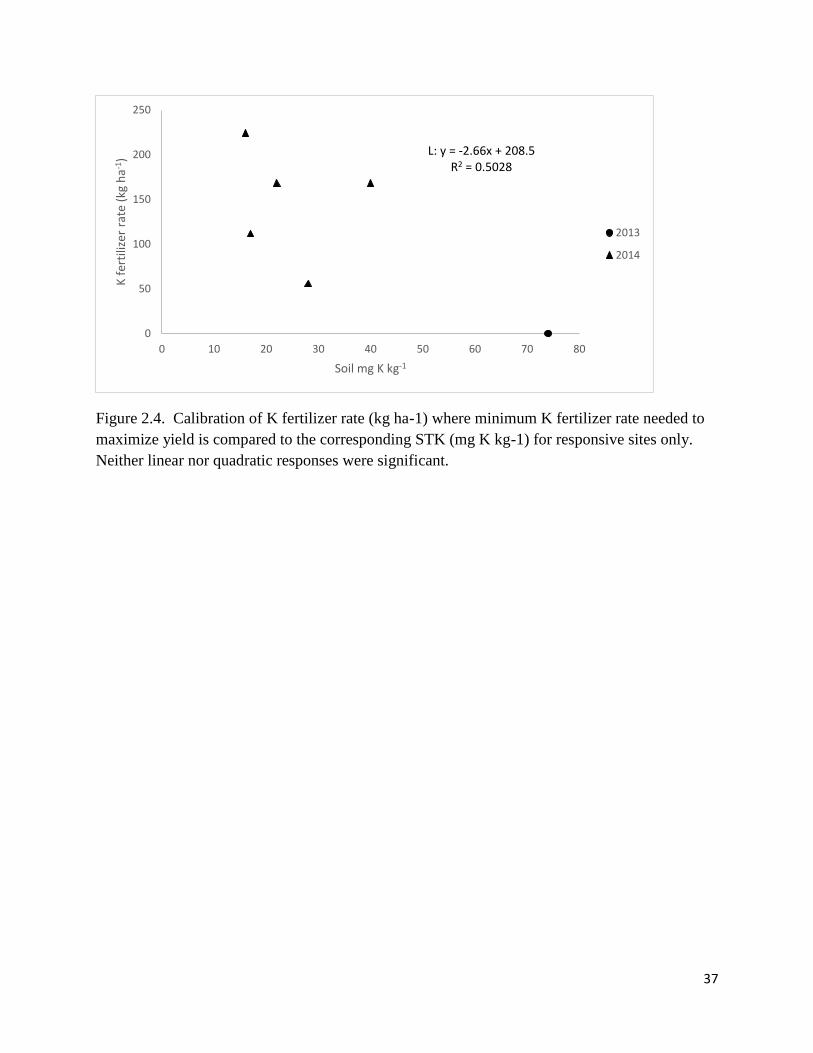
37
Figure 2.4. Calibration of K fertilizer rate (kg ha-1) where minimum K fertilizer rate needed to
maximize yield is compared to the corresponding STK (mg K kg-1) for responsive sites only.
Neither linear nor quadratic responses were significant.
0
50
100
150
200
250
0 10 20 30 40 50 60 70 80
K f
erti
lizer
rat
e (k
g h
a-1)
Soil mg K kg-1
2013
2014
L: y = -2.66x + 208.5R2 = 0.5028
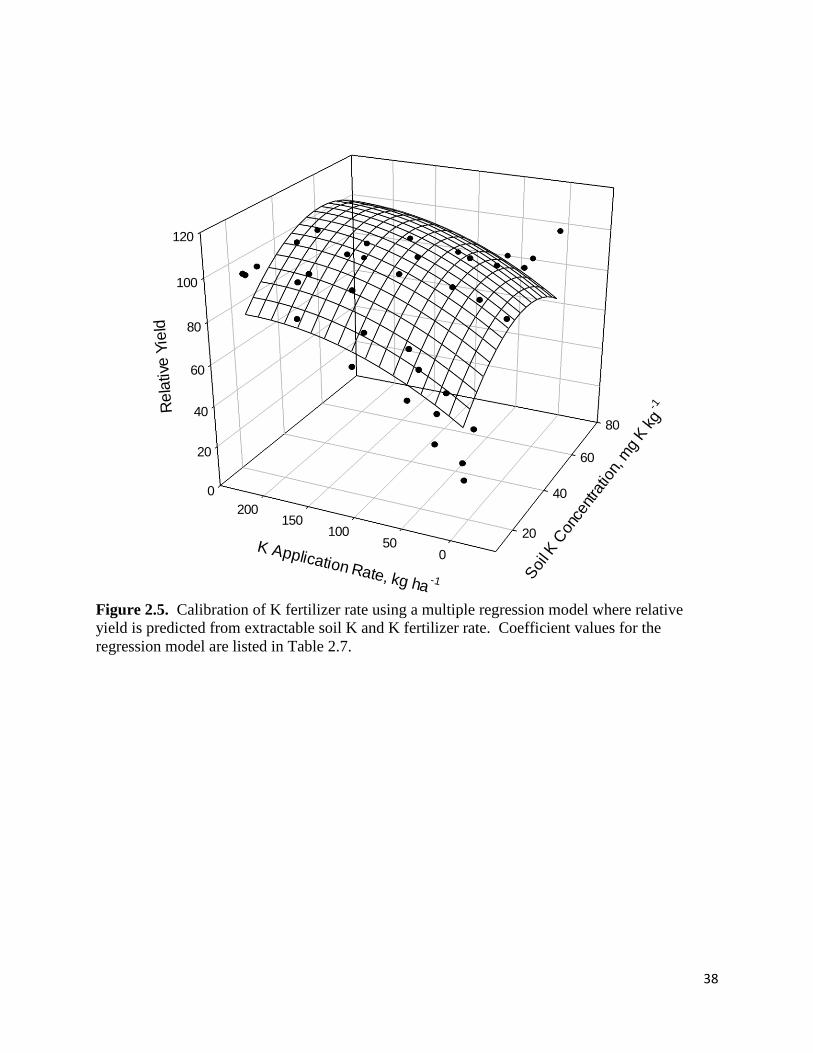
38
Figure 2.5. Calibration of K fertilizer rate using a multiple regression model where relative
yield is predicted from extractable soil K and K fertilizer rate. Coefficient values for the
regression model are listed in Table 2.7.
0
20
40
60
80
100
120
20
40
60
80
050
100150
200
Re
lative
Yie
ld
Soi
l K C
once
ntra
tion,
mg
K k
g-1
K Application Rate, kg ha -1

39
Chapter 3 – Double-Crop Soybean Response to Potassium on Coastal Plain and Piedmont
Soils of Virginia
ABSTRACT
Potassium nutrition is important to double-crop soybean [Glycine max (L.) Merr.]
systems in order to achieve high yields on Piedmont and Coastal Plain soils of the Mid-Atlantic
U.S.A region, but current fertilizer recommendations are dated and possibly need revisions.
Fourteen double-crop soybean experiments were conducted during 2013 and 2014 in Virginia to
correlate relative yield, V5 plant K concentration and R2 trifoliate leaf K concentration with
Mehlich-1 extractable soil K; establish critical K concentrations for V5 and R2 stage in soybean;
determine average wheat [Triticum aestivum (L.) Merr.] K removal by straw and chaff; and
calibrate K fertilizer rate for maximum yield. Experiments were designated as wheat straw
remaining or straw removed, dependent on location. Initial soil samples at 0 to 15, 15 to 30 and
30 to 60 cm were taken prior to broadcasting 0, 28, 56, 112, 168 and 224 kg K2O ha-1 within two
weeks of planting. Mehlich-1 extractable soil K ranged from 30 to 177 mg K kg-1 and resulted in
relative yields of 80 to 99% when no K fertilizer was applied. Potassium fertilizer increased
soybean yield at only one site, but yield declined with increasing K rate at another site. Critical
concentrations could not be determined for V5 and R2 soybean. These data indicated that at
higher soil test K levels and with ample summer rainfall, current extension recommendations are
sufficient but more experiments are needed at lower soil test K levels to determine if current
recommendations are sufficient for our region.
Introduction
Potassium (K) is an essential plant nutrient that affects photosynthesis; helps regulate
turgor pressure, which in turn reduces water loss and plant wilting; aids the translocation of
sugars and starches; and builds cellulose to reduce lodging (Fagaria, 2009, Havlin et al., 2004,
40
Shingles and McCarty, 1994, Talbott et al., 1998, Tiwari, 2001). With the exception of nitrogen,
K is needed in greater amounts than other nutrients, but is not always available in exchangeable
form in the soil. Therefore, it becomes necessary to apply K fertilizer to prevent or reduce the
likelihood of K deficiency in soybean [Glycine max (L.) Merr.] (Havlin et al., 2004).
Double-crop soybean systems are widely used in the Mid-Atlantic U.S.A. region and can
be more profitable than monoculture soybean systems since two crops can be grown and
harvested within a single year (Farno et al., 2002). There were 1.3 million hectares of soybean
harvested in the Mid-Atlantic in 2013, of which 42% were double-cropped (NASS, 2015).
Soils with low cation exchange capacity (CEC) and low water holding capacity are
prevalent in the Mid-Atlantic and there has been little research conducted on these types of soils,
especially in double-crop systems. The most recent double-crop research was conducted by
Evanylo (1991) on loamy sand coastal plain soils in Painter VA. He concluded that leaching and
accumulation of K at depths greater than 46 cm were responsible for lack of response to K
fertilization. Typically, soil K levels decrease after the first 0 to 5 cm and have been found to
have significantly greater K concentration than those at 10 to 20 cm (Fernandez et al., 2008; Yin
and Vyn, 2003). But in Evanylo’s research, the Bojac loamy sand contained 96, 118, or 106 mg
K ha-1 at 0 to 15, 15 to 30, or 30 to 46 cm, respectively. Furthermore, although the average
sampling depth for row crops is 0 to 15 cm, soybean roots can reach much greater depths than
that and soil sampling at depth is necessary to determine K levels throughout the whole soil
profile. As stated by Heckman and Kamprath (1995), the taproot of a soybean can utilize soil
reserves differently than the fibrous root system of corn. Evanylo further suggested that K
fertilizer application rate should be adjusted based on the amount of K present in the argillic
horizon, which can vary in coastal plain soils. Woodruf and Parks (1980) also suggested that

41
soybean could obtain more K from the B horizon on South Carolina coastal plain soils than corn.
Therefore, sampling depth may be especially important throughout the coastal plain and
piedmont region due to low CEC soils that are susceptible to leaching.
Although not in a double-crop system, Heckman and Kamprath (1995) conducted K
research in Clayton, NC on loamy sand and sandy loam soils, similar to those found in the
Coastal Plain of Virginia. The researchers saw linear increases in tissue concentration at 11, 35,
49 and 77 days after planting with broadcast K fertilizer application. Also, high yields were
associated with high plant K concentrations with average concentrations at 77 days of 29.6, 30.7
or 25.6 g K kg-1 in 1985, 1986 or 1987, respectively. Heckman and Kamprath also found a
positive correlation with grain yield and leaf and petiole K concentration, even though K
concentrations in that study were above a critical value of 22.0 g K kg-1, as reported by Melsted
et al. (1969). Although neither in the Mid-Atlantic region nor on double-crop soybean, K
research in soybean was recently performed by Clover and Mallarino (2012) in Iowa and Slaton
et al. (2010) in Arkansas. Broadcast K fertilization increased plant K concentration and grain
yield in each study. However, in the Iowa study, K fertilization at rates of 71 to 177 kg K ha-1
increased soybean yields at four of ten sites and soybean yield responded linearly at various K
application rates up to 103 kg K ha-1 (Clover and Mallarino, 2012). In the Arkansas study,
conducted on 34 silt loam soils ranging from 46 to 167 mg K kg-1, soybean yield responded
positively at all sites where Mehlich-3 extractable K was less than 91 mg K kg-1 and K fertilizer
applications ranged from of 0 to 148 kg K ha-1. In addition, nine of 15 sites where extractable K
ranged from 91 to 130 mg K kg-1, had positive yield response. While these studies related
soybean response to K fertilizer rate and to soil test levels, those soil types vary greatly from

42
Mid-Atlantic soils and research is needed within the region to reassess current fertilizer
recommendations.
Potassium uptake in wheat may have an influence on nutrient availability for the
following soybean crop. Nutrients remaining in the stem and chaff can be utilized by double-
crop soybean and reduce fertilizer input. A United Kingdom study on removal of P and K from
the soil in wheat [Triticum aevestum (L.) Merr.] and barley [Hordeum vulgare (L.) Merr.] straw
resulted in median straw removal of 0.07% total P and 100% total K in the soil (Withers, 1991).
Potassium concentrations in 1986 through 1988 were significantly different with 1988 being
greatest and 1986 being least. The literature states that it was a very wet at harvest in southeast
England, but very dry at harvest in southwest England in 1987. Wheat grain removal of K in this
study was 56% of the total K removed in grain plus straw. According to Tarkalson, et al. (2009),
9.34 kg K2O tonne-1 was removed when removing wheat straw. Compared to N and P, wheat
straw contains a greater proportion of K at grain mass nutrient ratios of 0.47, 0.26 and 4.12 of N,
P and K, respectively.
Tissue sampling gives an indication of uptake and current nutrient status in soybean. In
Kentucky, Coale and Grove (1991) found that K accumulation rate was greatest between R1
(beginning bloom) and R5 (beginning seed) (Fehr and Caviness, 1971) and was typically
increased by high K soil fertility conditions (88+ mg K kg-1) by 87 %, compared to low K soil
fertility conditions. In Ontario, Yin and Vyn (2004) studied three fertilizer placement methods,
two conservation tillage systems, and two soybean row widths to determine the critical K value
at R1 for maximum seed yield was 24.3 g kg-1. In that study, KCl applications of 100 kg K ha-1
increased soybean leaf concentrations by 5.1 to 8.0 g K kg-1. Clover and Mallarino (2012)
determined critical leaf K concentration at R1 to be 17.6 to 20.0 g K kg-1 for maximum yield.

43
There is lack of research in the Mid-Atlantic in K fertility on double-crop, wheat soybean
rotations. Due to differences between soils of the Mid-Atlantic and other regions, and due to
differences between full-season and double-crop systems, research on the response of soybean to
K fertilizer growing under these environments is needed. We hypothesize that maximum
soybean yield will be reached at soil K concentrations between 38 to 88 mg K kg-1 (medium
testing STK) and plant tissue K sufficiency ranges between 17.5 and 25 g K kg-1, according to
current Virginia recommendations (Donahue, 2000). The objectives of this study were to
determine double-crop response to soil test K and K fertilizer rates on coastal plain or piedmont
soils of Virginia. Specifically, we will 1) correlate relative yield, V5 plant K concentration, R2
trifoliate leaf K concentration, and physiological mature wheat stem and chaff K concentration
with Mehlich-1-extractable soil K; 2) establish critical tissue K concentrations for V5 and R2
soybean; and 3) calibrate K fertilizer necessary for maximum yield.
Materials and Methods
Fourteen field trials were conducted on soils representative of the Piedmont and Coastal
Plain regions of Virginia during 2013 and 2014 (Table 3.1). Maturity group IV or V soybean
was planted no-till into harvested wheat in June or July with farmer owned or small plot
equipment in 19 or 38-cm rows. Planting dates ranged from June 30 to July 15 for 2013 and
2014. Most test sites followed a two- or three-year crop rotation and previous year’s crop was
usually corn or soybean. Sites in Accomack County in 2014 were unique as they were planted to
cucumbers and squash in the previous year. This site was located on the Eastern Shore
Agricultural Research and Extension Center where produce research is conducted. Cultural
practices and pest management followed North Carolina or Virginia Cooperative Extension
recommendations. All sites were dependent upon rainfall and no irrigation was used. Rainfall

44
varied with location, but was generally above the 30-year average during June and July of 2013
at all sites except for the two sites in Accomack, which had a deficit of 7.1 cm (Table 3.2).
Rainfall was then below average during August and September for all sites except Culpeper and
Virginia Beach, where rainfall totals were near average. In 2014, the sites in Accomack
experienced similar conditions as in 2013 and Suffolk sites experienced near-normal rainfall in
all months except August, when there was an 8.9 cm deficit. Growing season temperatures were
near or slightly above average in 2013 and slightly below average in 2014.
At some locations, two adjacent experiments were conducted; wheat straw was either left
on the ground or removed by baling or raking. Aboveground wheat biomass samples (1 m2)
were taken in double crop experiments immediately before wheat harvest. These samples were
used to determine the amount of K remaining or removed in the straw and the amount of K
removed in the grain. Samples were weighed to obtain wet weight and a subsample (1/4 of
actual sample weight) was removed from the overall sample. Wheat heads were separated from
the stem by cutting at the base of the head. Grain and chaff were separated with a stationary
thresher in 2013 or by hand shelling in 2014. Chaff and stem were re-combined for future
measurements. All samples were dried at 60 °C then ground using a Wiley Mill grinder with a
0.5 mm screen. Samples were then digested using nitric acid and hydrogen peroxide (EPA
3050B) and analyzed at Virginia Tech soil testing laboratory using inductively coupled atomic
plasma mass spectrometry (ICAP).
Within two weeks of soybean planting and before fertilizer was applied, a composite soil
sample consisting of an average of 12 subsamples was collected at depths of 0 to 15, 15 to 30,
and 30 to 60 cm within each replication. Soil samples were air-dried, ground, and sent to
Virginia Tech soil testing laboratory for analysis using Mehlich I extraction procedures, which is
45
the routine method used at that laboratory. Five grams of sieved, air-dried soil were placed into
a 150 mL extraction flask, then 25 mL of Mehlich I extracting solution (0.05 M H2SO4 + 0.05 M
HCl) was added and shook for 5 minutes on a reciprocating shaker set at a minimum of 180 opm.
The sample was filtered through a Whatman no. 2 filter paper and analyzed using ICAP (Helmke
and Sparks, 1996). This process was performed for each soil test sample received at the VT
laboratory. Table 3.3 lists the average mg K kg-1 and standard error for each site at the three
sampling depths.
Each experiment was designed as a randomized complete block with four replications.
Individual plot size was 3.8 m wide and 14.6 m long. After the soil was sampled, K fertilizer
was broadcast by hand on the surface of the soil (not incorporated) at 0, 28, 56, 112, 168, or 224
kg K ha-1 using granular muriate of potash (0-0-60). To ensure that other nutrients were non-
limiting, fertilizer containing only those limiting nutrients was applied at the same time if needed
and plants were monitored for deficiency symptoms other than K throughout the growing season.
Wheat was not fertilized with K-containing fertilizers; therefore this was the only K fertilizer
used within the last year.
To determine K concentration in the plant, tissue samples were taken at V5 (5th trifoliate)
and R2 (full bloom), (Fehr and Caviness, 1977). At V5, samples consisted of 10 plants at
random locations from each plot in 2013 and 1 m of row from each plot in 2014. Twenty
uppermost, fully developed soybean trifoliate leaves were randomly collected at the R2 stage
from each plot in 2013 and 2014. Plant tissue for all V5 plants and R2 leaves were dried at 60o
C, then ground using a Wiley Mill grinder with a 0.5 mm screen. Samples were then digested
using EPA 3050 B and analyzed using ICAP.
46
Soybean was harvested at full maturity (R8) after seed moisture approached 130 g H2O
kg-1 of seed using a small plot research combine equipped with scale and moisture tester. In
2013, plots were harvested with a 1.2 m-combine head, collecting seed from rows two through
four in 30 cm-row tests and rows two through seven in 19 cm-row tests. In 2014, plots were
harvested with a 1.5 m-combine head, collecting seed from rows two through five in 38-cm row
experiments and rows two through nine in 19-cm experiments. Seed yield was adjusted to 130 g
H2O kg-1.
Data were subjected to analysis of variance using the PROC GLM procedure of SAS.
Fixed effects were K fertilizer rates and random effects were replications. A single degree of
freedom contrast comparing the yield of soybean receiving no K against the average yield of
soybean fertilized with K was performed to classify each site-year as responsive or unresponsive
to K fertilization. Yield responses were interpreted as significant at P < 0.10.
Soil test K levels were somewhat variable between replications at some sites; therefore,
soil test K and relative yields were not averaged over replications to perform regression analysis.
To obtain relative yields, the unfertilized controls (0 kg K2O ha-1) were divided by the highest
yielding treatments receiving potassium fertilizer within each replication and multiplied by 100.
Linear and quadratic relationships between relative seed yields and soil test K, V5 plant tissue,
and R2-stage trifoliate-leaf tissue were defined using the PROC REG procedures of SAS 9.4.
The Student’s residual (<-2.5 and >2.5) and Cook’s D statistics were used to identify outlying
and influential observations, respectively. The outlying or influential observations were omitted
from the dataset when appropriate and the model refit. Linear-plateau models were also fit to the
same data using the PROC NLIN procedure of SAS 9.4. From these relationships, maximum
relative yields were defined as 5% less than the predicted maximum for quadratic models or as

47
the maximum value of each dependent variable defined by the predicted plateau of linear or
quadratic-plateau models. When applicable, maximum yield definitions were used to identify
the critical soil K availability index or tissue K concentration.
Calibration of K rates needed to maximize soybean yield was performed using linear and
non-linear regression techniques. Analysis of variance was performed with yield data from each
site. The minimum K fertilizer rate to maximize yield were determined by using Fisher’s
protected LSD at P <0.10. The minimum K fertilizer rate that resulted in maximum yield for
each site-year was regressed against the corresponding soil test K. Calibration was also
performed with multiple regression techniques that included linear and quadratic terms for the
soil test K and K fertilizer rate. For this calibration, relative yields were determined by
determining treatment means within each test and dividing the each yield by the highest yielding
treatment in the test, then multiplying by 100. A significance level of P = 0.10 was used to
include or exclude terms from the model.
Results and Discussion
Soil Testing
Soil test potassium (STK) at 0 to 15 cm depth ranged from 30 to 177 mg K kg-1 across
the 14 sites (Table 3.1). Soil test K concentrations are generally thought to decrease with depth
(Fernandez et al., 2008). However, unchanging or greater STK concentrations at deeper depths
may indicate the cation exchange capacity (CEC) of sandy textured topsoil is not adequate to
hold K nutrients and therefore results in leaching into finer textured and higher CEC soil
horizons (Fagaria, 2009; Evanylo, 1991). In our experiments, sites 4, 5, 6, 7, 9 and 10 decreased
in STK with increasing depth (Table 3.3). These sites contained relatively high CEC values (4.4
to 9.4 g kg-1) at the 0 to 15 cm sampling depth; therefore, these soils likely allowed K to be

48
maintained and not leached into the subsoil. In contrast, site 1decreased slightly from 94 to 78
mg K kg-1 between 15 and 30 cm but then increased to 101 mg K kg-1 at the 30 to 60 cm depth.
Similarly, STK at site 2 remained relatively unchanged through 30 cm with 83 to 87 mg K kg-1
and decreased only slightly to 71 mg K kg-1 at the 30 to 60 cm sampling depth. Sites 13 and 14
varied little until 30 cm where STK increased somewhat from approximately 30 mg K kg-1 to 41
and 50 mg K kg-1, respectively. Soil test K at the remaining four sites changed little throughout
60 cm. The CEC of these soils was less than 5 g kg-1 and varied little between sampling depths;
thereby explaining unchanging or increasing STK at greater depths.
Wheat Straw
Wheat yields from 2013 (sites 4 through 9), calculated from the 1 m2 sample, were much
less than 2014 (Table 3.4). Stem and chaff biomass in 2013 yielded 55 % of that in 2014 on
average, but grain yield in 2013 averaged only 12 % of that in 2014. Although above average
rainfall between physiological maturity and harvest in 2013 (Table 3.2) may have lowered grain
test weight, it did not likely lower it to that extent. In 2013, much grain was lost when the
mechanical thresher was used and this is probably the reason for the poor grain yield. Therefore,
the amount of K removed by the grain per ha is not likely correct. However, the concentration of
K in the grain in 2013 ranged from 3.4 to 4.4 g kg-1, nearly 50 % greater than the grain K
concentration in 2014 where it ranged from 2.2 to 2.9 g kg-1. Due to greater yield in 2014, the
straw and chaff removed 40 % more K per ha than in 2013. Still, the concentration of K in straw
and chaff was nearly 30 % greater in 2013. Although there appears to be relationship between K
removed in the straw and STK, the relationship within year is minimum (Fig. 3.1).
49
Soybean Yield
Potassium fertilizer increased soybean yield at only one of the 14 sites (Table 3.5). At
that site (site 11 in Accomack), the yield response was quadratic and maximized at 156 kg K2O
ha-1 (Fig. 3.2a). In contrast, yield declined in a quadratic manner at site 12 (Fig. 3.2b). Soil test
levels at all depths were approximately equal (Table 3.3). Site 11 was planted to cucumbers in
the previous year and site 12 was planted to squash. This difference may have affected the
response, but it is not likely. Straw was not removed from site 11; therefore, more K should
have been available than at site 12, where straw was removed.
Soil test K at the 0 to 15 sampling depth at the two responsive sites was 65 and 56 mg K
kg-1 at sites 11 and 12, respectively (Table 3.3). The remaining unresponsive sites had STK
values from 30 to 177 mg K kg-1, of which two were classified as low, five were classified as
medium, and five were classified as high. Yield response is expected in low STK soils,
sometimes in medium STK soils and almost never in high STK soils (Donahue, 2000).
Therefore, yield response was not expected in the five high STK soils but a positive yield
response was expected in the two low STK soils and at least 50 % of the medium STK soils.
However, with the exception of site 10, STK remained relatively constant with depth for soils
classified as medium. Furthermore, STK increased at the 30 to 60 cm depth at sites 13 and 14,
where the soil was classified as low. This could partially explain why there was no response to
yield at the low and medium testing sites. In addition, soybean in these experiments was rarely
under water stress. Zorb et al. (2014) stated that K plays a prominent role in crop resistance to
dought due to its roles in turgor generation, primary metabolism, and long-distance transport.
Without at least some intermittent drought stress, lack of adequate STK may not affect yield in
as great of an extent. In contrast to these results, studies in Iowa showed positive response to

50
K2O fertilizer at four of 10 sites (Clover and Mallarino, 2013) and, in Arkansas on silt loam soils,
21 of 34 sites responded to K2O fertilizer (Slaton et al., 2010). Soil test K concentrations of the
Iowa sites ranged from 41 to 131 kg K ha-1 and 41 to 131 mg K ha-1 in Arkansas. However,
these studies were not conducted under double-crop systems. Furthermore, the lower CEC soils
that are prominent in the Coastal Plain and Piedmont regions of Virginia may respond differently
to K fertilization than silty loam soils similar to those in Iowa and Arkansas.
Lack of yield response to K2O fertilizer could also be attributed to variability of STK
between replicates in some experiments. Standard errors are listed in Table 3.3 for STK levels at
each sampling depth. For example, average STK at site 2 was 83 mg K kg-1 with a standard
error of 8.34 at 0 to 15 cm. However, compared to the full season standard errors in Chapter 2,
this variability was minimal. For instance, site 7 in full season had average STK at 0 to 15 cm of
37 mg K kg-1 with a standard error of 14.4.
Still due to some variability among replications at some sites, four unfertilized control
relative yields were calculated from each experiment by using the greatest yield within each
replication. The corresponding STK values for each replication, along with control plot relative
yields were used for regression analysis rather than using relative yields and STK values
averaged across replicates to determine soil supply nutrient sufficiency. Relative soybean yield
increased at a diminishing rate to a maximum relative yield of 91% at STK of 120 mg K kg-1 for
straw remaining sites (Fig. 3.3a) and a maximum relative yield of 98% at an STK of 116 mg K
kg-1 for straw removed sites (Fig. 3.2b) according to the quadratic model. Maximum yield is
defined here as the maximum yield predicted minus 5%. Therefore, the critical STK
concentration to produce 86% relative yield for straw remaining was 49 mg K kg-1 and to
produce 93% relative yield for straw removed was 70 mg K kg-1 to produce 93% relative yield.

51
It must be noted that R2 values indicated that only 5 and 18% of the variability; therefore, there is
little confidence in these responses. Although these critical levels are similar to full-season
soybean (Chapter 2) where the critical level was estimated to be 88 mg K kg-1, it is not likely
accurate since only one of the 14 sites actually responded to K2O fertilizer. Furthermore,
nonlinear regression did not fit these data. The linear portion of the linear plateau model for full-
season soybean (Chapter 2) was from 0 to 38.8 mg K kg-1, but only two sites in this study (Table
3.3) had STK in this range. Therefore, the lack of low STK experimental sites in this dataset
could also explain why there was little to no soybean yield response to STK.
V5 Tissue Concentration
Total K uptake in K2O fertilized soybean at the V5 growth stage was greater than the no
K2O fertilizer control in eight of fourteen sites, even though there was not a consistent yield
response at six of those sites (Table 3.6). Although a yield response did not always occur,
soybean was utilizing soil applied K fertilizer for growth and development. Still, neither the
quadratic model nor the linear plateau model fit these data and a critical V5 plant concentration
could not be determined (Fig. 3.4). Plant K concentration values at V5 ranged from 23 to 35 and
17 to 36 g K kg-1 for straw remaining and straw removed, respectively. Relative yield ranged
between 75 and 99%. The plant K concentrations determined in our study are comparable to
Sabbe et al.’s (2011) research as our soybean V5 K concentrations (Table 3.6) fall within or
above the sufficiency range (15 to 22.5 g K kg-1) for young soybean.
R2 Tissue Concentration
Plant K concentration at R2 responded to K fertilizer at four out of fourteen sites and was
almost significant at sites 3 and 7 with P-values of 0.1008 and 0.1075, respectively, (Table 3.7).
Sites 8, 10, 13 and 14 had significant increase in K concentration at both V5 and R2 growth
52
stages. However, sites 4, 9 and 12 were significant at V5 but not R2. Neither quadratic nor
linear plateau models fit the data when soybean relative yield was regressed against plant K
concentration at R2 (Fig. 3.5). There were little to no deficiency symptoms present throughout
the 2013 and 2014 soybean seasons. Plant K concentrations for R2 ranged from 13 to 31 or 20 to
28 g K kg-1 for straw remaining or straw removed, respectively (Figs. 3.5 a and b, Table 3.7.
Critical R2 trifoliate concentration for maximum relative yield of 82% was determined to be 24.6
g K kg-1 (Chapter 2, Fig. 2.3) for full-season soybean in Virginia and northeast North Carolina.
According to this critical concentration, double-crop R2 samples were sufficient at nine of
fourteen sites in at least one treatment (Table 3.7).
Fertilizer 2Calibration
Calibration of K fertilizer rate necessary to achieve highest yield is not included in the
results because neither model was significant. There were only two yield-significant sites for the
double-crop experiment and therefore not enough data to produce accurate results.
Conclusions
Potassium fertilization increased yield at only one of 14 sites. Although relative yield
responded quadratically to STK, the R2 was very low; therefore, little of the variability in the
data could be explained by this relationship. With neither linear nor non-linear models fitting the
data, the critical STK concentration at which yield would no longer respond to K fertilizer could
not be determined.
Our plant tissue analysis for V5 and R2 did support our hypothesis that no yield decrease
would occur if plant K concentration ranged between 17.5 and 25 g K kg-1. The double-crop
range of plant K concentration for V5 was between 17 and 35 g K kg-1 with the straw removed
and between 23 to 35 g K kg-1 with straw remaining. Flowering stage (R2) tissue samples
53
revealed that only site 13, where the STK was low, had K concentrations less than 17.5 g K kg-1
when no K2O was applied.
There was sufficient rainfall at most sites in 2013 and 2014, which could have relieved
plant stress that is typical in hot, dry summers. There would be less access to soil K, therefore
less uptake in drier years. Furthermore, due to lack of stress, K’s role in drought resistance was
not likely expressed in these experiments. Therefore, 0 to 15 cm sampling depths may not reflect
the total amount of K available to soybean and might not be adequate for low CEC soils.
Due to the lack of soybean yield response to K2O fertilizer, a calibration curve could not
be developed with these data. More data is needed, especially at low STK levels and drier
environments to complete this research. We plan to conduct research in 2015 at four sites, and
hopefully gain responsive data so that a calibration curve can be developed and compared to
current Virginia Cooperative Extension recommendations guidelines.
54
References
Clover, M.W. and A.P. Mallarino. 2012. Corn and soybean tissue potassium content responses
to potassium fertilization and relationships with grain yield. Soil Sci. Soc. Am. J. 77:630-
642.
Coale, F. J. and J.H. Grove. 1991. Potassium utilization by no-till full-season and double-crop
soybean. Agron. J, 83, 190-194.
Donohue, S.J. 2000. Soil testing and plant analysis. In D.E. Brann, D.L. Holshouser, and G.L.
Mullins, editors, Agronomy Handbook. Virginia Cooperative Ext. publ. 424-100,
Blacksburg, VA. pp. 75-86.
Evanylo, G.K. 1991. Potassium fertilization of doublecropped wheat and soybean under two
tillage systems. J. Prod. Agric. 4:555-562.
Fageria, N.K. 2009. Potassium. In: N.K. Faeria, editor, The use of nutrients in crop plants.
CRC Press, Boca Raton, FL. pp. 121-164.
Farmaha, B.S., F.G. Fernandez and E.D. Nafziger. 2012. Soybean seed composition,
aboveground growth, and nutrient accumulation with phosphorus and potassium
fertilization in no-till and strip-till. Agron. J, 104, 1006-1015.
Farno, L.A., L.H. Edwards, K. Keim, and F.M. Epplin. 2002. Economic analysis of soybean-
wheat cropping systems. Online Crop Management Doi: 10.1094/CM-2002-0816-01-RS.
Fehr, W.R. and C.E. Caviness. 1977. Stages of soybean development. Spec. Rep. 80. Iowa
Agric. Home Econ. Exp. Stn., Iowa State Univ., Ames, IA.
Fernandez, F. G., Brouder, S.M, Beyrouty, C.A., Volenec and J.J. Hoyum, R.2008. Assessment
of plant-available potassium for no-till, rain fed soybean. Soil Sci. Soc. Am. J. 72:1085-
1095.
55
Havlin, J. L., J.D. Beaton, S.L. Tisdale and W.L. Nelson. 2004. Potassium soil fertility and
fertilizers: an introduction to nutrient management. Upper Saddle River, NJ: Pearson,
Prentince Hall, 2005. 199-218
Heckman, J.R. and E.J. Kamprath. 1995. Potassium accumulation and soybean yield related to
potassium fertilizer rate and placement. Communication in soil science and plant
analysis. 26:1&2, 123-143.
National Agricultural Statistics Service. 2012. Acreage. USDA, NASS. 15-16.
SAS Institute. 2013. SAS v. 9.4. SAS Inst, Cary, NC.
Shingles, R. and R.E. McCarty. 1994. Direct measure of ATP-dependent proton concentration
changes and characterization of a K+ -stimulated ATPase in pea chloroplast inner
envelope vesicles. Plant Physiol 106:731-737.
Slaton, N. A., B.R. Golden, R.E. DeLong and M. Mozaffari. 2010. Correlation and calibration of
soil potassium availability with soybean yield and trifoliate potassium. Soil Sci. Soc. Am.
J. 74:1642-1651.
Talbott, L.D., S.M. Assmann and E. Zeiger. 1998. Potassium and sucrose in guard cell
osmoregulation. In: Oosterhuis DM and Berkowitz GA (eds) Fronteirs in Potassium
Nutrition: New Perspectives on the Effects of Potassium on Physiology of Plants. Potash
and Phosphate Institute, Norcross, GA; and Potash and Phosphate Institute of Canada,
Saskatoon, Canada pp 53-62.
Tarkalson, D.D., B. Brown, H. Kok, and D.L. Bjorneberg. 2009. Impact of removing straw
from wheat and barley fields: a literature review. Better Crops. 93(3):17-19.
Tiwari, S. P., O.P. Joshi, A.K. Vyas and S.D. Billore. 2001. Potassium nutrition in yield and
quality improvement of soybean. 307-320 www.ipipotash.org
56
Withers, P.J.A. 1991. Removal of phosphorus and potassium from the soil in wheat and barley
straw. Agr. Sci. J. 117:221-224
Woodruff, J.R. and C.L. Parks. 1980. Topsoil and subsoil potassium calibration with leaf
potassium for fertility rating. Agron. J. 72:392-396.
Yin, X. and T.J. Vyn. 2003. Potassium placement effects on yield and seed composition of no-till
soybean seeded in alternate row widths. Agron. J, 95, 126-132.
Yin, X. and T.J. Vyn. 2004. Critical Leaf Potassium Concentrations for Yield and Seed Quality
of Conservation-Till Soybean. Soil Sci. Soc. Am. J. 6:1626-1634.
Zorb, C. M. Senbayram, and E. Peter. 2014. Potassium in agriculture – status and perspectives.
J. Plant Physiol. 171:656-669.
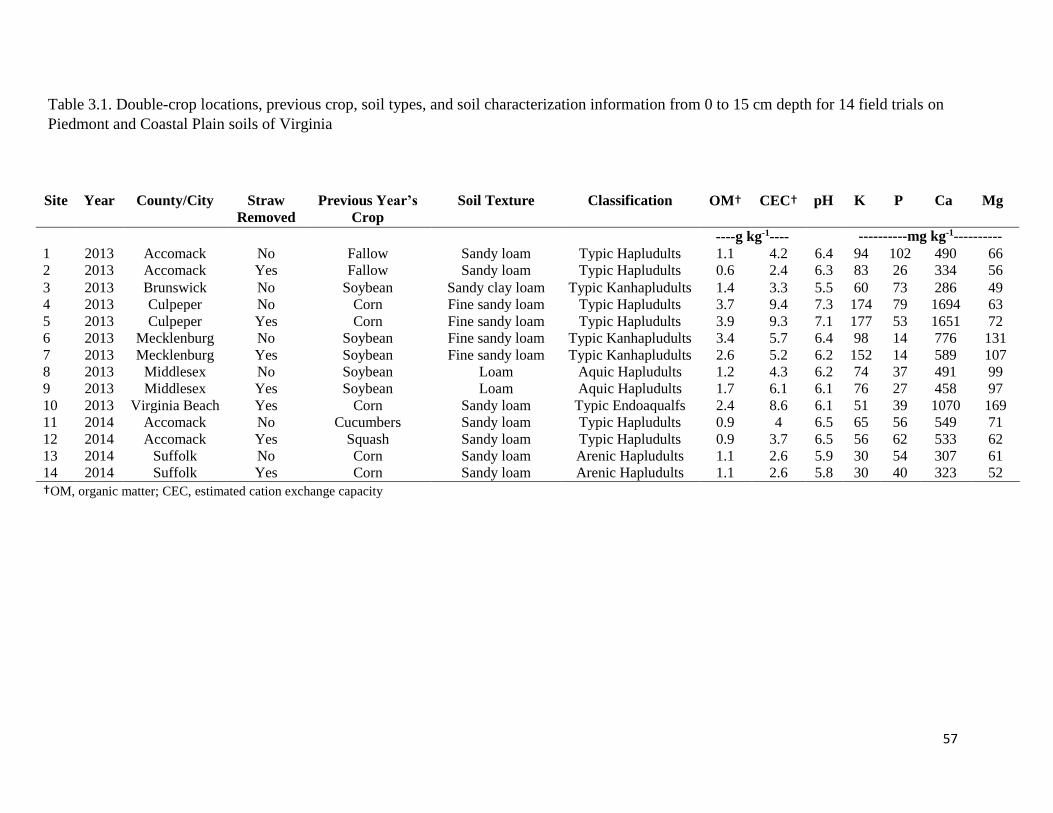
57
Table 3.1. Double-crop locations, previous crop, soil types, and soil characterization information from 0 to 15 cm depth for 14 field trials on
Piedmont and Coastal Plain soils of Virginia
Site Year County/City Straw
Removed
Previous Year’s
Crop
Soil Texture Classification OM† CEC† pH K P Ca Mg
----g kg-1---- ----------mg kg-1----------
1 2013 Accomack No Fallow Sandy loam Typic Hapludults 1.1 4.2 6.4 94 102 490 66
2 2013 Accomack Yes Fallow Sandy loam Typic Hapludults 0.6 2.4 6.3 83 26 334 56
3 2013 Brunswick No Soybean Sandy clay loam Typic Kanhapludults 1.4 3.3 5.5 60 73 286 49
4 2013 Culpeper No Corn Fine sandy loam Typic Hapludults 3.7 9.4 7.3 174 79 1694 63
5 2013 Culpeper Yes Corn Fine sandy loam Typic Hapludults 3.9 9.3 7.1 177 53 1651 72
6 2013 Mecklenburg No Soybean Fine sandy loam Typic Kanhapludults 3.4 5.7 6.4 98 14 776 131
7 2013 Mecklenburg Yes Soybean Fine sandy loam Typic Kanhapludults 2.6 5.2 6.2 152 14 589 107
8 2013 Middlesex No Soybean Loam Aquic Hapludults 1.2 4.3 6.2 74 37 491 99
9 2013 Middlesex Yes Soybean Loam Aquic Hapludults 1.7 6.1 6.1 76 27 458 97
10 2013 Virginia Beach Yes Corn Sandy loam Typic Endoaqualfs 2.4 8.6 6.1 51 39 1070 169
11 2014 Accomack No Cucumbers Sandy loam Typic Hapludults 0.9 4 6.5 65 56 549 71
12 2014 Accomack Yes Squash Sandy loam Typic Hapludults 0.9 3.7 6.5 56 62 533 62
13 2014 Suffolk No Corn Sandy loam Arenic Hapludults 1.1 2.6 5.9 30 54 307 61
14 2014 Suffolk Yes Corn Sandy loam Arenic Hapludults 1.1 2.6 5.8 30 40 323 52
†OM, organic matter; CEC, estimated cation exchange capacity

58
Table 3.2. Average monthly temperature (°C) and rainfall (cm) obtained from closest weather
station to each double-crop site. Surplus or deficit of rainfall, compared to 30-year average, is
listed in parentheses.
Site(s) Location May June July August September October
1, 2 Accomack
Rain 2.3 (-6.1) 9.5 (-0.5) 6.2 (-6.6) 7.1 (-3.8) 2.7 (-7.3) 10.2 (1.1)
Temp 19.4 (0.8) 24.3 (0.8) 27.4 (1.5) 24.3 (-0.6) 20.7 (-0.9) 18.9 (2.9)
4, 5 Culpeper
Rain 8.0 (-2.6) 24.7 (14.4) 20.0 (11.6) 9.7 (1.9) 12.8 (1.4) 8.8 (0.8)
Temp 17.7 (0.8) 23.2 (1.4) 25.6 (1.6) 23.7 (0.4) 20.7 (1.5) 16.2 (2.8)
3,6,7 Brunswick, Mecklenburg
Rain 3.1 (-6.3) 16.8 (7.0) 14.5 (2.4) 3.0 (-8.7) 3.4 (-7.5) 4.0 (-3.5)
Temp 17.6 (-1.1) 24.2 (0.7) 26.1 (0.7) 24.0 (-0.4) 21.1 (0.4) 16.3 (1.7)
8,9 Middlesex
Rain 7.2 (-3.3) 20.6 (11.6) 13.7 (2.1) 9.8 (-2.0) 2.6 (-8.1) 5.7 (-3.1)
Temp 18.6 (-0.7) 23.8 (-0.1) 26.1 (0.1) 24.3 (-0.8) 20.8 (-0.6) 16.8 (1.3)
10 VA Beach
Rain 4.5 (-4.0) 4.5 (-6.0) 24.9 (12.3) 5.9 (-7.2) 16.8 (6.4) 3.0 (-5.7)
Temp 23.0 (4.2) 25.6 (2.0) 26.9 (0.8) 26.1(0.9) 24.5 (2.4) 19.0 (2.5)
11,12 Accomack
Rain 11.8 (3.4) 5.4 (-4.6) 8.3 (-4.5) 5.6 (-5.3) 10.1 (0.1) 3.4 (-5.8)
Temp 18.6 (0.0) 22.1 (-1.4) 23.7 (-2.2) 22.4 (-2.4) 20.7 (-0.9) 15.8 (-0.2)
13, 14 Suffolk
Rain 6.6 (-3.2) 8.8 (-2.3) 16.1 (3.0) 5.6 (-8.9) 15.3 (1.8) 3.1 (-6.1)
Temp 20 (0.7) 23.1 (-0.8) 24.1 (-1.9) 23.2 (-1.8) 21.65 (-0.2) 16.1 (-0.2)

59
Table 3.3. Average Mehlich-I extractable K, standard error and estimated CEC at three sampling
depths for 14 sites of double-crop soybean studies in Piedmont and Coastal Plain of North
Carolina and Virginia
Site Year County/City Straw
Removed
0-15 cm 15-30 cm 30-60 cm
CEC† Soil K ‡ CEC† Soil K ‡ CEC† Soil K ‡
g kg-1 mg K kg-1 g kg-1 mg K kg-1 g kg-1 mg K kg-1 1 2013 Accomack No 4.2 94 ± 5.5 3.8 78 ± 3.4 4.2 101 ± 7.6
2 2013 Accomack Yes 2.4 83 ± 8.3 2.8 87 ± 3.4 2.8 71 ± 2.9
3 2013 Brunswick No 3.3 60 ± 1.3 3.1 59 ± 5.8 5.8 64 ± 4.6
4 2013 Culpeper No 9.4 174 ± 3.9 6.3 90 ± 1.7 5.1 50 ± 6.3
5 2013 Culpeper Yes 9.3 177 ± 3.0 6.3 76 ± 4.1 4.8 49 ± 0.8
6 2013 Mecklenburg No 5.2 98 ± 3.9 4.9 48 ± 6.4 5.3 37 ± 9.9
7 2013 Mecklenburg Yes 5.7 152 ± 8.1 4.3 115 ± 4.0 3.7 78 ± 3.5
8 2013 Middlesex No 4.3 74 ± 3.7 3.8 66 ± 2.3 4.6 67 ± 1.7
9 2013 Middlesex Yes 4.4 76 ± 6.3 3.9 66 ± 2.3 4.8 58 ± 3.7
10 2013 Virginia Beach Yes 8.6 51 ± 1.9 5.8 21 ± 0.9 4.7 16 ± 0.3
11 2014 Accomack No 4.0 65 ± 3.7 4.2 75 ± 5.5 4.1 73 ± 2.7
12 2014 Accomack Yes 3.7 56 ± 0.5 3.7 66 ± 1.6 3.9 72 ± 2.3
13 2014 Suffolk No 2.6 30 ± 2.1 1.9 33 ± 4.2 1.8 41 ± 3.4
14 2014 Suffolk Yes 2.6 30 ± 2.1 1.5 28 ± 2.0 1.6 50 ± 6.9
† CEC – estimated Cation Exchange Capacity
‡ Soil K concentration, mg K kg-1 ± Standard Error

60
Table 3.4. Wheat grain yield, stem and chaff biomass and K removal at 10 double-crop sites in
Virginia
Site Soil Grain
Yield
Grain
K Uptake
Stem + Chaff
Biomass
Stem + Chaff K
Uptake
---mg K kg-1--- --kg ha-1-- --kg K ha-1-- ---- kg-1 K ---- ----kg K ha-1----
4,5† 175 645.5 2.4 3918.9 47.7
6 98 950.2 4.2 4696.3 32.0
7 138 756.6 2.6 4586.2 50.8
8,9† 75 1252.3 4.7 5482.9 45.7
11 65 7803.6 18.4 7766.1 64.3
12 56 8253 18.5 8819.9 74.1
14 65 8040.8 23.2 9763.8 66.6
15 30 6005.6 14.8 7503.9 37.8
† Sites 4,5 and 8,9 were within the same field; therefore only one sample was collected.

61
Table 3.5. Double-crop soybean actual and relative yields as affected by K fertilizer rate at 19
site years on Coastal Plain and Piedmont soils of Virginia.
K2O Fertilizer Rate, kg ha-1
Site No. RY† 0 28 56 112 168 224 Sdf ‡ LSD
-%- -------------------------------kg ha-1------------------------------- Pr>F kg K ha-1
1 90 2885 3096 2909 2894 2672 2541 0.691 NS§
2 89 2488 2570 2362 2540 2441 2579 0.9009 NS
3 93 2242 2158 2302 2183 2290 2164 0.7898 NS
4 91 2719 2830 2427 2658 2725 2516 0.6279 NS
5 92 2919 2905 2949 2943 2878 2964 0.925 NS
6 82 1959 2091 2248 2076 2190 1787 0.4355 NS
7 91 2170 2178 2185 2128 2249 1966 0.8324 NS
8 93 2573 2604 2533 2470 2493 2547 0.5336 NS
9 95 2761 2752 2761 2770 2729 2739 0.8832 NS
10 94 3378 3373 3332 3302 3302 3304 0.7153 NS
11 80 3025 3310 3494 3503 3237 3531 0.0299 462
12 99 3311 3229 2998 2815 2958 2908 0.0213 290
13 82 2470 2454 2595 2549 2626 2547 0.7453 NS
14 78 1641 1833 1760 1805 1731 1734 0.5032 NS
† RY, relative yield of soybean receiving no K fertilizer compared to maximum numerical yield of soybean
receiving K fertilizer
‡ sdf, single-degree-of-freedom contrast P value comparing the yield of soybean receiving no K to the yield
of soybean receiving K
§ NS, not significant (P>0.10)

62
Table 3.6. Mean actual whole plant K concentration at V5 growth stage of double crop soybean
as affected by K fertilizer rates at 14 sites on Piedmont and Coastal Plain soils of Virginia.
K2O Fertilizer Rate, kg ha-1
Site 0 28 56 112 168 224 Sdf† LSD
----------------g K kg-1---------------- Pr>F g K kg-1
1 32.4 32.6 31.2 30.3 30.9 31.8 0.2933 2.1
2 26.9 24.5 25.7 26.2 23.9 26.1 0.3055 3.5
3 24.0 24.1 23.8 26.1 27.0 28.3 0.0500 1.9
4 33.0 33.6 33.8 32.7 33.2 32.5 0.9221 2.5
5 35.6 33.8 34.6 33.7 32.9 32.4 0.0925 2.7
6 27.8 27.0 27.1 27.7 26.9 25.5 0.3319 2.2
7 29.9 30.5 30.3 30.2 30.8 30.0 0.3869 1.3
8 32.2 32.9 33.1 33.7 34.6 32.6 0.0800 1.5
9 28.8 33.4 32.2 32.0 31.8 33.0 0.0006 1.9
10 17.6 19.6 20.2 20.9 20.4 21.6 0.0211 2.6
11 24.8 24.1 23.4 25.6 24.4 25.4 0.9077 3.0
12 19.5 22.3 20.6 24.1 23.1 23.5 0.0777 3.9
13 24.3 29.0 28.9 32.8 31.1 31.4 <.0001 2.8
14 22.1 28.6 29.7 30.0 31.8 33.7 <.0001 3.0
† sdf, single-degree-of-freedom contrast P value comparing the yield of soybean
receiving no K to the yield of soybean receiving K
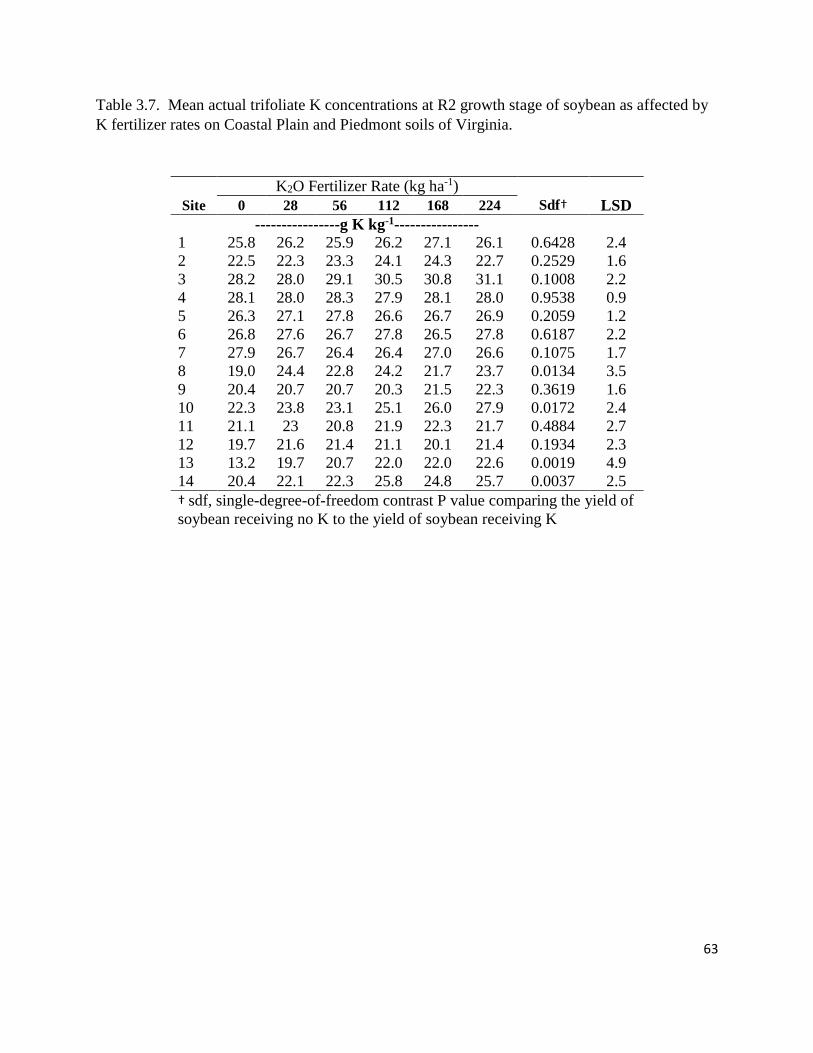
63
Table 3.7. Mean actual trifoliate K concentrations at R2 growth stage of soybean as affected by
K fertilizer rates on Coastal Plain and Piedmont soils of Virginia.
K2O Fertilizer Rate (kg ha-1)
Site 0 28 56 112 168 224 Sdf† LSD
----------------g K kg-1----------------
1 25.8 26.2 25.9 26.2 27.1 26.1 0.6428 2.4
2 22.5 22.3 23.3 24.1 24.3 22.7 0.2529 1.6
3 28.2 28.0 29.1 30.5 30.8 31.1 0.1008 2.2
4 28.1 28.0 28.3 27.9 28.1 28.0 0.9538 0.9
5 26.3 27.1 27.8 26.6 26.7 26.9 0.2059 1.2
6 26.8 27.6 26.7 27.8 26.5 27.8 0.6187 2.2
7 27.9 26.7 26.4 26.4 27.0 26.6 0.1075 1.7
8 19.0 24.4 22.8 24.2 21.7 23.7 0.0134 3.5
9 20.4 20.7 20.7 20.3 21.5 22.3 0.3619 1.6
10 22.3 23.8 23.1 25.1 26.0 27.9 0.0172 2.4
11 21.1 23 20.8 21.9 22.3 21.7 0.4884 2.7
12 19.7 21.6 21.4 21.1 20.1 21.4 0.1934 2.3
13 13.2 19.7 20.7 22.0 22.0 22.6 0.0019 4.9
14 20.4 22.1 22.3 25.8 24.8 25.7 0.0037 2.5
† sdf, single-degree-of-freedom contrast P value comparing the yield of
soybean receiving no K to the yield of soybean receiving K
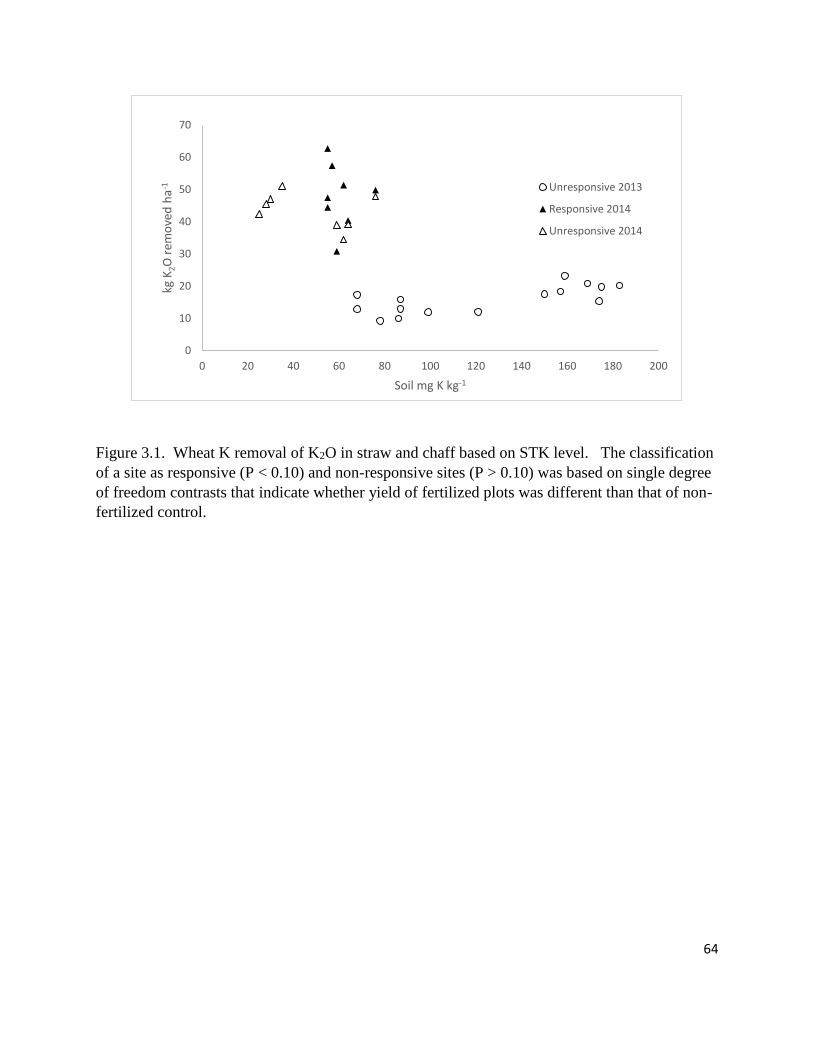
64
Figure 3.1. Wheat K removal of K2O in straw and chaff based on STK level. The classification
of a site as responsive (P < 0.10) and non-responsive sites (P > 0.10) was based on single degree
of freedom contrasts that indicate whether yield of fertilized plots was different than that of non-
fertilized control.
0
10
20
30
40
50
60
70
0 20 40 60 80 100 120 140 160 180 200
kg K
2O r
emo
ved
ha-1
Soil mg K kg-1
Unresponsive 2013
Responsive 2014
Unresponsive 2014
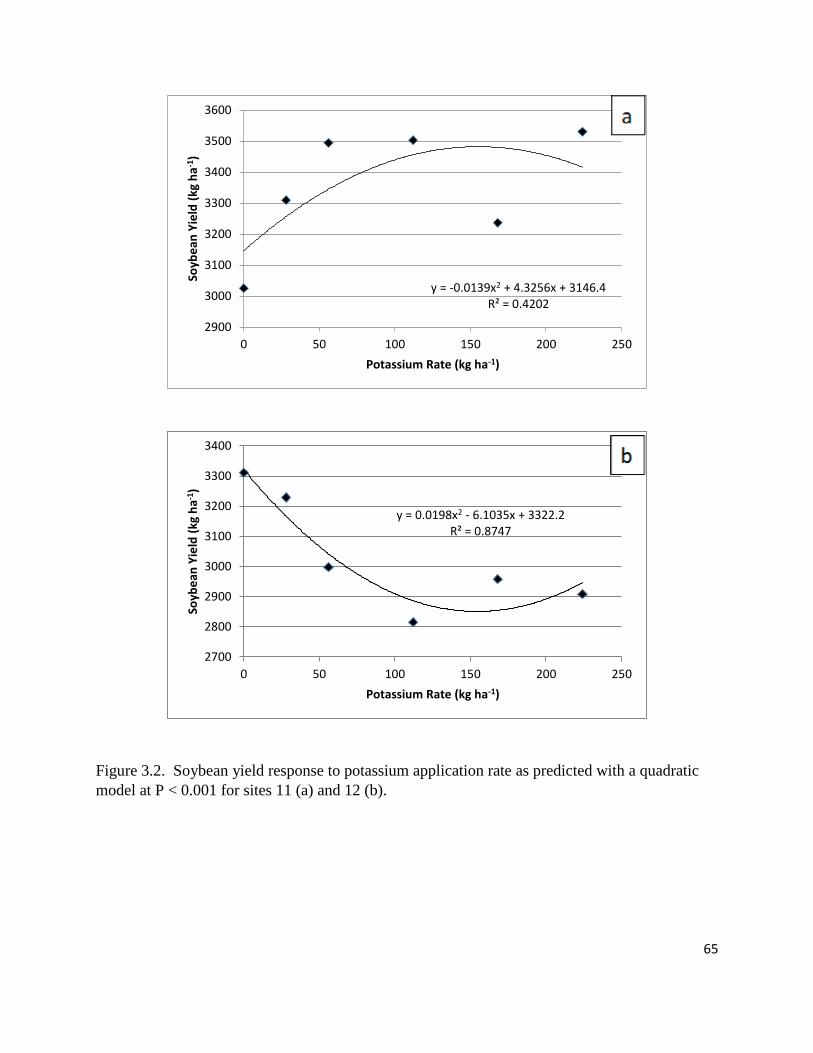
65
Figure 3.2. Soybean yield response to potassium application rate as predicted with a quadratic
model at P < 0.001 for sites 11 (a) and 12 (b).
y = -0.0139x2 + 4.3256x + 3146.4R² = 0.4202
2900
3000
3100
3200
3300
3400
3500
3600
0 50 100 150 200 250
Soyb
ean
Yie
ld (
kg h
a-1
)
Potassium Rate (kg ha-1)
y = 0.0198x2 - 6.1035x + 3322.2R² = 0.8747
2700
2800
2900
3000
3100
3200
3300
3400
0 50 100 150 200 250
Soyb
ean
Yie
ld (
kg h
a-1)
Potassium Rate (kg ha-1)
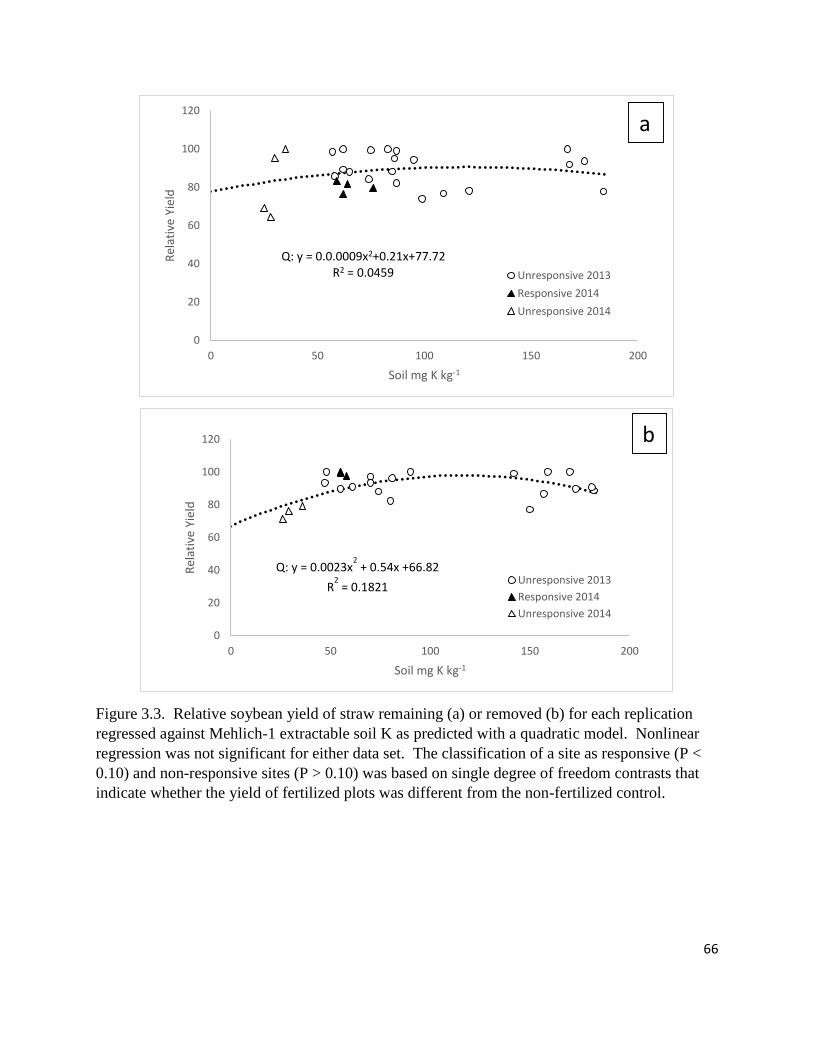
66
Figure 3.3. Relative soybean yield of straw remaining (a) or removed (b) for each replication
regressed against Mehlich-1 extractable soil K as predicted with a quadratic model. Nonlinear
regression was not significant for either data set. The classification of a site as responsive (P <
0.10) and non-responsive sites (P > 0.10) was based on single degree of freedom contrasts that
indicate whether the yield of fertilized plots was different from the non-fertilized control.
0
20
40
60
80
100
120
0 50 100 150 200
Rel
ativ
e Yi
eld
Soil mg K kg-1
Unresponsive 2013
Responsive 2014
Unresponsive 2014
Q: y = 0.0.0009x2+0.21x+77.72R2 = 0.0459
0
20
40
60
80
100
120
0 50 100 150 200
Rel
ativ
e Yi
eld
Soil mg K kg-1
Unresponsive 2013
Responsive 2014
Unresponsive 2014
Q: y = 0.0023x2 + 0.54x +66.82
R2 = 0.1821
a
b
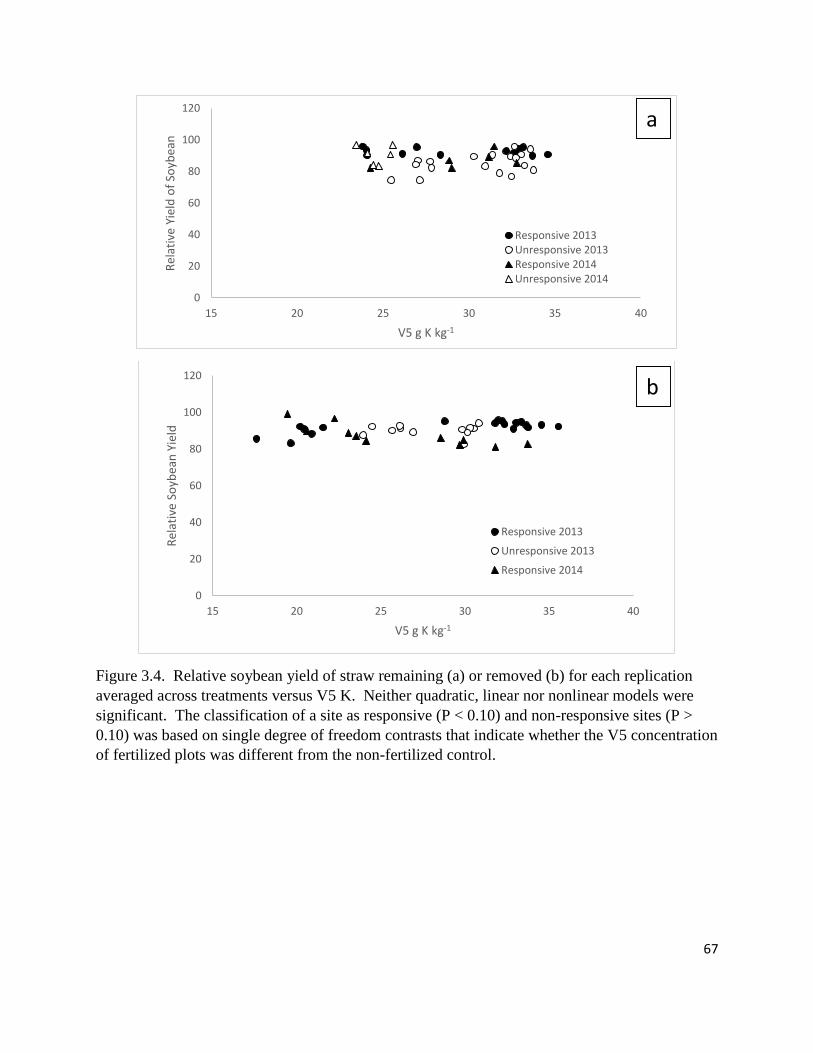
67
Figure 3.4. Relative soybean yield of straw remaining (a) or removed (b) for each replication
averaged across treatments versus V5 K. Neither quadratic, linear nor nonlinear models were
significant. The classification of a site as responsive (P < 0.10) and non-responsive sites (P >
0.10) was based on single degree of freedom contrasts that indicate whether the V5 concentration
of fertilized plots was different from the non-fertilized control.
0
20
40
60
80
100
120
15 20 25 30 35 40
Rel
ativ
e Yi
eld
of
Soyb
ean
V5 g K kg-1
Responsive 2013Unresponsive 2013Responsive 2014Unresponsive 2014
0
20
40
60
80
100
120
15 20 25 30 35 40
Rel
ativ
e So
ybea
n Y
ield
V5 g K kg-1
Responsive 2013
Unresponsive 2013
Responsive 2014
a
b

68
Figure 3.5. Relative soybean yield of straw remaining (a) or removed (b) for each replication
versus R2 K. Neither quadratic, linear nor nonlinear models were significant. The classification
of a site as responsive (P < 0.10) and non-responsive sites (P > 0.10) was determined from single
degree of freedom contrasts that indicate whether the R2 concentration of fertilized plots was
different from the non-fertilized control.
0
20
40
60
80
100
120
10 15 20 25 30 35
Soyb
ean
Rel
ativ
e Yi
eld
R2 g K kg-1
Responsive 2013
Unresponsive 2013
Responsive 2014
Unresponsive 2014
0
20
40
60
80
100
120
10 15 20 25 30
Soyb
ean
Rel
ativ
e Yi
eld
R2 g K kg-1
Responsive 2013
Unresponsive 2013
Responsive 2014
a
b
69
Chapter 4 – Comparison of different soil preparation methods prior to analysis compared
to air-dried soil preparation currently used in Virginia.
Abstract
Soil testing is necessary in order to determine soil nutrient status for soybean [Glycine
max. (L.) Merr.] nutrient management. Soil sample preparation methods may potentially
influence the amount of exchangeable K based on the method of preparation used prior to soil
analysis. Composite soil samples were taken from each replication in 12 full-season field trials,
prior to potassium fertilization in 2014 to determine differences in extractable K using four
methods (field moist, oven dried, air dried, and air dried followed by oven drying) of preparing
the soil for analysis with Mehlich-1 extractant. Samples were mixed and split for field moist and
air-dry conditions. There were site and drying method differences as well as a site by drying
method interaction. One or more of the alternative soil drying methods were significantly
different from air drying, which is used by Virginia Tech soil testing laboratory at eight of 12
sites, however, only in two of the eight sites did air-dry differ from moist soil samples by 2.4 and
10.3 mg Kg kg-1. These data indicated that current preparation methods for soil analysis is
sufficient in Virginia for low to medium k testing sandy loam soils.
Introduction
Soil testing is an important aspect of plant nutrient management and can help growers
determine levels of available nutrients within a field and the amount of fertilizer needed. In
soybean [Glycine max. (L.) Merr.], potassium is one of the most important soil nutrients for plant
growth and development. Potassium improves water and nutrient uptake by increasing root
growth; builds cellulose, which reduces lodging; is as an enzyme activator; reduces respiration;
and prevents energy loss from the plant (Fagaria, 2009). Throughout Virginia, Mehlich-1

70
extractant is typically used to determine plant-available K. Most soil samples are taken as a field
composite sample representing a field or part of a field and sent to a soil testing lab for analysis.
At the lab they are first air-dried, then five grams of sieved, air-dried soil are placed into a 150
mL extraction flask, and then 25 mL of Mehlich I extracting solution (0.05 M H2SO4 + 0.05 M
HCl) is added and shook for 5 minutes on a reciprocating shaker set at a minimum of 180 opm.
The sample is filtered through a Whatman no. 2 filter paper and analyzed using inductively
coupled plasma spectrometry (Helmke and Sparks, 1996).
It is thought that air drying and oven drying can change the soil composition and in turn,
have a negative influence on actual K extractable form in soil solution. When dried, the amount
of exchangeable K on the soil test report can be greater than the amount of K actually available
and in turn, can lead to lower than necessary fertilizer recommendations (Attoe, 1946, Grava et
al., 1961, Barbagelata and Mallarino, 2012). Field moist conditions present a more accurate
exchangeable K concentration and it is suggested to be a more efficient method of analysis
(Attoe, 1946, Grava et al., 1961, Barbagelata and Mallarino, 2012). The effects of drying soil
before analysis were researched in the north central region of the United States, as well as in
Wisconsin and Iowa.
Air-drying is typically used when drying soils in laboratories because the oven heat is
thought to affect nutrient availability by increasing exchangeable K content when the actual level
is less (Grava et al., 1961). Further research by Bray and DeTurk (1939) concluded that heating
soils to 200°C increased exchangeable K content when the actual value was less and decreased
exchangeable K content when the actual value was greater. Attoe and Truog (1946) developed
an equation (Log Y = k log X +c), on a Spencer silt loam, found that the amount of K fertilizer

71
applied, along with air drying at room temperature, was related to the amount of remaining
exchangeable K as determined by the equation. Y represented the amount of exchangeable K
remaining, X represented the amount of K applied, and k and c were constants determined by the
extent of fixation. Exchangeable K increased from 21 to 57 kg ha-1, as a result of drying on an
unfertilized Miami silt loam soil soils that were extruded prior to oat planting (Attoe, 1946).
Relative humidity levels of 10 to 90% had no K fixation while 100% relative humidity had 42%
fixation in dried soils at 10% humidity on a Spencer silt loam (Attoe, 1946).
Grava et al., (1961) studied Nicollet clay loam under three conditions: field moist
samples were placed in sealed plastic bags and refrigerated at 3° C until analysis; samples were
air dried at room temperature for seven days; and samples were dried in an oven at 105° C for 24
hours. Exchangeable potassium was determined using 1 N ammonium acetate for each drying
condition. There was an increase in exchangeable K in both air and oven dried samples, when
compared to field moist samples. Samples that had no K fertilizer applied in the field had greater
increases than samples with 109 or 218 kg K2O ha-1 fertilizer. Average percentage of increase
for treatments of 0, 109 or 218 kg K2O ha-1 were 36.5, 31.0 and 14.2 %, respectively, after air
drying and 55.1, 42.9 and 23.7 %, respectively, after oven drying. Samples were taken
throughout the growing season and exchangeable K content decreased in field moist soils as the
season progressed, regardless of fertilizer treatment, due to plant uptake and utilization of soil
nutrients. Grava, et al. stated that there might have be more difference in air drying and oven
drying if the soil moisture was at the critical value of 5% or lower. According to Luebs et al.,
there is little increase in Iowa soil exchangeable K until the moisture level dropped to 5% or
lower.
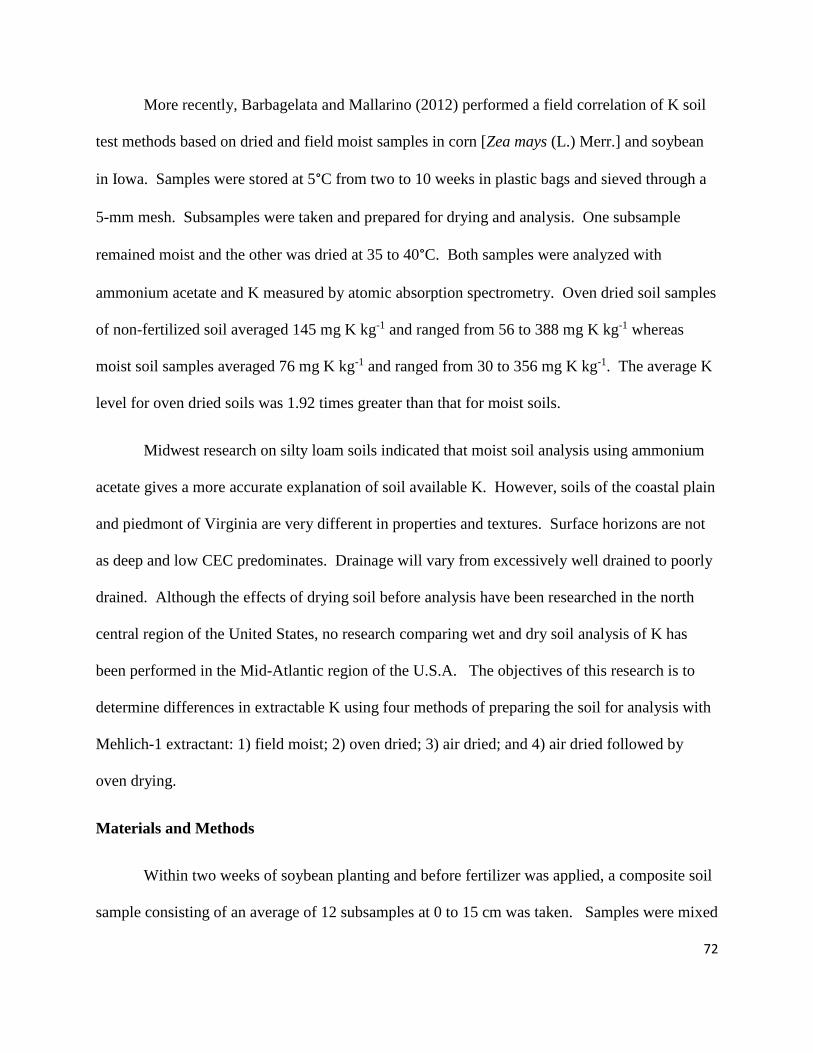
72
More recently, Barbagelata and Mallarino (2012) performed a field correlation of K soil
test methods based on dried and field moist samples in corn [Zea mays (L.) Merr.] and soybean
in Iowa. Samples were stored at 5°C from two to 10 weeks in plastic bags and sieved through a
5-mm mesh. Subsamples were taken and prepared for drying and analysis. One subsample
remained moist and the other was dried at 35 to 40°C. Both samples were analyzed with
ammonium acetate and K measured by atomic absorption spectrometry. Oven dried soil samples
of non-fertilized soil averaged 145 mg K kg-1 and ranged from 56 to 388 mg K kg-1 whereas
moist soil samples averaged 76 mg K kg-1 and ranged from 30 to 356 mg K kg-1. The average K
level for oven dried soils was 1.92 times greater than that for moist soils.
Midwest research on silty loam soils indicated that moist soil analysis using ammonium
acetate gives a more accurate explanation of soil available K. However, soils of the coastal plain
and piedmont of Virginia are very different in properties and textures. Surface horizons are not
as deep and low CEC predominates. Drainage will vary from excessively well drained to poorly
drained. Although the effects of drying soil before analysis have been researched in the north
central region of the United States, no research comparing wet and dry soil analysis of K has
been performed in the Mid-Atlantic region of the U.S.A. The objectives of this research is to
determine differences in extractable K using four methods of preparing the soil for analysis with
Mehlich-1 extractant: 1) field moist; 2) oven dried; 3) air dried; and 4) air dried followed by
oven drying.
Materials and Methods
Within two weeks of soybean planting and before fertilizer was applied, a composite soil
sample consisting of an average of 12 subsamples at 0 to 15 cm was taken. Samples were mixed

73
and separated into four subsamples. The first subsamples were stored in plastic bags and
refrigerated at 5°C to maintain moisture until extracted. The second set of subsamples were dried
at 105°C for 24 h. Another set of subsamples were dried in a forced air drying cabinet at 25°C
for 24 h. Finally, the last subsamples were dried in a forced air drying cabinet at 25°C for 24 h
then oven-dried at 105°C for 24 h. All samples were weighed again after drying to establish soil
moisture content (Gardner, 1986). Dried soils were ground to pass a 2-mm sieve using a
hammer mill. Samples were extracted by placing 5 g of soil and 20 mL of Mehlich-1 extraction
solution into a 60 mL straight walled plastic extraction beaker and shaking for 5 min at 180 opm
(Helme and Sparks, 1996). Supernatant was filtered through Whatman 2 filter paper and
analyzed using s inductively coupled plasma spectrometry. This process was performed for each
soil test sample received at the VT laboratory. Moist and air-dried soil samples were corrected
to a dry soil weight equivalent prior to statistical analysis while oven dried samples were
assumed to be devoid of moisture.
Analysis of variance was performed to determine differences in soil preparation method
and means were separated with Fisher’s Protected LSD (P<0.05).
Results and Discussion
Statistical Analysis
Analysis of variance revealed site and drying method differences and a site by drying
method interaction, therefore data are presented by site. One or more of the alternative soil
drying methods were significantly different from air drying, which is used by most soil testing
laboratories, at 8 of 13 sites (Table 4.1). Only at two of the 12 sites did air-dry differ from moist
soil samples. This difference was only 2.4 mg K kg-1 at site 13, a difference that would not
74
likely affect K recommendations. At site 8, the field moist sample extracted 10.3 mg kg-1 more
K than air-dried from the sample. With this difference K fertilizer recommendations would still
not be altered (Table 4.2). Considering that moist and air dried samples at 10 of the 12 sites
were not different, there appears to be little reason to alter soil preparation methods in Virginia.
Air-dry then oven-dry
When air-dried soils were further dried in the oven, STK from sites 15, 16, and 18
increased by 11.3, 5.8, and 6.2 mg K kg-1 soil. Relative to the soil test values, this represents a
2.2, 2.7, and 17.9% difference. Still, such minor differences are not likely to alter soil K
recommendations substantially. In addition, 9 of the 12 sites that were oven dried after air
drying were not different from air drying. Therefore, oven drying after air drying appears to
have little effect on STK.
Field moist then oven-dry
When field moist soils were dried in the oven, STK from sites 8, 12, 13, 14, and 19
decreased compared to air-dry by 3.4, 44.3, 33.8, 10.5 and 11.7% difference. However, sites 15
and 16 actually increased by 12.8 and 25.3%, as compared to air-dry. These samples were taken
on the same day but there is no other explanation for why these two significant sites increased
rather than decreased when dried in the oven. Regardless, these differences still did not alter the
classification of STK level (Table 4.2).
Variation among methods
Oven-dried samples had the greatest variation from air dried only soils; with six of 13
sites differing (Table 2). Sites 12, 13, and 16 had the greatest variation between the drying

75
methods, relative to STK. Site 12, had an STK level of 14.9 mg K kg-1 using the air-dried
method but only 8.3 mg K kg-1 using the field moist then oven-dried method, a 44% drop in
STK. Sites 13 experienced a 34% drop in STK when the oven-dried method was used. In
contrast, site 16, had an air-dried STK of 27.3 mg K kg-1 compared to a field moist then oven-
dried STK of 37.7 mg K kg-1, a 25% increase. Differences at the other significant sites ranged
from 11.7% less to 12.8% more STK with the oven-dried samples.
Conclusion
Eight out of 12 sites differed when comparing field moist and oven dried samples to air
dried samples. Differences occurred most often when the air-dried was compared to the oven-
dried method. Differences were in both low and medium STK levels and although some
differences were seen, only one response pushed soil levels into a different category.
Regardless, differences in the preparation methods were of little practical importance, as such
differences would not have changed K fertility recommendations substantially.
Although more research may be needed on other Mid-Atlantic soil types and STK levels,
this research indicated that the current method of air drying soils used by the Virginia Tech soil
testing laboratory is adequate and the other methods tested would not generally impact results for
low and medium testing Coastal Plain soils.
76
References
Attoe, O.J. 1946. Potassium fixation and release in soils occurring under moist and drying
conditions. Soil Sci. Soc. Am. J. 11:145-149.
Attoe, O.J., & E. Truog. 1946. Exchangeable and acid-soluble potassium as regards availability
and reciprocal relationships. Soil Sci. Soc. Am. Proc. 10:81-86.
Barbagelata, P.A. & A.P. Mallarino. 2012. Field correlations of potassium soil test methods
based on dried and field-moist soil samples for corn and soybean. Soil Sci. Soc. Am. J.
77:318-327.
Bray, R.H. & E.E. DeTurk. 1939. The release of potassium from non-replaceable forms in
Illinois soils. Soil Sci. Soc. Am. Proc. 3:101-106
Fageria, N.K. 2009. Potassium. In: N.K. Fageria, editor, The use of nutrients in crop plants.
CRC Press, Boca Raton, FL. p. 121-164.
Gardner, W.H. 1986. Water content. In: E.A. Klute, editor-in-chief, methods of soil analysis:
part 1, physical and mineralogical methods. SSSA, Madison, WI. p. 503.
Grava, J., G.E. Spalding, & A.C. Caldwell. 1961. Effect of drying upon the amounts of easily
extractable potassium and phosphorus in nicollet clay loam. Agron. J. 53:219-221.
Helmke, P.A., and D.L. Sparks. 1996. Lithium, sodium, potassium, rubidium and cesium. In:
J.M. Bigham, editor-in-chief, Methods of soil analysis: part 3, chemical methods. SSSA,
Madison, WI. p. 563-569.
Luebs, R.E., G. Stanford, & A.D. Scott. 1956. Relation of available potassium to soil moisture.
Soil Sci. Soc. Am. Proc. 20:45-50.

77
Table 4.1. Analysis of K fluctuation under four soil drying conditions and analysis using Mehlich-1-extractant solution. Soil samples
were collected in May within 2 weeks of soybean planting.
Site Location Soil Series and Type Classification O.M.† C.E.C.† pH Field
Moist
Field Moist
Then
Oven-dried
Air
Dried
Air-Dried
Then
Oven-Dried Pr>f‡ LSD
---------g K kg-1----- -------------------mg K kg-1----------------
8 Chesapeake, VA Chesapeake SL Typic Hapludults 1.8 5.3 5.4 48.5 36.9 38.2 40.8 0.0052 5.7
9 Currituck, NC Bojac LS Typic Hapludults 1.7 4.8 5.2 81.4 80.2 77.3 84.3 0.1381 NS§
10 Gates, NC Goldsboro FSL Aquic Paleudults 1.0 3.4 6.4 48.4 45.3 47.4 59.5 0.2537 NS
11 Gates, NC Bladen L Typic Albaquults 0.9 2.4 5.6 39.7 38.2 38.2 31.7 0.6049 NS
12 Lunenburg, VA Appling SL Typic Kanhapludults 3.3 5.2 6.3 15.0 8.3 14.9 15.4 0.0001 2.2
13 Mecklenburg, VA Cecil FSL Typic Kanhapludults 2.0 4.6 6.7 17.8 10.2 15.4 16.1 <.0001 2.0
14 Mecklenburg, VA Helena FSL Aquic Hapludults 1.3 2.8 5.4 17.8 16.2 18.1 18.6 0.0366 1.6
15 Northumberland, VA Sassafras FSL Aquic Hapludults 1.7 4.6 6.8 67.4 77.7 68.9 80.2 0.0009 5.4
16 Richmond, VA Dogue FSL Typic Endoquults 1.4 2.2 5.3 30.9 37.7 30.1 35.9 0.0084 4.4
17 Suffolk, VA Emporia FSL Typic Hapludults 0.8 2.2 5.6 22.6 21.0 21.0 22.3 0.2597 NS
18 Virginia Beach, VA Dragston FSL Aeric Endaquults 3.3 5.5 5.7 32.2 26.3 27.3 33.5 0.0332 5.3
19 Westmoreland, VA Suffolk SL Typic Hapludults 1.9 4.3 6.4 51.7 46.7 52.9 54.3 0.0060 3.7
Mean 39.4 35.3 40.7 37.3
† OM, organic matter; CEC, cation exchange capacity
‡ P value comparing STK levels
§ NS, not significant (P>0.05)
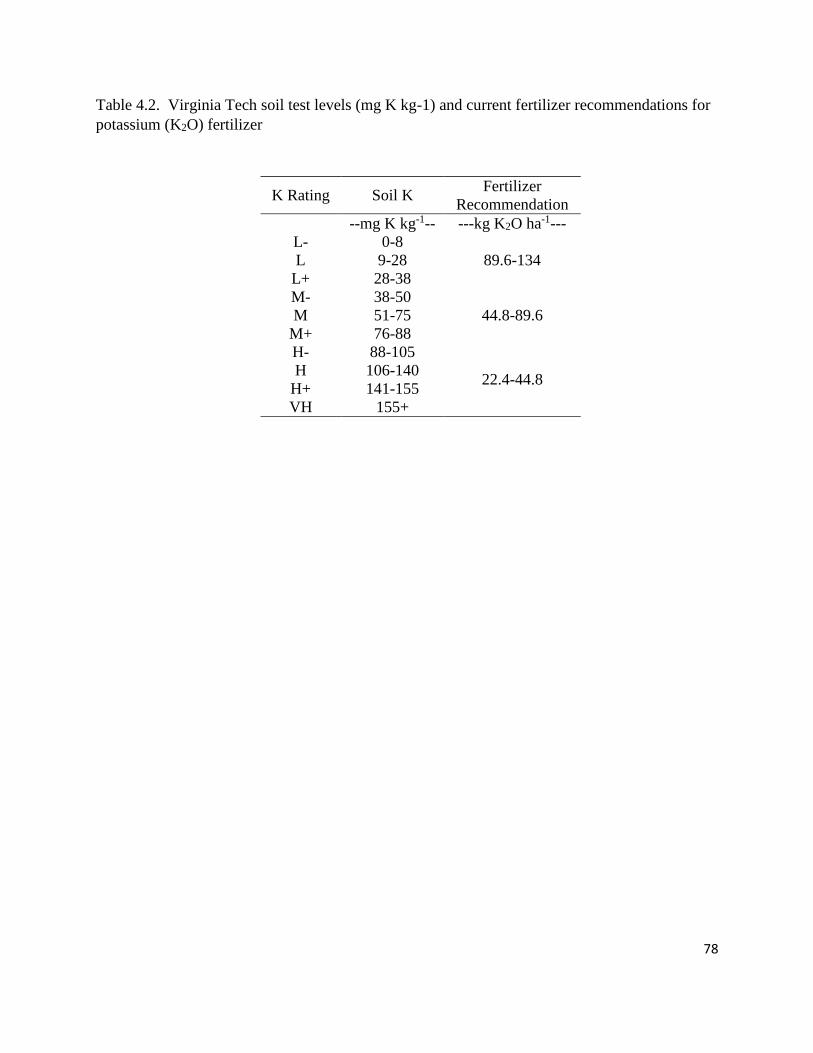
78
Table 4.2. Virginia Tech soil test levels (mg K kg-1) and current fertilizer recommendations for
potassium (K2O) fertilizer
K Rating Soil K Fertilizer
Recommendation
--mg K kg-1-- ---kg K2O ha-1---
L- 0-8
89.6-134 L 9-28
L+ 28-38
M- 38-50
44.8-89.6 M 51-75
M+ 76-88
H- 88-105
22.4-44.8 H 106-140
H+ 141-155
VH 155+
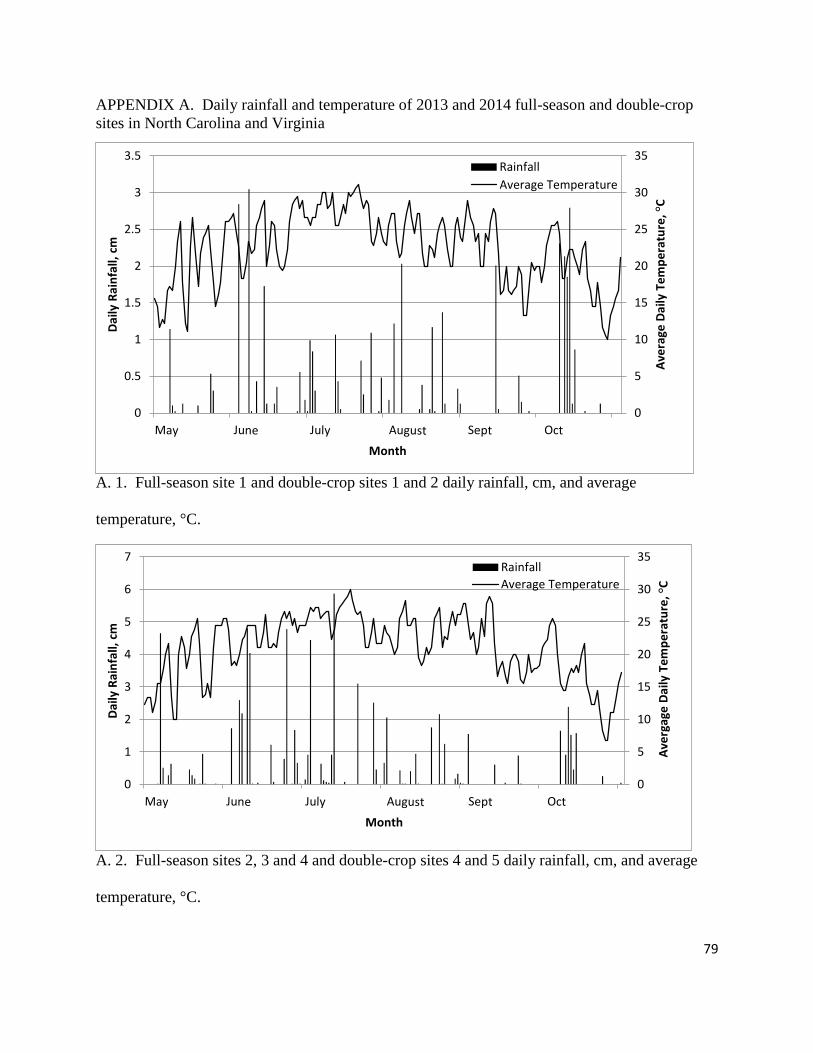
79
APPENDIX A. Daily rainfall and temperature of 2013 and 2014 full-season and double-crop
sites in North Carolina and Virginia
A. 1. Full-season site 1 and double-crop sites 1 and 2 daily rainfall, cm, and average
temperature, °C.
A. 2. Full-season sites 2, 3 and 4 and double-crop sites 4 and 5 daily rainfall, cm, and average
temperature, °C.
0
5
10
15
20
25
30
35
0
0.5
1
1.5
2
2.5
3
3.5
Ave
rage
Dai
ly T
em
pe
ratu
re, °
C
Dai
ly R
ain
fall,
cm
Month
Rainfall
Average Temperature
0
5
10
15
20
25
30
35
0
1
2
3
4
5
6
7
Ave
rgag
e D
aily
Te
mp
era
ture
, °C
Dai
ly R
ain
fall,
cm
Month
Rainfall
Average Temperature

80
A. 3. Full-season site 5 daily rainfall, cm, and average temperature, °C.
A. 4. Full-season site 6 and double-crop site 10 daily rainfall, cm, and average temperature, °C.
0
5
10
15
20
25
30
35
0
1
2
3
4
5
6
7
8
9
Ave
rage
Dai
ly T
em
pe
ratu
re, °
C
Dai
ly R
ain
fall,
cm
Month
Rainfall
Average Temperature
0
5
10
15
20
25
30
35
0
1
2
3
4
5
6
7
8
9
10
Ave
rage
Dai
ly T
em
pe
ratu
re, °
C
Dai
ly R
ain
fall,
cm
Month
RainfallAverage Temperature
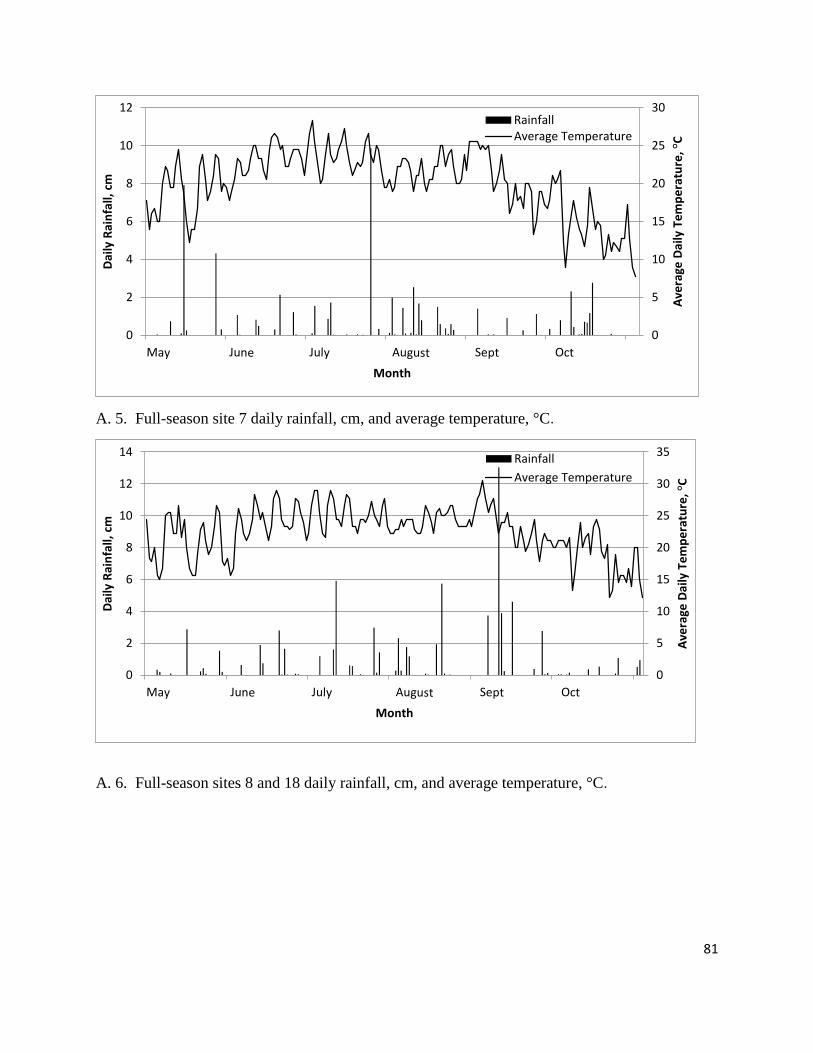
81
A. 5. Full-season site 7 daily rainfall, cm, and average temperature, °C.
A. 6. Full-season sites 8 and 18 daily rainfall, cm, and average temperature, °C.
0
5
10
15
20
25
30
0
2
4
6
8
10
12
Ave
rage
Dai
ly T
em
pe
ratu
re, °
C
Dai
ly R
ain
fall,
cm
Month
RainfallAverage Temperature
0
5
10
15
20
25
30
35
0
2
4
6
8
10
12
14
Ave
rage
Dai
ly T
em
pe
ratu
re, °
C
Dai
ly R
ain
fall,
cm
Month
Rainfall
Average Temperature
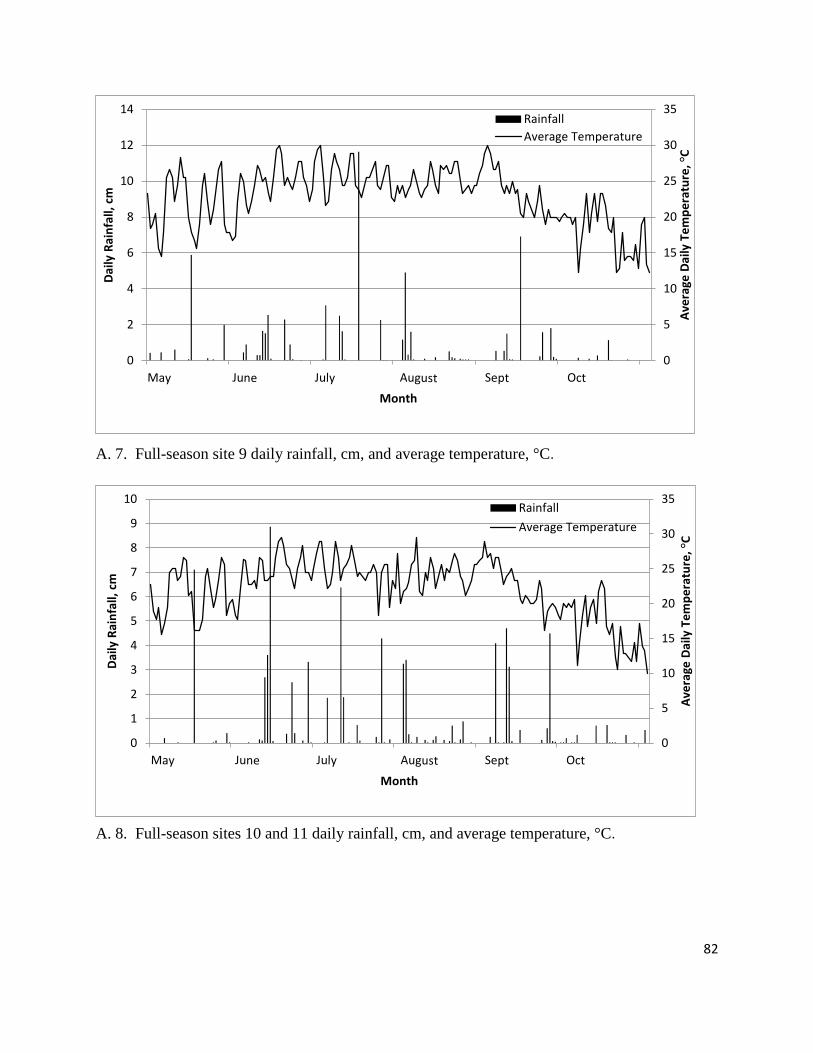
82
A. 7. Full-season site 9 daily rainfall, cm, and average temperature, °C.
A. 8. Full-season sites 10 and 11 daily rainfall, cm, and average temperature, °C.
0
5
10
15
20
25
30
35
0
2
4
6
8
10
12
14
Ave
rage
Dai
ly T
em
pe
ratu
re, °
C
Dai
ly R
ain
fall,
cm
Month
Rainfall
Average Temperature
0
5
10
15
20
25
30
35
0
1
2
3
4
5
6
7
8
9
10
Ave
rage
Dai
ly T
em
pe
ratu
re, °
C
Dai
ly R
ain
fall,
cm
Month
Rainfall
Average Temperature

83
A. 9. Full-season site 12 daily rainfall, cm, and average temperature, °C.
A. 10. Full-season sites 13 and 14 daily rainfall, cm, and average temperature, °C.
0
5
10
15
20
25
30
35
0
1
2
3
4
5
6
7
Ave
rage
Dai
ly T
em
pe
ratu
re, °
C
Dai
ly R
ain
fall,
cm
Month
Rainfall
Average Temperature
0
5
10
15
20
25
30
35
0
1
2
3
4
5
6
7
Ave
rage
Dai
ly T
em
pe
ratu
re, °
C
Dai
ly R
ain
fall,
cm
Month
RainfallAverage Temperature

84
A. 11. Full-season site 15 daily rainfall, cm, and average temperature, °C.
A. 12. Full-season sites 16 and 19 daily rainfall, cm, and average temperature, °C.
0
5
10
15
20
25
30
35
0
1
2
3
4
5
6
Ave
rage
Dai
ly T
em
pe
ratu
re, °
C
Dai
ly R
ain
fall,
cm
Month
Rainfall
Average Temperature
0
5
10
15
20
25
30
35
0
1
2
3
4
5
6
Ave
rage
Dai
ly T
em
pe
ratu
re, °
C
Dai
ly R
ain
fall,
cm
Month
RainfallAverage Temperature

85
A. 13. Full-season site 17 and double-crop sites 13 and 14 daily rainfall, cm, and average
temperature, °C.
A. 14. Double-crop sites 3, 6, and 7 daily rainfall, cm, and average temperature, °C.
0
5
10
15
20
25
30
35
0
1
2
3
4
5
6
7
8
Ave
rage
Dai
ly T
em
pe
ratu
re, °
C
Dai
ly R
ain
fall,
cm
Month
RainfallAverage Temperature
0
5
10
15
20
25
30
35
40
0
0.2
0.4
0.6
0.8
1
1.2
Ave
rage
Dai
ly T
em
pe
ratu
re, °
C
Dai
ly R
ain
fall,
cm
Month
Rainfall
Average Temperature
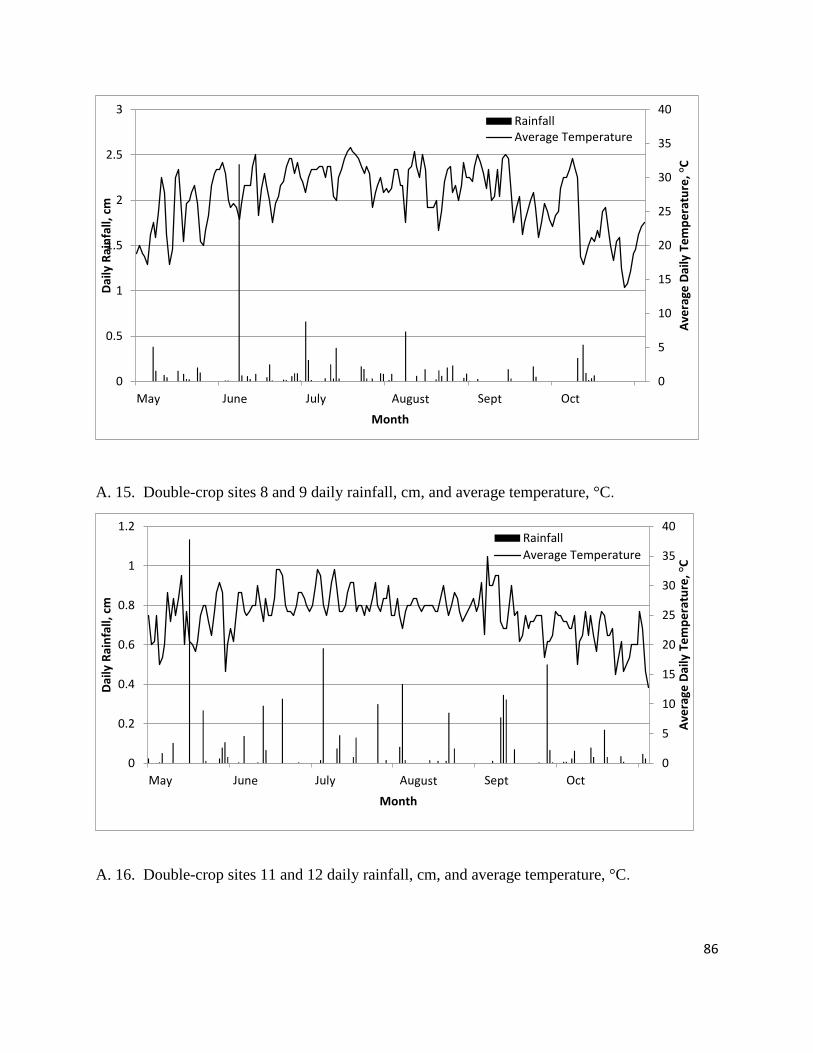
86
A. 15. Double-crop sites 8 and 9 daily rainfall, cm, and average temperature, °C.
A. 16. Double-crop sites 11 and 12 daily rainfall, cm, and average temperature, °C.
0
5
10
15
20
25
30
35
40
0
0.5
1
1.5
2
2.5
3
Ave
rage
Dai
ly T
em
pe
ratu
re, °
C
Dai
ly R
ain
fall,
cm
Month
RainfallAverage Temperature
0
5
10
15
20
25
30
35
40
0
0.2
0.4
0.6
0.8
1
1.2
Ave
rage
Dai
ly T
em
pe
ratu
re, °
C
Dai
ly R
ain
fall,
cm
Month
Rainfall
Average Temperature