full-scale room burn pattern study · flashover and full room involvement, (b) reproducibility of...
TRANSCRIPT
FULL-SCALE ROOM BURN PATTERN STUDY
Gregory E. Gorbett, CFEI, CFPS, MIFireE
John A. Kennedy & Associates (USA) and
William Hicks, CFEI, CFPS, IAAI-CFI Eastern Kentucky University (USA)
Patrick M. Kennedy, CFEI, CFPS, MIFireE
John A. Kennedy & Associates (USA)
Ronald L. Hopkins, CFEI, CFPS Eastern Kentucky University (USA)
Kathryn C. Kennedy, CFEI
John A. Kennedy & Associates (USA) ABSTRACT
Full-scale research burns into the nature of patterns in compartment fires were conducted at the new fire research facility of Eastern Kentucky University. Key questions to be addressed by the research burns were: (a) patterns persistence through flashover and full room involvement, (b) reproducibility of patterns geometry in minimal variable testing methods, and (c) reaffirmation of standard patterns analysis methodologies, such as heat and flame vector analysis, depth of calcination measurement, and truncated cone patterns formation and analysis. As an added value these research burns were designed to test the validity of content of the National Fire Code© component document, NFPA 921 – Guide for Fire and Explosion Investigations chapters on Fire Patterns, and Origin Determination. These tests demonstrate a remarkable resemblance of patterns in minimal variable testing methods. Patterns persistence through flashover and full room involvement was observed, as well as the reproducibility of specific fire patterns, heat and flame vector analysis results, and depth of calcination measurements. In addition, several ancillary fire effects, fire patterns, and post-fire analysis issues were successfully examined.
* * * INTRODUCTION
Since the very beginning of organized fire investigation in the late 1940’s, fire investigators have relied upon fire patterns (both their geometric shapes and the effects of fire on materials) as their basis for determining the place where a fire started (origin). Absent the testimony of reliable eyewitnesses to the actual inception of a particular fire event, the fire investigator is required to determine the origin or point of origin of a fire by observation of the physical evidence left by the fire, the fire patterns. Fire origin determination is now, and has always been, largely a matter of fire pattern recognition and analysis. In order to scientifically study the patterns produced by fires, a series of six full-scale experiments were conducted at Eastern Kentucky University’s (EKU) new research burn facility using test rooms furnished as residential bedrooms and living rooms. This paper reports on the first three sets of experimental tests. An experimental set is two identical full-scale burns. On March 4, 2005 two research burns (experiment set “A”) were performed as a preliminary part of the 2005 National Advanced Fire, Arson, and Explosion Investigation Science and Technology Seminar. This scientific fire research was conducted and co-sponsored by The Advanced Fire Pattern Research Project (AFPRP), EKU’s Fire and Safety Engineering Technology Program, and the National Association of Fire Investigators (NAFI). On November 4, 2005 two additional research burns (experiment set “B”) were performed as a preliminary part of EKU’s senior-level
ISFI 2006International Symposium on Fire Investigation Science and Technology
207

fire investigation curriculum. This scientific fire research was conducted and co-sponsored by the AFPRP, EKU, and NAFI. Finally, on March 11, 2006 two additional research burns (experiment set “C”) were performed as a preliminary part of the 2006 National Advanced Fire, Arson, and Explosion Investigation Science and Technology Seminar. These were also conducted and co-sponsored by the AFPRP, EKU, and NAFI. All test rooms were instrumented and the resulting data recorded. Temperatures and radiant fluxes were measured at various locations in the rooms. After fire extinguishment, the condition of the rooms and contents were studied. This report describes the experimental setup, measurement results, and the post fire inspection of the rooms. Key questions to be addressed by the research burns were: (a) patterns persistence through flashover and full room involvement, (b) reproducibility of pattern geometry in minimal variable testing methods, and (c) reaffirmation of standard pattern analysis methodologies, such as heat and flame vector analysis, depth of calcination measurement, and truncated cone pattern formation and analysis. As an added value these research burns were designed to test the validity of content of the National Fire Code© component document, NFPA 921 – Guide for Fire and Explosion Investigations chapters on Fire Patterns, and Origin Determination.
ADVANCED FIRE PATTERN RESEARCH PROJECTThe research test burns that are the subject of this paper were conducted under the
auspices of the Advanced Fire Pattern Research Project (AFPRP). NAFI and EKU’s Fire and Safety Engineering Technology Program founded the AFPRP in 1985. The directors and instructors of the 1985 training seminar came to the realization that in the past a large number of full-scale and small-scale model test and training fires had been conducted by EKU and NAFI, but in almost all of these previous test or training fires, the valuable data regarding fire pattern development was never documented or reported beyond (outside of) the individual training seminars. Therefore, the AFPRP was created to provide and report continuing research into the nature and dynamics of fire pattern production and analysis. Recognizing the need for an information data collection, preservation, and technology transfer system, the AFPRP was born. To date more than seventy full-scale, half-scale, and quarter-scale burn tests from NAFI/NFPA/EKU National Training Programs have been conducted within the purview of the AFPRP. THE TEST FACILITY
The test facility used for all these recent experiment sets was the Eastern Kentucky University, Fire and Safety Engineering and Technology Program’s test burn building, located on the EKU campus in Richmond, Kentucky. This structure is a specially constructed, single story building with overall dimensions of approximately 18.9 m x 9.75 m (62 feet x 32 feet). It incorporates six interconnected burn rooms and two hallways all with 8” reinforced concrete walls and roof. Individual test cells can be configured into various shapes and sizes by isolating individual spaces with gypsum wallboard partitions (see Figure 1).
ISFI 2006International Symposium on Fire Investigation Science and Technology
208

Figure 1 (left) layout of EKU test burn building; Figure 2 (right) location of test cells
18'
12'
59'6
16' 16' 27'6
59'6
15'612'4'12'4'12'14'8
1'4
14'
18'
12'
59'6
16' 16' 27'6
59'6
15'612'4'12'4'12'
14'8
1'4
14'
THE TEST CELLSThe test cells for this research project encompassed the east half of the facility configured
into two identical 4.88 m by 9.75m (16’ by 32’) cells (Figure 2). The cells were constructed of 8” poured, reinforced concrete walls, which were lined with 2x6 joists and gypsum wallboard (See Figure 2). All dimensions are approximated. Rooms with features resembling typical residential bedrooms and living rooms were constructed within the “test burn building”. The identical burn cells were composed of a front room 4.87m wide by 4.27m long (~16'W x 14'L) with front door and front window 1.07m wide by 0.91m high (~3'6”W x 3'H); a rear room 3.96m wide by 4.57m long (~13'W x 15'L) with side hallway doorway and rear window 1.07m wide by 0.91m high (~3'6”W x 3'H); and a rear hallway 0.91m wide by 4.88m long (~3'W x 16'L) adjacent to the rear room on the right and leading to a rear exterior door. Exterior doors are 0.99m wide by 2.21m high (3'3"W x 7'3"H). The bedrooms in both experiments were approximately 4.47m (14’8”) long, 4.04m (13’3”) wide, and 2.44m (8’0”) high. Each room had a single door that was open for the duration of the experiments. The doorways measured approximately 0.91m (3’0”) wide, with heights approximately 2.09m (6’10”). The overall dimensions of the window frames were approximately 1.06m (3’6”) wide and 0.91m (3’0”) high, with the sill or bottom of the window frames located approximately 1.04m (3’5”) above the floor. The open area for the window was approximately 0.41m (1’4”) wide and 0.76m (2’6”) high. All experiments utilized single pane windows. Fuel Load/ Room Furnishings Experiment sets “A” and “C”: Experiment sets “A” and “C” (conducted in March 2005 and March 2006) were roughly identical in the layout and types of furniture (Figure 3). The rooms were furnished as typical residential bedrooms and living rooms. The contents of each bedroom included a bed, chest, two lamps, end tables, two nightstands, television (not included in experiment set “C”), clothing and a dresser with an attached mirror. The bedrooms had wall-to-wall carpeting on the floor. The contents of each living room included a couch, loveseat, coffee table, two end tables, and television. The living room as well as the hallway had wall-to-wall carpeting on the floor. Experiment set “B”: Experiment set “B” (conducted in November 2005) was furnished as a residential living room. The living rooms consisted of a couch, loveseat, three end tables, two lamps and a coffee table. The living room as well as the hallway had wall-to-wall carpeting on the floor. The bedroom consisted of a single mattress with bedding material (Figure 4).
Test Cell #1
Test Cell #2
N
ISFI 2006International Symposium on Fire Investigation Science and Technology
209

All experiment sets were ignited by the application of a propane torch to a small plastic bag containing a 4”x4” piece of cotton fabric rag doused with about 4 ml gasoline. Experiment sets “A” and “C” were ignited near the head of the bed on the polyurethane bedspread. Experiment set “B” was ignited near the center of the couch at the base of the vertical cushion.
Figure 3 (left) Furniture Layout for Experiment Set “A” & “C”; Figure 4 (right) furniture layout for Experiment Set “B”
INSTRUMENTATION
The rooms were instrumented for the measurement of temperature with thermocouple arrays strung vertically between the ceiling and the floor (a.k.a. thermocouple trees). Experiment set “A” had two thermocouple trees for each experiment. Each tree was composed of five thermocouples, for a total of ten thermocouples per experiment. The first thermocouple was located at the ceiling height with three thermocouples located at a vertical spacing of approximately 0.15m (6”) apart. The fifth thermocouple was vertically located in the center of the room (~4 ft off the ground). Experiment set “B” had a single thermocouple tree located in the center of the living room. The thermocouple tree had a total of ten thermocouples with a similar configuration as the thermocouple tree from experiment set “A”. The last thermocouple for this tree was located at 1.07 m (3.5’) off of the floor. Experiment set “C” had one thermocouple tree inside the bedroom of each test cell. The thermocouple tree consisted of eleven thermocouples with a similar configuration as the previous experiment sets. The eleventh thermocouple was located at 0.92 m (3’) off the floor. All experiment sets had a single thermocouple, not associated with the thermocouple tree, located on the ceiling directly above the point of ignition. All thermocouple data was logged and stored electronically at regular intervals of 4 seconds. Additionally, experiment set “C” had a heat flux transducer placed in each cell. The radiant heat flux at the floor of the bedroom was measured with a water cooled, Schmidt-Boelter type heat flux transducer. The transducer was equipped with a Zinc Selenide (ZnSe) window to exclude convected heat flux. The view of the transducer, with the ZnSe window installed, was approximately 150o. The transducers were installed near the closet of each test cell. In addition to the above instrumentation, digital and 35mm still and video photography was used during each test to document the growth and progression of the fire. Photographic records of the compartment fire were supplemented by direct observations and written notes.
N
ISFI 2006International Symposium on Fire Investigation Science and Technology
210

FIRE SUPPRESSION (EXTINGUISHMENT) METHODOLOGYDuring these live fire activities, only IFSAC or PRO Board Certified, experienced
firefighters were utilized. Two sources of water supply were provided. The first was a 1985 Seagrave Fire Engine owned by Eastern Kentucky University. This unit is equipped with a 1250 Gallon Per Minute (gpm) pump, supplied with an on-board tank of 500 gallons. One 2 ½ inch line was deployed and split by a gated wye into two 1 ¾” lines, one for fire attack, and the other for a back up line. Also present was a 2001 E-one 75’ aerial provided to us by the city of Richmond fire department. A 1 ¾” hand line was manned by two city employees for emergency situations. Knockdown was accomplished with a fog stream setting, being supplied at 100 psi at the tip. Suppression personnel were instructed to minimize water damage and to focus on the fuel packages themselves. The same firefighters served on the nozzle to ensure duplicate activities. RESULTS – EXPERIMENT SET “A” The temperatures measured by the thermocouple tree located in the bedroom of each experiment are shown in Figures 6 and 7. In cell #1 (experiment #1), the technical indicator of 600oC (1112oF) in the upper layer for flashover was achieved at approximately 330s (seconds). The duration of the post-flashover/fully involved stage of the fire, the time between flashover and suppression, for experiment #1 was 360 s. In cell #2 (experiment #2), the technical indicator for flashover of 600oC (1112oF) in the upper layer was achieved at approximately 190s. The duration of the post-flashover/fully involved stage of the fire for experiment #2 was 200s. Figure 5 illustrates a timeline for each experiment.
Figure 5– Comparison of Timelines Experiment Set “A” The ventilation conditions for the experiments were expected to differ slightly due to the different locations of the rooms within the test burn building. The differences in ventilation are also suggested by the differences in the temperature growth profiles between experiments #1 and #2. In experiment #1, prior flashover, at 230s a substantial uniform decrease in temperature for all thermocouples was recorded. However, in experiment #2, only a minor decrease in temperature was recorded for all thermocouples just prior to flashover. A possible reason for the dramatic decrease in temperatures seen in experiment #1 and the resulting differences between the two temperature growth profiles is that the fire in experiment #1 became ventilation-controlled early on during the growth of the fire. This resulted in a decrease in temperature and a subsequent increase in time to flashover. Once sufficient oxygen concentrations returned, the fire quickly grew to transition through flashover conditions and into full-room involvement.
Experiment #1 Timeline Experiment #2 Timeline
0 s
330 s
690 s
360 s
Flashover
Extinguishment
Ignition 0 s
190 s
390 s 200 s
Flashover
Extinguishment
Ignition
ISFI 2006International Symposium on Fire Investigation Science and Technology
211

Figures 6 & 7 – Experiment Set “A” Thermocouple Data: (left)-Cell #1 (exp. 1); (right)-Cell #2 (exp. 2)
01002003004005006007008009001000
0 100 200 300 400 500 600 700 800 900 1000Time (sec)
Tem
pera
ture
(C)
0
200
400
600
800
1000
1200
0 50 100 150 200 250 300 350 400
Time (sec)
Tem
pera
ture
(C)
Results – Experiment Set “B” The temperatures measured by the thermocouple tree located in the living room of each
experiment are shown in Figures 9 and 10. In cell #1 (experiment #3) the technical indicator for flashover of 600oC (1112oF) in the upper layer was achieved at approximately 236s (seconds). Also, in experiment #3, the duration of the post-flashover/fully involved stage of the fire was 124s. In cell #2 (experiment #4) the technical indicator for flashover of 600oC (1112oF) in the upper layer was achieved at approximately 212s. Also, in experiment #4, the duration of the post-flashover/fully involved stage of the fire was 120s. The temperature growth profiles from experiments #3 and #4 are almost identical. Figure 8 illustrates a timeline for each experiment.
Figure 8 – Comparison of Timelines Experiment Set “B”
Figures 9 & 10 – Experiment Set “B” Thermocouple Data: (left)-Cell #1 (exp. 3); (right)-Cell #2 (exp. 4)
0.00
100.00
200.00
300.00
400.00
500.00
600.00
700.00
800.00
900.00
1000.00
0 50 100 150 200 250 300 350 400 450 500
Time (sec)
Tem
pera
ture
(C)
0.00
100.00
200.00
300.00
400.00
500.00
600.00
700.00
800.00
900.00
1000.00
0 50 100 150 200 250 300 350 400 450 500
Time (sec)
Tem
pera
ture
(C)
RESULTS – EXPERIMENT SET “C”The test in cell #1 (experiment #5) was stopped early due to hazardous weather
conditions creating an unsafe work environment. The temperatures measured by the thermocouple tree located in the bedroom of each experiment are shown in Figures 12 and 13. In experiment #5, the technical indicator for flashover of 600oC (1112oF) in the upper layer was achieved at approximately 1396s (seconds). However, the full transition of flashover into full-
TC #2
TC #3
TC #6
TC #1
TC #5
TC #4
TC #1
TC #6 TC #2
TC #3
TC #5
TC #4
TC #1
TC #11
TC #2&3
TC #4
TC #8 TC #9 & 10
TC #5 TC #6 TC #7
TC #1
TC #11
TC #9
TC #10 TC #2&3
TC #8
TC #4-7
Experiment #3 Timeline Experiment #4 Timeline
0 s
236 s
360 s 124 s
Flashover
Extinguishment
Ignition 0 s 212 s
332 s
120 s
Flashover
Extinguishment
Ignition
ISFI 2006International Symposium on Fire Investigation Science and Technology
212

room involvement did not occur. This was evident from the radiometer readings (figure 14), as well as the post-fire inspection of the furnishings (Figures 34, 38, 42 and 46). In cell #2 (experiment #6), the technical indicators for flashover of 600oC (1112oF) in the upper layer and radiant flux of 20kW/m2 at the floor were achieved at 790s (Figure 15). The duration of the post-flashover/fully involved stage of the fire for experiment #6 was 215s. Figure 11 illustrates a timeline for each experiment.
Figure 11 – Comparison of Timelines Experiment Set “C”
Figures 12 & 13 – Experiment Set “C” Thermocouple Data: (left)-Cell #1 (exp. 5); (right)-Cell #2 (exp. 6)
0.0
200.0
400.0
600.0
800.0
1000.0
1200.0
1400.0
0.0 200.0 400.0 600.0 800.0 1000.0 1200.0 1400.0 1600.0 1800.00
200
400
600
800
1000
1200
1400
1600
1800
0 200 400 600 800 1000 1200 1400
Figures 14 & 15 – Experiment Set “C” – Cell #1 (left) & Cell #2 (right) Radiometer Data
0.0
5.0
10.0
15.0
20.0
25.0
0 200 400 600 800 1000 1200 1400
0.0
5.0
10.0
15.0
20.0
25.0
30.0
35.0
40.0
45.0
0 200 400 600 800 1000
POST-FIRE ANALYSIS AND PATTERN IDENTIFICATION
Following each of the fire experiments, the conditions of the room contents and the building components were analyzed. Each experiment was documented by photography, written notes, and diagramming. Each experiment scene was thoroughly processed using generally recognized and accepted techniques and methods as outlined in NFPA 921 – Guide for Fire and Explosion Investigations.1 Specialized scene processing techniques were utilized including, Depth of Calcination and Heat
TC #4
TC #3 TC #1
TC #6
TC #9-11
TC #2 TC #5 TC #7-8
TC #9-11 TC #6 TC #7-8
TC #2-4
TC #1
TC #5
Experiment #5 Timeline Experiment #6 Timeline
0 s
1396 s Extinguishment
Ignition 0 s
790 s
1005 s 215 s
Flashover
Extinguishment
Ignition
ISFI 2006International Symposium on Fire Investigation Science and Technology
213

and Flame Vector Analysis. Scene processing requires special knowledge and skills gained through years of “dirty-knuckles” scene processing. Therefore, only qualified Certified Fire and Explosion Investigators (CFEI’s) were utilized to process each scene.
Scene Processing Techniques: Fire Pattern Analysis Two specialized scene processing techniques were employed during the post-fire analysis
of each experiment. A depth of calcination diagram and a heat and flame vector diagram were created for each experiment. The methodology for each technique and the resulting diagrams were prepared according to NFPA 921.1 Heat and Flame Vector Analysis: Each experiment was individually analyzed for all identifiable patterns. A heat and flame vector (arrow) was drawn on the respective diagram for each pattern to represent the direction of movement (fire spread). Experiment sets “A” and “C” were identical in furniture layout, and therefore, have been placed side-by-side for comparison purposes of their respective heat and flame vector diagrams (Figures 16-19). Experiment set “B” heat and flame vector diagrams are shown in Figures 20 and 21.
Figures 16-19 – Comparison of Heat and Flame Vector Diagrams(left to right) Experiment Set “A”: Cell #1; Cell #2; Experiment Set “C”: Cell #1; Cell #2
Figures 20 & 21 – Comparison of Heat and Flame Vector Diagrams
(left to right) Experiment Set “B”: Cell #1; Cell #2
9987
4
5 3
21
6
9
11 10
16
12
14
15 13
9987
4
5 3
21
6
9
10
11
13
14 12
987
4
5 3
21
6
9
10
11
13
1412
9987
4
5 3
21
6
9
11 10
16
12
14
15 13
15
17
18
Cell #1 Cell #2 Experiment Set “A”
Cell #1 Cell #2 Experiment Set “C”
Cell #1 Cell #2 Experiment Set “B”
9
5
3
4
1
2
6
7 811
10
1213
14
5
3
4
1
2
6
7 810
9
1112
13
ISFI 2006International Symposium on Fire Investigation Science and Technology
214

Depth of Calcination: Depth of calcination measurements were taken and recorded utilizing a depth gauge on a two-foot by two-foot grid for experiment set “A” and a one-foot by one-foot grid for experiment sets “B” and “C”. These depths of calcination readings have been transferred onto depth of calcination diagrams for additional pattern comparisons (Figures 22 and 27). Experiment sets “A” and “C” are illustrated by an elevation diagram of the east bedroom wall with the outline of the bed illustrated by a dashed line (Figures 22-25). A circle indicates a measurement of 1.5 mm or deeper, thus displaying a pattern of similar total heating. Experiment set “B” is demonstrated by an elevation diagram of the east wall with the outline of the couch illustrated by a dashed line (Figures 26 & 27). A circle indicates a measurement of 0.7 mm or deeper, thus displaying a pattern of similar total heating.
Figures 22-25 – Comparison of Depth of Calcination Elevation (East Wall) Diagrams(left to right) Experiment Set “A”: Cell #1; Cell #2; Experiment Set “C”: Cell #1; Cell #2
Circles indicate a measurement of 1.5 mm or deeper
Figures 26 & 27 – Comparison of Depth of Calcination Elevation (East Wall) Diagrams(left to right) Experiment Set “B”: Cell #1; Cell #2
Circles indicate a measurement of 0.7 mm or deeper DISCUSSIONScene Processing Techniques Discussion The Heat and Flame Vector diagrams for experiment sets “A” and “C” (experiments 1, 2, 5 and 6) demonstrate consistency. In fact, the first nine vectors for all four experiments show remarkable resemblance to each other and form the basis for the reliability of utilizing patterns and heat and flame vector diagrams for the accurate identification of an area of origin. Experiment set “B” (experiments 3 and 4) demonstrates even stronger consistency in vector analysis. Every pattern from experiment #3 was reproduced in experiment #4. A review of the depth of calcination diagrams with the post-fire photographs illustrates similarities between the visible patterns that remain and the measured intensity patterns in and on the calcined wallboard. Though there are slight differences in the resemblance of the diagrams from different tests, a general consistency is demonstrated between all of them.
E
D
H
G
F
H
G
F
H
G
F
Experiment Set “A” Experiment Set “C”
Experiment Set “B”
ISFI 2006International Symposium on Fire Investigation Science and Technology
215
Pattern Discussion Experiment Sets “A” and “C” – Bedroom Ignition
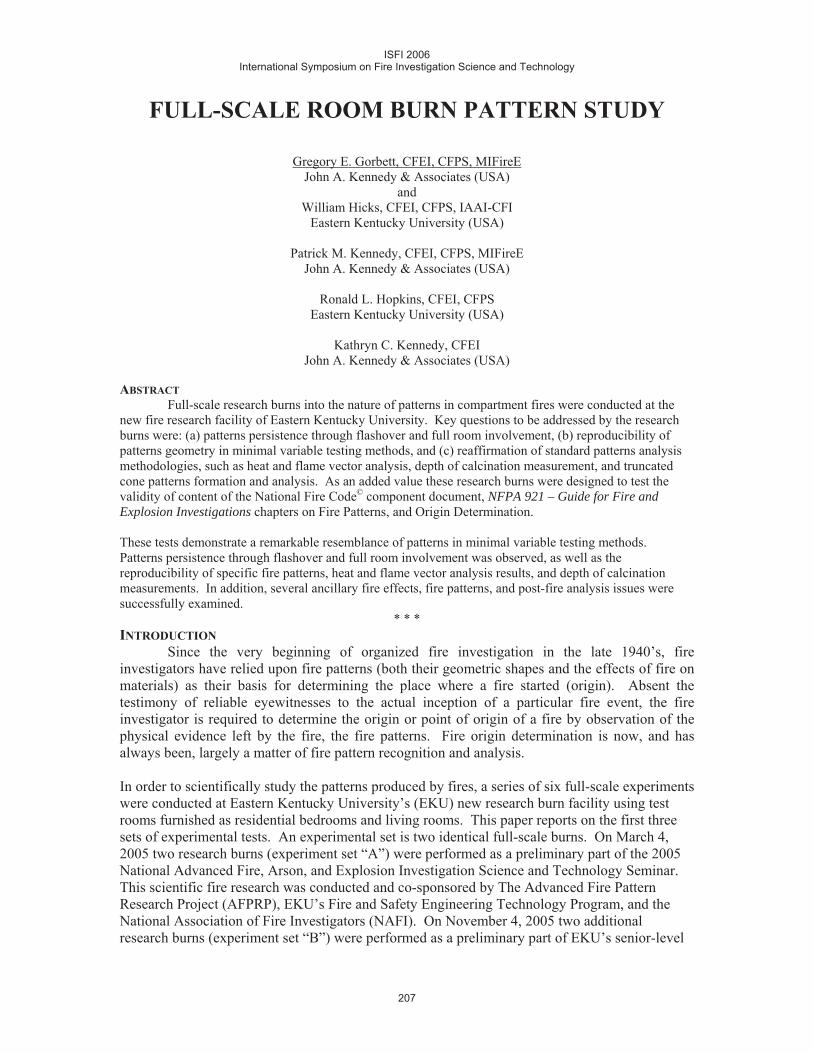
The post-fire conditions of all room contents (i.e. bed, dresser, chest, etc.) for both experiment sets were similar. The dresser, chest and nightstands were all deeply charred, but remained primarily intact after the fire. The mattress and bedding were consumed during the fire, except for the metal frame and springs. The exemplar clothing originally hung in the closet was found in a pile at the bottom of the closet and had been partially consumed during the fire. The plastic components of the television sets for experiment set “A” were consumed or melted away, but the metal components remained. The glass from the bedroom window was broken and no longer present. Similar truncated cone patterns (i.e. boundary patterns) were witnessed on the walls in all four experiments. The patterns remaining on the hallway walls demonstrate consistency. All four experiments produced a “U-shaped” pattern opposite the doorway on the hallway wall. The only difference that existed was the pattern in experiments #2 and #6 had a lower vertex than experiments #1 and #5 (Figures 28-31).
Figure 28-31 – Hallway (left to right) Exp. Set “A”: Cell #1, Cell #2; Exp. Set “C”: Cell #1, Cell #2
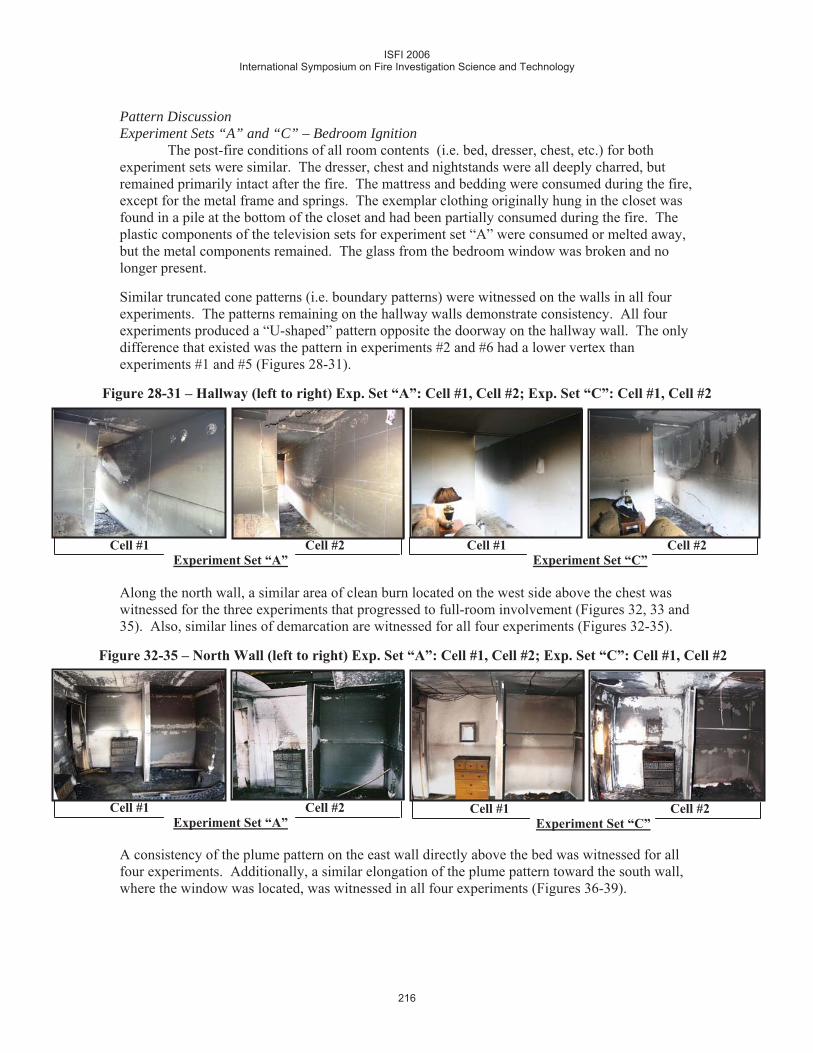
Along the north wall, a similar area of clean burn located on the west side above the chest was witnessed for the three experiments that progressed to full-room involvement (Figures 32, 33 and 35). Also, similar lines of demarcation are witnessed for all four experiments (Figures 32-35).
Figure 32-35 – North Wall (left to right) Exp. Set “A”: Cell #1, Cell #2; Exp. Set “C”: Cell #1, Cell #2
A consistency of the plume pattern on the east wall directly above the bed was witnessed for all four experiments. Additionally, a similar elongation of the plume pattern toward the south wall, where the window was located, was witnessed in all four experiments (Figures 36-39).
Cell #1 Cell #2 Experiment Set “C”
Cell #1 Cell #2 Experiment Set “A”
Cell #1 Cell #2 Experiment Set “A”
Cell #1 Cell #2 Experiment Set “C”
ISFI 2006International Symposium on Fire Investigation Science and Technology
216
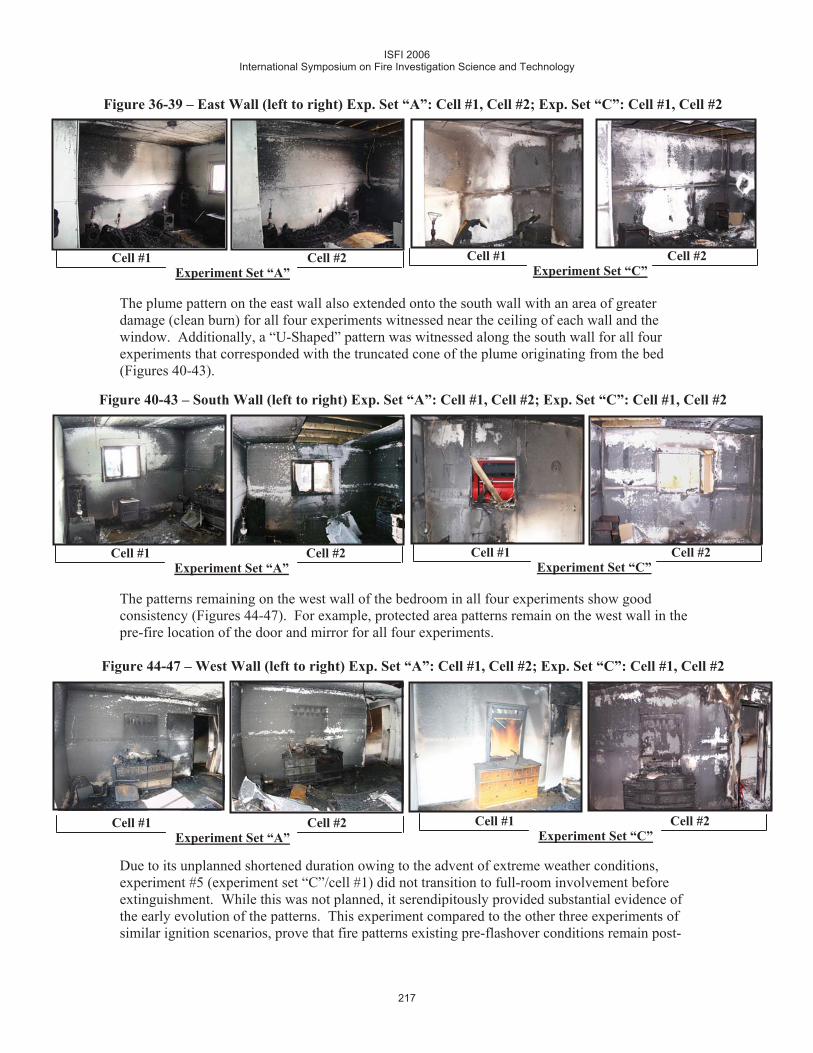
Figure 36-39 – East Wall (left to right) Exp. Set “A”: Cell #1, Cell #2; Exp. Set “C”: Cell #1, Cell #2
The plume pattern on the east wall also extended onto the south wall with an area of greater damage (clean burn) for all four experiments witnessed near the ceiling of each wall and the window. Additionally, a “U-Shaped” pattern was witnessed along the south wall for all four experiments that corresponded with the truncated cone of the plume originating from the bed (Figures 40-43).
Figure 40-43 – South Wall (left to right) Exp. Set “A”: Cell #1, Cell #2; Exp. Set “C”: Cell #1, Cell #2
The patterns remaining on the west wall of the bedroom in all four experiments show good consistency (Figures 44-47). For example, protected area patterns remain on the west wall in the pre-fire location of the door and mirror for all four experiments.
Figure 44-47 – West Wall (left to right) Exp. Set “A”: Cell #1, Cell #2; Exp. Set “C”: Cell #1, Cell #2
Due to its unplanned shortened duration owing to the advent of extreme weather conditions, experiment #5 (experiment set “C”/cell #1) did not transition to full-room involvement before extinguishment. While this was not planned, it serendipitously provided substantial evidence of the early evolution of the patterns. This experiment compared to the other three experiments of similar ignition scenarios, prove that fire patterns existing pre-flashover conditions remain post-
Cell #1 Cell #2 Experiment Set “C”
Cell #1 Cell #2 Experiment Set “C”
Cell #1 Cell #2 Experiment Set “A”
Cell #1 Cell #2 Experiment Set “A”
Cell #1 Cell #2 Experiment Set “A”
Cell #1 Cell #2 Experiment Set “C”
ISFI 2006International Symposium on Fire Investigation Science and Technology
217

flashover. The patterns evolved from distinct lines of demarcation to more subtle lines of demarcation; however, it is evident that the patterns existed both pre- and post-flashover. Experiment Set “B” – Living Room Ignition
Experiment set “B” (experiments #3 and #4) demonstrated remarkable similarity of the fire patterns. The loss of material patterns for the couch, loveseat, and end tables were almost identical (Figures 48-55). The ventilation patterns near the doorway were similar (Figures 48 and 49). The demarcation lines on the west wall corresponding to the airflow over the loveseat were nearly exact (Figures 48 and 49).
Figure 48-49 – Experiment Set “B”: West Wall - Cell #1 (left); Cell #2 (right)
Located on the east wall above the couch, a conical-shaped plume pattern existed in almost exact appearance between the two experiments (Figures 50 and 51). In fact, an almost perfect reproduction of the area of clean burn remained on each wall behind the couch.
Figure 50-51 – Experiment Set “B”: East Wall - Cell #1 (left); Cell #2 (right)
The remaining walls had similar truncated cone patterns, which originated from the plume on the couch (Figures 52-55).
Cell #1 Cell #2 Experiment Set “B”
Cell #1 Cell #2 Experiment Set “B”
ISFI 2006International Symposium on Fire Investigation Science and Technology
218
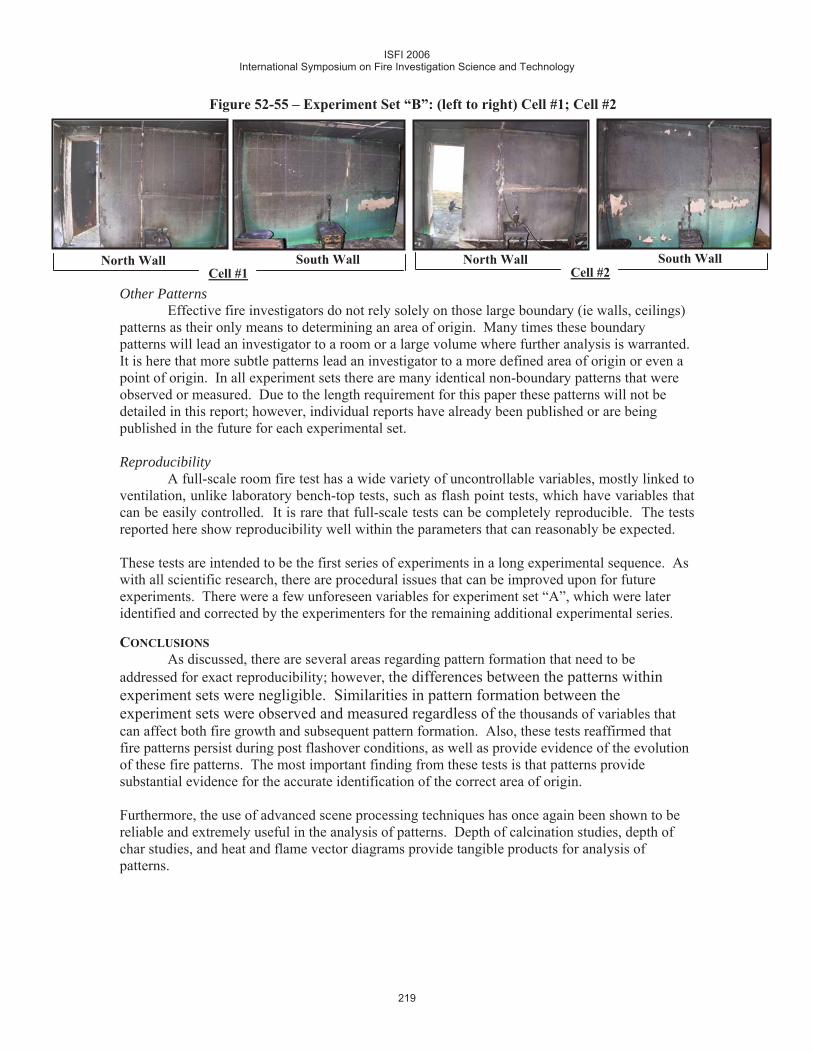
Figure 52-55 – Experiment Set “B”: (left to right) Cell #1; Cell #2
Other PatternsEffective fire investigators do not rely solely on those large boundary (ie walls, ceilings)
patterns as their only means to determining an area of origin. Many times these boundary patterns will lead an investigator to a room or a large volume where further analysis is warranted. It is here that more subtle patterns lead an investigator to a more defined area of origin or even a point of origin. In all experiment sets there are many identical non-boundary patterns that were observed or measured. Due to the length requirement for this paper these patterns will not be detailed in this report; however, individual reports have already been published or are being published in the future for each experimental set. Reproducibility
A full-scale room fire test has a wide variety of uncontrollable variables, mostly linked to ventilation, unlike laboratory bench-top tests, such as flash point tests, which have variables that can be easily controlled. It is rare that full-scale tests can be completely reproducible. The tests reported here show reproducibility well within the parameters that can reasonably be expected.
These tests are intended to be the first series of experiments in a long experimental sequence. As with all scientific research, there are procedural issues that can be improved upon for future experiments. There were a few unforeseen variables for experiment set “A”, which were later identified and corrected by the experimenters for the remaining additional experimental series.
CONCLUSIONSAs discussed, there are several areas regarding pattern formation that need to be
addressed for exact reproducibility; however, the differences between the patterns within experiment sets were negligible. Similarities in pattern formation between the experiment sets were observed and measured regardless of the thousands of variables that can affect both fire growth and subsequent pattern formation. Also, these tests reaffirmed that fire patterns persist during post flashover conditions, as well as provide evidence of the evolution of these fire patterns. The most important finding from these tests is that patterns provide substantial evidence for the accurate identification of the correct area of origin. Furthermore, the use of advanced scene processing techniques has once again been shown to be reliable and extremely useful in the analysis of patterns. Depth of calcination studies, depth of char studies, and heat and flame vector diagrams provide tangible products for analysis of patterns.
Cell #1North Wall South Wall
Cell #2North Wall South Wall
ISFI 2006International Symposium on Fire Investigation Science and Technology
219

ABOUT THE AUTHORSGregory E. Gorbett CFEI, CFPS, MIFireE. Mr. Gorbett is a staff expert fire and explosion analyst with John A. Kennedy & Associates. He holds two Bachelor of Science degrees, one in Fire Science, and the other in Forensic Science. He is currently working towards a Master’s Degree in Fire Protection Engineering at Worcester Polytechnic Institute (WPI). William D. Hicks, CFEI, IAAI-CFI, CFPS, Eastern Kentucky University. Mr. Hicks is employed as the Lab Coordinator for the Department of Loss Prevention and Safety at EKU. He also serves as the Assistant Chief of the White Hall Fire Department in Madison County, KY. He holds a Master’s Degree in Loss Prevention & Safety, and is in his second year attending the National Fire Academy’s Executive Fire Officer Program. Patrick M. Kennedy, CFEI, CFPS, MIFireE, John A. Kennedy & Associates, USA. Mr. Kennedy is a principle expert for John A. Kennedy & Associates. He serves as the Chairman of the Board of NAFI, is a member of the NFPA Technical Committee on Fire Investigations, and is Chairman of the NFPA’s Fire Science & Technology Educators Section. Ronald L. Hopkins, CFEI, CFPS, Eastern Kentucky University, USA. Mr. Hopkins is an Associate Professor in the Fire & Safety Engineering Technology program at EKU. He is a member of the NFPA Technical Committee on Fire Investigations and the Technical Committee on Fire Service Professional Qualifications. Mr. Hopkins is the Chair of the NAFI National Certification Board, and immediate past Chairman of the NFPA’s Fire Science & Technology Educators Section. END NOTES1 National Fire Protection Association, “NFPA 921 Guide for Fire and Explosion Investigations”, 2004
Edition, NFPA:Quincy, MA. 2 Kennedy, P. M., Shanley, J.H., Ward, J.. “USFA Fire Burn Pattern Test”, United State Fire
Administration Publication #FA-178, July 1997 3 Putorti, A.D. “Full-Scale Room Burn Pattern Study.”, NIJ Report 601-97, National Institute of
Justice, December 1997. FINANCIAL SPONSORS:Experiment Sets “A”, “B”& “C” John A. Kennedy & Associates TRACE Fire Protection and Safety Consultants, LTD 857 Tallevast Road 123 Redwood Drive Sarasota, FL 34243 Richmond, KY 40475 Experiment Set “A” Kodiak Enterprises, Inc. Combustion Science & Engineering, Inc. 6409 Constitution Drive 8940 Old Annapolis Road, Suite L. Fort Wayne, IN 46804 Columbia, MD 21045 Core Engineering Group 1000 J. Dodds Blvd. Suite 103-357 Mt. Pleasant, SC 29464
ISFI 2006International Symposium on Fire Investigation Science and Technology
220