full-scale embankment failure test under simulated train ... · soil investigation in the immediate...
TRANSCRIPT
Tampere University of Technology
Full-scale embankment failure test under simulated train loading
CitationLehtonen, V., Länsivaara, T., Mansikkamäki, J., & Meehan, C. (2015). Full-scale embankment failure test undersimulated train loading. Geotechnique, 65(12), 961-974. https://doi.org/10.1680/jgeot.14.P.100
Year2015
VersionPublisher's PDF (version of record)
Link to publicationTUTCRIS Portal (http://www.tut.fi/tutcris)
Published inGeotechnique
DOI10.1680/jgeot.14.P.100
Take down policyIf you believe that this document breaches copyright, please contact [email protected], and we will remove accessto the work immediately and investigate your claim.
Download date:18.01.2020

Full-scale embankment failure test under simulated train loading
V. J. LEHTONEN*, C. L. MEEHAN†, T. T. LÄNSIVAARA* and J. N. MANSIKKAMÄKI*
A full-scale embankment failure experiment was conducted in 2009 in Perniö, Finland. A small,extensively instrumented railway embankment on a soft clay foundation was brought to failure byloading over a period of 30 h. Instrumentation consisted of over 300 different measurement points,including 37 piezometers and nine automatically monitored inclinometer tubes. The relatively rapidloading simulated a heavy train coming to a standstill on the embankment. The primary purpose of theexperiment was to gather field data of a failure caused by a rapidly applied load, with an emphasis onthe pore pressure response in the clay foundation layer. The test was also used to assess the suitability ofvarious instruments for real-time stability monitoring. The embankment failure was an asymmetricbearing capacity mechanism that is hypothesised to have been triggered by an undrained creep rupture.During the last 2 h of the experiment, pore pressure and displacements increased at an accelerating ratewhile the external load was kept constant. The time-dependency of the pore pressure and displacementresponses was a key factor in the experiment. With regards to monitoring of similar in-service trainembankments, proper placement of instruments according to predicted failure mechanisms was foundto be important.
KEYWORDS: clays; creep; embankments; failure; full-scale tests; pore pressures
INTRODUCTIONFor many projects around the world, assessment of geotech-nical stability requires evaluation of the undrained capacityof clays. This capacity depends on many factors such as theeffective stresses, stress and time history, the direction andrate of loading, and temperature (Leroueil & Marques,1996). In ultimate limit state design, the undrained behaviourof a clay soil is often simplified by using a stress-independentconstant value, that is, the undrained shear strength (su).In conventional design, the effect of stress and loadinghistory is typically accounted for by determining su either insitu or at an appropriate stress level. The effects of loadingrate are typically accounted for by performing undrainedstrength tests at a standardised shear rate, and in the case ofthe field vane, the measured values are then corrected usingclay index properties (e.g. Bjerrum, 1973; Helenelund, 1977).The correction factor for su proposed by Bjerrum (1973) isperhaps the most well-known way to account for rate effects(as well as anisotropy).In conventional Finnish practice, su in clays is commonly
determined using the field vane shear test. Recently, therehave been indications in Finland that field vane shear testresults may be yielding values of su that underestimate thetrue capacity of clay soils. This phenomenon has beenattributed to problems with some of the coupling devicesthat are commonly used to measure shaft resistance whenvane shear testing is performed without casing, which canlead to overestimation of the correction for shaft resistance.For Finnish railways, this behaviour has raised the concernthat costly stability improvement actions are being performedin situations where they are unnecessary.
An alternative to the total stress analysis approachdescribed above is the undrained effective stress analysisapproach (e.g. Ladd, 1991). Following this methodology,effective stress shear strength parameters ϕ′ and c′ can reli-ably be determined from undisturbed samples in the labor-atory. Assessments of field behaviour are then performedusing effective stress shear strength analysis. The key chal-lenge with this approach is how to assess the excess porepressures that will be developed in the field as a result of theloads that are applied.The amount of excess pore pressure that is developed in the
field depends on the magnitude of the applied load, theproperties of the clay and the rate of loading. It is well knownthat creep, or viscosity, has a large influence on soft claybehaviour (e.g. Arulanandan et al., 1971; Augustesen et al.,2004). In constant strain rate oedometer tests, higher loadingrates result in higher stresses for the same amount of com-pression, which indicates that the preconsolidation pressure israte dependent (e.g. Leroueil et al., 1985; Augustesen et al.,2004). Similar behaviour can also be observed in other typesof tests that are performed to determine the shear strengthof clay (e.g. Graham et al., 1983; Leroueil et al., 1985).Typically, higher loading rates yield higher undrained shearstrength values, as shown in Fig. 1(a). The reason for this isthat higher loading rates typically result in a smaller build-upof pore pressure, as illustrated in Fig. 1(b). Fig. 1(c) shows thecorresponding effective stress paths. While the undrainedshear strength increases with rate of loading, the effectivestrength parameters are generally not significantly influenced(e.g. Janbu & Senneset, 1995). Sheahan & Kaliakin (1999)suggest a ‘correspondence principle’ that states that rate-dependency, undrained creep effects and stress relaxation areall governed by the same basic mechanisms.From a review of available literature on the behaviour of
clay soils, the following conclusions can safely be drawn:(a) yielding of clays is time dependent, and (b) yield-inducedpore pressure influences the undrained capacity of clays.While there are ample laboratory data on the time-dependentyield characteristics of clays, there seems to be very little fielddata available on this phenomenon. One real-world case
* Department of Civil Engineering, Tampere University ofTechnology, Tampere, Finland.† Department of Civil and Environmental Engineering, Universityof Delaware, Newark, DE, USA.
Manuscript received 6 June 2014; revised manuscript accepted14 July 2015.Discussion on this paper is welcomed by the editor.
Lehtonen, V. J. et al. Géotechnique [http://dx.doi.org/10.1680/geot.14.P.100]
1

where rapid loading and subsequent undrained creep willhave an effect on the stability of an embankment is a traincoming to a standstill on a railway embankment constructedover a clay foundation. The occurrence of this loading con-dition is an issue of concern for the Finnish TransportAgency, as soft clay foundations underlie railway embank-ments at a significant number of locations throughout theFinnish rail network. This type of rapid loading represents acritical condition that must be assessed to ensure adequatestability at a given railway site. Even if an undrained stabilityfailure does not occur immediately, stopped train loads thatare sustained for any period of time also have the potential toinduce undrained creep movements, potentially leading toundrained creep rupture. The use of distributed sensor net-works to monitor impending stability problems or excessivecreep movements is of particular interest to the FinnishTransport Agency, as part of assessing the on-going health oftheir rail network in real time.
As a result of a need for more field data in this area, thispaper presents results from a full-scale failure load test thatwas conducted to evaluate the undrained loading capacity ofa railway embankment on soft clay under rapid loading. Thesite was extensively instrumented, with a special emphasis onmeasuring excess pore pressure. The observations from thiscase history provide useful insight into the behaviour ofembankments that fail by way of bearing capacity and globalstability failure mechanisms.
FOUNDATION CONDITIONS AT THEEMBANKMENT TEST SITEThe embankment test site that is described in this paper is
located on the south coast of Finland, near the town ofPerniö. A non-operational railway track section that wasbuilt in the 1960s was utilised as the test site; this rail line isadjacent to the coastal railway track that connects Helsinkiand Turku. An extensive soil investigation programme wasperformed to characterise the foundation conditions at thissite, both prior to and following the failure experiment. Thesoil investigation in the immediate test area (Fig. 2) consistedof 25 soil borings performed with Swedish weight soundings(before the experiment), eight field vane shear test explora-tions, each with several vane shear test depths (before theexperiment), and 19 cone penetration tests (CPTUs) withpore pressure measurements (ten before the experiment,nine after the experiment next to the pre-failure CPTUlocations within the failure area). Before the experiment,disturbed soil samples were taken from three boreholes, andundisturbed samples from eight boreholes. Most of theundisturbed samples were taken using a Shelby tube-typepiston sampler with a diameter of 50 mm, but Geonor-typepiston samplers with 54 and 86 mm diameters were also used.The general foundation stratigraphy in the load test area
was determined using information obtained during the soilexploration process; a typical cross-section from the site isprovided in Fig. 3. As shown, the soil layers at the site (from
Axial strain, εa: % 0 2 4 6
(a) (b) (c)
8 100
5
10
15
20
25
Por
e pr
essu
re, u
: kP
a
0
10
20
30
40
0
10
20
30
40
50
60
She
ar s
tress
, τ =
(σ1–
σ 3)/2
: kP
aε1 = 6·67 × 10–7 s–1•
•
ε4 = 4·00 × 10–5 s–1•
ε2 = 2·50 × 10–6 s–1•
ε3 = 1·00 × 10–5 s–1•
ε1
•ε2•ε3
•ε4
Axial strain, εa: % 0 2 4 6 8 10
•ε1•ε2
•ε3
•ε4
•ε4•ε3•ε2
•ε1
q =
σ 1–σ
3: k
Pa
0 10 20 30 40 50p' = (σ1 +σ2 +σ3)/3: kPa' ' '
60
Fig. 1. Triaxial test results illustrating the effect of shear rate on: (a) shear stress; (b) excess pore pressure; (c) effective stress paths (data fromLänsivaara (1996))
Field vane
Undisturbed sample
Disturbed sample10 m
Car 1 Car 2 Car 3 Car 4
Excavated ditch
N
New embankment
Swedish weight sounding
CPTU
AA
Fig. 2. Plan view of embankment test site showing location of soil borings and in situ tests
LEHTONEN, MEEHAN, LÄNSIVAARA AND MANSIKKAMÄKI2
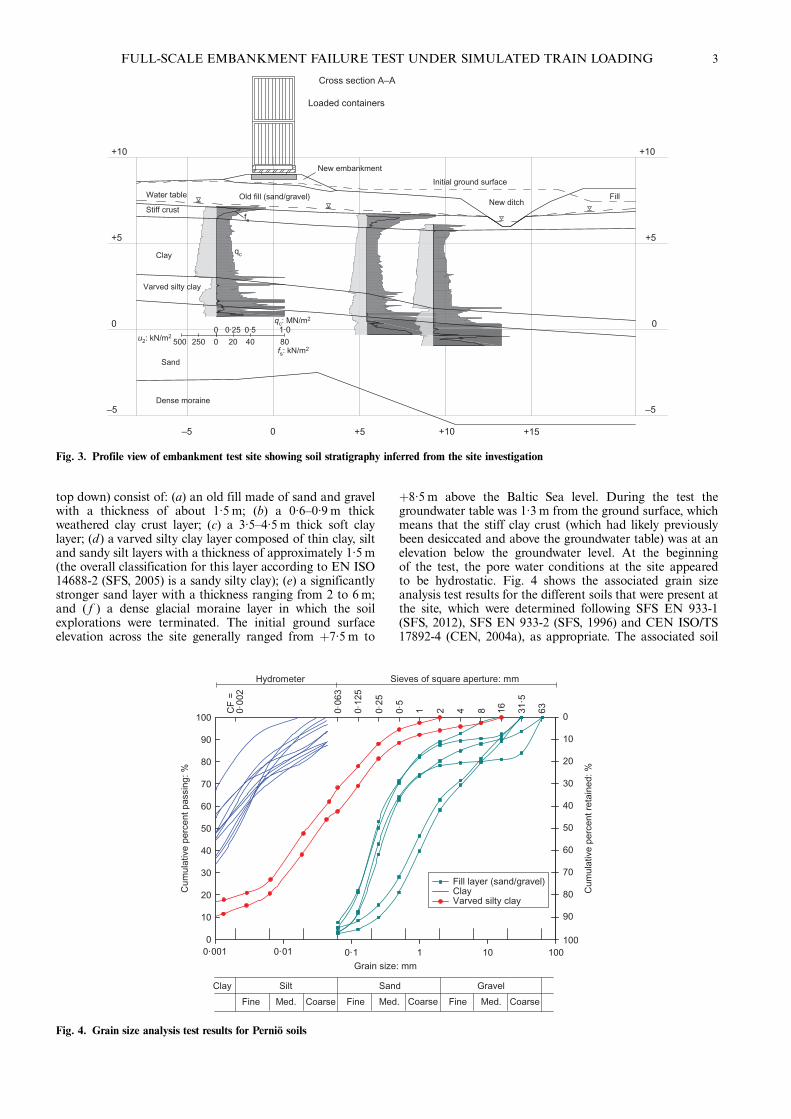
top down) consist of: (a) an old fill made of sand and gravelwith a thickness of about 1·5 m; (b) a 0·6–0·9 m thickweathered clay crust layer; (c) a 3·5–4·5 m thick soft claylayer; (d ) a varved silty clay layer composed of thin clay, siltand sandy silt layers with a thickness of approximately 1·5 m(the overall classification for this layer according to EN ISO14688-2 (SFS, 2005) is a sandy silty clay); (e) a significantlystronger sand layer with a thickness ranging from 2 to 6 m;and ( f ) a dense glacial moraine layer in which the soilexplorations were terminated. The initial ground surfaceelevation across the site generally ranged from þ7·5 m to
þ8·5 m above the Baltic Sea level. During the test thegroundwater table was 1·3 m from the ground surface, whichmeans that the stiff clay crust (which had likely previouslybeen desiccated and above the groundwater table) was at anelevation below the groundwater level. At the beginningof the test, the pore water conditions at the site appearedto be hydrostatic. Fig. 4 shows the associated grain sizeanalysis test results for the different soils that were present atthe site, which were determined following SFS EN 933-1(SFS, 2012), SFS EN 933-2 (SFS, 1996) and CEN ISO/TS17892-4 (CEN, 2004a), as appropriate. The associated soil
0
0
40
0·5
80
1·020
0·25
250500
Dense moraine
Sand
Clay
Stiff crust
Old fill (sand/gravel)
New embankment
FillNew ditch
Water table
Initial ground surface
Loaded containers
Varved silty clay
+10
+5
0
–5 –5
–5 0 +5 +10 +15
0
+5
+10
Cross section A–A
qc: MN/m2
fs: kN/m2
qc
u2: kN/m2
fs
Fig. 3. Profile view of embankment test site showing soil stratigraphy inferred from the site investigation
Grain size: mm
0·001 0·01 0·1 1 10 100
Cum
ulat
ive
perc
ent p
assi
ng: %
0
10
20
30
40
50
60
70
80
90
100
Cum
ulat
ive
perc
ent r
etai
ned:
%
0
10
20
30
40
50
60
70
80
90
100
Fill layer (sand/gravel)ClayVarved silty clay
6331·5
1684210·5
0·25
0·06
3
0·12
5
CF
=
0·00
2
Sieves of square aperture: mmHydrometer
GravelSand
Coarse
SiltClay
Med.Fine CoarseMed.Fine CoarseMed.Fine
Fig. 4. Grain size analysis test results for Perniö soils
FULL-SCALE EMBANKMENT FAILURE TEST UNDER SIMULATED TRAIN LOADING 3

classifications for these soils were determined in accordancewith SFS EN ISO 14688-2 (SFS, 2005).
From an embankment performance standpoint, the claylayer is of critical concern and was expected to govern theoverall failure behaviour. Consequently, much of the fieldexploration programme and associated field test instrumen-tation were focused on characterisation and monitoring ofthis soil layer. Geologically, this soft clay layer is quite young;it was deposited after the last ice age, presumably some 8500years ago, and it rose above the current sea level some 2000 to3000 years ago due to post-glacial rebound (e.g. Soveri &Kauranne, 1976). The general characteristics of the clay arepresented in Fig. 5. Data are shown for samples taken nearthe toe of the new embankment. The soil properties shown inthis figure were determined using a series of fall cone tests(CEN ISO/TS 17892-6 (CEN, 2004b)) and constant rate ofstrain (CRS) consolidation tests (conducted at a loading rateof 0·6%/h, using the test equipment and procedure describedby Kolisoja et al. (1987)).
As shown in Fig. 4, the clay content (,0·002 mm fraction)of the soft clay layer was in the range from 48 to 81%.Organic content tests (with heating to 800°C) on representa-tive specimens yielded organic contents in the range from0·1 to 1·0%. The measured unit weight of the soft clay rangedfrom 14·7 to 16·2 kN/m3, with an average of 15·4 kN/m3.Measured liquid limit values from the fall cone test had anaverage value of 57%. A few representative plastic limit tests(CEN ISO/TS 17892-12 (CEN, 2004c)) on samples collectedslightly outside of the study area indicate that the plastic limitfor this soil is generally in the range 29–36%. In situ watercontents in the soft clay layer varied from 62 to 90%. Theselaboratory results yield plasticity index (PI) values in therange 36–49% and liquidity index (LI) values in the range1·5–1·9. Historic leaching of salts from the clay structure byway of groundwater flow in the underlying coarser layers ispossible but not confirmed.
An average sensitivity of 40 (St¼40) was determined usingthe fall cone test, which means that the remolded undrainedstrength of the clay is generally less than 0·5 kPa. From theseproperties (especially sensitivity, remolded strength and liq-uidity index), the clay may be classified as quick clay, depen-ding on how one wishes to define it. The sensitivity andplasticity properties are also quite similar to some quick claysfound in Sweden (Rankka et al., 2004).
As shown in Fig. 5, the clay is slightly overconsolidated.The largest overconsolidation ratio (OCR.2) is found in thetop portion of the clay layer. The viscosity or rate dependencyof the clay given by the ratio Cα/Cc was in the range of 0·06 to0·08, which is typical for similar Finnish inorganic clays.
Field vane shear test (in accordance with SGY (1999))results from three combined soundings through the clay andvarved silty clay layers are shown in Fig. 6. Near the top ofthe soft clay layer the minimum measured undrained shearstrengths were in the range from 9 to 12 kPa and the averagestrength increase with depth was 1·15 kPa/m. A series ofisotropically consolidated undrained shear triaxial com-pression tests were also performed, which indicated a peakfriction angle of 25° for the soft clay.
TEST LAYOUTAs shown in Fig. 2 and Fig. 3, a new 0·6 m high railway
embankment having a length of 60 m was constructed at theexisting track location, 9 weeks prior to the load test. Thereason for constructing this new embankment (or ‘ballastlayer’) was that the old superstructure was deemed to be tooweak to support the designed loading. The old woodensleepers and light rails from the original track were alsoreplaced with concrete sleepers and heavier rails. The sideslopes of this embankment were generally 1:2. To reduce theoverall stability at the site, 10 weeks before the experimenta 0·3 to 0·6 m layer of top soil was removed next to theembankment. Additionally, a 2 m deep ditch, 7 m wide,with a 1:1·5 side slope on the embankment side was exca-vated approximately 13·5 m from the embankment centreline(Fig. 3), to further reduce stability and to control the extentsof the failure.
Field vane shear strength, su: kPa
Ele
vatio
n, z
: m
00 10 20 30
1
2
3
4
5
6
7
8
Fill
Clay
Varvedsilty clay
Sand
Stiff crust
Groundwater table
Fig. 6. Undrained strength characteristics of Perniö clay
Moisture content, w: %
Ele
vatio
n, z
: m
030 40 50 60 70 80 90 10 20 30 40 50 60 70 14 15 16 17 18 0 20 40 60 80 100 120
1
2
3
4
5
6
7
8
In situ moisture content, w Liquid limit, wL
Sensitivity, St = su/ sur Unit weight, γ : kN/m3
γ = 17·8 kN/m3
γ = 15·4 kN/m3
γ = 19·0 kN/m3
γ = 17·0 kN/m3
Fill
Clay
Varved silty clay
Sand
Stiff crust
Groundwater table
σc'
σv0'
Precon. pressure, σc: kPa '
Fig. 5. General characteristics of Perniö clay, from samples taken at embankment toe
LEHTONEN, MEEHAN, LÄNSIVAARA AND MANSIKKAMÄKI4

A train coming to a standstill on the embankment wassimulated by gradually filling modified shipping containerswith sand. The containers rested on four steel frameworksthat simulated four typical 12 m long two-bogey rail cars(Fig. 7). Each car had a stack of 2þ2 containers. The tops ofall containers and floors of the top containers were removedso as to be able to fill them without having to add the top rowduring the test. The frameworks distributed the load tothe embankment by wayof I-beams resting on the tracks. The
beams were positioned so that they realistically matched atypical Finnish train axle configuration.
IN SITU INSTRUMENTATIONThe two primary purposes of the in situ instrumentation
were to collect data regarding the soil response duringloading and failure, and to test the suitability of various insitu sensor systems for monitoring embankment stability
Each car consisted of2+2 shipping containersStacked containers were modified so that they wereopen from top to bottom
2·00 m2·00 m
12·00 m
(a)
(b)
Containers graduallyfilled with sand
Longitudinal beams2 × HE300B
Transverse beams (axles)4 × HE220B
4·00 m
Fig. 7. (a) Test site and containers before loading; (b) container layout used to simulate train car loading pattern
Car 1
Excavated ditch
Car 3
AAN
10 m
PrismSettlement tube and pressure transducerInclinometerSlip indicator tube/surveying pointPiezometerEarth pressure transducer
Car 4Car 2
1339
I4
I5
I6
41
43
Fig. 8. In situ instrumentation layout at the Perniö test site. Piezometers, inclinometers and settlement transducers, the data from which arepresented in Fig. 11, are shown using black symbols
FULL-SCALE EMBANKMENT FAILURE TEST UNDER SIMULATED TRAIN LOADING 5

under heavy train loading. The instrumentation was veryextensive, with nearly 300 measurement points in the testarea. Nearly all measurements were automated and con-stantly monitored during the experiment. A general map ofthe in situ instrumentation is provided in Fig. 8; thisinstrumentation is described below.
(a) Thirty-seven strain-gauge based piezometers wereinstalled in a cross-section in the central part of thearea. The piezometers used were foil-type units with amaximum pressure of 200 kPa. They were installed inthe soft clay layer 3 weeks prior to the experiment bypushing them manually to the desired depth using aninsertion rod. The intended function of the piezometerswas to measure the yield-induced excess pore pressureclose to failure at the slip surface. To be able to positionthe sensors in a useful manner, extensive pre-experimentstability analyses were carried out to predict the prob-able location of the failure zone. The piezometers werepositioned in four groups: under the embankment cen-treline, under the embankment toe, halfway between theembankment and the ditch, and next to the ditch. In eachgroup the piezometers were installed at 0·25m depthintervals at the expected soil shear failure locations.The piezometers were installed with a 1m horizontalspacing in the direction of the embankment so as toreduce the effects of soil disturbance. An additionaldeployment of five piezometers was utilised ina longitudinal pattern under the embankment centrelinebeneath the stiff clay crust layer to study the effect ofnon-uniform load distribution caused by the frameworks.
(b) Twenty-seven surveying prisms were positioned onthe soil surface and the loading containers, whichwere monitored by two robotic total stations. The totalstations were equipped with a monitoring routine thatcycled through the prisms and also periodically checkedfor the orientation and location of the total stationsthemselves.
(c) Nine automatic two-axis inclinometers were installed inthree cross-sections. Each ‘in-place’ inclinometer tubecontained several inclination transducers at predeter-mined depths (0·5 m vertical spacing) that automati-cally logged the inclination profile of the tube at set timeintervals.
(d) Three settlement tubes, with a total of 53 pressuretransducers, were deployed throughout the test area.These custom-built automatic settlement tubes weredeveloped at the soil and foundation structures lab-oratory at Tampere University of Technology (TUT).Each device consists of a flexible liquid-filled tubewhich contains pressure transducers at pre-determinedlocations. The tube is installed in the soil so that one endof the tube is fixed at a certain height level. Whenvertical displacements occur in the monitored area, thehydrostatic pressure acting on the transducers changes.The pressure changes are automatically recorded bythe transducers, and the resulting data can be used tocalculate the associated vertical displacements. Threetubes were used in the load test experiment (havinglengths of 65 m, 70 m and 110 m) with 53 total trans-ducers (six, 19 and 28 transducers in each tube,respectively).
(e) Five total stress earth pressure transducers wereemployed under the embankment. The vertical stressdistribution under the train load was measured withfive large-diameter (D¼384 mm), custom-built earthpressure transducers (manufactured at TUT) that wereinstalled in the sand fill layer 1·5 m from the top of theembankment, along its centreline.
(f) Seventy-six slip indicators were used with surveyingpoints on the surface, which were measured before andafter the experiment. These in situ test devices consistedof flexible tubing that was installed vertically in the soil,which was used to determine the slip surface depth afterthe failure. Post failure, the depth of the slip surface wasmeasured by lowering a 0·5 m long rod suspended on acable down each tube until it could not advance anyfurther. In addition, the surface ends of the tubes hadsurveying points installed. These points were surveyedbefore and after the experiment to map the groundsurface movements in the test area.
(g) Thirty-two strain gauges were employed on the frame-works for weighing the containers. In order to accu-rately weigh the containers as they were loaded, theframeworks were equipped with strain gauges. Thegeneral effectiveness of this technique was confirmedby comparing the applied load measurements fromthe strain gauges against the known mass of the sandthat was loaded onto the conveyor belt during theloading process.
TEST PROCEDURE AND OBSERVATIONSLoading of the embankment began on 20 October 2009;
the defined start time (t¼0) for the failure experiment was15:30, and time stamps for various events during the load testare given as time elapsed (t¼h:min) from this point. Loadingwas performed in increments using a telescopic conveyorbelt. In each loading increment a load of 15 t was added toeach car, corresponding to a 4·7 kPa train load increment.The applied load under each car is calculated using thefollowing equation
qapp ¼ Wsand þWc
LcBcð1Þ
where qapp¼applied bearing pressure under a given car(kPa); Wsand¼weight of sand loaded into a given car (kN);Wc¼dead weight of the containers and framework of agiven car, ca. 125 kN; Lc¼ length of car including spacing¼12·5 m; and Bc¼width of the sleepers¼2·5 m.For comparison purposes, the highest allowed axle load on
the Finnish rail network is 25 t. For the four-axle ‘cars’ usedin the experiment this corresponds to an applied bearingpressure of approximately 31 kPa. Fig. 9 shows the appliedbearing pressure for each car over time during the Perniö loadtest. As shown, during the first 3 h of loading a train load of24 kPa was applied on the two middle cars, and 21 kPa was
Time, t: h
App
lied
bear
ing
pres
sure
, qap
p: k
Pa
0
0 5 10 15 20 25 30
10
20
30
40
50
60
70
80
90
Mas
s pe
r un
it le
ngth
, mL:
t/m
0
2
4
6
8
10
12
14
16
18
20
22
Car 1Car 2Car 3Car 4
Fig. 9. Applied bearing pressure beneath each car over time during thePerniö load test
LEHTONEN, MEEHAN, LÄNSIVAARA AND MANSIKKAMÄKI6

applied on the two outer cars. The load of the outer cars wasintentionally kept slightly lower than the centre cars so as totrigger the eventual failure at the centre part of the area. Thevalue of mass per unit length (mL) shown on the right axis ofthis figure was obtained using the equation: mL¼qapp�Bc.Although the loading in this figure is presented as uniform, itshould be noted that in reality the load distribution in the soilvaries slightly along the length of the embankment due to therealistic axle geometry of the cars.The loading was halted at t¼3:20 for the night and con-
tinued in the morning of 21 October (t¼16:45). Throughoutthe loading process, gradual linear increases of displacementsand pore pressures were recorded. The containers wereloaded at an average rate of approximately 5·5 kPa/h untilthe loading was ended at t¼28:04. At this point, the centrecontainers had been completely filled to a load of 87 kPa(with the outer containers at 85 kPa). Under this constantload, displacements and pore pressures continued to increase.Accelerating pore pressure and displacement increases wererecorded before failure. The first visual cues of an impendingembankment failure were only minutes before failure whenthe cars began to tilt away from the instrumented side of theembankment. A total failure of the embankment occurred att¼29:57, when the containers quickly sank and fell to theirsides. Simultaneously, the soil next to the embankmentmoved upwards and laterally towards the ditch (Fig. 10).Figure 11 provides some recorded observations of the
failure behaviour of the Perniö railway embankment.Fig. 11(a) shows measured vertical and horizontal displace-ments and excess pore pressure from representative sensorsfrom the middle of the test area (close to cross-section A–A).Fig. 11(b) shows the corresponding rates of change forthe quantities presented in Fig. 11(a). The applied bearingpressure line (qapp) corresponds to the applied bearingpressure beneath car 2. The vertical displacement data (Δz)correspond to readings from representative settlement tubesensors at the embankment crest, embankment toe, halfwaybetween the embankment and ditch, and at the edge of theditch. The inclinometer data are the horizontal displacement(Δx) in three inclinometer tubes (I4, I5 and I6) at elevationsþ4·2 m, þ4·0 m and þ3·9 m, respectively. The chosenelevation level of approximately þ4m roughly correspondsto the level of highest displacement in tubes I4 and I5. Theexcess pore water pressure (Δu) data shown represent the
average pore pressure values from groups of sensors (asdiscussed in more detail in the next section).The data shown in Fig. 11(b) result from the differentiation
of the data in Fig. 11(a); the raw differentiated data aresmoothed with a simple exponential moving average filter(e.g. Holt, 2004) with a B value of 0·03. This large level ofsmoothing was required as the unsmoothed differentiateddata are very noisy.As shown in Fig. 11, yielding of the soil began at around
t¼26:40; this start of yield is subject to interpretation, andappears a little more clearly in the Fig. 11(b) plots than in theFig. 11(a) plots. As shown, loading was completed at t¼28:04, and failure of the embankment then occurred at t¼29:57. A more detailed discussion of the field measurementstaken during the field test and after failure is provided in thefollowing sections.
PORE PRESSURE RESPONSE DURING THEEMBANKMENT LOAD TESTThis section discusses the recorded pore pressure response.
The following sensor behaviour groups were establishedbased on location and qualitative pore pressure response(the average data from each of these groups are what ispresented in Fig. 11)
• CL upper: under the embankment centreline, elevationsþ4·5 to þ5·25 m (four piezometers)
• CL lower: under the embankment centreline, elevationsþ3·5 to þ4·25 m (four piezometers)
• toe: under the embankment toe, elevations þ2·25 toþ4·25 m (eight piezometers)
• mid: midway between the embankment toe and the ditch,between elevations þ2·5 to þ4·0 m (seven piezometers)
• edge: next to the ditch, between elevations þ3·25 andþ4·5 m (four piezometers).
Clearly malfunctioning sensors (a total of four) were omittedfrom the data. For post-experiment analysis the piezometersunder the embankment centreline were divided into twosubgroups (i.e. CL upper and CL lower) owing to the dis-tinctly different pore pressure response that was observed atdifferent elevation levels (above or below þ4·5 m).
Fig. 10. Post-failure photograph of the embankment failure area at the Perniö test site
FULL-SCALE EMBANKMENT FAILURE TEST UNDER SIMULATED TRAIN LOADING 7
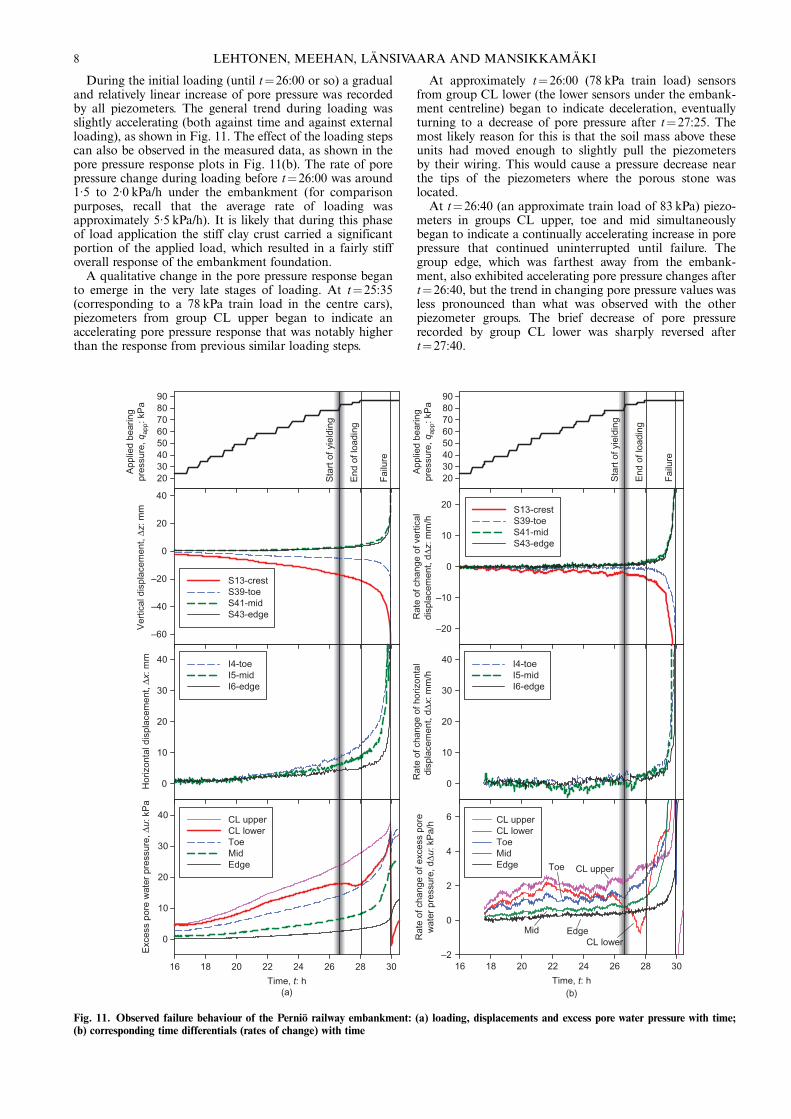
During the initial loading (until t¼26:00 or so) a gradualand relatively linear increase of pore pressure was recordedby all piezometers. The general trend during loading wasslightly accelerating (both against time and against externalloading), as shown in Fig. 11. The effect of the loading stepscan also be observed in the measured data, as shown in thepore pressure response plots in Fig. 11(b). The rate of porepressure change during loading before t¼26:00 was around1·5 to 2·0 kPa/h under the embankment (for comparisonpurposes, recall that the average rate of loading wasapproximately 5·5 kPa/h). It is likely that during this phaseof load application the stiff clay crust carried a significantportion of the applied load, which resulted in a fairly stiffoverall response of the embankment foundation.
A qualitative change in the pore pressure response beganto emerge in the very late stages of loading. At t¼25:35(corresponding to a 78 kPa train load in the centre cars),piezometers from group CL upper began to indicate anaccelerating pore pressure response that was notably higherthan the response from previous similar loading steps.
At approximately t¼26:00 (78 kPa train load) sensorsfrom group CL lower (the lower sensors under the embank-ment centreline) began to indicate deceleration, eventuallyturning to a decrease of pore pressure after t¼27:25. Themost likely reason for this is that the soil mass above theseunits had moved enough to slightly pull the piezometersby their wiring. This would cause a pressure decrease nearthe tips of the piezometers where the porous stone waslocated.At t¼26:40 (an approximate train load of 83 kPa) piezo-
meters in groups CL upper, toe and mid simultaneouslybegan to indicate a continually accelerating increase in porepressure that continued uninterrupted until failure. Thegroup edge, which was farthest away from the embank-ment, also exhibited accelerating pore pressure changes aftert¼26:40, but the trend in changing pore pressure values wasless pronounced than what was observed with the otherpiezometer groups. The brief decrease of pore pressurerecorded by group CL lower was sharply reversed aftert¼27:40.
Hor
izon
tal d
ispl
acem
ent,
∆x: m
m
0
10
20
30
40 I4-toeI5-midI6-edge
App
lied
bear
ing
pres
sure
, qap
p: k
Pa
2030405060708090
Sta
rt o
f yie
ldin
g
End
of l
oadi
ng
Fai
lure
(a)
Ver
tical
dis
plac
emen
t, ∆z
: mm
–60
–40
–20
0
20
40
S13-crestS39-toeS41-midS43-edge
–2
0
2
4
6 CL upperCL lowerToeMidEdge
0
10
20
30
40 I4-toeI5-midI6-edge
2030405060708090
Sta
rt o
f yie
ldin
g
End
of l
oadi
ng
Fai
lure
CL upper
EdgeCL lower
Mid
Toe
Rat
e of
cha
nge
of v
ertic
aldi
spla
cem
ent,
d ∆z:
mm
/h
Rat
e of
cha
nge
of h
oriz
onta
ldi
spla
cem
ent,
d∆x:
mm
/h
Rat
e of
cha
nge
of e
xces
s po
rew
ater
pre
ssur
e, d
∆u: k
Pa/
h
–20
–10
0
10
20 S13-crestS39-toeS41-midS43-edge
Time, t: h
Exc
ess
pore
wat
er p
ress
ure,
∆u:
kP
a
0
16 18 20 22 24 26 28 30
10
20
30
40 CL upperCL lowerToeMidEdge
App
lied
bear
ing
pres
sure
, qap
p: k
Pa
(b)Time, t: h
16 18 20 22 24 26 28 30
Fig. 11. Observed failure behaviour of the Perniö railway embankment: (a) loading, displacements and excess pore water pressure with time;(b) corresponding time differentials (rates of change) with time
LEHTONEN, MEEHAN, LÄNSIVAARA AND MANSIKKAMÄKI8

Loading was ended at t¼28:04, with the load in the centrecars being held constant at 87 kPa. This had no visible effecton the already accelerating trend of pore pressure increase.More drastic accelerations of pore pressure increase were
recorded in the toe and mid groups at t¼28:40, and the edgegroup at t¼29:20. Groups CL upper and CL lower exhibitedsimilar ‘final accelerations’ at t¼29:30 (exact times are sub-ject to interpretation). The authors speculate that these finalaccelerations in pore pressure response may have been tosome extent caused by the total failure of the stiff clay crustlayer, which would have further increased the load acting onthe soft clay layer.Figure 12 shows the profile of excess pore pressure in the
centre cross-section A–A at t¼28:00 (end of loading), at t¼29:30 (ca. 28 min before failure) and right before final failure.The contours are interpolated between individual readings(with the results from malfunctioning sensors omitted). Thegeneral shape of the slip surface and its progression with timeat constant loading can be observed in the pore pressurecontours.Failure occurred at t¼29:58. Table 1 shows the measured
highest and average Δu values before failure (t¼29:57), andthe average Δu values immediately after failure (t¼29:59) foreach piezometer group.At failure, sensors in the CL lower group instantaneously
exhibited a very large drop in pore pressure, with manyeven indicating suction. Groups CL upper, toe and midalso indicated slight drops in pore pressure at failure, buttheir magnitudes were quite small compared to the CL lowergroup. The measured drops in all cases were very temporary,as the pore pressure quickly began to increase again. Thispost-failure increase lasted for approximately 50–65 h beforeapproaching steady values. Pore pressure measurements werecontinued for 8 days after the experiment. During this timethe measured pore pressures remained at a high level, with aslightly decreasing trend.A likely explanation for the sharp drop in pressure that was
observed in the CL lower group readings is that the piezo-meters were rapidly pulled out from their positions at failure(i.e. similar behaviour as what was observed with the CLlower sensors after t¼27:25). The subsequent fast increasein pore pressure after failure would indicate local equili-bration of pore pressure around the sensor after its pullout. Itis likely that the piezometers indicating a large drop in porepressure (i.e. the CL lower group) were outside the finalfailure surface.
DISPLACEMENT RESPONSE DURING THEEMBANKMENT LOAD TESTA response similar to what was observed with the pore
pressure measurements was also observedwith the horizontaland vertical displacement monitoring systems. As shown inFig. 11, the vertical and horizontal displacement responsesduring initial loading exhibited a fairly flat slope, with anychanges in slope reasonably being attributed to the
corresponding increase in load that was being applied. Asnoted previously, some observed changes in pore pressurebehaviour began to occur around 26:40; after this point,more significant changes were generally observed to occur inmost sensors. Associated horizontal movements during the
02
Lateral distance: m
4
6
Ele
vatio
n: m
8
2 4 6
(a)
(b)
(c)
8 10
1020
00
10
20
Exc
ess
pore
pre
ssur
e: k
Pa
3030
40
50
60
2
Lateral distance: m
4
6
Ele
vatio
n: m
8
2 4 6 8 10
0
Lateral distance: m
2 4 6 8 10
102030
40
4050
1020
2
4
6
Ele
vatio
n: m
8
Fig. 12. Excess pore pressure profile inferred from piezometermeasurements along cross-section A–A, at: (a) t=28:00; (b) t=29:30; (c) t=29:57. The full load has been applied at all stages.Piezometer locations are shown
Table 1. Measured Δu values before and after failure
Pore pressuresensor group
Highest Δu value before failure(t¼29:57) and the average sensor
elevation level
Average Δu valuebefore failure (t¼29:57): kPa
Average Δu value immediatelyafter failure (t¼29:59): kPa
CL upper 41·2 kPa; þ5·25 m 37·9 30·5CL lower 38·3 kPa; þ3·75 m 33·9 �1·3Toe 59·4 kPa; þ2·75 m 35·0 27·8Mid 32·9 kPa; þ2·75 m 23·2 22·2Edge 9·2 kPa; þ4·0 m 7·1 7·4
FULL-SCALE EMBANKMENT FAILURE TEST UNDER SIMULATED TRAIN LOADING 9

yielding process that were recorded in the foundation soil byinclinometers at the toe, mid and edge locations are providedin Fig. 13. Fig. 14 shows the vertical displacement measure-ments that were recorded by settlement tubes at the groundsurface during the same time frame, along the embank-ment crest and perpendicular to the embankment alongsection A–A.
As shown in Fig. 11, Fig. 13 and Fig. 14, horizontal andvertical displacements continued to occur at a constant loadlevel (87 kPa) past t¼28:00, increasing at an acceleratingrate until failure. Data from inclinometers and total stationmeasurements indicated that during loading and prior tofailure the soil mass between the embankment and the ditchmoved so that lateral displacements on the ground surface(not shown here) were fairly uniform regardless of thedistance from the embankment.
As shown in Fig. 13, the horizontal displacements thatoccurred were dominated by movement in the soft clay layer.Some significant movements were also observed in theunderlying stratified silty clay layer, especially at the midpointlocation (i.e. inclinometer I5). It is hypothesised that asignificant amount of the observed displacements in the siltyclay layer may have been caused by inclinometer tube move-ments in the soft clay layer, which dragged the underlying
tube section along in the somewhat stiffer layer. This hypothesisis supported by other field measurements and analyses.The vertical displacement response along the embankment
centreline exhibited a fairly uniform and consistent trend(Fig. 14(a)), yielding a ‘bowl-shaped’ depression as move-ment occurred. Perpendicular to the embankment, themagnitude and direction of the measured vertical displace-ments were highly dependent on the distance from theembankment (Fig. 14(b)). The embankment exhibited dis-placement downwards under the load area, while a signifi-cant portion of the area between the embankment and theditch moved upwards. The largest pre-failure settlements(�85 mm) were observed at the embankment crest close tothe centre cross-section (Fig. 14(a)). The largest upwarddisplacements (þ35 mm) occurred close to halfway betweenthe embankment and the ditch, approximately 7 m awayfrom the embankment centreline (Fig. 14(b)). At the embank-ment toe vertical displacements were very small, which is aresult of the particular failure geometry that occurred.
POST-FAILURE DISPLACEMENTSFigure 15 shows the final horizontal displacement vectors
that were recorded from the ground surface surveying points.
Lateral displacement, ∆x: mm
Ele
vatio
n, z
: m
–2
–1
0
0 20 40
(a) (b) (c)
60 80
1
2
3
4
5
6
7
8
26:30 (78 kPa)28:00 (87 kPa)29:00 (87 kPa)29:30 (87 kPa)29:55 (87 kPa)
I4 - Toe I5 - Mid I6 - Edge
Soft clay Soft clay Soft clay
29:55
29:5
5
29:3
0
28:0
026
:30
29:0
0
29:55
29:3
0
29:0
028
:00
26:3
0
29:3
029
:00
26:3
0
28:0
0
Lateral displacement, ∆x: mm
0 20 40 60 80
Lateral displacement, ∆x: mm
0 20 40 60 80
Ele
vatio
n, z
: m
–2
–1
0
1
2
3
4
5
6
7
8
Ele
vatio
n, z
: m
–2
–1
0
1
2
3
4
5
6
7
8
Fig. 13. Horizontal displacement measurements in the foundation: (a) at embankment toe; (b) at midpoint between embankment and ditch;(c) at edge of ditch
Distance along embankment, y: m
Ver
tical
dis
plac
emen
t, ∆z
: mm
–80
–30 –20 –10 –10 10 2000
(a) (b)
10 20 30
–60
–40
–20
0
20
40
Distance perpendicular to embankment, x: m
26:35 (78 kPa)28:04 (87 kPa)29:00 (87 kPa)29:30 (87 kPa)29:57 (87 kPa)
Loaded areaLoaded area
Perpendicular section location
Parallelsection location
Ele
v., z
: m
6789
26:35
29:00
26:35 28:04
29:00 29:30
29:57
29:30
29:57
28:04
Fig. 14. Vertical displacement measurements at the ground surface: (a) along embankment crest; (b) perpendicular to embankment alongsection A–A
LEHTONEN, MEEHAN, LÄNSIVAARA AND MANSIKKAMÄKI10

As shown, the failure was confined between the embankmentand the ditch, with practically no displacements beingobserved beyond the ditch. The width of the failure areawas approximately 50 m, roughly the loaded length of theembankment. Owing to a locally stiffer and thinner layer ofsoft clay, the displacements near car 4 were slightly smallerthan those at the other end of the loaded area (car 1).The largest measured ground surface deformations post-
failure occurred under car 2, and were generally consistentwith the observed pre-failure deformation pattern. Thelargest measured embankment settlement after failure was�1·07 m, the largest heave was þ0·70 m (at 10·9 m from thecentreline of the embankment), and the largest lateral surfacemovement was 0·98 m. It should be noted that the largestembankment settlement was likely more than the valuemeasured by the settlement tubes, but for safety reasons itcould not be confirmed by other more direct means.After the total failure of the embankment, no further soil
movements outside the limits of measurement accuracy wererecorded with any of the monitoring systems. This indicatesthat the soil mass reached its new equilibrium practicallyinstantaneously at failure.
SLIP SURFACE AND FAILURE MECHANISMPost-failure measurements of the slip surface location
remained generally inconclusive. At failure the inclinometertubes had moved with and in relation to the soil mass atfailure. Some tubes were also dislodged from their bottomanchor point at failure. Thus the post-failure locations of theinclinometers’ measurement points were unclear. The slipindicator tubes also proved inconclusive. The tubes hadsignificant bending above the actual shear zone, and in mostcases the 500 mm steel rod used for probing was stopped veryclose to the surface due to the large displacements that hadoccurred.The best information on the shape of the failure surface
comes from the pre-failure pore pressure readings, coupledwith general observations from the inclinometer readings.Fig. 16 shows the ‘best guess’ failure surface location that wasdetermined by analysis of the different sensors. In general,observations indicate a zone of high shear deformations in
the soft clay layer rather than formation of a distinct slipsurface, so the discrete failure surface that is shown couldalso perhaps be expressed as a zone of general plastic sheardeformation of varying magnitude (Fig. 16). As shown, theinferred shear zone extended from behind the railway sleepersto the lower level of the soft clay layer under the embankmenttoe. From there it gradually curved back up, ending at thebottom of the ditch. Observed inclinometer movements inthe varved silty clay layer that underlies the soft clay layer arelargely attributed to dislodgement and dragging of the lowerportions of the inclinometer casing as a result of the largestrains that occurred in the soft clay layer.The field data and associated observations point to a
bearing capacity type failure. The failure mechanism likelycontained an active zone beneath the loaded area that moveddown and outward, a direct shear zone under the embank-ment toe, and a passive zone that moved upwards andoutwards towards the ditch (Fig. 16). At failure a distinctcrack (with awidth up to 0·5 m) opened on the soil surface atthe embankment toe. It is believed that this crack extended tothe bottom of the fill layer.
DISCUSSIONA noteworthy finding from this study is that a significant
change in the pore pressure and displacement responseoccurred only at a very late stage in the experiment. Thehighest rates of change in both pore pressures and displace-ments were measured only after loading ended, during thetime period when the rapidly applied load was kept constant.The likely reason for this behaviour lies in the time- andrate-dependent behaviour of the soft clay layer. The describedbehaviour points to an undrained creep rupture caused by theconstant external load.Following the hypothesised mechanism of failure, the
deviator stress in the clay beneath the embankment wasraised to a high level close to failure due to the applied load.Under this condition, the resulting shear-induced excess porepressure is partly governed by the viscous properties of theclay, that is, creep. Under a constant load, measured porepressures increased at an accelerating rate until failure. In thissense, the experiment is analogous to an undrained creep test
Surface crack
Horizontaldisplacementvectors (scaled 2 ×)
Approximate extents of failure
10 m
N
Car 1 Car 2 Car 3
A
Car 4
A
Fig. 15. Measured horizontal displacement vectors at ground surface from the beginning to the end of the experiment, at the various survey pointlocations. Also shown are approximate extents of failure and a surface crack that opened up at failure
FULL-SCALE EMBANKMENT FAILURE TEST UNDER SIMULATED TRAIN LOADING 11

that leads to failure at a sufficiently high deviator stress (e.g.Sheahan, 1995). During undrained shear, lightly overconso-lidated clay tends to contract, which causes an increasein pore pressure such that a constant volume condition ismaintained. This response is dependent (among other things)on the loading rate, or the time a constant load increment issustained.
For the field study described here, it is likely that the onsetof failure was fairly localised, with failure first occurringsomewhere close to the embankment, followed by progressivefailure throughout the shear band. Given the nature of therecorded data, it is difficult to find clear indicators of failureprogression from one location to another. It is quite possiblethat the observed time-dependency of the pore pressureresponse is due in part to progressive development of theshear band and associated localised shear stress/strainconcentrations. Over time, as the shear band formed, porepressures would have increased accordingly along the entireslip surface.
The highest pore pressure at failure was measured at thetoe of the embankment (Fig. 12). This pore pressureconcentration may be due to the proposed sliding mechanism(Fig. 16) where a downward-moving ‘active’ soil blockmay have transitioned into a more horizontally displacingsliding mass, causing large strains and stress concentrations.
Overall, it is believed that the failure occurred under ‘true’undrained conditions due to the relatively low permeabilityof the foundation soils involved, and the short duration ofloading prior to failure. Given these constraints, it is expectedthat pore water migration would have occurred only over arelatively thin zone of soil that was adjacent to one of themore permeable boundaries.
This proposed mechanism of failure is generally consistentwith what has been noted by others (e.g. Arulanandan et al.,1971; Holzer et al., 1973), who observe that once a certainthreshold level of deviator stress is reached, subsequentundrained creep will lead to a continually increasing rate ofstrain and pore pressure increase, eventually leading tofailure. Higher deviator stress levels lead to a reduced timeto failure and vice versa. Below a threshold level of deviatorstress, undrained creep will not cause the soil to fail, with thesoil instead reaching a certain constant equilibrium stressstate below the failure envelope.
Thinking back to the general ‘stopping train’ problemthat this load test was designed to simulate, there is thusno single failure load value that can be determined withouttaking time into account. Instead, failure for a given setof soil conditions is governed by both the magnitude ofthe applied load (i.e. the applied deviator stress), and thetime over which that load will be sustained. Possible stress
paths to failure under the embankment, with loadingcorresponding to different deviator stress levels, are shownin Fig. 17.Following these observations, for a given ‘stopped train’
problem, it should be possible to determine a safe load levelthat will not cause failure after any amount of time. Thiscondition would correspond to a shear stress level that is lowenough not to lead to a creep failure of the soil. One suchapproach that may be useful in this regard has been proposedby Sheahan (1995), who suggested that a ‘static yield surface’be determined by a series of undrained triaxial creep tests orsufficiently slow CRS triaxial tests.The issue of ultimate bearing capacityof the Perniö loading
test has also been researched by Mansikkamäki (2015), whoused advanced elasto-viscoplastic soil models that accountfor soil creep. According to these studies, a 70–80 kPa loadwould have been sufficiently large enough to cause a creepfailure if it was sustained for a long enough duration.It appears likely that the stiff clay crust had a large
distributing effect on the applied load during initial loading,which would explain the initially stiff response of thefoundation soils. The sudden changes in pore pressure anddisplacement that occurred in the final stages of the test couldhave been partly caused by a general failure of the stiff claycrust layer.The best indicators for an impending failure seem to have
been the excess pore pressure response under the embankmenttoe, the embankment settlement and lateral movements in thesoil. The rates of change in the pore pressure response (dΔu/dt)or displacement (ds/dt) appear to be more reliable safety
BC
A
D
p' = (σ1 +σ2 +σ3)/3' ' '
q =
σ1 –
σ 3'
'
C' B'
Fig. 17. Conceptual example of hypothesised effective stress pathsunder embankment. ABC: Stress path in the test. ABD: Possible stresspath if loading had been continued further (less time to failure, lessshear-induced pore pressure Δus). AB′C′: Possible stress path ifloading had been stopped earlier (more time to failure, more Δus)
Toe Mid
Edge
Surface afterfailure
Surface beforefailure
Observed surface crack
Approximateband of shearing
CLupper
CLlower
Water table
+10
+5
00
0
+5
+5
+10
+10–5
Fig. 16. Hypothesised failure surface location and general band of shearing based on overall analysis of field sensor data. Piezometer locationsare shown
LEHTONEN, MEEHAN, LÄNSIVAARA AND MANSIKKAMÄKI12

indicators than the measured absolute values themselves. Hadthe case been a real-life embankment under monitoring, anyclear alarm limits would have been very difficult to determinein real time owing to large variation in the measured variables.The present authors’ experience with this project has
indicated that the proper positioning of monitoring equip-ment is a case-sensitive issue and should be based onsufficient stability analyses that identify the most probablefailure mechanisms. With regards to monitoring of similarin-service train embankments, proper placement of instru-ments according to predicted failure mechanisms is conse-quently clearly important.
CONCLUSIONSA small railway embankment on soft clay subsoil was
brought to failure with rapid loading, simulating a traincoming to a standstill. The embankment was loaded witha ‘train-sized’ finite area surcharge that was increased up to87 kPa, over the course of 28 h. The embankment failed att¼29:57 from the start of the experiment, under a steadysustained surcharge of 87 kPa. The observed shear geometryindicated an asymmetric bearing capacity mechanism offailure. The failure was evidently triggered by an undrainedcreep rupture.The main conclusions from this failure experiment are
given below.
(a) A review of previous literature indicates that thepore pressure and deformation response of soft clayunder undrained loading is highly time and ratedependent. Similar behaviour was observed in thecurrent failure experiment, in which undrained creeprupture seems to have been the governing mode offailure.
(b) Owing to conclusion (a), the ultimate bearingcapacity of an embankment on soft clay subjected toa rapidly applied and subsequently sustained loading(e.g. a train coming to a standstill) is governed bothby the magnitude and the duration of loading.
(c) Because of conclusion (b), the stability design of suchembankments should in principle take into account theduration for which high load levels are sustained. Areview of available literature indicates that it may bepossible to determine a safe load level that is smallenough not to cause an undrained creep rupture, evenfor loads that are sustained for a very long period oftime.
(d) Sudden changes in the rates of deformation and porepressure increase close to the embankment are the bestindicators of an impending failure. The proper place-ment of monitoring instruments should be performedbased on predictions of the likely failure mechanismsfor a given geometry.
This field test provides valuable input in relation todeveloping methods for undrained stability analysis. Theseanalyses will be presented in a separate paper. The variousdegrees of usefulness for the measurements that were madeprovide valuable information for others that are seeking todesign an ‘early warning system’ or a ‘structural healthmonitoring system’ for railway embankments constructed onsoft clay foundations.
AVAILABILITY OF DATAThe authors together with the Finnish Transport Agency
have decided to make the full experimental data available for
all those interested. The data can be accessed from: http://urn.fi/urn:nbn:fi:csc-kata20150507094517328502
ACKNOWLEDGEMENTSThe authors would like to thank the Finnish Transport
Agency for making the project possible with their generousfunding and support, as well as everyone involved in prepar-ing and conducting the experiment. Professor Meehan wouldlike to acknowledge the support of the Fulbright Center inFinland and the 2012–2013 Fulbright-Tampere University ofTechnology Scholar Award, which provided support for workon this manuscript.
NOTATIONB width (m)Cc compression indexCα secondary compression indexc′ cohesion (kPa)L length (m)
mL mass per unit length (tonne/m)qapp applied bearing pressure (kPa)St sensitivitysu undrained shear strength (kPa)sur remoulded undrained shear strength (kPa)t elapsed time (h)u pore pressure (kPa)W weight (kN)w water content (%)
wL liquid limit (%)z elevation from sea level (m)γ unit weight (kN/m3)εa axial strain (%)σc′ preconsolidation stress (kPa)σv0′ vertical effective stress (kPa)ϕ′ friction angle (degrees)
REFERENCESArulanandan, K., Shen, C. & Young, R. (1971). Undrained creep
behaviour of a coastal organic silty clay. Géotechnique 21, No. 4,359–375, http://dx.doi.org/10.1680/geot.1971.21.4.359.
Augustesen, A., Liingaard, M. & Lade, P. V. (2004). Evaluationof time-dependent behavior of soils. Int. J. Geomech. 4, No. 3,137–156.
Bjerrum, L. (1973). Problems of soil mechanics and construction onsoft clays and structurally unstable soils (collapsible, expansiveand others). Proceedings of the 8th European conference onsoil mechanics and foundation engineering, Moscow, vol. 3,pp. 111–159.
CEN (European Committee for Standardisation) (2004a) ISO/TS17892-4: Geotechnical investigation and testing. Laboratorytesting of soil. Part 4: Determination of particle size distribution.Brussels, Belgium: CEN.
CEN (2004b) ISO/TS 17892-6: Geotechnical investigation andtesting. Laboratory testing of soil. Part 6: Fall cone test.Brussels, Belgium: CEN.
CEN (2004c) ISO/TS 17892-12: Geotechnical investigation andtesting. Laboratory testing of soil. Part 12: Determination ofAtterberg limits. Brussels, Belgium: CEN.
Graham, J., Crooks, J. & Bell, A. (1983). Time effects on the stress–strain behaviour of natural soft clays. Géotechnique 33, No. 3,327–340, http://dx.doi.org/10.1680/geot.1983.33.3.327.
Helenelund, K. V. (1977). Methods for reducing undrained shearstrength of soft clay, report no. 3. Linköping, Sweden: SwedishGeotechnical Institute.
Holt, C. C. (2004). Forecasting seasonals and trends by exponen-tially weighted moving averages. Int. J. Forecasting 20, No. 1,5–10.
Holzer, T. L., Höeg, K. & Arulanandan, K. (1973). Excess porepressures during undrained clay creep. Can. Geotech. J. 10,No. 1, 12–24.
FULL-SCALE EMBANKMENT FAILURE TEST UNDER SIMULATED TRAIN LOADING 13

Janbu, N. & Senneset, K. (1995). Soil parameters determined bytriaxial testing. Proceedings of the 11th European conference onsoil mechanics and foundation engineering, Copenhagen, vol. 3,pp. 101–106.
Kolisoja, P., Sahi, K. & Hartikainen, J. (1987). Automatedoedometer device. Proceedings of the 9th European conferenceon soil mechanics and foundation engineering, New Delhi, vol. 1,39–42.
Ladd, C. C. (1991). Stability evaluation during staged construction.J. Geotech. Engng 117, No. 4, 540–615.
Länsivaara, T. (1996). Maan mekaanisen käyttäytymisen mallinta-minen. Licensiate thesis, Tampere University of Technology,Tampere, Finland (in Finnish, English title ‘Modelling themechanical behaviour of soil’).
Leroueil, S. & Soares Marques, M. E. (1996). Importance ofstrain rate and temperature effects in geotechnicalengineering. In Measuring and modeling time dependentsoil behavior (eds T. C. Sheahan and V. N. Kaliakin),Geotechnical Special Publication no. 61, pp. 1–60.New York, NY, USA: American Society of Civil Engineers(ASCE).
Leroueil, S., Kabbaj, M., Tavenas, F. & Bouchard, R. (1985). Stress–strain–strain rate relation for the compressibility of sensitivenatural clays. Géotechnique 35, No. 2, 159–180, http://dx.doi.org/10.1680/geot.1985.35.2.159.
Mansikkamäki, J. (2015) Effective stress finite element stabilityanalysis of an old railway embankment on soft clay.Doctoral thesis, Tampere University of Technology, Tampere,Finland.
Rankka, K., Andersson-Sköld, Y., Hultén, C., Larsson, R., Leroux,V. & Dahlin, T. (2004). Quick clay in Sweden, report 65, 145.Linköping, Sweden: Swedish Geotechnical Institute.
SFS (Finnish Standards Association) (1996) SFS EN 933-2: Testsfor geometrical properties of aggregates. Part 2: determinationof Particle size distribution. Test sieves, nominal size ofapertures. Helsinki, Finland: SFS.
SFS (2005) SFS EN ISO 14688-2: Geotechnical investigation andtesting. Identification and classification of soil. Part 2: Principlesfor a classification. Helsinki, Finland: SFS.
SFS (2012) SFS EN 933-1: Tests for geometrical properties ofaggregates. Part 1: determination of particle size distribution.Sieving method. Helsinki, Finland: SFS.
SGY (Suomen Geoteknillinen Yhdistys (Finnish GeotechnicalSociety) (1999). Kairausopas II, Siipikairaus. Nummela,Finland: Finnish Geotechnical Society (in Finnish, Englishtitle ‘Soil boring manual II, Vane shear test’).
Sheahan, T. C. (1995). Interpretation of undrained creep tests interms of effective stresses. Can. Geotech. J., 32, No. 2, 373–379.
Sheahan, T. C. & Kaliakin, V. N. (1999). Microstructural con-siderations and validity of the correspondence principle forcohesive soils. In Proceedings of the 13th conference onengineering mechanics, Baltimore, MD, USA (eds N. Jonesand R. Ghanem). Reston, VA, USA: American Society of CivilEngineers (ASCE).
Soveri, U. & Kauranne, L. K. (1976). Rakennusgeologia I, Suomenrakennusgeologia. Espoo, Finland: Otakustantamo (in Finnish,English title ‘Civil engineering geology I, Finnish civil engin-eering geology’).
LEHTONEN, MEEHAN, LÄNSIVAARA AND MANSIKKAMÄKI14