full record
TRANSCRIPT
1
MBABT 516: STOCK AND FOREX TRADING LAB
RECORD
Lab report submitted in partial fulfillment of the requirements for the degree of
MBA: BANKING TECHNOLOGY
Submitted
By
PRAKASH RAJIV. S
Reg No. : 14381044
DEPARTMENT OF BANKING TECHNOLOGY
SCHOOL OF MANAGEMENT
PONDICHERRY UNIVERSITY
PONDICHERRY – 605 014
JANUARY 2016

2
DEPARTMENT OF BANKING TECHNOLOGY
SCHOOL OF MANAGEMENT
PONDICHERRY UNIVERSITY
PONDICHERRY – 605 014
NAME : PRAKASH RAJIV S
REG. NO : 14381044
SUBJECT : Stock and Forex Trading lab
CODE : MBABT-516
Lab in charge Head of the Department
Submitted for the Practical Examination held on………………….
INTERNAL EXAMINER EXTERNAL EXAMINER
ACKNOWLEDGEMENT
3
It gives me an immense pleasure to express my profound gratitude to my beloved guide Dr. S.
Sudalai Muthu,, Associate Professor, Department of Banking Technology, School of Management for his
consistent guidance and constant encouragement in this Lab work. His advice and systematic approach has
given a new dimension to this Lab work.
I express my special thanks to Dr. V. PRASANNA VENKATESAN, Professor and Head of the
Department of Banking Technology, School of Management, Pondicherry University, for his continuous
support, advice and encouragement.
I also express my sincere thanks to Mr. S.GOWTHAM RAJ, Authorized Person, Sharekhan Ltd for
giving us an opportunity to do stock and forex trading practices in their branch.
I am very grateful to my parents and the Almighty. Also I would like to express my heartfelt
gratitude to other Faculty and Friends for their help in making this record work successful.
PRAKASH RAJIV S
TABLE OF CONTENTS
1. OPENING OF PAN AND DP ACCOUNT ............................................................................ 1
2. EVALUATION OF NEW ISSUE APPLICATION FORMS IPO EVALUATION ....................... .9

4
3. IPO RISK FACTORS ........................................................................................................ 12
4. SCREEN BASED TRADING ............................................................................................. 13
5. STUDY OF VARIOUS ORDER TYPES AND ORDER BOOKING ......................................... 18
6. TRADING AND SETTLEMENT ACTIVITIES ..................................................................... 24
7. PREPARATION OF TECHNICAL CHARTS ........................................................................ 27
8. FUNDAMENTAL ANALYSIS OF A COMPANY ................................................................ 38
9. COMPANY SPECIFIC EVENTS AND IDENTIFICATION OF STOCK PRICE REACTION ....... 47
10. STUDY ON INDICES ................................................................................................... 51
11. MARKETING OF MUTUAL FUNDS ............................................................................ 55
12. FUTURES AND OPTIONS ........................................................................................... 64
13. A STUDY ON CLEARING AND SETTLEMENT ACTIVITIES IN FUTURES AND OPTIONS…….. 73
14. STUDY ON CURRENCY DERIVATIVES…………………………………………………...79
15. FOREX TRADING –BASICS……………………………………………………………..89
16. PROBLEMS ON FOREGIN EXCHANGE ARITHMETIC ................................................ .94
17. STUDY ON COMMODITY MARKETS ........................................................................ 103
SHAREKHAN LIMITED
INTRODUCTION
Sharekhan is one of the leading retail broking House of SSKI Group which was running successfully since
1922 in the country. It is the retail broking arm of the Mumbai-based SSKI Group, which has over eight
decades of experience in the stock broking business. Sharekhan offers its customers a wide range of equity
related services including trade execution on BSE, NSE, Derivatives, depository services, online trading,

5
investment advisory, Mutual Fund Advisory etc.
The firm’s online trading and investment site - www.sharekhan.com - was launched on Feb 8, 2000.
The site gives access to superior content and transaction facility to retail customers across the country.
Known for its jargon-free, investor friendly language and high quality research, the site has a registered base
of over two lakh customers. The number of trading members currently stands More than 8 Lacs. While
online trading currently accounts for just over 8 per cent of the daily trading in stocks in India, Sharekhan
alone accounts for 32 per cent of the volumes traded online.
The content-rich and research oriented portal has stood out among its contemporaries because of its
steadfast dedication to offering customers best-of-breed technology and superior market information. The
objective has been to let customers make informed decisions and to simplify the process of investing in
stocks.
On April 17, 2002 Sharekhan launched Speed Trade, a net-based executable application that
emulates the broker terminals along with host of other information relevant to the Day Traders. This was for
the first time that a net-based trading station of this caliber was offered to the traders. In the last six months
Speed Trade has become a de facto standard for the Day Trading community over the net.
On October 01, 2007 Sharekhan again launched his another integrated Software based product Trade
Tiger, a net-based executable application that emulates the broker terminals along with host of other
information relevant to the Day Traders. It has another quality which differs it from other that it has the
combined terminal for EQUITY and COMMODITIES both.
Share khan’s ground network includes over 1005 centers in 410 cities in India, of which 210 are
fully-owned branches. Sharekhan has always believed in investing in technology to build its business. The
company has used some of the best-known names in the IT industry, like Sun Microsystems, Oracle,
Microsoft, Cambridge Technologies, Nexgenix, Vignette, Verisign Financial Technologies India Ltd, Spider
Software Pvt Ltd. to build its trading engine and content. Previously the Morakiya family holds a majority
stake in the company but now a world famous brand CITI GROUP has taken a majority stake in the

6
company. HSBC, Intel & Carlyle are the other investors.
With a legacy of more than 80 years in the stock markets, the SSKI group ventured into institutional
broking and corporate finance 18 years ago. Presently SSKI is one of the leading players in institutional
broking and corporate finance activities. SSKI holds a sizeable portion of the market in each of these
segments. SSKI’s institutional broking arm accounts for 7% of the market for Foreign Institutional portfolio
investment and 5% of all Domestic Institutional portfolio investment in the country. It has 60 institutional
clients spread over India, Far East, UK and US. Foreign Institutional Investors generate about 65% of the
organization’s revenue, with a daily turnover of over US$ 4 million. The Corporate Finance section has a
list of very prestigious clients and has many ‘firsts’ to its credit, in terms of the size of deal, sector tapped
etc. The group has placed over US$ 1 billion in private equity deals. Some of the clients include BPL
Cellular Holding, Gujarat Pipavav, Essar, Hutchison, Planetasia, and Shopper’s Stop.
Sharekhan business
1. Brokering business.
2. White feathering house production.
Vision
To be the best retail broking brand in the retail business of the stock market.
Mission
To educate and empower the individual investor to make better investment decisions through quality
advices and superior services.
Stock exchange Mumbai
Share khan is the retail broking arm of SSKI, an organization with more then eight decade of trust
and credibility in the stock market.
Amongst pioneers of investment research in the Indian market.
In 1984 venture into institutional broking and the corporate finance.
7
Leading domestic player in the Indian institutional business.
Over US$5 billion of private equity deal.
SSKI group companies
SSKI investor services ltd (Sharekhan)
S.S. Kantilal Isharlal securities
SSKI corporate finance.
SHAREKHAN PROFILE
SHAREKHAN RETAIL BROKING
Among the top three (3) branded retail services providers (Rs 856 crs average daily volume.
NO. 2 player in online business
Large network of branded broking outlets in the country servicing around 5, 45, 000 Clients
BENEFITS
Free Depository A/c
Secure Order by Voice Tool Dial-n-Trade.
Automated Portfolio to keep track of the value of your actual purchases.
24x7 Voice Tool access to your trading account.
Personalized Price and Account Alerts delivered instantly to your Cell Phone & E-mail address.
Special Personal Inbox for order and trade confirmations.
On-line Customer Service via Web Chat.
Anytime Ordering.
NSDL Account
Instant Cash Tranferation.
Multiple Bank Option.
8
Enjoy Automated Portfolio.
Buy or sell even single share.
PRODUCTS OF SHAREKHAN
CLASSIC ACCOUNT
This account allows the client to trade through the website www.sharekhan.com and is suitable for the retail
investor who is risk-averse and hence prefers to invest in stocks or who do not trade too frequently.
It allows investor to buy and sell stocks online along with the following features like multiple watch lists,
Integrated Banking, De-mat and Digital contracts, Real-time portfolio tracking with price alerts and Instant
money transfer.
FEATURES
Online trading account for investing in Equity and Derivatives via www.sharekhan.com
Live Terminal and Single terminal for NSE Cash, NSE F&O, BSE & Mutual Funds (online and offline).
Integration of On-line trading, Saving Bank and De-mat Accounts.
Instant cash transfer facility against purchase & sale of shares.
Competative transaction charges.
Instant order and trade confirmation by E-mail.
Streaming Quotes (Cash & Derivatives).
Personlized market watch.
Single screen interface for Cash and derivatives and more.
Provision to enter price trigger and view the same online in market watch.
TRADE TIGER
TRADE TIGER is an internet-based software application which is the combination of EQUITY &
COMMODITIES, that enables you to buy and sell share and well as commodities item instantly. It is ideal
9
for every client of SHAREKHAN LTD.
FEATURES
Integration of EQUITY & COMMODITIES MARKET.
Instant order Execution and Confirmation.
Single screen trading terminal for NSE Cash, NSE F&O & BSE & Commodities.
Technical Studies.
Multiple Charting.
Real-time streaming quotes, tic-by-tic charts.
Market summary (Cost traded scrip, highest value etc.)
Hot keys similar to broker’s terminal.
Alerts and reminders.
Back-up facility to place trades on Direct Phone lines.
Live market debts.
DIAL-N-TRADE
Along with enabling access for your trade online, the CLASSIC and TRADE TIGER ACCOUNT
also gives you our Dial-n-trade services. With this service, all you have to do is dial our dedicated phone
lines which are 1800-22-7500, 3970-7500.
PORTFOLIO MANAGEMENT SERVICES
Sharekhan is also having Portfolio Management Services for Exclusive clients.
1. PROPRIME - Research & Fundamental Analysis.
Ideal for investors looking at steady and superior returns with low to medium risk appetite. This portfolio

10
consists of a blend of quality blue-chip and growth stocks ensuring a balanced portfolio with relatively
medium risk profile. The portfolio will mostly have large capitalization stocks based on sectors & themes
that have medium to long term growth potential.
2. PROTECH - Technical Analysis.
Protech uses the knowledge of technical analysis and the power of derivatives market to identify trading
opportunities in the market. The Protech lines of products are designed around various risk/reward/ volatility
profiles for different kinds of investment needs.
THRIFTY NIFTY: Nifty futures are bought and sold on the basis of an automated trading system
that generates calls to go long/short. The exposure never exceeds value of portfolio i.e. there is no
leveraging; but being short in Nifty allows you to earn even in falling markets and there by generates
linear
BETA PORTFOLIO: Positional trading opportunities are identified in the futures segment based
on technical analysis. Inflection points in the momentum cycles are identified to go long/short on
stock/index futures with 1-2 month time horizon. The idea is to generate the best possible returns in
the medium term irrespective of the direction of the market without really leveraging beyond the
portfolio value. Risk protection is done based on stop losses on daily closing prices.
STAR NIFTY: Trailing Stops Momentum trading techniques are used to spot short term momentum
of 5-10 days in stocks and stocks/index futures. Trailing stop loss method of risk management or
profit protection is used to lower the portfolio volatility and maximize returns. Trading opportunities
are explored both on the long and the short side as the market demands to get the best of both
upwards & downward trends.
3. PROARBITRAGE - Exploit price analysis
- ONLINE IPO'S AND MUTUAL FUNDS ADVISORY IS AVAILABLE.
PROCESS OF ACCOUNT OPPENING

11
LEAD MANAGEMENT SYSTEM (LMS) / REFERENCES
CONTACT
TELEPHONE AND PRESONAL VISIT
APPOINTMENT
DEMONSTRATION
AGREE DISAGREE (CLOSE)
DOCUMANTATION
FILLING THE FORM
SUBMISSION THE FORM
LOGIN OF THE FORM
SENDING THE ACCOUNT OPENING KIT TO THE CUSTOMER FOR TRADING
CHARGE STRUCTURE
1)- PRE PAID OR AMC A/C: -
Advance Amount which will be fully adjsted against your brokerage you paid in One year.
Following Schemes Are Available: - Brokerage will be chagred -
1) - 750/- Scheme:- 0.05 / 0.50 %
2) - 1000/- Scheme 0.045 / 0.45 %
3) – 2,000/- Scheme: - 0.035 / 0.40 %
4) – 6,000/- Scheme: - 0.025 / 0.25 %
5) – 18,000/- Scheme: - 0.020 / 0.20 %
6) – 30,000/- Scheme: - 0.015 / 0.18 %

12
7) – 60,000/- Scheme: - 0.010 / 0.15 %
8) – 1,00,000/- Scheme: - 0.0075 / 0.10 %
Minimum Margine of Rs. 25000/- is Required for Account Opening.
Annual Maintanance Charges will NIL for 1st year and Rs. 400/- from 2nd year.
- EXPOSURE : 4 TIMES (ON MARGINE MONEY)
- EXPOSURE : 10 TIMES (ON MAX TRADING)
- ONLINE IPO'S AND MUTUAL FUNDS ADVISORY IS AVAILABLE.
We are having tie-up with Eleven banks for online fund transfering i.e. HDFC, ICICI, IDBI, CITI,
Union Bank of India, Oriental Bank of Commerce, INDUSIND, AXIS, Centurian Bank of Punjab,
Bank of India and Yes Bank. Company Provide 4-6 E-mail to there customers per day.
Online Trade in Share
Sharekhan customers can online trade through there computers, through internet during the market timings.
Online Fund Transfer
We have tie up with Eleven Banks for online fund transferring i.e. HDFC, IDBI, CITI, UBI, OBC,
INDSLANDAND and UTI BANK, Yes bank, Bank of India for Online Money Transfer.
Research based investment advice
Investment and trading services
Trading and seminars
Technology based investment tools
Integrated demat facility
CUSTOMER CAN TRADE IN
o Equities
o Derivatives
o Commodities

13
SWOT ANALYSIS OF SHAREKHAN
(My observation)
STRENGTHS
1. Big client base
2. In-house research house
3. online as well as offline trading
4. Online IPO/ MF services
5. Share shops
6. Transparent
7. User friendly tie ups with 10 banks
8. Excellent order execution speed and reliability
WEAKNESS
1. Lack of awareness among customer
2. Less focus on customer retention
3. Less Exposure
OPPORTUNITIES
1. Diversification
2. Product modification
3. Improve Web based trading
4. Provide competitive brokerage
5. Concentrate on PMS
6. Focus on Institutional investors
7. Concentrate on HNI’s (high net worth investor)
THREATS
1. Aggressive promotional strategies by close competitor like Religare, Angel Broking and India bulls.
2. More and more players are venturing into this domain, which can further reduce the earning of Share

14
Khan.
3. Stock market is very volatile, risk involves is very high.
15
1. OPENING OF PAN AND DP ACCOUNT
Opening of a PAN Card:
Permanent Account Number (PAN) card can be obtained by filling the form 49A issued by the
National Securities Depository Limited (NSDL) on behalf of Income tax department. Applications for the
PAN card can be obtained from any Income Tax office as well as any stock broking firms or any Banks
which is a depository participant.
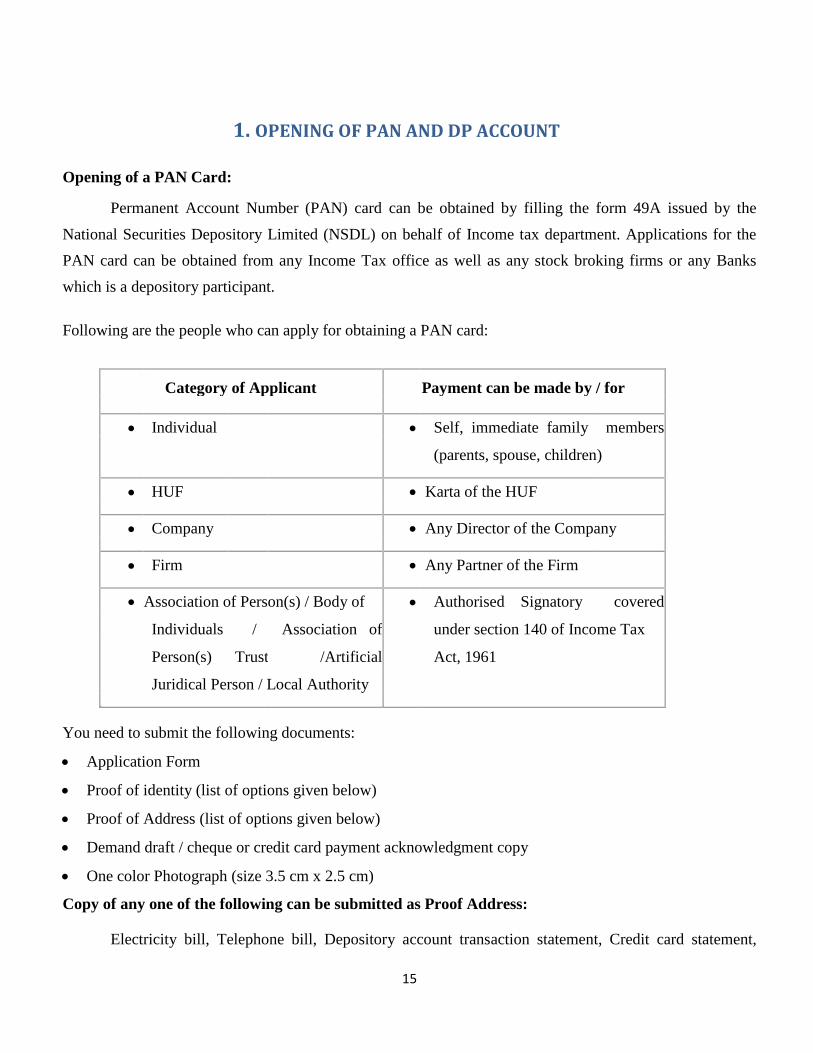
Following are the people who can apply for obtaining a PAN card:
Category of Applicant Payment can be made by / for
Individual Self, immediate family members
(parents, spouse, children)
HUF Karta of the HUF
Company Any Director of the Company
Firm Any Partner of the Firm
Association of Person(s) / Body of Authorised Signatory covered
Individuals / Association of under section 140 of Income Tax
Person(s) Trust /Artificial Act, 1961
Juridical Person / Local Authority
You need to submit the following documents: Application Form Proof of identity (list of options given below) Proof of Address (list of options given below) Demand draft / cheque or credit card payment acknowledgment copy One color Photograph (size 3.5 cm x 2.5 cm) Copy of any one of the following can be submitted as Proof Address:
Electricity bill, Telephone bill, Depository account transaction statement, Credit card statement,

16
Bank account statement, Ration card, Employer certificate, Passport Voters Identity card,
Property tax assessment order, Driving License, Rent receipt, Certificate of address signed by
Member of Parliament or Member of Legislative Assembly or Municipal Councilor or Gazetted
Officer.
Copy of any one of the following can be submitted as Proof Identity:
School leaving certificate, Matriculation certificate, Degree of a recognized educational
institution, Depository account transaction statement, Credit card, Bank account statement, Water
bill, Ration card, Property tax assessment order, Passport, Voters Identity Card, Driving License,
Certificate of identity signed by Member of Parliament or Member of Legislative Assembly or
Municipal Councilor or Gazetted Officer
OPENING OF BANK ACCOUNT
One can open an account with a deposit as low as Rs.100/- to Rs.300/-(Rs. 250/- for cheque
book facility and Rs.100/- without cheque book facility) depending upon the area and earn interest at
3.5% (w.e.f 01/03/2003) per annum. Computerized branches - Rs.500/- and Specialized hi-tech
branches - Rs.2000/-
The Bank's Savings Bank Rules are laid down in the various circulars issued by Head Office
From time to time. Managers and other Supervising Officials staff must read the instructions here
under in conjunction with the rules with which they must keep themselves fully conversant.
Opening of Accounts:
Accounts may be opened in the names of:-
I. Individuals, singly or jointly with other individuals; II. Minors, or on behalf of minors by their guardians. Special Instructions in this regard are contained in
paragraphs 7 to 14; III. Employees (in their individual names) of Schools and Colleges jointly with the Secretary/ Head
Master/Principal of the School/College, as the case may be for depositing provident fund moneys of the
employees provided there is no Trust Deed/Rules relating to the Provident Fund; IV. Associations, Clubs or similar other non-trading institutions (or purpose of depositing savings, provided
the relevant bylaws, rules etc., are found acceptable and are strictly adhered to;

17

18
V. Societies registered under the Societies Registration Act, 1860 or any other corresponding law in
force in a State or a Union Territory; VI. Companies governed by the Companies Act, 1956 which have been licensed by the Central
Government under Section 25 of the said Act or under the corresponding provision in the Indian
Companies Act, 1913 and permitted not to add lo their names the word limited' or the words
'private limited'. VII. Institutions, which are not liable to pay Income Tax under the Income Tax Act
a. 1961.
b. Savings Bank Account of Hindu Undivided families provided The Hindu undivided family is not
engaged in trading and business activity. Such a Savings Bank account should be preferably
opened in the name of the Karta.
Only in exceptional circumstances will accounts be opened in the names of
companies (other than item VI above), Corporations, Proprietary or Partnership Firms, Trustees,
Liquidators etc., with prior permission of the Controlling Authorities.
An application to open a Savings Bank Account will be taken on Form No. 1725
according to whether the depositor wants an account with or without the facility of withdrawal by
cheque, if the applicant is not well known, he should be required to furnish a written introduction
from some respectable person known to the Bank (. All applications must be approved by the
Manager or Manager (Accounts) / Deputy Manager (Accounts) / Assistant Manager (Accounts).
After the accounts have been opened, the forms will be signed by the Manager or Manager
(Accounts) / Deputy Manager (Accounts) / Assistant Manager (Accounts) and will be numbered
with the account numbers and filed in serial order.
The application to open such an account is to be taken on Form No.1725 signed by the minor.
The minor should declare his/her date of birth, which may be accepted as prima facie in order and
no supporting evidence, need be called for. Introductory reference may be taken from the father or
mother where he/she is already known to the Bank or the Head Master/Principal of the educational
institution where the minor is studying. Upon the minor attaining majority, all that will need to be
done will be to note this fact in the account opening forms, specimen signature card and ledger
sheet for completion of record.

19
When an account is opened in the names of two or more persons, who are not minors,
all of them must sign the application and the account will be operated in accordance with their
instructions on the back of the form, unless the instructions are rescinded by any one of them in
terms of the Savings Bank Rules. Under the same rules, the balance is repayable to the survivor or
survivors without reference to the representatives of the deceased person or persons.
Branches may open Savings Bank accounts in the names of two persons payable to
'Former or Survivor' or 'Later or Survivor' on similar lines on which Term Deposit Accounts are
opened.
Accounts will be opened segment wise in the Savings Bank ledger(s), each account being
allotted a serial number which will be entered in the pass book . The passbook should be handed over to
the depositor after the amount of the initial deposit has been credited to the account and entered in the
passbook under the initial of the supervising official.
An alphabetical index of accounts must be accurately maintained and kept upto date as
accounts are carried over to new folios or into new ledgers. Specimen Signatures
Specimen Signatures will be obtained on specimen signature cards at the time of opening their
accounts and must be individually attested by the Manager or Manager (Accounts)/Deputy Manager
(Accounts)/Assistant Manager (Accounts). The same precautions must be taken to record as are observed
in the case of specimen signatures on constituent accounts (vide paragraph 149 and 150 of Chapter 3).
Specimen Signatures in Kannada or other Indian languages may be accepted.
Minimum Balance in Savings Bank account:-
The minimum balance to be maintained in the Savings Bank account with cheque book and
without cheque book is furnished in relation to the population category.
OPENING OF DP ACCOUNT
In order to avail of depository facilities, an investor has to open a beneficiary account with a
depository participant of his choice. This is similar to opening a bank account to use the banking
services.

20
Just as one can hold funds in a bank account and transfer funds across accounts without actually
handling cash; one can hold securities in a depository account and transfer securities across depository
accounts without actually handling share certificates. The account holder is called 'beneficial owner' in a
depository system and the account is known as 'beneficiary account'.
Features of Beneficiary Account No minimum balance is required to be retained in a beneficiary account.
An investor can close a beneficiary account with one DP and open an account with another DP.
To dematerialized existing physical holdings, the beneficiary account must be opened in the same
ownership pattern in which the securities are held in the physical form e.g., if one certificate is in
individual name and another certificate is jointly held by X & Y, two different accounts should be
opened. However, in case of joint holders, securities can be dematerialized in the same account even
though share certificates are in different sequence of names e.g., shares held in joint names of X & Y
can also be dematerialized in an account opened in the names of Y & X as well by submitting an
additional form (Transposition Form) along with Demat Request Form to the DP.However, shares
held jointly by X & Y cannot be dematerialized in an account opened in the name of only X or only
Y or any combination of a joint account with three names i.e., X, Y and Z.
Procedure
Investor will choose a DP for the purposes of opening beneficiary account. The choice of the
investor may be based on convenience, comfort, services offered, cost or any other reason.
The investor will obtain the relevant account opening form from the chosen DP.
For the purpose of verification, investor has to submit the following documents along with the
prescribed account opening form. In case investor wants to open account jointly with other
person(s), following should be submitted for all the account holders:
PROOF OF IDENTITY (POI) (COPY OF ANY ONE PROOF): Passport
Voter ID Card
PAN card with photograph

21
PROOF OF ADDRESS (POA) (COPY OF ANY ONE PROOF):
Ration card Voted ID card Electricity Bill
Passport-Size Photograph
Copy of Pan Card
Original documents must be taken to the DP for verification. DP will carry out "in-person
verification" of account holder(s) at the time of opening the account.
Account opening form requires the applicants to give the following details:
Name(s) of account holder(s) -The investor should ensure that the name is identical to that which
appears on the certificate(s) to be dematerialised. In case of joint holdings, account may be opened in
any one combination, irrespective of the sequence in which names are appearing on share certificates.
Investors are advised to open their account in their fully expanded name, i.e., to spell to the first
name as well as the middle name. This would obviate any doubts about the veracity of the
information.
Mailing and communication addresses - The veracity of the applicant's address is determined
through the documents submitted for verification like ration card, passport, voter ID, PAN card,
driving license, bank passbook, etc. For NRI accounts, proof is required for both addresses - that of
the account holder as well as the constituted attorney. For corporate accounts, a copy of
Memorandum of Association, Articles of Association, Board resolution permitting opening of
account, the registered address of the company have to be furnished.
Details of guardian in case account holder is a minor -Only a guardian can open a depository
account for a minor. The guardian is required to sign the application form, and details of his name
and address need to be given in addition to the details of the minor.
Foreign Address and RBI approval details for NRI, FII or OCB accounts -For foreign-based
applicants like NRIs, Flls, OCBs, etc., the applicant must furnish original or attested copies of the
power of attorney and the approval letter from RBI permitting them to invest, as the case may be. If
the account holder is an FII or an OCB, SEBI registration details along with attested copy of

22
registration certificate issued by SEBI and authorisation letter is required.
Details of bank account -Details of bank account of the account holder, including the nine digit code
number of the bank and branch appearing on the MICR cheques issued by the bank have to be filled
in the application form. Companies use this information for printing them on dividend/interest
warrants etc.
Nomination declaration -A beneficial owner can make a nomination of his account in favour of any
person by filing the nomination form with his DP. Such nomination is considered to be conclusive
evidence of the account holder'(s) disposition in respect of all the securities in the account for which
the nomination is made. Standing Instruction - a facility of standing instruction is provided to the investors for receiving
securities to the credit of their accounts without giving a separate receipt instruction.
The Demat account cannot be operated on "either or survivor" basis like the bank account. In
case of the joint account for the beneficial owners, all the joint holders have to sign the account
opening form.
The investor will submit to his DP the duly filled in account opening form & DP-client
agreement along with the documents. The DP will verify whether the account opening form has been
duly filled in or not. He will also verify the submitted documents. For corporate investors, the DP
will also verify whether the board resolution for the authorised signatories has been enclosed. The DP
will ensure that client's signature is recorded on the form which will serve as specimen for
authorizations in future.
If the application form and documents are in order, the DP will accept them and give an
acknowledgement slip duly signed and stamped to the client. The DP will execute the agreement and
give a copy of it to the client.
After completion of all documentation, the DP will enter the client details as mentioned in the
account opening form in the DPM (software provided by NSDL to the DP) screen provided for the
purpose. After entering client details in the system, a client account number will be generated by the
DPM. The DP will enter this in the account opening form.

23
On successful opening of the account, the DP will give:
Client Id - an eight digit number to be used along with DP Id for any future transactions.
Delivery Instruction slip book.
A copy of the report listing the client details captured in the DPM database to the client. The
report will be generated by the DPM. Precautions:
Corporate investors to enclose Memorandum of Association/Trust deed/Board resolution for
the authorised signatories along with the account opening form.
Details with respect to the bank account details of an investor must be indicated in the space
provided for the same in the account opening form.
If an investor is interested in availing the facility of standing instructions for credits to his
account, then such instructions may be given to the DP. Otherwise, he will need to give a
receipt instruction to his DP for receiving credits to his account.
24
2. EVALUATION OF NEW ISSUE APPLICATION FORMS IPO EVALUATION
Introduction
Public issues can be classified into Initial Public Offerings and Further Public Offerings.
In a public offering, the issuer makes an offer for new investors to enter its shareholding family. The
issuer company makes detailed disclosures as per the DIP guidelines in its offer document and offers
it for subscription. Initial Public Offering (IPO) is when an unlisted company makes either a fresh
issue of securities or an offer for sale of its existing securities or both for the first time to the public.
This paves way for listing and trading of the issuer’s securities.
IPO is new shares Offered to the public in the Primary Market .The first time the company is
traded on the stock exchange. A prospectus is issued to read about its risk before investing. IPO is a
company's first sale of stock to the public. Securities offered in an IPO are often, but not always,
those of young, small companies seeking outside equity capital and a public market for their stock.
Investors purchasing stock in IPOs generally must be prepared to accept very large risks for the
possibility of large gains. Sometimes, just before the IPO is launched, Existing share Holders get
very liberal bonus issues as a reward for their faith in risking money when the project was new
How to apply to a Public issue?
When a company floats a public issue or IPO, it prints forms for application to be filled by
the investors. Public issues are open for a few days only. As per law, any public issue should be kept
open for a minimum of 3days and a maximum of 21 days. For issues, which are underwritten by
financial institutions, the offer should be kept open for a minimum of 3 days and a maximum of 21
days.
For issues, which are underwritten by all India financial institutions, the offer should be kept
open for a maximum of 10 days. Generally, issues are kept open for only 3 to 4 days. The duly
complete application from, accompanied by cash, cheque, DD or stock invest should be deposited
before the closing date as per the instruction on the form. IPO's by investment companies (closed end
funds) usually contain underwriting fees which represent a load to buyers.
Before applying for any IPO, analyse the following factors:
1. Who are the Promoters? What is their credibility and track record?

25
2. What is the company manufacturing or providing services - Product, its potential 3. Does the Company have any Technology tie-up? if yes , What is the reputation of the collaborators 4. What has been the past performance of the Company offering the IPO? 5. What is the Project cost, what are the means of financing and profitability projections? 6. What are all the Risk factors involved? 7. Who has appraised the Project? In India Projects apprised by IDBI and ICICI have more credibility
than small Merchant Bankers
How to make payments for IPO?
The payment terms of any IPO or Public issue is fixed by the company keeping in view its
fund requirements and the statutory regulations. In general, companies stipulate that either the entire
money should be paid along with the application or 50 percent of the entire amount be paid along
with the application and rest on allotment. However, if the funds requirements are staggered, the
company may ask for the money in calls, that is, the company demands for the money after allotment
as and when the cash flow demands. As per the statutory requirements, for public issue large than Rs.
250 crore, the money is to be collected as under:
25 per cent on application 25 per cent on allotment 50 per cent in two or more calls
Understanding IPO Grading
IPO grading is a unique concept involving an independent agency that is free from bias and
with the available tools for assessing the investment attractiveness of an equity security. IPO grading
is a service aimed at facilitating the assessment of equity issues offered to the public, says SEBI. IPO
grading can act as an additional decision-making tool for them.
The idea is that IPO grading will help the investor better appreciate the meaning of the
disclosures in the issue documents, collapsing all of the above information into a single digit. Thus,
IPO grading could be seen as an added investment guidance tool seeking to hide the ignorance of the
above factors and still help the investors make an informed decision. Grading of IPOs in terms of
their fundamental quality will enable investors steer clear of unsound offers. IPO grading in general
26
would be a relative assessment of the fundamentals of the equity security by credit rating agencies
registered with SEBI.
But IPO grading is totally unheard of anywhere else and is a First-From-India initiative. The
grading, to be done by the SEBI-registered credit rating agencies, would be applicable to all IPOs for
which offer documents are filed after April 30, SEBI said in a circular. SEBI does not play any role
in the assessment made by the grading agency.
The grading is intended to be an independent and unbiased opinion of that agency. The
company needs to first contact one of the grading agencies and mandate it for the grading exercise.
Though this process will ideally require 2-3 weeks for completion, it may be a good idea for
companies to initiate the grading process about 6-8 weeks before the targeted IPO date to provide
sufficient time for any contingencies. IPO grading is a service aimed at facilitating the assessment of
equity issues offered to the public, says SEBI.
“IPO grading is the grade assigned by a Credit Rating Agency registered with SEBI, to the initial
public offering (IPO) of equity shares or any other security which may be converted into or
exchanged with equity shares at a later date”
3. IPO RISK FACTORS
RISK FACTORS
An investment in Equity Shares involves a high degree of risk. The risks and uncertainties
described in this section are not the only risks that the company currently faces. Additional risks and
uncertainties not presently known to us or that we currently believe to be immaterial may also have

27
an adverse effect on this business, results of operations and financial condition. If any of the
following risks, or other risks that are not currently known or are now deemed immaterial, actually
occur, adani business, results of operations and financial condition could suffer, the price of this
Equity Shares could decline, and investor may lose all or part of the investor investment.
The financial and other related implications of risks concerned, wherever quantifiable, have
been disclosed in the risk factors mentioned below. However, there are risk factors where the effect
is not quantifiable and hence has not been disclosed in such risk factors.
The numbering of the risk factors has been done to facilitate the ease of reading and
reference, and does not in any manner indicate the importance of one risk factor over another. In
making an investment decision, prospective investors must rely on their own examination of the
Company and the terms of the Issue, including the merits and risks involved.
Unless otherwise stated, the financial information of the Company used in this section is
derived from our audited consolidated financial statements under Indian GAAP, as restated.
4. SCREEN BASED TRADING-NEAT, BOLT AND ODIN
NSE ARCHITECTURE – NEAT
NSE has deployed NIBIS (NSE's Internet Based Information System) for real-time
dissemination of trading information over the Internet and NEAT a client-server-based application to
help its operations.
NEAT (National Exchange for Automated Trading) stores all trading information in an in-
memory database at the server end to achieve minimum response time and maximum system
availability for users. The trading server software runs on a fault-tolerant STRATUS mainframe and
the client software runs on Windows PCs.The telecommunications network uses the X.25 protocol
and is the backbone of the automated trading system. Each trading member trades on the NSE with
28
other members through a PC located in the trading member's office.
The trading members on the Wholesale Debt Market segment are linked to the central
computer at the NSE through dedicated 64 Kbps leased lines and VSAT terminals. These leased lines
are multiplexed using dedicated 2 MB optical-fiber links. The WDM participants connect to the
trading system through dial-up links.
The exchange uses RISC-based UNIX servers from Digital and HP for back office
processing. Applications like Oracle 7 and SQL/Oracle Forms 4.5 front ends are used for the
exchange functions.
BSE ARCHITECTURE – BOLT
BSE has deployed an Online Trading system (BOLT) on March 14, 1995. It works on a
Tandem S74016 platform running on 16 CPUs. The Tandem Himalaya S74016 machines act as the
backend to more than 8000 Trader Workstations networked on Ethernet, VSAT and Managed Leased
Data Network (MLDN). The systems claim to handle up to two million trades a day.
BOLT has a two-tier architecture. The trader workstations are connected directly to the
backend server which acts as a communication server and a Central Trading Engine (CTE). Other
services like information dissemination, index computation, and position monitoring are also
provided by the system. A transaction monitoring facility in the Tandem architecture helps keep data
integrity through non-stop SQL.

29
With the help of MTNL, BSE has setup a MLDN Network comprising 300 2 Mbps lines
and 1500 64 Kbps lines which connect all regional stock exchanges and offices in Mumbai.
Access to market related information through the trader workstations is essential for the market
participants to act on real-time basis and take instantaneous decisions. BOLT has been interfaced
with various information vendors like Bloomberg, Bridge, and Reuters. Market information is fed
to news agencies in real time. The exchange plans to enhance the capabilities further to have an
integrated two-way information flow.
'BSE On-Line Trading System’ (BOLT) has been awarded the globally recognized
the
Information Security Management System standard BS7799-2:2002.
ODIN - OPEN DEALER INTEGRATED NETWORK
ODIN™ - the Multi-Exchange, Multi-Currency Front Office trading and risk management
system - makes trading on multiple markets easier through the use of a single application. It
incorporates appealing features and works on advanced technology which facilitates higher
accessibility, ensuring speedy performance and advanced risk management.
ODIN™ Trader Work Station (TWS) is the trading front-end for the brokers. The broker
can view an integrated Market Watch allowing him to view and trade on more than one market on
the same screen.
Features
Sophisticated trading front-end with Microsoft Excel compatibility
Offers alerts and basket trading features
Allows multiple portfolio creation, customizable preferences like font, layout, color, columns,
etc.
Offers real time integrated order and trade book.
Provides integrated view of mark-to-market profits & losses, net positions and exposures
Advanced trading strategies tool for capturing finest profit making opportunities
ODIN™ ADMINISTRATOR Defines organization structure by setting up groups, branches, dealers and clients Creates multiple administrators for role segregation as well as permit ease of monitoring
30
Defines various limits with alerts for each type of user and the end clients Defines risk views, risk scenarios and real-time update on risk at organization level and at each user
level Features panic withdrawal to cancel or close out all/selected outstanding orders in one click
ODIN™ Connect
ODIN™ Connect acts as a bridge between a client application, which could be an OMS
or a direct trading workstation, and a Stock Exchange’s Central Trading Engine. It provides a
higher level of abstraction over the exchange message structures to offer a uniform interface for a
client application to communicate with the Stock Exchange.
ODINTM
– DIET
Overview
ODIN™ Diet is a high-end, integrated trading application for active retail traders. It
works on an advanced technology algorithm. This facilitates higher accessibility and availability,
ensuring any where any time trading and delivers speedy performance on very low bandwidth
requirement. As the name suggest ODIN™ Diet works on the principle of high optimization of
the hardware and network requirements at the end-trader level.
ODIN™ Diet is a new generation, easy to access client level trading application. It
provides streaming quotes on a real-time basis and an ability to transmit buy/sell order requests
directly to the exchange. Existing ODIN™ users can provide this ‘direct trading facility' to their
clients without investing much on hardware or network. ODIN™ Diet application can easily
interface with the existing ODIN™ Server Setup.
ODIN™ Diet is capable of functioning on heterogeneous network platforms and ensures
high performance & scalability whereby facilitating anywhere any time trading environment. It is
user-friendly in the sense that the size of the application is shrink-wrapped to ease the distribution
and availability of the trading front-end.
Features
The self-installing kit of ODIN™ Diet is easy to deploy. It can be put on the Broker’s website to
allow client/s to download, install and trade anytime from any computer. For optimum utilization
of bandwidth ODIN™ Diet provides real-time streaming information for scrips set-up in the portfolio
thus optimizing the bandwidth utilization.
31
Integrated Market Watch provides a view with real-time streaming information from the
exchange Central Trading Engine for all the markets i.e.Equities, Derivatives and Commodities.
Ability to configure column profile makes it easier to view and navigate across columns.
Market Snap Shot provides the Best Buy / Sell price, Volume in Quantity and Value, day’s
Open, High, Low and Close prices for every individual scrips/contracts.
Best Five Orders Real-Time Market Information of securities & contracts, displaying the
market depth. Portfolio Portfolio is a selected set of scrips/ contracts logically grouped, as per the
requirements of the user. The portfolio can then be applied to views such as the Market Watch or the
Ticker. The user can create multiple portfolios and switch from one portfolio to another anytime.
The user can create a dynamic portfolio in Futures and options. This feature allows the user to
create a portfolio for Futures or Options based on Available/Current month, with strike prices based
on In/Out/At the Money. Thus on every expiry date/month the user is not required to create a new
portfolio for new maturities being introduced.
Order entry screen with minimum required inputs from user for quick creation and execution
of orders. Order and Trade confirmations are transmitted to the trader workstation in real-time,
thereby eliminating the need to query the server for order and trade information. Using the
comprehensive filters, the user can customize the order / trade book. The Order status is displayed in
the order book
e.g. pending at the exchange, executed, cancelled, pending administrator approval, amongst others.
Pending orders in the order book can be modified or cancelled.
Integrated Net Position and Exposures
A view to track the clients net-position either contract or security-wise. Further this provides
an aggregate view of exposures and maintains not only daily position but also expiry. Multi scrip
graphing facility, graph for comparison in F&O with the underlying. Intraday charting with pan,
zoom facility for scrips and index. Charting options with trend lines, mounts, cross, dots. Time
coordinates on graph with values.

32
The data window displays the data on which the graph is plotted.. Intraday data plotted on the
graph can be viewed in the data window.. The data can be viewed either on value or on volume. Data
can also be saved to file for future records.
The tick watch window displays the tick-by-tick movement in any scrip. This enables the user
to make more informed buy/sell decision based on the information. Data can be saved to file. The
facility of filter watch allows the user to set filters/alerts. The filters can be set for Volume, Price,
Quantity, Change in price % as and when any scrip satisfies the criteria it will appear in the filter
Benefits
Helps in leveraging business expertise for growth Trading facility available at marginal cost Common screen for multiple exchange segment User definable fully customizable views at all levels
Single interface for Multi Tier Risk Management across Multi-Exchange segments with user defined
periodicity Online integration with the bank & depository to monitor and control clients Provides safety against uncertain volatility of market Real time streaming quote of multi exchanges/segments Stability / Robustness Scalability Business Expansion Risk Management Performance

33
5. STUDY OF VARIOUS ORDER TYPES AND ORDER BOOKING
ORDER TYPES
An Order is an instruction to a broker/dealer to buy, sell, deliver, or receive financial
instruments or commodities which commits the issuer of the "order" to the terms specified.
Indication, inquiry, bid wanted, offer wanted.
Basically, two types of share transaction exist- buy orders and sell orders. Technically sell
orders can be further classified as either selling long or selling short. Various types of orders that you
can put through to exchanges are as follows:
Buy Orders
Buy orders, obviously are used when the investor anticipates a rise in prices. When he deems
the time appropriate for the share purchase, the investor enters a buy order.
Sell Orders
A brokerage order is to sell a specified amount of a security.
Sell – Long Orders
When the investor determines that a stock he already owns (i.e. long position) is going to
experience a decline in price, he may decide to dispose of it. Here also, other determinations must be
made to accompany sell order.
Sell-Short Orders
Short selling, or "going short," is a special and quite speculative variety of selling. Basically it
involves selling shares of a stock that are not owned in the anticipation of a price decline. The short
seller sells a stock in the first leg of transaction, which is neutralized by eventual purchase of sold
position at a lower market price. The short seller makes profit/loss by the difference between the sale
price and the purchased price. However, short selling can be very dangerous since every rise in price
of stock would add to losses of the short-seller, the stock may never reach the lower price (the price
of short sell) for a long time and booking losses would be the only solution for short-seller. Sell-short
transaction, by its very nature leads to unlimited losses till the transaction is neutralized. In the case
of a buy into a stock at least the investor acquires stake in the company whose performance may
eventually get reflected in the share price and provide exit to the buyer. Sell-short transactions are

34
hence executed by experienced participants who follow markets and company performances on a
daily basis.
Price Limit Orders: Market Order:
Investors, who want to buy or sell the share regardless of price on that day. They are executed
as fast as possible at the best prevailing price on the exchange. It means that your order quantity will
be executed the moment it reaches the exchange provided the required quantity is available. This
order type is accepted by both the exchanges i.e. BSE and NSE. The obvious advantage of a market
order is the speed with which it is executed. The disadvantage is that the investor does not know the
exact execution price until after the execution. This advantage is potentially most troublesome when
dealing in either very inactive or very volatile securities.
Limit orders
Limit type orders refer to a buy or sell order with a limit price. Limit orders overcome the
disadvantage of the market order-namely, not knowing in advance the price at which the transaction
will take place. It means that if the order gets executed, them it will within the limit specified or at a
better rate than that. This order type is accepted by both the exchanges i.e. BSE and NSE.
When using a limit order, the investor specifies in advance the limit price at which he wants
the transaction to be carried out. It is always understood that the price limitation includes an "or
better" instruction. In the case of a limit order to buy, the investor specifies the maximum price he
will pay for the share; the order can be carried out only at the limit price or lower. In the case of a
limit order to sell, the investor specifies the minimum price he will accept for the share; the order can
be carried out only at the limit price or higher Use of Market and limit orders:
To safe guard against extreme volatility in the markets, you can put a limit on what price you
would want your order to execute. Generally, limit orders are placed "away from the market." This
means that the limit price is somewhat removed from the prevailing price (generally, above the
prevailing price in the case of a limit order to sell, and below the prevailing price in the case of a
limit order to buy). Obviously, the investor operating in this manner believes that his limit price will
35
be reached and executed in a reasonable period of time. Therein, however, lies the chief disadvantage
of a limit order-i.e. it may never be executed at all. If the limit price is set very close to the prevailing
price, there is little advantage over the market order. Moreover, if the limit is considerably removed
from the market, the price may never reach the limit – even because of a fractional difference. Also
because limit orders are filled on a first come first basis, it is possible that so many of them are in
ahead of the investor’s limit at a given price that his order will never be executed. Thus, selecting a
proper limit price is a delicate maneuver.
On the other hand a market order is filled at the best possible price as soon as an investor
places the order and it will not be even possible to cancel the order. However, a limit order may be
cancelled or modified at any time prior to execution.
Time limit of Orders: Day Orders or End of Day Orders
A day order is one that remains active only for the normal trading time on that day. Unless
otherwise requested by the investor, all orders are treated as day orders only. Market orders are
almost day orders because they do not specify a particular price. One key rationale for the day order
is that market conditions might change overnight, and thus a seemingly good investment decision one
day might seem considerably less desirable the following day.
Good Till Cancel Order
A Good Till Cancelled (GTC) order remains in the system until they are executed or
cancelled. These types of orders are used in conjunction with limit orders. However, the system
cancels this order if it is not traded within a number of days, which is parameterized by the
Exchange. In the case of BSE and NSE, such order expires at the end of settlement in which it was
placed.
When using a GTC order, the investor is implying that he understands the market mechanics,
and therefore feels sufficiently confident that, given enough time, the order will be executed at the
limit price.
Good Till Date Order
A Good Till Days/Date (GTD) order allows you to specify the number of days/date till which
the order should stay in the system if not executed. The days counted are inclusive of the day/date on
which the order is placed and inclusive of holidays. Such orders are automatically cancelled at the

36
end of settlement in case strike-price is not reached during the tenure of settlement in which the order
was placed. The investor would then have to refresh the order with his broker, in the subsequent new
settlement.
Immediate or Cancel Order
An Immediate or Cancel (IOC) order allows the user to buy or sell a security as soon as the
order is released into the system, failing which the order is cancelled from the system. Partial match
is possible for the order and the unmatched portion of the order is cancelled immediately. NSE uses
the same terminology while BSE calls it Hit BUY/SELL.
SPECIAL TYPES OF ORDERS: Stop Loss Order:
A stop loss order allows investor to place an order, which gets activated only when the last
traded price of the share is reached or crosses a predefined threshold price also called as trigger price.
It means that if investor feels that any particular share will be worth buy or sell only after it crosses
some threshold rate then this type of order gets activated. Several possible dangers are inherent when
using this type of order. First, if the stop is placed too close to the market, the investor might have his
position closed out because of a minor price fluctuation, even though his idea will prove correct in
the long run. On the order hand, if the stop is too far away from the market, the stop order serves no
purpose. Further classification of this type of orders can be defined depending upon the price limit of
orders, i.e. the price on which the order should execute, as explained under:
Stop Loss Market Orders
A stop order is a special type of limit order but with very important differences in intent and
application. A stop market order to sell is treated as a market order when the stop price or a price
below is "touched" (reached); a stop market order to buy is treated as a market order when the stop
price or a price above it is reached. Thus, stop market order to sell is set at a price below the current
market price, and a stop order to buy is set at a price above the current market price.
The possible inherent danger associated with this type of order is that because they become
market orders after the proper price level has been reached, the actual transaction could take place

37
some distance away from the price the investor had in mind when he placed the order. The reason
may be prior queuing up of other orders or order quantity not available.
Stop Loss Limit Orders
The stop limit order is a device to overcome the uncertainties connected with a stop market
order – namely that of not knowing what the execution price will be after the order becomes a market
order. The stop limit order gives the investor the advantage of specifying the limit price: the
maximum price on which the buy order should filled or minimum price on which the sell order
should filled. Therefore, a stop limit order to buy is activated as soon as the stop price or higher is
reached, and then an attempt is made to buy at the limit price or lower. Conversely, a stop limit order
to sell is activated as soon as the stop price or lower is reached, and then an attempt is made to sell at
the limit price or higher. The obvious danger is that the order may not be executed in a volatile
market because the difference between execution limit and stop price may be too low. However, if
things work out as planned, the stop limit order to sell will be very effective.
Disclosed Quantity (DQ) order
The system provides a facility for entering orders with quantity conditions: DQ order allows
you to disclose only a part of the order quantity to the market.
Price Bands
Also known as circuit filters or circuit breakers, price bands set the upper and lower limit
within which a stock can fluctuate on any given day. A price band for the day is a function of
previous trading day’s closing. Currently the both BSE and NSE have fixed price bands for different
securities within which they can move within a day. Pursuant to a SEBI directive effective from July
03, 2000 the Exchanges decided that the price bands in respect of all the securities shall be relaxed by
8% after the security has touched the initial price band of 8%. However, for securities traded at or
above Rs.10 and below Rs.20 will have daily price band of +/-25% without any settlement / weekly
price band and for securities traded below Rs.10/- will have daily price band of +/- 50% without any
other settlement price band. The utility of price bands is that they are supposed to prevent extreme
price movements, thus reducing the scope of price manipulation. In a way price bands do slow things
down and make it that much harder for operators wanting to quickly manipulate prices in huge leaps.
When there is general euphoria or panic in the market that seems fundamentally unwarranted, price

38
bands give wary investors the benefit of a cooling period. Operators with access to large funds,
shares and time at their disposal, however can manipulate the price bands to their advantage by
blocking exit/entry of other investors from a particular counter by placing huge orders.
Example
For example when a stock touches the lower circuit in a sharp downtrend, ordinary buyers
would wait for the next trading session believing that the stock will be available at a still lower price. As a result, investors wanting to sell the stock won’t find buyers at the lower circuit price but would
have to offload at a much lower price due to the volume-led manipulation executed by operator. The
operator would thus be able to batter the stock down by a large gap created by his own sell order.

39
6. TRADING AND SETTLEMENT ACTIVITIES Introduction
The trading on stock exchanges in India used to take place through open outcry without use
of information technology for immediate matching or recording of trades. This was time consuming
and inefficient. This imposed limits on trading volumes and efficiency. In order to provide
efficiency, liquidity and transparency, NSE introduced a nation-wide on-line fully automated screen
based trading system (SBTS) where a member can punch into the computer quantities of securities
and the prices at which he likes to transact and the transaction is executed as soon as it finds a
matching sale or buy order from a counter party. SBTS electronically matches orders on a strict
price/time priority and hence cuts down on time, cost and risk of error, as well as on fraud resulting
in improved operational efficiency.
It allows faster incorporation of price sensitive information into prevailing prices, thus
increasing the informational efficiency of markets. It enables market participants, irrespective of their
geographical locations, to trade with one another simultaneously, improving the depth and liquidity
of the market. It provides full anonymity by accepting orders, big or small, from members without
revealing their identity, thus providing equal access to everybody. It also provides a perfect audit
trail, which helps to resolve disputes by logging in the trade execution process in entirety. This
sucked liquidity from other exchanges and in the very first year of its operation, NSE became the
leading stock exchange in the country, impacting the fortunes of other exchanges and forcing them to
adopt SBTS also. Today India can boast that almost 100% trading take place through electronic order
matching.
Technology was used to carry the trading platform from the trading hall of stock exchanges to
the premises of brokers. NSE carried the trading platform further to the PCs at the residence of
investors through the Internet and to handheld devices through WAP for convenience of mobile
investors. This made a huge difference in terms of equal access to investors in a geographically vast
country like India.
The trading network is depicted in Figure 1.1. NSE has main computer which is connected
through Very Small Aperture Terminal (VSAT) installed at its office. The main computer runs on a
fault tolerant STRATUS mainframe computer at the Exchange. Brokers have terminals (identified as

40
the PCs in the Figure 1.1) installed at their premises which are connected through VSATs/leased
lines/modems.
An investor informs a broker to place an order on his behalf. The broker enters the order
through his PC, which runs under Windows NT and sends signal to the Satellite via VSAT/leased
line/modem. The signal is directed to mainframe computer at NSE via VSAT at NSE's office. A
message relating to the order activity is broadcast to the respective member. The order confirmation
message is immediately displayed on the PC of the broker. This order matches with the existing
passive order(s), otherwise it waits for the active orders to enter the system. On order matching, a
message is broadcast to the respective member.
The trading system operates on a strict price time priority. All orders received on the system
are sorted with the best priced order getting the first priority for matching i.e., the best buy orders
match with the best sell order. Similar priced orders are sorted on time priority basis, i.e. the one that
came in early gets priority over the later one. Orders are matched automatically by the computer
keeping the system transparent, objective and fair. Where an order does not find a match, it remains
in the system and is displayed to the Whole market, till a fresh order comes in or the earlier order is
cancelled or modified.
The trading system provides tremendous flexibility to the users in terms of kinds of orders
that can be placed on the system. Several time - related (immediate or cancel), price-related (buy/sell
41
limit and stop loss orders) or volume related (Disclosed Quantity) conditions can be easily built into
an order. The trading system also provides complete market information on-line. The market screens
at any point of time provide complete information on total order depth in a security, the five best
buys and sells available in the market, the quantity traded during the day in that security, the high and
the low, the last traded price, etc. Investors can also know the fate of the orders almost as soon as
they are placed with the trading members. Thus the NEAT system provides an Open Electronic
Consolidated Limit Order Book (OECLOB).
Limit orders are orders to buy or sell shares at a stated quantity and stated price. If the price
quantity conditions do not match, the limit order will not be executed. The term ‘limit order book’
refers to the fact that only limit orders are stored in the book and all market orders are crossed against
the limit orders sitting in the book. Since the order book is visible to all market participants, it is
termed as an ‘Open Book’.
42
7. PREPARATION OF TECHNICAL CHARTS
TECHNICAL ANALYSIS
Fundamental and technical analyses are the 2 basic techniques used to analyze securities in
the stock market. Technical analysis is a mathematical approach to predict stock price movements
based on historical price and volume data. Usually stock charts are combined with the analytical data
to interpret technical indicators in a graphical format.
Technical analysis does not consider company fundamentals such as earnings, PE (Price to
Earnings Ratio), EBITDA, cash, debt, dividends, insider transactions, take-over’s, bankruptcy’s,
etc.Many professional securities traders recommend that aspiring traders use both fundamental and
technical analysis.
Interpreting stock charts Bar Chart
A method of displaying the open, high, low and close prices for a financial instrument for a
specific period.
Bar charts use single, vertical bars to illustrate a stock's price range and opening/closing
prices for a designated time period. The bars may illustrate daily, weekly, or monthly periods. For
example on a weekly chart, each bar represents one week and on a daily chart, each bar represents
one day.
The top of the bar indicates the stock's highest price of the period. The bottom of the bar
represents the stock's lowest price for that period. The small perpendicular bar on the left designates
the stock's opening price. The one on the right shows the stock's closing price.
Candle stick chart
A charting method used to display open, high, low and close prices for a security,
Candlesticks were invented by a 17th century Japanese rice broker, Munehisa Homma, who was one
of the first Japanese traders to use price history to predict future prices. His trading theories and
principles evolved into the candlestick charting techniques used today.

43
A candlestick uses the top and bottom of its bar to indicate high and low prices of the time
frame indicated. The bar is referred to as a "real body" and connects the opening and closing prices.
The real body shows the opening and closing prices with a clear, or a dark, rectangle. When the
rectangle or real body is clear, it means that the stock closed above its opening price. When the real
body is dark, it means that the stock closed below its opening price. The bar that extends above and
below the real body is called the upper shadow and lower shadow respectively.
Another major component of stock charts is the volume data. This data is usually shown in
bar graph format below the price chart
Line Chart The most basic of the four charts is the line chart because it represents only the closing prices over a
set period of time. The line is formed by connecting the closing prices over the time frame. Line
charts do not provide visual information of the trading range for the individual points such as the
high, low and opening prices. However, the closing price is often considered to be the most
important price in stock data compared to the high and low for the day and this is why it is the only
value used in line charts.

44
Head & Shoulders chart
The Head and Shoulders bottom is a popular pattern with investors. This pattern marks a
reversal of a downward trend in a financial instrument's price.
Volume is absolutely crucial to a Head and Shoulders Bottom. An investor will be looking for
increasing volumes at the point of breakout. This increased volume definitively marks the end of the
pattern and the reversal of a downward trend in the price of a stock.
A perfect example of the Head and Shoulders Bottom has three sharp low points created by
three successive reactions in the price of the financial instrument. It is essential that this pattern form
following a major downtrend in the financial instrument's price.
The first point - the left shoulder - occurs as the price of the financial instrument in a falling
market hits a new low and then rises in a minor recovery. The second point - the head happens when
prices fall from the high of the left shoulder to an even lower level and then rise again. The third
point - the right shoulder - occurs when prices fall again but don't hit the low of the head. Prices then
rise again once they have hit the low of the right shoulder. The lows of the shoulders are definitely
higher than that of the head and, in a classic formation, are often roughly equal to one another.
The neckline is a key element of this pattern. The neckline is formed by drawing a line
connecting the two high price points of the formation. The first high point occurs at the end of the
left shoulder and beginning of the downtrend to the head. The second marks the end of the head and
the beginning of the downturn to the right shoulder. The neckline usually points down in a Head and
Shoulders Bottom, but on rare occasions can slope up.
The pattern is complete when the resistance marked by the neckline is "broken". This occurs
when the price of the stock, rising from the low point of the right shoulder moves up through the
neckline. Many technical analysts only consider the neckline "broken" if the stock closes above the
neckline.

45
The volume sequence should progress beginning with relatively heavy volume as prices
descend to form the low point of the left shoulder. Once again, volume spikes as the stock hits
a new low to form the point of the head. It is possible that volume at the head may be slightly
lower than at the left shoulder. When the right shoulder is forming, however, volume should be
markedly lighter as the price of the stock once again moves lower.
It is most important to watch volume at the point where the neckline is broken. For a
true reversal, experts agree that heavy volume is essential. Technical indicators
Technical indicators are mathematical parameters that are constructed by intelligent
design with the intent to be used as tools to predict stock prices. The indicators are constructed
using stock price and volume data. View or create technical indicators at our example technical
indicators page. One signal market technicians look for is a divergence between certain
indicators and the price action of a stock. A positive divergence (classic buy signal) exists
when the price action of a stock is going down while the indicator is simultaneously becoming
more bullish. A negative divergence is the opposite of a positive divergence.
There are hundreds of well known technical indicators. Well known technical indicators
such as RSI (Relative Strength Index), Stochastics, Moving Average Cross-overs, MACD were
all contructed by humans. AiStockCharts.com goes far beyond relying on humans to construct
new intelligent technical indicators. Every day the AI (Artifical Intelligence) programs run at
AiStockCharts.com to find new and historically profitable technical indicators. Only the
strongest daily top stock picks are automatically entered into the AI StockCharts trading log as
open positions. Unlike other trading systems that set arbitrary entry and exit points,
AistockCharts.com sets exit prices including stop losses that are calculated based on the history
of the individual stock. Subscribers can lookup the historical performance of all technical
indicators. Some traders may be surprised to find some well known technical indicators have
worked well while others have not.
Hypothetical performance results have many inherent limitations, some of which are
described below. No representation is being made that any account will or is likely to achieve
profits or losses similar to those shown. In fact, there are frequently sharp differences between
hypothetical performance results and the actual results subsequently achieved by any particular
46
trading system. One of the limitations of hypothetical performance results is that they are
generally prepared with the
benefit of hindsight. In addition, hypothetical trading does not involve financial risk, and no
hypothetical trading record can completely account for the impact of financial risk in actual
trading. For example, the ability to withstand losses or to adhere to a particular trading program
in spite of trading losses are material points which can also adversely affect actual trading
results. There are numerous other factors related to the markets in general or to the
implementation of any specific trading program which cannot be fully accounted for in the
preparation of hypothetical performance results and all of which can adversely affect actual
trading results. The risk of loss in trading stocks can be substantial.
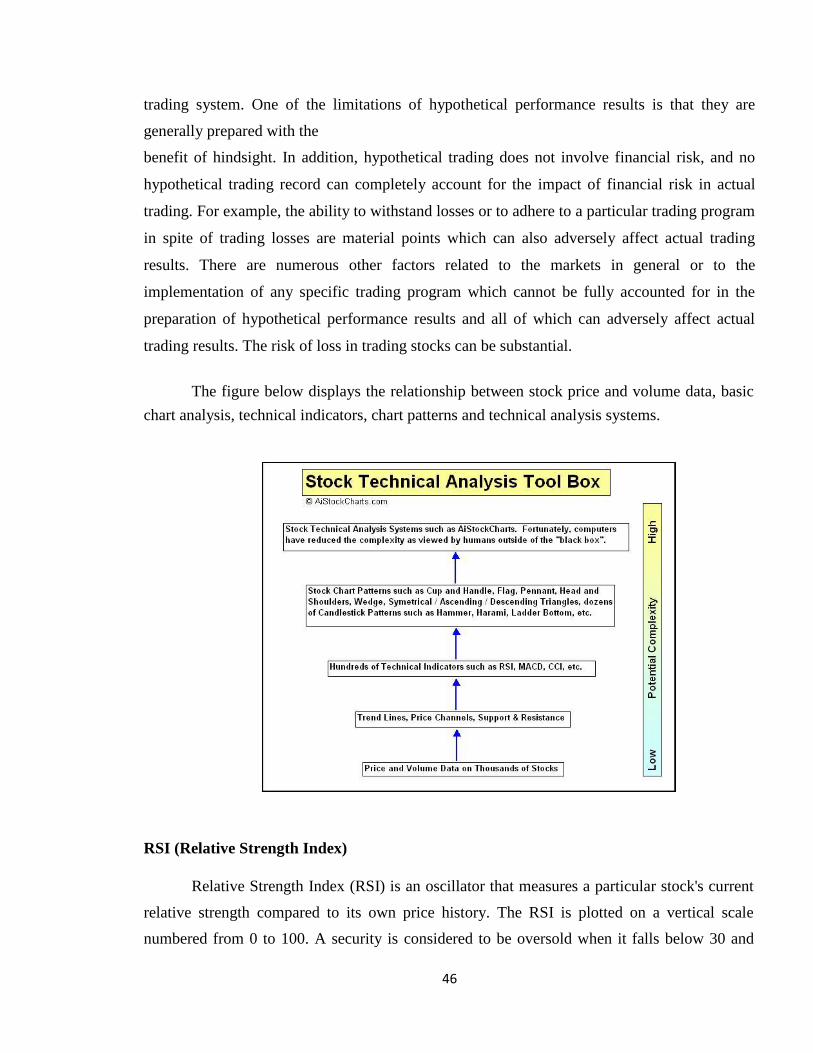
The figure below displays the relationship between stock price and volume data, basic
chart analysis, technical indicators, chart patterns and technical analysis systems.
RSI (Relative Strength Index)
Relative Strength Index (RSI) is an oscillator that measures a particular stock's current
relative strength compared to its own price history. The RSI is plotted on a vertical scale
numbered from 0 to 100. A security is considered to be oversold when it falls below 30 and
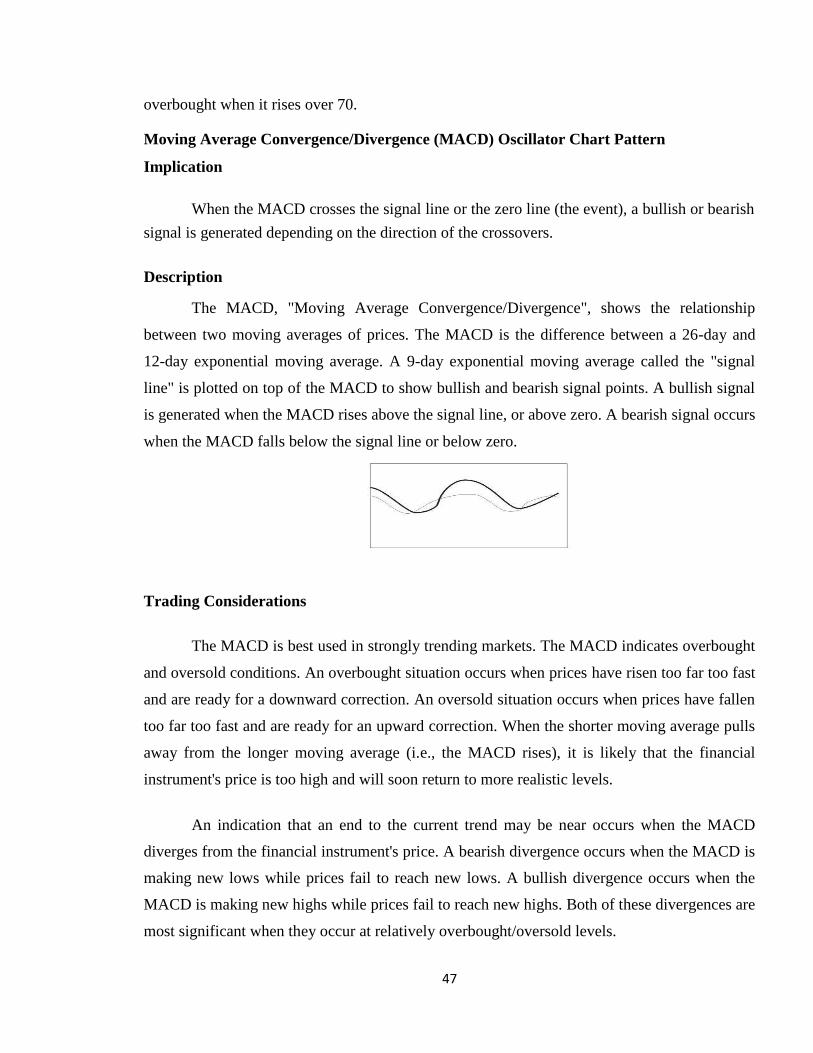
47
overbought when it rises over 70.
Moving Average Convergence/Divergence (MACD) Oscillator Chart Pattern Implication
When the MACD crosses the signal line or the zero line (the event), a bullish or bearish
signal is generated depending on the direction of the crossovers.
Description
The MACD, "Moving Average Convergence/Divergence", shows the relationship
between two moving averages of prices. The MACD is the difference between a 26-day and
12-day exponential moving average. A 9-day exponential moving average called the "signal
line" is plotted on top of the MACD to show bullish and bearish signal points. A bullish signal
is generated when the MACD rises above the signal line, or above zero. A bearish signal occurs
when the MACD falls below the signal line or below zero.
Trading Considerations
The MACD is best used in strongly trending markets. The MACD indicates overbought
and oversold conditions. An overbought situation occurs when prices have risen too far too fast
and are ready for a downward correction. An oversold situation occurs when prices have fallen
too far too fast and are ready for an upward correction. When the shorter moving average pulls
away from the longer moving average (i.e., the MACD rises), it is likely that the financial
instrument's price is too high and will soon return to more realistic levels.
An indication that an end to the current trend may be near occurs when the MACD
diverges from the financial instrument's price. A bearish divergence occurs when the MACD is
making new lows while prices fail to reach new lows. A bullish divergence occurs when the
MACD is making new highs while prices fail to reach new highs. Both of these divergences are
most significant when they occur at relatively overbought/oversold levels.
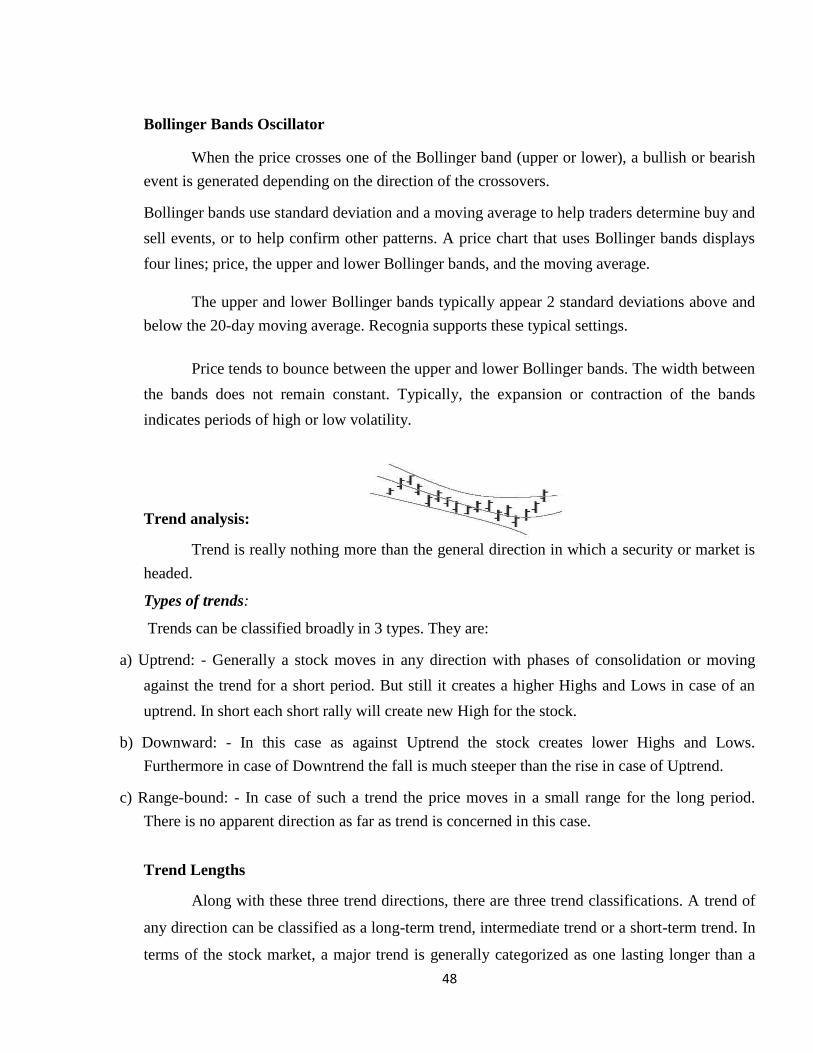
48
Bollinger Bands Oscillator
When the price crosses one of the Bollinger band (upper or lower), a bullish or bearish
event is generated depending on the direction of the crossovers. Bollinger bands use standard deviation and a moving average to help traders determine buy and
sell events, or to help confirm other patterns. A price chart that uses Bollinger bands displays
four lines; price, the upper and lower Bollinger bands, and the moving average.
The upper and lower Bollinger bands typically appear 2 standard deviations above and
below the 20-day moving average. Recognia supports these typical settings.
Price tends to bounce between the upper and lower Bollinger bands. The width between
the bands does not remain constant. Typically, the expansion or contraction of the bands
indicates periods of high or low volatility.
Trend analysis:
Trend is really nothing more than the general direction in which a security or market is
headed. Types of trends: Trends can be classified broadly in 3 types. They are:
a) Uptrend: - Generally a stock moves in any direction with phases of consolidation or moving
against the trend for a short period. But still it creates a higher Highs and Lows in case of an
uptrend. In short each short rally will create new High for the stock.
b) Downward: - In this case as against Uptrend the stock creates lower Highs and Lows.
Furthermore in case of Downtrend the fall is much steeper than the rise in case of Uptrend.
c) Range-bound: - In case of such a trend the price moves in a small range for the long period.
There is no apparent direction as far as trend is concerned in this case.
Trend Lengths
Along with these three trend directions, there are three trend classifications. A trend of
any direction can be classified as a long-term trend, intermediate trend or a short-term trend. In
terms of the stock market, a major trend is generally categorized as one lasting longer than a

49
year. An intermediate trend is considered to last between one and three months and a near-term
trend is anything less than a month. A long-term trend is composed of several intermediate
trends, which often move against the direction of the major trend. If the major trend is upward
and there is a downward correction in price movement followed by a continuation of the
uptrend, the correction is considered to be an intermediate trend.
When analyzing trends, it is important that the chart is constructed to best reflect the
type of trend being analyzed. To help identify long-term trends, weekly charts or daily charts
spanning a five-year period are used by chartists to get a better idea of the long-term trend.
Daily data charts are best used when analyzing both intermediate and short-term trends.
Trendlines
A trendline is a simple charting technique that adds a line to a chart to represent the
trend in the market or a stock. Drawing a trendline is as simple as drawing a straight line that
follows a general trend. These lines are used to clearly show the trend and are also used in the
identification of trend reversals.
As seen in the above figure, an upward trendline is drawn at the lows of an upward
trend. This line represents the support the stock has every time it moves from a high to a low.
Notice how the price is propped up by this support. This type of trendline helps traders to
anticipate the point at which a stock's price will begin moving upwards again. Similarly, a
downward trendline is drawn at the highs of the downward trend. This line represents the
resistance level that a stock faces every time the price moves from a low to a high.
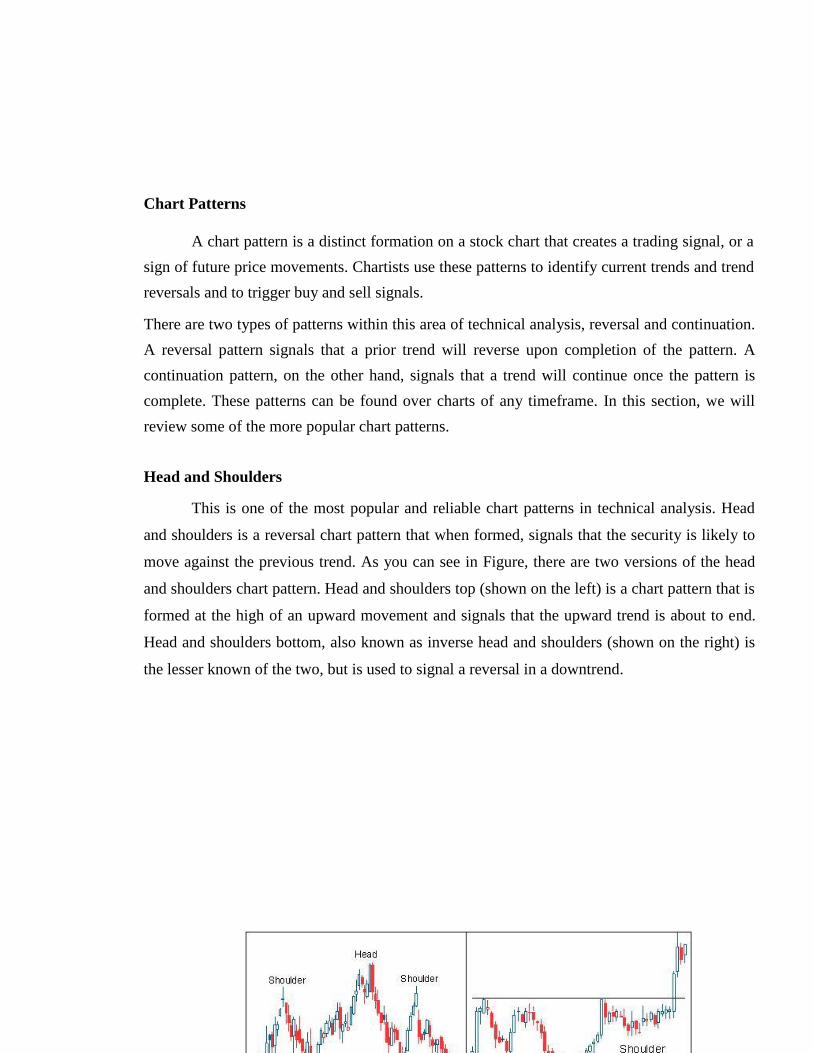
50
Chart Patterns
A chart pattern is a distinct formation on a stock chart that creates a trading signal, or a
sign of future price movements. Chartists use these patterns to identify current trends and trend
reversals and to trigger buy and sell signals. There are two types of patterns within this area of technical analysis, reversal and continuation.
A reversal pattern signals that a prior trend will reverse upon completion of the pattern. A
continuation pattern, on the other hand, signals that a trend will continue once the pattern is
complete. These patterns can be found over charts of any timeframe. In this section, we will
review some of the more popular chart patterns.
Head and Shoulders
This is one of the most popular and reliable chart patterns in technical analysis. Head
and shoulders is a reversal chart pattern that when formed, signals that the security is likely to
move against the previous trend. As you can see in Figure, there are two versions of the head
and shoulders chart pattern. Head and shoulders top (shown on the left) is a chart pattern that is
formed at the high of an upward movement and signals that the upward trend is about to end.
Head and shoulders bottom, also known as inverse head and shoulders (shown on the right) is
the lesser known of the two, but is used to signal a reversal in a downtrend.

51
Both of these head and shoulders patterns are similar in that there are four main parts:
two shoulders, a head and a neckline. Also, each individual head and shoulder is comprised of
a high and a low. For example, in the head and shoulders top image shown on the left side in
Figure, the left shoulder is made up of a high followed by a low. In this pattern, the neckline is
a level of support or resistance. Remember that an upward trend is a period of successive rising
highs and rising lows. The head and shoulders chart pattern, therefore, illustrates a weakening
in a trend by showing the deterioration in the successive movements of the highs and lows.
We have finished our look at some of the more popular chart patterns. You should now
be able to recognize each chart pattern as well the signal it can form for chartists. We will now
move on to other technical techniques and examine how they are used by technical traders to
gauge price movements.
Charting terms and indicators
Concepts
Average true range - averaged daily trading range
Coppock - Edwin Coppock developed the Coppock Indicator with one sole
purpose: to identify the commencement of bull markets
Dead cat bounce - the phenomenon whereby a spectacular decline in the price of a
stock is immediately followed by a moderate and temporary rise before resuming
its downward movement
Elliott wave principle and the golden ratio to calculate successive price
movements and retracements
Hikkake Pattern - pattern for identifying reversals and continuations
Momentum - the rate of price change
Overlays
Overlays are generally superimposed over the main price chart.

52
Resistance - an area that brings on increased selling
Support - an area that brings on increased buying
Breakout - when a price passes through and stays above an area of support or resistance
Trend line - a sloping line of support or resistance
Channel - a pair of parallel trend lines
Moving average - lags behind the price action but filters out short term movements
Bollinger bands - a range of price volatility
Pivot point - derived by calculating the numerical average of a particular currency's or
stock's high, low and closing prices
Price-based indicators
These indicators are generally shown below or above the main price chart.
Accumulation/distribution index—based on the close within the day's range
Average Directional Index — a widely used indicator of trend strength
Commodity Channel Index - identifies cyclical trends
MACD - moving average convergence/divergence
Parabolic SAR - Wilder's trailing stop based on prices tending to stay within a parabolic
curve during a strong trend
Relative Strength Index (RSI) - oscillator showing price strength
Rahul Mohindar Oscillator - a trend indentifying indicator
Stochastic oscillator, close position within recent trading range
Trix - an oscillator showing the slope of a triple-smoothed exponential moving average,
developed in the 1980s by Jack Hutson
53
8. FUNDAMENTAL ANALYSIS OF A COMPANY
Introduction
Investing, like most other things, requires that you have a general philosophy about how to do things in order to avoid careless errors.
Fundamental Analysis - Buying a Business (Value, Growth, Income, GARP, Quality)
Many people rightly believe that when you buy a share of stock you are buying a proportional
share in a business. As a consequence, to figure out how much the stock is worth, you should
determine how much the business is worth. Investors generally do this by assessing the company's
financials in terms of per-share values in order to calculate how much the proportional share of the
business is worth. This is known as "fundamental" analysis by some, and most who use it view it as
the only kind of rational stock analysis.
Although analyzing a business might seem like a straightforward activity, there are many
flavors of fundamental analysis. Investors often create oppositions and subcategories in order to
better understand their specific investing philosophy. In the end, most investors come up with an
approach that is a blend of a number of different approaches. Many of the distinctions are more
academic inventions than actual practical differences. For instance, value and growth have been
codified by economists who study the stock market even though market practitioners do not find
these labels to be quite as useful. In the following descriptions, we will focus on what most investors
mean when they use these labels, although you always have to be careful to double-check what
someone using them really means.
Value
The goal of the value investor is to purchase companies at a large discount to their intrinsic
value - what the business would be worth if it were sold tomorrow. In a sense, all investors are
"value" investors - they want to buy a stock that is worth more than what they paid. Typically those
who describe themselves as value investors are focused on the liquidation value of a company, or
what it might be worth if all of its assets were sold tomorrow. However, value can be a very
confusing label as the idea of intrinsic value is not specifically limited to the notion of liquidation
value. Novices should understand that although most value investors believe in certain things, not all
who use the word "value" mean the same thing.

54
These value investors tend to have very strict, absolute rules governing how they
purchase a company's stock. These rules are usually based on relationships between the current
market price of the company and certain business fundamentals. Some examples include:
Price/earnings ratios (P/E) below a certain absolute limit Dividend yields above a certain absolute limit Book value per share at a certain level relative to the share price Total sales at a certain level relative to the company's market capitalization, or market value
Growth
Growth investing is the idea that you should buy stock in companies whose potential for
growth in sales and earnings is excellent. Growth investors tend to focus more on the company's
value as an ongoing concern. Many plan to hold these stocks for long periods of time, although
this is not always the case. At a certain point, "growth" as a label is as dysfunctional as "value,"
given that very few people want to buy companies that are not growing.
Growth investors look at the underlying quality of the business and the rate at which it is
growing in order to analyze whether to buy it. Excited by new companies, new industries, and
new markets, growth investors normally buy companies that they believe are capable of
increasing sales, earnings, and other important business metrics by a minimum amount each year.
Growth is often discussed in opposition to value, but sometimes the lines between the two
approaches become quite fuzzy in practice.
Income
Although today common stocks are widely purchased by people who expect the shares to
increase in value, there are still many people who buy stocks primarily because of the stream of
dividends they generate. Called income investors, these individuals often entirely forego
companies whose shares have the possibility of capital appreciation for high-yielding dividend-
paying companies in slow-growth industries. These investors focus on companies that pay high
dividends like utilities and real estate investment trusts (REITs), although many times they may
invest in companies undergoing significant business problems whose share prices have sunk so
low that the dividend yield is consequently very high.
GARP

55
GARP, aside from being the name of the title character to John Irving's The World
According to Garp, is an acronym for growth at a reasonable price. The world according to GARP
investors combines the value and growth approaches and adds a numerical slant. Practitioners look
for companies with solid growth prospects and current share prices that do not reflect the intrinsic
value of the business, getting a "double play" as earnings increase and the price/earnings (P/E) ratios
at which those earnings are valued increase as well. Peter Lynch, who may be familiar to you
through his starring role in Fidelity Investments commercials with Lily Tomlin and Don Rickles, is
GARP's most famous practitioner.
One of the most common GARP approaches is to buy stocks when the P/E ratio is lower than
the rate at which earnings per share can grow in the future. As the company's earnings per share
grow, the P/E of the company will fall if the share price remains constant. Since fast-growing
companies normally can sustain high P/Es, the GARP investor is buying a company that will be
cheap tomorrow if the growth occurs as expected. If the growth does not come, however, the GARP
investor's perceived bargain can disappear very quickly.
Because GARP presents so many opportunities to focus just on numbers instead of looking at
the business, many GARP approaches, like the nearly ubiquitous PEG ratio and Jim O'Shaughnessy's
work in What Works on Wall Street are really hybrids of fundamental analysis and another type of
analysis -- quantitative analysis.
Quality
Most investors today use a hybrid of value, growth, and GARP approaches. These investors are
looking for high-quality businesses selling for "reasonable" prices. Although they do not have any
shorthand rules for what kind of numerical relationships there should be between the share price and
business fundamentals, they do share a similar philosophy of looking at the company's valuation and
at the inherent quality of the company as measured both quantitatively by concepts like Return on
Equity (ROE) and qualitatively by the competence of management. Many of them describe
themselves as value investors, although they concentrate much more on the value of the company as
an ongoing concern rather than on liquidation value.
Warren Buffett of Berkshire Hathaway is probably the most famous practitioner of this
approach. He studied under Benjamin Graham at Columbia Business School but was eventually
swayed by his partner, Charlie Munger, to also pay attention to Phil Fisher's message of growth and
quality.
56
Arguments against Fundamental Analysis
Those who do not use fundamental analysis have two major arguments against it. The first is
that they believe that this type of investing is based on exactly the kind of information that all major
participants in publicly traded markets already know, so therefore it can provide no real advantage. If
you cannot get a leg up by doing all of this fundamental work understanding the business, why
bother? The second is that much of the fundamental information is "fuzzy" or "squishy," meaning
that it is often up to the person looking at it to interpret its significance. Although gifted individuals
can succeed, this group reasons, the average person would be better served by not paying attention to
this kind of information.
Quantitative Analysis - Buying the Numbers
Pure quantitative analysts look only at numbers with almost no regard for the underlying
business. The more you find yourself talking about numbers, the more likely you are to be using a
purely quantitative approach. Although even fundamental analysis requires some numerical inputs,
the primary concern is always the underlying business, focusing on things like management's
expertise, the competitive environment, the market potential for new products, and the like.
Quantitative analysts view these things as subjective judgments, and instead focus on the
incontrovertible objective data that can be analyzed.
One of the principal minds behind fundamental analysis, Benjamin Graham, was also one of
the original proponents of this trend. While running the Graham-Newman partnership, Graham
exhorted his analysts to never talk to management when analyzing a company and focus completely
on the numbers, as management could always lead one astray.
In recent years as computers have been used to do a lot of number crunching, many "quants," as
they like to call themselves, have gone completely native and will only buy and sell companies
on a purely quantitative basis, without regard for the actual business or the current valuation - a
radical departure from fundamental analysis. "Quants" will often mix in ideas like a stock's
relative strength, a measure of how well the stock has performed relative to the market as a
whole. Many investors believe that if they just find the right kinds of numbers, they can always
find winning investments. D. E. Shaw is widely viewed as the current King of the Quants, using
sophisticated mathematical algorithms to find minute price discrepancies in the markets. His
partnership sometimes accounts for as much as 50% of the trading volume on the New York

57
Stock Exchange in a single day.
Company Size
Some investors purposefully narrow their range of investments to only companies of a
certain size, measured either by market capitalization or by revenues. The most common way to
do this is to break up companies by market capitalization and call them micro-caps, small-caps,
mid-caps, and large-caps, with "cap" being short for "capitalization." Different-size companies
have shown different returns over time, with the returns being higher the smaller the company.
Others believe that because a company's market capitalization is as much a factor of the market's
excitement about the company as it is the size, revenues are a much better way to break up the
company universe. Although there is no set breakdown used by all investors, most distinctions
look something like this: MICRO - $100 million or less
SMALL - $100 million to $500 million
MID - $500 million to $5 billion
LARGE - $5 billion or more
The majority of publicly traded companies fall in the micro or small categories. Some
statisticians believe that the perceived outperformance of these smaller companies may have
more to do with "survivor" bias than actual superiority, as many of the databases used to do this
performance testing routinely expunged bankrupt companies until pretty recently. Since smaller
companies have higher rates of bankruptcy, excluding this factor helps "juice" up their historical
returns as a result. However, this factor is still being debated.
Screen-Based Investing
Many quantitative analysts use "screens" to select their investments, meaning that they
use a number of quantitative criteria and examine only the companies that meet these criteria. As
the use of computers has become widespread, this approach has increased in popularity because
it is easy to do. Screens can look at any number of factors about a company's business or its stock
over many time periods.
Arguments against Quantitative Analysis
Because quantitative analysis hinges on screens that anyone can use, as computing

58
horsepower becomes cheaper and cheaper many of the pricing inefficiencies quantitative analysis
finds are wiped out soon after they are discovered. If a particular screen has generated 40% returns
per year and becomes widely known, and if lots of money flows into the companies that the screen
identifies, the returns will start to suffer.
As "fuzzy" as fundamental analysis might be, there are often times that knowing even a little
about the company you are buying can help a lot. For instance, if you are using a high-relative-
strength screen, you should always check and see if the companies you find have risen in price
because of a merger or an acquisition. If this is the case, then the price will probably stay right where
it is, even if the "screen" you used to pick this company has generated high annual returns in the past.
Capital Appreciation
One of the two components of total return, capital appreciation is how much the underlying
value of a security has increased. If you bought a stock at $10 and it has risen to $13, you have
enjoyed a 30% return from the appreciation of the original capital you invested. Dividend yield is the
other component of total return.
Dividend Yield
A ratio of a company's annual cash dividends divided by its current stock price expressed in the
form of a%age. To get the expected annual cash dividend payment, take the next expected quarterly
dividend payment and multiply that by four. For instance, if a $10 stock is expected to pay a 25 cent
quarterly dividend next quarter, you just multiple 25 cents by 4 to get $1 and then divide this by $10
to get a dividend yield of 10%.
Ann. Div. $0.25* 4
Dividend Yield = = = 0.10 = 10%
P rice $ 10
Many newspapers and online quote services will include dividend yield as one of the
variables. If you are uncertain whether the current quoted dividend yield reflects a recent
increase in the dividend a company may have made, you can call the company and ask
them what the dividend per share they expect to pay next quarter will be.

59
Earnings per Share (EPS)
Earnings, also known as net income or net profit, are the money that is left over after a
company pays all of its bills. For many investors, earnings are the most important factor in analyzing
a company. To allow for apples-to-apples comparisons, those who look at earnings use earnings per
share (EPS).
You calculate the earnings per share by dividing the dollar amount of the earnings a company
reports over the past 12 months by the number of shares it currently has outstanding. Thus, if XYZ
Corp. has 1 million shares outstanding and has earned $1 million in the past 12 months, it has an EPS
of $1.00.
$1,000,000
= $1.00 in earnings per share (EPS)
1 ,000,000 shares
Market Capitalization
The current market value of all of a company's shares outstanding. To calculate market
value, you take the number of shares outstanding and multiply them by the current price of each
share. You can find information about shares outstanding from the company's last quarterly report or
any online quote service.
For instance, if a company has 10 million shares outstanding and trades at $13 per share, the
market capitalization is $130 million.
= Shares Outstanding* Share Price
et =10 million * $13 = $130 million Price/Earnings Ratio (P/E)
Earnings per share alone mean absolutely nothing. In order to get a sense of how expensive
or cheap a stock is, you have to look at those earnings relative to the stock price. To do this, most
investors employ the price/earnings (P/E) ratio. The P/E ratio takes the stock price and divides it by
the last four quarters' worth of earnings. If XYZ Corp. is currently trading at $15 a share with $1.00
of earnings per share (EPS), it would have a P/E of 15.In general P/E ratio is denoted by P/E=Market
60
Per share/EPS.
Real Estate Investment Trusts (REITs)
REITs are a specialized form of equity that allows investors to own a portion of a group of
real estate properties, although many investors think of them as an alternative to bonds. REITs have
become increasingly popular over the past decade. Granted special tax status by the Internal Revenue
Service, REITs pay out at least 95% of their earnings in the form of dividends to shareholders, often
offering healthy dividend yields of the same magnitude as bonds. Even better, as REITs acquire more
property and increase the value of the properties they own, the value of the equity increases as well,
providing a nice total return. For more information on REITs, check the website for the National
Association of REITS (NAREIT).
Relative Strength
Relative strength, also known as relative price strength, rates the performance of a stock
versus the performance of the market as a whole over a given time period. The rating system gives a
numerical grade - just like the ones Mr. Spicer used to scrawl in bright red ink on your algebra
quizzes - to the performance of a stock over a given period, normally the past 12 months. Thus,
relative strength is a momentum indicator.
The most popular form of relative strength ratings are those published in Investor's Business
Daily, which go from 1 to 99. A relative strength of 95, for example, indicates a wonderful stock, one
that has outperformed 95% of all other U.S. stocks over the past year. However, given that relative
strength is only a mathematical relationship between the stock's performance and an index's
performance, many others have created their own relative strength measures.
Revenues
It is also known as sales, revenues are how much the company has sold over a given period.
Annual revenues would be the sales for a given year, whereas quarterly revenues would be the sales
for a given quarter.
Sales
It is also known as revenues, sales are literally how much the company has sold over a given
period. Annual sales would be the sales for a given year, whereas quarterly sales would be the sales
for a given quarter.
61
Utilities
A business that provides a service essential to almost everyone is called a utility. These
businesses are almost always under some form of regulation by the government and normally have a
monopoly position in a certain region. Electric companies, natural gas providers, and local phone
companies are often referred to as utilities.
Volume
The number of shares traded on a given day is known as the volume. Many investors look at
volume over a month or a year to come up with average daily volume. Market watchers will say a
company has traded at a certain number of times the average daily volume, giving the investor a
sense of how active the stock was on a certain day relative to previous days. When major news is
announced, a stock can trade as much as 20 or 30 times its average daily volume, particularly if the
average daily volume is very low.
The average number of shares traded gives an investor an idea of a company's liquidity - how
easy it is to buy and sell a particular stock. Highly liquid stocks trade easily in large batches with low
transaction costs. Illiquid stocks trade infrequently and large sales often cause the price to rise or fall
dramatically. Illiquid stocks on the NASDAQ also tend to carry the largest spreads, the difference
between the buying price and the selling price.

62
9. COMPANY SPECIFIC EVENTS AND IDENTIFICATION OF STOCK PRICE REACTION
Introduction
The corporate specific events can be broadly classified under stock benefit and cash benefit.
The various stock benefits declared by the issuer of capital are Bonus, Rights, Merger/ Demerger,
Amalgamation, splits, consolidations, hive-off, warrants and secured premium notes. The cash
benefit declared by the issuer of capital is cash dividend.
STOCK BENEFIT SCHEMES:
Corporate stock benefit plans are to help the corporate clients retain their efficient employees.
Bonus:
An issue of additional shares (bonus shares) to a company's shareholders in proportion to
their existing shareholding, representing the conversion of reserves into capital. A company may
decide to distribute further shares as an alternative to increasing the dividend payout. It is also known
as a "scrip issue" or "capitalization issue".
Rights issue:
When doing a secondary market offering, of shares to raise money, a company can opt to do a
rights issue to raise equity. With the issued rights, existing shareholders have the privilege to buy a
specified number of new shares from the firm at a specified attractive price within a specified time. A
rights issue is offered to all existing shareholders individually and may be rejected, accepted in full
or (in a typical rights issue) accepted in part by each shareholder.
Rights can be renounceable (can be sold separately from the share to other investors during
the life of the right) or non-renounceable (shareholders must either take up the rights or let them
lapse. Once the rights have lapsed, they no longer exist). To issue rights the financial manager has to consider:
Subscription price per new share
number of new shares to be sold
the value of rights
the effect of rights on the value of the current share

63
the effect of rights to existing and new shareholders

64
A right to a share, generally issued on ratio basis (e.g. one-for-three rights issue). Because the
company is getting the shareholders' money in exchange for issuing rights, a rights issue is a source
of funds for the company issuing it.
Rights issues may be underwritten. The role of the underwriter is to guarantee that the funds
sought by the company will be raised. The agreement between the underwriter and the company is
set out in a formal underwriting agreement. Typical terms of an underwriting require the underwriter
to subscribe for any shares offered but not taken up by shareholders. Underwriters and sub-
underwriters may be financial institutions, stock-brokers, major shareholders of the company or other
related or unrelated parties. The Panel’s guidance covers both non-underwritten and underwritten
rights issue.
Merger:
Combination of two or more companies, where the amount paid over and above the acquired
company's book value is carried on the books of the purchaser as goodwill; or a consolidation, where
a new company is formed to acquire the net assets of the combining companies.
Mergers can also be classified in terms of their economic function. Thus a horizontal merger
is one combining direct competitors in the same product lines and markets; a vertical merger
combines customer and company or supplier and company; a market extension merger combines
companies selling the same products in different markets; a product extension merger combines
companies selling different but related products in the same market; a conglomerate merger combines
companies with none of the above relationships or similarities.
Demerger:
A corporate strategy to sell off subsidiaries or divisions of a company. For example, in 2001
British Telecom did a de-merger of its mobile phone arm, BT Wireless, in an attempt to boost the
performance of its stock. British Telecom took this action because it was struggling under high debt
levels from the wireless venture.
Amalgamation:
An existing Company which is taken over by another existing company. In such course of
amalgamation, the consideration may be paid in cash or in Kind, and the purchasing company
services in this process.

65
Stock splits:
A type of corporate action where a company's existing shares are divided into multiple
shares. Although the amount of shares outstanding increases by a specific multiple, the total
dollar value of the shares remains the same compared to pre-split amounts, because no real value
has been added as a result of the split.
One reason as to why stock splits are performed is that a company's share price has grown
so high that to many investors the shares are too expensive to buy in round lots.
For example, if a XYZ Corp's shares were worth $1,000 each, investors would need to
purchase $100,000 in order to own 100 shares. Whereas, if each share was worth $10 each,
investors only need to pay $1,000 to own 100 shares.
Consolidations:
Consolidation is the act of merging many things into one. In business, it often refers to the
mergers or acquisitions of many smaller companies to much larger ones. The financial accounting
term of consolidation refers to the aggregated financial statements of a group company as
consolidated account.
Types of Business Consolidations
There are three forms of business combinations: Statutory Merger: a business combination that results in the liquidation of the
acquired
company’s assets and the survival of the purchasing company. Statutory Consolidation: business combination that creates a new company in which
none of the previous companies survive. Stock Acquisition: a business combination in which the purchasing company
acquires
the majority, more than 50%, of the common stock of the acquired company and both companies
survive. Amalgamation: Means an existing Company which is taken over by another existing
company. In such course of amalgamation, the consideration may be paid in cash or in Kind, and
the
purchasing company servises in this process.

66
Cash benefit scheme: Dividend:
Dividends are payments made by a company to its share holders. When a company earns a
profit, that money can be put to two uses: it can either be re-invested in the business or it can be paid
to the shareholders of the company as a dividend. Paying dividends is not an expense rather, it is the
division of an asset among shareholders. Many companies retain a portion of their earnings and pay
the remainder as a dividend. Publicly-traded companies usually pay dividends on a fixed schedule,
but may declare a dividend at any time, sometimes called a special dividend to distinguish it from a
regular one.
Dividends are usually settled on a cash basis, as a payment from the company to the
customer. They can also take the form of shares in the company (either newly-created shares or
existing shares bought in the market), and many companies offer dividend reinvestment plans, which
automatically use the cash dividend to purchase additional shares for the shareholder.
Cash dividends (most common) are those paid out in form of checks. Such dividends are a
form of investment income and are usually taxable to the recipient in the year they are paid. This is
the most common method of sharing corporate profits with the shareholders of the company.

67
10. STUDY ON INDICES
Introduction
Stock Market is a place where the stocks of a listed company are traded. A single figure that
sums up the overall performance of the market on a daily basis is the Stock Index. A good Stock
Index captures the movement of the well diversified and highly liquid stocks. For a lay man it is the
pulse rate of the economy. Index movements reflect the changing expectations of the stock market
about future dividends of the corporate sector. The index is calculated by finding the weighted
average of the prices of the most actively traded companies in the market, where the weights are
generally in proportion to the market capitalization of the company.
But when and where did it all start? Stock Exchanges as a centre for trading were established
as early as the 16th century. In Antwerp, a major financial hub in Belgium, traders gathered together
in 1531 to speculate in shares and commodities. This was the world's first Stock Exchange. London
and Paris set up Exchanges sometime near the end of the 17th century. Close to hundred years later,
in 1792, the New York Stock Exchange (NYSE) was established, which is still one of the world’s
most powerful exchanges today.
The reason for establishment was primarily the need for financing businesses and for
providing returns for the finances. In India, the Stock Exchange, Mumbai, was established in 1875 as
"The Native Share and Stockbrokers Association" (a voluntary non-profit making association) and is
now popularly known as the Bombay Stock Exchange (BSE).
The other major exchange is the National Stock Exchange of India Limited (NSE) and was
incorporated in November 1992. Combined the two trading zones are responsible for 99.9% of the
trading done in India.
Types of Indexes available:-
Broad-Market Index: This consists of all the large, liquid stocks of the country and becomes the benchmark for the entire capital market of the country. An example for this is the S&P CNX 500.
Specialized Index: We can either have Industry or Sector specific Index for any particular sector of the economy which then serves as the benchmark for that particular industry or we can have an index

68
for the highly liquid stocks. Taking an example for an industry specific index we have the S&P
Banking Index which is a capitalization-weighted index of 26 domestic equities traded on the New
York Stock Exchange and NASDAQ, The stocks in the Index are high-capitalization stocks
representing a sector of the S&P 500. Similarly, The S&P CNX Nifty is a relevant example for an
index composed of highly liquid stocks.
Determinants of a Stock Index
Following parameters should be taken into picture before one constructs a stock index:
Liquidity – Liquidity of stocks as measured by the “impact cost” criterion which determines the cost faced when actually trading the index. For example if the current market price of a stock is Rs 200
and a trader purchases it at Rs 202 (due to involved transaction costs) then the market impact cost is
1% and the stock is considered highly liquid for lower impact cost. EG.
Diversification – Diversification, by putting stocks of various sectors that reflect the economy, is used to cancel out stock noise which is essentially the individual stock fluctuations and to reduce
investor’s risks. An index must thus have a balanced representation of all sectors.
Optimum size - More stocks lead to greater diversification but the limiting factor is the size of the index. Increasing number of stocks in an index from 10 to say 30 gives a sharp reduction in risks but
increasing the number beyond a point does very little in risk reduction. Further it might lead to
addition of illiquid stocks. For example, the optimal size for BSE Sensex is 30.
Market Capitalization: The index should include primarily the stocks of companies that have significant market capitalization with respect to the index such that any major change in the price of
the stock is reflected in the index. For example in BSE 30 Index, the scrip must have a minimum of
0.5% of the market capitalization of the Index.
Averaging - Every stock primarily moves for two reasons: The news about the company and the news about the country. An ideal index is affected only by the latter, that is the news of the economy
and the effect of the former is knocked out by proper averaging.
The various methods of averaging employed are:
Price Weighted: The weights assigned are proportional to the stock prices.

69
Market Capitalization Weighted: The equity price is weighted by the market capitalization of the
company. Hence each constituent stock in the index affects the index value in proportion to the market value of all outstanding shares.
(Current market capitalization)
Index = ---------------------------------------- x Base Value
(Base Market Capitalization)
Where:
CMS = Sum of (current market price * outstanding shares) of all securities in the index
BMS = Sum of (market price * issue size) of all securities as on base date.
Equal Weighted: The weights are equal and assigned irrespective of both market capitalization or
price Index revision is done periodically taking into consideration the factors mentioned above. The
relevant index body makes clear, researched and publicly documented rules for this purpose. These
rules are applied regularly, to obtain changes to the index set. However, it is ensured that the value of
the index does not change significantly after the revision of the index set.
SENSEX (BSE 30)
The index includes 30 companies which figure in top 100 in terms of market capitalization
and are also among the leaders in their industry groups. Presently the following are the constituent
companies: ACC, Infosys, ICICI Bank, Dr. Reddy’s Lab, SBI, CIPLA, Zee Telefilms, Nestle India, RPL, RIL, HCL Tech., Bajaj Auto, BHEL, Castrol, BSES, Colgate Palmolive, Hindalco, Grasim,
Glaxo, Hero Honda, Gujrat Ambuja Cements, HLL, HPCL, ITC, L&T, MTNL, Ranbaxy, TISCO,
TELCO and Satyam.
Standard and Poor’s CRISIL NSE Exchange NIFTY
S&P CNX NIFTY is an S&P endorsed Stock Index owned by the India Index Services Ltd.
(IISL). It is a highly diversified index, accurately reflecting the overall market conditions and is
composed of 50 liquid stocks. It is backed by solid economic research and three extremely respected
organizations (NSE, CRISIL and S&P).
70
Signals from the Stock Index
The Index finds uses in various fields starting from economic research to helping investors
choose appropriate portfolio for investment. For example the index funds are funds that passively
invest in the market i.e. the portfolio returns of the index funds is same as that of the Index. Since the
Index is an indicator of the overall mood of the investors in the secondary market, it helps a company
answer questions like is it the right time to take out an IPO, how to price the issue, etc. It acts as a
signal to the government of the ‘feel good’ factor prevailing in the economy.
The Stock Index can often also act as a trigger to herd mentality. Any downturn in the market
would be reinforced by the collective action of the investors to hedge against any losses and get out
of the market. This would further depress the market. This herd mentality is often used to the
advantage of speculators. The speculator buys long thus creating waves in the market that the stock
he is investing in is ‘hot’. Thus everyone would follow suit giving the speculator a good short term
profit margin. The stock index is often more a representation of investors’ perceptions (noise
element) rather than real news. The dot com bubble of 2000 is a case in point.
There was a rush of investment in anything even remotely connected with information-
technology driving up the stock prices way above what they should have been according to their P/E
ratios. Thus it can be seen that though the index is a popular investor’s guide, it is riddled with
imperfections which can often confuse rather than help. The index popularly used in India is the NSE
CNX Nifty. There are processes afoot to reduce the pure noise element and speculative margin of the
index. The basic problem arises due to imperfect information reflected by the inclusion of illiquid
stocks in the calculation of the index. Illiquid stock is one which is not actively traded in the market
or has been lying dormant for a long time. Inclusion of such stocks leads to problems of stale prices,
bid-ask bounce and ease in manipulation.
Bid-ask bounce: Illiquid stocks have a wide bid-ask spread. Thus even when no news is breaking,
when a stock price is not changing, the `bid-ask bounce' is about prices bouncing up and down
between bid and ask. Such changes are spurious in nature.
Stale prices: To make an index useful, there has to be continuous evaluation of the stocks listed and
any stock which remains inactive for a period of time should be de-listed or removed from the index.

71
11. MARKETING OF MUTUAL FUNDS
Introduction
A mutual fund is an investment company that collects money from many people and
invests it in a variety of securities. The company then manages the money on an ongoing basis
for individuals and businesses. Mutual funds are an efficient way to invest in stocks, bonds, and
other securities for two reasons:
The securities purchased are managed by professional managers.
Risk is spread out or diversified, because you have a collection of different stocks and bonds.
Usually, investment companies have a variety of funds to sell. Examples of investment
companies include Vanguard, Fidelity, Janus, T. Rowe Price, American Funds, and Dreyfus.
These and other companies have many mutual funds with different investment objectives. Mutual
funds can be bought directly from the investment company or from brokers, banks, financial
planners, or insurance agents.
Before purchasing any fund:
Read the fund’s prospectus.
Study the fund’s fee table.
Consider the fund’s objective and your investment objectives.
Consider the other investments you have.
Know the fund’s performance.
Read other financial information about funds you are considering.
Mutual Fund
Mutual Fund is a investment company that pools money from shareholders and invests in a variety of
securities, such as stocks, bonds and money market instruments. Most open-end mutual funds stand
ready to buy back (redeem) its shares at their current net asset value, which depends on the total
market value of the fund's investment portfolio at the time of redemption. Most open-end mutual
funds continuously offer new shares to investors. It is also known as an open-end investment
company, to differentiate it from a closed-end investment company. Mutual funds invest pooled cash
of many investors to meet the fund's stated investment objective. Mutual funds stand ready to sell and
redeem their shares at any time at the fund's current net asset value: total fund assets divided by
shares outstanding.

72
In Simple Words, Mutual fund is a mechanism for pooling the resources by issuing units to
the investors and investing funds in securities in accordance with objectives as disclosed in offer
document.
Investments in securities are spread across a wide cross-section of industries and sectors and
thus the risk is reduced. Diversification reduces the risk because all stocks may not move in the same
direction in the same proportion at the same time. Mutual fund issues units to the investors in
accordance with quantum of money invested by them. Investors of mutual funds are known as unit
holders.
The profits or losses are shared by the investors in proportion to their investments. The
mutual funds normally come out with a number of schemes with different investment objectives
which are launched from time to time. In India, A mutual fund is required to be registered with
Securities and Exchange Board of India (SEBI) which regulates securities markets before it can
collect funds from the public.
In Short, a mutual fund is a common pool of money in to which investors with common
investment objective place their contributions that are to be invested in accordance with the stated
investment objective of the scheme. The investment manager would invest the money collected from
the investor in to assets that are defined/ permitted by the stated objective of the scheme. For
example, an equity fund would invest equity and equity related instruments and a debt fund would
invest in bonds, debentures, gilts etc. Mutual Fund is a suitable investment for the common man as it
offers an opportunity to invest in a diversified, professionally managed basket of securities at a
relatively low cost.
Objective of Mutual Funds
1. Income. Income funds focus on dividends and interest that provide income to investors.
This is a relatively steady source of money, but the fund’s NAV can still go up and down.
2. Growth. Growth funds focus on increasing the value of the principal or amount invested
through capital gains and net asset values. Growth funds are usually more risky but offer greater
potential return.
3. Stability. Stability funds focus on protecting the amount invested from loss so the fund’s
NAV does not go down. This is the least risky type of fund but may make the least amount of money.

73
Schemes according to Maturity Period:
A mutual fund scheme can be classified into open-ended scheme or close-ended scheme
depending on its maturity period.
Open-ended Fund
An open-ended Mutual fund is one that is available for subscription and repurchase on a
continuous basis. These Funds do not have a fixed maturity period. Investors can conveniently buy
and sell units at Net Asset Value (NAV) related prices which are declared on a daily basis. The key
feature of open-end schemes is liquidity.
Close-ended Fund
A close-ended Mutual fund has a stipulated maturity period e.g. 5-7 years. The fund is open
for subscription only during a specified period at the time of launch of the scheme. Investors can
invest in the scheme at the time of the initial public issue and thereafter they can buy or sell the units
of the scheme on the stock exchanges where the units are listed. In order to provide an exit route to
the investors, some close-ended funds give an option of selling back the units to the mutual fund
through periodic repurchase at NAV related prices. SEBI Regulations stipulate that at least one of the
two exit routes is provided to the investor i.e. either repurchase facility or through listing on stock
exchanges. These mutual funds schemes disclose NAV generally on weekly basis.
Fund according to Investment Objective A scheme can also be classified as growth fund, income
fund, or balanced fund considering its investment objective. Such schemes may be open-ended or
close-ended schemes as described earlier. Such schemes may be classified mainly as follows:
Growth / Equity Oriented Scheme
The aim of growth funds is to provide capital appreciation over the medium to long- term.
Such schemes normally invest a major part of their corpus in equities. Such funds have
comparatively high risks. These schemes provide different options to the investors like dividend
option, capital appreciation, etc. and the investors may choose an option depending on their
preferences. The investors must indicate the option in the application form. The mutual funds also
allow the investors to change the options at a later date. Growth schemes are good for investors
having a long-term outlook seeking appreciation over a period of time.
Income / Debt Oriented Scheme

74
The aim of income funds is to provide regular and steady income to investors. Such schemes
generally invest in fixed income securities such as bonds, corporate debentures, Government
securities and money market instruments. Such funds are less risky compared to equity schemes.
These funds are not affected because of fluctuations in equity markets. However, opportunities of
capital appreciation are also limited in such funds. The NAVs of such funds are affected because of
change in interest rates in the country. If the interest rates fall, NAVs of such funds are likely to
increase in the short run and vice versa. However, long term investors may not bother about these
fluctuations.
Balanced Fund
The aim of balanced funds is to provide both growth and regular income as such schemes
invest both in equities and fixed income securities in the proportion indicated in their offer
documents. These are appropriate for investors looking for moderate growth. They generally invest
40-60% in equity and debt instruments. These funds are also affected because of fluctuations in share
prices in the stock markets. However, NAVs of such funds are likely to be less volatile compared to
pure equity funds.
Money Market or Liquid Fund
These funds are also income funds and their aim is to provide easy liquidity, preservation of
capital and moderate income. These schemes invest exclusively in safer short-term instruments such
as treasury bills, certificates of deposit, commercial paper and inter-bank call money, government
securities, etc. Returns on these schemes fluctuate much less compared to other funds. These funds
are appropriate for corporate and individual investors as a means to park their surplus funds for short
periods.
Gilt Fund
These funds invest exclusively in government securities. Government securities have no
default risk. NAVs of these schemes also fluctuate due to change in interest rates and other economic
factors as is the case with income or debt oriented schemes.
Index Funds
Index Funds replicate the portfolio of a particular index such as the BSE Sensitive index,
S&P NSE 50 index (Nifty), etc. These schemes invest in the securities in the same weightage

75
comprising of an index. NAVs of such schemes would rise or fall in accordance with the rise or fall
in the index, though not exactly by the same percentage due to some factors known as "tracking
error" in technical terms. Necessary disclosures in this regard are made in the offer document of the
mutual fund scheme. There are also exchange traded index funds launched by the mutual funds
which are traded on the stock exchanges.
NET ASSET VALUE
The Term Net Asset Value (NAV) is used by investment companies to measure net assets. It
is calculated by subtracting liabilities from the value of a fund's securities and other items of value
and dividing this by the number of outstanding shares. Net asset value is popularly used in
newspaper mutual fund tables to designate the price per share for the fund.
The value of a collective investment fund based on the market price of securities held in its
portfolio. Units in open ended funds are valued using this measure. Closed ended investment trusts
have a net asset value but have a separate market value. NAV per share is calculated by dividing this
figure by the number of ordinary shares. Investments trusts can trade at net asset value or their price
can be at a premium or discount to NAV.
NAV is calculated each day by taking the closing market value of all securities owned plus all
other assets such as cash, subtracting all liabilities, then dividing the result (total net assets) by the
total number of shares outstanding.
Calculating NAVs - Calculating mutual fund net asset values is easy. Simply take the current market
value of the fund's net assets (securities held by the fund minus any liabilities) and divide by the
number of shares outstanding. So if a fund had net assets of Rs.50 lakh and there are one lakh shares
of the fund, then the price per share (or NAV) is Rs.50.00.
Tax Saving Schemes
In India, Tax Saving Schemes schemes offer tax rebates to the investors under specific
provisions of the Income Tax Act, 1961 as the Government offers tax incentives for investment in
specified avenues. e.g. Equity Linked Savings Schemes (ELSS).
Pension schemes launched by the mutual funds also offer tax benefits. These schemes are
growth oriented and invest pre-dominantly in equities. Their growth opportunities and risks
associated are like any equity-oriented scheme.
76
Load Funds / No Load Funds
A Load Fund is one that charges a percentage of NAV for entry or exit. That is, each time one
buys or sells units in the fund, a charge will be payable. This charge is used by the mutual fund for
marketing and distribution expenses. Suppose the NAV per unit is Rs.10. If the entry as well as exit
load charged is 1%, then the investors who buy would be required to pay Rs.10.10 and those who
offer their units for repurchase to the mutual fund will get only Rs.9.90 per unit. The investors should
take the loads into consideration while making investment as these affect their yields/returns.
However, the investors should also consider the performance track record and service standards of
the mutual fund which are more important. Efficient Mutual funds may give higher returns in spite of
loads.
A no-load fund is one that does not charge for entry or exit. It means the investors can enter
the fund/scheme at NAV and no additional charges are payable on purchase or sale of units.
Assured Return Scheme In Mutual Funds, Assured Return Schemes are those schemes that assure a specific return to the
unitholders irrespective of performance of the scheme. A scheme cannot promise returns unless such
returns are fully guaranteed by the sponsor or AMC and this is required to be disclosed in the offer
document. Investors should carefully read the offer document whether return is assured for the entire
period of the scheme or only for a certain period. Some schemes assure returns one year at a time and
they review and change it at the beginning of the next year.
How to Invest in Mutual Funds?
Mutual funds normally come out with an advertisement in newspapers publishing the date of
launch of the new schemes. Investors can also contact the agents and distributors of mutual funds
who are spread all over the country for necessary information and application forms. Forms can be
deposited with mutual funds through the agents and distributors who provide such services. Now a
days, the post offices and banks also distribute the units of mutual funds. However, the investors may
please note that the mutual funds schemes being marketed by banks and post offices should not be
taken as their own schemes and no assurance of returns is given by them. The only role of banks and
post offices is to help in distribution of mutual funds schemes to the investors. Investors should not be carried away by commission/gifts given by agents/distributors for investing
in a particular scheme. On the other hand they must consider the track record of the mutual fund and
77
should take objective decisions.
Non-Resident Indians (NRI) can also invest in mutual funds. Normally, necessary details in
this respect are given in the offer documents of the schemes. How to fill Mutual Fund Application Form
An investor must mention clearly his name, address, number of units applied for and such
other information as required in the application form. He must give his bank account number so as to
avoid any fraudulent encashment of any cheque/draft issued by the mutual fund at a later date for the
purpose of dividend or repurchase. Any changes in the address, bank account number, etc at a later
date should be informed to the mutual fund immediately.
Mutual Fund Offer Document -What to Look For?
An abridged offer document, which contains very useful information, is required to be given
to the prospective investor by the mutual fund. The application form for subscription to a Mutual
Fund is an integral part of the offer document. SEBI has prescribed minimum disclosures in the offer
document. An investor, before investing in a Mutual Fund scheme, should carefully read the offer
document. Due care must be given to portions relating to main features of the Mutual Fund, risk
factors, initial issue expenses and recurring expenses to be charged to the Mutual Fund entry or exit
loads, sponsor’s track record, educational qualification and work experience of key personnel
including fund managers, performance of other Mutual Fund schemes launched by the mutual fund
in the past, pending litigations and penalties imposed, etc.
Can Mutual Fund Change Schemes?
Yes. They Can However, no change in the nature or terms of the scheme, known as
fundamental attributes of the Mutual Fund e.g. structure, investment pattern, etc. can be carried out
unless a written communication is sent to each unit holder and an advertisement is given in one
English daily having nationwide circulation and in a newspaper published in the language of the
region where the head office of the mutual fund is situated. The unitholders have the right to exit the
Mutual Fund at the prevailing NAV without any exit load if they do not want to continue with the
scheme. The mutual funds are also required to follow similar procedure while converting the scheme
form close-ended to open-ended scheme and in case of change in sponsor.
The mutual funds are required to inform any material changes to their unitholders. Apart from
78
it, many mutual funds send quarterly newsletters to their investors. At present, offer documents are
required to be revised and updated at least once in two years. In the meantime, new investors are
informed about the material changes by way of addendum to the offer document till the time offer
document is revised and reprinted.
Mutual Funds Performance
The performance of a Mutual Fund is reflected in its net asset value (NAV) which is disclosed
on daily basis in case of open-ended schemes and on weekly basis in case of close-ended schemes.
The NAVs of mutual funds are required to be published in newspapers. The NAVs are also available
on the web sites of mutual funds.
The mutual funds are also required to publish their performance in the form of half-yearly
results which also include their returns/yields over a period of time i.e. last six months, 1 year, 3
years, 5 years and since inception of schemes. The mutual funds are also required to send annual
report or abridged annual report to the unitholders at the end of the year.
Various studies on mutual fund schemes including yields of different schemes are being
published by the financial newspapers on a weekly basis. Apart from these, many research agencies
also publish research reports on performance of mutual funds including the ranking of various
schemes in terms of their performance. Investors should study these reports and keep themselves
informed about the performance of various schemes of different mutual funds.
Investors can compare the performance of their schemes with those of other mutual funds
under the same category. They can also compare the performance of equity oriented schemes with
the benchmarks like BSE Sensitive Index, S&P CNX Nifty, etc. On the basis of performance of the
mutual funds, the investors should decide when to enter or exit from a mutual fund scheme
Where do the Mutual Funds Invest? How to check it
The mutual funds are required to disclose full portfolios of all of their schemes on half-yearly
basis which are published in the newspapers. Some mutual funds send the portfolios to their
unitholders.
The scheme portfolio shows investment made in each security i.e. equity, debentures, money
market instruments, government securities, etc. and their quantity, market value and % to NAV.
These portfolio statements also required to disclose illiquid securities in the portfolio, investment

79
made in rated and unrated debt securities, non-performing assets (NPAs), etc. Some of the mutual
funds send newsletters to the unitholders on quarterly basis which also contain portfolios of the
schemes.
Where can an investor look out for information on mutual funds?
Almost all the mutual funds have their own web sites. Investors can also access the NAVs,
half-yearly results and portfolios of all mutual funds at the web site of Association of mutual funds in
India (AMFI) www.amfiindia.com. AMFI has also published useful literature for the investors.
Investors can log on to the web site of SEBI www.sebi.gov.in and go to "Mutual Funds"
section for information on SEBI regulations and guidelines, data on mutual funds, draft offer
documents filed by mutual funds, addresses of mutual funds, etc. Also, in the annual reports of SEBI
available on the web site, a lot of information on mutual funds is given.
There are a number of other web sites which give a lot of information of various schemes of
mutual funds including yields over a period of time. Many newspapers also publish useful
information on mutual funds on daily and weekly basis. Investors may approach their agents and
distributors to guide them in this regard.
80
12. FUTURES AND OPTIONS-SCREEN BASED TRADING SYSTEM
Introduction
The futures & options trading system of NSE, called NEAT-F&O trading system,
provides a fully automated screen-based trading for Index futures & options and Stock futures &
options on a nationwide basis as well as an online monitoring and surveillance mechanism. It
supports an order driven market and provides complete transparency of trading operations. It is
similar to that of trading of equities in the cash market segment.
The software for the F&O market has been developed to facilitate efficient and transparent
trading in futures and options instruments. Keeping in view the familiarity of trading members
with the current capital market trading system, modifications have been performed in the existing
capital market trading system so as to make it suitable for trading futures and options.
Entities in the trading system
There are four entities in the trading system. Trading members, clearing members,
professional clearing members and participants.
1) Trading members:
Trading members are members of NSE. They can trade either on their own account or on
behalf of their clients including participants. The exchange assigns a trading member ID to each
trading member. Each trading member can have more than one user. The number of users
allowed for each trading member is notified by the exchange from time to time. Each user of a
trading member must be registered with the exchange and is assigned a unique user ID. The
unique trading member ID functions as a reference for all orders/trades of different users. This ID
is common for all users of a particular trading member. It is the responsibility of the trading
member to maintain adequate control over persons having access to the firm’s User IDs. 2) Clearing members:
Clearing members are members of NSCCL. They carry out risk management activities and

81
confirmation/inquiry of trades through the trading system.
3) Professional clearing members:
A professional clearing member is a clearing member who is not a trading member.
Typically, banks and custodians become professional clearing members and clear and settle for
their trading members.
4) Participants:
A participant is a client of trading members like financial institutions. These clients may
trade through multiple trading members but settle through a single clearing member.
Basis of trading
The NEAT F&O system supports an order driven market, wherein orders match
automatically. Order matching is essentially on the basis of security, its price, time and quantity.
All quantity fields are in units and price in rupees. The exchange notifies the regular lot size and
tick size for each of the contracts traded on this segment from time to time. When any order
enters the trading system, it is an active order. It tries to find a match on the other side of the
book. If it finds a match, a trade is generated. If it does not find a match, the order becomes
passive and goes and sits in the respective outstanding order book in the system.
Corporate hierarchy
In the F&O trading software, a trading member has the facility of defining a hierarchy
amongst users of the system. This hierarchy comprises corporate manager, branch manager and
dealer.
1) Corporate manager:
The term 'Corporate manager' is assigned to a user placed at the highest level in a trading
firm. Such a user can perform all the functions such as order and trade related activities, receiving
reports for all branches of the trading member firm and also all dealers of the firm. Additionally,
a corporate manager can define exposure limits for the branches of the firm. This facility is
available only to the corporate manager.
2) Branch manager:
82
The branch manager is a term assigned to a user who is placed under the corporate
manager. Such a user can perform and view order and trade related activities for all dealers under
that branch.
3) Dealer:
Dealers are users at the lower most level of the hierarchy. A Dealer can perform view order and
trade related activities only for one and does not have access to information on other dealers under
either the same branch or other branches.
Client Broker Relationship in Derivative Segment
A trading member must ensure compliance particularly with relation to the following while
dealing with clients:
Filling of 'Know Your Client' form
Execution of Client Broker agreement
Bring risk factors to the knowledge of client by getting acknowledgement of client on risk
disclosure document
Timely execution of orders as per the instruction of clients in respective client codes.
Collection of adequate margins from the client
Maintaining separate client bank account for the segregation of client money.
Timely issue of contract notes as per the prescribed format to the client
Ensuring timely pay-in and pay-out of funds to and from the clients
Resolving complaint of clients if any at the earliest.
Avoiding receipt and payment of cash and deal only through account payee cheques
Sending the periodical statement of accounts to clients
Not charging excess brokerage
Maintaining unique client code as per the regulations.
Order types and conditions
The system allows the trading members to enter orders with various conditions attached to
them as per their requirements. These conditions are broadly divided into the following
categories:
83
Time conditions
Price conditions
Other conditions
Several combinations of the above are allowed thereby providing enormous flexibility to
the users. The order types and conditions are summarized below.
Time conditions
Day order:
A day order, as the name suggests is an order which is valid for the day on which it is
entered. If the order is not executed during the day, the system cancels the order automatically at
the end of the day.
Immediate or Cancel (IOC):
An IOC order allows the user to buy or sell a contract as soon as the order is released into
the system, failing which the order is cancelled from the system. Partial match is possible for the
order, and the unmatched portion of the order is cancelled immediately.
Price condition
Stop-loss:
This facility allows the user to release an order into the system, after the market price of
the security reaches or crosses a threshold price e.g. if for stop-loss buy order, the trigger is
1027.00, the limit price is 1030.00 and the market (last traded) price is 1023.00, then this order is
released into the system once the market price reaches or exceeds 1027.00. This order is added to
the regular lot book with time of triggering as the time stamp, as a limit order of 1030.00. For the
stop-loss sell order, the trigger price has to be greater than the limit price.
Other conditions
Market price:
Market orders are orders for which no price is specified at the time the order is entered (i.e.
price is market price). For such orders, the system determines the price.
Trigger price:

84
Price at which an order gets triggered from the stop-loss book.
Limit price:
Price of the orders after triggering from stop-loss book.
Pro(Proprietor):
Pro means that the orders are entered on the trading member's own account.
Cli(Client):
Cli means that the trading member enters the orders on behalf of a client.
Placing orders on the trading system
For both the futures and the options market, while entering orders on the trading system,
members are required to identify orders as being proprietary or client orders. Proprietary orders
should be identified as 'Pro' and those of clients should be identified as 'Cli'. Apart from this, in
the case of 'Cli' trades, the client account number should also be provided.
The futures market is a zero sum game i.e. the total number of long in any contract always
equals the total number of short in any contract. The total number of outstanding contracts
(long/short) at any point in time is called the "Open interest". This Open interest figure is a good
indicator of the liquidity in every contract. Based on studies carried out in international
exchanges, it is found that open interest is maximum in near month expiry contracts.
Market spread/combination order entry
The NEAT F&O trading system also enables to enter spread/combination trades. This
enables the user to input two or three orders simultaneously into the market. These orders will
have the condition attached to it that unless and until the whole batch of orders finds a counter
match, they shall not be traded. This facilitates spread and combination trading strategies with
minimum price risk.
FUTURES AND OPTIONS MARKET INSTRUMENTS
The F&O segment of NSE provides trading facilities for the following derivative instruments:
1. Index based futures 2. Index based options
85
3. Individual stock options 4. Individual stock futures Contract specifications for index futures
NSE trades Nifty, CNX IT, BANK Nifty, CNX Nifty Junior, CNX 100, Nifty Midcap 50 and
Mini Nifty 50 futures contracts having one-month, two-month and three-month expiry cycles. All
contracts expire on the last Thursday of every month. Thus a January expiration contract would
expire on the last Thursday of January and a February expiry contract would cease trading on the last
Thursday of February. On the Friday following the last Thursday, a new contract having a three-
month expiry would be introduced for trading.
The Instrument type refers to "Futures contract on index" and Contract symbol - NIFTY
denotes a "Futures contract on Nifty index" and the Expiry date represents the last date on which the
contract will be available for trading.
Each futures contract has a separate limit order book. All passive orders are stacked in the
system in terms of price-time priority and trades take place at the passive order price (similar to the
existing capital market trading system). The best buy order for a given futures contract will be the
order to buy the index at the highest index level whereas the best sell order will be the order to sell
the index at the lowest index level.
Example:
If trading is for a minimum lot size of 100 units. If the index level is around 2000, then the
appropriate value of a single index futures contract would be Rs.200000. The minimum tick size for
an index future contract is 0.05 units. Thus a single move in the index value would imply a resultant
gain or loss of Rs.5.00 (i.e. 0.05*100 units) on an open position of 100 units.
Table 6.1 gives the contract specifications for index futures trading on the NSE. The figure
shows the contract cycle for futures contracts on NSE's derivatives market. As can be seen, at any
given point of time, three contracts are available for trading - a near-month, a middle-month and a
far-month. As the January contract expires on the last Thursday of the month, a new three-month
contract starts trading from the following day, once more making available three index futures

86
contracts for trading.
Figure - Contract cycle Contract specification for index options
On NSE's index options market; there are one- month, two- month and three-month expiry
contracts with minimum nine different strikes available for trading. Hence, if there are three serial
month contracts available and the scheme of strikes is 4-1-4, then there are minimum 3 x 9 x 2 (call
and put 83 options) i.e. 54 options contracts available on an index. Option contracts are specified as
follows: DATE-EXPIRYMONTH-YEAR-CALL/PUT-AMERICAN/ EUROPEAN-STRIKE. For
example the European style call option contract on the Nifty index with a strike price of 2040
expiring on the 30th June 2005 is specified as '30 JUN 2005 2040 CE'.
Just as in the case of futures contracts, each option product (for instance, the 28 JUN 2005 2040
CE) has its own order book and its own prices. All index options contracts are cash settled and expire
on the last Thursday of the month. The clearing corporation does the novation. The minimum tick for
an index options contract is 0.05 paise. Table 6.2 gives the contract specifications for index options
trading on the NSE.
Contract specifications for stock futures

87
Trading in stock futures commenced on the NSE from November 2001. These contracts are
cash settled on a T+1 basis. The expiration cycle for stock futures is the same as for index futures,
index options and stock options. A new contract is introduced on the trading day following the expiry
of the near month contract. The below table gives the contract specifications for stock futures.
Table- Contract specification: Stock futures Contract specifications for stock options
Trading in stock options commenced on the NSE from July 2001. These contracts are
American style and are settled in cash. The expiration cycle for stock options is the same as for index
futures and index options. A new contract is introduced on the trading day following the expiry of the
near month contract. NSE provides a minimum of seven strike prices for every option type (i.e. call
and put) during the trading month. There are at least three in-the-money contracts, three out-of-the-
money contracts and one at-the-money contract available for trading. The below table gives the
contract specifications for stock options.
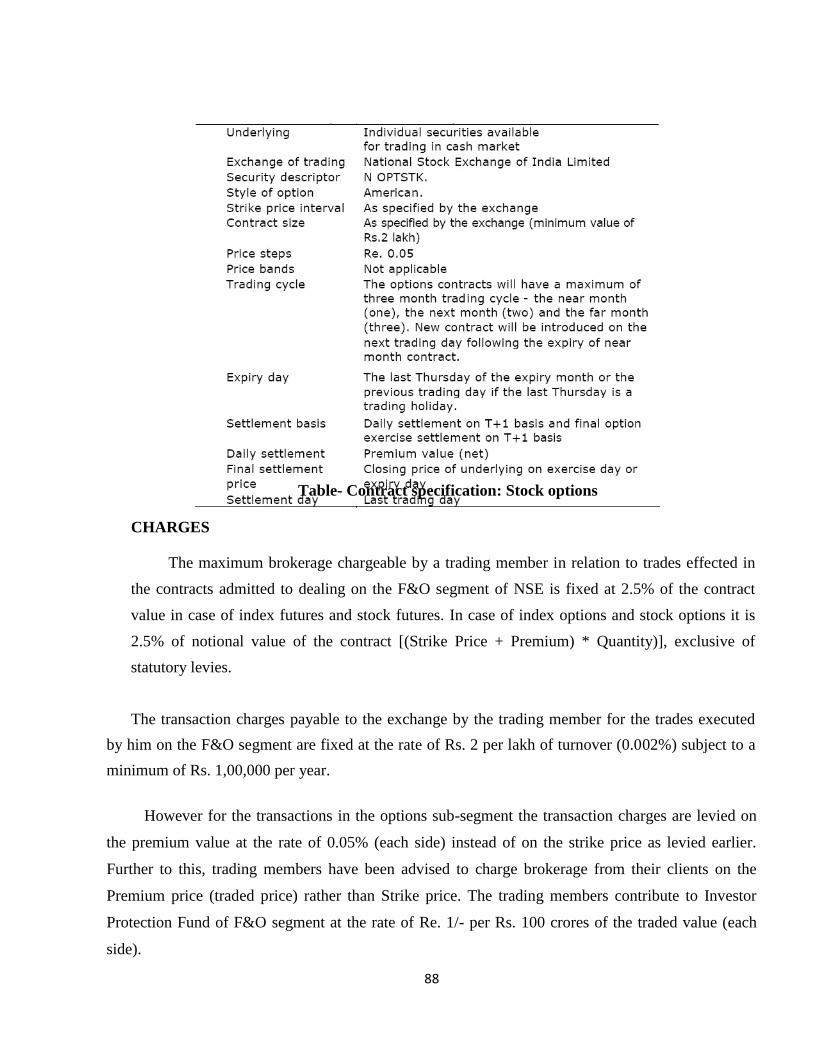
88
Table- Contract specification: Stock options
CHARGES
The maximum brokerage chargeable by a trading member in relation to trades effected in
the contracts admitted to dealing on the F&O segment of NSE is fixed at 2.5% of the contract
value in case of index futures and stock futures. In case of index options and stock options it is
2.5% of notional value of the contract [(Strike Price + Premium) * Quantity)], exclusive of
statutory levies.
The transaction charges payable to the exchange by the trading member for the trades executed
by him on the F&O segment are fixed at the rate of Rs. 2 per lakh of turnover (0.002%) subject to a
minimum of Rs. 1,00,000 per year.
However for the transactions in the options sub-segment the transaction charges are levied on
the premium value at the rate of 0.05% (each side) instead of on the strike price as levied earlier.
Further to this, trading members have been advised to charge brokerage from their clients on the
Premium price (traded price) rather than Strike price. The trading members contribute to Investor
Protection Fund of F&O segment at the rate of Re. 1/- per Rs. 100 crores of the traded value (each
side).

89
13. A STUDY ON CLEARING AND SETTLEMENT ACTIVITIES IN FUTURES AND OPTIONS
National Securities Clearing Corporation Limited (NSCCL) undertakes clearing and settlement
of all trades executed on the futures and options (F&O) segment of the NSE. It also acts as legal
counterparty to all trades on the F&O segment and guarantees their financial settlement.
CLEARING ENTITIES
Clearing and settlement activities in the F&O segment are undertaken by NSCCL with the help
of the following entities:
Clearing members
In the F&O segment, some members, called self clearing members, clear and settle their trades
executed by them only either on their own account or on account of their clients. Some others called
trading member-cum-clearing member, clear and settle their own trades as well as trades of other
trading members (TMs). Besides, there is a special category of members, called professional clearing
members (PCM) who clear and settle trades executed by TMs. The members clearing their own
trades and trades of others, and the PCMs are required to bring in additional security deposits in
respect of every TM whose trades they undertake to clear and settle.
Clearing banks
Funds settlement takes place through clearing banks. For the purpose of settlement all clearing
members are required to open a separate bank account with NSCCL designated clearing bank for
F&O segment. The Clearing and Settlement process comprises of the following three main activities:
1) Clearing 2) Settlement 3) Risk Management
CLEARING MECHANISM
The clearing mechanism essentially involves working out open positions and obligations of
clearing (self-clearing/trading-cum-clearing/professional clearing) members. This position is
considered for exposure and daily margin purposes. The open positions of CMs are arrived at by

90
aggregating the open positions of all the TMs and all custodial participants clearing through him, in
contracts in which they have traded. A TM's open position is arrived at as the summation of his
proprietary open position and clients' open positions, in the contracts in which he has traded. While
entering orders on the trading system, TMs are required to identify the orders, whether proprietary (if
they are their own trades) or client (if entered on behalf of clients) through 'Pro/ Cli' indicator
provided in the order entry screen. Proprietary positions are calculated on net basis (buy - sell) for
each contract. Clients' positions are arrived at by summing together net (buy - sell) positions of each
individual client. A TM's open position is the sum of proprietary open position, client open long
position and client open short position.
SETTLEMENT MECHANISM
All futures and options contracts are cash settled, i.e. through exchange of cash. The underlying
for index futures/options of the Nifty index cannot be delivered. These contracts, therefore, have to
be settled in cash. Futures and options on individual securities can be delivered as in the spot market.
However, it has been currently mandated that stock options and futures would also be cash settled.
The settlement amount for a CM is netted across all their TMs/clients, with respect to their
obligations on MTM, premium and exercise settlement.
Table -Determination of open position of a clearing member Settlement of futures contracts
Futures contracts have two types of settlements, the MTM settlement which happens on a
continuous basis at the end of each day, and the final settlement which happens on the last trading
day of the futures contract.
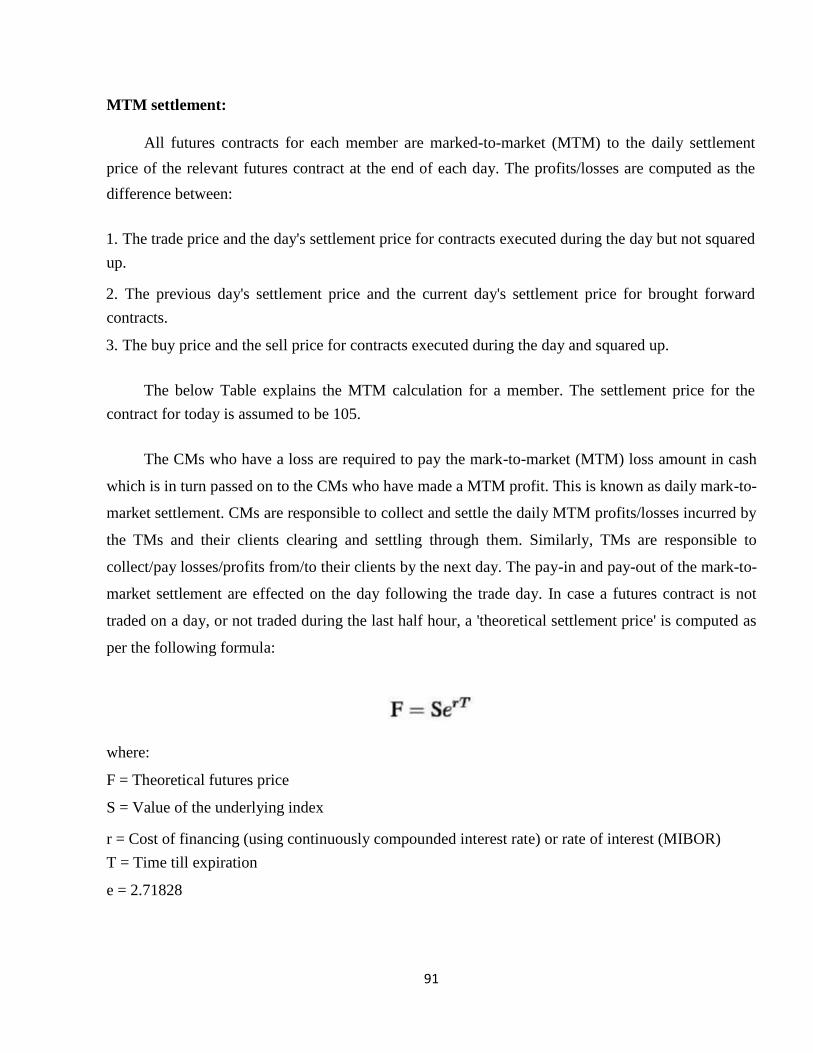
91
MTM settlement:
All futures contracts for each member are marked-to-market (MTM) to the daily settlement
price of the relevant futures contract at the end of each day. The profits/losses are computed as the
difference between:
1. The trade price and the day's settlement price for contracts executed during the day but not squared
up. 2. The previous day's settlement price and the current day's settlement price for brought forward
contracts. 3. The buy price and the sell price for contracts executed during the day and squared up.
The below Table explains the MTM calculation for a member. The settlement price for the
contract for today is assumed to be 105.
The CMs who have a loss are required to pay the mark-to-market (MTM) loss amount in cash
which is in turn passed on to the CMs who have made a MTM profit. This is known as daily mark-to-
market settlement. CMs are responsible to collect and settle the daily MTM profits/losses incurred by
the TMs and their clients clearing and settling through them. Similarly, TMs are responsible to
collect/pay losses/profits from/to their clients by the next day. The pay-in and pay-out of the mark-to-
market settlement are effected on the day following the trade day. In case a futures contract is not
traded on a day, or not traded during the last half hour, a 'theoretical settlement price' is computed as
per the following formula:
where: F = Theoretical futures price S = Value of the underlying index r = Cost of financing (using continuously compounded interest rate) or rate of interest (MIBOR)
T = Time till expiration e = 2.71828
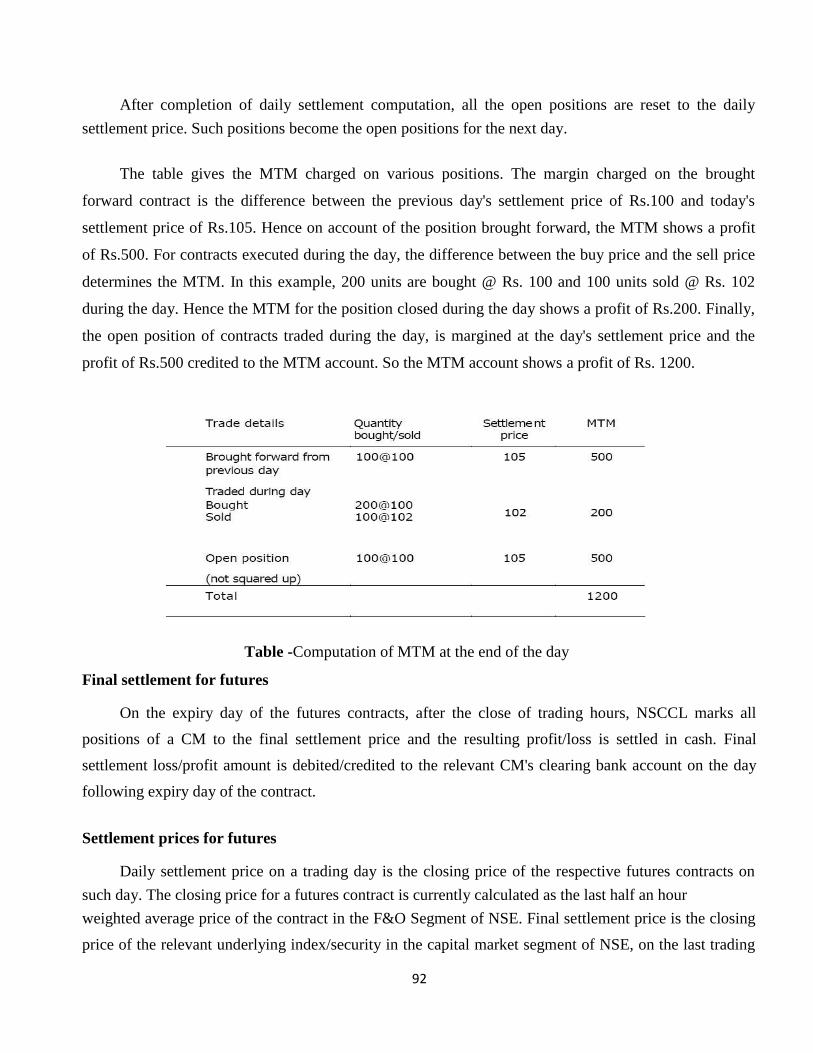
92
After completion of daily settlement computation, all the open positions are reset to the daily
settlement price. Such positions become the open positions for the next day.
The table gives the MTM charged on various positions. The margin charged on the brought
forward contract is the difference between the previous day's settlement price of Rs.100 and today's
settlement price of Rs.105. Hence on account of the position brought forward, the MTM shows a profit
of Rs.500. For contracts executed during the day, the difference between the buy price and the sell price
determines the MTM. In this example, 200 units are bought @ Rs. 100 and 100 units sold @ Rs. 102
during the day. Hence the MTM for the position closed during the day shows a profit of Rs.200. Finally,
the open position of contracts traded during the day, is margined at the day's settlement price and the
profit of Rs.500 credited to the MTM account. So the MTM account shows a profit of Rs. 1200.
Table -Computation of MTM at the end of the day Final settlement for futures
On the expiry day of the futures contracts, after the close of trading hours, NSCCL marks all
positions of a CM to the final settlement price and the resulting profit/loss is settled in cash. Final
settlement loss/profit amount is debited/credited to the relevant CM's clearing bank account on the day
following expiry day of the contract.
Settlement prices for futures
Daily settlement price on a trading day is the closing price of the respective futures contracts on
such day. The closing price for a futures contract is currently calculated as the last half an hour
weighted average price of the contract in the F&O Segment of NSE. Final settlement price is the closing
price of the relevant underlying index/security in the capital market segment of NSE, on the last trading
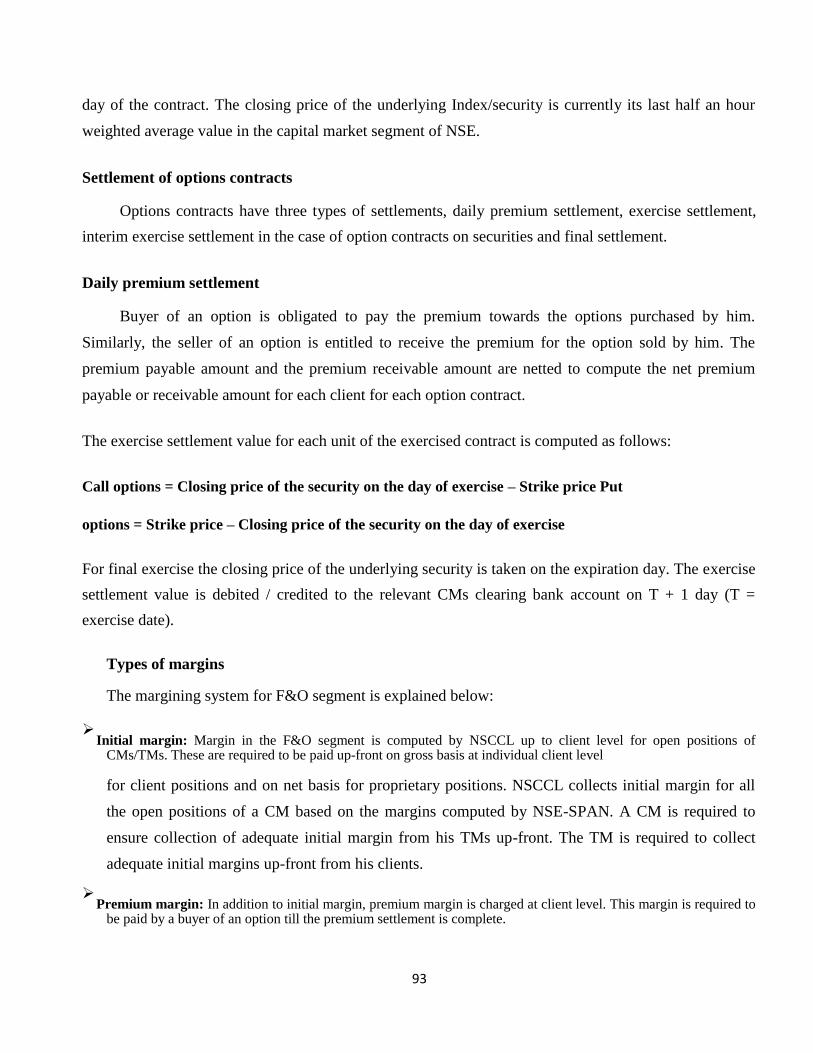
93
day of the contract. The closing price of the underlying Index/security is currently its last half an hour
weighted average value in the capital market segment of NSE.
Settlement of options contracts
Options contracts have three types of settlements, daily premium settlement, exercise settlement,
interim exercise settlement in the case of option contracts on securities and final settlement.
Daily premium settlement
Buyer of an option is obligated to pay the premium towards the options purchased by him.
Similarly, the seller of an option is entitled to receive the premium for the option sold by him. The
premium payable amount and the premium receivable amount are netted to compute the net premium
payable or receivable amount for each client for each option contract.
The exercise settlement value for each unit of the exercised contract is computed as follows: Call options = Closing price of the security on the day of exercise – Strike price Put
options = Strike price – Closing price of the security on the day of exercise
For final exercise the closing price of the underlying security is taken on the expiration day. The exercise
settlement value is debited / credited to the relevant CMs clearing bank account on T + 1 day (T =
exercise date).
Types of margins
The margining system for F&O segment is explained below: Initial margin: Margin in the F&O segment is computed by NSCCL up to client level for open positions of
CMs/TMs. These are required to be paid up-front on gross basis at individual client level
for client positions and on net basis for proprietary positions. NSCCL collects initial margin for all
the open positions of a CM based on the margins computed by NSE-SPAN. A CM is required to
ensure collection of adequate initial margin from his TMs up-front. The TM is required to collect
adequate initial margins up-front from his clients.
Premium margin: In addition to initial margin, premium margin is charged at client level. This margin is required to be paid by a buyer of an option till the premium settlement is complete.

94
Assignment margin for options on securities: Assignment margin is levied in addition to initial margin and premium margin. It is required to be paid on assigned positions of CMs towards interim
and final exercise settlement obligations for option contracts on individual securities, till such
obligations are fulfilled. The margin is charged on the net exercise settlement value payable by a CM
towards interim and final exercise settlement.
Client margins: NSCCL intimates all members of the margin liability of each of their client. Additionally members are also required to report details of margins collected from clients to NSCCL,
which holds in trust client margin monies to the extent reported by the member as having been
collected from their respective clients.
MARGINING SYSTEM
Derivatives enable traders to take on leveraged positions. This can be very risky because a
small movement in prices of underlying could result in either big gains or big losses. Hence the
margining system for a derivative becomes an important aspect of market functioning and determines
the integrity of this market. In this chapter we look at some margining concepts and the methodology
used for computing margins.
NSCCL has developed a comprehensive risk containment mechanism for the Futures &
Options segment. The most critical component of a risk containment mechanism is the online
position monitoring and margining system. The actual margining and position monitoring is done on-
line, on an intra-day basis using PRISM (Parallel Risk Management System) which is the real-time
position monitoring and risk management system. The risk of each trading and clearing member is
monitored on a real-time basis and alerts/disablement messages are generated if the member crosses
the set limits. NSCCL uses the SPAN (Standard Portfolio Analysis of Risk) system; a portfolio based
margining system, for the purpose of calculating initial margins.
SPAN approach of computing initial margins
The objective of SPAN is to identify overall risk in a portfolio of futures and options contracts
for each member. The system treats futures and options contracts uniformly, while at the same time
recognizing the unique exposures associated with options portfolios like extremely deep out-of-the-
money short positions, inter- month risk and inter-commodity risk.

95
14. STUDY ON CURRENCY DERIVATIVES
Introduction
Derivatives are financial contracts whose value is determined from one or more underlying
variables, which can be a stock, a bond, an index, an interest rate, an exchange rate etc. The most
commonly used derivative contracts are forwards and futures contracts and options.
There are other types of derivative contracts such as swaps, swaptions, etc. Currency
derivatives can be described as contracts between the sellers and buyers whose values are derived
from the underlying which in this case is the Exchange Rate. Currency derivatives are mostly
designed for hedging purposes, although they are also used as instruments for speculation.
Currency markets provide various choices to market participants through the spot market or
derivatives market. Before explaining the meaning and various types of derivatives contracts, let us
present three different choices of a market participant. The market participant may enter into a spot transaction and exchange the currency at current time.
The market participant wants to exchange the currency at a future date. Here the market participant may either:
a. Enter into a futures/forward contract, whereby he agrees to exchange the currency in the future at a
price decided now, or, b. Buy a currency option contract, wherein he commits for a future exchange of currency, with an
agreement that the contract will be valid only if the price is favourable to the participant. (In this
workbook we will be only dealing in Currency Futures).
Forward Contracts
Forward contracts are agreements to exchange currencies at an agreed rate on a specified future
date. The actual settlement date is more than two working days after the deal date. The agreed rate is
called forward rate and the difference between the spot rate and the forward rate is called as forward
margin. Forward contracts are bilateral contracts (privately negotiated), traded outside a regulated
stock exchange and suffer from counter -party risks and liquidity risks. Counter Party risk means that
one party in the contract may default on fulfilling its obligations thereby causing loss to the other
party.
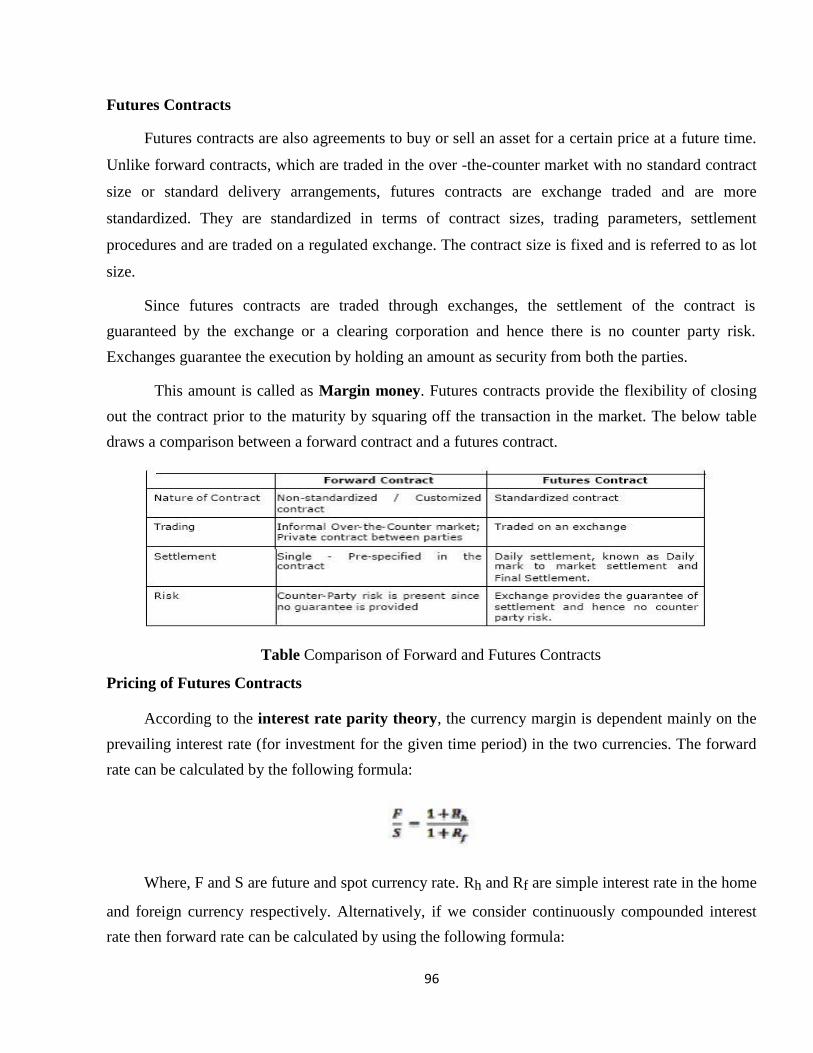
96
Futures Contracts
Futures contracts are also agreements to buy or sell an asset for a certain price at a future time.
Unlike forward contracts, which are traded in the over -the-counter market with no standard contract
size or standard delivery arrangements, futures contracts are exchange traded and are more
standardized. They are standardized in terms of contract sizes, trading parameters, settlement
procedures and are traded on a regulated exchange. The contract size is fixed and is referred to as lot
size.
Since futures contracts are traded through exchanges, the settlement of the contract is
guaranteed by the exchange or a clearing corporation and hence there is no counter party risk.
Exchanges guarantee the execution by holding an amount as security from both the parties.
This amount is called as Margin money. Futures contracts provide the flexibility of closing
out the contract prior to the maturity by squaring off the transaction in the market. The below table
draws a comparison between a forward contract and a futures contract.
Table Comparison of Forward and Futures Contracts Pricing of Futures Contracts
According to the interest rate parity theory, the currency margin is dependent mainly on the
prevailing interest rate (for investment for the given time period) in the two currencies. The forward
rate can be calculated by the following formula:
Where, F and S are future and spot currency rate. Rh and Rf are simple interest rate in the home
and foreign currency respectively. Alternatively, if we consider continuously compounded interest
rate then forward rate can be calculated by using the following formula:

97
Where rh and rf are the continuously compounded interest rate for the home currency and
foreign currency respectively, T is the time to maturity and e = 2.71828 (exponential). If the
following relationship between the futures rate and the spot rate does not hold, then there will be an
arbitrage opportunity in the market. This will force the futures rate to change so that the relationship
holds true.
Strategies using Currency Futures
Futures contracts act as hedging tools and help in protecting the risks associated with
uncertainties in exchange rates. Anyone who is anticipating a future cash outflow (payment of
money) in a foreign currency can lock-in the exchange rate for the future date by entering into a
futures contract. For example, let us take the example of an oil-importing firm - ABC Co. The
company is expected to make future payments of USD 100000 after 3 months in USD for payment
against oil imports. Suppose the current 3-month futures rate is Rs. 45, then ABC Co. has two
alternatives:
OPTION A:
ABC Co. does nothing and decides to pay the money by converting the INR to USD. If the spot
rate after three months is Rs. 47, the ABC Co. will have to pay INR 47,00,000 to buy USD 100000.
Alternatively, if the spot price is Rs. 43.0000, ABC Co. will have to pay only INR 43,00,000 to buy
USD 100000. The point is that ABC Co. is not sure of its future liability and is subject to risk of
exchange rate fluctuations.
OPTION B:
ABC Co. can alternatively enter into a futures contract to buy 1,00,000 USD at Rs. 45 and lock
in the future cash outflow in terms of INR. In this case, whatever may be the prevailing spot market
price after three months the company’s liability is locked in at INR 45,00,000. In other words, the
company is protected against adverse movement in the exchange rates.
This is known as hedging and currency futures contracts are generally used by hedgers to
reduce any known risks relating to the exchange rate.

98
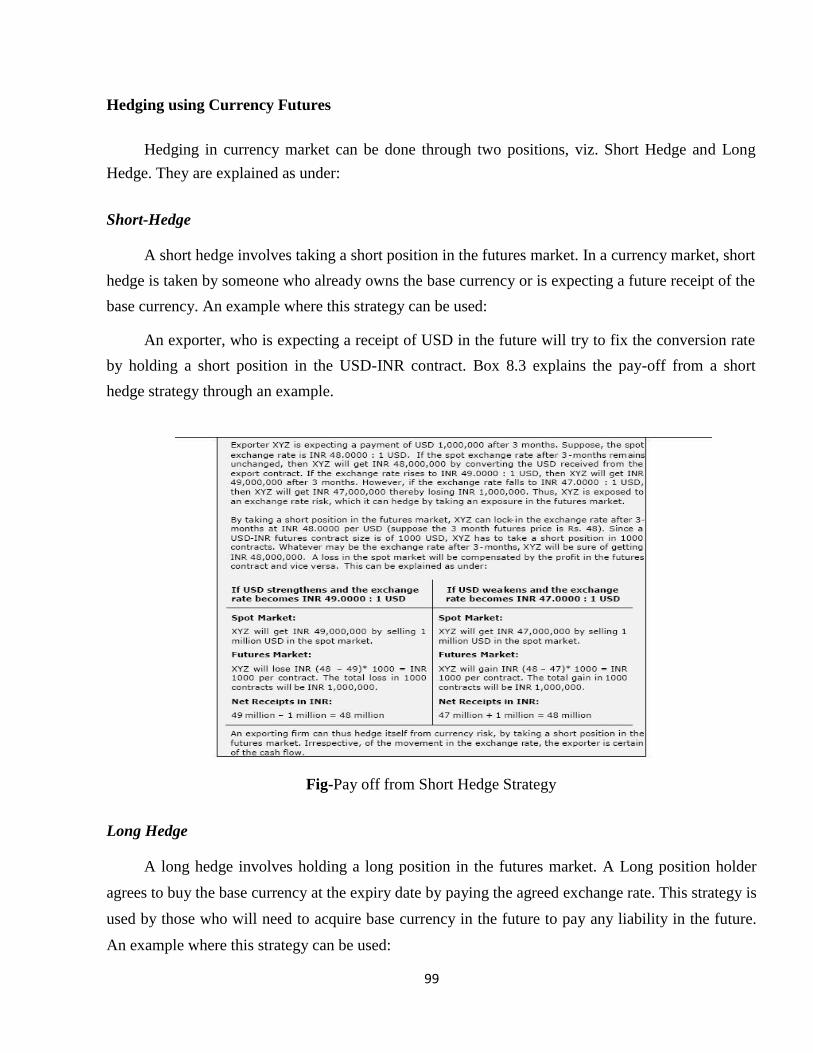
99
Hedging using Currency Futures
Hedging in currency market can be done through two positions, viz. Short Hedge and Long
Hedge. They are explained as under:
Short-Hedge
A short hedge involves taking a short position in the futures market. In a currency market, short
hedge is taken by someone who already owns the base currency or is expecting a future receipt of the
base currency. An example where this strategy can be used:
An exporter, who is expecting a receipt of USD in the future will try to fix the conversion rate
by holding a short position in the USD-INR contract. Box 8.3 explains the pay-off from a short
hedge strategy through an example.
Fig-Pay off from Short Hedge Strategy Long Hedge
A long hedge involves holding a long position in the futures market. A Long position holder
agrees to buy the base currency at the expiry date by paying the agreed exchange rate. This strategy is
used by those who will need to acquire base currency in the future to pay any liability in the future.
An example where this strategy can be used:
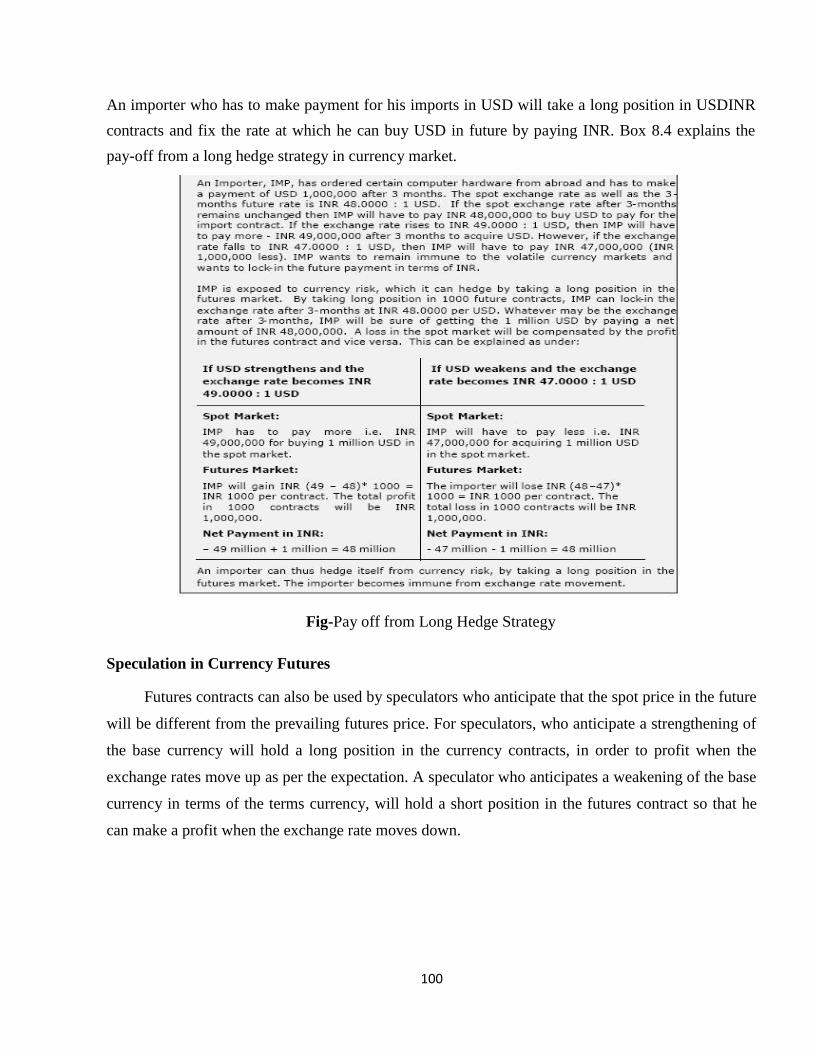
100
An importer who has to make payment for his imports in USD will take a long position in USDINR
contracts and fix the rate at which he can buy USD in future by paying INR. Box 8.4 explains the
pay-off from a long hedge strategy in currency market.
Fig-Pay off from Long Hedge Strategy
Speculation in Currency Futures
Futures contracts can also be used by speculators who anticipate that the spot price in the future
will be different from the prevailing futures price. For speculators, who anticipate a strengthening of
the base currency will hold a long position in the currency contracts, in order to profit when the
exchange rates move up as per the expectation. A speculator who anticipates a weakening of the base
currency in terms of the terms currency, will hold a short position in the futures contract so that he
can make a profit when the exchange rate moves down.

101
Fig-Speculation in Futures Market
Speculators prefer taking positions in the futures market to the spot market because of the low
investment required in case of futures market. In futures market, the parties are required to pay just the
margin money upfront, but in case of spot market, the parties have to invest the full amount, as they have
to purchase the foreign currency. Box 4.3 explains a speculators strategy through an example.
NSE’s Currency Derivatives Segment
The phenomenal growth of financial derivatives across the world is attributed to the fulfillment of
needs of hedgers, speculators and arbitrageurs by these products. In this chapter we look at contract
specifications, participants, the payoff of these contracts, and finally at how these contracts can be used
by various entities at the NSE.
Product Specification
The Reserve Bank of India has currently permitted futures only on the USD-INR rates. The
contract specifications of the futures are as under:
Underlying:
Initially, a currency futures contract on US Dollar – Indian Rupee (USD-INR) has been permitted.
102
Trading Hours:
The trading on currency futures is available from 9 a.m. to 5 p.m. from Monday to Friday.
Size of the contract:
The minimum contract size of the currency futures contract at the time of introduction is USD 1000.
Quotation:
The currency futures contracts are quoted in Rupee terms. However, the outstanding positions are
in US Dollar terms.
Tenor of the contract:
The currency futures contracts have a maximum maturity of 12 months.
Available contracts:
All monthly maturities from 1 to 12 months are available.
Settlement mechanism:
The currency futures contracts are settled in cash in Indian Rupee.
Settlement price:
The settlement price is the Reserve Bank of India Reference Rate on the last trading day. Final settlement day:
Final settlement day is the last working day (subject to holiday calendars) of the month. The last
working day is taken to be the same as that for Inter-bank Settlements in Mumbai. The rules for Inter-
bank Settlements, including those for ‘known holidays’ and ‘subsequently declared holiday’ are those
laid down by FEDAI (Foreign Exchange Dealers Association of India).
In keeping with the modalities of the OTC markets, the value date / final settlement date for the each
contract is the last working day of each month and the reference rate fixed by RBI two days prior to the
final settlement date is used for final settlement. The last trading day of the contract is therefore 2 days
prior to the final settlement date.
On the last trading day, since the settlement price gets fixed around 12:00 noon, the near month
contract ceases trading at that time (exceptions: sun outage days, etc.) and the new far month contract is
introduced. Contract specification is given below in a tabular form.

103
Exporters may wish to sell Rupee (importers may wish to buy Rupee) at a future date to eliminate
the risk of change in the price of Rupee. This is an example of currency derivative transaction. Here the
underlying asset is Rupee, which derives its value from spot price of Rupee. Currency forwards,
currency futures and currency options are most widely used currency derivative products.
Currency Derivatives Segment
The phenomenal growth of financial derivatives across the world is attributed to the fulfillment of
needs of hedgers, speculators and arbitrageurs by these products. In this chapter we look at contract
specifications, participants, the payoff of these contracts, and finally at how these contracts can be used
by various entities in the economy.
The contract specification in a tabular form is as under:
Participants and Functions
The participants in this segment shall prima -facie include all the entities that directly or
indirectly have exposure to the foreign exchange movements. Any importer or exporter of goods and
services has exposure to foreign currency risk. These entities shall find this product useful for
hedging their risks. The entities shall include corporates importing machinery / raw materials or
paying for services to an offshore entity, and corporates exporting their products and services abroad.
Therefore all entities having trade or capital related flows denominated in foreign currency will have
an interest in using this product.
The share holders and creditors of these companies also may be indirectly exposed to the
currency risk and hence may find the product useful. Any entity using such goods and services
whose price is exposed to foreign exchange movements may also find this useful.
Uses of Currency Futures
Hedgers

104
Hedging is an excellent tool to offset the risks associated with fluctuations in the price of the
currency in foreign exchange markets.
Hedging is the process of seeking a cover or insurance against price risks for protecting future cash flows and profitability.
Hedger is the person who uses currency futures primarily for hedging the risks arising out of extreme volatility in foreign exchange rate.
Hedger is an important player in the derivatives markets.
Hedgers take position in currency futures markets only for protecting the position in cash market.
Hedgers hold large number of currency futures lots at a time and in such a way that the size is approximately equal to exposure in cash market.
Hedger holds the position in currency futures market for a longer period until the cash position is
ready for settlement.
Speculators
Speculators are those participants who trade in the markets essentially for making profit from the anticipated up/down movement in the price of the currency.
Speculators provide the necessary liquidity to the currency markets by offering ample demand and supply.
Speculators are the participants who support continuous flow of transactions in the market.
Speculators are risk takers (accept the risks) whereas hedgers are risk-averse (avoid the risks).
Speculators do not hold any offsetting (counter) position in the cash market.
Speculator is an active buyer whenever it seems that the price of currency is lower than what it should be. Conversely, speculator would change his role from active buyer to active seller when the
price of currency seems to be higher than anticipated price.
Speculators tend to trade in smaller number of currency future contracts as compared to hedgers.
Trading timeframe of speculators is very short - ranging from intra day to few weeks
Large participation from speculators is desirable in the currency futures markets in order to cater to the requirement of hedgers.
Currency futures or any derivative market is a highly leveraged market where you trade with very small amount of margin. This is the most important factor for attracting speculators to the currency
markets.

105
Arbitragers
Arbitrage is the process of simultaneous buying and selling of same financial instrument in different markets in order to make immediate profits without any risk.
Arbitragers make profit by spotting price discrepancy between the rates of same financial asset in different markets.
Arbitragers know beforehand the minimum profit potential at the time of entering the markets.
Arbitragers continuously watch the market screens to look out for the opportunities in price inconsistencies.
Gross profits are very small and net profits after deducting the expenses and taxes become much smaller. Nevertheless, the profits are low-risk and hence arbitragers trade in large quantity.

106
15. FOREX TRADING -BASICS
The global foreign exchange market is the biggest market in the world with 3.2 trillion USD
daily turnover dwarfs the combined turnover of the entire world's stock and bond markets.
There are many reasons for the popularity of foreign exchange trading, but among the most
important are the leverage available, the high liquidity 24 hours a day and the very low dealing costs
associated with trading.Of course many commercial organisations participate purely due to the
currency exposures created by their import and export activities, but the main part of the turnover is
accounted for by financial institutions. Investing in foreign exchange remains predominantly the
domain of the big professional players in the market - funds, banks and brokers. Nevertheless, any
investor with the necessary knowledge of the market's functions can benefit from the advantages
stated above.
Margin Trading
Foreign exchange is normally traded on margin. A relatively small deposit can control much
larger positions in the market. For trading the main currencies, Saxo Bank requires a 1% margin
deposit. This means that in order to trade one million dollars, you need to place just USD 10,000 by
way of security.
In other words, you will have obtained a gearing of up to 100 times. This means that a change
of, say 2%, in the underlying value of your trade will result in a 200% profit or loss on your deposit.
See below for specific examples. As you can see, this calls for a much disciplined approach to
trading as both profit opportunities and potential risks are very large indeed. Base Currency and Variable Currency
When you trade, you will always trade a combination of two currencies. For example, you will
buy US dollars and sell euro. Or buy euro and sell Japanese yen, or any other combination of dozens
of widely traded currencies. But there is always a long (bought) and a short (sold) side to a trade,
which means that you are speculating on the prospect of one of the currencies strengthening in
relation to the other.
The trade currency is normally, but not always, the currency with the highest value. When
trading US dollars against Singapore dollars, the normal way to trade is buying or selling a fixed

107
amount of US dollars, i.e. USD 1,000,000. When closing the position, the opposite trade is done,
again USD 1,000,000. The profit or loss will be apparent in the change of the amount of SGD
credited and debited for the two transactions. In other words, your profit or loss will be denominated
in SGD, which is known as the price currency. As part of our service, Saxo Bank will automatically
exchange your profits and losses into your base currency if you require this.
Dealing Spread, but No Commissions
When trading foreign exchange, you are quoted a dealing spread offering you a buying and a
selling level for your trade. Once you accept the offered price and receive confirmation from our
dealers, the trade is done. There is no need to call an exchange floor. There are no other time-
consuming delays. This is possible due to live streaming prices, which are also a great advantage in
times of fast-moving markets: You can see where the market is trading and you know whether your
orders are filled or not.
The dealing spread is typically 3-5 points in normal market conditions. This means that you
can sell US dollars against the euro at 1.7780 and buy at 1.7785. There are no further costs,
commissions or exchange fees.
This ensures that you can get in and out of your trades at very low slippage and many traders
are therefore active intra-day traders, given that a typical day in USDEUR presents price swings of
150-200 points. Spot and forward trading
When you trade foreign exchange you are normally quoted a spot price. This means that if you
take no further steps, your trade will be settled after two business days. This ensures that your trades
are undertaken subject to supervision by regulatory authorities for your own protection and security.
If you are a commercial customer, you may need to convert the currencies for international
payments.
If you are an investor, you will normally want to swap your trade forward to a later date. This
can be undertaken on a daily basis or for a longer period at a time. Often investors will swap their
trades forward anywhere from a week or two up to several months depending on the time frame of
the investment. Although a forward trade is for a future date, the position can be closed out at any
time - the closing part of the position is then swapped forward to the same future value date.

108
Interest Rate Differentials
Different currencies pay different interest rates. This is one of the main driving forces behind
foreign exchange trends. It is inherently attractive to be a buyer of a currency that pays a high interest
rate while being short a currency that has a low interest rate.
Although such interest rate differentials may not appear very large, they are of great
significance in a highly leveraged position. For example, the interest rate differential between the US
dollar and the Japanese yen has been approximately 5% for several years. In a position that can be
supported by a 5% margin deposit, this results in a 100% profit on capital per annum when you buy
the US dollar. Of course, an even more important factor normally is the relative value of the
currencies, which changed 15% from low to high during 2005 – disregarding the interest rate
differential. From a pure interest rate differential viewpoint, you have an advantage of 100% per
annum in your favour by being long US dollar and an initial disadvantage of the same size by being
short.
Such a situation clearly benefits the high interest rate currency and as result, the US dollar was
in a strong bull market all through 2005. But it is by no means a certainty that the currency with the
higher interest rate will be strongest. If the reason for the high interest rate is runaway inflation, this
may undermine confidence in the currency even more than the benefits perceived from the high
interest rate. Stop-loss discipline
As you can see from the description above, there are significant opportunities and risks in
foreign exchange markets. Aggressive traders might experience profit/loss swings of 20-30% daily.
This calls for strict stop-loss policies in positions that are moving against you.
Fortunately, there are no daily limits on foreign exchange trading and no restrictions on trading
hours other than the weekend. This means that there will nearly always be an opportunity to react to
moves in the main currency markets and a low risk of getting caught without the opportunity of
getting out. Of course, the market can move very fast and a stop-loss order is by no means a
guarantee of getting out at the desired level. But the main risk is really an event over the weekend, where all markets are closed. This happens
from time to time as many important political events, such as G7 meetings, are normally scheduled
for weekends.

109
For speculative trading, we always recommend the placement of protective stop-loss orders. With Saxo
Bank Internet Trading you can easily place and change such orders while watching market development
graphically on your computer screen.
Foreign Exchange
Foreign exchange trading is the simultaneous buying of one currency and selling of another. The
foreign exchange market (Forex or FX) is the largest financial market in the world with a daily turnover
of over $2.6 trillion. Examples of currency trading pairs are Euro/US Dollar (EUR/USD) and US
Dollar/Japanese Yen (USD/JPY). Most currency transactions involve the "Majors" - US Dollar, Euro,
Japanese Yen, British Pound, Swiss Franc, Canadian Dollar and Australian Dollar.
Unlike most financial markets, the foreign exchange market has no physical location and no
central exchange. The Forex market operates 24 hours a day through an electronic network of banks,
corporations and individual traders. Forex trading begins every day in Sydney, and then moves to Tokyo,
followed by London and then New York. The major market makers, or dealers, consist of the
commercial and investment banks; the exchange traded futures, and registered futures commission
merchants (FCMs).
Foreign Exchange Prices
Foreign exchange markets and prices are mainly influenced by international trade flows and
investment flows. The FX markets are also influenced, but to a lesser extent, by the same factors that
influence the equity and bond markets: economic and political conditions especially interest rates,
inflation, and political instability. Those factors usually have only a short-term impact, which makes
Forex attractive as it offers some of the diversification necessary to protect against adverse movements
in the equity and bond markets.
Foreign Exchange prices, or quotes, include a "Bid" and "Ask" similar to other financial
products:
Bid: Price at which Dealer is willing to Buy and Traders can Sell Currency
Ask: Price at which Dealer will sell and Traders can Buy Currency
The difference between the Bid and Ask is called the "Spread", which is the Trader's cost of the
transaction. Currencies are usually quoted to four decimal places, such as the Euro/US Dollar trading
at 1.2400/1.2403, with the last decimal place referred to as a point or "pip". A pip for most currencies

110
is 0.0001 of an exchange rate.
Types of quoting:
Direct quote:
When one USD is denominated in Indian currency equivalent it is called as direct
quote. E.g. 1 unit/USD= INR 39.35
Indirect quote:
When an Indian currency is used to represent the US dollar it is called as indirect
quote. E.g. INR 100= 2.5412 USD
Cross currency quote:
When a currency of some other country is converted to Indian currency first by converting them
into US dollar and then converting US dollars into Indian currency.
E.g. 10 Euros=? INR
1 Euro= 1.4530 USD
10 Euros=14.53 USD
1 USD= INR 39.35
Price of 10 Euro in Indian currency= 1 USD*10
Euros = 39.35*14.53
=571.7555 INR
Therefore the price of 10 Euro in Indian currency is 571.7555 INR.
Analysis of Foreign Exchange Markets
Foreign exchange traders generally fall into two groups and base their decisions on either
technical analysis or fundamental analysis. Technical traders use charts, trend lines, support and
resistance levels, mathematical models and other means to identify opportunities and drive trading
decisions. Fundamental traders identify trading opportunities by analyzing economic information,
such as interest rates, money supply and political/economical macroeconomic factors. Additionally,
some traders take short-term positions and trade frequently while others are long-term, buy and hold
traders.

111
16. PROBLEMS ON FOREGIN EXCHANGE
ARITHMETIC
1) Problem On Cross Rates a. An export customer requests the bank to quote him a rate for purchase of a Singapore
dollars 100,000 bill drawn on Singapore. Assuming US dollar quoted in the interbank market as under:
Spot USD 1 = Rs. 49.5500/5600
1 month forward 49.3500/3600
2 months forward 49.0500/0600
3 months forward 48.7600/7700
And Singapore dollars are quoted in Singapore market as under:
Spot USD 1 =SGD 1.8220/8340
1 month forward 0.0040/0.0045
2 months forward 0.0060/0.0065
3 months forward 0.0080/0.0085 What will be the rate quoted to the customer? Also calculate the rupee amount payable to
him and the interest to be recovered. Notes: (1) Transit period is 25 days.
(2) Exchange margin to be included in the rate is 0.10%.
(3) Interest to be recovered at 10%.
Solution: The bank has to quote bill buying rate to the customer. Dollar is at discount against rupee. Since this is a buying rate, the transit period will be
rounded off to the higher month and one month forward dollar/rupee buying rate will be
taken. Dollar/Rupee one month forward buying rate LESS: Exchange margin at 0.10% on Rs. 49.3500
Bill buying rate for dollar

112
US dollar is at premium against Singapore dollar. Since this is a selling rate, the transit
period will be rounded off to the higher month and one month forward US dollar/Singapore dollar selling rate will be taken.
US dollar/Singapore dollar spot selling rate = SGD 1.8340
ADD: Premium for one month = SGD 0.0045
------------------
= SGD 1.8385
Bill buying rate for Singapore dollar (49.30065 / 1.8385) = Rs: 26.8157 Rounded off to the nearest multiple of 0.0025, the rate quoted to the customer would be
Rs 26.8150 per Singapore dollar. Amount payable to customer on purchase of bill for GSD 100,000 at Rs.26, 8150 a dollar
is Rs. 26, 81,500. Interest to be recovered at 10% for 25 days on Rs 26, 81,500 is Rs.18,
366.
2) Problem on Forward contract A. Your importer-customer has requested you to book a forward exchange contract for
Swedish kroner 35,000 for fixed delivery 6th month.
Assuming Swedish Kroners are quoted in Singapore foreign exchange market against US
dollars as under:
Spot USD 1 = SEK 6.0700/0750
3 months forward 950/1050
6 months forward 2300/2500
And the US dollars are quoted in the local market exchange as under:
Spot USD 1 = Rs. 48.7000/8500
3 months forward 1.8000/1.6000
6 months forward 3.7000/3.5000
What rate will you quote to your customer bearing in mind that your exchange margin is 0.15% for TT selling and 0.2% for bills selling?
Solution:
Dollar/Rupee spot selling rate = Rs. 48.8500

113
LESS: Discount for 6 months - Rs. 3.5000
------------------
= Rs. 45.3500
ADD: Exchange margin at 0.15% for TT selling on Rs.45.3500 + Re. 0.0680
= Rs. 45.4180
ADD: Exchange margin at 0.20% for bill selling on Rs.45.4180 + Re 0.0908
Forward bill selling rate for dollar = Rs. 45.5088
Dollar/Kroner spot buying rate = SEK 6.0700
ADD: Premium for 6 months + SEK 0.2300
= SEK 6.3000 Forward bills selling rate for kroner (45.5008/6.3000) = Rs.
7.2236. Rounded off, the rate quoted is Rs. 7.2225 per Kroner.
3) Problems on Foreign Exchange Arithmetic – Ready Exchange Rate B. The market quotation for a currency consists of the spot rate and the forward margin.
The outright forward rate has to be calculated by loading the forward margin into spot
rate. US dollar is quoted as under in the interbank market on 25th
January such as:
Spot USD 1 = Rs 42.4000/4200
Spot/February 2000/2100
Spot/March 3500/3600
Solution: The forward margin is in increasing order, forward dollar is at premium.
Buying rate selling rate
February March February March
Spot rate 42.4000 42.4000 42.4200 42.4200
ADD: Premium 0.2000 0.3500 0.2100 0.3600
Forward rates 42.6000 42.7500 42.6300 42.7800
From the above calculation we arrive at the following outright rates:
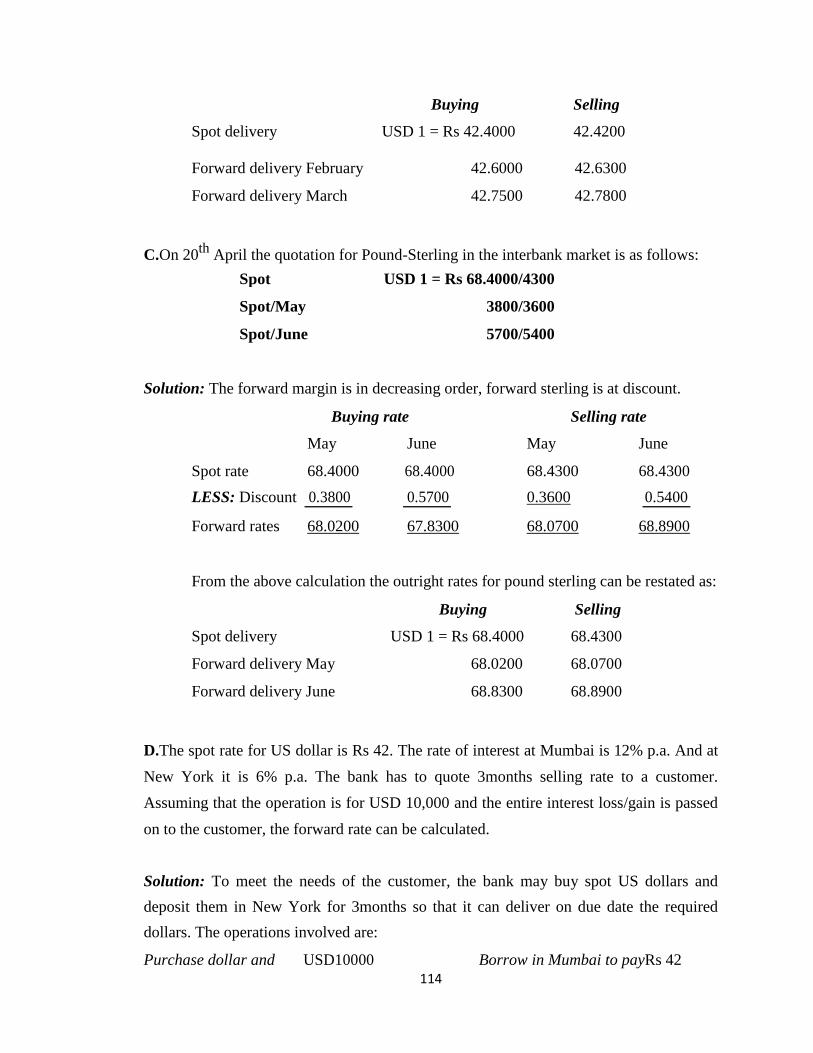
114
Buying Selling
Spot delivery USD 1 = Rs 42.4000 42.4200
Forward delivery February 42.6000 42.6300
Forward delivery March 42.7500 42.7800
C.On 20th
April the quotation for Pound-Sterling in the interbank market is as follows:
Spot USD 1 = Rs 68.4000/4300
Spot/May 3800/3600
Spot/June 5700/5400
Solution: The forward margin is in decreasing order, forward sterling is at discount.
Buying rate Selling rate
May June May June
Spot rate 68.4000 68.4000 68.4300 68.4300
LESS: Discount 0.3800 0.5700 0.3600 0.5400
Forward rates 68.0200 67.8300 68.0700 68.8900
From the above calculation the outright rates for pound sterling can be restated as:
Buying Selling
Spot delivery USD 1 = Rs 68.4000 68.4300
Forward delivery May 68.0200 68.0700
Forward delivery June 68.8300 68.8900 D.The spot rate for US dollar is Rs 42. The rate of interest at Mumbai is 12% p.a. And at
New York it is 6% p.a. The bank has to quote 3months selling rate to a customer.
Assuming that the operation is for USD 10,000 and the entire interest loss/gain is passed
on to the customer, the forward rate can be calculated.
Solution: To meet the needs of the customer, the bank may buy spot US dollars and
deposit them in New York for 3months so that it can deliver on due date the required
dollars. The operations involved are: Purchase dollar and USD10000 Borrow in Mumbai to payRs 42

115
invest for 3months for dollar at Rs 42 × 10,000 Rs 4,20,000
3months at 6% p.a USD 150 Interest payable for 3months Rs 12,600
_______ 3months at 12% __________
Receive after 3months 10,150__ Pay after 3months Rs4,32,600_
The bank should be able to get Rs 4,32,000 against USD 10,150. Therefore, the rate quoted is:
(432000/10150) = Rs 42.62
Thus the forward premium is Rs 0.62. This can be calculated approximately by the following formula:
Forward Margin =
= 42 × 3 × 6
100 × 12
= Rs 0.63
E.On 15th
September you receive a mail transfer from your New York correspondent for
USD 5,000 payable to your customer. Your account with the corresponding bank has
been credited with the amount of the mail transfer in reimbursement. Assuming US
dollars/rupees are quoted in the local interbank market as under:
Spot USD 1 = Rs 43.2500/2700
Spot/October 2200/2300
Calculate the exchange rate and the Rupee amount payable to the customer
bearing in mind that (a) You require an exchange margin of 0.080% to be
loaded in the rate, and (b) Rupee equivalent should be nearest to the whole
rupee.
Solutions: The rate applicable is the TT buying rate. The rate quoted to the customer will be based on the market buying rate is Rs 43.2500
Dollar/Rupee market spot buying rate = Rs 43.25000

116
LESS: Exchange margin at 0.08% on Rs 43.25000 = Rs 0.03460 =
Rs 43.21540 Rounded off the rate quoted to the customer would be Rs 43.2150 per dollar. Amount
payable to the customer for USD 5,000 at the rate of Rs 43.2150 per dollar is Rs 2,
16,075.
F.On 25th
July, your customer has presented to you at sight documents for USD 1,
00,000 under an irrevocable letter of credit. The letter of credit provides for
reimbursement by the negotiating bank’s own demand draft on the opening bank at New
York. Assuming US dollars/Rupee is quoted in the local interbank market as under:
Spot USD 1 = Rs 43.6525/6650
Spot/August 6000/5700
Spot/September 1.0000/0.9700
Spot/October 1.4000/3900
Transit period for bill is 20days. What rate will you quote to your customer
provided you required an exchange margin of 0.15%? Also calculate and show
the amount in rupee payable to the customer.
Solution: The bank has to quote bill buying rate. The transit period is 20days and dollar
is at discount. Therefore the transit period will be rounded off to one month and the rate
quoted will be based on one month forward buying rate for dollar in the interbank market.
Dollar/Rupee market spot buying rate = Rs 43.65250
LESS: Discount for one month = Rs 0.60000
Dollar/Rupee one month forward buying rate = Rs 43.05250
LESS: Exchange margin at 0.15% on Rs 43.0525 = Rs 0.06458
Bill Buying Rate = Rs 42.98792 The rate quoted to the customer would be Rs 42.98792 per dollar, rounding off to nearest
paise. The rupee amount payable to the customer on purchase of the bill for USD 1,
00,000 at Rs42.9875 per dollar is Rs 42, 98,750.
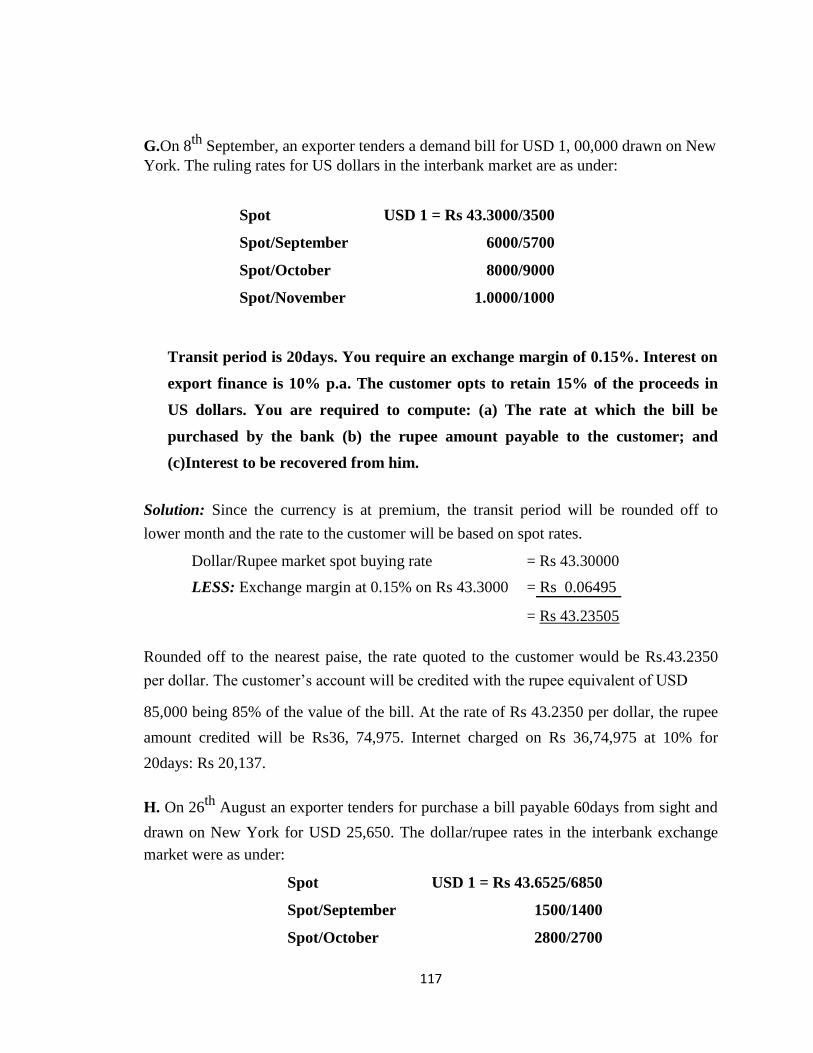
117
G.On 8th
September, an exporter tenders a demand bill for USD 1, 00,000 drawn on New
York. The ruling rates for US dollars in the interbank market are as under:
Spot USD 1 = Rs 43.3000/3500
Spot/September 6000/5700
Spot/October 8000/9000
Spot/November 1.0000/1000
Transit period is 20days. You require an exchange margin of 0.15%. Interest on
export finance is 10% p.a. The customer opts to retain 15% of the proceeds in
US dollars. You are required to compute: (a) The rate at which the bill be
purchased by the bank (b) the rupee amount payable to the customer; and
(c)Interest to be recovered from him.
Solution: Since the currency is at premium, the transit period will be rounded off to
lower month and the rate to the customer will be based on spot rates.
Dollar/Rupee market spot buying rate = Rs 43.30000
LESS: Exchange margin at 0.15% on Rs 43.3000 = Rs 0.06495
= Rs 43.23505
Rounded off to the nearest paise, the rate quoted to the customer would be Rs.43.2350
per dollar. The customer’s account will be credited with the rupee equivalent of USD 85,000 being 85% of the value of the bill. At the rate of Rs 43.2350 per dollar, the rupee
amount credited will be Rs36, 74,975. Internet charged on Rs 36,74,975 at 10% for
20days: Rs 20,137.
H. On 26th
August an exporter tenders for purchase a bill payable 60days from sight and
drawn on New York for USD 25,650. The dollar/rupee rates in the interbank exchange
market were as under:
Spot USD 1 = Rs 43.6525/6850
Spot/September 1500/1400
Spot/October 2800/2700

118
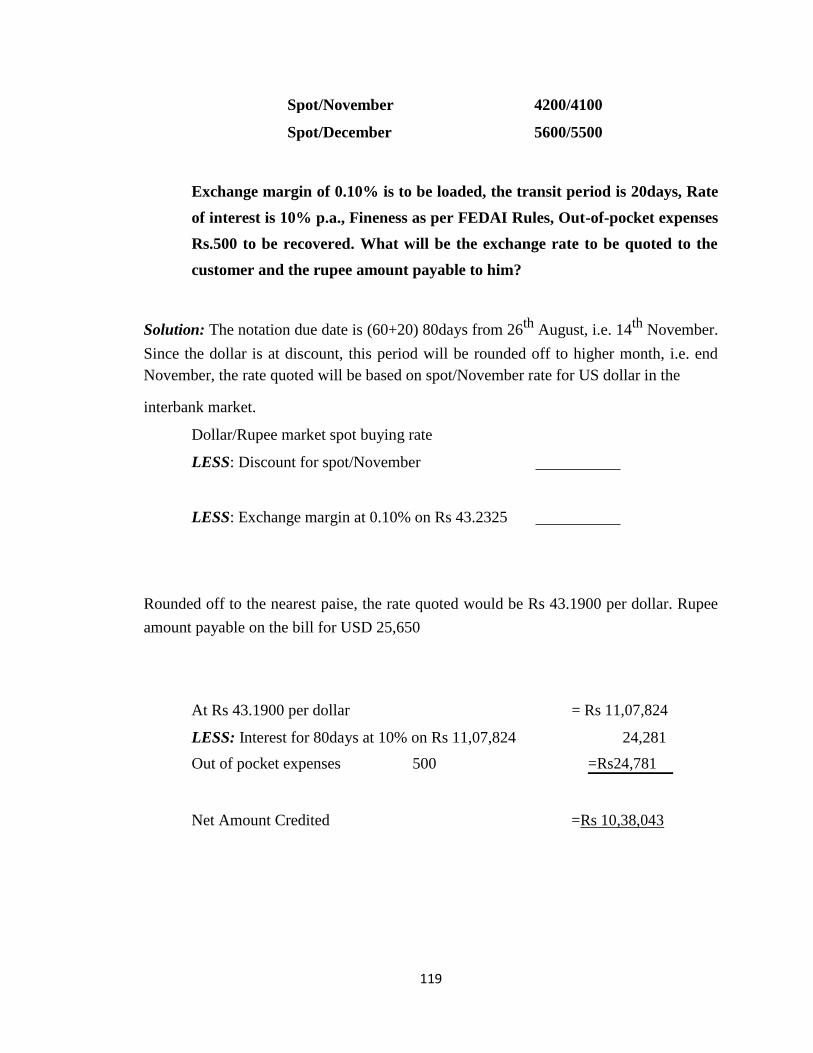
119
Spot/November 4200/4100
Spot/December 5600/5500
Exchange margin of 0.10% is to be loaded, the transit period is 20days, Rate
of interest is 10% p.a., Fineness as per FEDAI Rules, Out-of-pocket expenses
Rs.500 to be recovered. What will be the exchange rate to be quoted to the
customer and the rupee amount payable to him?
Solution: The notation due date is (60+20) 80days from 26th
August, i.e. 14th
November.
Since the dollar is at discount, this period will be rounded off to higher month, i.e. end
November, the rate quoted will be based on spot/November rate for US dollar in the interbank market.
Dollar/Rupee market spot buying rate
LESS: Discount for spot/November
LESS: Exchange margin at 0.10% on Rs 43.2325 Rounded off to the nearest paise, the rate quoted would be Rs 43.1900 per dollar. Rupee
amount payable on the bill for USD 25,650
At Rs 43.1900 per dollar = Rs 11,07,824
LESS: Interest for 80days at 10% on Rs 11,07,824 24,281
Out of pocket expenses 500 =Rs24,781
Net Amount Credited =Rs 10,38,043

120
I.Your customer requested you to issue a demand draft on New York for USD 25000.
Assuming the ongoing spot rates in the local market for US dollar is as under:
Spot USD 1 = Rs 43.3575/3825
One month forward Rs 43.7825/8250
You require an exchange margin of 0.15%. What rate will you quote to your
customer and what is the rupee amount payable by the customer?
Solution: The bank has to quote its TT selling rate based on the market selling rate.
Dollar/Rupee market spot selling rate = Rs 43.38250
ADD: Exchange margin at 0.15% on Rs 43.3825 = Rs 0.06507
= Rs 43.44757 Rounding off to the nearest paise, the rate quoted to the customer would be Rs 4,34,475
per dollar. The amount payable by the customer for USD 25,000 at Rs 43.4475 per dollar
is Rs10,86,188.

121
17. STUDY ON COMMODITY MARKETS
INTRODUCTION
Rapid economic growth in recent years with more than 6 per cent GDP growth rate has made
India one of the fastest growing economies of the world. With higher incomes giving significant
purchasing power to over a billion strong populations, demands for all kinds of goods and services is
set to grow rapidly.
With liberalisation measures in place, commodity markets in India are likely to make an
overwhelming impact on the global commodity markets. Indian Corporate entities are now in a
position to hedge their price risks in the domestic and international commodity exchanges. Online
trading at the three nationwide multi-commodity futures exchanges allows domestic hedging, while
some of the established commodity-specific, exchanges are gearing up to meet the needs of the
expanding market. There is no doubt that the commodities market in India is definitely in for a big
spent offering enormous opportunities of growth to investors, speculators, arbitragers and even big
corporations in manufacturing sector. MARKET
Markets have existed for centuries in India and abroad for selling and buying of goods and
services. The concept of market started with agricultural products and hence it is as old as the agro
products or the business of farming itself. Traditionally, the farmers used to bring their produce to a
central place (called Mandi\Bazar) in a town\village where grain merchants\traders would also come
and buy the produce and transport, distribute it to other markets.
In a traditional market, agriculture produce would be brought and kept in the market and the
potential buyers would come and see the quality of the produce and negotiate with the farmers
directly for a price that they would be willing to pay and the quantity that they would like to buy. The
deals were then struck once mutual agreement was reached on the price and the quantity to be bought
/ sold.
In the system of traditional markets, shortages of a commodity in a given season would lead
to increase in price for the commodity or oversupply on even a single day (due to heavy arrivals)
could result into decline in prices sometimes below the cost of production to the farmers. Neither the
122
farmers nor the food grain merchants were happy with this situation since they could predict what the
prices would be on a given: ay or in a given season. As a result many times me farmers were required
to return from the market with their produce since it did not fetch reasonable price and since there
were no storage facilities available near the market place. It was in this context that farmers and food
grain merchants in negotiating for future supplies of grains in exchange of cash at a agreeable price.
This type of agreement was acceptable to both parties since the farmer would know how much he
would be paid for his produce, and the dealer would know his cost of procurement in advance. This
effectively started the system of commodity market, forward contracts, which subsequently evolved
to futures market
COMMODITY
“A commodity is a product having commercial value, which can be produced, bought, sold
and consumed. Commodities are basically the products of primary sector of an economy. Primary
sector of an economy is that part of the economy, which is concerned with agriculture and extraction
of raw material.”
In order to qualify as a commodity, an article or a product has to meet some basic characteristics.
These are listed below: The product has not gone through any complicated manufacturing activity, though simple processing
(like mining, cropping, etc.) is not ruled out. In other words, the product must be in a basic, raw,
unprocessed state. (For instance wheat is a commodity; but wheat flour and bread are not
commodities). There are of course some exceptions to this rule e.g. in case of metals and products
like sugar.
Major consideration while buying a particular commodity is its price (since there is hardly any difference in quality from seller to seller)
The product has to be fairly standardized in the sense that there cannot such differentiation in a product based on its quality (e.g. Rice is rice though different varieties of rice can be treated as
different commodities and hence traded as separate contracts).
Prices of the product are determined by market forces, demand 'and supply and they undergo rapid changes / fluctuations (price must fluctuate enough to create uncertainty, which means both risk and
potential profit / loss for buyers and sellers)
Usually there would be many competing sellers of the product in the market.
COMMODITY MARKET

123
Market is a place where buyers and sellers meet to transact a business i.e. for exchange of
goods or services for a consideration, which is usually money. Markets are usually and traditionally
at a place or location, where buyers and sellers could meet. However, in modern world, buyers and
sellers on telephone lines or on Internet can transact the business. Hence, in today's world markets
need not Exist in physical form as long as the exchange of goods or services take place for a
consideration.
Commodity market is therefore logically a market where commodities or commodity derivatives are
bought or sold for a consideration. It is thus an important constituent of the financial system for any
country.
Existence of a vibrant, active and liquid commodity market is normally considered as a
healthy sign of development of any economy. Commodity markets quite often have their centers in
developed countries though the primary commodities in many cases are produced in developing
countries. Birth and growth of transparent commodity market is thus a sign of development of an
economy. This has particular significance in case of countries like India, which produce agri-products
as well as a number of other basic commodities, which are traded on commodity exchanges.
Commodity futures in particular help price discovery and assist investors in hedging their risks by
taking positions in commodities and exploiting arbitrage opportunities in the market.
CONSTITUENTS OF COMMODITY MARKET
The system includes following elements: 1. Buyers / Sellers / Users / Producers: Farmers, Farmer' Cooperatives, Metal (Precious & other)
producers / suppliers / stockiest, APMC Mandies, Traders, Brokers, Members of Commodity
Exchanges, State Civil Supply Corporations, Hedgers, Speculators and arbitragers (these could
include corporate houses, FMCG Companies, etc.) 2. Logistics Companies: Storage and Transport Companies/ Operator Quality Testing and Certifying
Companies, Valuers, etc. 3. Markets and Exchanges: Spot Markets (Mandies, Bazars, etc.) and Commodity Exchanges (National
Level and Regional level), 4. Support agencies: Depositories / De-materializing agencies, Central and State Warehousing
Corporation and Private sector warehousing companies. 5. Lending Agencies: Banks, Financial Institutions.
FUNCTIONING OF COMMODITY MARKET IN INDIA

124
There are three types of regulated markets in India:
Spot Markets: Direct purchases for immediate consumption.
Futures and Forward Markets: Agreements new to pay and received deliver later.
Forwards and Futures reduce the risks by allowing the trader to decide a price today for goods to be delivered in the future.
Derivatives Market is purely financial transactions based on physical trading.
The system includes following elements: Hedgers, Speculators, Investors, Arbitragers
Producers - Farmers
Consumers, refiners, food processing companies, jewelers, textile mills, exporters & importers.
The biggest benefits of commodity trading will accrue to commodity traders, farmers and
companies dealing in commodity-based products (like wheat and metals) by allowing them to hedge
their risks. Then there are speculators, who are in the game only to make money out of the volatility
in prices. But unlike in stocks, few retail investors are expected to trade in commodity futures since it
requires a fair bit of expertise. Even those who do will probably restrict themselves to trading in gold
or silver.
OVER THE COUNTER\SPOT MARKET
Direct purchases and sales are achieved in spot markets normally for immediate consumption.
Buyers and sellers meet ‘‘face-to-face" and deals are struck. This is akin to "over the counter (OTC)"
market where there is no need for organization like a commodity change. These are traditional
markets c1assic example of a spot market is a Mandi where food grains are sold in bulk. Farmers
would bring their produce to this market and food grain merchants/traders would purchase the
produce "on the spot" and settle the deal in Spot markets thus call for immediate delivery of
goods/services against actual payment.
BENEFITS OF TRADING IN COMMODITY: -
A future trading performs two important functions of price discovery and price risk
management with reference to the given commodity. It is therefore useful to all the segments of the
economy and particularly to all the constituents of the Commodity Market System.
Benefits to Consumer & user

125
It is useful for the consumer because he gets an idea of the price at which the commodity would be available at a future point of time. He can do proper costing and also cover his purchases by making
forward contracts. Predictable pricing & transparency is an added advantage.
Hedging their risks if they are using some of the commodities as their raw materials in particular can benefit corporate entities. They can hedge the risk even if the commodity traded does not meet their
requirements of exact quality / technical specifications.
Futures trading is very useful to the exporters as it provides an advance indication of the price likely to prevail and thereby help the exporter in quoting a realistic price and thereby secure export contract
in a competitive market
Benefits to Investors
High financial leverage is possible in commodity markets. In case of stocks, an investor needs to put up the full amount of the stock value to buy the stock. With commodities, you control commodity
futures contracts with a margin, which is usually between 5% to 10% of the value of the commodity.
Investor can effectively hedge the risk in price fluctuations of a commodity.
Investor can also hedge his risk on investments in stocks and debt markets since commodities provide a choice and provide one more alternative avenue in the investment port for. It may be
mentioned here that the Commodities are less volatile compared to equity market, though more
volatile as compared to G-Sec's
Commodity markets are extremely transparent in the sense that the manipulation of prices of a commodity is extremely difficult. Given the knowledge of the commodity, the investor can be thus
clear about what he can expect in foreseeable future.
Business involves just you and the market.
With the rapid spread of derivatives trading in commodities, this route too has become an option for high net worth and savvy investors to consider in their overall asset allocation.
The fact that the stock indices and commodity indices are not correlated implies that the commodity markets can be used as an effective diversification tool, where investors can park their money.
A look at the performance of the commodities markets during the last year shows that the positive movement was witnessed during most parts of the year.

126
LIMITATION OF COMMODITY MARKET: -
Commodity markets, like any other markets, have their own limitations too. Some of them are:
Commodity market prices can fluctuate wildly depending on the factors, which are sometimes beyond human control (floods, storms, natural calamities like earthquakes, etc. can create temporary
shortages of commodities and hence result in drastic changes in their prices in a very short time).
Forward / futures trading involve a passage of time between entering into a contract and its performance making thereby the contracts susceptible to risks, uncertainties, etc.

127

128

129

130

131

132

133

134

135

136

137

138

139

140

141

142

143

144

145