full paper ecological impact assessment of a
TRANSCRIPT

J. Gen. Appl. Microbiol., 65, 225–233 (2019)doi 10.2323/jgam.2018.10.003„2019 Applied Microbiology, Molecular and Cellular Biosciences Research Foundation
Full Paper
*Corresponding authors: Nobutada Kimura and Naohiro Noda, Bioproduction Research Institute, National Institute of Advanced Industrial Scienceand Technology (AIST), 1-1-1 Higashi, Tsukuba, Ibaraki 305-8566, Japan; Biomedical Research Institute, National Institute of Advanced Indus-trial Science and Technology (AIST), 1-1-1 Higashi, Tsukuba, Ibaraki 305-8566, Japan.E-mail: [email protected]; [email protected]
**Present address: Department of Biological Chemistry, College of Bioscience and Biotechnology, Chubu University, Aichi 487-8501, Japan.
None of the authors of this manuscript has any financial or personal relationship with other people or organizations that could inappropriatelyinfluence their work.
Introduction
Chlorinated solvents, such as trichloroethylene (TCE)and tetrachloroethylene (PCE), are widely used in indus-trial processes and the agricultural industry. These com-pounds have been used in vapor-degreasing, paint remov-ers, metal cleaning, and dry-cleaning/wool facilities(Suttinun et al., 2013). However, chlorinated solvents,including cis-dichloroethylene (cDCE) and vinyl chloride(VC), which are produced as intermediates of TCE degra-dation in the environment, have caused serious environ-mental problems. Chlorinated solvents tend to accumu-late and diffuse at the bottom of aquifers originating from
Ecological impact assessment of a bioaugmentation site on remediationof chlorinated ethylenes by multi-omics analysis
(Received August 30, 2018; Accepted October 19, 2018; J-STAGE Advance publication date: March 8, 2019)
Saori Watahiki,1,2 Nobutada Kimura,1,2,* Atsushi Yamazoe,3 Takamasa Miura,3 Yuji Sekiguchi,4
Naohiro Noda,4,* Satoko Matsukura,4 Daisuke Kasai,5 Yoh Takahata,6 Hideaki Nojiri,7 and Masao Fukuda5,**
1 Life Sciences and Bioengineering, Graduate School of Life and Environmental Science, University of Tsukuba, Ibaraki, Japan2 Bioproduction Research Institute, National Institute of Advanced Industrial Science and Technology (AIST), Ibaraki, Japan
3 National Institute of Technology and Evaluation (NITE), Tokyo, Japan4 Biomedical Research Institute, National Institute of Advanced Industrial Science and Technology (AIST), Ibaraki, Japan
5 Department of Bioengineering, Nagaoka University of Technology, Niigata, Japan6 Taisei Corporation, Tokyo, Japan
7 Biotechnology Research Center, The University of Tokyo, Tokyo, Japan
Bioremediation may affect the ecological systemaround bioremediation sites. However, little isknown about how microbial community structureschange over time after the initial injection ofdegraders. In this study, we have assessed the eco-logical impact of bioaugmentation usingmetagenomic and metatranscriptomic approachesto remove trichlorinated ethylene/cis-dichloroethylene (TCE/cDCE) by Rhodococcusjostii strain RHA1 as an aerobic chemical com-pound degrader. Metagenomic analysis showed thatthe number of organisms belonging to the genusRhodococcus, including strain RHA1, increasedfrom 0.1% to 76.6% of the total microbial commu-nity on day 0 at the injection site. Subsequently,the populations of strain RHA1 and other TCE/cDCE-degrading bacteria gradually decreased overtime, whereas the populations of the anaerobicdechlorinators Geobacter and Dehalococcoides in-creased at later stages. Metatranscriptomic analy-sis revealed a high expression of aromatic com-pound-degrading genes (bphA1-A4) in strain RHA1after RHA1 injection. From these results, we con-cluded that the key dechlorinators of TCE/cDCEwere mainly aerobic bacteria, such as RHA1, untilday 1, after which the key dechlorinators changedto anaerobic bacteria, such as Geobacter and
Dehalococcocides, after day 6 at the injection well.Based on the aaaaa-diversity, the richness levels of themicrobial community were increased after injec-tion of strain RHA1, and the microbial communitycomposition had not been restored to that of theoriginal composition during the 19 days after treat-ment. These results provide insights into the assess-ment of the ecological impact and bioaugmentationprocess of RHA1 at bioremediation sites.
Key Words: bioremediation; chlorinated ethylenes;metagenomics; metatranscriptomics; next-genera-tion sequencing; Rhodococcus jostii RHA1

226 WATAHIKI et al.
dense nonaqueous-phase liquids (DNAPLs), and can pro-vide a persistent source of contamination for decades.Moreover, TCE induces various diseases, such as cancer,in animals and humans (Adetutu et al., 2015; Eder, 1991;Gilbert et al., 2009; Rusyn et al., 2014).
A number of physical and chemical approaches, such asexcavation, in situ chemical oxidation with permanganate,and in situ thermal desorption, can be used for the removalof pollutants from groundwater and soil (Crane and Scott,2012; Heron et al., 2013; Perelo, 2010). However, theseapproaches are inadequate for the removal of chlorinatedsolvents, which tend to spread in the environment at lowconcentrations. Microbes can be used effectively to treatTCE-contaminated environments at a low cost and to de-grade TCE/cDCE completely to produce nontoxic com-pounds, such as ethane, glyoxylic acid, and formic acid.
Bioaugmentation is a bioremediation method that re-duces contamination at certain sites by the introductionof specific bacteria, or a consortium of bacteria (Duba etal., 1996). Bioaugmentation is a short-term remedy com-pared with biostimulation; therefore, this method isthought to be a useful clean-up approach at bioremediationsites (Tiehm and Schmidt, 2011). For bioaugmentation,both anaerobic and aerobic microorganisms can be usedas degraders for contaminated substrates. The anaerobicreductive dechlorination (RD) of chlorinated solvents canbe mediated by anaerobic microorganisms such asDehalobacter, Dehalococcoides, Desulfitobacterium,Desulfuromonas, Dehalogenimonas, Geobacter, andSulfurospirillum (Frascari et al., 2015). These bacteria havebeen applied to remediate TCE and their derivatives atsites of contamination. In a previous study, cultured strainKB-1 was injected into TCE-contaminated groundwaterto degrade TCE to ethane in Southern Ontario, Canada(Pérez-de-Mora et al., 2014). Another study reported thatDehalococcoides strains FL2, BAV1, and GT with nutri-ents were able to transform 100% of TCE within 17 weeksat the injection site (Patil et al., 2014). In addition, Adetutuet al. (2015) reported that bioaugmentation of TCE affectsaquifers with Dehalococcoides by the RD approach at fieldsites. Furthermore, another study reported the effects ofbioaugmentation with a mixed Dehalococcoides/Dehalobacter culture for the treatment of 1,1,1-trichloroethane (TCA) and chloroethenes in groundwaterat three Danish sites (Scheutz et al., 2014).
Although TCE-degrading microorganisms are usefultools for in situ field-scale bioaugmentation, anaerobicmicroorganisms of these bacteria convert TCE/cDCE intoVC as the intermediate, which is harmful to humans, dur-ing the reductive dechlorination reaction (Chambon et al.,2013; Kielhorn et al., 2000). In addition, the degradationvelocity of VC is rate-limiting; thus, VC persists in thebioremediation site for a long time. In contrast, aerobicbacteria do not convert TCE to VC as the intermediatebecause these bacteria degrade TCE/cDCE via theepoxidation of short-chain alkenes by an alkenemonooxygenase (Suttinun et al., 2013). Therefore, aero-bic microorganisms are a more attractive choice forbioaugmentation at sites requiring bioremediation.Rhodococcus jostii strain RHA1, which was isolated froma g-hexachlorocyclohexane-contaminated site, can degrade
a broad range of organic compounds, such as gasolinecomponents, highly chlorinated PCB, and TCE under aero-bic conditions (Hand et al., 2015; Iino et al., 2012; Seto etal., 1995). RHA1 has three linear plasmids, i.e., pRHL1(1,100 kb), pRHL2 (450 kb), and pRHL3 (300 kb), anddioxygenase genes (bph), which are located on the pRHL1plasmid and are involved in the initial step of the PCB-degrading pathway (Iwasaki et al., 2007; Yang et al., 2011).Strain RHA1 may be useful for bioaugmentation since noaccumulation of toxic intermediates, such as cDCE andVC, was observed during TCE degradation by this strain.
To control field-scale bioaugmentation and to selectadequate bioaugmentation methods, it is necessary to as-sess the conditions for pollutant degradation by microor-ganisms and the ecological effects of environmental fac-tors, including microbial communities. In particular, thereis concern that the injection of microorganisms may causechanges in the microbial community balance, resulting inincreased numbers of harmful microorganisms and,thereby, affecting human health and water quality. In thisstudy, we attempted multi-omics analysis to assess theecological impact at the bioaugmentation site. Multi-omicsapproaches provide comprehensive information on themicrobial community, and metatranscriptomic approachesprovide information to predict the degradation mechanismof pollutants according to different degraders. Our find-ings demonstrated that the inoculated strain contributedto TCE/cDCE degradation in groundwater, but also causedan irreversible shift in the microbial community structure.
Materials and Methods
Site characterization. The bioaugmentation site was lo-cated in a field of a chemical company, which was con-taminated with TCE/cDCE/VC. Figure S1 shows a sitemap of the wells, including the two injection wells (E1and E4). The test site was surrounded by embedded steelsheet piles enclosing an area of 2.0 m ¥ 2.0 m arranged toprevent water inflow or outflow. The steel sheet pile wasinstalled one month before the bioaugumentation experi-ment and pumped 1 kL water. E1 mostly consisted of asimilar soil matrix, containing concrete, brick (GL 0.0 mto –2.5 m), fine sand (GL –2.5 m to –5.0 m), medium sand(GL –5.0 m to –7.0 m), gravel (GL –7.0 m to –8.0 m),coarse sand (GL –8.0 m to –9.0 m), and silt (below –9.0m). The E4 well was the control well.
Cell culture and injection of cells into the well. RHA1cells were grown using a fermentation tank under aera-tion-agitation conditions. RHA1 was incubated at 30∞Cfor 64 h in 150 L LB medium with defoaming agent. Aftercultivation, RHA1 was centrifuged for 10 min at 20∞C and5,000 rpm, and the collected pellet was washed with 10mM potassium phosphate buffer (pH 7.5). The washedRHA1 was suspended in 7 L of the same buffer, and thismixture was used as a cell suspension (1.0 ¥ 1014 cells).The cell suspension was suspended in 1 kL aeration waterand injected into the E1 well. In addition, aeration waterwas injected into the control well with an injection rate of2.0 kL/h.
Groundwater collection. Groundwater samples (2 L) werecollected in plastic bottles from the E1 and E4 wells at 30

Ecological impact of bioaugmentation 227
days before injection and on days 0, 1, 6, 19, and 54 afterinjection of RHA1 cell aeration water. Collected sampleswere centrifuged for 10 min at 4∞C and 10,000 rpm andthen stored at –80∞C until subsequent analysis.
Analytical procedures. The analytical procedures for de-termination of physicochemical parameters were carriedout as described by Miura et al. (2015). The 16S rRNAgene copy numbers were analyzed by real-time PCR asdescribed by Ritalahti et al. (2006). The copy number ofthe RHA1 etbAc gene was determined by quantitative PCR(qPCR) using a Light Cycler 96 (Roche, Basel, Switzer-land). The primers were 052-Fw (5 ¢-CGTTTGTGCTGTGTGGATGAA-3¢) and 143-Rv (5¢-TCGCCGACCCGGTATG-3¢). The probe was (5¢-FAM-AAAACCTgTCgCgCTgAACCCACC-TAMRA-3¢). Each20-mL reaction mixture contained 6 mL sterilized deionizedwater, 10 mL THUNDERBIRD Prove qPCR Mix(TOYOBO, Osaka, Japan), 1 mL 052-Fw primer (4 mM),1 mL 143-Rv primers (4 mM), 1 mL probe (4 mM), and 1mL extracted DNA. PCR was conducted by incubating thesamples at 95∞C for 60 s, followed by 50 cycles of 95∞Cfor 15 s and 52∞C for 60 s.
DNA, RNA, and cDNA preparation. Pellets (0.5 g) weresuspended in 200 mL of sterilized water, and the mixturewas then transferred to Lysing Matrix E (MP-Biomedicals,Santa Ana, CA, USA). DNA was extracted using a FastDNA Spin Kit for soil (MP-Biomedicals) according to themanufacturer’s instructions. DNA was quantified using aQubit dsDNA HS assay kit (Invitrogen, Grand Island, NY,USA) on a Qubit 2.0 Fluorometer (Invitrogen). RNA wasextracted using a Fast RNA Spin Kit for soil (MP-Biomedicals) according to the manufacturer’s instructions,and RNA was then purified using an RNeasy Mini kit(Qiagen, Hilden, Germany) according to the manufactur-er’s instructions. For removal of DNA, RNA samples weretreated using DNase (Takara Bio, Shiga, Japan) and ex-tracted by ethanol precipitation. RNA was quantified us-ing a Qubit dsRNA HS assay kit (Invitrogen) and AgilentRNA 6000 Pico (Agilent, Palo Alto, CA, USA). RNA waspurified using Ribozero (Illumina, Inc., San Diego, CA,USA) and was quantified using an Agilent RNA 6000 Pico(Agilent).
Metagenome sequencing and analysis. For metagenomesequencing, the libraries were constructed using a TruSeqDNA Sample Prep Kit v2 (Illumina, Inc.). These librar-ies, prepared with a fragment length of about 325 bp, weresequenced with a HiSeq 1000 sequencer using TruSeq SBSKit v3-HS (Illumina, Inc.). DNA sequences were anno-tated with MetaGenomics Rapid Annotation using Sub-system Technology (MG-RAST) pipeline version 4.0 witha minimum alignment length of 15 bp, minimum identityof 60%, and maximum E-value cut off of 1.0 ¥ 10–5 (Meyeret al., 2008). Three million sequence reads were used forthe analysis of each sample. Taxonomic analysis was con-ducted with a normalized abundance of sequences matchedto the M5NR database. Functional analysis was determinedat levels 1, 2, and 3 by matching normalized sequenceabundance to a given subsystem. Principal coordinatesanalysis (PCoA) and alpha-diversity were analyzed byMG-RAST.
Transcriptome sequencing and analysis. For cDNApreparation, a TruSeq DNA Sample Prep Kit v2-setA(Illumina, Inc.) and SuperScript III Reverse Transcriptase(Invitrogen) were used to synthesize cDNA, following themanufacturer’s instructions. Sequencing of the synthesizedcDNA sequence was performed by Hiseq1000 (Illumina,Inc.) with a fragment length of about 325 bp. Data analy-sis of the transcriptome was performed using R (ver. 3.3.2).Mapping of reads to the RHA1 genome (NC_008268.1,NC_008269.1, NC_008270.1, and NC_008271.1),Geobacter lovleyi SZ genome (NC_01814.1 andNC_010815.1), and Dehalococcoides mccrartyi 195 ge-nome (NC_002936.3) was performed using theBioconductor package QuasR allowing 2 bp mismatches(Langmead et al., 2009). Mapped read counts per genewere obtained using the qCount function of QuasR andannotation data formatted by the Bioconductor packagertracklayer (Lawrence et al., 2009; Love et al., 2014). Dif-ferential expression analysis was performed usingBioconductor package DESeq2 (Langmead et al., 2009;Lawrence et al., 2009; Love et al., 2014). For hierarchicalclustering, we normalized read count data across samplesusing the varianceStabilizingTransformation function ofDESeq2 prior to clustering (Langmead et al., 2009; Law-rence et al., 2009; Love et al., 2014).
Nucleotide sequence accession numbers. Themetagenome and metatranscriptome sequences were de-posited in the DDBJ database under accession numbersDRA005882 and DRA006583.
Results
Analysis of parameters after treatment of the contami-nated site
To evaluate the effects of RHA1 injection, the E1 andE4 wells were monitored between days -30 and 54 (Table1). The pH value was 6.2 at day -30 in the E1 well andranged from 6.8 to 7.2 after RHA1 injection. The oxida-tion-reduction potential (ORP) was 98 mV at day -30 andincreased to 181 mV at day 0, then decreased to –158 mVat day 54. The electrical conductivity (EC) value was 99mV at day -30 and then decreased to 25 mV at day 0 andincreased to 80 mV at day 54. The dissolved oxygen (DO)value was 0.0 mg/L at day -30 and increased to 5.8 mg/Lat day 0. The DO value in E1 well decreased significantlyto 0.3 mg/mL at day 1 and then to below the detectionlimit between days 6 and 54. The dissolved organic car-bon (DOC) value was 5.7 mg/mL at day -30 and increasedto 6.1 mg/mL at day 54. The concentration of total ironwas 10.4 mg/L at day -30 and then decreased to 0.2 and0.5 mg/L at days 0 and 1, respectively. Moreover, the con-centrations of total iron were increased to 11.0, 15.5, and18.9 mg/L at days 6, 19, and 54, respectively. At day 54,the concentrations of o-phosphoric acid and ammonia ni-trogen were higher than before treatment.
The time course of chlorinated ethylenes levels in theE1 well is shown in Figs. 1A–C. In the E1 well, the levelsof TCE and cDCE decreased to 69.2% and 71.4% at day54. Subsequently, the concentration of VC was signifi-cantly increased from 2.0 ¥ 10–3 mg/L at day 6 to 2.7 ¥10–2 mg/L at day 54.

228 WATAHIKI et al.
In the E4 well, the pH values were 6.3, 6.7, 6.6, 6.4,6.4, and 6.4 at days -30, 0, 1, 6, 19, and 54, respectively(Table 1). The ORP value was 95 mV at day -30 increasedto 230 mV at day 0 and then decreased to 102 mV at day54. The EC and DOC values were lower at day 54 thanbefore treatment. The DO value was 0.0 mg/L at day -30,increased to 7.0 mg/L at day 0, and gradually decreased to3.0, 3.3, 1.1, and 0.2 mg/L at days 1, 6, 19, and 54, re-spectively. The concentration of total iron was 13.5 mg/Lat day -30, decreased significantly to 0.6 mg/L at day 0,and then gradually increased to 1.4, 3.6, 5.3, and 13.1 mg/L at days 1, 6, 19, and 54, respectively. No significantchanges were observed in the concentration of o-phos-phoric acid and ammonia nitrogen compared with thatbefore treatment at day 54. The level of TCE decreased to60.0% at day 54, and that of cDCE increased from 0.3mg/L at day -30 to 0.4 mg/L at day 54. The concentrationof VC increased from 1.0 ¥ 10–3 mg/L at day -30 to 2.0 ¥10–3 mg/L at day 54 (Figs. 1A–C).
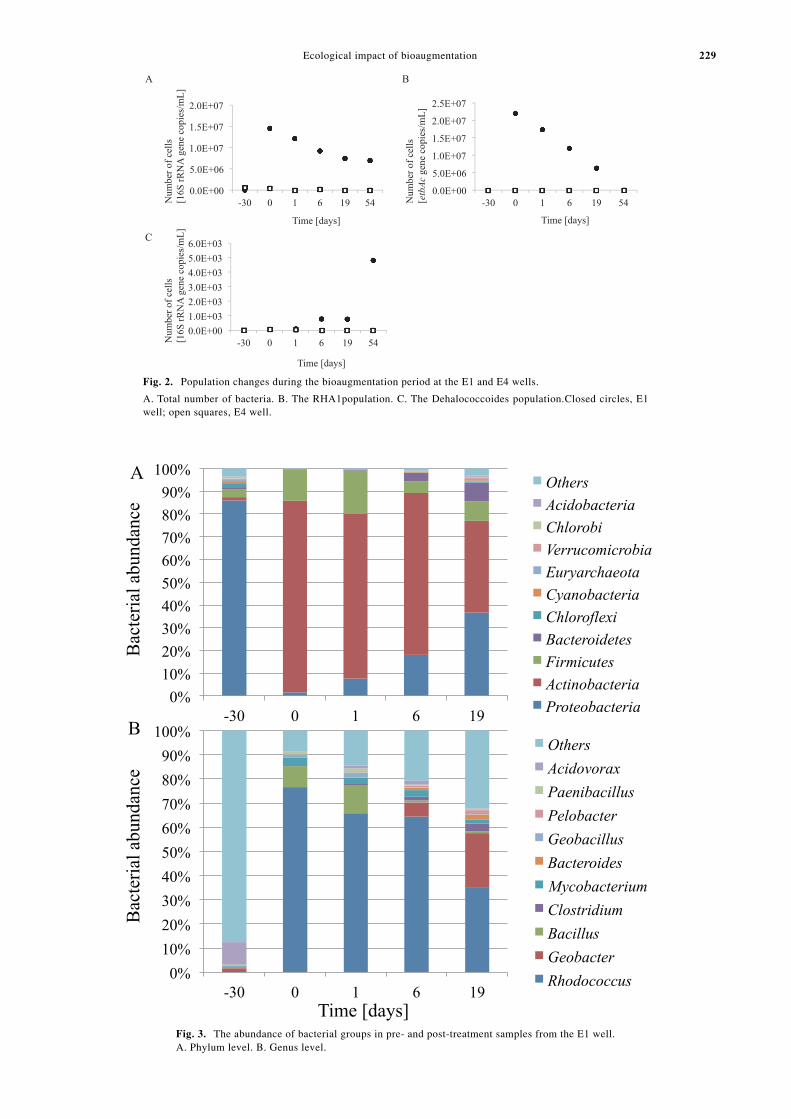
After injection of RHA1 culture, the total number of 16S
rRNA genes was 1.5 ¥ 107 copies/mL at day 0 in the E1well (Fig. 2A). The total number of 16S rRNA genes thengradually decreased to 7.6 ¥ 106 copies/mL at day 54. Thetime course of changes in the RHA1 population in the E1well is shown in Fig. 2B. The RHA1 population increasedfrom 0.0 copies/mL at day -30 to 2.2 ¥ 107 copies/mL atday 0 and then gradually decreased thereafter to 1.9 ¥ 104
copies/mL at day 54. In contrast, the population ofDehalococcoides was increased from 7.8 copies/mL at day-30 to 4.8 ¥ 103 copies/mL at day 54 (Fig. 2C).
In the E4 well, the total number of 16S rRNA genes was5.8 ¥ 105 copies/mL at day -30, and this value graduallydecreased to 3.2 ¥ 105, 1.1 ¥ 104, 8.2 ¥ 104, 8.3 ¥ 103, and2.9 ¥ 103 copies/mL at days 0, 1, 6, 19, and 54, respec-tively (Fig. 2A). An RHA1 population was detected in thesamples collected from days -30 to 19 by qPCR; how-ever, no RHA1 population was detected at day 54. In ad-dition, the Dehalococcoides population was barely detect-able from days -30 to 6 by qPCR, and no Dehalococcoideswere detected from days 19 to 54 (Fig. 2C).
Well Days after injection Temp.[∞C]
pH ORP[mV]
EC[mV]
DO[mg/L]
DOC[mg/L]
Total iron[mg/L]
o-phosphoric acid[mg/L]
Ammonia nitrogen[mg/L]
E1 -30 22.5 6.2 98 99 0.0 5.7 10.4 0.0 0.5
0 19.0 7.2 181 25 5.8 7.4 0.2 0.4 1.11 21.3 6.9 58 30 0.3 3.0 0.5 0.2 0.66 22.7 6.9 -142 44 0.0 9.4 11.0 0.4 2.6
19 22.0 6.8 -157 69 0.0 11.4 15.5 1.1 4.1
54 20.0 6.8 -158 80 0.0 6.1 18.9 0.5 5.0
E4 -30 22.3 6.3 95 90 0.0 6.2 13.5 0.1 0.6
0 16.5 6.7 230 24 7.0 2.2 0.6 0.0 0.01 21.0 6.6 89 26 3.0 2.2 1.4 0.0 0.16 22.3 6.4 135 37 3.3 3.1 3.6 0.0 1.219 21.8 6.4 60 50 1.1 5.5 5.3 0.0 0.354 19.2 6.4 102 68 0.2 4.8 13.1 0.0 0.3
Table 1. Geochemical characteristics of groundwater at E1 and E4 wells.
Fig. 1. Time course of contamination levels of TCE, cDCE, and VC at E1 and E4 wells.
A. TCE, B. cDCE, C. VC. Closed circles, E1 well; open squares, E4 well.
Ecological impact of bioaugmentation 229
Fig. 2. Population changes during the bioaugmentation period at the E1 and E4 wells.
A. Total number of bacteria. B. The RHA1population. C. The Dehalococcoides population.Closed circles, E1well; open squares, E4 well.
Fig. 3. The abundance of bacterial groups in pre- and post-treatment samples from the E1 well.A. Phylum level. B. Genus level.

230 WATAHIKI et al.
Bacterial community analysis by whole-genome shotgunsequencing
In the E1 well, metagenomic analysis revealed that thephylum Proteobacteria was dominant before injection ofRHA1 cells (at day -30; 85.8%), and the classBetaproteobacteria (73.9%) accounted for over half of thephylum Proteobacteria. At the genus level, Acidovorax(14.5%), Polaromonas (9.6%), and Albidiferax (9.2%;Figs. 3A and B, Tables S1, S2A, and S2B) were present.After RHA1 injection, the phylum Actinobacteria wasdominant throughout the monitoring period (84.1% at day0, 72.5% at day 1, 71.3% at day 6, and 40.3% at day 19).At the genus level, Rhodococcus was dominant, and atthe phylum level Actinobacteria accounted for 76.6%,65.8%, 64.4%, and 34.9% at days 0, 1, 6, and 19, respec-tively (Table S3). In addition, the population of the phy-lum Firmicutes increased to 13.8% and 18.9% at days 0and 1, respectively, and then decreased to 5.0% and 8.7%at days 6 and 19, respectively. At the genus level, Bacilluswas the most abundant in the phylum Firmicutes at days 0and 1. Although the genus Geobacter decreased from 1.5%at day -30 to 0.0% at day 0, the population of Geobacterincreased to 5.8% and 22.6% at days 6 and 19, respec-tively.
PCoA of the bacterial community structuresPCoA revealed that the microbial community in the E1
well was significantly changed after RHA1 injection (Fig.S2). Indeed, this analysis revealed that the microbial com-munities were different between days -30 and 19. Addi-tionally, a-diversity was 246 at day -30, 6 at day 0, 11 at
day 1, 14 at day 6, and 61 at day 19 (Table S4) and de-creased after RHA1 injection, although the level subse-quently increased over time.
Functional profile of the bacterial communityTo determine the genetic potential of the microbial com-
munities of TCE/cDCE-contaminated groundwater andtheir adaptive features with regard to the biodegradationof xenobiotic compounds, functional annotations werecarried out according to KEGG hits, and we assigned pre-dicted functions to the metagenome shotgun sequences.After injection of the RHA1 culture in the remediationsite at the E1 well, the portion of functional genes involvedin the metabolism of aromatic compounds increased from1.8% at day -30 to 7.0% at day 0 (Table 2). The portion offunctional genes involved in dormancy and sporulationalso increased from 0.1% at day -30 to 0.6% at day 0.These results indicated that the functional profile of thebacterial community was affected by RHA1 culture injec-tion.
Gene expression of aromatic compound-degrading en-zymes
To test whether the strain RHA1, inoculated as a bio-degrader, was physiologically active in the E1 well, weextracted the total RNA from contaminated soils, and theexpression levels of genes on the RHA1 plasmids pRHL1,pRHL2, and pRHL3 were estimated by transcriptomesequencing (RNA-seq; Fig. 4). We focused on these threeplasmids since the complete set of genes responsible foraromatic compound degradation was located on the
Table 2. Functional analysis (subsystem/level 1) based on metagenome analysis using MG-RAST at E1 well.
Subsystem/level 1 Abundance [%]Day -30 Day 0 Day 1 Day 6 Day 19
Amino acids and derivatives 9.6 12.3 11.8 12.0 10.9Carbohydrates 10.1 14.7 14.0 14.3 12.3Cell division and cell cycle 0.9 0.7 0.7 0.6 0.8Cell wall and capsule 4.3 2.5 2.7 3.0 3.9Clustering-based subsystems 11.9 11.3 11.7 11.0 11.5Cofactors, vitamins, prosthetic groups, pigments 5.5 5.4 5.4 5.4 5.4DNA metabolism 4.6 3.6 3.7 3.6 4.3Dormancy and sporulation 0.1 0.6 0.8 0.2 0.2Fatty acids, lipids, and isoprenoids 2.6 4.4 4.1 4.0 2.9Iron acquisition and metabolism 0.5 1.3 1.3 1.0 0.7Membrane transport 3.9 2.9 3.3 2.9 3.4Metabolism of aromatic compounds 1.8 7.0 6.2 6.0 2.8Miscellaneous 5.9 5.4 5.5 5.4 5.7Motility and chemotaxis 2.2 0.4 0.6 0.7 1.5Nitrogen metabolism 2.7 1.7 1.7 1.9 1.7Nucleosides and nucleotides 3.0 2.8 2.9 2.7 2.9Phages, prophages, transposable elements, plasmids 0.9 0.9 0.9 0.9 1.0Phosphorus metabolism 1.2 0.9 1.0 0.9 1.1Photosynthesis 0.0 0.0 0.0 0.0 0.0Potassium metabolism 0.5 0.5 0.4 0.5 0.6Protein metabolism 9.2 5.7 6.0 6.6 8.6RNA metabolism 4.4 2.3 2.6 2.7 3.7Regulation and cell signaling 1.1 0.7 0.8 0.8 1.0Respiration 5.5 4.8 4.7 5.1 5.7Secondary metabolism 0.1 0.6 0.5 0.5 0.3Stress response 2.5 3.2 2.9 2.9 2.4Sulfur metabolism 1.2 1.5 1.3 1.3 1.0Virulence, disease and defense 3.8 2.1 2.4 2.7 3.5

Ecological impact of bioaugmentation 231
plasmids in RHA1. To screen genes that showed changesin expression levels after inoculation of RHA1, we ini-tially conducted pairwise comparisons in data for days 0and 1. Twenty-seven genes showed relatively low q.values(false discovery data) of less than 0.1. Normalized readcounts for these 27 genes were obtained from four timepoints, and their expression values were shown as Z scoresin the heatmap (Fig. 4). These data suggested that all 27genes showed decreased expression over time. Among theselected 27 genes, bphAa (RS35885), bphAb (RS35880),bphAc (RS35875), and bphAd (RS35870) were estimatedto be involved in the degradation of TCE/cDCE. Thegradually decreased expression of these genes was con-sistent with the decrease in TCE/cDCE in the environment.The inoculated strain was expected to be physiologicallyactive in producing degradation enzymes, but showed adecreased degradation activity relatively rapidly.
Discussion
In this study, we performed multi-omics analysis to as-sess the ecological impact at the bioaugmentation site. Atthe initial stage of TCE/cDCE degradation, RHA1 was thedominant bacterium in the E1 well after RHA1 injection.Moreover, gene expression of biphenyl-degrading enzymesin RHA1 was detected immediately after RHA1 injection.As a result of metagenome analysis, the proportion ofRhodococcus, including RHA1 in the groundwater, at day0 increased by 76.5% when compared with that at days-30 and 0, making RHA1 the dominant species. In addi-tion, the proportion of Bacillus also increased by 8.5%when comparing days -30 and 0. The populations of other
Fig. 4. Heatmap of genes involved in degradation of TCE/cDCE.
aerobic microorganisms, such as Mycobacterium ,Geobacillus, and Paenibacillus, also increased at the in-jection site. At the E4 well, changes in TCE levels mayhave been caused by temporary dilution with the aerationwater and natural attenuation by activated native bacte-ria, which can degrade TCE under aerated conditions.However, TCE-degrading bacteria could not be identifiedfrom metagenome data from the E4 well. Previous studiesrevealed that Mycobacterium vaccae JOB 5 andGeobacillus sp. strain FW23 are able to degrade TCE andtheir metabolites (Dey and Roy, 2009; Pore, 2014; Wackett,1989). Another study reported that Paenibacillus kobensis,Paenibacillus curdlanolyticus, and Paenibacillus wynniican grow even in TCE-contaminated soil. These resultssuggested that the other aerobic bacteria, as well as strainRHA1, may be involved in TCE degradation at the injec-tion site (Mera and Iwasaki, 2007). These findings pro-vide a new point of view for the selection of bioremediationmethods and the evaluation of the effects on the microbialenvironment during bioremediation.
Degradation of TCE/cDCE by strain RHA1 was not ob-served after day 6 since this bacterium completely con-sumed the oxygen required for growth and degradation ofpollutants. In addition, we verified gene expression inRHA1 using metatranscriptomic analysis and observedhigh expression in 27 oxygenase genes at day 0. Degrada-tion of TCE/cDCE by aerobic bacteria resulted in the gen-eration of formic acid and carbon dioxide via TCE/cDCEepoxide (Suttinun et al., 2013). Previous studies reportedthat monooxygenase and dioxygenase are involved in theproduction of TCE/cDCE epoxide as a TCE/cDCEmetabolite (Furukawa, 2006; Suttinun et al., 2013). For

232 WATAHIKI et al.
example, in Xanthobacter strain Py2, alkenemonooxygenase and epoxidase are involved in the pro-duction of TCE/cDCE epoxide (Ensign, 1996). Further-more, in R. erythropolis BD 2 and Rhodococcus sp. L 4,isopropyl benzene/toluene dioxygenase has been reportedto be involved in the degradation of TCE (Suttinun et al.,2013). In the case of strain RHA1, genes involved in pro-ducing TCE/cDCE epoxide have not been reported; how-ever, propane/alkane monooxygenase or biphenyldioxygenase of strain RHA1 was expressed in the pres-ence of triclosan as a substrate (Lee and Chu, 2013). Thus,aromatic compound and alkane oxygenases may be respon-sible for the initial reaction in the aerobic degradation ofTCE/cDCE. Although 203 oxygenases were annotated inthe genome of strain RHA1, seven oxygenase-relatedgenes, including biphenyl 2,3-dioxygenase subunit genes,bphAa (RS35885), bphAb (RS35880), bphAc (RS35875),bphAd (RS35870), and etbAc (non-heme iron oxygenaseferredoxin subunit; RS41430), and 2,3-dihydroxybiphenyl1,2-dioxygenase genes, bphC1 (RS35865) and etbC(RS41380), were found to be highly expressed at day 0 inthis study (McLeod et al., 2006). Therefore, these resultssuggested that some of these highly expressed genes areinvolved in the degradation of TCE/cDCE.
On day 6 after the beginning of TCE/cDCEbioremediation, TCE/cDCE may be converted to VC byanaerobic bacteria, i.e., Geobacter and Dehalococcoides,which were increased in the injection site. Strain RHA1was related to the consumption of DO, caused decreasedORP levels, and created the observed anaerobic conditions.Moreover, increased DOC, o-phosphoric acid, ammonianitrogen, and EC were observed after day 6, and thesechanges were expected to be the cause of dissolution ofthe cellular components from strain RHA1 in thegroundwater. Therefore, the chemical conditions at theinjection well have been changed to enhance the growthof, and dechlorination by, Geobacter andDehalococcoides. The concentration of VC significantlyincreased in the injection well from days 6–54 in this study,and VC was accumulated in the well around 27 times be-fore treatment. Moreover, a rebound in TCE/cDCE at day6 was observed, resulting in the creation of the conditionsfor easier accumulation of VC. On the basis of the micro-bial community analysis, anaerobic bacteria, i .e.,Geobacter and Dehalococcoides, were detected at the in-jection site at days 6 and 19 after treatment. From theseresults, it was speculated that Geobacter was related tothe conversion of TCE to cDCE and that Dehalococcoidesrelied on the degradation of cDCE to VC as a metaboliteof TCE at the injection site. In contrast, the E4 well didnot become anaerobic because there was no oxygen con-sumption by RHA1. Therefore, cDCE degradation was notobserved at the E4 well. A previous study reported thataccumulation of VC was observed during thebioaugmentation of TCE using Dehalococcoides spp.,Dehalobacter sp., and G. lovleyi strain SZ (Amos et al.,2009). According to these results, key dechlorinators ofTCE/cDCE were mainly aerobic bacteria, such as RHA1and Bacillus, until day 1, and the key dechlorinators thenshifted to anaerobic bacteria, such as Geobacter andDehalococcocides, beginning on day 6 in the injection
well.In this study, the microbial communities at the injection
site were disrupted by the injection of RHA1 cultures. Aprevious study also reported that the microbial composi-tion in the TCE bioremediation site was significantly dif-ferent before and after treatment using Dehalococcoidesstrains FL 2, BAV 1, and GT with acetic acid as an elec-tron accepter (Adetutu et al., 2015). Furthermore, succes-sion of the microbial composition at the remediation siteshowed that e-Proteobacteria and g-Proteobacteria, whichwere not injected, were dominant species in thebioremediation site during bioremediation. In this study,PCoA revealed that succession of the microbial commu-nity was also observed at the injection site duringbioremediation after treatment. These results suggestedthat injection of the culture of the degrading strain led todisruption of the microbial community and that the suc-cession of the microbial community composition occurredafter injection of the culture.
In summary, in this study, we used multi-omics analysisto analyze the roles of degrading bacteria in the metabo-lism of TCE/cDCE at bioremediation sites. The advan-tage of metagenomic analysis is that the bias of culturingmicroorganisms from the environmental samples can beexcluded, even though the population of microorganismwas very low. Metatranscriptomic analysis can analyze thetranscription of an enormous number of genes present inthe environment. Thus, multi-omics analysis provides use-ful information for comprehensively analyzing microbialcommunity succession and predicting the degradationpathway for contaminated compounds at bioremediationsites.
Acknowledgments
This work was supported by a grant from the Ministry of Economy,Trade and Industry of Japan.
Supplementary Materials
Supplementary figures and tables are available in our J-STAGE site(http://www.jstage.jst.go.jp/browse/jgam).
References
Adetutu, E. M., Gundry, T. D., Patil, S. S., Golneshin, A., Adigun, J. etal. (2015) Exploiting the intrinsic microbial degradative potentialfor field-based in situ dechlorination of trichloroethene contami-nated groundwater. J. Hazard. Mater., 300, 48–57.
Amos, B. K., Suchomel, E. J., Pennell, K. D., and Löfler, F. E. (2009)Spatial and temporal distributions of Geobacter lovleyi andDehalococcoides spp. during bioenhanced PCE-NAPL dissolution.Environ. Sci. Technol., 43, 1977–1985.
Chambon, J. C., Bjerg, P. L., Scheutz, C., Bælum, J., Jakobsen, R. et al.(2013) Review of reactive kinetic models describing reductivedechlorination of chlorinated ethenes in soil and groundwater.Biotechnol. Bioeng., 110, 1–23.
Crane, R. A. and Scott, T. B. (2012) Nanoscale zero-valent iron: futureprospects for an emerging water treatment technology. J. Hazard.Mater., 211–212, 112–125.
Dey, K. and Roy, P. (2009) Degradation of trichloroethylene by Bacil-lus sp.: isolation strategy, strain characteristics, and cell immobili-zation. Curr. Microbiol., 59, 256–260.
Duba, A. G., Jackson, K. J., Jovanovich, M. C., Knapp, R. B., and Taylor,R. T. (1996) TCE remediation using in situ , resting statebioaugmentation. Environ. Sci. Technol., 30, 1982–1989.

Ecological impact of bioaugmentation 233
Eder, E. (1991) Toxicology of C1–C3 chlorinated hydrocarbons.Chemosphere, 23, 1783–1801.
Ensign, S. A. (1996) Aliphatic and chlorinated alkenes and epoxides asinducers of alkene monooxygenase and epoxidase activities inXanthobacter strain Py2. Appl. Environ. Microbiol., 62, 61–66.
Frascari, D., Zanaroli, G., and Danko, A. S. (2015) In situ aerobiccometabolism of chlorinated solvents: a review. J. Hazard. Mater.,283, 382–399.
Furukawa, K. (2006) Oxygenases and dehalogenases: molecular ap-proaches to efficient degradation of chlorinated environmental pol-lutants. Biosci. Biotechnol. Biochem., 70, 2335–2348.
Gilbert, K. M., Przybyla, B., Pumford, N. R., Han, T., Fuscoe, J. et al.(2009) Delineating liver events in trichloroethylene-inducedautoimmune hepatitis. Chem. Res. Toxicol., 22, 626–632.
Hand, S., Wang, B., and Chu, K.-H. (2015) Biodegradation of 1,4-diox-ane: effects of enzyme inducers and trichloroethylene. Sci. TotalEnviron., 520, 154–159.
Heron, G., Lachance, J., and Baker, R. (2013) Removal of PCE DNAPLfrom tight clays using in situ thermal desorption. Ground WaterMonit. Remediat., 33, 31–43.
Iino, T., Wang, Y., Miyauchi, K., Kasai, D., Masai, E. et al. (2012) Spe-cific gene responses of Rhodococcus jostii RHA1 during growth insoil. Appl. Environ. Microbiol., 78, 6954–6962.
Iwasaki, T., Takeda, H., Miyauchi, K., Yamada, T., Masai, E. et al. (2007)Characterization of two biphenyl dioxygenases for biphenyl/PCBdegradation in A PCB degrader, Rhodococcus sp. strain RHA1.Biosci. Biotechnol. Biochem., 71, 993–1002.
Kielhorn, J., Melber, C., Wahnschaffe, U., Aitio, A., and Mangelsdorf,I. (2000) Vinyl chloride: still a cause for concern. Environ. HealthPerspect., 108, 579–588.
Langmead, B., Trapnell, C., Pop, M., and Salzberg, S. L. (2009) Ultrafastand memory-efficient alignment of short DNA sequences to thehuman genome. Genome Biol., 10, R25.
Lawrence, M., Gentleman, R., and Carey, V. (2009) rtracklayer: an Rpackage for interfacing with genome browsers. Bioinformatics, 25,1841–1842.
Lee, D. G. and Chu, K.-H. (2013) Effects of growth substrate on triclosanbiodegradation potential of oxygenase-expressing bacteria.Chemosphere, 93, 1904–1911.
Love, M., Huber, W., and Anders, S. (2014) Moderated estimation offold change and dispersion for RNA-seq data with DESeq2. Ge-nome Biol., 15, 550.
McLeod, M. P., Warren, R. L., Hsiao, W. W. L., Araki, N., Myhre, M. etal. (2006) The complete genome of Rhodococcus sp. RHA1 pro-vides insights into a catabolic powerhouse. Proc. Natl. Acad. Sci.USA, 103, 15582–15587.
Mera, N. and Iwasaki, K. (2007) Use of plate-wash samples to monitorthe fates of culturable bacteria in mercury- and trichloroethylene-contaminated soils. Appl. Microbiol. Biotechnol., 77, 437–445.
Meyer, F., Paarmann, D., D’Souza, M., Olson, R., Glass, E. M. et al.
(2008) The metagenomics RAST server—a public resource for theautomatic phylogenetic and functional analysis of metagenomes.BMC Bioinform., 9, 386.
Miura, T., Yamazoe, A., Ito, M., Ohji, S., Hosoyama, A. et al. (2015)The impact of injections of different nutrients on the bacterial com-munity and its dechlorination activity in chloroethene-contaminatedgroundwater. Microbes Environ., 30, 164–171.
Patil, S. S., Adetutu, E. M., Sheppard, P. J., Morrison, P., Menz, I. R. etal. (2014) Site-specific pre-evaluation of bioremediation technolo-gies for chloroethene degradation. Int. J. Environ. Sci. Technol.,11, 1869–1880.
Perelo, L. W. (2010) In situ and bioremediation of organic pollutants inaquatic sediments. J. Hazard. Mater., 177, 81–89.
Pérez-de-Mora, A., Zila, A., McMaster, M. L., and Edwards, E. A. (2014)Bioremediation of chlorinated ethenes in fractured bedrock andassociated changes in dechlorinating and nondechlorinating micro-bial populations. Environ. Sci. Technol., 48, 5770–5779.
Pore, S. D., Arora, P., and Dhakephalkar, P. K. (2014) Draft genomesequence of Geobacillus sp. strain FW23, isolated from a forma-tion water sample. Genome Announc., 2, e00352-14.
Ritalahti, K. M., Amos, B. K., Sung, Y., Wu, Q., Koenigsberg, S. S. etal. (2006) Quantitative PCR targeting 16S rRNA and reductivedehalogenase genes simultaneously monitors multipleDehalococcoides strains. Appl. Environ. Microbiol., 72, 2765–2774.
Rusyn, I., Chiu, W. A., Lash, L. H., Kromhout, H., Hansen, J. et al.(2014) Trichloroethylene: mechanistic, epidemiologic and othersupporting evidence of carcinogenic hazard. Pharmacol. Ther., 141,55–68.
Scheutz, C., Durant, N. D., and Broholm, M. M. (2014) Effects ofbioaugmentation on enhanced reductive dechlorination of 1,1,1-trichloroethane in groundwater: a comparison of three sites. Bio-degradation, 25, 459–478.
Seto, M., Masai, E., Ida, M., Hatta, T., Kimbara, K. et al. (1995) Multi-ple polychlorinated biphenyl transformation systems in the Gram-positive bacterium Rhodococcus sp. strain RHA1. Appl. Environ.Microbiol., 61, 4510–4513.
Suttinun, O., Luepromchai, E., and Müller, R. (2013) Cometabolism oftrichloroethylene: concepts, limitations and available strategies forsustained biodegradation. Rev. Environ. Sci. Biol. Technol., 12, 99–114.
Tiehm, A. and Schmidt, K. R. (2011) Sequential anaerobic/aerobic bio-degradation of chloroethenes-aspects of field application. Curr.Opin. Biotechnol., 22, 415–421.
Wackett, L. P., Brusseau, G. A., Householder, S. R., and Hanson, R. S.(1989) Survey of microbial oxygenases: trichloroethylene degra-dation by propane-oxidizing bacteria. Appl. Environ. Microbiol.,55, 2960–2964.
Yang, X., Xue, R., Shen, C., Li, S., Gao, C. et al. (2011) Genome se-quence of Rhodococcus sp. strain R04, a polychlorinated-biphenylbiodegrader. J. Bacteriol., 193, 5032–5033.