full electrification of lund city bus traffic - a
TRANSCRIPT

LUND UNIVERSITY
PO Box 117221 00 Lund+46 46-222 00 00
Full electrification of Lund city bus traffic - A simulation study
Lindgren, Lars
2015
Link to publication
Citation for published version (APA):Lindgren, L. (2015). Full electrification of Lund city bus traffic - A simulation study. Department of IndustrialElectrical Engineering and Automation, Lund Institute of Technology.
Total number of authors:1
General rightsUnless other specific re-use rights are stated the following general rights apply:Copyright and moral rights for the publications made accessible in the public portal are retained by the authorsand/or other copyright owners and it is a condition of accessing publications that users recognise and abide by thelegal requirements associated with these rights. • Users may download and print one copy of any publication from the public portal for the purpose of private studyor research. • You may not further distribute the material or use it for any profit-making activity or commercial gain • You may freely distribute the URL identifying the publication in the public portal
Read more about Creative commons licenses: https://creativecommons.org/licenses/Take down policyIf you believe that this document breaches copyright please contact us providing details, and we will removeaccess to the work immediately and investigate your claim.

Ind
ust
rial E
lectr
ical En
gin
eerin
g a
nd
A
uto
matio
n
CODEN:LUTEDX/(TEIE-7255)/1-48/(2015)
Full electrification of Lund city bus traffic A simulation study
Lars Lindgren
Division of Industrial Electrical Engineering and Automation Faculty of Engineering, Lund University

Industrial Electrical Engineering and Automation Lund Institute of Technology
Full electrification of Lund city bus traffic A simulation study
Lund 2015-05-13
Lars Lindgren, Lund University

2
1 Abstract Flexible and economic systems for full electric operation of road vehicles are an area of intense re-search and development. This report applies such systems to the operation of all city buses in Lund. Software for simulation and economic optimization of such systems is developed and a few system designs are presented. An attempt to a realistic cost and performance estimate of the main compo-nents is presented. All buses are assumed to operate at the same schedule as today. Under some of the assumptions these systems are shown to be cheaper than diesel and gas buses in addition to being quieter and without local pollution.

3
2 Sammanfattning Flexibla och ekonomiska system för eldrift av vägfordon är ett område med aktiv utveckling och forskning. Denna rapport tillämpar sådana system för drift av alla stadsbussar i Lund. En programvara för simulering och ekonomisk optimering av sådana system har utvecklats och några systemkonstruktioner presenteras. Ett försök till realistiska kostnader och resultat uppskattningar av de viktigaste komponenterna presenteras. Alla bussar antas arbeta vid samma schema som i dag. Under vissa antaganden visar det sig att dessa system är billigare än diesel och gas bussar förutom att de är tystare och utan lokala föroreningar.
4
3 Table of Contents 1 Abstract ........................................................................................................................................... 2
2 Sammanfattning .............................................................................................................................. 3
3 Table of Contents ............................................................................................................................ 4
1. Introduction ..................................................................................................................................... 6
3.1 Limitations ............................................................................................................................... 7
3.2 Project background ................................................................................................................. 8
4 Supply systems for electric buses .................................................................................................... 9
4.1 Conductive energy transfer ..................................................................................................... 9
4.1.1 Elonroad .......................................................................................................................... 9
4.1.2 Siemens bus charging system ........................................................................................ 10
4.1.3 Other ............................................................................................................................. 10
4.2 Inductive energy transfer ...................................................................................................... 11
4.2.1 Primove ......................................................................................................................... 11
4.2.2 Other ............................................................................................................................. 11
5 Assumptions in this simulation study ............................................................................................ 12
5.1 Batteries ................................................................................................................................ 12
5.2 Reference cases ..................................................................................................................... 13
5.3 Economics .............................................................................................................................. 14
5.4 Energy consumption .............................................................................................................. 15
5.5 Routes, operation etc. ........................................................................................................... 15
5.6 Example cases ........................................................................................................................ 17
5.6.1 Conductive 1 .................................................................................................................. 17
5.6.2 Inductive ........................................................................................................................ 17
5.6.3 Conductive 2 .................................................................................................................. 18
5.7 Simulator ............................................................................................................................... 18
6 Charging system optimizer ............................................................................................................ 19
7 Results ........................................................................................................................................... 20
7.1 Conductive 2 - No Electric Heating ........................................................................................ 22
7.2 Inductive power transfer – Electric heating 2 ....................................................................... 27
7.2.1 Average day ................................................................................................................... 29

5
7.2.2 Winter day ..................................................................................................................... 32
7.3 Conductive 1 - Electric heat 2 ................................................................................................ 35
7.3.1 Average day ................................................................................................................... 37
7.3.2 Winter day ..................................................................................................................... 40
7.4 Heating .................................................................................................................................. 43
8 Conclusions and discussion ........................................................................................................... 44
9 Further work .................................................................................................................................. 46
10 References ................................................................................................................................. 47

6
1. Introduction There is a general trend towards electrification of different transportation infrastructures. This is driven by an ambition to reduce exhaust gas and acoustic noise emissions and to reduce the depend-ence on fuels suitable for vehicles. Additional benefits are the opportunity to operate some commer-cial vehicles early/late hours (like garbage hauling) or indoors (like having a bus terminal within a shopping mall.
The ability to run city buses fully or partially electric has in recent years come to be demonstrated at individual bus lines in cities around the world. The charging is controlled automatically by wireless inductive or automatic conductive energy transfer from the charging station to the bus. A city bus typically have a mileage between two end stops about 5 ... 15 km and uses about 1.5 kWh/km elec-tric energy, i.e. from just below 10 kWh to just over 20 kWh depending on mileage, one way. The average speed is under 20 km / h, i.e. a single trip between two terminal takes 15 ... 45 minutes’ drive depending on mileage.
With a charging station at each end of the bus line and a charging power of 200 kW it can fully re-charge the battery at 3 ... 6 minutes depending on mileage. This is a reasonable rest time for the driver, seen in relation to the running time.
If that kind of charging is applied to a bus network it is possible that charging stations at selected stops along the route is both a technical and an economic advantage. The cost of charging stations can be shared by several bus lines that stop at the same stops. This leads to shorter times at bus stops (type 10 ... 40 seconds) compensated with more charging opportunities such that the total energy supply is maintained and the total charge variation decreases – which in both cases favors the battery cost by smaller size or longer operating life.
It is therefore interesting to more closely study how an all-electric city bus service in the Lund urban area would best be energy supplied with respect to number of charging stations, locations of these, charging times etc.
In recent years several research and product development projects towards Electrical Road Systems (ERS) have started and some commercial products have already emerged. Conceptually such systems are similar to trolley bus systems in the sense that electric power is supplied to vehicles while mov-ing. The main difference is that the new systems emerging are applicable to general traffic and can thus be used by more than only buses, e.g. by local good s distribution, taxis and cars. Tree power transfer categories can be seen:
1. Overhead wires (Limited to Busses , trucks and other high vehicles) 2. Electric tracks in the road surface 3. Inductive energy transfer from coils under the road surface
The main difference from trolley bus systems are that vehicles need to be able to connect and dis-connect from the system automatic while driving at speed and those vehicles are assumed to have a battery on board that is charged from the ERS so that the vehicles can operate outside the ERS. This can reduce the charging infrastructure cost since only selected roads needs to be equipped with ERS. Billing systems are being developed to distribute the energy cost to the actual user in a similar way as the mobile phone bills in relation to the use of the mobile phone system.

7
Plug In and Full Electric buses are a good platform for electro mobility technology. The dynamic driv-ing pattern with intense start/stop operation benefits from hybridization. The repetitive driving pat-tern – repeating a particular bus line – facilitates the use of a dedicated charging infrastructure. These are the reasons why public bus transport has emerged as the first adopter of new electro mo-bility technology, including the use of automatic bus stop charging systems and ERS technology
In this study both automatic bus stops charging systems and ERS technology are combined in the system optimization of the Lund city bus network.
3.1 Limitations In this project the 2014-04-24 city buss traffic schedule is used as a test case. No alternations of the bus schedule and route network are made to better fit electric operation. The requirement is that the system should operate fully electric with adequate reserves for missed charging opportunities. No modeling of blackout or other serve contingencies are made.
When designing a new public transport system, predictions on future transport demands needs to be taken in to consideration, this not done in this report regardless of energy source.
The cost of dedicated lanes and new platforms etc. that may be needed to increase capacity and reduce travel time are also disregarded as the costs for these are not dependent on energy source.
The solutions in this report are optimized for minimal total cost. The different actors such as Skånetrafiken, the Bus operator and Lund municipality have incentives to optimize the economy of their part. This could potentially lead to a suboptimal total solution.
The calculation is based mainly on data for a 12 meter unarticulated buses but due to margins in the assumptions the results should also reasonable well cover cases with a mix of 12 meter and 18 meter articulated buses. 24 meter double articulated buses could be used, increasing both vehicle cost and transport capacity, but that option is not considered in in this report.
The traffic schedule used is the published schedule that is rounded to whole minutes and rough ap-proximations are used to generate more detailed timing.
An automatic scheduling algorithm is used to schedule the empty trips needed to get the buses to the start of each trip in the published schedule. This is not based on the current practice but not op-timized especially for electric buses either.
The used battery costs and lifetime modeling are realistic assumptions. No detailed comparisons between different battery types are made.
It is always hard to get accurate cost estimates of the different components and installations in such a system as this before you are able to ask for real quotations. We have tried to make realistic as-sumptions for early series production costs.
No socioeconomic calculation of the value of reduced acoustic noise and cleaner air in the city are made.

8
3.2 Project background This project was initiated by Lund University and Lund municipality through LUOpen and Future by Lund. The goal are to simulate and estimate costs of a few different solutions for electric city buses in Lund in an as objective way as possible within the time frame of the project. This type of study does however require a large number of subjective estimates and judgements so it is important to be open with possible biases in the project. The main assumptions are presented in this report so the reader can judge if they are biased in any direction.
The main author of this report Lars Lindgren is involved in a number of projects related to electrical roads.[1][2][3] He has also supervised a number of master thesis projects on the Elonroad system.[4]
Mats Alaküla, who has been the project leader in this project in his position as professor at LTH, also works part time as a technology specialist at AB Volvo.
9
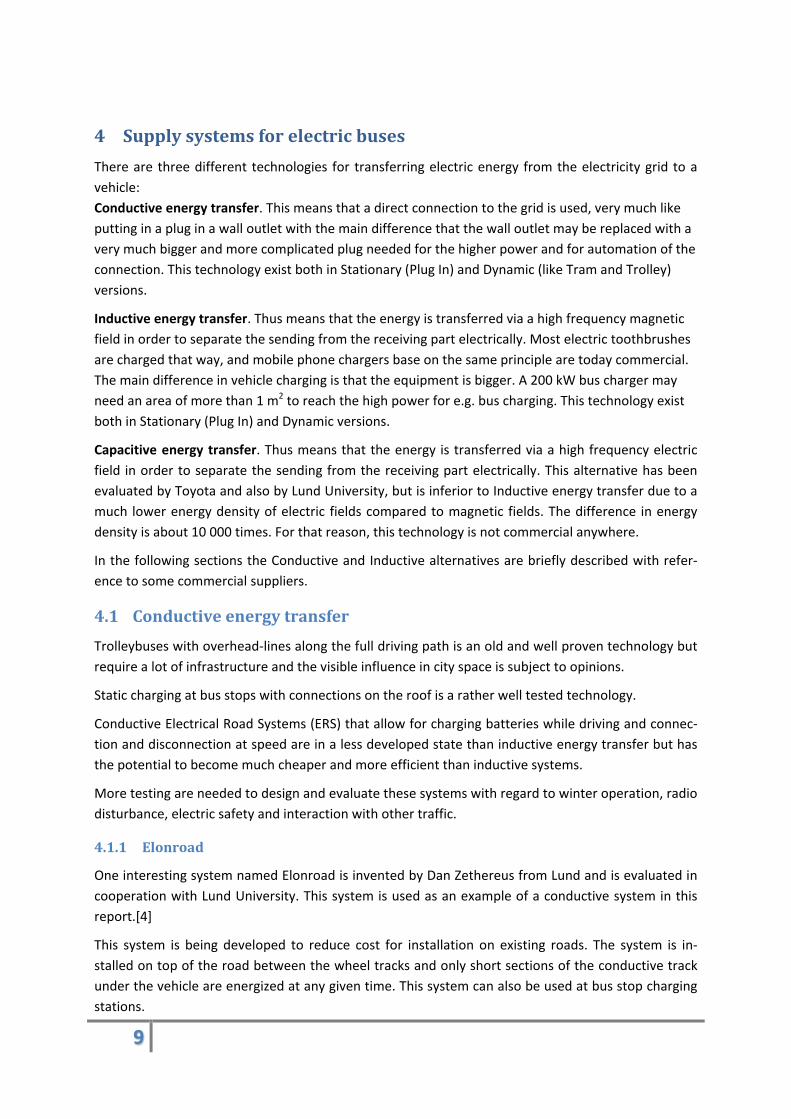
4 Supply systems for electric buses There are three different technologies for transferring electric energy from the electricity grid to a vehicle: Conductive energy transfer. This means that a direct connection to the grid is used, very much like putting in a plug in a wall outlet with the main difference that the wall outlet may be replaced with a very much bigger and more complicated plug needed for the higher power and for automation of the connection. This technology exist both in Stationary (Plug In) and Dynamic (like Tram and Trolley) versions.
Inductive energy transfer. Thus means that the energy is transferred via a high frequency magnetic field in order to separate the sending from the receiving part electrically. Most electric toothbrushes are charged that way, and mobile phone chargers base on the same principle are today commercial. The main difference in vehicle charging is that the equipment is bigger. A 200 kW bus charger may need an area of more than 1 m2 to reach the high power for e.g. bus charging. This technology exist both in Stationary (Plug In) and Dynamic versions.
Capacitive energy transfer. Thus means that the energy is transferred via a high frequency electric field in order to separate the sending from the receiving part electrically. This alternative has been evaluated by Toyota and also by Lund University, but is inferior to Inductive energy transfer due to a much lower energy density of electric fields compared to magnetic fields. The difference in energy density is about 10 000 times. For that reason, this technology is not commercial anywhere.
In the following sections the Conductive and Inductive alternatives are briefly described with refer-ence to some commercial suppliers.
4.1 Conductive energy transfer Trolleybuses with overhead-lines along the full driving path is an old and well proven technology but require a lot of infrastructure and the visible influence in city space is subject to opinions.
Static charging at bus stops with connections on the roof is a rather well tested technology.
Conductive Electrical Road Systems (ERS) that allow for charging batteries while driving and connec-tion and disconnection at speed are in a less developed state than inductive energy transfer but has the potential to become much cheaper and more efficient than inductive systems.
More testing are needed to design and evaluate these systems with regard to winter operation, radio disturbance, electric safety and interaction with other traffic.
4.1.1 Elonroad
One interesting system named Elonroad is invented by Dan Zethereus from Lund and is evaluated in cooperation with Lund University. This system is used as an example of a conductive system in this report.[4]
This system is being developed to reduce cost for installation on existing roads. The system is in-stalled on top of the road between the wheel tracks and only short sections of the conductive track under the vehicle are energized at any given time. This system can also be used at bus stop charging stations.

10
4.1.2 Siemens bus charging system
The other conductive example in this report is the static bus charging system developed by Siemens illustrated in Figure 1. It uses an automatic connector reaching the bus from above, able to provide 300 kW of charging power. This system is used in an operative hybrid bus line in Hamburg; but is being applied in Stockholm, Gothenburg and other cities as well. This system is the most mature stat-ic conductive system known and is thus used as reference in this report.
For bus stops with very short stops the few seconds needed to connect to the charging station will decrease the time available for charging.
Figure 1 An example of a charging system from Siemens. http://www.siemens.com/press/IM2014110115MOEN
4.1.3 Other
Some examples of other systems for electrical roads and bus charging systems are:
• Siemens are developing an ERS solution based on overhead-lines similar to trolleybuses but with pantographs that can connect and disconnect at speed.[5] This is a rather simple system with mainly mature technology but the acceptance of the visual impact in a city application is unclear.
• The Slide In bus system in Landskrona is based directly on trolleybus technology from So-laris/Skoda. Connection can only be done at standstill at e.g. a bus stop.[6]
• Elways AB develops an ERS solution based on conductive power transfer through narrow slits in the road. The solution is tested on a full scale test track and is planned for demonstration on public road during 2016.[7]

11
• Alstom has a solution for operating trams without overhead-lines by using a conductive track on the ground.[8] This is during the last years developed for trucks and buses and public demonstration is due.[1]
• Hybricon have developed a conductive bus stop charging system that charge buses with up to 300 kW through a pick-up system on the roof. This system is in operation in Umeå.[9]
4.2 Inductive energy transfer The inductive energy transfer systems have coils buried below the asphalt that generate magnetic AC fields when a vehicle is charging. This field are captured by a pick-up on the vehicle.
Inductive systems are almost invisible and insensitive to e.g. snow and ice.
4.2.1 Primove
Bombardier have developed a bus stop charging system of 200 kW based on inductive energy trans-fer and are working on extending the system to also be usable in an ERS.[2]
Bus stop charging stations are in operation in Braunschweig.
The Primove system has inspired one of the simulated cases in this report.
4.2.2 Other
A South Korean company called OLEV have developed another inductive power transfer system and have a bus line with an inductive ERS in operation. [10]

12
5 Assumptions in this simulation study A large number of assumptions and approximations are needed to do a study like this the most im-portant ones are presented in this chapter.
5.1 Batteries Batteries are the most limiting component in most electric road vehicles. Most high performance batteries today are based on some lithium chemistry.
Many different combinations of battery performance can be produced for different applications, the main performance parameters are: • Cost [$/kWh]. Estimations of electric vehicle battery costs range from 1 500 SEK/kWh to 10
000 SEK/kWh. Battery cost can be given on cell level or at the system level including packaging cooling and control system. Battery costs have been steadily declining. [11]
In this study a system cost of 4000 SEK/kWh is used as an estimate of the battery cost in all cases except for case “conductive 1” where the current price of 10 000 SEK/kWh is used based on estimated current small scale production price at Volvo. These batteries are also of higher quality and probably have higher cycle life than the assumptions in this report.[12]
• Energy density [kWh/kg].
• Volumetric energy density [kWh/litre]
• Power density, charging/discharging [W/kg]
• Operating life, Number of cycles vs. cycle depth. The main parameter limiting battery life in this application is the cycling between charging and discharging.
A method called Rain flow counting is used to estimate the life of the battery given a simulated sequence of charging and discharging in a specific bus schedule and charging infrastruc-ture.[13]
Batteries in city-bus applications are used very heavily with many charging/discharging cycles. The main concern is therefore lifetime in relation to cost given a charging/discharging cycle. The demands on energy density and power density are less stringent than in many other appli-cations since the battery generally make up a relatively small fraction of the bus mass. There is however potentially problems with mounting large batteries in standard bus designs. Volvo’s plug-in hybrid buses have as an example 76 kWh batteries with a mass of 1400 kg [14] mount-ed on the roof.
In general lithium batteries have much better life if only a small part of the capacity is used regularly. In this study the cycle life curve in figure 2 are used. This curve is representative for normal lithium-ion batteries for vehicle applications.

13
Figure 2 Used relationship between battery cycle depth and battery damage cost. This curve is calculated using a battery price of 4000 SEK/kWh when the assumption 10000 SEK/kWh is used the cost is 2,5 times higher. The life time at 100% cycle depth is 1800 cycles.
This means that either large batteries with low cycle life can be used with small charg-ing/discharging cycles or smaller high quality batteries with high cycle life can be used to achieve a given lifetime. Therefore it can be economic to use larger batteries than technically needed.
The high charging and discharging rates can also shorten the lifespan of the battery; this is not considered in this study.
Batteries also tend to wear more when operated almost full or almost empty, this is not explic-itly modelled in this study but for this reason the batteries in this study is never charged to more than 80 percent of their capacity and deep discharging is avoided in most cases.
In addition to the wear of the batteries due to cycling it is assumed that the batteries have a calendar life of 10 years and that the cost for these degradation modes can be added directly.
• Operating temperature range.
• Fire safety.
• Efficiency [%]
5.2 Reference cases City buses in Lund today operate on natural gas while most buses in the world operate on diesel. Therefore it is interesting to calculate comparable costs for both, to be compared to the cost for electric bus operation.
The total driving distance for all Lund City buses per day are 10 400 km.
0
0,5
1
1,5
2
2,5
0 20 40 60 80 100
Batt
ery
wea
r (SE
K/kW
h)
Cycle depth (%)
Battery cycling cost vs cycling depth
14
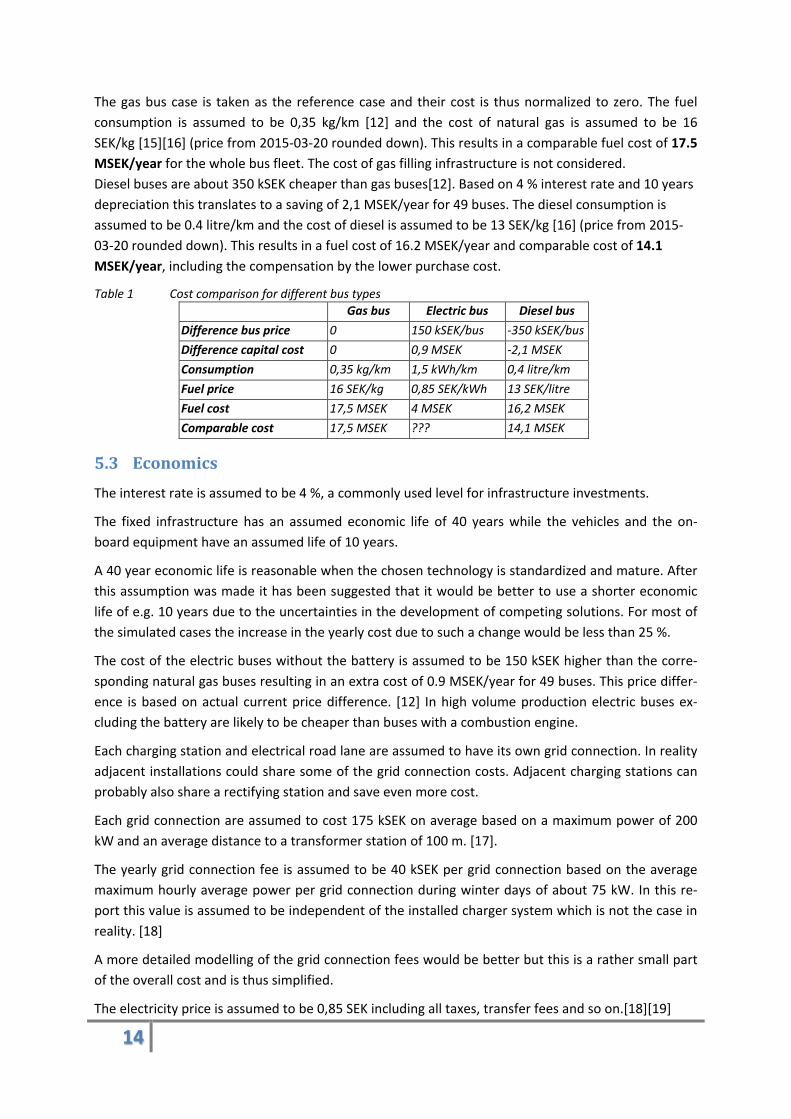
The gas bus case is taken as the reference case and their cost is thus normalized to zero. The fuel consumption is assumed to be 0,35 kg/km [12] and the cost of natural gas is assumed to be 16 SEK/kg [15][16] (price from 2015-03-20 rounded down). This results in a comparable fuel cost of 17.5 MSEK/year for the whole bus fleet. The cost of gas filling infrastructure is not considered. Diesel buses are about 350 kSEK cheaper than gas buses[12]. Based on 4 % interest rate and 10 years depreciation this translates to a saving of 2,1 MSEK/year for 49 buses. The diesel consumption is assumed to be 0.4 litre/km and the cost of diesel is assumed to be 13 SEK/kg [16] (price from 2015-03-20 rounded down). This results in a fuel cost of 16.2 MSEK/year and comparable cost of 14.1 MSEK/year, including the compensation by the lower purchase cost.
Table 1 Cost comparison for different bus types Gas bus Electric bus Diesel bus Difference bus price 0 150 kSEK/bus -350 kSEK/bus Difference capital cost 0 0,9 MSEK -2,1 MSEK Consumption 0,35 kg/km 1,5 kWh/km 0,4 litre/km Fuel price 16 SEK/kg 0,85 SEK/kWh 13 SEK/litre Fuel cost 17,5 MSEK 4 MSEK 16,2 MSEK Comparable cost 17,5 MSEK ??? 14,1 MSEK
5.3 Economics The interest rate is assumed to be 4 %, a commonly used level for infrastructure investments.
The fixed infrastructure has an assumed economic life of 40 years while the vehicles and the on-board equipment have an assumed life of 10 years.
A 40 year economic life is reasonable when the chosen technology is standardized and mature. After this assumption was made it has been suggested that it would be better to use a shorter economic life of e.g. 10 years due to the uncertainties in the development of competing solutions. For most of the simulated cases the increase in the yearly cost due to such a change would be less than 25 %.
The cost of the electric buses without the battery is assumed to be 150 kSEK higher than the corre-sponding natural gas buses resulting in an extra cost of 0.9 MSEK/year for 49 buses. This price differ-ence is based on actual current price difference. [12] In high volume production electric buses ex-cluding the battery are likely to be cheaper than buses with a combustion engine.
Each charging station and electrical road lane are assumed to have its own grid connection. In reality adjacent installations could share some of the grid connection costs. Adjacent charging stations can probably also share a rectifying station and save even more cost.
Each grid connection are assumed to cost 175 kSEK on average based on a maximum power of 200 kW and an average distance to a transformer station of 100 m. [17].
The yearly grid connection fee is assumed to be 40 kSEK per grid connection based on the average maximum hourly average power per grid connection during winter days of about 75 kW. In this re-port this value is assumed to be independent of the installed charger system which is not the case in reality. [18]
A more detailed modelling of the grid connection fees would be better but this is a rather small part of the overall cost and is thus simplified.
The electricity price is assumed to be 0,85 SEK including all taxes, transfer fees and so on.[18][19]

15
5.4 Energy consumption The electricity consumption of electric buses has four parts:
• The electric traction system driving the bus forward.
• On board heat.
• Air-conditioning.
• Everything else: lights control systems, compressors and soon.
During cold days the heating system can consume as much power as the rest of the vehicle. The air-conditioning system is of course only used during hot days and does not consume as much power as the heating system.
Heat can potentially be provided more economical by using some sort of burner so therefore it is treated separately.
Based on discussion with Edward Jobson [12] and data provided by Johan Björnstedt at LTH from the SlideIn project in Landskrona [6] the following average energy consumption figures for electric buses are used.
In the case of no electric heating (heat provided by burner or other system) the total electric power consumption is assumed to be 1.2 kWh/km including air conditioning all days since the air condition unit consumes rather low power.
In the case of electrical heating the average total electric power consumption for heating that is used for economical evaluation is assumed to be 1.5 kWh/km while the simulated system is designed for 2,5 kWh/km in order to handle cold winter days.
In the cases “No electric heat” and “Electric heat 1” the simulated charging power is limited to 150 kW in all cases, which is lower than the technical capability of the charging systems considered. This creates a margin that allow for shorter stops than scheduled and some limitation on the charging rate of the batteries.
The case “Electric heat 2” utilises the full technical capability of the charging systems and require some change in the bus schedule or some other form of operating margin.
Table 2 Total energy consumption, different load cases. No Electric heat Electric heat 1 Electric heat 2 Max energy consumption 1,2 kWh/km 2,5 kWh/km 2,5 kWh/km Average energy consumption 1,2 kWh/km 1,5 kWh/km 1,5 kWh/km Charging power 150 kW 150 kW 300; 200; 240 kW
5.5 Routes, operation etc. The city bus routes number 1, 2, 3, 4, 5, 6, 9 and 21 are modelled as fully electric with unmodified timetables as they were on Thursday 2014-04. A full year is calculated as equivalent to 300 times the traffic on this day. This is reasonable given the lower traffic on weekends and during the summer.
The bus schedule data and position of the bus stops are extracted from a data file provided by Samtrafiken. [20]
In total the buses makes about 1000 trips per day and travel 10 400 km. The bus network contains about 180 bus stops. The maximum number of simultaneous bus trips is 42.
16
The data from Samtrafiken only contains the public schedule, the movements of empty buses from the bus depot to the start of the route and other empty movements of the buses have been sched-uled by an automatic algorithm. This scheduling is independent of the charging system and not opti-mized for electric buses. In total 49 buses are used in the simulation.
The times in the time tables are rounded to full minutes meaning that many bus stops are given as 0 minutes. In the model it is assumed that all bus stops take at least 15 seconds and that all buses stops at every stop.
The bus routes are on straight lines between bus stops to compensate for this the driving distance are increased by a factor of 10 % and a few extra junctions are added manually to make some routes more realistic.
Routes that pass bus stops but do not stop there are also corrected manually.
The altitude of all bus stops are added manually from Google earth.
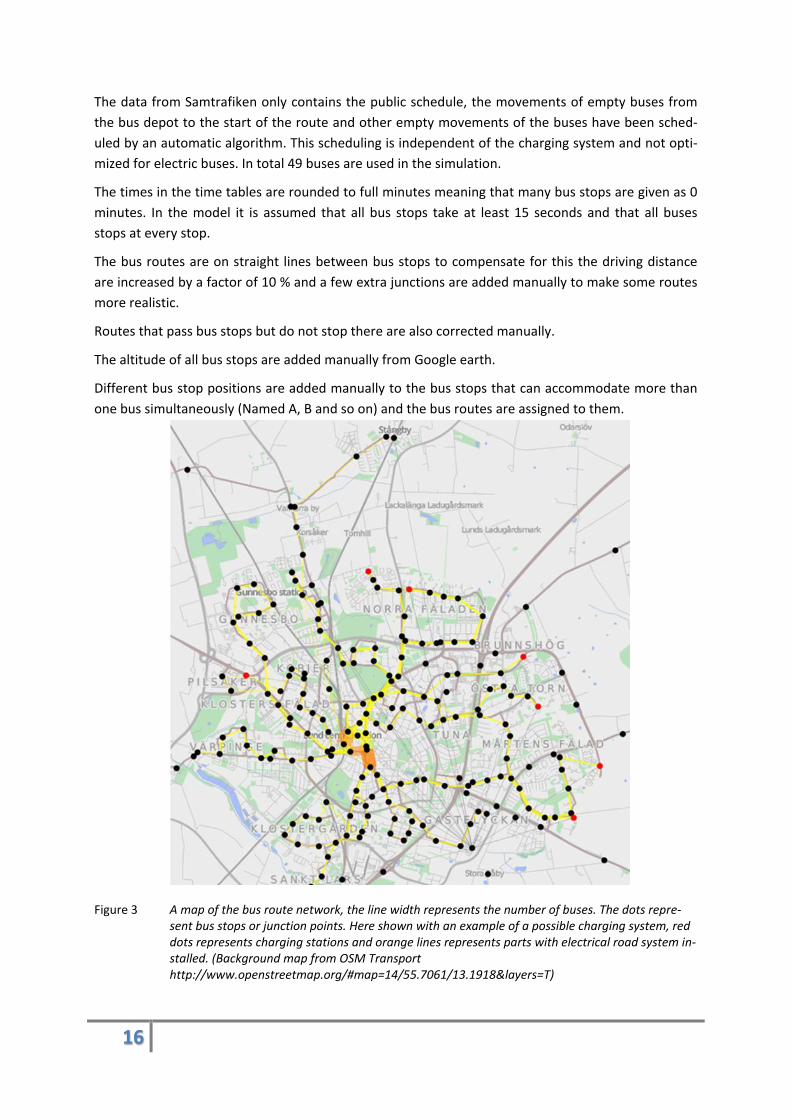
Different bus stop positions are added manually to the bus stops that can accommodate more than one bus simultaneously (Named A, B and so on) and the bus routes are assigned to them.
Figure 3 A map of the bus route network, the line width represents the number of buses. The dots repre-sent bus stops or junction points. Here shown with an example of a possible charging system, red dots represents charging stations and orange lines represents parts with electrical road system in-stalled. (Background map from OSM Transport http://www.openstreetmap.org/#map=14/55.7061/13.1918&layers=T)

17
5.6 Example cases Based on cost estimates by Mats Alaküla (Lund University), Dan Zetheraus (Elonroad) [4] and Edward Jobson (AB Volvo) tree different examples of electric bus systems are simulated. Two of the systems include the possibility to install electrical road systems (ERS) and these are tested with and without ERS giving in total five cases.
These systems are tested with and without electric heating system in the buses. The systems are also tested at their respective full power level with electric heating. This gives totally 15 tested cases.
The following sections describe the example systems.
The different cases are summarized in the table below and described in the following sections
Table 3 Charging system assumptions Conductive 1 Inductive Conductive 2 Charging station 1,5 MSEK 2 MSEK 0,5 MSEK Max Power 300 kW 200 kW 240 kW ERS No 30 MSEK/km 5 MSEK/km Battery price 10 SEK/Wh 4 SEK/Wh 4 SEK/Wh Pick-up and on board system
0 MSEK 1 MSEK 0,3 MSEK
Maintenance 2 % 2 % 4 % Time-frame 1 - 3 years 2 – 5 years 3 – 7 years
5.6.1 Conductive 1
This system is inspired by Siemens bus stop charging system used with hybrid buses from Volvo AB in for example Hamburg.
The prices are based on discussion with Edward Jobson [12] at Volvo and are applicable to a time-frame of about 1- 3 years from now.
The charging stations are capable of transferring 300 kW. (In the real system the power is limited to 85 kW due to uncertainties of the power handling capability of the battery packs.)
This is the most current and reliable case. For this case the current battery price level of 10 kSEK/kWh is used, this is reasonable given the short time-frame but should be kept in mind when interpreting the results. These batteries are highly likely to have better lifespan than the assumptions in this report.
The cost of a charging station is assumed to be 1.5 MSEK. This solution has no ERS solution. The “pick-up” on the vehicle is very simple and no extra cost is assumed.
The maintenance cost of the infrastructure is assumed to be 2 % of the investment per year; this is a typical figure for electric installations.
5.6.2 Inductive
This system is inspired by Bombardiers Primove system. The maximum static charging power transfer is 200 kW.
The prices are probable on a time frame of 2 to 5 years from now.
The cost of a charging station is assumed to be 2 MSEK and the ERS cost to be 30 MSEK/km.
18
The on-board system including pick-up, shielding and power electronics are assumed to cost 1 MSEK.
The battery cost is assumed to be 4 kSEK/kWh, due to the more future time frame.
The maintenance cost of the infrastructure is assumed to be 2 % of the investment per year; this is a typical figure for electric installations.
5.6.3 Conductive 2
This system is inspired by the Elonroad system and the prices mainly based on estimates by Dan Zethereaus, the inventor of this system. This is a conductive solution mounted on the road as a slight bump along the road between the wheels. This gives a very low installation cost since the road does not need to be repaved. This is the concept that is currently least developed and have biggest uncer-tainty and consequently the time frame is about 3 to 7 years from now. The current design power is 240 kW. The charging station is assumed to cost 500 kSEK (including a rectifying station of 400 kSEK). The ERS cost are assumed to be 5 MSEK/km. The on-board system including pick-up and DC/DC con-verter are assumed to cost 300 kSEK.
The battery cost is assumed to be 4 kSEK/kWh due to the more future time frame.
The maintenance cost of the infrastructure is assumed to be 4 % of the investment per year, a higher value than for the other systems are used due to the lower investment cost and some exposed parts.
5.7 Simulator The simulator is written in the programming language Python and simulates all bus movements ac-cording to published bus schedule with a time resolution of 15 seconds. Simulation of 24 hours city bus traffic requires about 10 seconds of CPU-time.

19
6 Charging system optimizer The charging system optimizer works by starting from an initial charging infrastructure and systemi-cally insert and remove charging stations at all possible locations in an order based on an estimate of demand divided by estimated cost. After each change a simulation of the bus traffic during a day is performed and the battery life and yearly total cost is calculated. If the cost is reduced then the change are accepted otherwise it is rejected and the next change are tested.
Each bus stop position can have zero or one charging station and only one bus at a time can charge at a charging station.
Each driving direction along a bus route between bus stops or other modelled junctions are consid-ered a possible location of ERS. ERS installation on only parts of such a distance is not considered.
The computation time for one charging system optimization is less than 10 minutes. During the itera-tions changes to the battery size are also tested.
Since the selection of charging infrastructure is a combinatorial search problem with a very large search space and are likely to be NP-hard the algorithm make a heuristic attempt to minimize the cost but cannot guarantee that the generated solutions are a global minimum.

20
7 Results Fifteen different cases of electrification of the city buses in Lund are optimized.
Five different assumptions on the charging system are tested according to section 5.6 with the two systems that includes electrical road system (ERS) solutions are tested both with and without ERS.
These charging systems are combined with three different operating assumptions according to sec-tion 5.4 giving the fifteen cases in table 4.
It is important to remember that the prices do not reflect the same time of delivery. E.g. Conductive
1 represents a system that could be delivered earlier and where the prices are expected to decrease further if the production series increases.
Table 4 Result summary, the cases shown with borders are described more in detail in the following sec-tions
As seen the yearly cost for the different cases are in the range of 10 to 40 MSEK. The cost increases significantly if electric heating are included, the cost of other heating options are not analysed in detail but are probably less than 2 MSEK/year.
These results indicate that the conductive and inductive bus stop charging solutions that are current-ly in operation are slightly more expensive than gas bus operation (17,5 MSEK/year) while the cheapest solutions would be significantly cheaper.

21
In both the inductive system and in the conductive 2 system the total cost becomes lower if electric road systems are allowed in the solution.
In the following sections three of the cases are being shown in detail, these three cases are selected to show the range of solutions.

Selected case study - Conductive 2
22
7.1 Conductive 2 - No Electric Heating This case give the cheapest system, the charging system distribution is shown in figure 4. This solu-tion could be somewhat too optimistic if the rather small battery size limits the possible charging power.
Figure 4: Bus charging system optimized for the case with no electric heating and the conductive 2 system with ERS. The line width represents the number of buses. The dots represent bus stops or junction points. Red dots represents charging stations and orange lines represents parts with electrical road system installed.

Selected case study - Conductive 2
23
Figure 5 The composition of the yearly costs
Figure 6 The total investment to get this system, the cost for buses are given as the additional cost com-pared to gas buses.
The lanes with electrical road system installed are: • Lund Clemenstorget –
Lund Centralstation • Lund Botulfsplatsen - Lund Domkyrkan
• Lund Bankgatan - Lund Botulfsplatsen • Lund Domkyrkan - Lund Botulfsplatsen • Lund Bantorget - Lund Domkyrkan
The bus stop charging stations are at: (Charging are only possible at one position at the bus stops.) • Lund Ringhornegränd • Lund Jordabalksvägen • Lund Runslingan • Lund Annehem
• Lund Flygelvägen • Lund Solbjer • Lund Fjelierondellen
In this simulated case the 49 batteries are exposed to 2476 charging cycles per day, ignoring the small cycles from regenerative breaking. (Figure 7) The total charging energy is 12 MWh equivalents to 210 full charging cycles. (Figure 8)
This result in damages that on average requires 1.1 kWh of batteries to be replaced each day, with a value of 4408 SEK or a full battery pack replaced every period of 51 days according to the used bat-tery damage model over the full bus fleet, see Figure 9.
It can clearly be seen that the deeper cycles causes more damage in relation to the number of cycles and the charging energy.

Selected case study - Conductive 2
24
Figure 7: The number of charging cycles of different depth during a day.
Figure 8: The total charging energy vs. charge cycle depth.
Figure 9: The battery damage cost during a day for charging cycles of different depth.

Selected case study - Conductive 2
25
Figure 10: State of charge over the day for a few of the buses in the simulation. The green bus run a small deficiency each bus trip during the morning traffic.
Figure 11: The total load on the grid for all charging stations and electrical roads in the system. The blue line is instantaneous values while the red line is hourly averages.
Figure 12: The charging power at a typical charging station. The blue line is instantaneous values while the red line is hourly averages. The grid connection fee is based on the highest hourly average.

Selected case study - Conductive 2
26
Figure 13: The total power on a typical lane of electrical road system. This lane is 330 meter long. The blue line is instantaneous values while the red line is hourly averages.

Selected case study – Inductive
27
7.2 Inductive power transfer – Electric heating 2
Figure 14: Bus charging system optimized for the case with electric heating and the inductive system with ERS. The line width represents the number of buses. The dots represent bus stops or junction points. Red dots represent charging stations and orange lines represents parts with electrical road system installed.
Due to the higher energy consumption on winter days (electric heating) significantly more electric road system is needed in this case, see figure 14.

Selected case study – Inductive
28
Figure 15: The composition of the yearly costs
Figure 16: The total investment to get this system, the cost for buses are given as the additional cost com-pared to gas buses.
The combination of more expensive pick-up on the buses and more expensive infrastructure compo-nents with the higher energy demand during winter days increases the needed investments and capi-tal cost, see figure 15 and 16. Since the system operates at a fraction of maximum load most of the days the electricity cost and battery damage cost are a relatively small fraction of the costs.

Selected case study – Inductive
29
The lanes with electrical road system installed are:
• Lund Clemenstorget - Lund Centralstation
• Lund Lundagård - Lund Åke Hans • Lund Allhelgonakyrkan -
Lund Åke Hans • Lund Botulfsplatsen - Lund Domkyrkan • Lund Bankgatan - Lund Botulfsplatsen • Lund Gunnesbo centrum -
Lund Alfa-Laval Gunnesbo • Lund Polishuset - Lund Bantorget
• (Kung Oskars Väg, Getingevägen) - Lund Univ-sjukhuset
• Lund Allhelgonakyrkan - (Kung Oskars Väg, Getingevägen)
• Lund Centralstation - Lund Bantorget • (Getingevägen Baravägen) -
Lund Univ-sjukhuset • Lund Domkyrkan - Lund Botulfsplatsen • Lund Bantorget - Lund Domkyrkan
The bus stop charging stations are at: (Charging are only possible at one position at the bus stops.)
• Lund Centralstation position K • Lund Univ-sjukhuset position A • Lund Ringhornegränd • Lund S:t Lars • Lund Jordabalksvägen • Lund Botulfsplatsen position A • Lund Runslingan
• Lund Hubertusparken • Lund Annehem • Lund Flygelvägen • Stångby station • Lund Solbjer • Lund Brandstationen • Lund Fjelierondellen
7.2.1 Average day
In this simulated case during an average day the 49 batteries is exposed to 3411 charging cycles per day, ignoring the small cycles from regenerative breaking.(Figure 17) The total charging energy is 14 MWh equivalent to 119 full charging cycles.(Figure 18)
This result in damages that on average requires 0.7 kWh of batteries to be replaced each day, with a value of 2613 SEK or a full battery pack replaced every period of 184 days according to the used bat-tery damage model over the full bus fleet. (Figure 19) Due to the fact that the charging system are dimensioned for the higher winter day load the discharging/charging cycles have very low cycle depth.
Figure 17: The number of charging cycles of different depth during a day.

Selected case study – Inductive
30
Figure 18: The total charging energy divided up based on the charge cycle depth.
Figure 19: The battery damage cost during a day for charging cycles of different depth.
Figure 20: State of charge over the day for a few of the buses in the simulation.

Selected case study – Inductive
31
Figure 21: The total load on the grid for all charging stations and electrical roads in the system. The blue line is instantaneous values while the red line is hourly averages.
Figure 22: The charging power at a typical charging station. The blue line is instantaneous values while the red line is hourly averages. The grid connection fee is based on the highest hourly average.
Figure 23: The total power on a typical lane of electrical road system. This lane is 330 meter long. The blue line is instantaneous values while the red line is hourly averages.

Selected case study – Inductive
32
7.2.2 Winter day In this simulated case the 49 batteries was exposed to 3393 charging cycles per day, ignoring the small cycles from regenerative breaking. (Figure 24) The total charging energy was 22 MWh equiva-lent to 185 full charging cycles.(Figure 25)
This resulted in damages that on average requires 1.7 kWh of batteries to be replaced each day, with a value of 6828 SEK or a full battery pack replaced every period of 70 days during the winter accord-ing to the used battery damage model over the full bus fleet. (Figure 26)
It can clearly be seen that the deeper cycles causes more damage in relation to the number of cycles and the charging energy.
Figure 24: The number of charging cycles of different depth during a day.
Figure 25: The total charging energy divided up based on the charge cycle depth.
Figure 26: The battery damage cost during a day for charging cycles of different depth.

Selected case study – Inductive
33
Figure 27: State of charge over the day for a few of the buses in the simulation. The green and blue buses run a small deficiency each bus trip.
Figure 28: The total load on the grid for all charging stations and electrical roads in the system. The blue line is instantaneous values while the red line is hourly averages.
Figure 29: The charging power at a typical charging station. The blue line is instantaneous values while the red line is hourly averages. The grid connection fee is based on the highest hourly average.

Selected case study – Inductive
34
Figure 30: The total power on a typical lane of electrical road system. This lane is 330 meter long. The blue line is instantaneous values while the red line is hourly averages.

Case Study – Conductive 1
35
7.3 Conductive 1 - Electric heat 2
Figure 31: Bus charging system optimized for the case with no electric heating and the conductive 2 system with ERS. The line width represents the number of buses. The dots represent bus stops or junction points. Red dots represents charging stations and orange lines represents parts with electrical road system installed.
This describes the conductive system inspired by the Siemens charging station and represents the most ready technology, therefore the current battery price of 10 kSEK/kWh are used in this case ra-ther than 4 kSEK/kWh used in the calculations for the other systems. This is important to remember when comparing the results. This case includes electric heat and assume that the full 300 kW of the charging station can be used, this assumption give lower margins for missed charging opportunities due to delays, limitations in the batteries or faulty charging stations. The high number of required charging stations, 50 in this case, is necessary to get enough charging time during winter days. Small changes in the bus schedule could reduce the number of charging stations significantly. One minute

Case Study – Conductive 1
36
more at the end stop would reduce the number of charging stations along the bus line with four since most bus stops are assumed to be 15 seconds. No economic evaluation of these options has been done since it is outside the scope of this study. The higher bus stop charger cost and battery cost is shows in figure 33.
Figure 32: The composition of the yearly costs
Figure 33: The total investment to get this system, the cost for buses are given as the additional cost com-pared to gas buses.

Case Study – Conductive 1
37
The bus stop charging stations are at: (Unless noted otherwise charging are only possible at one posi-tion at the bus stops.)
• Lund Allhelgonakyrkan position A and B
• Lund Annehem • Lund Bankgatan position E • Lund Bantorget • Lund Beslutsgränden • Lund Blåtungavägen • Lund Botulfsplatsen position A, B, C
and D • Lund Brandstationen • Lund Centralstation position B, C and
K • Lund Clemenstorget • Lund Delfinen • Lund Domkyrkan • Lund Esplanaden (Both directions) • Lund Fjelierondellen • Lund Flygelvägen • Lund Gambro • Lund Gunnesbo Gård
• Lund Hubertusparken • Lund Jordabalksvägen • Lund Klosters Fälad • Lund Kämnärsvägen • Lund Lindebergska (Both directions) • Lund Lundagård (Both directions) • Lund Polishuset • Lund Ringhornegränd • Lund Runslingan • Lund S:t Lars • Lund Smörlyckan (Both directions) • Lund Solbjer • Lund Stadsbiblioteket • Lund Univ-sjukhuset position A and C • Lund Utsättaregränden • Lund Victoriastadion position A and B • Lund Vikingavägen V • Lund Värpinge by • Lund Åke Hans (Both directions) • Stångby station
7.3.1 Average day
In this simulated case the 49 batteries was exposed to 8091 charging cycles per day, ignoring the small cycles from regenerative breaking. (Figure 34) The total charging energy was 19 MWh equiva-lent to 187 full charging cycles. (Figure 35) The high number of charging cycles is expected given the high number of charging stations.
This resulted in damages that on average requires 0.9 kWh of batteries to be replaced each day, with a value of 9024 SEK or a full battery pack replaced every period of 111 days according to the used battery damage model over the full bus fleet.(Figure 36)
Figure 34: The number of charging cycles of different depth during a day

Case Study – Conductive 1
38
Figure 35: The total charging energy divided up based on the charge cycle depth.
Figure 36: The battery damage cost during a day for charging cycles of different depth.
Figure 37: State of charge over the day for a few of the buses in the simulation.
Case Study – Conductive 1
39
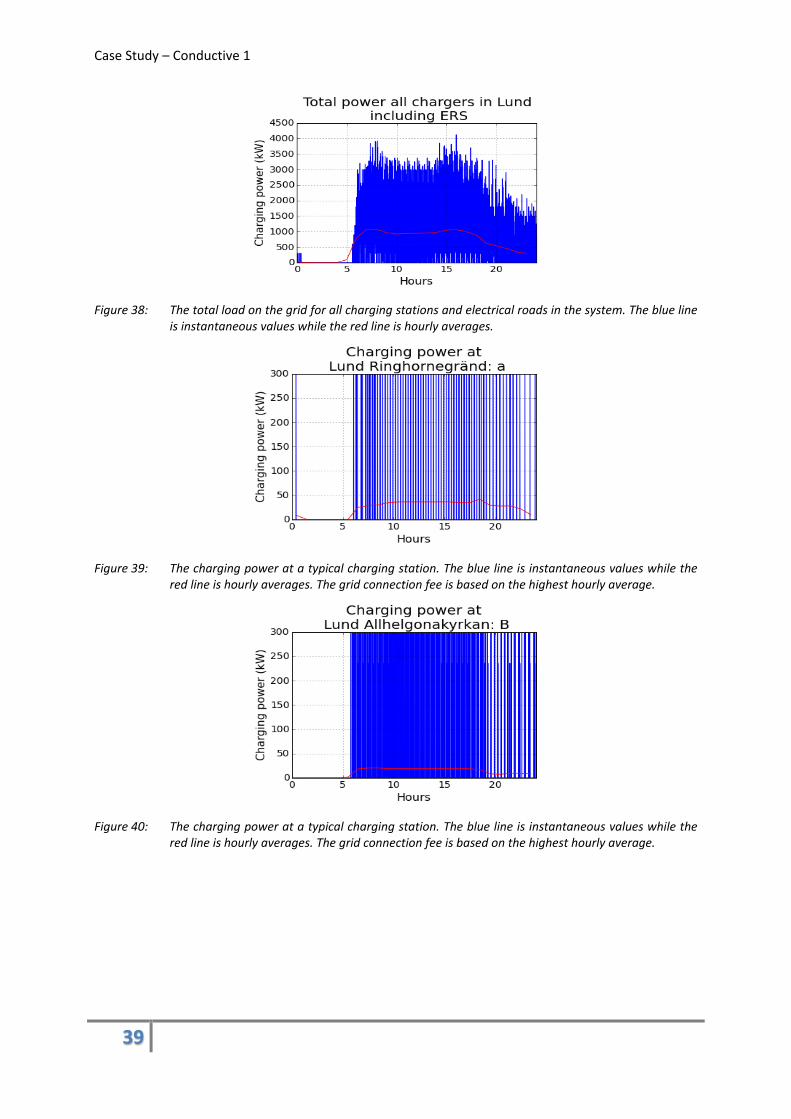
Figure 38: The total load on the grid for all charging stations and electrical roads in the system. The blue line is instantaneous values while the red line is hourly averages.
Figure 39: The charging power at a typical charging station. The blue line is instantaneous values while the red line is hourly averages. The grid connection fee is based on the highest hourly average.
Figure 40: The charging power at a typical charging station. The blue line is instantaneous values while the red line is hourly averages. The grid connection fee is based on the highest hourly average.
Case Study – Conductive 1
40
7.3.2 Winter day
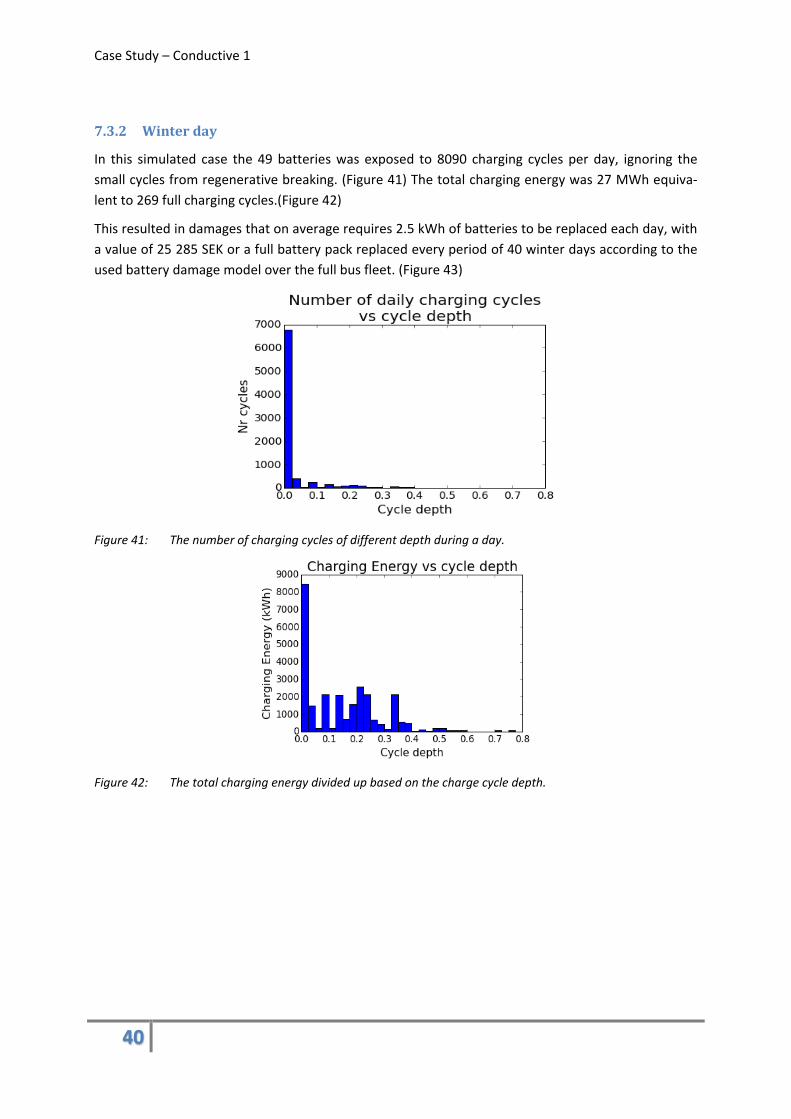
In this simulated case the 49 batteries was exposed to 8090 charging cycles per day, ignoring the small cycles from regenerative breaking. (Figure 41) The total charging energy was 27 MWh equiva-lent to 269 full charging cycles.(Figure 42)
This resulted in damages that on average requires 2.5 kWh of batteries to be replaced each day, with a value of 25 285 SEK or a full battery pack replaced every period of 40 winter days according to the used battery damage model over the full bus fleet. (Figure 43)
Figure 41: The number of charging cycles of different depth during a day.
Figure 42: The total charging energy divided up based on the charge cycle depth.

Case Study – Conductive 1
41
Figure 43: The battery damage cost during a day for charging cycles of different depth.
Figure 44: State of charge over the day for a few of the buses in the simulation. The green and blue buses run a small deficiency each bus trip.
Figure 45: The total load on the grid for all charging stations and electrical roads in the system. The blue line is instantaneous values while the red line is hourly averages.

Case Study – Conductive 1
42
Figure 46: The charging power at a typical charging station. The blue line is instantaneous values while the red line is hourly averages. The grid connection fee is based on the highest hourly average.
Figure 47: The charging power at a typical charging station. The blue line is instantaneous values while the red line is hourly averages. The grid connection fee is based on the highest hourly average.

43
7.4 Heating As seen the on board electric heating can increase the cost much. From both an economic and envi-ronmental point of view it is probably better to use a fuel based on board heater, e.g. a gas heater. The fuel to heating system would probably cost less than 2 MSEK/year.1 The additional cost of such a system is not investigated in this project but it should be rather cheap. Depending on prices and oth-er factors a mix of fuel-based end electric heat can of course be used.
On cold days when the heat are needed the total demand for electrical power are high and therefore are the electricity price high and power plants with high marginal cost e.g. fossil fuel based thermal power plants are operating. From an environmental point of view it is therefore good to reduce the power consumption during these days.
An interesting alternative to a pure gas heater would be to have a small (e.g. 20 kW electric power) combustion engine with a generator optimized for heat generation by applying insulation to mini-mize heat losses and using heat exchangers to extract heat from the exhaust. This would decrease the power consumptions on cold days even more. It would also act as an emergency range extender that could make it possible to continue operation in some cases where changes in scheduling or fail-ure in charging system or battery would otherwise that impossible.
Another possibility is to use cheaper more environmentally friendly fuel such as wood pellets. This would probably require some development of burners and so on.
Better insulation of the vehicles would of course be better but most of the heat is probably lost through the doors.
Waste heat recovery from the drive-train could potentially give a minor contribution but due to the high efficiency this is rather minor.
1) The average heat consumption in the slidein bus in Landskrona was 0,45 kWh/km, that gives 1400 MWh
yearly heat consumption. The cost of natural gas for vehicles is about 1,2 SEK/kWh giving a yearly cost of 1,7 MSEK

44
8 Conclusions and discussion The development of bus stop charging systems is in an early phase of commercialization. Current systems (Conductive 1, Inductive) do not or just barely seem to be able to compete with gas and diesel on only cost according to the assumptions in this study. Accounting for expected future cost reduction on batteries and full electric vehicles and charging systems, a full electric bus fleet is likely to be very competitive based on cost only.
Electric buses give also other benefits such as potentially lower environmental impact, cleaner air and less acoustic noise.
Minor adjustments in the scheduling of the buses, e.g. a few more minutes at the end-stops could potentially reduce the needed investments significantly. This would however generate other costs since more buses and drivers are probably needed to operate the system, and this is not calculated in this report.
In a full bus-line network such as in Lund a small installation of electrical road systems (ERS) on the most heavily used streets seems to be economically favorable in all cases that are considered in this study.
Electrical road system installations could also potentially be used by more categories of vehicles than only buses, e.g. City distribution, Taxi or Refuse trucks.
The inductive system is almost invisible and have few parts exposed to wear and should work reliably in all weather conditions. Stationary charging is currently being tested in real buss traffic.
Conductive systems are generally cheaper but can potentially be more sensitive to weather. The safety against electric shocks also needs to be considered, but is proven very safe with Tram-variants of similar technology.
More flexible conductive systems suitable both for bus-stop charging and use on electrical road sys-tems are being developed but are not proven in public operation yet.
The different charging systems can be mounted on different vehicles from different manufacturers but no standard interfaces exist yet, so this is a rather complicated process. In many cases it is prob-ably possible to mount pickups for more than one system on one and the same vehicle or charging systems for more than one system on the same bus stop to handle incompatible systems, but that will introduce extra costs. Even if it turns out that the system initially chosen is not the most econom-ical to continue with, the investments in grid connection, electric buses and batteries can still be uti-lized.
Standardized systems would be preferred and are necessary in order for automatic charging and ERS to be useful for vehicles in general traffic. Since several incompatible systems are under development and need operational experience in order to asses them, standardization will probably not happen soon.
Another large uncertainty are the price development on battery, currently battery packs for electric buses are rather expensive due to low volume production and high requirements on expected life-time. At the same time the prices on battery cells and battery packs to electric cars are falling rapidly.

45
On-board battery driven resistive electric heat can make the system much more expensive due to higher demand on charging system and battery. It is probably more economical and better for the environment to combine the electric drive-train with either a pure fuel based heater or a heat opti-mized range extender.
It seems important to minimize the needed investments on-board the buses due to shorter amortiza-tion period than on the infrastructure and a large number of vehicles.
All together it seems that with a few adjustments in the time table and fuel-based heaters electric bus systems could be an economical alternative in the near future.

46
9 Further work Some of the areas that could be improved in the future include:
Improve battery modeling and include damage generated by fast charging and the limited charging rate on batteries.
In order to get better data on where the buses spend time and hence where the best charging oppor-tunities are, GPS tracking data could be used.
Verify and update cost estimates and other assumptions.
Try to get price estimations and data on more competing systems in different time-frames.
Include the time needed to connect and disconnect from the different systems in the modeling.
Improve the modeling of grid connection costs.
Study bus networks in other cities.

47
10 References 1: Olsson, O., Slide-in Electric Road System, Conductive project report, Phase 1,
2014,Swedish ICT Viktoria
2: Olsson, O., Slide-in Electric Road System, Inductive project report, Phase 1, 2014,Swedish ICT Viktoria
3: EMC and safety studies on electric road systems, http://hybridfordonscentrum.se/project/emc-and-safety-studies-on-electric-road-systems/,
4: El on road webpage, http://elonroad.com/, Accessed 2015-04-16
5: http://www.siemens.com/innovation/apps/pof_microsite/_pof-fall-2012/_html_en/electric-trucks.html
6: http://www.slidein.se
7: http://elways.se/
8: http://www.alstom.com/products-services/product-catalogue/rail-systems/Infrastructures/products/aps-ground-level-power-supply/
9: http://hybricon.se
10: olevtech.com
11: Björn Nykvist, Måns Nilsson, Rapidly falling costs of battery packs for electric vehicles, 2015, http://www.nature.com/nclimate/journal/v5/n4/full/nclimate2564.html, doi:10.1038/nclimate2564
12: Edward Jobson, Personal communication 2015-03-20
13: C.H. McInnes, P.A. Meehan, , Equivalence of four-point and three-point rainflow cy-clecounting algorithms, 2008, http://www.sciencedirect.com/science/article/pii/S0142112307001119, doi:10.1016/j.ijfatigue.2007.03.006
14: Batteriet är Volvos största utmaning , http://www.nyteknik.se/tekniknyheter/article3877179.ece
15: Fordonsgaspris , http://www.kraftringen.se/Foretag/Fordonsgas/Priser/
16: Drivmedel , http://www.okq8.se/pa-stationen/drivmedel/
17: Håkan Skarrie, Kraftringen, Personal communication, 2014
18: Elnätsavgifter för lågspänning , http://www.kraftringen.se/Foretag/El/Elnat/Elnatsavgifter/Prislista-Syd/Elnatsavgifter-lagspanning-/

48
19: Bästa elpriser just nu: Bundet 5 år , https://www.elprisguiden.se/elpriser/lista/bundet+elpris+5+ar
20: https://www.trafiklab.se/api/gtfs-sverige/dokumentation-0