fuente nueva waste audit - appropedia · 0 it fuente nueva waste audit fall 2013 the purpose of...
TRANSCRIPT

0
FUEN
TE N
UEV
A W
AST
E A
UD
IT
FUENTE NUEVA
WASTE AUDIT FALL 2013
The purpose of this project is reducing Fuente Nueva Charter School’s carbon and waste
footprint by educating the children and getting the administration and students involved.

1
FUEN
TE N
UEV
A W
AST
E A
UD
IT
Table of Contents
1) Abstract/ Purpose……………………………………………………………………… 3
2) Planning………………………………………………………………………………... 4
a) Phase 1- Preliminary Phase
b) Phase 2- Life Cycle Analysis
c) Phase 3- Teams
d) Phase 4- Implementation
e) Conclusion
3) Waste Education Lesson Plan……………………………………………………….... 9
a) The full layout for a waste education lesson plan:
i) Time duration for lesson plan
ii) Overview of lesson plan
iii) Objectives and goals
iv) Vocabulary
v) Materials
vi) Introduction
vii) Activities and procedures
viii) Assessment
ix) Conclusion
x) Homework and Take-home Projects
b) Fun facts about Recycling
c) Where our waste goes
i) Sanitary Landfills
ii) Composting
iii) Recycling
d) Letter template to parents for “Waste-Free Lunch Day”
4) Physical Infrastructure Plan………………………………………………………… 18
a) Introduction
b) Bin Materials for Recycling and Compost
i) Recycling: Type, Cost, Where to buy
ii) Compost: Type, Cost, Where to buy
c) Bins: Waste Separation, Disposal, and Locations
i) Waste Separation
ii) Disposal
iii) Compost Bin Location
d) Signage: Infrastructure and Design
i) Infrastructure of signs
ii) Design
(1) How to make signs persuasive
(2) How to make signs easy to understand
(3) How to make signs look nice
(4) Bilingual Option
e) Getting the kids involved: Ideas for FNCS and participation
i) Ideas
ii) Participation
iii) References
iv) Cost Effectiveness of the Physical Infrastructure Plan Implementation
5) Conclusion & Discussion
a) Total emissions saved
b) Discussion on effectiveness

2
FUEN
TE N
UEV
A W
AST
E A
UD
IT
Abstract
In an effort to reduce and divert the waste products at Fuente Nueva
Charter School, a waste audit was performed by students at Humboldt State
University determining the waste profile generated by the school in the fall
of 2013. This project aims to significantly reduce the school’s environmental
impact, while simultaneously educating and engaging the students within it.
The project includes a description of the current waste removal system, as
well as an analysis of the waste generated by the students and staff.
Additionally, the impact analysis section provides a detailed report on the
total amount of waste items produced and the embedded energy and CO2
emissions associated with each item. Finally, the report contains effective
suggestions for constructing the physical infrastructure needed to make the
system successful, including lesson plans, educational signage, and
composting facilities.

3
FUEN
TE N
UEV
A W
AST
E A
UD
IT
Planning
During the fall of 2013, students enrolled in ENGR 308, Technology and the
Environment, undertook a project to assist Fuente Nueva Charter School in creating a plan to
reduce their waste by diverting recyclable materials, as well as compostable items, away from
the landfill. This document serves to provide the steps that were taken by the ENGR 308
students.
Phase 1 – Preliminary Phase
The ENGR 308 students initially conducted research and gathered peer-reviewed articles
on similar projects and policies. The students then conducted a waste audit at Fuente Nueva
Charter School on November 14, 2013. They evaluated one week’s worth of waste from all
students and staff and sorted the waste into categories. This waste was sorted into six categories:
paper compost, food compost, commercial compost, garbage, recycling, and odd items.
The categories were determined based on whether the materials could be recycled or
composted. Compostables were split into three categories; industrial compost, paper compost
and food compost. The industrial compost category consists of products that require regular
turning, higher temperatures, and higher moisture levels to break down the items. The paper
compost category consists of easier to break down paper products including napkins, paper
towels, tissues, and paper food trays. The food compost category consists of food products that
can be easily composted. The garbage category consists of non-reusable materials that are
destined for the landfill. The recycling category consists of materials that are able to be recycled
4
FUEN
TE N
UEV
A W
AST
E A
UD
IT
including milk cartons, yogurt cups, mixed office paper, cans, bottles, glass, aluminum foil, and
cardboard. The odd items category consists of items that were still usable including a key hanger,
particle board, and miscellaneous art projects.
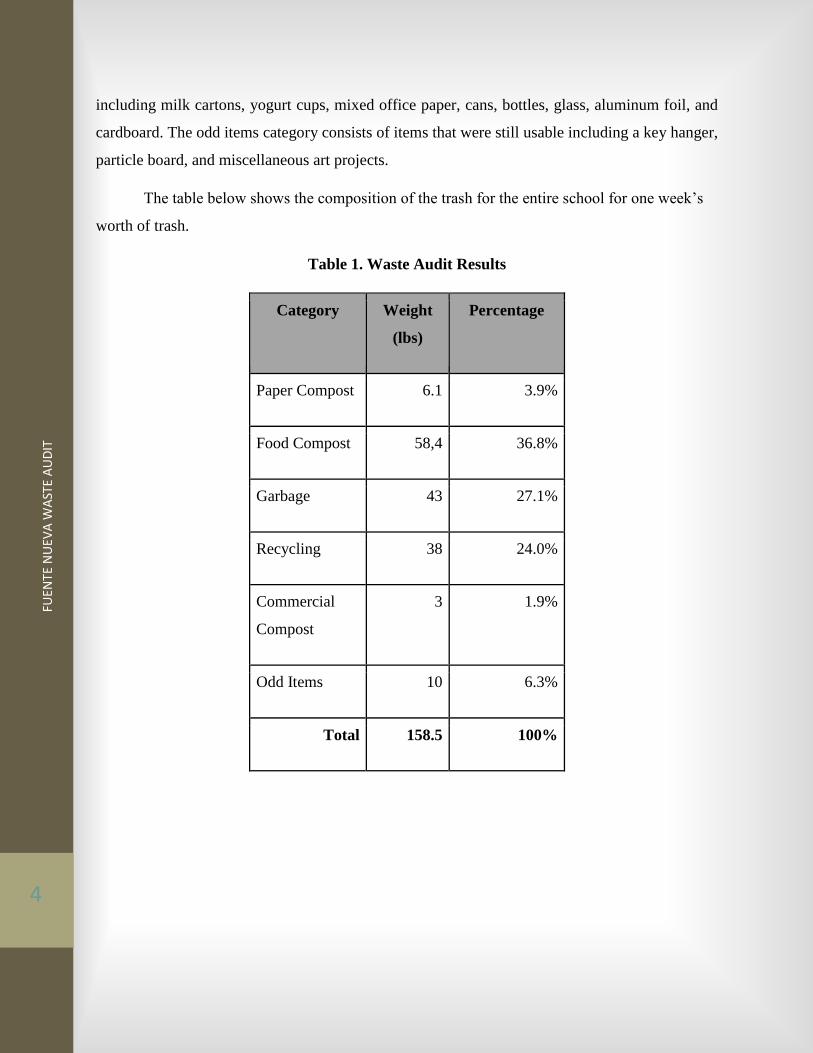
The table below shows the composition of the trash for the entire school for one week’s
worth of trash.
Table 1. Waste Audit Results
Category Weight
(lbs)
Percentage
Paper Compost 6.1 3.9%
Food Compost 58,4 36.8%
Garbage 43 27.1%
Recycling 38 24.0%
Commercial
Compost
3 1.9%
Odd Items 10 6.3%
Total 158.5 100%
5
FUEN
TE N
UEV
A W
AST
E A
UD
IT
Phase 2 - Lifecycle Analysis
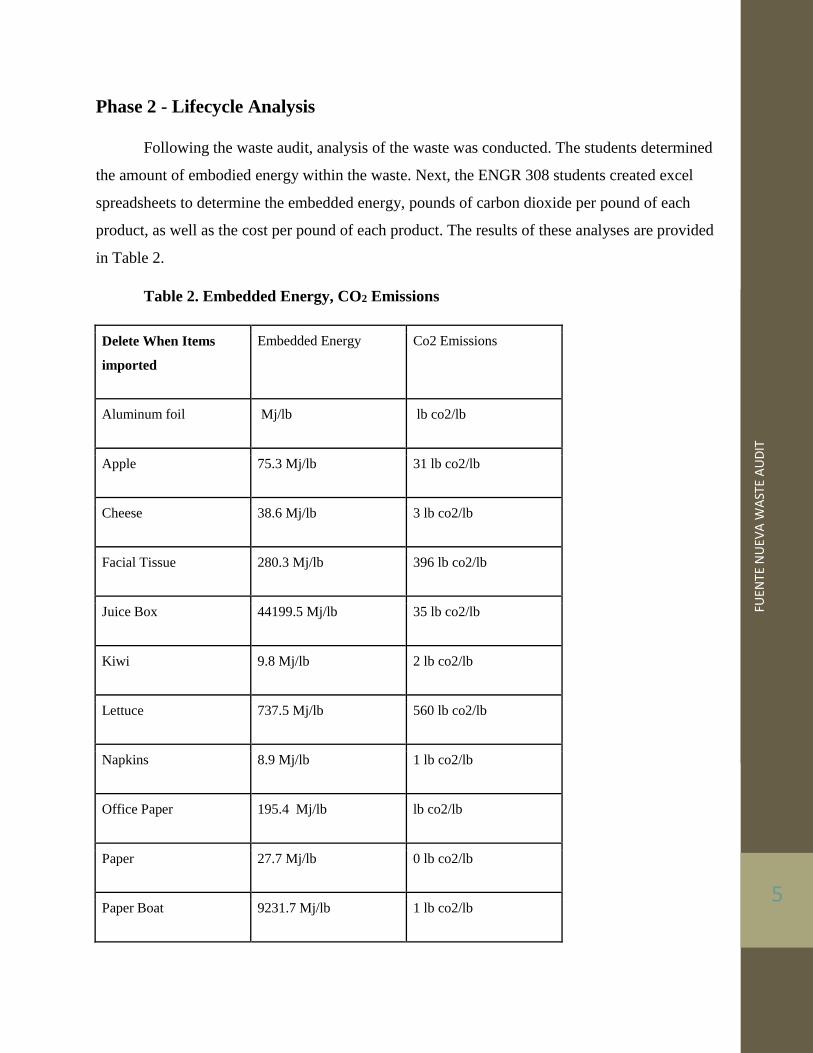
Following the waste audit, analysis of the waste was conducted. The students determined
the amount of embodied energy within the waste. Next, the ENGR 308 students created excel
spreadsheets to determine the embedded energy, pounds of carbon dioxide per pound of each
product, as well as the cost per pound of each product. The results of these analyses are provided
in Table 2.
Table 2. Embedded Energy, CO2 Emissions
Delete When Items
imported
Embedded Energy Co2 Emissions
Aluminum foil Mj/lb lb co2/lb
Apple 75.3 Mj/lb 31 lb co2/lb
Cheese 38.6 Mj/lb 3 lb co2/lb
Facial Tissue 280.3 Mj/lb 396 lb co2/lb
Juice Box 44199.5 Mj/lb 35 lb co2/lb
Kiwi 9.8 Mj/lb 2 lb co2/lb
Lettuce 737.5 Mj/lb 560 lb co2/lb
Napkins 8.9 Mj/lb 1 lb co2/lb
Office Paper 195.4 Mj/lb lb co2/lb
Paper 27.7 Mj/lb 0 lb co2/lb
Paper Boat 9231.7 Mj/lb 1 lb co2/lb

6
FUEN
TE N
UEV
A W
AST
E A
UD
IT
Milk carton 6640 Mj/lb 633 lb co2/lb
Rice 9.8 Mj/lb 3 lb co2/lb
Other Compost (Too much variety to
calculate) Mj/lb
(Too much variety to
calculate) lb co2/lb
Paper Folder 1999.6 Mj/lb 94254 lb co2/lb
Paper Pail 21936.7 Mj/lb 6764 lb co2/lb
Trash Bags 600945.8 Mj/lb 97570 lb co2/lb
Yogurt Cups 0.1 Mj/lb lb co2/lb
Phase 3 - Teams
The class was separated into teams based on the skills and interests of the ENGR 308
students.
Meta Team – This team is responsible for evaluating the summation of embedded
energy reports, confirming findings, and creating an aggregate of what was found.
Education Team – This team is responsible for creating lesson plans that refer to life
cycle analysis for compost and recycling activities. These activities will portray the importance
and of recycling and composting.
Infrastructure Team – This team will examine materials and logistics. Analyze optimal
bin locations and form. They will also look at prices and conduct a purchasing plan. Ideally each
classroom, as well as all the common areas, will receive a blue recycling bin as well as one five-
gallon bucket for compostable materials.
Planning Team – This team will provide grant language, as well as create an
accumulated review/report of what has been done and what needs to be done.

7
FUEN
TE N
UEV
A W
AST
E A
UD
IT
Phase 4: Implementation
The implementation process includes purchasing standard bins and providing them to
each classroom and common area. The recycling bins will consists of ten blue “Slim Jim Bins”
and the compost bins will consist of ten five-gallon bins. These bins will be constant and
uniform throughout the school to ensure that students and staff can properly dispose of waste
throughout the school. The estimated cost of the bins is estimated at $393.00 before shipping
(Table 3).
Table 3. Proposed Infrastructure Costs
Item Number Cost($) Total($)
Slim Jim Tall Can 10 $33.99 $339.90
5 Gallon Can 10 $5.29 $52.90
Total $393.00
The implementation process will also consist of educating the Fuente Nueva students on
the aspects of waste reduction. The education group will provide a workshop to encourage the
students to learn about how recycling and composting work.
Through a properly conducted recycling education program, which will meet Education
and the Environment Initiative standards, we estimate that 50% of the waste generated by Fuente
Nueva students and staff can be diverted from landfills. This will result in reduced spending
from the school for their weekly waste collection.

8
FUEN
TE N
UEV
A W
AST
E A
UD
IT
Table 4. Current and Proposed Spending on Waste Services
Service Level Solid
Waste
Recycling
Service
Service
Cost1
Number of
Bins
Cost per
Month
Current 60 Gallon Can
Weekly Service
90 Gallon Totes
Weekly
$48.74 per
Month 4 $194.96
Proposed 60 Gallon Can
Weekly Service
90 Gallon Totes
Weekly
$48.74 per
Month 2 $97.48
1Retrieved from: cityofarcata.org/departments/environmental-services/garbage-recycling
With proper implementation, Fuente Nueva Charter School could reduce the cost of
disposing their waste by $97.48 a month. With the proposed infrastructure costs of $393.00, the
project would pay itself off in five months.
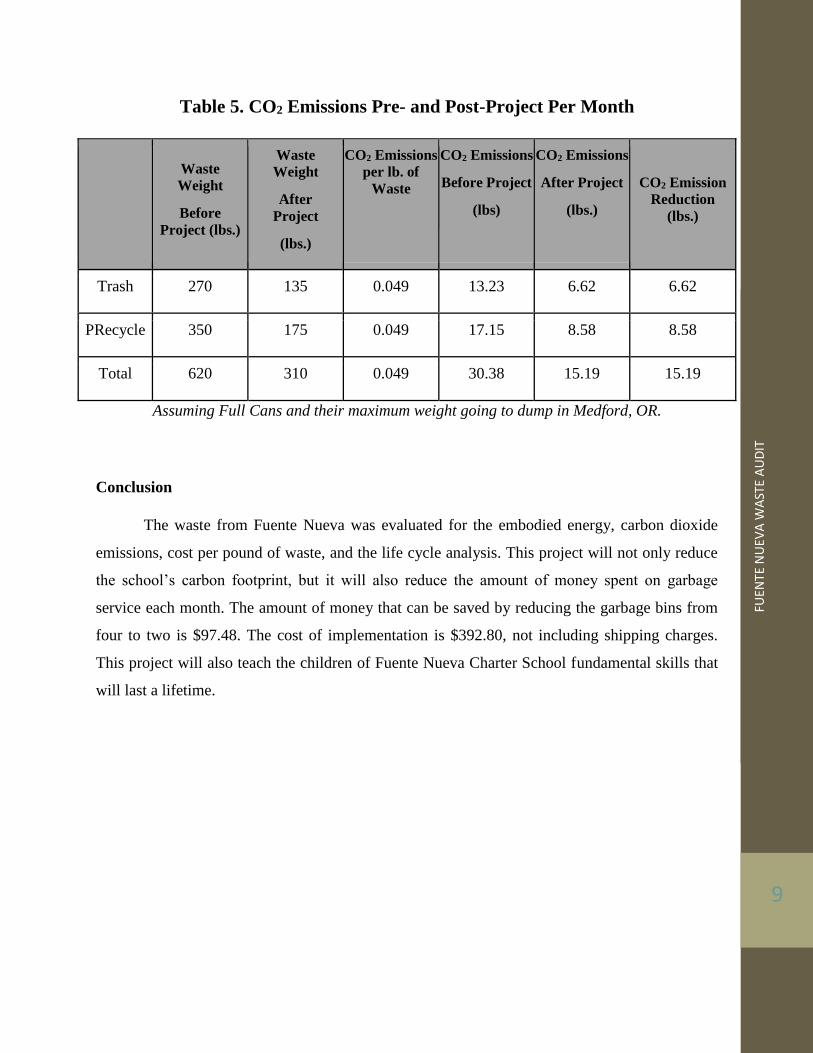
The project would also reduce the carbon and embedded energy footprint of Fuente
Nueva Charter School. Assuming full bins of waste transported to the Dry Creek Landfill in
Medford, Oregon, a 50% reduction in waste would equate to a reduction of 15.19 lbs. of CO2 per
week.
9
FUEN
TE N
UEV
A W
AST
E A
UD
IT
Table 5. CO2 Emissions Pre- and Post-Project Per Month
Waste
Weight
Before
Project (lbs.)
Waste
Weight
After
Project
(lbs.)
CO2 Emissions
per lb. of
Waste
CO2 Emissions
Before Project
(lbs)
CO2 Emissions
After Project
(lbs.)
CO2 Emission
Reduction
(lbs.)
Trash 270 135 0.049 13.23 6.62 6.62
PRecycle 350 175 0.049 17.15 8.58 8.58
Total 620 310 0.049 30.38 15.19 15.19
Assuming Full Cans and their maximum weight going to dump in Medford, OR.
Conclusion
The waste from Fuente Nueva was evaluated for the embodied energy, carbon dioxide
emissions, cost per pound of waste, and the life cycle analysis. This project will not only reduce
the school’s carbon footprint, but it will also reduce the amount of money spent on garbage
service each month. The amount of money that can be saved by reducing the garbage bins from
four to two is $97.48. The cost of implementation is $392.80, not including shipping charges.
This project will also teach the children of Fuente Nueva Charter School fundamental skills that
will last a lifetime.
10
FUEN
TE N
UEV
A W
AST
E A
UD
IT
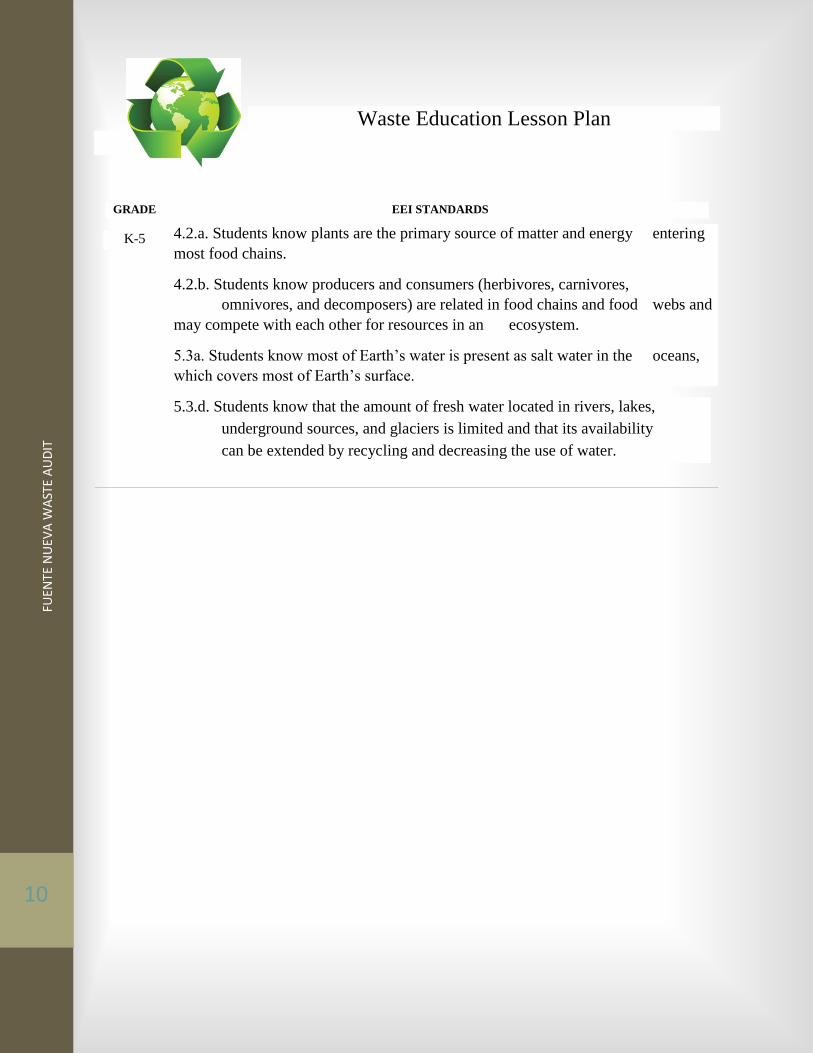
Waste Education Lesson Plan
GRADE EEI STANDARDS
K-5 4.2.a. Students know plants are the primary source of matter and energy entering
most food chains.
4.2.b. Students know producers and consumers (herbivores, carnivores,
omnivores, and decomposers) are related in food chains and food webs and
may compete with each other for resources in an ecosystem.
5.3a. Students know most of Earth’s water is present as salt water in the oceans,
which covers most of Earth’s surface.
5.3.d. Students know that the amount of fresh water located in rivers, lakes,
underground sources, and glaciers is limited and that its availability
can be extended by recycling and decreasing the use of water.
11
FUEN
TE N
UEV
A W
AST
E A
UD
IT
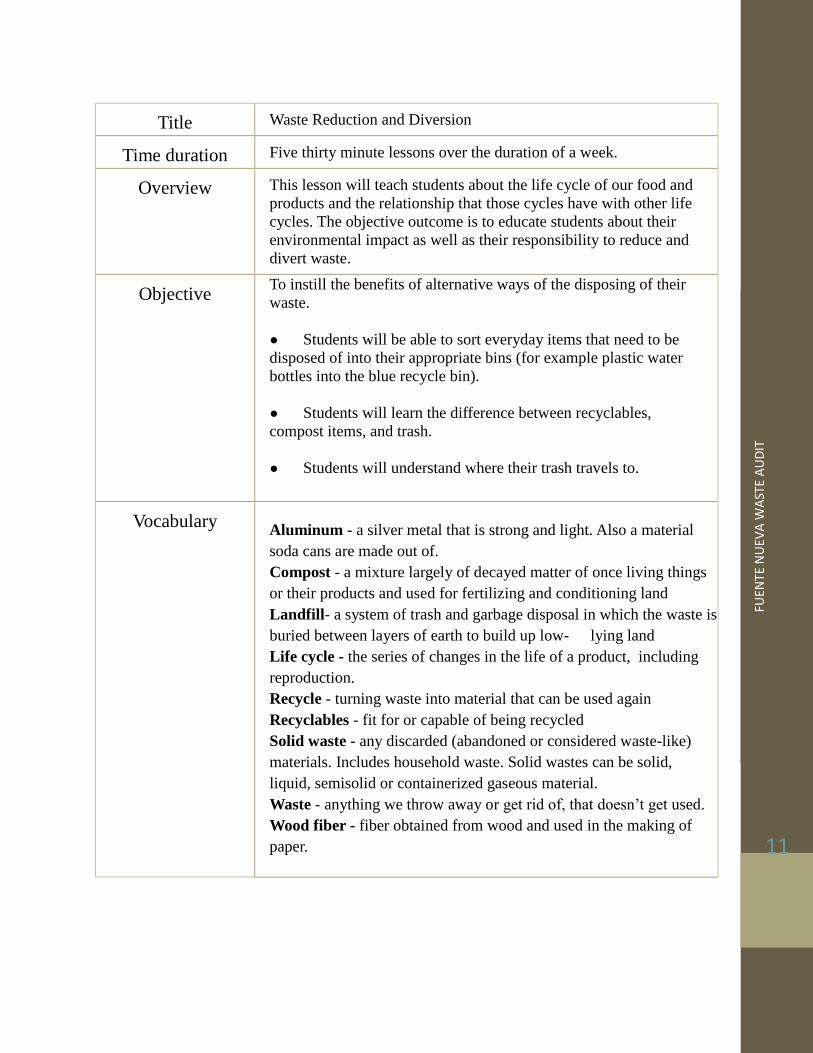
Title Waste Reduction and Diversion
Time duration Five thirty minute lessons over the duration of a week.
Overview This lesson will teach students about the life cycle of our food and
products and the relationship that those cycles have with other life
cycles. The objective outcome is to educate students about their
environmental impact as well as their responsibility to reduce and
divert waste.
Objective To instill the benefits of alternative ways of the disposing of their
waste.
● Students will be able to sort everyday items that need to be
disposed of into their appropriate bins (for example plastic water
bottles into the blue recycle bin).
● Students will learn the difference between recyclables,
compost items, and trash.
● Students will understand where their trash travels to.
Vocabulary
Aluminum - a silver metal that is strong and light. Also a material
soda cans are made out of.
Compost - a mixture largely of decayed matter of once living things
or their products and used for fertilizing and conditioning land
Landfill- a system of trash and garbage disposal in which the waste is
buried between layers of earth to build up low- lying land
Life cycle - the series of changes in the life of a product, including
reproduction.
Recycle - turning waste into material that can be used again
Recyclables - fit for or capable of being recycled
Solid waste - any discarded (abandoned or considered waste-like)
materials. Includes household waste. Solid wastes can be solid,
liquid, semisolid or containerized gaseous material.
Waste - anything we throw away or get rid of, that doesn’t get used.
Wood fiber - fiber obtained from wood and used in the making of
paper.

12
FUEN
TE N
UEV
A W
AST
E A
UD
IT
Materials Make your own paper
trays
Compostable materials
Take-Home Recycling
Kit
Old Magazines
Used Cardboard
Construction Paper
Markers/Paint
Glue
Scissors
Composting Activity
1 Jar of Dirt
1 Jar of Soil
Recycling Relay
2 blue recycling bins
2 trash bins
2 bags of “trash” composed of the
same materials in each bag
Introduction
1) What is an ecosystem?
An interconnected system of organisms that are all working together.
Where energy and nutrients are exchanged back and forth within
different life cycles.
2) Life Cycle of a plant. What do plants need to grow?
- Soil and water.
Our water is in a continuous loop. A system of water evaporating
from plants, the environment, and from lakes and streams; then it
accumulates in the atmosphere as clouds which then falls back down
to the earth as precipitation which we then use to water our plants or
drink.
And what do plants provide for us?
-Nutrients
How do plants get their nutrients?
-For the plants to provide us with nutrients they need nutrients, which
they get from the soil they are grown in. Therefore we need to put
nutrients in to replenish the soil. The best and most efficient way of
13
FUEN
TE N
UEV
A W
AST
E A
UD
IT
doing this is to put the unused plant parts right back in the ground.
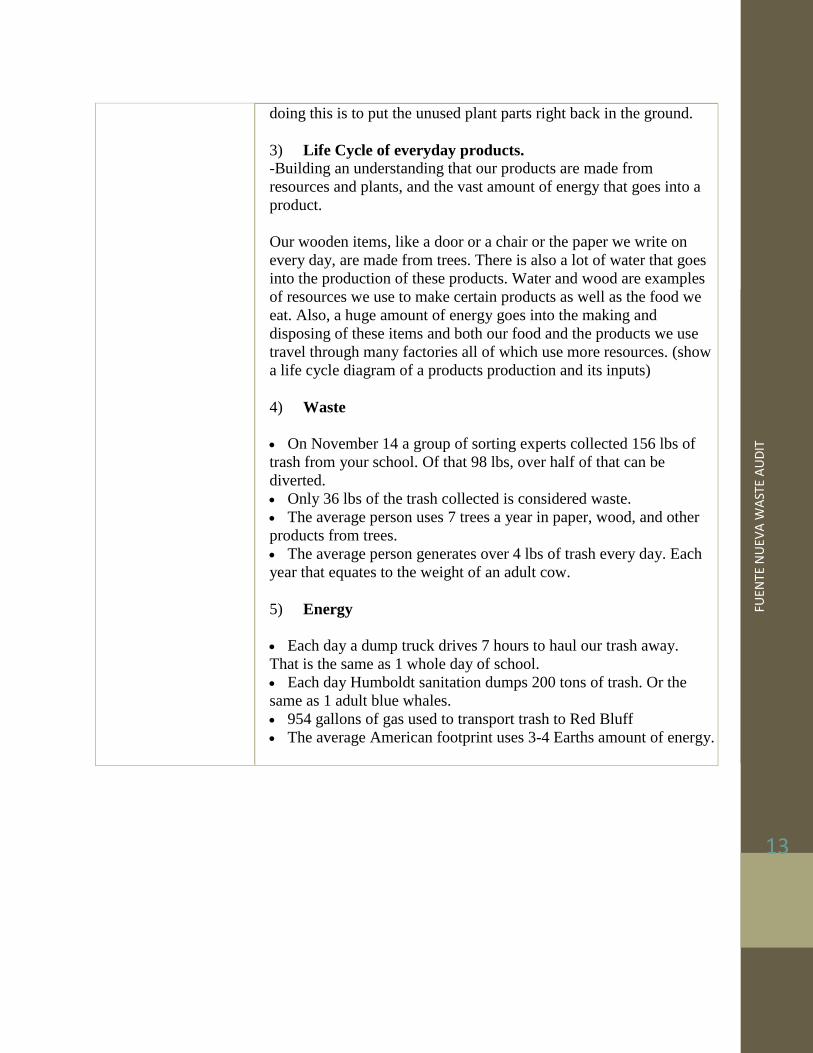
3) Life Cycle of everyday products. -Building an understanding that our products are made from
resources and plants, and the vast amount of energy that goes into a
product.
Our wooden items, like a door or a chair or the paper we write on
every day, are made from trees. There is also a lot of water that goes
into the production of these products. Water and wood are examples
of resources we use to make certain products as well as the food we
eat. Also, a huge amount of energy goes into the making and
disposing of these items and both our food and the products we use
travel through many factories all of which use more resources. (show
a life cycle diagram of a products production and its inputs)
4) Waste
On November 14 a group of sorting experts collected 156 lbs of
trash from your school. Of that 98 lbs, over half of that can be
diverted.
Only 36 lbs of the trash collected is considered waste.
The average person uses 7 trees a year in paper, wood, and other
products from trees.
The average person generates over 4 lbs of trash every day. Each
year that equates to the weight of an adult cow.
5) Energy
Each day a dump truck drives 7 hours to haul our trash away.
That is the same as 1 whole day of school.
Each day Humboldt sanitation dumps 200 tons of trash. Or the
same as 1 adult blue whales.
954 gallons of gas used to transport trash to Red Bluff
The average American footprint uses 3-4 Earths amount of energy.

14
FUEN
TE N
UEV
A W
AST
E A
UD
IT
Activities and
procedures
1) Discuss beneficial impacts for recycling
a) Utilize Visuals
b) Facts
c) Impacts
2) Show Video
3) Making your own paper food trays
a) Cut Rectangle that Measures 6 x 8 Scrap Book Paper
b) Cut Corners at an angle about 1 ½ Inches
c) Make slits at the corners these cuts should be 1 ¾ inches long
d) Creates sides to make a boat
e) Fold each slit to create flap
f) Create flap for each slit
g) Flatten creases and lay your paper play again
h) Cut a piece of paper to fit over both sides of paper
i) Refold all creased lines
j) Glue Sides
4) Composting Activity
a) Ask children if they know what is underneath them
b) Ask children how they receive their nutrients
c) Explain the difference between soil/dirt.
d) Have children feel the dirt/soil
e) Explain how soil receives its nutrients
5) Recycling Relay
a) Have students help sort items into recycling, compost, and a
trash can. This will be a competition between two teams (split
the class into two groups) that will have a relay-race style game
to test the students’ knowledge of identification and sorting of
trash, recycling and a few compostable items. The two teams
will each have their own area with a blue recycling bin, a trash
can and the compost spot which if outside can be the grass (this
will give further opportunities to make the connection that
though items will decompose and the nutrients will be returning
to the ground soil.)At the opposite end of the groups and there
currently empty bins will be 2 bags or boxes of the mixed
materials of “trash” around 20 or so feet away.
b) The students will then line up and then one at a time run over to
their teams trash bag select an item and then run back and place
that item in the appropriate bin and tap the hand of their next
team mate to run and select the next item. Until all materials are
sorted.

15
FUEN
TE N
UEV
A W
AST
E A
UD
IT
6) Take-Home Recycling Kit
a) Explain what recycling is. Review the information in recycling
facts.
b) Have each child cut old cardboard boxes into four 8 ½ by 11-
inch pieces and glue different colored construction paper to each
side of the cardboard. Connect each piece of cardboard with tape
to form a placard that can stand on a table. Instruct the children
to label each piece of cardboard with one of the following
recyclables: aluminum, glass, plastic, and paper.
c) Have children cut out or draw the appropriate recyclable for
each cardboard placard using the magazines, newspaper,
markers, or paints.
d) When the children are finished decorating, ask them to take their
placards home. To encourage families to recycle, ask the
children to set the placards where their families keep their
recyclables or trash. Encourage children to share the information
they learned with their parents. Explain how the placards serve
as a friendly reminder of the importance and benefits of
recycling.
e) After completing the activity, give each child a sticker.
16
FUEN
TE N
UEV
A W
AST
E A
UD
IT
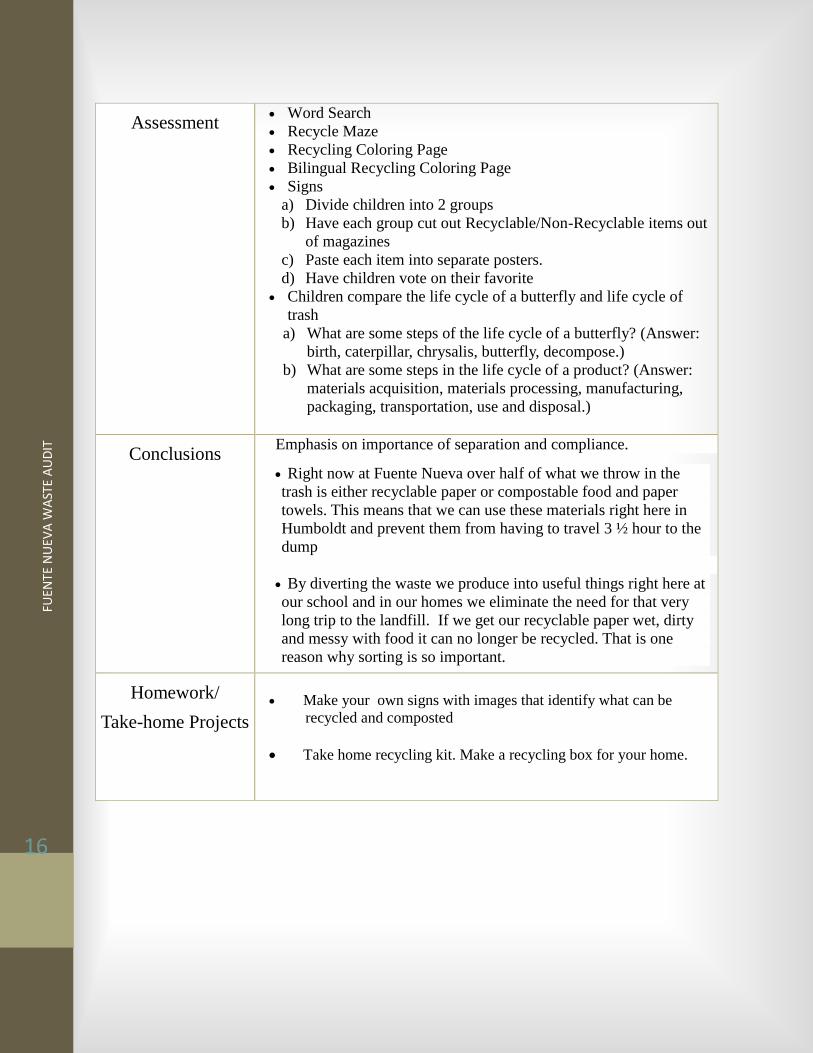
Assessment Word Search
Recycle Maze
Recycling Coloring Page
Bilingual Recycling Coloring Page
Signs
a) Divide children into 2 groups
b) Have each group cut out Recyclable/Non-Recyclable items out
of magazines
c) Paste each item into separate posters.
d) Have children vote on their favorite
Children compare the life cycle of a butterfly and life cycle of
trash
a) What are some steps of the life cycle of a butterfly? (Answer:
birth, caterpillar, chrysalis, butterfly, decompose.)
b) What are some steps in the life cycle of a product? (Answer:
materials acquisition, materials processing, manufacturing,
packaging, transportation, use and disposal.)
Conclusions Emphasis on importance of separation and compliance.
Right now at Fuente Nueva over half of what we throw in the
trash is either recyclable paper or compostable food and paper
towels. This means that we can use these materials right here in
Humboldt and prevent them from having to travel 3 ½ hour to the
dump
By diverting the waste we produce into useful things right here at
our school and in our homes we eliminate the need for that very
long trip to the landfill. If we get our recyclable paper wet, dirty
and messy with food it can no longer be recycled. That is one
reason why sorting is so important.
Homework/
Take-home Projects
Make your own signs with images that identify what can be
recycled and composted
Take home recycling kit. Make a recycling box for your home.

17
FUEN
TE N
UEV
A W
AST
E A
UD
IT
FUN FACTS about Recycling!
One ton of recycled paper uses: 64% less energy, 50% less water, 74% less air
pollution, saves 17 trees and creates 5 times more jobs than one ton of paper
products from virgin wood pulp.
Recycling just one aluminum can saves enough energy to run a TV for three hours –
or the equivalent of a half a gallon of gasoline.
A 60-watt light bulb can be run for over a day on the amount of energy saved by
recycling 1 pound of steel. In one year in the United States, the recycling of steel
saves enough energy to heat and light 18,000,000 homes!
If you had a 15-year-old tree and made it into paper grocery bags, you'd get about
700 of them. A supermarket could use all of them in under an hour! This means in
one year, one supermarket goes through 60,500,000 paper bags! Imagine how many
supermarkets there are in the U.S.!!!
So, one super market uses 86,429 trees in one year!
The average person uses 7 trees a year in paper, wood, and other products from
trees.
Cigarette butts and filters take 12 years to biodegrade. Aluminum cans take between
200 to 500 years to biodegrade. Plastic diapers and sanitary pads take between 500-
800 years. Styrofoam takes more than 5,000 years. And it would take a glass bottle
1 million years to biodegrade.
The average person generates over 4 pounds of trash every day and about 1.5 tons
of solid waste per year.
Over 75% of waste is recyclable, but we only recycle about 30% of it.
It has been estimated that 1 billion tons of plastic (the equivalent weight of nearly
3000 Empire State buildings” have been created. Since it takes hundreds of years to
decompose, most of it still exists.

18
FUEN
TE N
UEV
A W
AST
E A
UD
IT
Where Our Waste Goes
Sanitary Landfills:
a) Most common form of waste disposal
b) Sanitary landfills are constructed on carefully chosen sites and lined with durable plastic
and clay to prevent trash coming into contact with the earth, particularly groundwater
c) Waste deposited in landfills is covered daily with soil or a special fabric cover. This
covering seals the compacted trash from the air and prevents pests (birds, rodents, etc.)
from getting into the trash
d) There is a big difference between a sanitary landfill and a dump. A dump is a big hole or
pile of garbage that does not prevent waste from coming in contact with the ground, has
many pest problems and stinks. A landfill is a specially engineered system designed to
contain garbage in a more sanitary way.
e) As garbage in a landfill decomposes it creates gas. Forty-five to sixty percent of the gas
is composed of methane and the rest is mostly carbon dioxide. Do you know that landfill
gas can be burned to create energy?
Composting
a) Compost is made from decomposed plant and animal material
b) Composting is a controlled decomposition of plant material to create humus
c) The composting process is a carefully regulated system of combining oxygen, nitrogen,
carbon and water…plus some microbes, who love to eat waste
d) Landfill space is saved when people recycle plant materials (yard trimmings, food
scraps) through composting
Recycling
a) Recycle old materials and turn them into new reusable materials.
b) Reduces amount of trash to landfills and reduce pollution from landfill leachate.
c) Recycling saves natural resources. Without recycling this material would come from
trees.

19
FUEN
TE N
UEV
A W
AST
E A
UD
IT
Physical Infrastructure Plan
Introduction
The physical infrastructure team has consolidated this collective information to assist in the
implementation of the waste management system at Fuente Nueva Charter School. This
document contains effective suggestions on how construct the physical infrastructure materials
that are needed to make this system effective. Decoration, usage, and placement ideas for the
recycling bins, composting pile, and relevant signage are all included in this document.
-------------------------------------------------------------------------------------------------------------------------------------------------
Bin Materials for: Recycling and Compost
1. Recycling:
Type
Rubbermaid Slim Jim Recycling Bin
Capacity: 23 gallon
Color: Blue with recycling logo
How many: About 10, one for each classroom
Example:
20
FUEN
TE N
UEV
A W
AST
E A
UD
IT
Cost
One bin: $35 dollars each.
Bins must be without holes in the bottom, but lids are optional.
Where To Buy
The bins are available on the Home Depot website and are likely in stock at local Home
Depot stores.
Optional Lids
Utilization and efficiency of recycling can be dramatically increased when bins are
equipped with lids which reduce and/or minimize the deposit of misplaced or non-
recyclable goods.
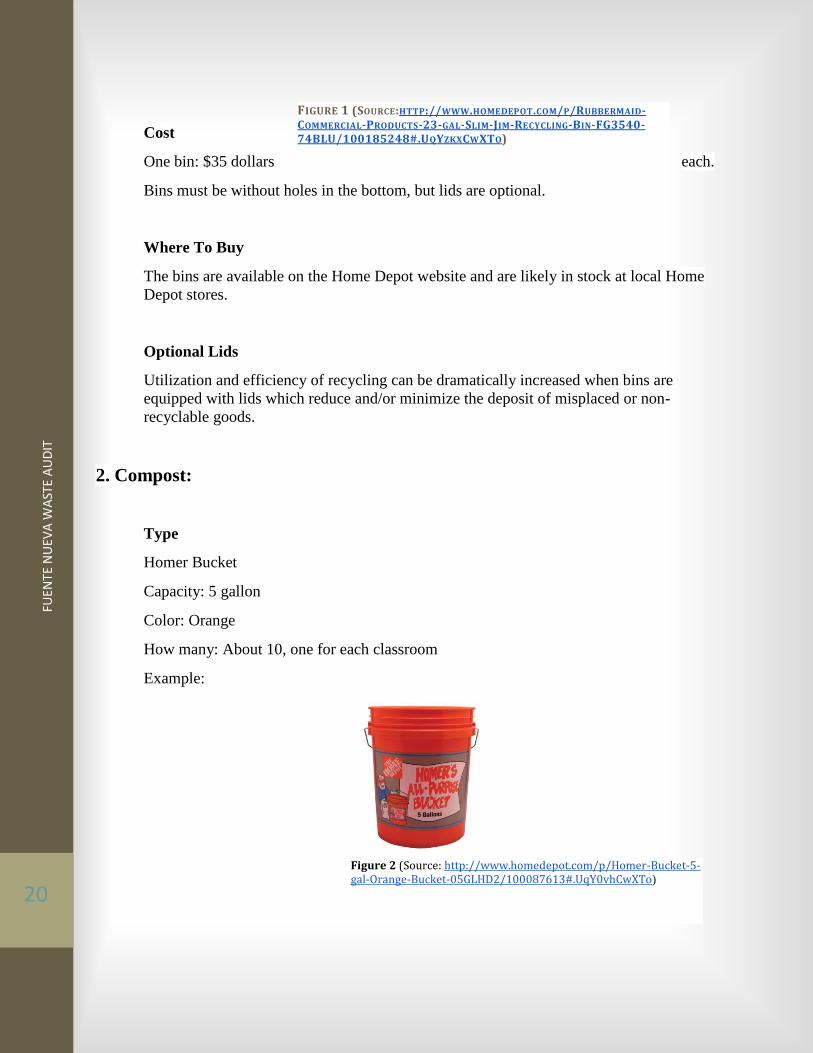
2. Compost:
Type
Homer Bucket
Capacity: 5 gallon
Color: Orange
How many: About 10, one for each classroom
Example:
FIGURE 1 (SOURCE:HTTP://WWW.HOMEDEPOT.COM/P/RUBBERMAID-COMMERCIAL-PRODUCTS-23-GAL-SLIM-JIM-RECYCLING-BIN-FG3540-74BLU/100185248#.UQYZKXCWXTO)
Figure 2 (Source: http://www.homedepot.com/p/Homer-Bucket-5-gal-Orange-Bucket-05GLHD2/100087613#.UqY0vhCwXTo)

21
FUEN
TE N
UEV
A W
AST
E A
UD
IT
Cost
One bin: About $3 each
Lids are recommended for the compost buckets but are optional.
Where to buy:
The recommended Homer Bucket is available at Home Depot and online at the Home
Depot website:
(http://www.homedepot.com/b/webapp/catalog/servlet/HomePageView?storeId=10051&
catalogId=10053&langId=-1).
-------------------------------------------------------------------------------------------------------------------------------------------------
Bins: Waste Separation, Disposal, and Locations
1. Waste Separation
Four types
1. Plastic Recyclable
2. Paper (mainly for milk cartons)
3. Compost
4. Trash.
Trash will have its own separate bin (classrooms already have them) and one Slim Jim
will be needed for each classroom for a mixed recycling system. The recycling bin will
take all recyclable plastic and paper. There is also a need for a compost bucket in each
class due to the high level of organic waste. It is recommended to put shredded paper at
the bottom of each bucket to help reduce odor.
Compost Bin Materials
There are already worm compost bins on site that will be utilized for classroom compost.

22
FUEN
TE N
UEV
A W
AST
E A
UD
IT
(If additional compost bins are needed, these materials are required):
4 pieces of 2x4 wood or plastic
Water Resistant Tarp
Long Spike Thermometer
2. Disposal
Since each class eats inside their own classrooms for lunch and there is no designated
eating area, each classroom with have a 23 gallon recycling bin for papers and plastics, a
5 gallon compost bucket, and a standard trash can.
Recycling will be picked up at the end of each day by the custodian who already comes
around to pick up trash. We recommend that the compost is taken out by a student or the
teacher each day (the position of whom would rotate at the discretion of the teacher) to
encourage student involvement.
3. Compost Bin Location
Compost bins will be needed at all locations in which food will be consumed and organic
waste will be generated. Each classroom will need a small 5 gallon bucket which can be
emptied daily into a one of the larger worm compost bins.
-------------------------------------------------------------------------------------------------------------------------------------------------
Signage: Infrastructure and Design
1. Infrastructure of Signs
Signage to designate each recycle, compost, and trash bins inside of the classrooms could
be made from recycled materials such as cardboard. We could get even more creative and
try to make signs out of recycled materials found at the school. The use of recyclable

23
FUEN
TE N
UEV
A W
AST
E A
UD
IT
materials for the signs would tie in well to the whole reduce, reuse, recycle mantra as we
would be finding new uses for materials that would otherwise be thrown into the waste
stream. Or another alternative would be simply using construction paper and markers and
making signs that could be laminated. Students could each decorate a sign, then the class
could vote on the best ones to laminate and use.
The signs inside the classroom should designate: which bin is which and what goes in
each. The recyclable, compost, and trash signs should be placed above each designated
bin. Nearby should be the signs that explain which items go in which. However this sign
and bin arrangement is done, is ultimately up to each of the classes.
2. Design
Materials should be of good quality as in something sturdy like, poster board or
cardboard. They should look clean and be presented well. Effective composition is
accomplished by designing a sign that is pleasing to the eye. Pictures and words should
be incorporated into the sign in a way that makes the eye attracted to looking at them.
This can be done through a variety of strategies like, posting the pictures in ways that
draws your eye from one to another as in triangles, avoiding tangents (where the
picture/word looks as if it will touch the edge of the board), and not overlapping images
in awkward ways. Effective color combinations are often done instinctually, but can also
be accomplished by analyzing the color wheel. As discussed in MotoCMS’s article on
color schemes, there are five main ones, monochromatic, analogous, complementary,
triadic, and tetradic.
Figure 3 shows an example of a sign that shows what kind of
paper can be thrown away.
How to Make Signs Persuasive
The use of psychology is an effective way to make signs
persuasive. In a study done by Arizona State University, it
was found that the language a sign uses and how it gets
across its message has a huge impact on whether or not
people will listen to it. Signs that suggest that you ‘should do’
or ‘do not do’ something for the: greater good of an
establishment, the environment, or for your fellow man, are
not always effective. However, signs that suggest that there is
a social norm that must be upheld are often followed more
willingly. Based off of this study we know that any
persuasive signs on campus should try and follow along these
FIGURE 3 (SOURCE: ANNIKA RAGSDALE’S PHOTO)

24
FUEN
TE N
UEV
A W
AST
E A
UD
IT
same guidelines.
How To Make Signs Easy To Understand
Signs should try to use few words and mainly pictures to be effective. Pictures that have
been drawn may be more exciting and eye catching than a photograph printed out. Any
words on the signs can be in English and in Spanish to assist the students in their education
experience development in a bilingual school.
How To Make Signs Look Nice
We are going to want to make our signs look nice by using quality materials, effective
composition, and effective color combinations.
Monochromatic: Variations of a single color.
Example: Blue, Light Blue, and Dark Blue.
Analogous:A single color is chosen as the main color and is highlighted by the colors next to it
on the wheel.
Example:
Main Color: Red.
Highlights: Orange and Purple.
OR Main Color: Green.
Highlights: Darker Green and Yellow.
Complementary: Two colors are chosen across the color wheel from one another.
Example: Red and Green OR Yellow and Blue.
Triadic: Three colors are chosen that form a 120 degree angle between them.
Example: Red, Blue, and Green.
Tetradic: Four colors are chosen, two that are complementary to each other and another two
complementary to each other.
Example: Red and Green, Blue and Yellow.
Bilingual Option
By using two different languages it gives the students a chance to incorporate what they are
learning and use them in recycling as well. Signs that designate bins could be in both English and

25
FUEN
TE N
UEV
A W
AST
E A
UD
IT
Spanish. Signs that show what goes where can have pictures and then the Spanish/English
equivalent to that item written underneath. An example of this can be seen in Figure 3.
Students are also encouraged to make creative recycling signs to make them excited about the
cause. Here are some sign examples:
Spanish example
“Cada persona deja una huella en la tierra, los que buscan ayudar al mundo solo dejan una
impresion de mano.”
English example
“Every person leaves a footprint on the earth, those who look to help the earth leave a hand
print.”
Possible persuasive signs for FNCS:
English versions
“Don’t forget to recycle!”
“Help your classmates recycle!”
“Join your friends in recycling/join your friends in making a difference and recycle!”
Spanish versions
“No olvide reciclar!”
“Ayude a tus compañeros reciclar!”
“Juntos con tus amigos reciclen y hagan una diferencia en el mundo!”

26
FUEN
TE N
UEV
A W
AST
E A
UD
IT
Getting the Kids Involved: Ideas for FNCS and Participation
Having the children make their own signs will be the most effective way to have them recycle,
because they will attribute it to their own idea. Knowledge about waste, landfills, and embedded
energy involved in making the products that are being thrown away will help the children care
for the environment.
1. Ideas
Have an arts and crafts day where the kids could make art out of recyclable materials.
Encourage community recycling by decorating signs/placing them and the bins in the
classroom themselves.
Encourage teachers to have a reward system for recycling.
Students can collect coupons that they receive for recycling and putting the correct trash
in the right bins and be given a reward for collecting a certain amount.
2. Participation
To increase in participation we suggest that education efforts should focus on helping
students become more familiar with the details of how to recycle. If teachers can
incorporate any amount of recycling information and environmental science into their
lesson plans, students will understand more about why their actions are important.
Students and teachers can dump compost bins daily. This will allow kids to be hands on
and see the amount of food waste they accumulate. A buddy system can be set up in
classes so kids can go in pairs and each get a chance to dump waste.

27
FUEN
TE N
UEV
A W
AST
E A
UD
IT
Cost Effectiveness of the Physical Infrastructure Plan Implementation
Costs in Dollars
Rubbermaid Slim Jim Recycling Bin- 23-Gallon Capacity – Blue
(Possible donation of bins by local businesses)
$15.00 Each (10 Needed)
$150.00 Total
Homer Bucket- 5-Gallon Capacity- Orange
(Possible donation of bins by local businesses)
$3.00 Each (10 Needed)
$30.00 Total
Crayola 64 pack of markers $14.00 Total
The Board Dudes SRX Medium Point Dry Erase Markers 10-pk. $7.50
Production Paint, Latex & Lead free. Outdoor strength paint $22.00 Each (4 Needed)
$88.00 Total
Generic Frames for recycling sign protection $6.00 Each (24 Needed)
$144.00 Total
Total Cost: $433.50
*This is an educated estimation of the overall cost of implementation of the physical
Infrastructure portion. Costs may vary depending on where materials are purchased or possibly
donated.
References
MotoCMS. (2013). The Power of Color Combination. Retrieved December 2, 2013, from
http://www.motocms.com/blog/project-news/color-combination-ultimate-guide/
Tracey, M. D. (2005, October). Crafting persuasive pro-environmental messages. Monitor on
Psychology, 36(9). http://www.apa.org/monitor/oct05/persuasive.aspx