fuel cell vehicle systems analysis fc p1
TRANSCRIPT
2004 DOE Hydrogen, Fuel Cells & Infrastructure Technologies Program Review
Tony Markel
National Renewable Energy LaboratoryMay 25, 2004
Fuel Cell Vehicle Systems Analysis
This presentation does not contain any proprietary or confidential information

2
Objectives
• Provide DOE and industry with technical solutions and modeling tools that accelerate the introduction of robust fuel cell technologies
• Quantify benefits and impacts of HFC&IT development efforts at the vehicle level (both current status and future goal evaluation)
• Highlight potential system level solutions to technical barriers

3
Budget and Safety
• Budget– FY04 funding: $200 K total
• Safety– All work conducted under this project is
simulation and analysis. Standard office safety protocols followed.

4
Technical Barriers and Targets
• Technical Barriers: – Fuel Cells
• D. Fuel Cell Power System Benchmarking• R. Thermal and Water Management
• Technical Targets:– Specific technical targets related to fuel cell vehicle
systems modeling do not exist– The modeling activity integrates the component level
technical targets and development activities to quantify the potential cumulative impacts of the DOE programs

5
1. Complete Preliminary Water and Thermal Management Analysis (2/04)
2. Complete Technical Targets Tool Enhancement and Analysis (6/04)
3. Simulate Supercharged Fuel Cell Power System In Hybrid Vehicle (7/04)
10/0310/03 Project TimelineProject Timeline 9/049/041 2 3
NREL has provided Fuel Cell Vehicle Systems Analysis support to OHFCIT annually since 2000.
Milestones

6
Overall ApproachVehicle Systems Modelingw/integrated parametric
fuel cell model
System Concept Evaluation
Fuel Cell System Water and Thermal
Management on Drive Cycles
Supercharged Fuel Cell System
Concept
Vehicle Benchmarking
DataCollection
Technical Target
Evaluation
VehicleRequirements
Interaction withProduction and Supply
Tech ValidationSystems Integration
Vehicle Analysis
Future Supporting RolesCurrent Focus

7
Vehicle Systems Modeling in ADVISOR 2003 with Integrated Parametric Fuel Cell Model
• Original work initiated with Virginia Tech– Benchmarked based on Honeywell/GE fuel cell integration
into 2002 FutureTruck entry
• Focus on thermal system modeling
• Parametric polarization curve
• Primary applications – Understand impacts of cycle dynamics on fuel cell operation– Quantify water and thermal management requirements
under a variety of driving conditions– Assess opportunities for system optimization

8
StructurePrimary Component Models
• Cell polarization model (tunable)
• Air compressor• Thermal
– Stack– Humidifier– Condenser– Radiator– Reservoir
• System controller
PEM Fuel CellStack
Humid.
WaterReservoir
Humid.
AirCompressor
Airintake
H2 from tanks
PressureRegulator
M
Airexhaust
Air in
Cooling water(de-ionized)
H2 in
WaterReservoir
ThermostatBy-Pass
Radiator
Legend
Fuel SystemAir SystemThermal System
Condenser
ProgrammedProgrammedin in
SimulinkSimulinkTMTM

9
Parametric Flexibility
• Polarization model coefficients
• Pressure, stoichiometry, and humidity operating strategies
• Air compressor operating maps
• Coolant pump characteristics• Radiator and condenser
characteristics• Stack thermal properties• …
• Cell current density and voltage
• Component temperatures• Parasitic power consumption
of components• Net system power output• State of water balance• Heat production and
rejection breakdown by component
• Fluid flow rates throughout the system
• …
InputsInputs OutputsOutputs

10
Parametric Fuel Cell Model Detailed Results over Real Driving Profiles
Predicted dynamic fuel cell system and component operationPortion of US06 Drive Cycle
11
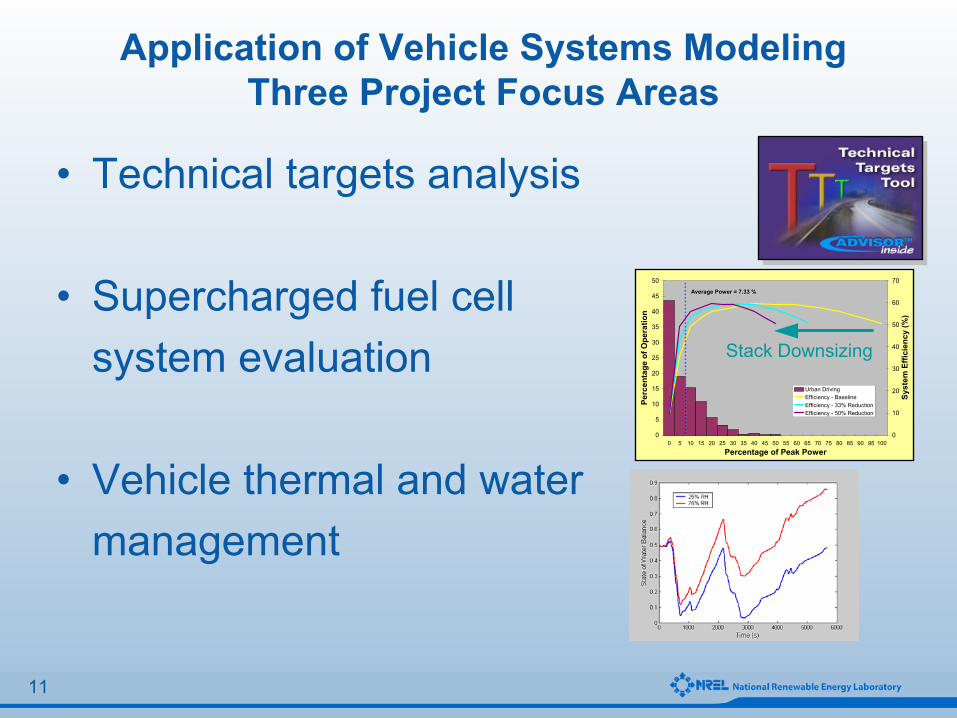
Application of Vehicle Systems ModelingThree Project Focus Areas
• Technical targets analysis
• Supercharged fuel cell system evaluation
• Vehicle thermal and water management
0
5
10
15
20
25
30
35
40
45
50
0 5 10 15 20 25 30 35 40 45 50 55 60 65 70 75 80 85 90 95 100
Percentage of Peak Power
Perc
enta
ge o
f Ope
ratio
n
0
10
20
30
40
50
60
70
Syst
em E
ffici
ency
(%)
Urban DrivingEfficiency - BaselineEfficiency - 33% ReductionEfficiency - 50% Reduction
Average Power = 7.33 %
Stack Downsizing

Technical Targets Analysis

13
Targets Analysis History
• NREL has provided DOE with high quality technical targets analysis using ADVISOR for the past 5 years New Technology Vehicle Progressive Market Share
ConventionalFuel Cell
Parallel Hybrid
Series Hybrid
0%
10%
20%
30%
40%
50%
60%
70%
80%
90%
100%
1 2 3 4
Penetration Model
1998 1999 2001 2003
Fuel Economy
66.664.1
46.9
69.166.0
48.0
69.766.5
48.3
67.964.8
47.1
68.665.4
47.4
69.466.3
48.2
70.967.6
49.0
0
10
20
30
40
50
60
70
80
Compact Car Midsize Car Midsize SUV
Fuel
Eco
nom
y (m
pgge
)
Current Status
Fuel Cell Stack 2005
Fuel Cell Stack 2010
Fuel Cell Storage 2005
Fuel Cell Storage 2010
Stack and Storage 2005
Stack and Storage 2010
0
20
40
60
80
100
120
FY00 2004
Com
posi
te F
uel E
cono
my
(mpg
ge)
Parallel w/CIDIFuel Cell Hybrid - GasolineFuel Cell Hybrid - Hydrogen
Vehicle PerformanceTarget (2004)
R&D Plan
2004
Fuel Economy
66.664.1
46.9
69.166.0
48.0
69.766.5
48.3
67.964.8
47.1
68.665.4
47.4
69.466.3
48.2
70.967.6
49.0
0
10
20
30
40
50
60
70
80
Compact Car Midsize Car Midsize SUV
Fuel
Eco
nom
y (m
pgge
)
Current Status
Fuel Cell Stack 2005
Fuel Cell Stack 2010
Fuel Cell Storage 2005
Fuel Cell Storage 2010
Stack and Storage 2005
Stack and Storage 2010

14
Fuel Savings
per Vehicle Class
Fuel Cell Targets Study Description
• Compared potential performance of vehicles achieving targets for:– current status for fuel cell stack and hydrogen storage (baseline)– fuel cell stack (year 2005 and year 2010)– hydrogen storage (year 2005 and year 2010)– a combination of fuel cell stack and hydrogen storage targets
(year 2005 and year 2010)
Optimization
R&D Plan Technical Targets
Vehicle PerformanceAttributes
Component Characteristics
OptimalTotal Fleet
Fuel Savings
New Technology Vehicle Progressive Market Share
ConventionalFuel Cell
Parallel Hybrid
Series Hybrid
0%
10%
20%
30%
40%
50%
60%
70%
80%
90%
100%
1 2 3 4
Penetration Penetration ModelModel
Cost Model$$$
Cost Model$$$
15
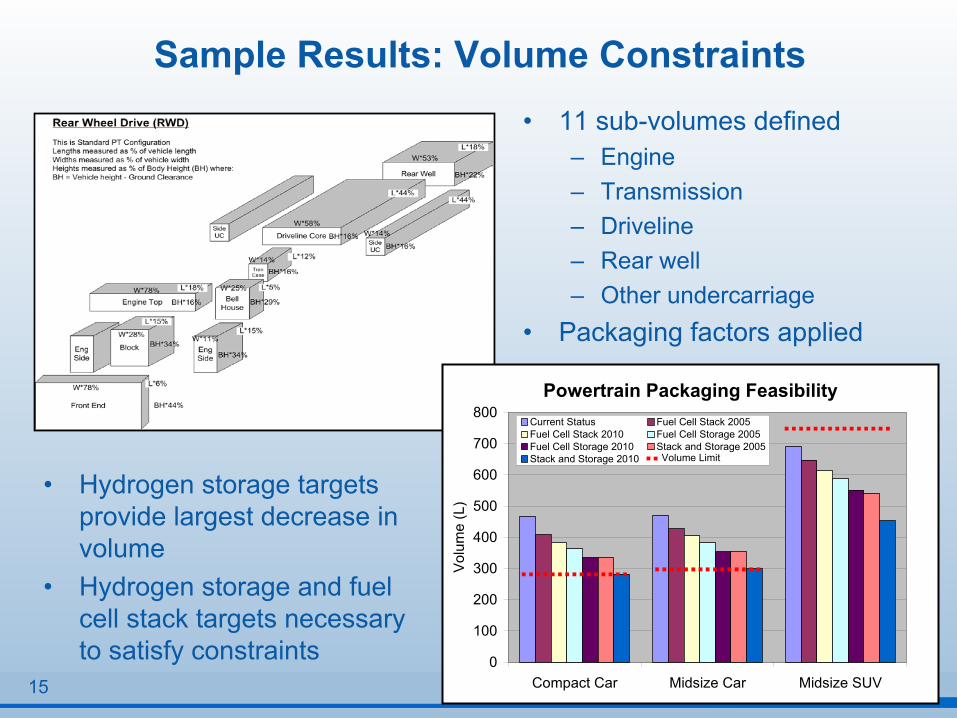
Sample Results: Volume Constraints
• Hydrogen storage targets provide largest decrease in volume
• Hydrogen storage and fuel cell stack targets necessary to satisfy constraints
• 11 sub-volumes defined– Engine– Transmission– Driveline– Rear well– Other undercarriage
• Packaging factors applied
Powertrain Packaging Feasibility
0
100
200
300
400
500
600
700
800
Compact Car Midsize Car Midsize SUV
Volu
me
(L)
Current Status Fuel Cell Stack 2005Fuel Cell Stack 2010 Fuel Cell Storage 2005Fuel Cell Storage 2010 Stack and Storage 2005Stack and Storage 2010 Volume Limit

Supercharged Fuel Cell Power System

17
Supercharged Fuel Cell Power System ResearchObjectives Rationale
Approach
• Reduce impact of limiting factors in stack and system• Peak traction power demand case is only small fraction of typical operation• Flexible system to match transient power demands
Quantify feasibility and benefits of fuel cell system oxygen supercharging
• Increase specific output • Downsize fuel cell stack• Address system cost, mass, and volume barriers from vehicle systems perspective
0
100
200
300
400
500
600
SpecificPower(W/kg)
PowerDensity
(W/L)
SpecificCost ($/kW)
Std. Fuel Cell System Concept FCS
Supercharged Fuel Cell System Closes the Gap Between 2005 and 2010 Targets
Fraction of Time within Specific Power Range for US06
(as Percent of Peak Capability)>50%
30%-50%
10-30%
<10%
• Develop representative fuel cell system models for use in vehicle analysis• Cell tests used to validate model predictions • Compare performance predictions of fuel cell only and fuel cell hybrid vehicle scenarios• Optimize component sizing and control for maximum benefit
0.5
0.6
0.7
0.8
0.9
1
1.1
0 500 1000 1500 2000Current Density (mA/cm^2)
Cel
l Vol
tage
(V)
ADVISOR (0.21 atm)
Nafion 112 (80C, 30psi, air)
ADVISOR (2 atm)
Nafion 112 (80C, 30psi, 100% 02)
Same Fuel Cell TechnologyBetter System Attributes
2010 Targets
Thermal and Water Management

19
Fuel Cell Vehicle Thermal and Water Management
• Model revisions– Variable air density with respect to altitude– Scaling factors for components
• Assessing impacts of altitude and relative humidity on fuel consumption, heat rejection, and water balance
• Impacts most significant in high power drive cycles (i.e. US06)– 14% increase in fuel consumption from 0m to 3000m elevation
• Preliminary results published at EVS-20 and Fuel Cell Seminar

20
Water supply and demand affected by operating point and environment
Water required for cathode humidification (80% RH)Water available in ambient air
Case 2 Cold and Dry Environment
High Temp and Low PressureAmbient supply provides <1% of demand
Case 1 Hot and Humid EnvironmentLow Temp and High Pressure
Ambient supply provides >80% of demand

21
Impacts of Relative Humidity on State of WaterNREL to Vail Drive Cycle
• Condenser fan used to maintain balance of water in a reservoir
• Variation in ambient conditions only minor impact on fuel economy (fan power)
• Results can be used to tune component sizes and control
0 1000 2000 3000 4000 50000
50
100
150
Veh
icle
spe
ed [k
m/h
]
0 1000 2000 3000 4000 50001000
2000
3000
4000
Tim e [s ]
Ele
vatio
n [m
]
0 1000 2000 3000 4000 5000 60000
50
100
150
Veh
icle
spe
ed [k
m/h
]
0 1000 2000 3000 4000 5000 60001000
2000
3000
4000
Tim e [s ]
Ele
vatio
n [m
]
NREL to Va il
Va il to NREL

22
Next StepsFuel Cell Hybrid Vehicles with Robust Operation
• Need to size component appropriately for a variety of ambient conditions
• Fuel cell humidification requirements difficult to satisfy in dry climates
• Rejecting low grade waste heat challenging in hot climates
Pikes Peak, ColoradoCold, Dry, andHigh ElevationDenver, Colorado
Moderate Temp, Dry, and Moderate Elevation Miami, Florida
Hot, Humid, andLow Elevation
Death Valley, CaliforniaHot, Dry, andLow Elevation
23
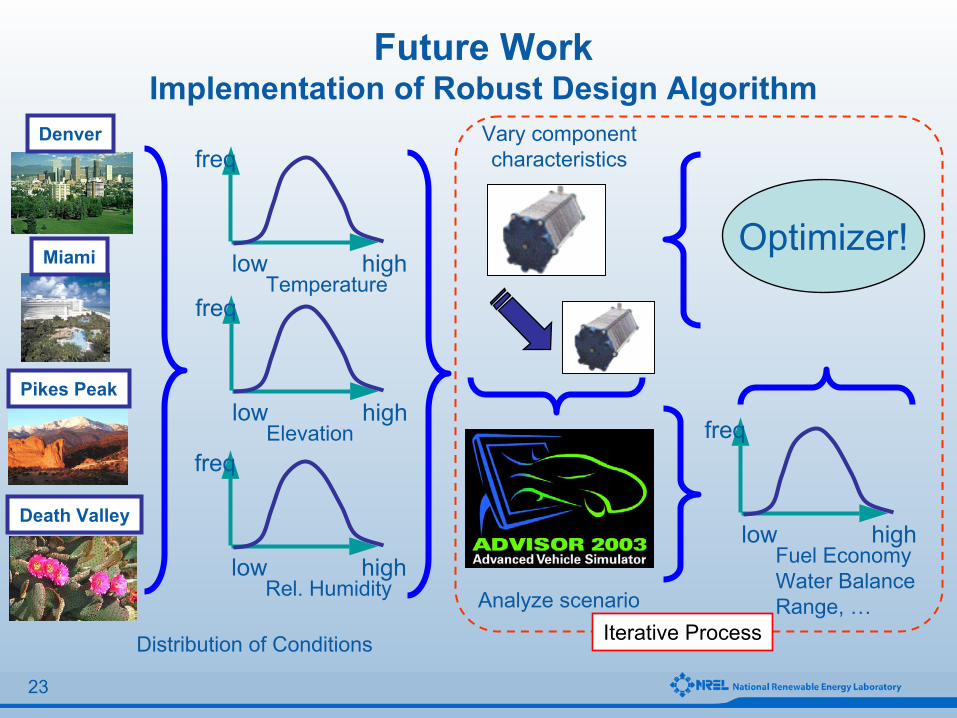
Future WorkImplementation of Robust Design Algorithm
low high
freq
Temperature
low high
freq
Elevation
low high
freq
Rel. Humidity
Pikes Peak
Denver
Miami
Death Valleylow high
freq
Fuel EconomyWater BalanceRange, …
Vary componentcharacteristics
Optimizer!
Analyze scenario
Distribution of Conditions Iterative Process

24
Responses to Previous Year Reviewer’s Comments
• Prefer to see greater involvement of OEM’s and tech teams– Systems analysis is core to OEM’s; collaboration
challenging– Participate in and share results primarily with Systems
Analysis Tech Team• Focus on general systems issues and less on
specific component design issues– Water and thermal management analysis with respect to
ambient conditions introduced as general topic

25
Acknowledgements
• Staff Contributions – Aaron Brooker– Kristina Haraldsson– Bill Kramer– Keith Wipke
• Sponsors– Pat Davis– Nancy Garland