fuel capability demonstration test report 4 for the jea ... library/research/coal/major... · fuel...
TRANSCRIPT
B&V Project 137064
Fuel Capability Demonstration Test Report 4 for the
JEA Large-Scale CFB Combustion Demonstration Project
80 / 20 Blend Petroleum Coke and Pittsburgh 8 Coal Fuel
Submitted to U.S. DEPARTMENT OF ENERGY National Energy Technology Laboratory (NETL) Pittsburgh, Pennsylvania 15236 Cooperative Agreement No. DE-FC21-90MC27403
March 31, 2005
DOE Issue, Rev. 1
Prepared by Black & Veatch for:
B&V Project 137064
TABLE OF CONTENTS
1.0 INTRODUCTION .................................................................................................................1 1.1 TEST SCHEDULE ...............................................................................................................................1 1.2 ABBREVIATIONS ................................................................................................................................3
2.0 SUMMARY OF TEST RESULTS........................................................................................7 2.1 TEST REQUIREMENTS........................................................................................................................7 2.2 VALVE LINE-UP REQUIREMENTS .......................................................................................................7 2.3 TEST RESULTS ..................................................................................................................................7
3.0 BOILER EFFICIENCY TESTS ..........................................................................................12 3.1 CALCULATION METHOD...................................................................................................................12 3.2 DATA AND SAMPLE ACQUISITION.....................................................................................................13
4.0 AQCS INLET AND STACK TESTS ..................................................................................14 4.1 SYSTEM DESCRIPTION.....................................................................................................................14 4.2 UNIT EMISSIONS DESIGN POINTS ....................................................................................................14 4.3 EMISSION DESIGN LIMITS AND RESULTS .........................................................................................14 4.4 FLUE GAS EMISSIONS TEST METHODS ...........................................................................................16 4.5 CONTINUOUS EMISSION MONITORING SYSTEM................................................................................17
ATTACHMENTS.............................................................................................................................18 ATTACHMENT A - FUEL CAPABILITY DEMONSTRATION TEST PROTOCOL ATTACHMENT B - BOILER EFFICIENCY CALCULATION ATTACHMENT C - CAE TEST REPORT ATTACHMENT D - PI DATA SUMMARY ATTACHMENT E - ABBREVIATION LIST ATTACHMENT F - ISOLATION VALVE LIST ATTACHMENT G - FUEL ANALYSES - 80/20 BLEND PET COKE AND PITTSBURGH 8 ATTACHMENT H - LIMESTONE ANALYSES ATTACHMENT I - BED ASH ANALYSES ATTACHMENT J - FLY ASH (AIR HEATER AND PJFF) ANALYSES ATTACHMENT K - AMBIENT DATA, AUG. 10, 2004 AND AUG. 11, 2004 ATTACHMENT L - PARTIAL LOADS AMBIENT DATA, AUG. 12, 2004, AND AUG. 13, 2004
B&V Project 137064
TABLES
TABLE 1 - TESTS RESULTS - 100% LOAD .................................................................................... 9 TABLE 2 - BOILER & SDA SO2 REMOVAL EFFICIENCY............................................................. 11 TABLE 3 - TEST RESULTS - PARTIAL LOADS ............................................................................ 11
FIGURES
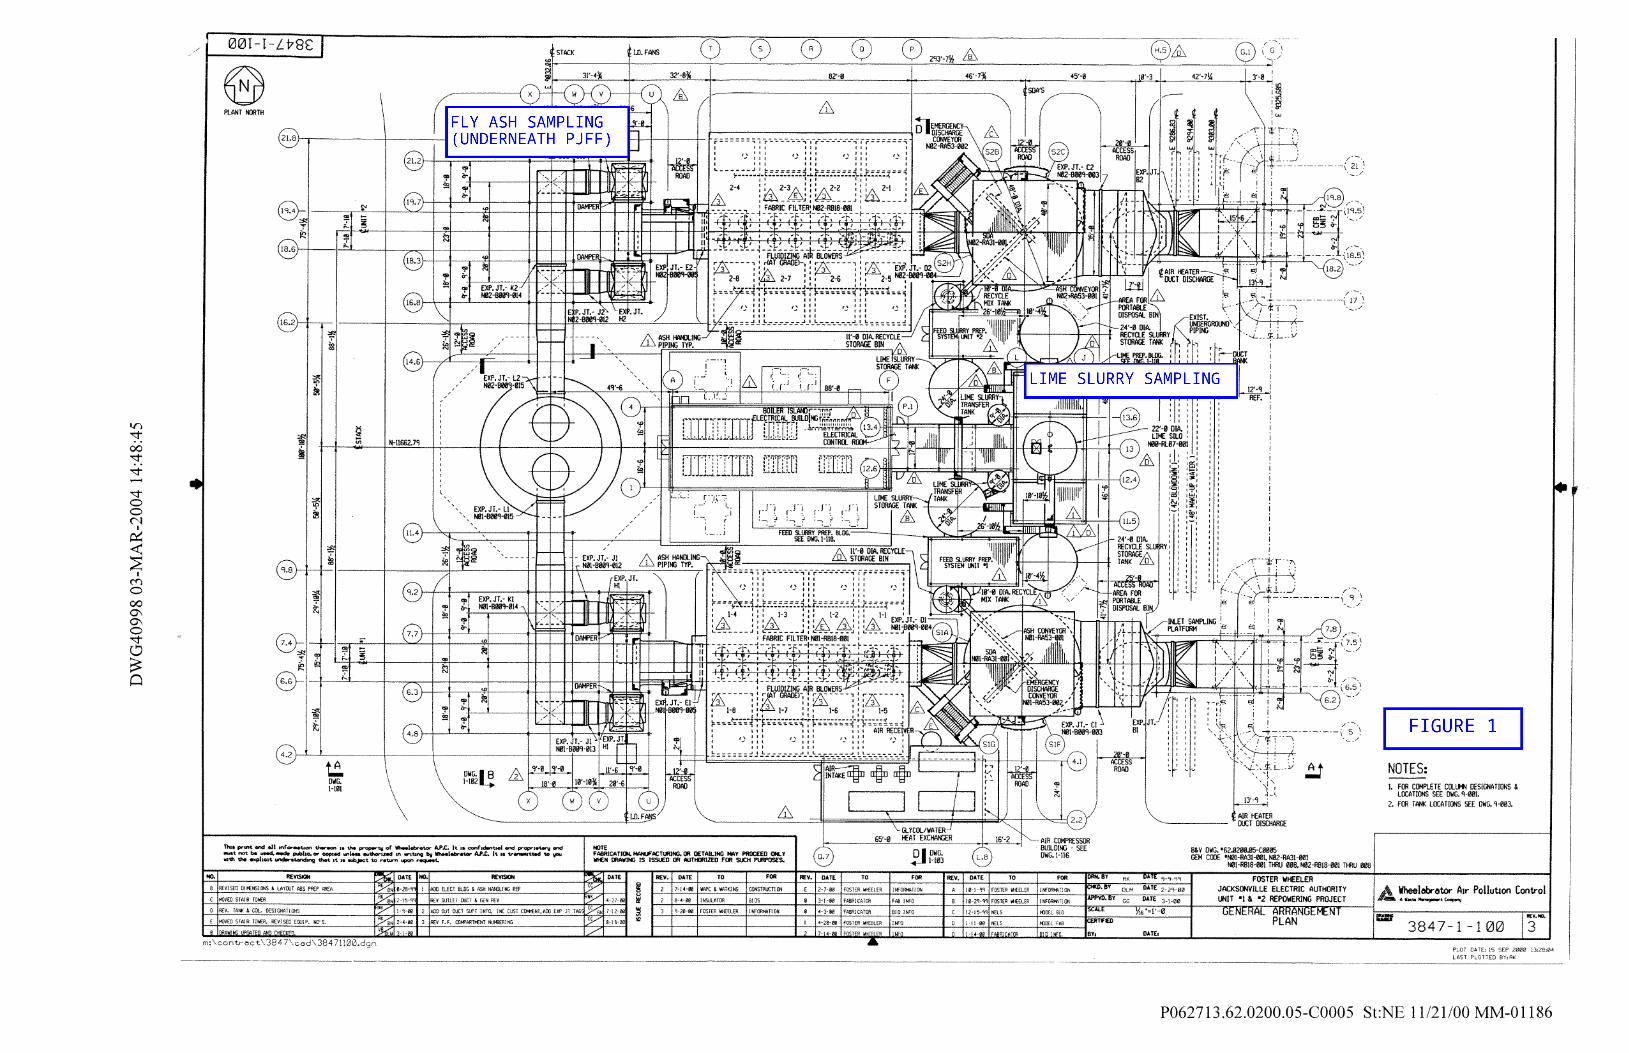
FIGURE 1 - GENERAL ARRANGEMENT PLAN, DRAWING NO. 3847-1-100, REV. 3
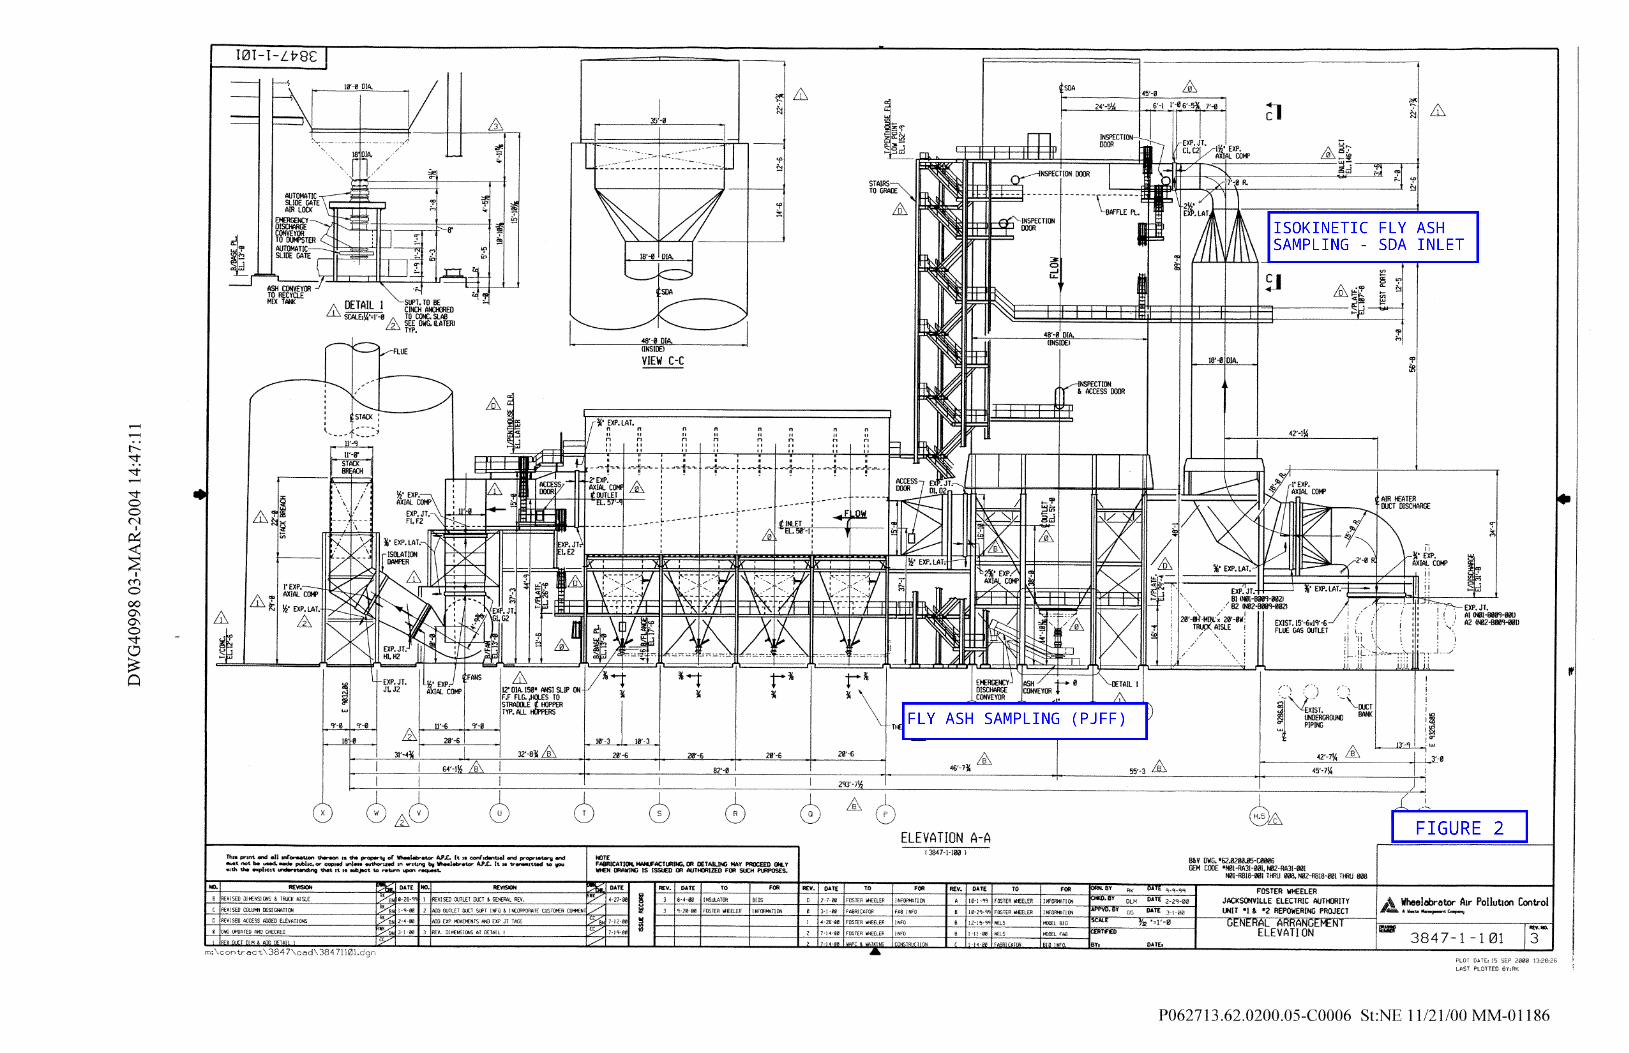
FIGURE 2 - GENERAL ARRANGEMENT ELEVATION, DRAWING NO. 3847-1-101, REV. 3
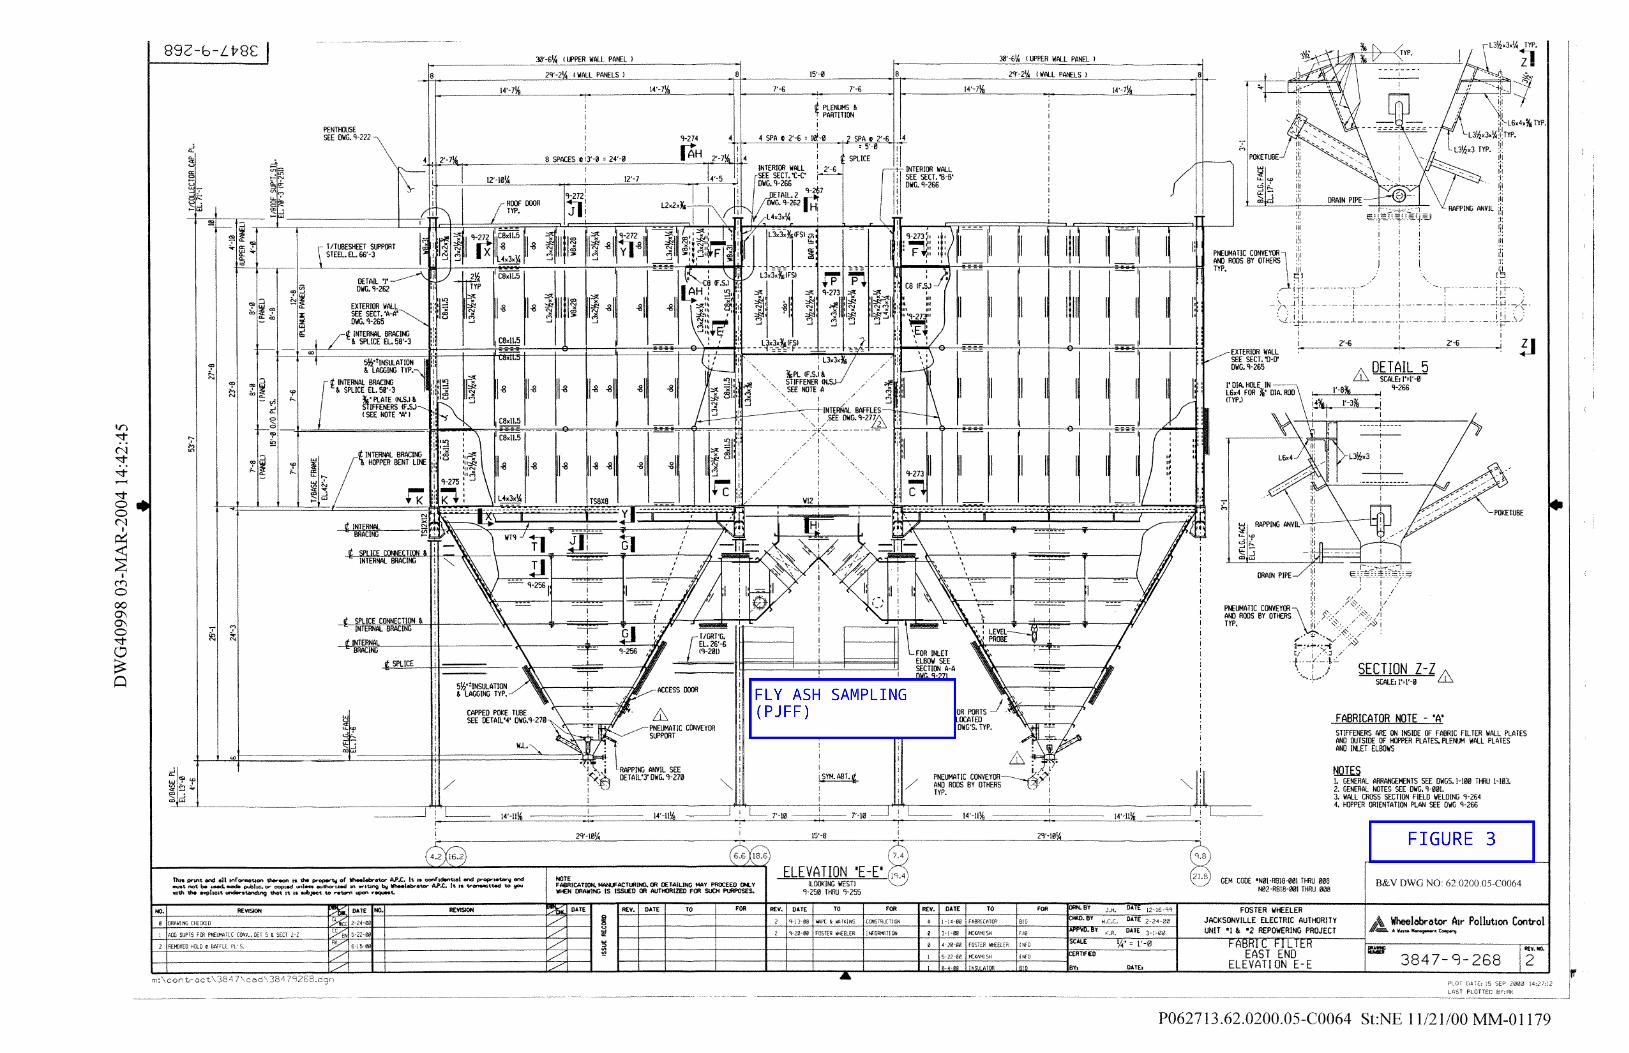
FIGURE 3 - FABRIC FILTER EAST END ELEVATION, DRAWING NO. 3847-9-268, REV. 2
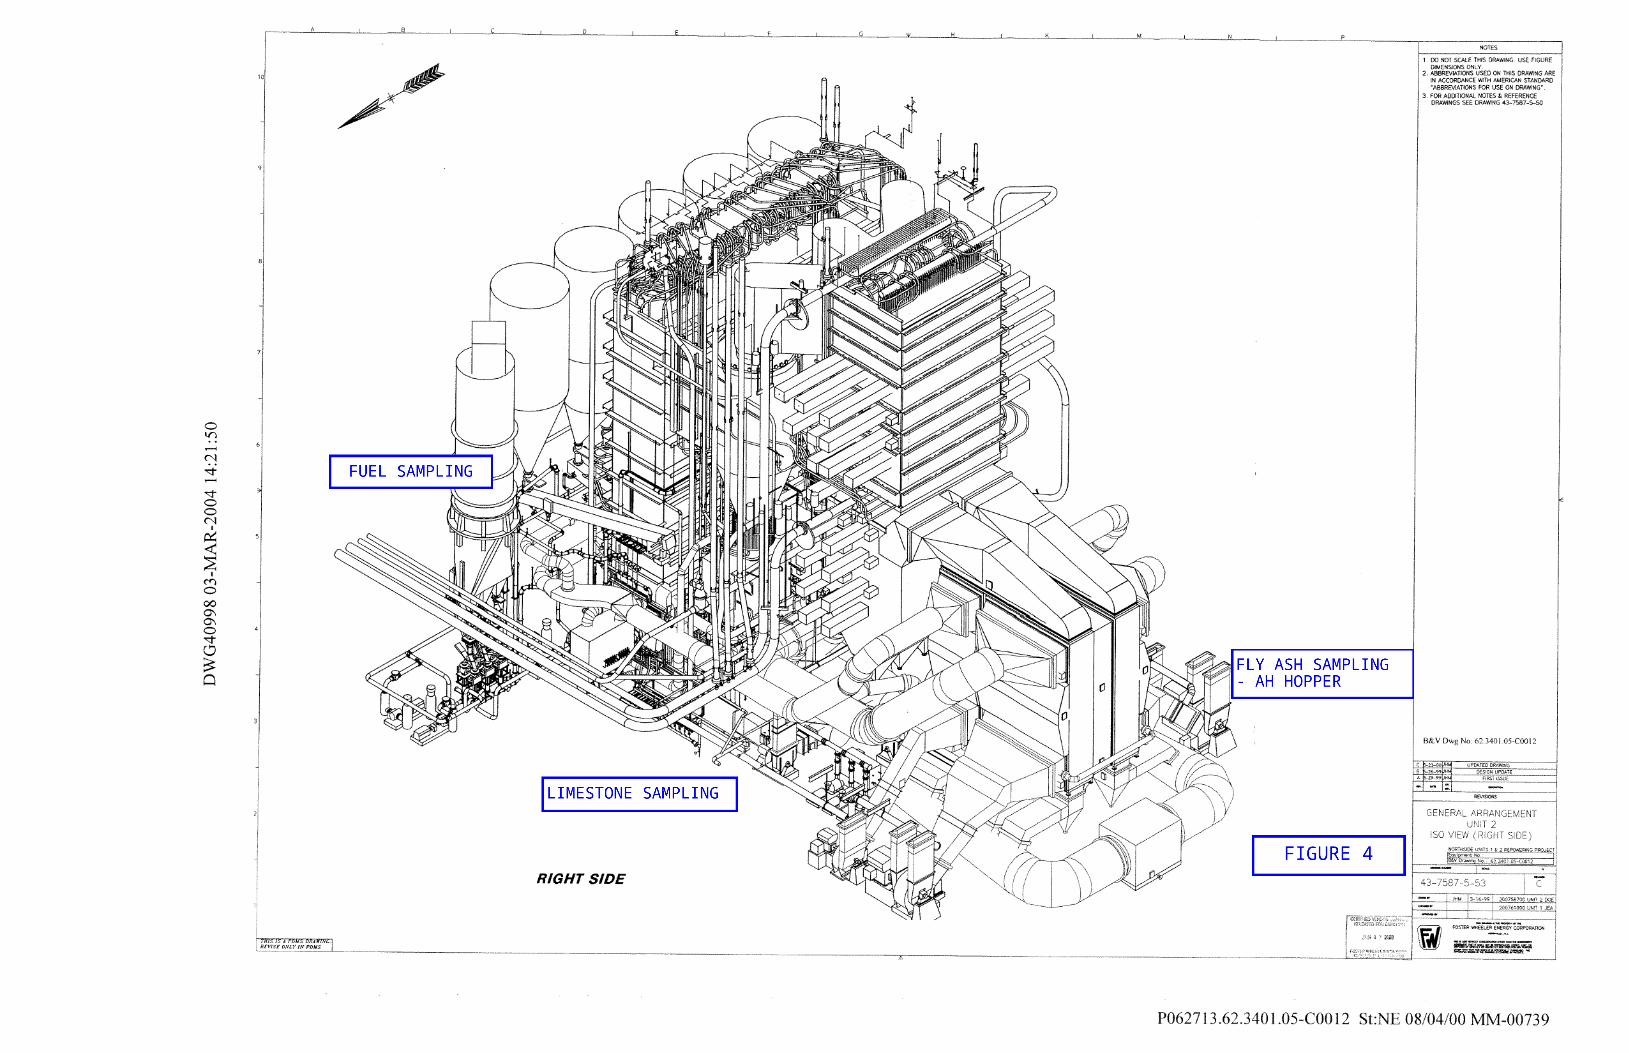
FIGURE 4 - GENERAL ARRANGEMENT UNIT 2 ISO VIEW (RIGHT SIDE), DRAWING NO. 43-7587-5-53
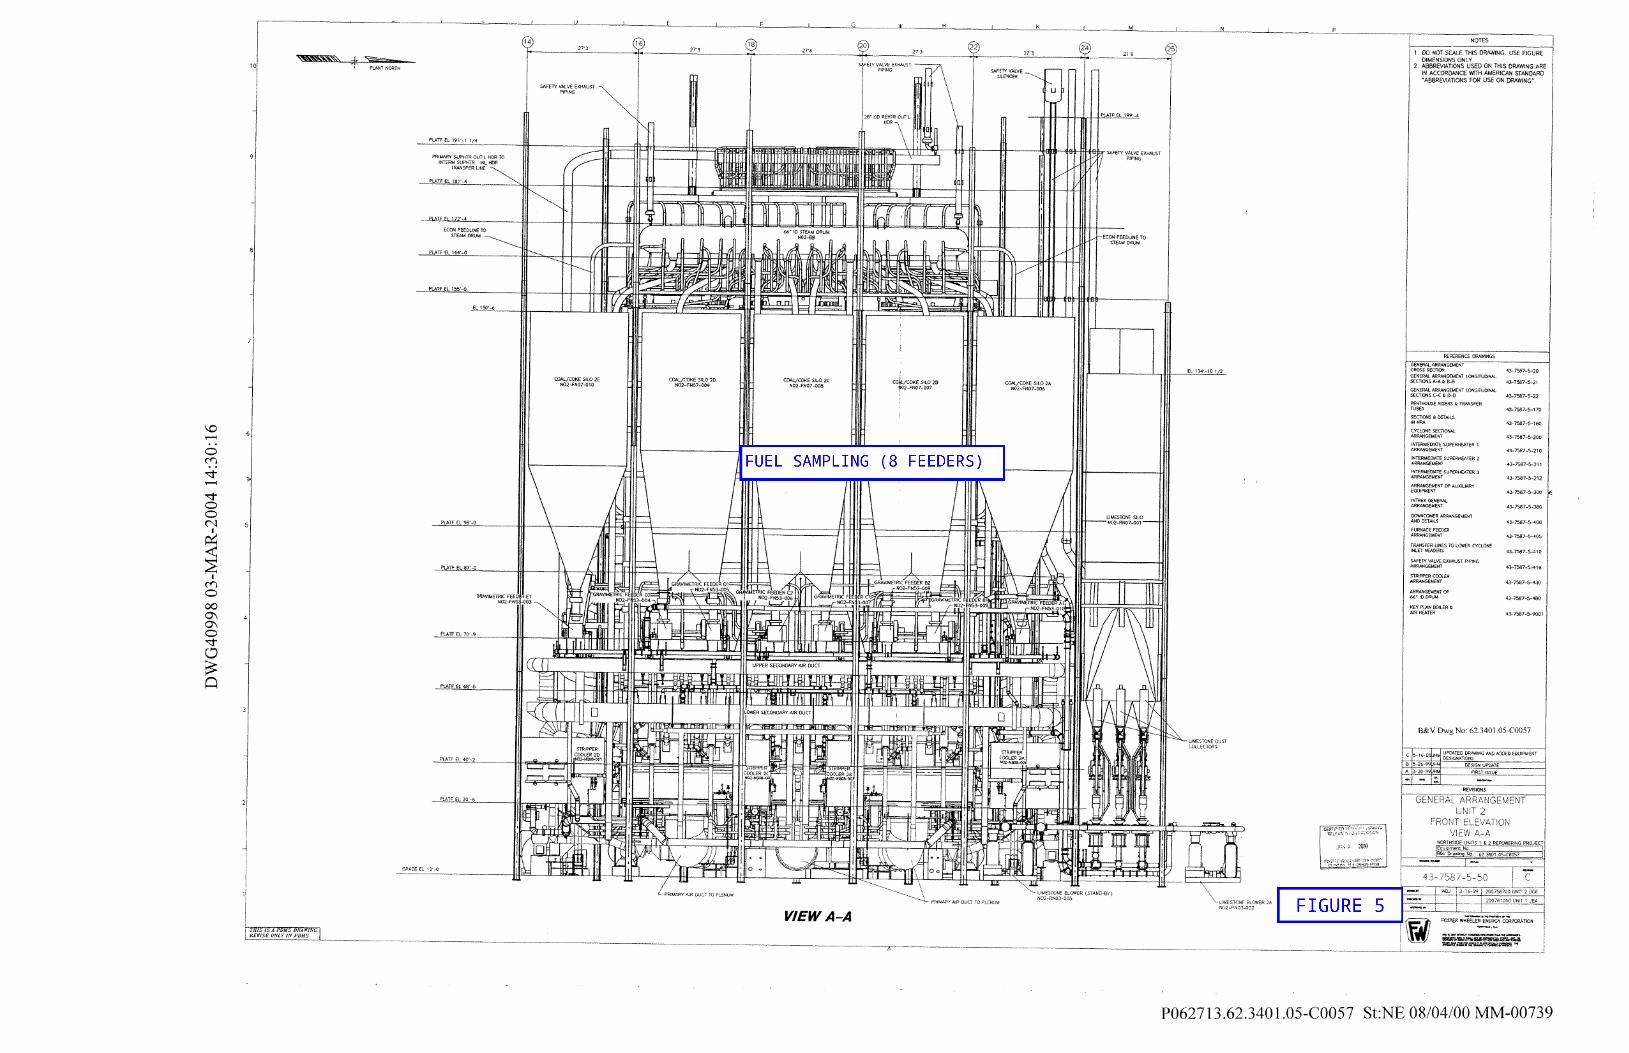
FIGURE 5 - GENERAL ARRANGEMENT UNIT 2 FRONT ELEVATION VIEW A-A, DRAWING NO. 43-7587-5-50, REV. C
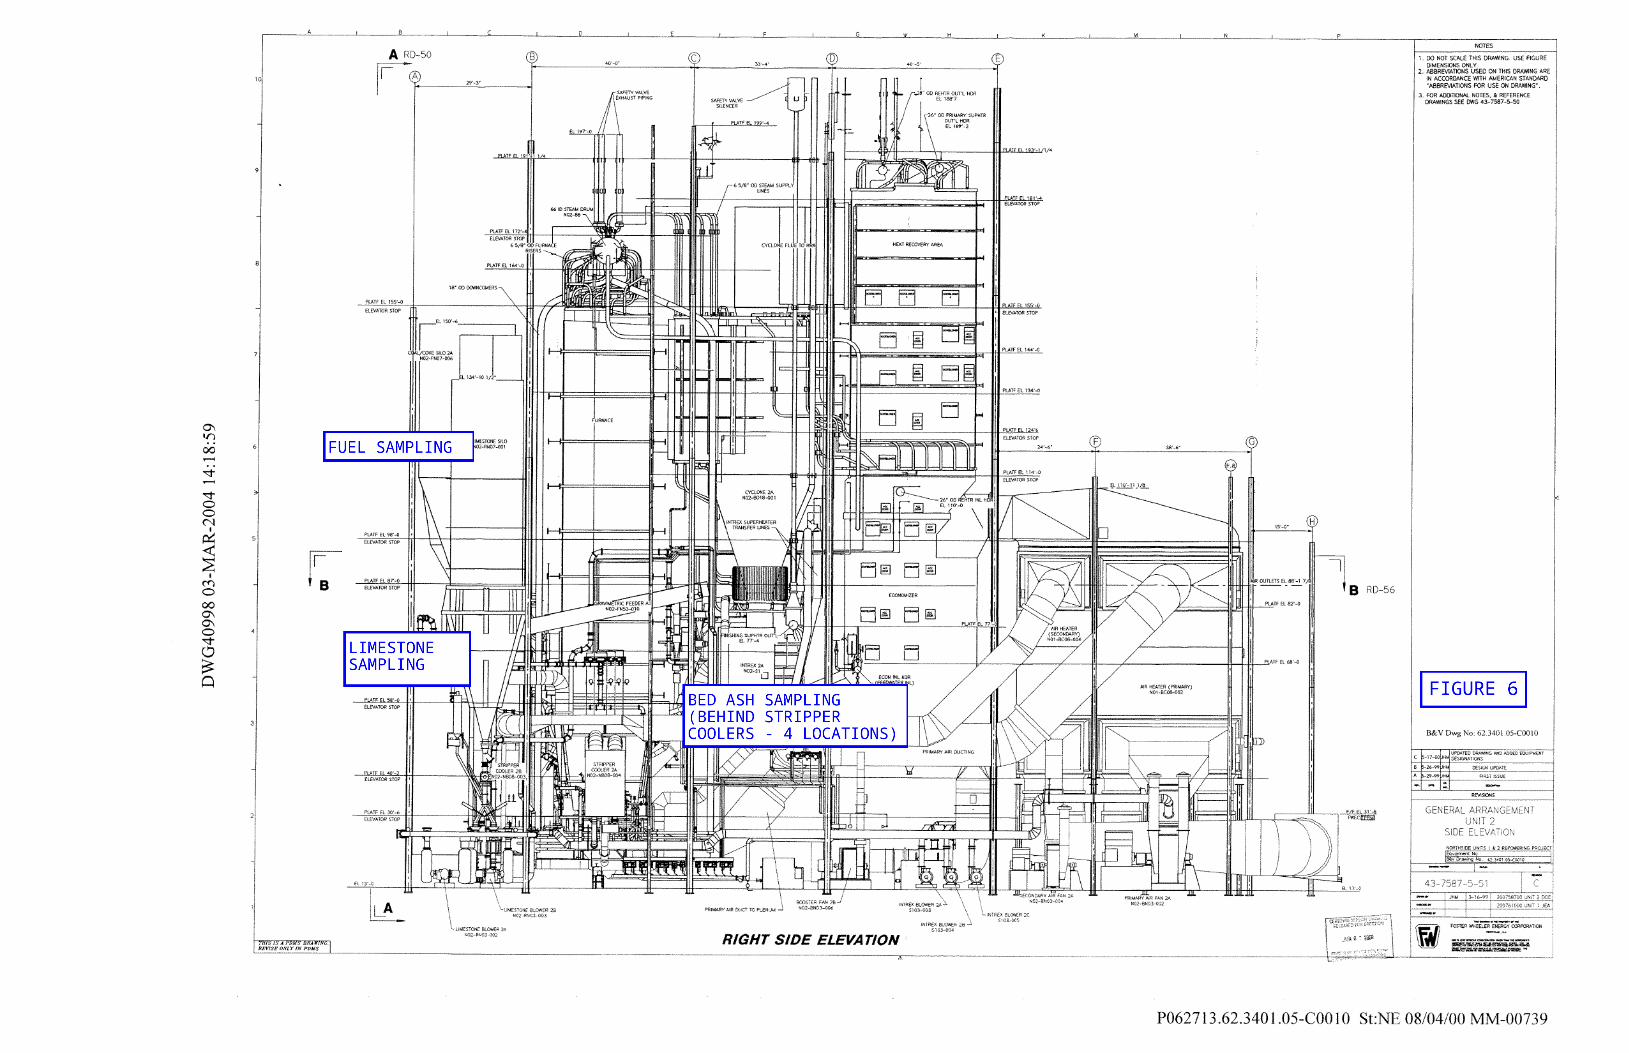
FIGURE 6 - GENERAL ARRANGEMENT UNIT 2 SIDE ELEVATION, DRAWING NO. 43-7587-5-51, REV. C
JEA Large-Scale CFB Combustion Demonstration Project
Fuel Capability Demonstration Test Report #4 p-1 80 / 20 Blend Petroleum Coke and Pittsburgh 8 Coal Fuel
B&V Project 137064
1.0 INTRODUCTION
The agreement between the US Department of Energy (DOE) and JEA covering DOE participation in the Northside Unit 2 project required JEA to demonstrate fuel flexibility of the unit to utilize a variety of different fuels. Therefore, it was necessary for JEA to demonstrate this capability through a series of tests. The purpose of the test program was to document the ability of the unit to utilize a variety of fuels and fuel blends in a cost effective and environmentally responsible manner. Fuel flexibility would be quantified by measuring the following parameters: • Boiler efficiency • CFB boiler sulfur capture • AQCS sulfur and particulate capture • The following flue gas emissions
• Particulate matter (PM) • Ammonia (NH3) • Oxides of nitrogen (NOx) • Lead (Pb) • Sulfur dioxide (SO2) • Mercury (Hg) • Carbon monoxide (CO) • Fluorine (F) • Carbon dioxide (CO2) • Dioxin
• Furan
• Stack opacity This test report documents the results of JEA’s Fuel Capability Demonstration Tests firing a 80/20 blend of Petroleum Coke and Pittsburgh 8 coal for the JEA Large-Scale CFB Combustion Demonstration Project. The term “blend” will be used throughout this report to describe the 80/20 blend of the two fuels. The tests were conducted in accordance with the Fuel Demonstration Test Protocol in Attachment A. Throughout this report, unless otherwise indicated, the term “unit” refers to the combination of the circulating fluidized bed (CFB) boiler and the air quality control system (AQCS). The AQCS consists of a lime-based spray dryer absorber (SDA) and a pulse jet fabric filter (PJFF).
1.1 Test Schedule Unit 2 of the JEA Northside plant site is a Circulating Fluidized Bed Steam Generator designed and constructed by Foster-Wheeler. The steam generator was designed to deliver main steam to the steam turbine at a flow rate of 1,993,591 lb/hr, at a throttle pressure of 2,500 psig, and at a throttle temperature of 1,000 deg F when firing Pittsburgh 8 coal. The fuel capability demonstration test for the unit firing the blended coal was conducted over a four (4) day period beginning on August 10, 2004 and completed on August 13, 2004. During that four (4) day period, data were taken in accordance with the Test Protocol (Attachment A) while the unit was operating at 100% load, 80% load, and 60% load. The 40% load was cancelled due to Hurricane Charley which came ashore as a Category 4 hurricane on August 13, 2004 and traveled
JEA Large-Scale CFB Combustion Demonstration Project
Fuel Capability Demonstration Test Report #4 p-2 80 / 20 Blend Petroleum Coke and Pittsburgh 8 Coal Fuel
B&V Project 137064
northeast towards the Jacksonville, Florida area. There are no plans to run this partial load test. The following log represents the sequence of testing: § Day 1 August 10, 2004:
o Unit at 100% load - turbine load set and maintained at approx. 300 MW. o Flue gas testing commenced at 0932 hours; completed at 2006 hours. o Coal feeder B1 tripped at 0805 hours; taken out of service at 0900 hours. The
test was run with this feeder out of service. o Boiler performance testing commenced at 0930 hours; completed at 1330
hours.
§ Day 2 August 11, 2004: o Unit at 100% load - turbine load set and maintained at approx. 300 MW. o Flue gas testing commenced at 0800 hours; completed at 1656 hours. o Boiler performance testing commenced at 0800 hours; completed at 1200
hours
§ Day 3 August 12, 2004: o Unit at 80% load - turbine load set and maintained at approx. 240 MW. o Unit began 2-hour stabilization period at 240 MW at 2230 hours. o Coal feeder E1 tripped; decision was made to leave it out of service for the
remainder of the 80% load test. o Boiler performance testing commenced at 0030 hours (8/13/04) after
stabilization period completed; test completed at 0430 hours. o Flue gas emissions data taken and recorded by CEMS system.
§ Day 4 August 12 / 13, 2004: o Unit began ramp down to approximately 60% load; began 2-hour stabilization
period at 180 MW at 2000 hours. o Boiler performance testing commenced at 0045 hours after stabilization period
completed; test completed at 0445 hours, Aug. 13, 2004. o Flue gas emissions data taken and recorded by CEMS system.
JEA Large-Scale CFB Combustion Demonstration Project
Fuel Capability Demonstration Test Report #4 p-3 80 / 20 Blend Petroleum Coke and Pittsburgh 8 Coal Fuel
B&V Project 137064
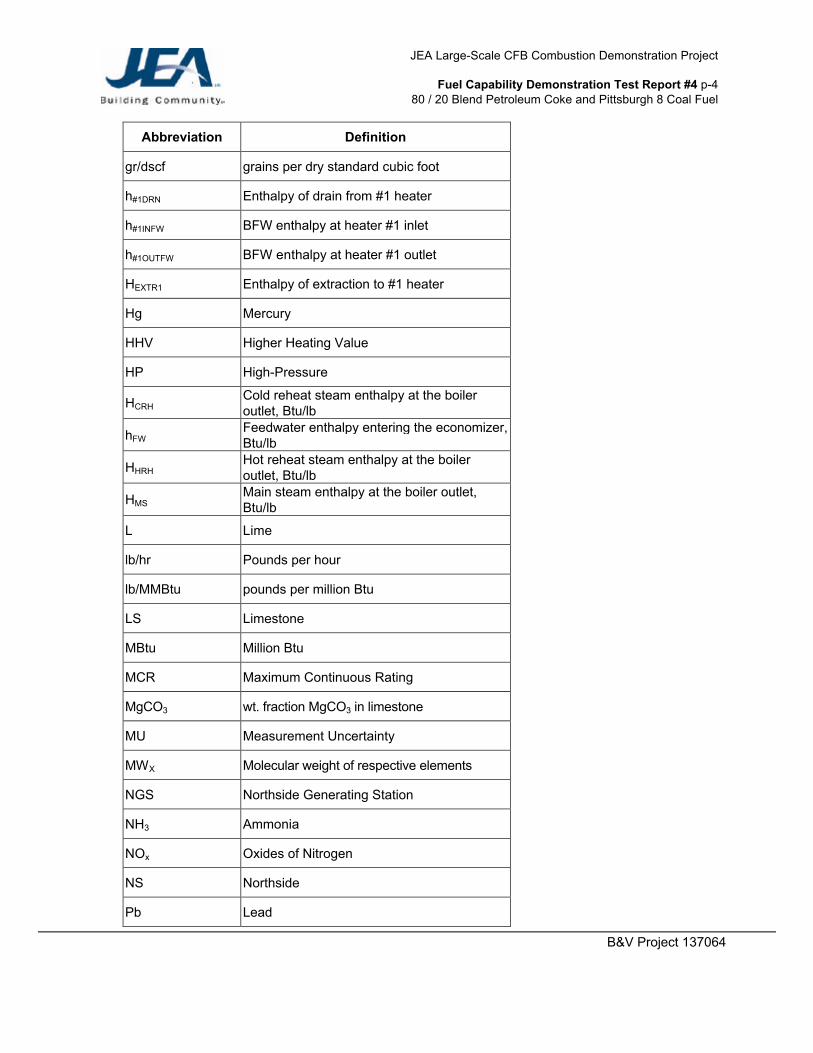
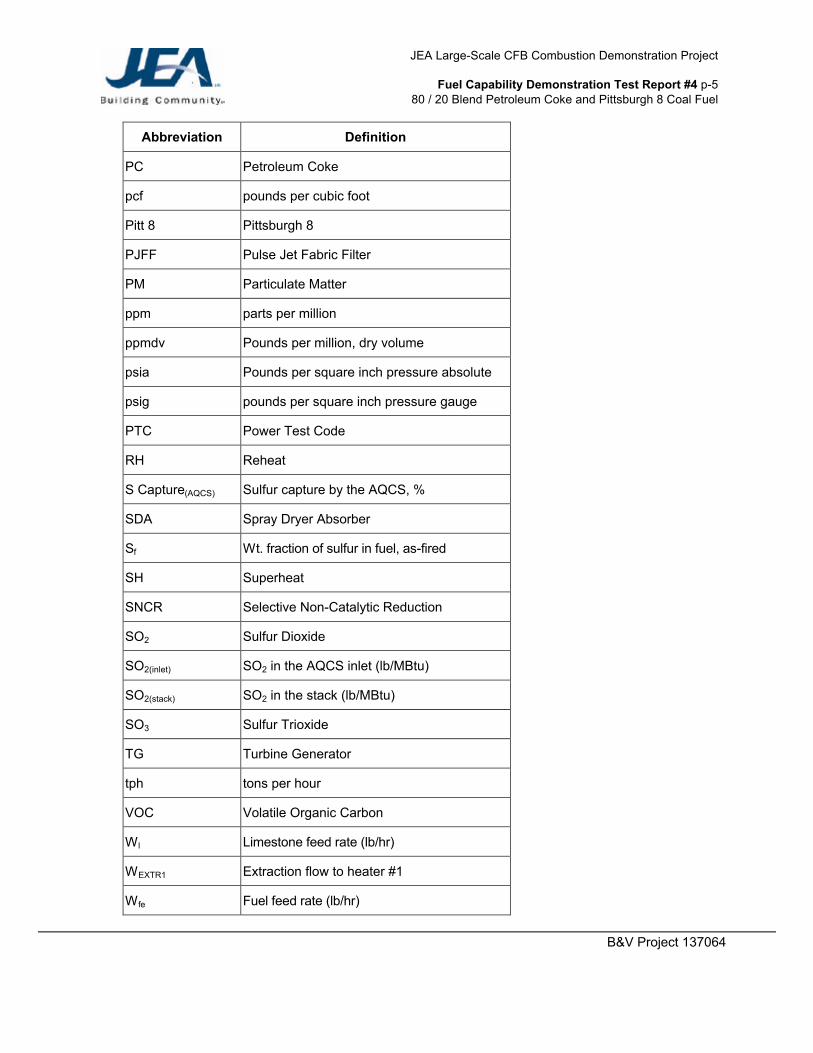
1.2 Abbreviations Following is a definition of abbreviations used in this report. Note that at their first use, these terms are fully defined in the text of the report, followed by the abbreviation in the parenthesis. Subsequent references use the abbreviation only.
Abbreviation Definition
A.F. As-Fired
AQCS Air Quality Control System
BA Bed Ash
BOP Balance of Plant
btu British Thermal Unit
C Coal
CaCO3 wt. fraction CaCO3 in limestone
Ca:S Calcium to Sulfur Ration
CaO Lime
Cb Pounds of carbon per pound of “as-fired” fuel
CEMS Continuous Emissions Monitoring System
CFB Circulating Fluidized Bed
CO Carbon Monoxide
CO2 Carbon Dioxide
COMS Continuous Opacity Monitoring System
DAHS Data Acquisition Handling System
DCS Distributed Control System
DOE Department of Energy
F Fluorine or Degrees Fahrenheit
FA Fly ash
FF Fabric Filter
gpm gallons per minute
gr/acf grains per actual cubic foot
JEA Large-Scale CFB Combustion Demonstration Project
Fuel Capability Demonstration Test Report #4 p-4 80 / 20 Blend Petroleum Coke and Pittsburgh 8 Coal Fuel
B&V Project 137064
Abbreviation Definition
gr/dscf grains per dry standard cubic foot
h#1DRN Enthalpy of drain from #1 heater
h#1INFW BFW enthalpy at heater #1 inlet
h#1OUTFW BFW enthalpy at heater #1 outlet
HEXTR1 Enthalpy of extraction to #1 heater
Hg Mercury
HHV Higher Heating Value
HP High-Pressure
HCRH Cold reheat steam enthalpy at the boiler outlet, Btu/lb
hFW Feedwater enthalpy entering the economizer, Btu/lb
HHRH Hot reheat steam enthalpy at the boiler outlet, Btu/lb
HMS Main steam enthalpy at the boiler outlet, Btu/lb
L Lime
lb/hr Pounds per hour
lb/MMBtu pounds per million Btu
LS Limestone
MBtu Million Btu
MCR Maximum Continuous Rating
MgCO3 wt. fraction MgCO3 in limestone
MU Measurement Uncertainty
MWX Molecular weight of respective elements
NGS Northside Generating Station
NH3 Ammonia
NOx Oxides of Nitrogen
NS Northside
Pb Lead
JEA Large-Scale CFB Combustion Demonstration Project
Fuel Capability Demonstration Test Report #4 p-5 80 / 20 Blend Petroleum Coke and Pittsburgh 8 Coal Fuel
B&V Project 137064
Abbreviation Definition
PC Petroleum Coke
pcf pounds per cubic foot
Pitt 8 Pittsburgh 8
PJFF Pulse Jet Fabric Filter
PM Particulate Matter
ppm parts per million
ppmdv Pounds per million, dry volume
psia Pounds per square inch pressure absolute
psig pounds per square inch pressure gauge
PTC Power Test Code
RH Reheat
S Capture(AQCS) Sulfur capture by the AQCS, %
SDA Spray Dryer Absorber
Sf Wt. fraction of sulfur in fuel, as-fired
SH Superheat
SNCR Selective Non-Catalytic Reduction
SO2 Sulfur Dioxide
SO2(inlet) SO2 in the AQCS inlet (lb/MBtu)
SO2(stack) SO2 in the stack (lb/MBtu)
SO3 Sulfur Trioxide
TG Turbine Generator
tph tons per hour
VOC Volatile Organic Carbon
W l Limestone feed rate (lb/hr)
WEXTR1 Extraction flow to heater #1
Wfe Fuel feed rate (lb/hr)
JEA Large-Scale CFB Combustion Demonstration Project
Fuel Capability Demonstration Test Report #4 p-6 80 / 20 Blend Petroleum Coke and Pittsburgh 8 Coal Fuel
B&V Project 137064
Abbreviation Definition
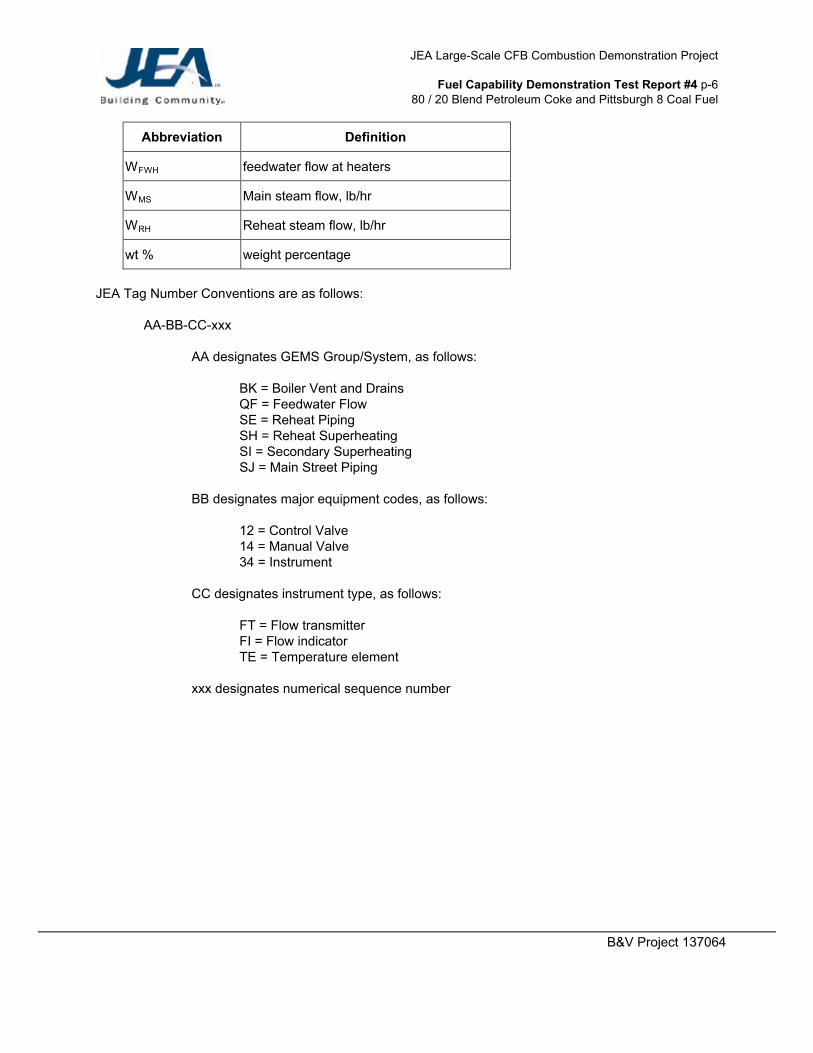
WFWH feedwater flow at heaters
WMS Main steam flow, lb/hr
WRH Reheat steam flow, lb/hr
wt % weight percentage
JEA Tag Number Conventions are as follows: AA-BB-CC-xxx AA designates GEMS Group/System, as follows: BK = Boiler Vent and Drains
QF = Feedwater Flow SE = Reheat Piping SH = Reheat Superheating SI = Secondary Superheating SJ = Main Street Piping BB designates major equipment codes, as follows: 12 = Control Valve 14 = Manual Valve 34 = Instrument CC designates instrument type, as follows: FT = Flow transmitter FI = Flow indicator TE = Temperature element xxx designates numerical sequence number
JEA Large-Scale CFB Combustion Demonstration Project
Fuel Capability Demonstration Test Report #4 p-7 80 / 20 Blend Petroleum Coke and Pittsburgh 8 Coal Fuel
B&V Project 137064
2.0 SUMMARY OF TEST RESULTS
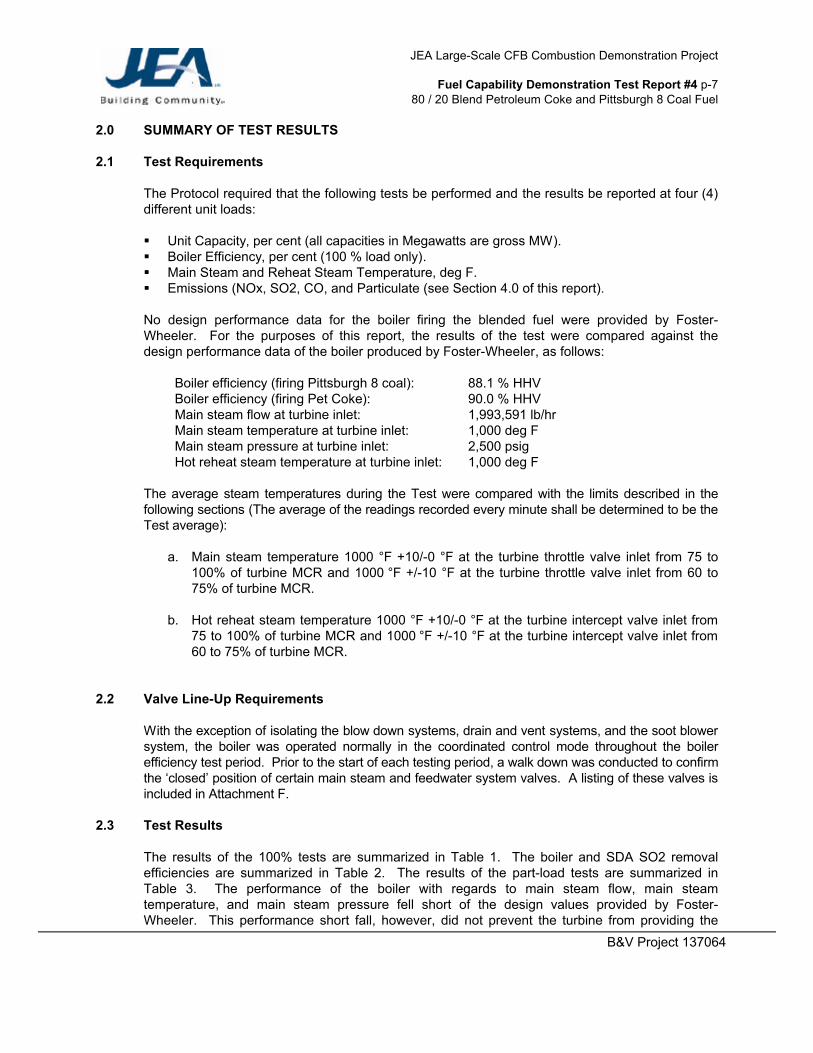
2.1 Test Requirements The Protocol required that the following tests be performed and the results be reported at four (4) different unit loads: § Unit Capacity, per cent (all capacities in Megawatts are gross MW). § Boiler Efficiency, per cent (100 % load only). § Main Steam and Reheat Steam Temperature, deg F. § Emissions (NOx, SO2, CO, and Particulate (see Section 4.0 of this report). No design performance data for the boiler firing the blended fuel were provided by Foster-Wheeler. For the purposes of this report, the results of the test were compared against the design performance data of the boiler produced by Foster-Wheeler, as follows:
Boiler efficiency (firing Pittsburgh 8 coal): 88.1 % HHV Boiler efficiency (firing Pet Coke): 90.0 % HHV Main steam flow at turbine inlet: 1,993,591 lb/hr Main steam temperature at turbine inlet: 1,000 deg F Main steam pressure at turbine inlet: 2,500 psig Hot reheat steam temperature at turbine inlet: 1,000 deg F
The average steam temperatures during the Test were compared with the limits described in the following sections (The average of the readings recorded every minute shall be determined to be the Test average):
a. Main steam temperature 1000 °F +10/-0 °F at the turbine throttle valve inlet from 75 to
100% of turbine MCR and 1000 °F +/-10 °F at the turbine throttle valve inlet from 60 to 75% of turbine MCR.
b. Hot reheat steam temperature 1000 °F +10/-0 °F at the turbine intercept valve inlet from
75 to 100% of turbine MCR and 1000 °F +/-10 °F at the turbine intercept valve inlet from 60 to 75% of turbine MCR.
2.2 Valve Line-Up Requirements With the exception of isolating the blow down systems, drain and vent systems, and the soot blower system, the boiler was operated normally in the coordinated control mode throughout the boiler efficiency test period. Prior to the start of each testing period, a walk down was conducted to confirm the ‘closed’ position of certain main steam and feedwater system valves. A listing of these valves is included in Attachment F.
2.3 Test Results
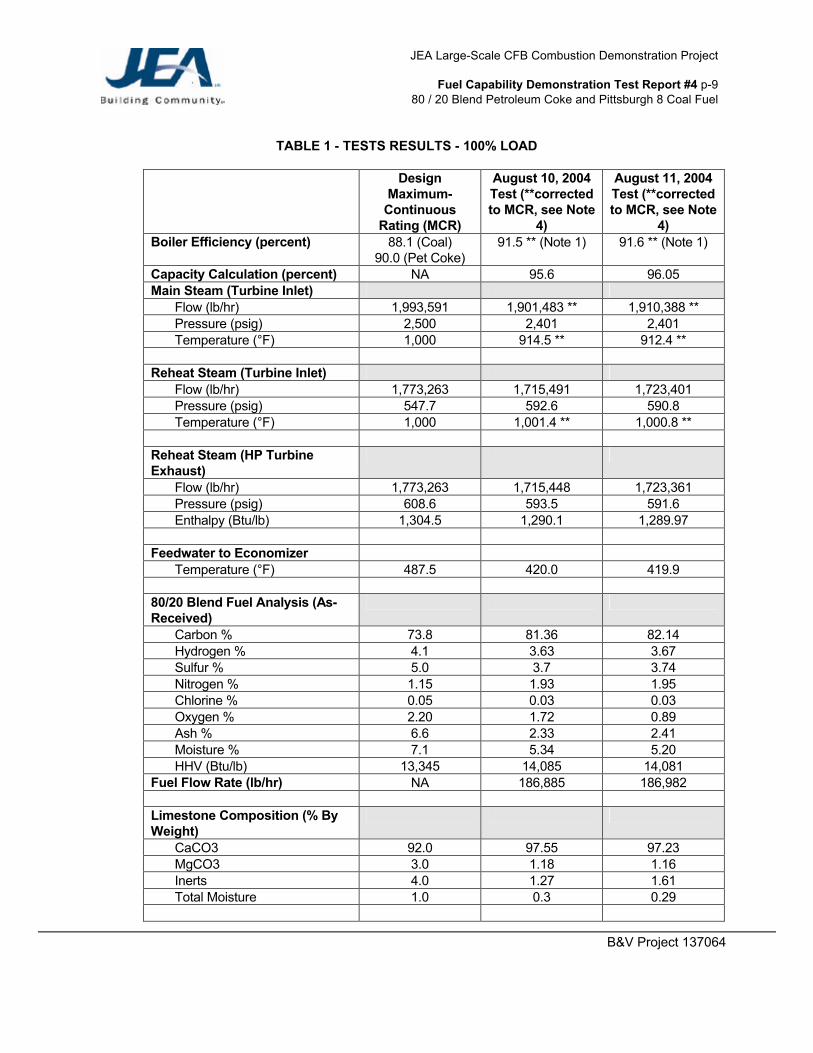
The results of the 100% tests are summarized in Table 1. The boiler and SDA SO2 removal efficiencies are summarized in Table 2. The results of the part-load tests are summarized in Table 3. The performance of the boiler with regards to main steam flow, main steam temperature, and main steam pressure fell short of the design values provided by Foster-Wheeler. This performance short fall, however, did not prevent the turbine from providing the
JEA Large-Scale CFB Combustion Demonstration Project
Fuel Capability Demonstration Test Report #4 p-8 80 / 20 Blend Petroleum Coke and Pittsburgh 8 Coal Fuel
B&V Project 137064
required megawatt output. It should be noted that the main steam temperature was controlled to a value below 950 deg F, as there were some stress issues with the superheater. The hot reheat temperature into the steam turbine met the design values provided by Foster-Wheeler. Just after the start of the first 100% load test, the B1 feeder tripped. The decision was made to leave the feeder out of service and continue with the test. At the start of the 80% MCR test, the E1 feeder tripped. The test was completed with the E1 feeder out of service once the unit was stabilized. No further problems with the fuel feeding system were observed or recorded during the remainder of the part-load testing periods.
JEA Large-Scale CFB Combustion Demonstration Project
Fuel Capability Demonstration Test Report #4 p-9 80 / 20 Blend Petroleum Coke and Pittsburgh 8 Coal Fuel
B&V Project 137064
TABLE 1 - TESTS RESULTS - 100% LOAD
Design
Maximum-Continuous
Rating (MCR)
August 10, 2004 Test (**corrected to MCR, see Note
4)
August 11, 2004 Test (**corrected to MCR, see Note
4) Boiler Efficiency (percent) 88.1 (Coal)
90.0 (Pet Coke) 91.5 ** (Note 1) 91.6 ** (Note 1)
Capacity Calculation (percent) NA 95.6 96.05 Main Steam (Turbine Inlet)
Flow (lb/hr) 1,993,591 1,901,483 ** 1,910,388 ** Pressure (psig) 2,500 2,401 2,401 Temperature (°F) 1,000 914.5 ** 912.4 **
Reheat Steam (Turbine Inlet)
Flow (lb/hr) 1,773,263 1,715,491 1,723,401 Pressure (psig) 547.7 592.6 590.8 Temperature (°F) 1,000 1,001.4 ** 1,000.8 **
Reheat Steam (HP Turbine Exhaust)
Flow (lb/hr) 1,773,263 1,715,448 1,723,361 Pressure (psig) 608.6 593.5 591.6 Enthalpy (Btu/lb) 1,304.5 1,290.1 1,289.97
Feedwater to Economizer
Temperature (°F) 487.5 420.0 419.9 80/20 Blend Fuel Analysis (As-Received)
Carbon % 73.8 81.36 82.14 Hydrogen % 4.1 3.63 3.67 Sulfur % 5.0 3.7 3.74 Nitrogen % 1.15 1.93 1.95 Chlorine % 0.05 0.03 0.03 Oxygen % 2.20 1.72 0.89 Ash % 6.6 2.33 2.41 Moisture % 7.1 5.34 5.20 HHV (Btu/lb) 13,345 14,085 14,081
Fuel Flow Rate (lb/hr) NA 186,885 186,982 Limestone Composition (% By Weight)
CaCO3 92.0 97.55 97.23 MgCO3 3.0 1.18 1.16 Inerts 4.0 1.27 1.61 Total Moisture 1.0 0.3 0.29
JEA Large-Scale CFB Combustion Demonstration Project
Fuel Capability Demonstration Test Report #4 p-10 80 / 20 Blend Petroleum Coke and Pittsburgh 8 Coal Fuel
B&V Project 137064
Design Maximum-
Continuous Rating (MCR)
August 10, 2004 Test (**corrected to MCR, see Note
4)
August 11, 2004 Test (**corrected to MCR, see Note
4)
AQCS Lime Slurry Composition (% By Weight)
CaO (See Note 5) 85.0 46.24 46.24 MgO and inerts (See Note 5) 15.0 53.76 53.76 AQCS Lime Slurry Density – % Solids
35 1.25 1.41
Boiler Limestone Feedrate, lb/hr 66,056 (maximum
value) 50,892 50,405
Flue Gas Emissions
Nitrogen Oxides, NOx, lb/MMBtu (HHV)
0.09 0.0127 0.0081
Uncontrolled SO2, lb/MMBtu (HHV) - based on 80/20 blend
7.49 5.25 5.312
Boiler Outlet SO2, lb/MMBtu (HHV) [See Note 3]
0.78 0.1150 0.1636
Stack SO2 lb/MMBtu, (HHV) 0.15 0.058 0.07 Solid Particulate matter, baghouse outlet, lb/MMBtu (HHV)
0.011
0.0024
Carbon Monoxide, CO, lb/MMBtu (HHV)
0.22 0.0127 0.0081
Opacity, percent 10 0.07 0.08 Ammonia (NH3) Slip, ppmvd 2.0 0.27 Ammonia feed rate, gal/hr NA 3.42 1.09 Lead, lb/MMBtu 2.60 x 10⁻⁵ (max) 4.424 x 10⁻⁷ Mercury (fuel and limestone), µg/g
NA 0.05
Mercury, lb/TBtu (at stack) 10.5 (max) < 0.07385 Total Mercury Removal Efficiency, percent
No requirement 98 (See Note 2)
Fluoride (as HF), lb/MMBtu 1.57 x 10⁻⁴ (max) < 5.3 x 10⁻⁶ Dioxins / Furans No Limit NOT TESTED
NOTE 1: Boiler efficiency includes a value of 0.112 % for unaccounted for losses (from Foster-
Wheeler data). NOTE 2: Refer to Section 4.3.4.1. NOTE 3: Design boiler outlet SO2 emission rate based on 85% removal of SO2 in the boiler. NOTE 4: Corrections to design MCR conditions were made in accordance with Section 6.2.1 of
Attachment A, FUEL CAPABILITY DEMONSTRATION TEST PROTOCOL. NOTE 5: These components were not captured for this test - average results from Test #1 and
Test #2 are indicated.

JEA Large-Scale CFB Combustion Demonstration Project
Fuel Capability Demonstration Test Report #4 p-11 80 / 20 Blend Petroleum Coke and Pittsburgh 8 Coal Fuel
B&V Project 137064
TABLE 2 - BOILER & SDA SO2 REMOVAL EFFICIENCY
Design Basis August 10, 2004
Test August 11, 2004
Test) Percent of total SO2 removed by
boiler 85.0 typical, with range of 75 - 90
97.8 96.9
Percent of total SO2 removed by
SDA 12.1 typical, with range 22.1 – 7.1
1.1 1.8
Percent of Total SO2 Removed 97.1 98.9 98.7 Percent of SO2 entering SDA
removed in SDA 81.0 typical with range 90 – 71
49.5 57.0
Boiler Calcium to Sulfur Ratio < 2.88 2.29 2.29
TABLE 3 - TEST RESULTS - PARTIAL LOADS (See Note 1)
Aug. 12 Aug. 13
Unit Capacity (MW) 240 180 Percent MCR Load 80% 60% Capacity Calculation (percent) 76.51 54.69 Total Main Steam Flow, lb/hr 1,393,557 1,021,784 Main Steam Temperature, deg F 980.55 980.62 Main Steam Pressure, psig 2,200.14 1,450.21 Cold Reheat Steam Temperature, deg F
579.46 595.45
Hot Reheat Steam Temperature, deg F
984.03 992.10
NOx, lb/MMBtu 0.027 0.018 CO, lb/MMBtu 0.0147 0.0218 SO2, lb/MMBtu 0.054 0.058 Opacity, percent 1 1
NOTE 1: Test at 120 MW (40% load) cancelled due to Hurricane Charlie. 2.3.1 Unit Capacity - During the four (4) day testing period, the boiler was successfully operated at
approximately 96% turbine load for day 1 and day 2 and at partial turbine loads of approximately 240 MW and 180 MW for day 3 and day 4. The load limitations during day 1 and day 2 were due to main steam temperature limitations to minimize stresses in the superheater tubes in the Intrex. The unit operated steadily at each of the stated loads without any deviation in unit output. Prior to each of the testing periods, the unit was brought to load and allowed to stabilize for two (2) hours prior to the start of each test.
2.3.2 Boiler Efficiency - The steam generator operated at corrected efficiencies of 91.5 % and 91.6% on
Day 1 and Day 2, respectively, of the testing period.
JEA Large-Scale CFB Combustion Demonstration Project
Fuel Capability Demonstration Test Report #4 p-12 80 / 20 Blend Petroleum Coke and Pittsburgh 8 Coal Fuel
B&V Project 137064
2.3.3 Steam Temperature - During both days at 100% load operation, the average corrected main steam temperature measured at the turbine inlet was 913.5 deg F, which is significantly outside the design tolerances of the unit. The turbine generator output correction for an initial main steam temperature reduction of 86.5 F would be a reduction of about 1.8 MW. Additionally, the corrected hot reheat steam temperature measured at the turbine inlet was 1,001.1 deg F, which is within the design tolerances of the unit. During partial load operation, the main steam temperatures and the hot reheat temperatures were outside the design tolerances previously listed in Section 2.1.
2.3.4 Steam Production - The steam flows of the unit at the 100% load operation cases and partial load
operation cases were each determined by adding the main steam desuperheating system flow rates to the feed water system flow rates, and subtracting the continuous blow down flow rates and the sootblowing steam flow rates. The data for each of these systems were retrieved from the plant information system database. The main steam flow rates were corrected for deviations from the design MCR feedwater temperature. Although the corrected main steam flow rates determined for the 100% load operation cases were less than the design flow rates established by Foster-Wheeler, the main steam flow rates were adequate to maintain the steam turbine at near the desired plant output. The primary reason plant output could be maintained is that the Foster Wheeler design flow rates included an approximately 2.5% design margin on main steam flow above that required by the turbine generator, to compensate for plant performance degradation over time. The main steam flow rates at the partial load operation cases were adequate to maintain the steam turbine at the required output.
2.3.5 Calcium to Sulfur Ratio (Ca:S) - The calcium to sulfur ratio represents the ability of the CFB boiler
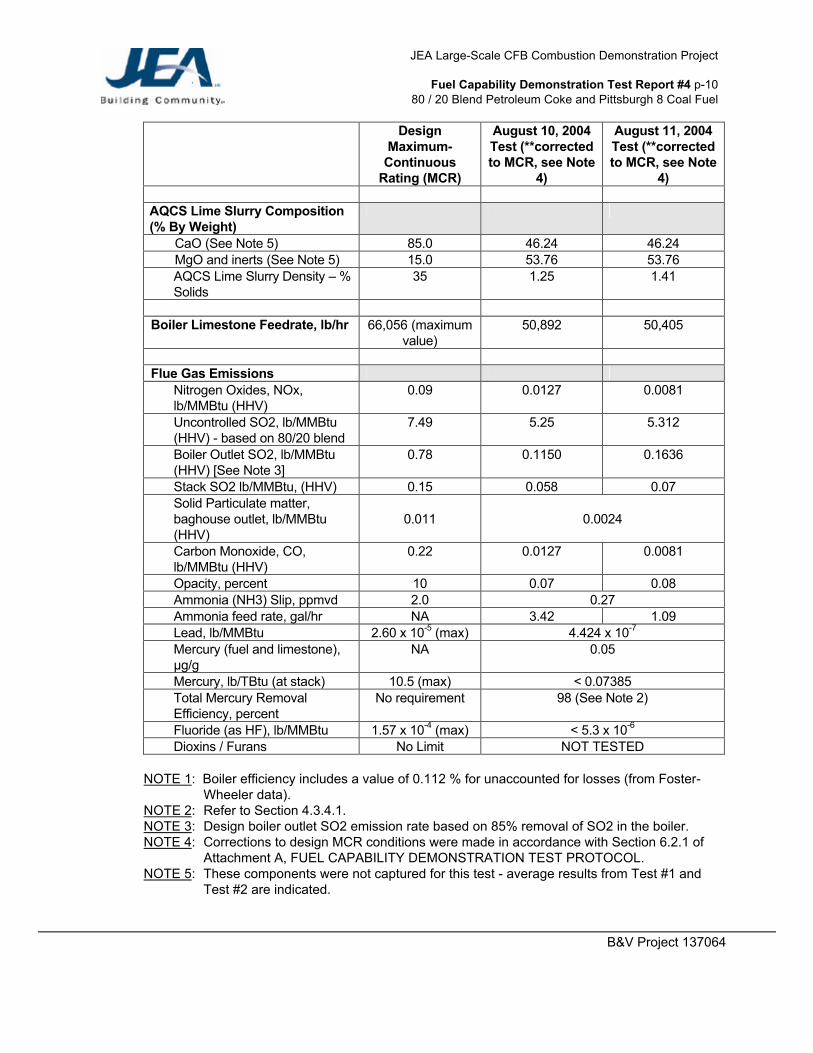
and limestone feed system to effectively remove the sulfur dioxide produced by the combustion process of the boiler. The maximum ratio established for firing the blend was 2.88. The calculated calcium to sulfur ratios for both Day 1 and Day 2 are 2.29. This value represents SO2 removal efficiencies for the boiler of greater than 95 % which are acceptable values for a CFB. SO2 reductions of greater than 90% are typically achieved in a CFB with Ca:S ratios of 2 to 2.5. These values are dependent on the sulfur content in the fuel and the reactivity of the limestone.
3.0 BOILER EFFICIENCY TESTS
The unit was operated at a steady turbine load of approximately 300 MW (100% MCR) for two (2) consecutive days as prescribed in Section 2 of the Attachment A Test Protocol. During these two days, data were recorded via the PI (Plant Information) System and were also collected by independent testing contractors. These data were then used to determine the unit’s boiler efficiency. No significant operational restrictions were observed during testing at the 100% MCR condition.
3.1 Calculation Method
The boiler efficiency calculation method was based on a combination of the abbreviated heat loss method as defined in the ASME Power Test Code (PTC) 4.1, 1974, reaffirmed 1991, and the methods described in ASME PTC 4. The method was modified to account for the heat of calcination and sulfation within the CFB boiler SO2 capture mechanism. The methods have also been modified to account for process differences between conventional and fluidized bed boilers to account for the addition of limestone. These modifications account for difference in the dry gas quantity and the additional heat loss/gain due to calcinations / sulfation. A complete description of the modified procedures is included in Section 4.2 of Attachment A. Some of the heat losses included losses due to the heat in dry flue gas, unburned carbon in the bed ash and the fly ash, and the heat loss due to radiation and convection from the insulated boiler surfaces. A complete
JEA Large-Scale CFB Combustion Demonstration Project
Fuel Capability Demonstration Test Report #4 p-13 80 / 20 Blend Petroleum Coke and Pittsburgh 8 Coal Fuel
B&V Project 137064
list of the heat losses can be found in Section 4.2.1 of Attachment A. The completed efficiency calculations are included in Attachment F to this report.
3.2 Data and Sample Acquisition During the tests, permanently installed plant instrumentation was used to measure most of the data which were required to perform the boiler efficiency calculations. The data were collected electronically utilizing JEA’s Plant Information (PI) system. The data provided by the plant instrumentation is included in Attachment D, PI Data Summary. Additional data required for the boiler efficiency calculations were provided by two independent testing contractors, PGT/ESC, and Clean Air Engineering (CAE). A summary of this information is located in Attachments G, H, I, J, and K, lab analyses provided by PGT/ESC for the fuel, limestone, bed ash, fly ash, and environmental data, and Attachment C, CAE Test Report, respectively. As directed in the test protocol (Attachment A), test data for days 1 and 2 were taken and labeled by CAE and PGT. No flue gas sampling was performed on the unit during operations at reduced loads. Data were, however, recorded by the CEMS system and are reported in this document. The majority of the data utilized in the boiler efficiency calculation and sulfur capture performance, such as combustion air and flue gas temperatures and flue gas oxygen content, were stored and retrieved by the plant information system, as noted above. Data for the as-fired fuel, limestone, and resulting bed ash, fly ash, and exiting flue gas constituents were provided via laboratory analyses. Samples were taken in the following locations by PGT and forwarded to a lab for analysis. (Refer to Figures 1 thru 6 for approximate locations). Lime (Figure 1):
Lime slurry samples were taken from the sample valve located on the discharge of the lime slurry transfer pump. This valve is located in the AQCS Spray Dryer Absorber (SDA) pump room.
Fly Ash (Figures 2, 3, and 4):
Fly Ash samples were taken by two different methods. 1) Fly ash was taken by isokinetic sampling at the inlet to the SDA. These samples were taken
to determine ash loading rates and also obtain samples for laboratory analysis of ash constituents.
2) Fly ash was also taken by grab sample method in two different locations. One grab sample was taken every hour at a single air heater outlet hopper and another grab sample at a single bag house fabric filter hopper.
Fuel (Figures 4, 5, and 6):
Fuel samples were taken from the sample port at the discharge end of each gravimetric fuel feeder. The fuel samples were collected using a coal scoop inserted through the 4 inch test port at each operating fuel conveyor.
Limestone (Figures 4 and 6):
Limestone samples were taken from the outlet of each operating limestone rotary feeder. The samples were collected using a scoop passed into the flow stream of the 4 inch test ball valve in the neck of each feeder outlet.
Bed Ash (Figure 6): Bed Ash samples were taken from each of the operating stripper cooler rotary valve outlets. The samples were taken by passing a stainless steel scoop through the 4 inch test port at each operating
JEA Large-Scale CFB Combustion Demonstration Project
Fuel Capability Demonstration Test Report #4 p-14 80 / 20 Blend Petroleum Coke and Pittsburgh 8 Coal Fuel
B&V Project 137064
stripper cooler.
As instructed by the Test Protocol, all of the samples were labeled and transferred to a lab for analysis. The average values were determined and used as input data for performing the boiler efficiency calculation. The results of the lab analyses are included in Attachments G, H, I, and J.
4.0 AQCS INLET AND STACK TESTS 4.1 System Description
The Unit 2 AQCS consists of a single, lime-based spray dryer absorber (SDA) and a multi-compartment pulse jet fabric filter (PJFF). The SDA has sixteen independent dual-fluid atomizers. The fabric filter has eight isolatable compartments. The AQCS system also uses reagent preparation and byproduct handling subsystems. The SDA byproduct solids/fly ash collected by the PJFF is pneumatically transferred from the PJFF hoppers to either the Unit 2 fly ash silo or the Unit 2 AQCS recycle bin. Fly ash from the recycle bin is slurried and reused as the primary reagent by the SDA spray atomizers. The reagent preparation system converts quicklime (CaO), which is delivered dry to the station, into a hydrated lime [Ca(OH)2] slurry, which is fed to the atomizers as a supplemental reagent.
4.2 Unit Emissions Design Points The following sections describe the desired emissions design goals of the unit. The tests were conducted in accordance with standard emissions testing practices and test methods as listed in Section 4.2.7. It should be noted that not all tests conducted fit exactly the 4 hour performance test period that was the basis of the fuel capability demonstration test. Several of the tests (especially those not based on CEMS) had durations that were different than the 4 hour performance period due to the requirements of the testing method and good engineering/testing practice. All sampling tests were done at the 100% load case only. All data at the 100%, 80%, and 60% performance load tests were collected by the CEMS (as previously stated the 40% partial load test was cancelled.).
4.3 Emission Design Limits and Results 4.3.1 NOx / SO2 / Particulate Emission Design Limits / Results
The following gaseous emissions were measured for each 4-hour interval during the Test (EPA Permit averaging period).
a. Nitrogen oxides (NOx) values in the flue gas as measured in the stack were expected to be less than 0.09 lb/MMBtu HHV fuel heat input. The hourly average lb/MMBtu values reported by the Continuous Emissions Monitoring system (CEMS) were used as the measure of NOx in the flue gas over the course of each fuel test. The average NOx values for Day 1 and Day 2, based on HHV, were 0.0127 lb/MMBtu and 0.0081 lb/MMBtu, respectively. Both of these values were less than the expected maximum value because the ammonia feed rate exceeded what was required to control emissions to the permitted level.
b. Sulfur dioxide (SO2) The design operating condition of the unit is to remove 85 percent
of the SO2 in the boiler, with the balance to make the permitted emission rate removed in the SDA. Burning performance coal with a boiler SO2 removal efficiency of 85%, the SO2
JEA Large-Scale CFB Combustion Demonstration Project
Fuel Capability Demonstration Test Report #4 p-15 80 / 20 Blend Petroleum Coke and Pittsburgh 8 Coal Fuel
B&V Project 137064
concentration at the air heater outlet was expected to be 1.12 lb/MMBtu, with an uncontrolled SO2 emission rate (at 0% SO2 removal) calculated to be 7.49 lb/MMBtu. JEA has chosen to operate at a much higher boiler SO2 removal rate than design. Part of the reason for this operating mode is that reliability of the limestone feed system during and after the startup period was inadequate, resulting in a substantial number of periods with excess SO2 emissions. Over time the operations group has learned that if limestone feed is higher than normally desired the likelihood of excess emissions during an upset is reduced. Additionally, control of the AQCS slurry density at the desired density levels has been difficult due to some instrumentation and control issues that are not completely resolved yet. Modifications to increase the reliability and consistency of limestone feed are scheduled to be complete in late 2005, which should permit a change toward lower boiler SO2 removal and increased SDA removal.
The SO2 concentration at the SDA inlet was measured by an independent test contractor, Clean Air Engineering (CAE). These results are included in Attachment C. The average SO2 values for Day 1 and Day 2, based on HHV of the fuel, out of the air heaters and into the SDA, were 0.115 lb/MMBtu and 0.1636 lb/MMBtu, respectively. Both of these values were below the expected outlet emission rate. In fact, the boiler removed 97.8% and 96.9% respectively, in comparison to the design removal rate of 85%. Uncontrolled SO2 emissions rates were calculated to be 5.25 lb/MMBtu and 5.31 lb/MMBtu, respectively, for a decreased SO2 input of 29.9% and 29.1% below the design performance coal SO2 input of 7.49 lb/MMBtu.
The SO2 emissions from the stack during the execution of the tests were expected to be less than 0.15 lb/MMBtu. The hourly average lb/MMBtu values (based on HHV of the fuel) reported by CEMS were used as the measure of SO2 emissions from the stack for the test. The average SO2 values for Day 1 and Day 2, (based on HHV of the fuel) were 0.058 lb/MMBtu and 0.07 lb/MMBtu, respectively. These values were 61% and 53% lower than the 0.15 lb/MMBtu permitted emission rate. The SO2 emissions were substantially lower than required by permit because the limestone feed exceeded the amount required to control SO2 emissions to the required level.
c. Solid particulate matter in the flue gas at the fabric filter outlet was expected to be
maintained at less than 0.011 lb/MMBtu HHV fuel heat input. These values were measured at the stack by CAE. The average particulate matter value for the testing period was 0.0024 lb/MMBtu which is below the expected maximum value.
4.3.2 CO Emissions Design Point
Carbon monoxide (CO) in the flue gas was expected to be less than or equal to 0.22 lb/MMBtu HHV fuel heat input at 100% MCR. This sample was measured at the stack by the plant CEMS. The average values for Day 1 and Day 2 were 0.0127 lb/MMBtu and 0.0081 lb/MMBtu, respectively. The average values were less than the maximum expected value.
4.3.3 SO3 Emissions Design Point Sulfur Trioxide (SO3) in the flue gas was assumed to be zero due to the high removal efficiency of the SDA. No testing was done for SO3 as explained in the Test Protocol located in Attachment A. See Section 4.2.3 of the Fuel Capability Test Protocol for the rationale.
JEA Large-Scale CFB Combustion Demonstration Project
Fuel Capability Demonstration Test Report #4 p-16 80 / 20 Blend Petroleum Coke and Pittsburgh 8 Coal Fuel
B&V Project 137064
4.3.4 NH3/ Lead/ Mercury/ Fluorine Emissions Design Points NH3, Lead, Mercury, and Fluorine gaseous emissions were measured during the Test (EPA Permit averaging period). Mercury sampling and analysis was performed at the inlet to the AQCS system in addition to the samples taken at the stack. Both samples were taken by CAE. Lead, ammonia and Fluorine were sampled only at the stack by CAE. The average values are indicated in Table 1.
4.3.4.1 Mercury Removal Mercury in the flue gas was expected to be less than or equal to 10.5 lb/TBtu HHV fuel heat input at 100% MCR. This sample was measured at the stack by CAE, an independent testing contractor. The average values for the test were 0.07385 lb/TBtu. The average values were less than the maximum expected value. The inlet to SDA/FF for the test was 3.373 lb/TBtu which resulted in a 98 percent removal efficiency. The mercury test was conducted utilizing the Ontario Hydro Test Method. The Ontario Hydro mercury speciation results are detailed in Attachment C.
4.3.5 Dioxin and Furan Emissions Design Points Dioxin and Furan gaseous emissions testing were not required for evaluation of the blend.
4.3.6 Opacity The opacity was measured by the plant CEMS/COMS (Continuous Opacity Monitoring System) to determine the opacity of the unit over a six minute block average during the test period. The maximum expected opacity was 10%. The testing indicated that the maximum opacity of the unit during the two day test was 0.08%, which is much less than the maximum opacity value of 10%.
4.4 Flue Gas Emissions Test Methods
The emissions test methods used for the demonstration test were based upon utilizing 40 CFR 60 based testing methods or the plant CEMS. The emissions tests were conducted by CAE. The following test methods were utilized:
• Particulate Matter at SDA Inlet – USEPA Method 17 • Particulate Matter at Stack – USEPA Method 5 • Oxides of Nitrogen at Stack – Plant CEMS • Sulfur Dioxide at SDA Inlet – USEPA Method 6C • Sulfur Dioxide at Stack – Plant CEMS • Carbon Monoxide at Stack – Plant CEMS • Ammonia at Stack – CTM 027 • Lead at Stack – USEPA Method 29 • Mercury at SDA Inlet – Ontario Hydro Method • Fluorine at Stack – USEPA Method 13B • Dioxin/Furans – PCDD/F
Specific descriptions of the testing methods (non-CEMS) are included in the Clean Air Engineering Emissions Test Report located in Attachment D of this document.
JEA Large-Scale CFB Combustion Demonstration Project
Fuel Capability Demonstration Test Report #4 p-17 80 / 20 Blend Petroleum Coke and Pittsburgh 8 Coal Fuel
B&V Project 137064
4.5 Continuous Emission Monitoring System
The plant CEMS was utilized for measurement of gaseous emissions as a part of the fuel capability demonstration and as listed in Section 4.2.7. The CEMS equipment was integrated by KVB-Entertec (now GE Energy Systems). The system is a dilution extractive system consisting of Thermo Environmental NOX, SO2, and CO2 analyzers. The data listed for CEMS in Section 4.2.7 originated from the certified Data Acquisition Handling System (DAHS).
JEA Large-Scale CFB Combustion Demonstration Project
Fuel Capability Demonstration Test Report #4 p-18 80 / 20 Blend Petroleum Coke and Pittsburgh 8 Coal Fuel
B&V Project 137064
Attachments
Attachment A - Fuel Capability Demonstration Test Protocol Attachment B - Boiler Efficiency Calculation Attachment C - CAE Test Report Attachment D - PI Data Summary Attachment E - Abbreviation List Attachment F - Isolation Valve List Attachment G - Fuel Analyses - 80/20 Blend Pet Coke and Pittsburgh 8 Coal Attachment H - Limestone Analyses Attachment I - Bed Ash Analyses Attachment J - Fly Ash (Air Heater and PJFF) Analyses Attachment K - Ambient Data, Aug. 10, 2004 and Aug.11, 2004 Attachment L - Partial Loads Ambient Data, Aug. 12, 2004 and Aug. 13, 2004
JEA Large-Scale CFB Combustion Demonstration Project
Fuel Capability Demonstration Test Report #4 - ATTACHMENTS 80 / 50 Blend Petroleum Coke and Pittsburgh 8 Coal Fuel
B&V Project 137064
ATTACHMENT A
Fuel Capability Demonstration Test Protocol
This Document is located via the following link:
http://www.netl.doe.gov/cctc/resources/pdfs/jacks/FCTP.pdf
JEA Large-Scale CFB Combustion Demonstration Project
Fuel Capability Demonstration Test Report #4 - ATTACHMENTS 80 / 20 Blend Petroleum Coke and Pittsburgh 8 Coal Fuel
B&V Project 137064
ATTACHMENT B
Boiler Efficiency Calculation

Jacksonville Electric Authority Unit Tested: Northside Unit 2 Boiler Efficiency: 91.90 Test Date: August 10, 2004 Test Start Time: 9:30 AM Test End Time: 1:30 PM Test Duration, hours: 4 Enter all data required in Section 1 - Note: Some cells are identified as calculated values - DO NOT enter values in these cells, imbedded formulas calculate values. DATA INPUT SECTION - INPUT ALL DATA REQUESTED IN SECTION 1 EXCEPT AS NOTED
1. DATA REQUIRED FOR BOILER EFFICIENCY DETERMINATION
AS - TESTED
Average Value Units Symbol1.1 Fuel1.1.1 Feed Rate, lb/h 186,885 lb/h Wfe - Summation feeder feed rates - FN-34-FT-508, 528, 548, 568, 588, 608, 628, 668
Composition ("as fired")1.1.2 Carbon, fraction 0.8175 lb/lb AF fuel Cf - Laboratory analysis of coal samples obtained by grab sampling.1.1.3 Hydrogen, fraction 0.0365 lb/lb AF fuel Hf - Laboratory analysis of coal samples obtained by grab sampling.1.1.4 Oxygen, fraction 0.0130 lb/lb AF fuel Of - Laboratory analysis of coal samples obtained by grab sampling.1.1.5 Nitrogen, fraction 0.0194 lb/lb AF fuel Nf - Laboratory analysis of coal samples obtained by grab sampling.1.1.6 Sulfur, fraction 0.0372 lb/lb AF fuel Sf - Laboratory analysis of coal samples obtained by grab sampling.1.1.7 Ash, fraction 0.0237 lb/lb AF fuel Af - Laboratory analysis of coal samples obtained by grab sampling.1.1.8 Moisture, fraction 0.0527 lb/lb AF fuel H2Of - Laboratory analysis of coal samples obtained by grab sampling.1.1.9 Calcium, fraction 0.0000 lb/lb AF fuel Caf - Laboratory analysis of coal samples obtained by grab sampling - assume a value of zero if not reported.1.1.10 HHV 14,083 Btu/lb HHV - Laboratory analysis of coal samples obtained by grab sampling.
1.2 Limestone1.2.1 Feed Rate, lb/h 50,892 lb/h Wle - Summation feeder feed rates - 2RN-53-010-Rate, 011, 012
Composition ("as fired")1.2.2 CaCO3, fraction 0.9739 lb/lb limestone CaCO3l - Laboratory analysis of limestone samples obtained by grab sampling.1.2.3 MgCO3, fraction 0.0117 lb/lb limestone MgCO3l - Laboratory analysis of limestone samples obtained by grab sampling.1.2.4 Inerts, fraction 0.0144 lb/lb limestone Il - Laboratory analysis of limestone samples obtained by grab sampling.1.2.5 Moisture, fraction 0.0030 lb/lb limestone H2Ol - Laboratory analysis of limestone samples obtained by grab sampling.1.2.6 Carbonate Conversion, fraction 0.9875 XCO2 - Laboratory analysis of limestone samples obtained by grab sampling - assume value of 1 if not reported.
1.3 Bottom Ash1.3.1 Temperature, °F at envelope boundary 277 °F tba - Plant instrument.
Composition1.3.2 Organic Carbon, wt fraction 0.0064 lb/lb BA Cbao - Laboratory analysis of bottom ash samples obtained by grab sampling.1.3.3 Inorganic Carbon, wt fraction 0.0000 lb/lb BA Cbaio - Laboratory analysis of bottom ash samples obtained by grab sampling.1.3.4 Total Carbon, wt fraction - CALCULATED VALUE DO NOT ENTER 0.0064 lb/lb BA Cba = Cbao + Cbaio1.3.5 Calcium, wt fraction 0.0006 lb/lb BA Caba - Laboratory analysis of bottom ash samples obtained by grab sampling.1.3.6 Carbonate as CO2, wt fraction 0.0000 lb/lb BA CO2ba - Laboratory analysis of bottom ash samples obtained by grab sampling.1.3.7 Bottom Ash Flow By Iterative Calculation - ENTER ASSUMED VALUE 24,241 lb/h Wbae
TO BEGIN CALCULATION
1.4 Fly Ash Composition
1.4.1 Organic Carbon, wt fraction 0.0050 lb/lb FA Cfao - Laboratory analysis of fly ash samples obtained by grab sampling.1.4.2 Inorganic Carbon, wt fraction 0.0000 lb/lb FA Cfaio - Laboratory analysis of fly ash samples obtained by grab sampling.1.4.3 Carbon, wt fraction - CALCULATED VALUE DO NOT ENTER 0.0050 lb/lb FA Cfa = Cfao + Cfaio1.4.4 Calcium, wt fraction 0.0168 lb/lb FA Cafa - Laboratory analysis of fly ash samples obtained by grab sampling.1.4.5 Carbonate as CO2, wt fraction 0.0000 lb/lb FA CO2fa - Laboratory analysis of fly ash samples obtained by grab sampling.1.4.6 Fly Ash Flow 24,416 LB/HR Wfam - Weight of fly ash from isokenetic sample collection.
1.5 Combustion Air Primary Air
Hot1.5.1 Flow Rate, lb/h 1,761,691 lb/h Wpae - Plant instrument.1.5.2 Air Heater Inlet Temperature, °F 103 °F tpa
Cold1.5.3 Flow Rate, lb/h 20 LB/HR1.5.4 Fan Outlet Temperature, oF 103 °F
Secondary Air1.5.5 Flow Rate, lb/h 1,438,159 lb/h Wsae - Plant instrument.1.5.6 Air Heater Inlet Temperature, °F 99 °F tsa
Intrex Blower1.5.7 Flow Rate, lb/h 42,094 lb/h Wib - Plant instrument1.5.8 Blower Outlet Temperature, oF 185 oF tib
Seal Pot Blowers 1.5.9 Flow Rate, lb/h 42,116 lb/h Wspb - Plant instrument1.5.10 Blower Outlet Temperature, oF 205 oF tspb
1 of 10
Jacksonville Electric Authority Unit Tested: Northside Unit 2 Boiler Efficiency: 91.90 Test Date: August 10, 2004 Test Start Time: 9:30 AM Test End Time: 1:30 PM Test Duration, hours: 4 Enter all data required in Section 1 - Note: Some cells are identified as calculated values - DO NOT enter values in these cells, imbedded formulas calculate values.
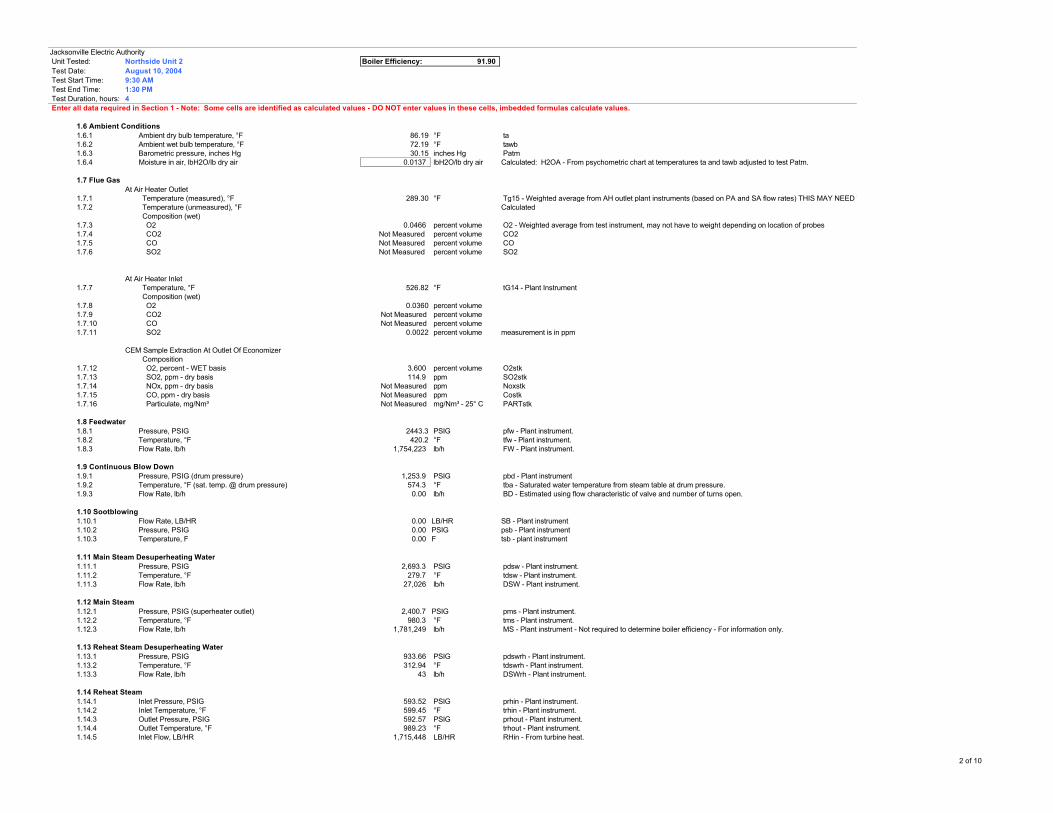
1.6 Ambient Conditions1.6.1 Ambient dry bulb temperature, °F 86.19 °F ta1.6.2 Ambient wet bulb temperature, °F 72.19 °F tawb1.6.3 Barometric pressure, inches Hg 30.15 inches Hg Patm1.6.4 Moisture in air, lbH2O/lb dry air 0.0137 lbH2O/lb dry air Calculated: H2OA - From psychometric chart at temperatures ta and tawb adjusted to test Patm.
1.7 Flue GasAt Air Heater Outlet
1.7.1 Temperature (measured), °F 289.30 °F Tg15 - Weighted average from AH outlet plant instruments (based on PA and SA flow rates) THIS MAY NEED TO BE DETERMINED BY TEST EQUIPMENT LOCATED I N THE MANIFOLD DUCT1.7.2 Temperature (unmeasured), °F Calculated
Composition (wet)1.7.3 O2 0.0466 percent volume O2 - Weighted average from test instrument, may not have to weight depending on location of probes1.7.4 CO2 Not Measured percent volume CO21.7.5 CO Not Measured percent volume CO1.7.6 SO2 Not Measured percent volume SO2
At Air Heater Inlet1.7.7 Temperature, °F 526.82 °F tG14 - Plant Instrument
Composition (wet)1.7.8 O2 0.0360 percent volume1.7.9 CO2 Not Measured percent volume1.7.10 CO Not Measured percent volume1.7.11 SO2 0.0022 percent volume measurement is in ppm
CEM Sample Extraction At Outlet Of Economizer Composition
1.7.12 O2, percent - WET basis 3.600 percent volume O2stk1.7.13 SO2, ppm - dry basis 114.9 ppm SO2stk1.7.14 NOx, ppm - dry basis Not Measured ppm Noxstk1.7.15 CO, ppm - dry basis Not Measured ppm Costk1.7.16 Particulate, mg/Nm³ Not Measured mg/Nm³ - 25° C PARTstk
1.8 Feedwater1.8.1 Pressure, PSIG 2443.3 PSIG pfw - Plant instrument.1.8.2 Temperature, °F 420.2 °F tfw - Plant instrument.1.8.3 Flow Rate, lb/h 1,754,223 lb/h FW - Plant instrument.
1.9 Continuous Blow Down1.9.1 Pressure, PSIG (drum pressure) 1,253.9 PSIG pbd - Plant instrument1.9.2 Temperature, °F (sat. temp. @ drum pressure) 574.3 °F tba - Saturated water temperature from steam table at drum pressure.1.9.3 Flow Rate, lb/h 0.00 lb/h BD - Estimated using flow characteristic of valve and number of turns open.
1.10 Sootblowing1.10.1 Flow Rate, LB/HR 0.00 LB/HR SB - Plant instrument1.10.2 Pressure, PSIG 0.00 PSIG psb - Plant instrument1.10.3 Temperature, F 0.00 F tsb - plant instrument
1.11 Main Steam Desuperheating Water1.11.1 Pressure, PSIG 2,693.3 PSIG pdsw - Plant instrument.1.11.2 Temperature, °F 279.7 °F tdsw - Plant instrument.1.11.3 Flow Rate, lb/h 27,026 lb/h DSW - Plant instrument.
1.12 Main Steam1.12.1 Pressure, PSIG (superheater outlet) 2,400.7 PSIG pms - Plant instrument.1.12.2 Temperature, °F 980.3 °F tms - Plant instrument.1.12.3 Flow Rate, lb/h 1,781,249 lb/h MS - Plant instrument - Not required to determine boiler efficiency - For information only.
1.13 Reheat Steam Desuperheating Water1.13.1 Pressure, PSIG 933.66 PSIG pdswrh - Plant instrument.1.13.2 Temperature, °F 312.94 °F tdswrh - Plant instrument.1.13.3 Flow Rate, lb/h 43 lb/h DSWrh - Plant instrument.
1.14 Reheat Steam1.14.1 Inlet Pressure, PSIG 593.52 PSIG prhin - Plant instrument.1.14.2 Inlet Temperature, °F 599.45 °F trhin - Plant instrument.1.14.3 Outlet Pressure, PSIG 592.57 PSIG prhout - Plant instrument.1.14.4 Outlet Temperature, °F 989.23 °F trhout - Plant instrument.1.14.5 Inlet Flow, LB/HR 1,715,448 LB/HR RHin - From turbine heat.
2 of 10

Jacksonville Electric Authority Unit Tested: Northside Unit 2 Boiler Efficiency: 91.90 Test Date: August 10, 2004 Test Start Time: 9:30 AM Test End Time: 1:30 PM Test Duration, hours: 4 Enter all data required in Section 1 - Note: Some cells are identified as calculated values - DO NOT enter values in these cells, imbedded formulas calculate values.
2. REFERENCE TEMPERATURES
2.1 Average Air Heater Inlet Temperature 102.59
3. SULFUR CAPTURE The calculation of efficiency for a circulating fluid bed steam generator that includes injection of a reactive sorbent material, such as limestone, to reduce sulfur dioxide emissions is an iterative calculation to minimize the number of parameters that have to be measured and the number of laboratory material analyses that must be performed. This both reduces the cost of the test and increases the accuracy by minimizing the impact of field and laboratory instrument inaccuracies.
To begin the process, assume a fuel flow rate. The fuel flow rate is required to complete the material balances necessary to determine the amount of limestone used and the effect of the limestone reaction on the boiler efficiency. The resulting boiler efficiency is used to calculate a value for the fuel flow rate. If the calculated flow rate is more than 1 percent different than the assumed flow rate, a new value for fuel flow rate is selected and the efficiency calculation is repeated. This process is repeated until the assumed value for fuel flow and the calculated value for fuel flow differ by less than 1 percent of of the value of the calculated fuel flow rate.
3.1 ASSUMED FUEL FLOW RATE, lb/h 174,084 lb/h
3.2 ASSUMED SULFUR EMISSIONS, fraction 0.0446 fraction Can get reading from CEMS system3.3 Sulfur Capture, fraction 0.9554
4. ASH PRODUCTION AND LIMESTONE CONSUMPTION
4.1 Accumulation of Bed Inventory 0 lb/h
4.2 Corrected Ash Carbon Content4.2.1 Bottom Ash, fraction 0.0064 lb/lb BA4.2.2 Fly Ash, fraction 0.0050 lb/lb FA
4.3 Bottom Ash Flow Rate4.3.1 Total bottom ash including bed change 24,240.8178660 lb/h
4.4 Limestone Flow Rate
Iterate to determine calcium to sulfur ratio and limestone flow rate. Enter an assumed value for the calcium to sulfur ratio. Compare resulting calculated calcium to sulfur ratio to assumed value. Change assumed value until the difference between the assumed value and the calculated value is less than 1 percent of the assumed value.
4.4.1 ASSUMED CALCIUM to SULFUR RATIO 2.4496 mole Ca/mole S4.4.2 Solids From Limestone - estimated 0.869494842 lb/lb limestone4.4.3 Limestone Flow Rate - estimated 50892 lb/h4.4.4 Calculated Calcium to Sulfur Ratio 2.449545967 mole Ca/mole S
Limestone Flow Rate from PI Data, lb/hr 50,8924.4.5 Difference Estimated vs Assumed - Ca:S -0.000207975 percent
4.4.6 Calculated Fly Ash Flow Rate 24,416 lb/h
4.4.7 Difference Calculated vs Measured (0.0000000005) percent
4.5 Total Dry Refuse4.5.1 Total Dry Refuse Hourly Flow Rate 48,657 lb/h4.5.2 Total Dry Refuse Per Pound Fuel 0.2795 lb/lb AF fuel
4.6 Heating Value Of Total Dry Refuse4.6.1 Average Carbon Content Of Ash 0.0057 fraction4.6.2 Heating Value Of Dry Refuse 82.61 Btu/lb
5. HEAT LOSS DUE TO DRY GAS
5.1 Carbon Burned Adjusted For Limestone5.1.1 Carbon Burned 0.8159 lb/lb AF fuel5.1.2 Carbon Adjusted For Limestone 0.8501 lb/lb AF fuel
CALCULATION SECTION - ALL VALUES BELOW CALCULATED BY EMBEDDED FORMULAS - DO NOT ENTER DATA BELOW THIS LINE - EXCEPT ASSUMED VALUES FOR ITERATIVE CALCULATIONS
al = (CaCO3l * (56.0794/100.08935)) + ((CaCO3l/CaS) * (80.0622/100.08935) * XSO2) + Wle = ((Wfea * af * ((Caf - (Cafa/(1 - Cfai)))) + Wbae' * (1 - Cba') * ((Cafa/(1 - Cfa)) - Caba))/((Cafa/(1 -
3 of 10

Jacksonville Electric Authority Unit Tested: Northside Unit 2 Boiler Efficiency: 91.90 Test Date: August 10, 2004 Test Start Time: 9:30 AM Test End Time: 1:30 PM Test Duration, hours: 4 Enter all data required in Section 1 - Note: Some cells are identified as calculated values - DO NOT enter values in these cells, imbedded formulas calculate values.
Determine Amount Of Flue Gas
Iterate to determine carbon dioxide volumetric content of dry flue gas. Enter an assumed value for excess air. Compare resulting calculated oxygen content to the measure oxygen content. Change assumed value of excess air until the difference between the calculated oxygen content value and the measured value oxygen content value is less than 1 percent of the assumed value. Use the calculated carbon dioxide value in subsequent calculations.
5.2 Air Heater Outlet
5.2.1 ASSUMED EXCESS AIR at AIR HEATER OUTLET 28.952 percent
5.2.2 Corrected Stoichiometric O2, lb/lb fuel 2.4964 lb/lb AF fuel5.2.3 Corrected Stoichiometric N2, lb/lb fuel 8.2918 lb/lb AF fuel
5.2.4 Flue Gas Composition, Weight Basis, lb/lb AF Fuel5.2.4.1 Carbon Dioxide, weight fraction 3.1149 lb/lb AF fuel5.2.4.2 Sulfur Dioxide, weight fraction 0.0033 lb/lb AF fuel5.2.4.3 Oxygen from air less oxygen to sulfur capture, weight fraction 0.7050 lb/lb AF fuel5.2.4.4 Nitrogen from air, weight fraction 10.6924 lb/lb AF fuel5.2.4.5 Nitrogen from fuel, weight fraction 0.0194 lb/lb AF fuel5.2.4.6 Moisture from fuel, weight fraction 0.0527 lb/lb AF fuel5.2.4.7 Moisture from hydrogen in fuel, weight fraction 0.3263 lb/lb AF fuel5.2.4.8 Moisture from limestone, weight fraction 0.0009 lb/lb AF fuel5.2.4.9 Moisture from combustion air, weight fraction 0.1903 lb/lb AF fuel
5.2.5 Weight of DRY Products of Combustion - Air Heater OUTLET 14.5350 lb/lb AF fuel
5.2.6 Molecular Weight, lb/lb mole DRY FG - Air Heater OUTLET 30.7137 lb/lb mole
5.2.7 Weight of WET Products of Combustion - Air Heater OUTLET 15.1051 lb/lb AF fuel
5.2.8 Molecular Weight, lb/lb mole WET FG - Air Heater OUTLET 29.9178 lb/lb AF fuel
5.2.9 Dry Flue Gas Composition, Volume Basis, % Dry Flue Gas5.2.9.1 Carbon Dioxide, volume percent 14.9558 percent volume5.2.9.2 Sulfur Dioxide, volume percent 0.0109 percent volume5.2.9.3 Oxygen from air, volume percent 4.6555 percent volume5.2.9.4 Nitrogen from air, volume percent 80.2316 percent volume5.2.9.5 Nitrogen from fuel, volume percent 0.1460 percent volume
100.0000 percent volume
5.2.10 Oxygen - MEASURED AT AIR HEATER OUTLET, % vol - dry FG 4.655555556 percent
5.2.11 Difference Calculated versus Measured Oxygen At Air Heater Outlet 0.000276621 percent
5.2.12 Carbon Dioxide, DRY vol. fraction 0.14965.2.13 Nitrogen (by difference), DRY vol. fraction 0.8039
5.2.14 Weight Dry FG At Air Heater OUTLET 14.4778 lb/lb AF fuel
5.2.15 Molecular Weight Of Dry Flue Gas At Air Heater OUTLET 30.7118 lb/lb mole
5.2.16 Wet Flue Gas Composition, Volume Basis, % Wet Flue Gas5.2.16.1 Carbon Dioxide, volume percent 14.0184 percent volume5.2.16.2 Sulfur Dioxide, volume percent 0.01026 percent volume5.2.16.3 Oxygen from air, volume percent 4.3637 percent volume5.2.16.4 Nitrogen from air, volume percent 75.2030 percent volume5.2.16.5 Nitrogen from fuel, volume percent 0.1369 percent volume5.2.16.6 Moisture from fuel, fuel hydrogen, limestone, and air 6.2677 percent volume
100.0000
5.2.17 Weight Wet FG At Air Heater OUTLET 15.0479 lb/lb AF fuel
5.2.18 Molecular Weight Of Wet Flue Gas At Air Heater OUTLET 29.9132 lb/lb mole
H2O%out = (((H2Of + H2Oh2 + H2Ol/f + H2Oair)/18.01534) * (100)/(Wgcalcahoutwet/MWahoutwet)
Note: Molecular weight of nitrogen in air (N2a) is 28.161 lb/lb mole per PTC 4 Sub-Section 5.11.1 to account for trace gases in air.
O2stoich = (31.9988/12.01115) * Cb + (15.9994/2.01594) * Hf + (31.9998/32.064) * Sf - Of + (((Sf * 31.9988/32.064) * (XSO2) * 31.9988 * 0.5/64.0128)
MWahoutwet = Wgcalc/((CO2calc/44.0095) + (SO2calc/64.0629) + (O2calc/31.9988) + (N2acalc/28.161) + (Nf/28.0134) + ((H2Of + H2Oh2 + H2Ol/f + H2Oair)/18.01534))
MWahoutdry = Wgcalc/((CO2calc/44.0095) + (SO2calc/64.0629) + (O2calc/31.9988) + (N2acalc/28.161) + (Nf/28.0134))
4 of 10

Jacksonville Electric Authority Unit Tested: Northside Unit 2 Boiler Efficiency: 91.90 Test Date: August 10, 2004 Test Start Time: 9:30 AM Test End Time: 1:30 PM Test Duration, hours: 4 Enter all data required in Section 1 - Note: Some cells are identified as calculated values - DO NOT enter values in these cells, imbedded formulas calculate values.
5.2.19 Weight Fraction of DRY Flue Gas Components5.2.19.1 Oxygen, fraction weight 0.0485 fraction5.2.19.2 Nitrogen, fraction weight 0.7371 fraction5.2.19.3 Carbon Dioxide, fraction weight 0.2144 fraction5.2.19.4 Carbon Monoxide, fraction weight 0.0000 fraction5.2.19.5 Sulfur Dioxide, fraction weight 0.0000 fraction
5.2.20 Weight Fraction of WET Flue Gas Components -NOT USED IN CALCULATION5.2.20.1 Oxygen, fraction weight fraction5.2.20.2 Nitrogen, fraction weight fraction5.2.20.3 Carbon Dioxide, fraction weight fraction5.2.20.4 Carbon Monoxide, fraction weight fraction5.2.20.5 Sulfur Dioxide, fraction weight fraction5.2.20.6 Moisture, fraction weight fraction
5.3 Air Heater Inlet
5.3.1 ASSUMED EXCESS AIR at AIR HEATER INLET 21.220 percent
5.3.2 Flue Gas Composition, Weight Basis, lb/lb AF Fuel5.3.2.1 Carbon Dioxide, weight fraction 3.1149 lb/lb AF fuel5.3.2.2 Sulfur Dioxide, weight fraction 0.0033 lb/lb AF fuel5.3.2.3 Oxygen from air less oxygen to sulfur capture, weight fraction 0.5120 lb/lb AF fuel5.3.2.4 Nitrogen from air, weight fraction 10.0513 lb/lb AF fuel5.3.2.5 Nitrogen from fuel, weight fraction 0.0194 lb/lb AF fuel5.3.2.6 Moisture from fuel, weight fraction 0.0527 lb/lb AF fuel5.3.2.7 Moisture from hydrogen in fuel, weight fraction 0.3263 lb/lb AF fuel5.3.2.8 Moisture from limestone, weight fraction 0.0009 lb/lb AF fuel5.3.2.9 Moisture from combustion air, weight fraction 0.1789 lb/lb AF fuel
5.3.3 Weight of DRY Products of Combustion - Air Heater INLET 13.7009 lb/lb AF fuel5.3.4 Molecular Weight, lb/lb mole DRY FG - Air Heater INLET 30.8270 lb/lb mole
5.3.5 Weight of WET Products of Combustion - Air Heater INLET 14.2596 lb/lb AF fuel5.3.6 Molecular Weight, lb/lb mole WET FG - Air Heater INLET 29.9914 lb/lb AF fuel
Volume Basis5.3.7 Flue Gas Composition, Volume Basis, % DRY Flue Gas % Dry Flue Gas5.3.7.1 Carbon Dioxide, volume percent 15.9249 percent volume5.3.7.2 Sulfur Dioxide, volume percent 0.0117 percent volume5.3.7.3 Oxygen from air, volume percent 3.6000 percent volume5.3.7.4 Nitrogen from air, volume percent 80.3080 percent volume5.3.7.5 Nitrogen from fuel, volume percent 0.1555 percent volume
100.0000 percent volume
5.3.8 Oxygen - MEASURED AT AIR HEATER INLET, % vol - dry FG 3.6 percent
5.3.9 Difference Calculated versus Measured Oxygen At Air Heater Inlet -0.00035125 percent
5.3.10 Carbon Dioxide, DRY vol. fraction 0.15925.3.11 Nitrogen (by difference), DRY vol. fraction 0.8025
5.3.12 Weight Dry FG At Air Heater INLET 13.6886 lb/lb AF fuel
5.3.13 Molecular Weight Of Dry Flue Gas At Air Heater INLET 30.9002 lb/lb mole
5 of 10

Jacksonville Electric Authority Unit Tested: Northside Unit 2 Boiler Efficiency: 91.90 Test Date: August 10, 2004 Test Start Time: 9:30 AM Test End Time: 1:30 PM Test Duration, hours: 4 Enter all data required in Section 1 - Note: Some cells are identified as calculated values - DO NOT enter values in these cells, imbedded formulas calculate values.
Volume Basis5.3.14 Flue Gas Composition, Volume Basis, % Wet Flue Gas % Wet Flue Gas5.3.14.1 Carbon Dioxide, volume percent 14.8862 percent volume5.3.14.2 Sulfur Dioxide, volume percent 0.01090 percent volume5.3.14.3 Oxygen from air, volume percent 3.3652 percent volume5.3.14.4 Nitrogen from air, volume percent 75.0699 percent volume5.3.14.5 Nitrogen from fuel, volume percent 0.1454 percent volume5.3.14.6 Moisture from fuel, fuel hydrogen, limestone, and air 6.5224 percent volume
100.0000
5.3.15 Weight Wet FG At Air Heater INLET 14.2473 lb/lb AF fuel
5.3.16 Molecular Weight Of Wet Flue Gas At Air Heater INLET 30.0573 lb/lb mole
5.3.17 Weight Fraction of DRY Flue Gas Components5.3.17.1 Oxygen, fraction weight 0.0373 fraction5.3.17.2 Nitrogen, fraction weight 0.7314 fraction5.3.17.3 Carbon Dioxide, fraction weight 0.2267 fraction5.3.17.4 Carbon Monoxide, fraction weight 0.0000 fraction5.3.17.5 Sulfur Dioxide, fraction weight 0.0046 fraction
5.3.18 Weight Fraction of WET Flue Gas Components5.3.18.1 Oxygen, fraction weight 0.0358 fraction5.3.18.2 Nitrogen, fraction weight 0.7027 fraction5.3.18.3 Carbon Dioxide, fraction weight 0.2180 fraction5.3.18.4 Carbon Monoxide, fraction weight 0.0000 fraction5.3.18.5 Sulfur Dioxide, fraction weight 0.0044 fraction5.3.18.6 Moisture, fraction weight 0.0391 fraction
5.4 CEM Sampling Location
5.4.1 ASSUMED EXCESS AIR at CEM SAMPLING LOCATION 22.956 percent
5.4.2 Flue Gas Composition, Weight Basis, lb/lb AF Fuel5.4.2.1 Carbon Dioxide, weight fraction 3.1149 lb/lb AF fuel5.4.2.2 Sulfur Dioxide, weight fraction 0.0033 lb/lb AF fuel5.4.2.3 Oxygen from air less oxygen to sulfur capture, weight fraction 0.5553 lb/lb AF fuel5.4.2.4 Nitrogen from air, weight fraction 10.1953 lb/lb AF fuel5.4.2.5 Nitrogen from fuel, weight fraction 0.0194 lb/lb AF fuel5.4.2.6 Moisture from fuel, weight fraction 0.0527 lb/lb AF fuel5.4.2.7 Moisture from hydrogen in fuel, weight fraction 0.3263 lb/lb AF fuel5.4.2.8 Moisture from limestone, weight fraction 0.0009 lb/lb AF fuel5.4.2.9 Moisture from combustion air, weight fraction 0.1814 lb/lb AF fuel
5.4.3 Weight of DRY Products of Combustion - CEM Sampling Location 13.8881 lb/lb AF fuel5.4.4 Molecular Weight, lb/lb mole DRY FG - CEM Sampling Location 30.8003 lb/lb mole
5.4.5 Weight of WET Products of Combustion - CEM Sampling Location 14.4494 lb/lb AF fuel5.4.6 Molecular Weight, lb/lb mole WET FG - CEM Sampling Location 29.9741 lb/lb mole
Volume Basis5.4.7 Flue Gas Composition, Volume Basis, % WET or DRY Flue Gas % Wet Flue Gas5.4.7.1 a Carbon Dioxide, volume percent 14.6822 percent volume5.4.7.2 a Sulfur Dioxide, volume percent 0.0107 percent volume5.4.7.3 a Oxygen from air, volume percent 3.6000 percent volume5.4.7.4 a Nitrogen from air, volume percent 75.1012 percent volume5.4.7.5 a Nitrogen from fuel, volume percent 0.1434 percent volume5.4.7.6 a Moisture in flue gas, volume percent 6.4625 percent volume
100.0000 percent volume
6 of 10
Jacksonville Electric Authority Unit Tested: Northside Unit 2 Boiler Efficiency: 91.90 Test Date: August 10, 2004 Test Start Time: 9:30 AM Test End Time: 1:30 PM Test Duration, hours: 4 Enter all data required in Section 1 - Note: Some cells are identified as calculated values - DO NOT enter values in these cells, imbedded formulas calculate values.
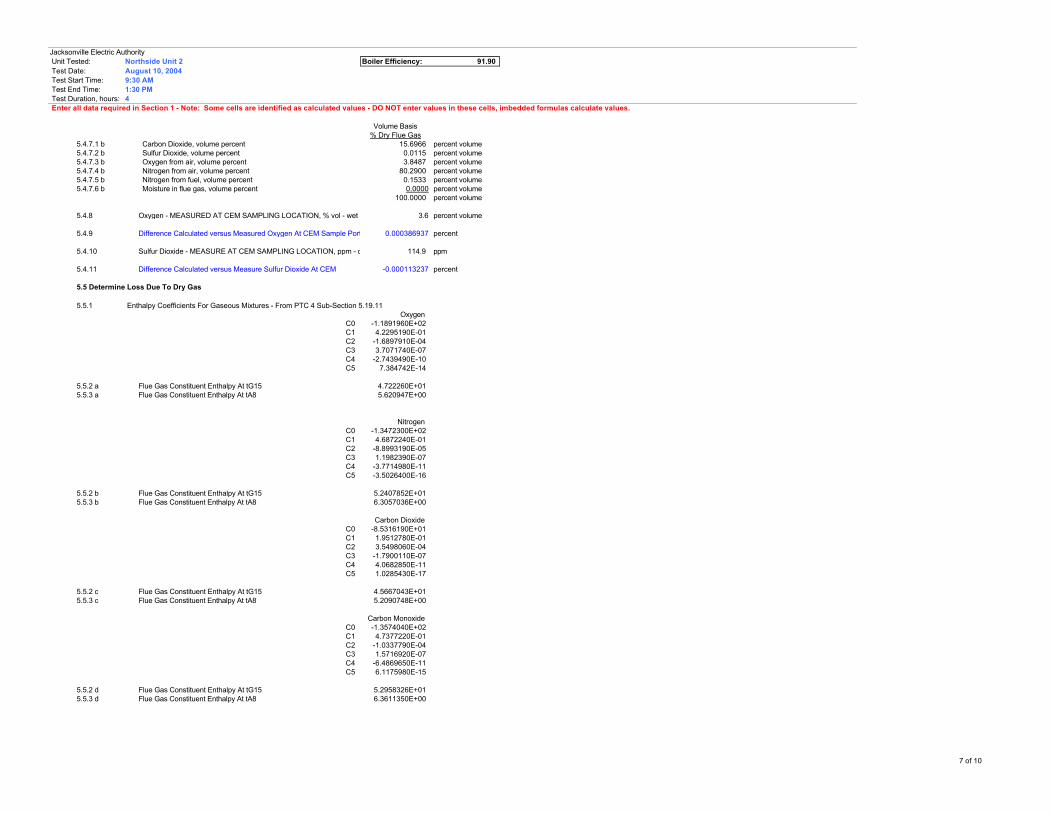
Volume Basis% Dry Flue Gas
5.4.7.1 b Carbon Dioxide, volume percent 15.6966 percent volume5.4.7.2 b Sulfur Dioxide, volume percent 0.0115 percent volume5.4.7.3 b Oxygen from air, volume percent 3.8487 percent volume5.4.7.4 b Nitrogen from air, volume percent 80.2900 percent volume5.4.7.5 b Nitrogen from fuel, volume percent 0.1533 percent volume5.4.7.6 b Moisture in flue gas, volume percent 0.0000 percent volume
100.0000 percent volume
5.4.8 Oxygen - MEASURED AT CEM SAMPLING LOCATION, % vol - wet FG 3.6 percent volume
5.4.9 Difference Calculated versus Measured Oxygen At CEM Sample Port In Stack0.000386937 percent
5.4.10 Sulfur Dioxide - MEASURE AT CEM SAMPLING LOCATION, ppm - dry FG 114.9 ppm
5.4.11 Difference Calculated versus Measure Sulfur Dioxide At CEM -0.000113237 percent
5.5 Determine Loss Due To Dry Gas
5.5.1 Enthalpy Coefficients For Gaseous Mixtures - From PTC 4 Sub-Section 5.19.11Oxygen
C0 -1.1891960E+02C1 4.2295190E-01C2 -1.6897910E-04C3 3.7071740E-07C4 -2.7439490E-10C5 7.384742E-14
5.5.2 a Flue Gas Constituent Enthalpy At tG15 4.722260E+015.5.3 a Flue Gas Constituent Enthalpy At tA8 5.620947E+00
Nitrogen C0 -1.3472300E+02C1 4.6872240E-01C2 -8.8993190E-05C3 1.1982390E-07C4 -3.7714980E-11C5 -3.5026400E-16
5.5.2 b Flue Gas Constituent Enthalpy At tG15 5.2407852E+015.5.3 b Flue Gas Constituent Enthalpy At tA8 6.3057036E+00
Carbon Dioxide C0 -8.5316190E+01C1 1.9512780E-01C2 3.5498060E-04C3 -1.7900110E-07C4 4.0682850E-11C5 1.0285430E-17
5.5.2 c Flue Gas Constituent Enthalpy At tG15 4.5667043E+015.5.3 c Flue Gas Constituent Enthalpy At tA8 5.2090748E+00
Carbon Monoxide C0 -1.3574040E+02C1 4.7377220E-01C2 -1.0337790E-04C3 1.5716920E-07C4 -6.4869650E-11C5 6.1175980E-15
5.5.2 d Flue Gas Constituent Enthalpy At tG15 5.2958326E+015.5.3 d Flue Gas Constituent Enthalpy At tA8 6.3611350E+00
7 of 10
Jacksonville Electric Authority Unit Tested: Northside Unit 2 Boiler Efficiency: 91.90 Test Date: August 10, 2004 Test Start Time: 9:30 AM Test End Time: 1:30 PM Test Duration, hours: 4 Enter all data required in Section 1 - Note: Some cells are identified as calculated values - DO NOT enter values in these cells, imbedded formulas calculate values.
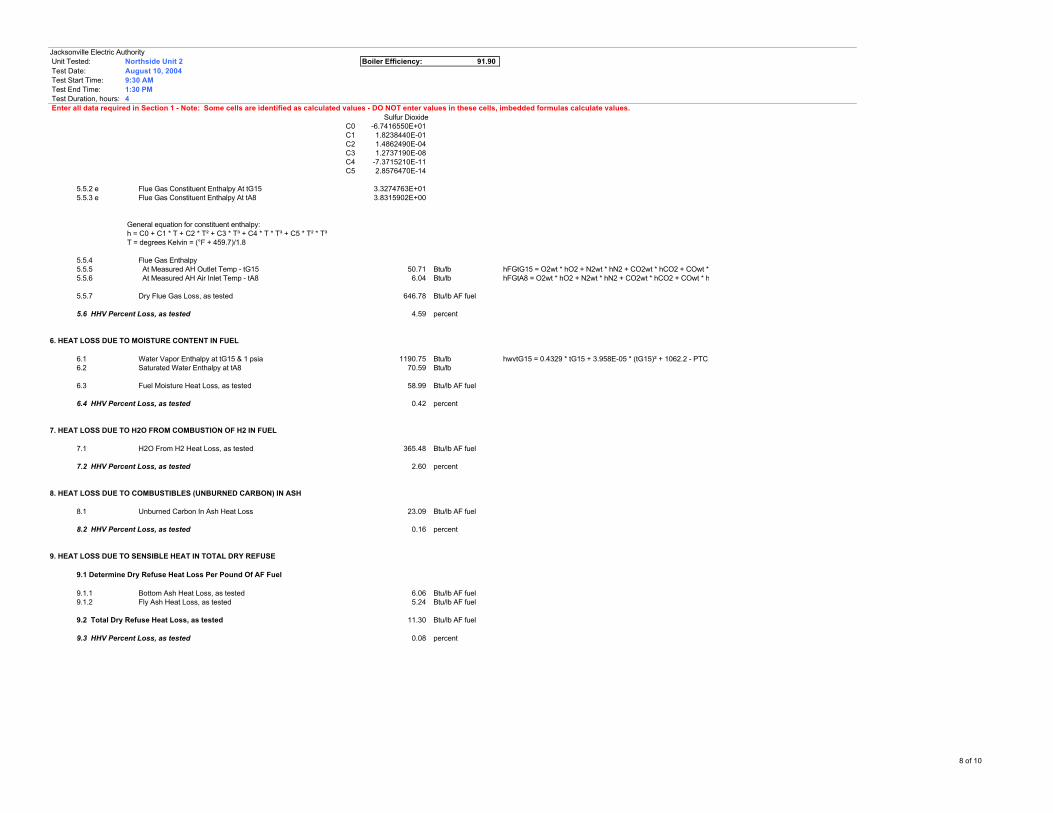
Sulfur DioxideC0 -6.7416550E+01C1 1.8238440E-01C2 1.4862490E-04C3 1.2737190E-08C4 -7.3715210E-11C5 2.8576470E-14
5.5.2 e Flue Gas Constituent Enthalpy At tG15 3.3274763E+015.5.3 e Flue Gas Constituent Enthalpy At tA8 3.8315902E+00
General equation for constituent enthalpy: h = C0 + C1 * T + C2 * T² + C3 * T³ + C4 * T * T³ + C5 * T² * T³ T = degrees Kelvin = (°F + 459.7)/1.8
5.5.4 Flue Gas Enthalpy5.5.5 At Measured AH Outlet Temp - tG15 50.71 Btu/lb5.5.6 At Measured AH Air Inlet Temp - tA8 6.04 Btu/lb
5.5.7 Dry Flue Gas Loss, as tested 646.78 Btu/lb AF fuel
5.6 HHV Percent Loss, as tested 4.59 percent
6. HEAT LOSS DUE TO MOISTURE CONTENT IN FUEL
6.1 Water Vapor Enthalpy at tG15 & 1 psia 1190.75 Btu/lb6.2 Saturated Water Enthalpy at tA8 70.59 Btu/lb
6.3 Fuel Moisture Heat Loss, as tested 58.99 Btu/lb AF fuel
6.4 HHV Percent Loss, as tested 0.42 percent
7. HEAT LOSS DUE TO H2O FROM COMBUSTION OF H2 IN FUEL
7.1 H2O From H2 Heat Loss, as tested 365.48 Btu/lb AF fuel
7.2 HHV Percent Loss, as tested 2.60 percent
8. HEAT LOSS DUE TO COMBUSTIBLES (UNBURNED CARBON) IN ASH
8.1 Unburned Carbon In Ash Heat Loss 23.09 Btu/lb AF fuel
8.2 HHV Percent Loss, as tested 0.16 percent
9. HEAT LOSS DUE TO SENSIBLE HEAT IN TOTAL DRY REFUSE
9.1 Determine Dry Refuse Heat Loss Per Pound Of AF Fuel
9.1.1 Bottom Ash Heat Loss, as tested 6.06 Btu/lb AF fuel9.1.2 Fly Ash Heat Loss, as tested 5.24 Btu/lb AF fuel
9.2 Total Dry Refuse Heat Loss, as tested 11.30 Btu/lb AF fuel
9.3 HHV Percent Loss, as tested 0.08 percent
hFGtG15 = O2wt * hO2 + N2wt * hN2 + CO2wt * hCO2 + COwt * hCO + SO2wt * hSO2 hFGtA8 = O2wt * hO2 + N2wt * hN2 + CO2wt * hCO2 + COwt * hCO + SO2wt * hSO2
hwvtG15 = 0.4329 * tG15 + 3.958E-05 * (tG15)² + 1062.2 - PTC 4 Sub-Section 5.19.5
8 of 10

Jacksonville Electric Authority Unit Tested: Northside Unit 2 Boiler Efficiency: 91.90 Test Date: August 10, 2004 Test Start Time: 9:30 AM Test End Time: 1:30 PM Test Duration, hours: 4 Enter all data required in Section 1 - Note: Some cells are identified as calculated values - DO NOT enter values in these cells, imbedded formulas calculate values.
10. HEAT LOSS DUE TO MOISTURE IN ENTERING AIR
10.1 Determine Air Flow
10.1.1 Dry Air Per Pound Of AF Fuel 14.24 lb/lb AF fuel
10.2 Heat Loss Due To Moisture In Entering Air
10.2.1 Enthalpy Of Leaving Water Vapor 143.32 Btu/lb AF fuel10.2.2 Enthalpy Of Entering Water Vapor 50.31 Btu/lb AF fuel
10.2.3 Air Moisture Heat Loss, as tested 18.12 Btu/lb
10.3 HHV Percent Loss, as tested 0.13 percent
11. HEAT LOSS DUE TO LIMESTONE CALCINATION/SULFATION REACTIONS
11.1 Loss To Calcination
11.1.1 Limestone Calcination Heat Loss 217.57 Btu/lb AF Fuel
11.2 Loss To Moisture In Limestone
11.2.1 Limestone Moisture Heat Loss 0.97 Btu/lb AF Fuel
11.3 Loss From Sulfation
11.3.1 Sulfation Heat Loss -239.48 Btu/lb AF Fuel
11.4 Net Loss To Calcination/Sulfation
11.4.1 Net Limestone Reaction Heat Loss -20.95 Btu/lb AF Fuel
11.5 HHV Percent Loss -0.15 percent
12. HEAT LOSS DUE TO SURFACE RADIATION & CONVECTION
12.1 HHV Percent Loss 0.27 percent
12.1.1 Radiation & Convection Heat Loss 38.50 Btu/lb AF fuel
13. SUMMARY OF LOSSES - AS TESTED/GUARANTEE BASIS
As TestedBtu/lb AF Fuel
13.1.1 646.7813.1.2 58.9913.1.3 365.4813.1.4 23.0913.1.5 11.3013.1.6 18.1213.1.7 -20.9513.1.8 38.50
1,141.30
9 of 10
Jacksonville Electric Authority Unit Tested: Northside Unit 2 Boiler Efficiency: 91.90 Test Date: August 10, 2004 Test Start Time: 9:30 AM Test End Time: 1:30 PM Test Duration, hours: 4 Enter all data required in Section 1 - Note: Some cells are identified as calculated values - DO NOT enter values in these cells, imbedded formulas calculate values.
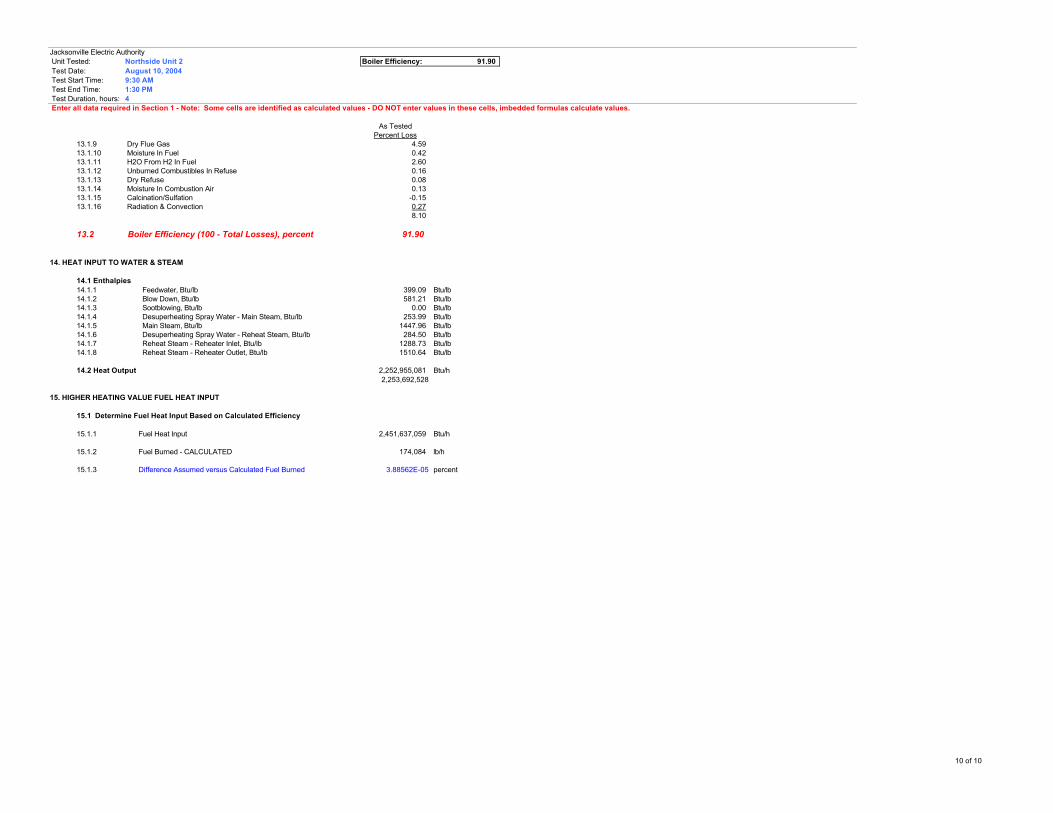
As TestedPercent Loss
13.1.9 Dry Flue Gas 4.5913.1.10 Moisture In Fuel 0.4213.1.11 H2O From H2 In Fuel 2.6013.1.12 Unburned Combustibles In Refuse 0.1613.1.13 Dry Refuse 0.0813.1.14 Moisture In Combustion Air 0.1313.1.15 Calcination/Sulfation -0.1513.1.16 Radiation & Convection 0.27
8.10
13.2 Boiler Efficiency (100 - Total Losses), percent 91.90
14. HEAT INPUT TO WATER & STEAM
14.1 Enthalpies14.1.1 Feedwater, Btu/lb 399.09 Btu/lb14.1.2 Blow Down, Btu/lb 581.21 Btu/lb14.1.3 Sootblowing, Btu/lb 0.00 Btu/lb14.1.4 Desuperheating Spray Water - Main Steam, Btu/lb 253.99 Btu/lb14.1.5 Main Steam, Btu/lb 1447.96 Btu/lb14.1.6 Desuperheating Spray Water - Reheat Steam, Btu/lb 284.50 Btu/lb14.1.7 Reheat Steam - Reheater Inlet, Btu/lb 1288.73 Btu/lb14.1.8 Reheat Steam - Reheater Outlet, Btu/lb 1510.64 Btu/lb
14.2 Heat Output 2,252,955,081 Btu/h2,253,692,528
15. HIGHER HEATING VALUE FUEL HEAT INPUT
15.1 Determine Fuel Heat Input Based on Calculated Efficiency
15.1.1 Fuel Heat Input 2,451,637,059 Btu/h
15.1.2 Fuel Burned - CALCULATED 174,084 lb/h
15.1.3 Difference Assumed versus Calculated Fuel Burned 3.88562E-05 percent
10 of 10
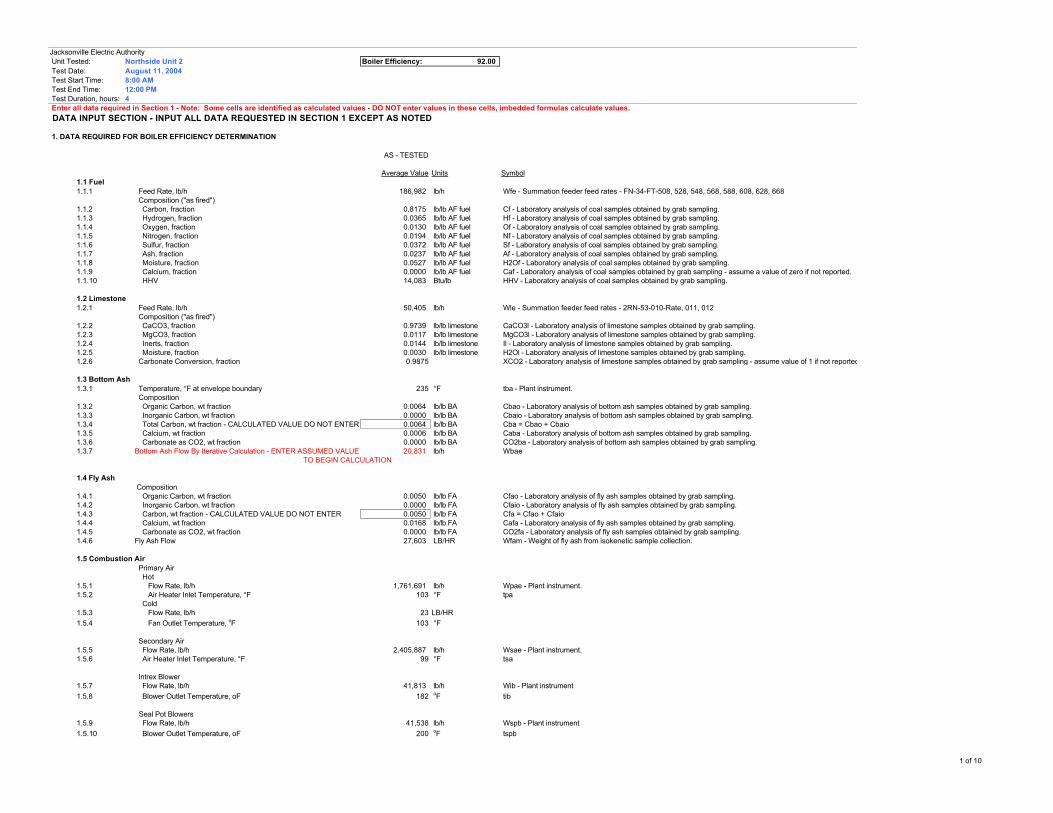
Jacksonville Electric Authority Unit Tested: Northside Unit 2 Boiler Efficiency: 92.00 Test Date: August 11, 2004 Test Start Time: 8:00 AM Test End Time: 12:00 PM Test Duration, hours: 4 Enter all data required in Section 1 - Note: Some cells are identified as calculated values - DO NOT enter values in these cells, imbedded formulas calculate values. DATA INPUT SECTION - INPUT ALL DATA REQUESTED IN SECTION 1 EXCEPT AS NOTED
1. DATA REQUIRED FOR BOILER EFFICIENCY DETERMINATION
AS - TESTED
Average Value Units Symbol1.1 Fuel1.1.1 Feed Rate, lb/h 186,982 lb/h Wfe - Summation feeder feed rates - FN-34-FT-508, 528, 548, 568, 588, 608, 628, 668
Composition ("as fired")1.1.2 Carbon, fraction 0.8175 lb/lb AF fuel Cf - Laboratory analysis of coal samples obtained by grab sampling.1.1.3 Hydrogen, fraction 0.0365 lb/lb AF fuel Hf - Laboratory analysis of coal samples obtained by grab sampling.1.1.4 Oxygen, fraction 0.0130 lb/lb AF fuel Of - Laboratory analysis of coal samples obtained by grab sampling.1.1.5 Nitrogen, fraction 0.0194 lb/lb AF fuel Nf - Laboratory analysis of coal samples obtained by grab sampling.1.1.6 Sulfur, fraction 0.0372 lb/lb AF fuel Sf - Laboratory analysis of coal samples obtained by grab sampling.1.1.7 Ash, fraction 0.0237 lb/lb AF fuel Af - Laboratory analysis of coal samples obtained by grab sampling.1.1.8 Moisture, fraction 0.0527 lb/lb AF fuel H2Of - Laboratory analysis of coal samples obtained by grab sampling.1.1.9 Calcium, fraction 0.0000 lb/lb AF fuel Caf - Laboratory analysis of coal samples obtained by grab sampling - assume a value of zero if not reported.1.1.10 HHV 14,083 Btu/lb HHV - Laboratory analysis of coal samples obtained by grab sampling.
1.2 Limestone1.2.1 Feed Rate, lb/h 50,405 lb/h Wle - Summation feeder feed rates - 2RN-53-010-Rate, 011, 012
Composition ("as fired")1.2.2 CaCO3, fraction 0.9739 lb/lb limestone CaCO3l - Laboratory analysis of limestone samples obtained by grab sampling.1.2.3 MgCO3, fraction 0.0117 lb/lb limestone MgCO3l - Laboratory analysis of limestone samples obtained by grab sampling.1.2.4 Inerts, fraction 0.0144 lb/lb limestone Il - Laboratory analysis of limestone samples obtained by grab sampling.1.2.5 Moisture, fraction 0.0030 lb/lb limestone H2Ol - Laboratory analysis of limestone samples obtained by grab sampling.1.2.6 Carbonate Conversion, fraction 0.9875 XCO2 - Laboratory analysis of limestone samples obtained by grab sampling - assume value of 1 if not reported.
1.3 Bottom Ash1.3.1 Temperature, °F at envelope boundary 235 °F tba - Plant instrument.
Composition1.3.2 Organic Carbon, wt fraction 0.0064 lb/lb BA Cbao - Laboratory analysis of bottom ash samples obtained by grab sampling.1.3.3 Inorganic Carbon, wt fraction 0.0000 lb/lb BA Cbaio - Laboratory analysis of bottom ash samples obtained by grab sampling.1.3.4 Total Carbon, wt fraction - CALCULATED VALUE DO NOT ENTER 0.0064 lb/lb BA Cba = Cbao + Cbaio1.3.5 Calcium, wt fraction 0.0006 lb/lb BA Caba - Laboratory analysis of bottom ash samples obtained by grab sampling.1.3.6 Carbonate as CO2, wt fraction 0.0000 lb/lb BA CO2ba - Laboratory analysis of bottom ash samples obtained by grab sampling.1.3.7 Bottom Ash Flow By Iterative Calculation - ENTER ASSUMED VALUE 20,831 lb/h Wbae
TO BEGIN CALCULATION
1.4 Fly Ash Composition
1.4.1 Organic Carbon, wt fraction 0.0050 lb/lb FA Cfao - Laboratory analysis of fly ash samples obtained by grab sampling.1.4.2 Inorganic Carbon, wt fraction 0.0000 lb/lb FA Cfaio - Laboratory analysis of fly ash samples obtained by grab sampling.1.4.3 Carbon, wt fraction - CALCULATED VALUE DO NOT ENTER 0.0050 lb/lb FA Cfa = Cfao + Cfaio1.4.4 Calcium, wt fraction 0.0168 lb/lb FA Cafa - Laboratory analysis of fly ash samples obtained by grab sampling.1.4.5 Carbonate as CO2, wt fraction 0.0000 lb/lb FA CO2fa - Laboratory analysis of fly ash samples obtained by grab sampling.1.4.6 Fly Ash Flow 27,603 LB/HR Wfam - Weight of fly ash from isokenetic sample collection.
1.5 Combustion Air Primary Air
Hot1.5.1 Flow Rate, lb/h 1,761,691 lb/h Wpae - Plant instrument.1.5.2 Air Heater Inlet Temperature, °F 103 °F tpa
Cold1.5.3 Flow Rate, lb/h 23 LB/HR1.5.4 Fan Outlet Temperature, oF 103 °F
Secondary Air1.5.5 Flow Rate, lb/h 2,405,887 lb/h Wsae - Plant instrument.1.5.6 Air Heater Inlet Temperature, °F 99 °F tsa
Intrex Blower1.5.7 Flow Rate, lb/h 41,813 lb/h Wib - Plant instrument1.5.8 Blower Outlet Temperature, oF 182 oF tib
Seal Pot Blowers 1.5.9 Flow Rate, lb/h 41,538 lb/h Wspb - Plant instrument1.5.10 Blower Outlet Temperature, oF 200 oF tspb
1 of 10

Jacksonville Electric Authority Unit Tested: Northside Unit 2 Boiler Efficiency: 92.00 Test Date: August 11, 2004 Test Start Time: 8:00 AM Test End Time: 12:00 PM Test Duration, hours: 4 Enter all data required in Section 1 - Note: Some cells are identified as calculated values - DO NOT enter values in these cells, imbedded formulas calculate values.
1.6 Ambient Conditions1.6.1 Ambient dry bulb temperature, °F 83.71 °F ta1.6.2 Ambient wet bulb temperature, °F 75.13 °F tawb1.6.3 Barometric pressure, inches Hg 29.99 inches Hg Patm1.6.4 Moisture in air, lbH2O/lb dry air 0.0169 lbH2O/lb dry air Calculated: H2OA - From psychometric chart at temperatures ta and tawb adjusted to test Patm.
1.7 Flue GasAt Air Heater Outlet
1.7.1 Temperature (measured), °F 284.51 °F Tg15 - Weighted average from AH outlet plant instruments (based on PA and SA flow rates) THIS MAY NEED TO BE DETERMINED BY TEST EQUIPMENT LOCATED I N THE MANIFOLD DUCT1.7.2 Temperature (unmeasured), °F Calculated
Composition (wet)1.7.3 O2 0.0466 percent volume O2 - Weighted average from test instrument, may not have to weight depending on location of probes1.7.4 CO2 Not Measured percent volume CO21.7.5 CO Not Measured percent volume CO1.7.6 SO2 Not Measured percent volume SO2
At Air Heater Inlet1.7.7 Temperature, °F 523.22 °F tG14 - Plant Instrument
Composition (wet)1.7.8 O2 0.0360 percent volume1.7.9 CO2 Not Measured percent volume1.7.10 CO Not Measured percent volume1.7.11 SO2 0.0030 percent volume measurement is in ppm
CEM Sample Extraction At Outlet Of Economizer Composition
1.7.12 O2, percent - WET basis 3.600 percent volume O2stk1.7.13 SO2, ppm - dry basis 114.9 ppm SO2stk1.7.14 NOx, ppm - dry basis Not Measured ppm Noxstk1.7.15 CO, ppm - dry basis Not Measured ppm Costk1.7.16 Particulate, mg/Nm³ Not Measured mg/Nm³ - 25° C PARTstk
1.8 Feedwater1.8.1 Pressure, PSIG 2443.9 PSIG pfw - Plant instrument.1.8.2 Temperature, °F 419.9 °F tfw - Plant instrument.1.8.3 Flow Rate, lb/h 1,770,064 lb/h FW - Plant instrument.
1.9 Continuous Blow Down1.9.1 Pressure, PSIG (drum pressure) 1,242.6 PSIG pbd - Plant instrument1.9.2 Temperature, °F (sat. temp. @ drum pressure) 573.2 °F tba - Saturated water temperature from steam table at drum pressure.1.9.3 Flow Rate, lb/h 0.00 lb/h BD - Estimated using flow characteristic of valve and number of turns open.
1.10 Sootblowing1.10.1 Flow Rate, LB/HR 0.00 LB/HR SB - Plant instrument1.10.2 Pressure, PSIG 0.00 PSIG psb - Plant instrument1.10.3 Temperature, F 0.00 F tsb - plant instrument
1.11 Main Steam Desuperheating Water1.11.1 Pressure, PSIG 2,695.5 PSIG pdsw - Plant instrument.1.11.2 Temperature, °F 278.3 °F tdsw - Plant instrument.1.11.3 Flow Rate, lb/h 19,359 lb/h DSW - Plant instrument.
1.12 Main Steam1.12.1 Pressure, PSIG (superheater outlet) 2,400.7 PSIG pms - Plant instrument.1.12.2 Temperature, °F 980.5 °F tms - Plant instrument.1.12.3 Flow Rate, lb/h 1,789,423 lb/h MS - Plant instrument - Not required to determine boiler efficiency - For information only.
1.13 Reheat Steam Desuperheating Water1.13.1 Pressure, PSIG 933.76 PSIG pdswrh - Plant instrument.1.13.2 Temperature, °F 312.85 °F tdswrh - Plant instrument.1.13.3 Flow Rate, lb/h 40 lb/h DSWrh - Plant instrument.
1.14 Reheat Steam1.14.1 Inlet Pressure, PSIG 591.57 PSIG prhin - Plant instrument.1.14.2 Inlet Temperature, °F 598.95 °F trhin - Plant instrument.1.14.3 Outlet Pressure, PSIG 590.78 PSIG prhout - Plant instrument.1.14.4 Outlet Temperature, °F 988.40 °F trhout - Plant instrument.1.14.5 Inlet Flow, LB/HR 1,723,361 LB/HR RHin - From turbine heat.
2 of 10
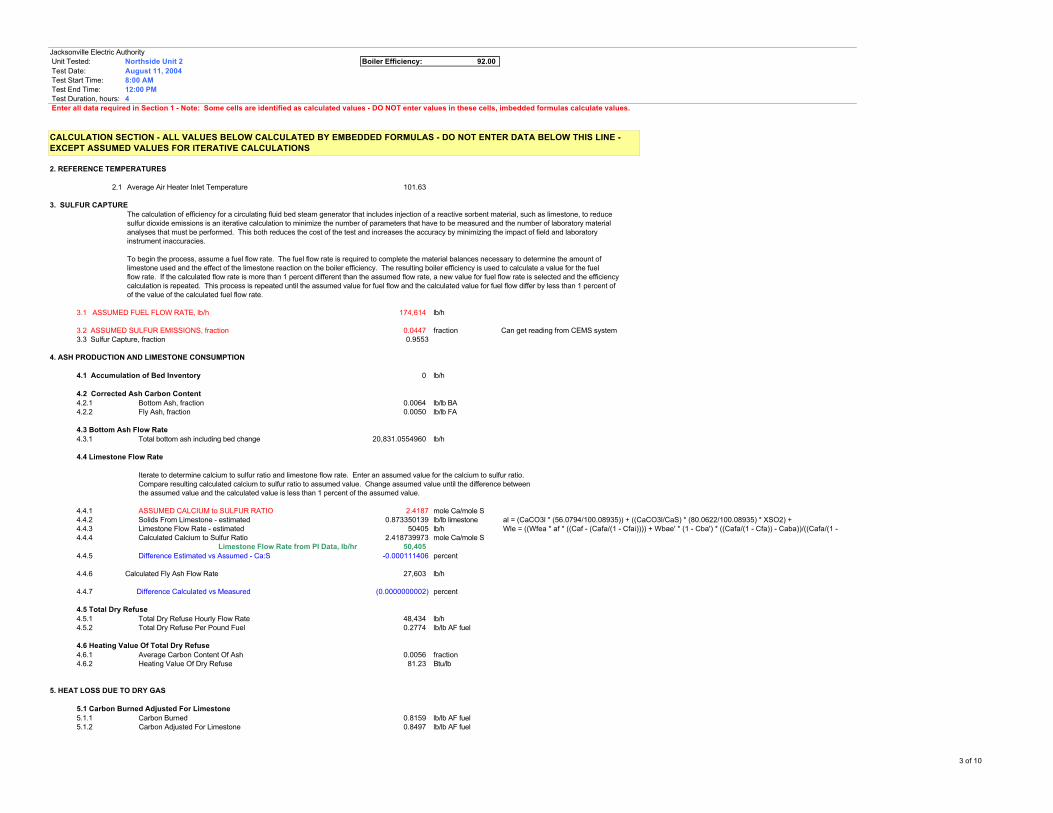
Jacksonville Electric Authority Unit Tested: Northside Unit 2 Boiler Efficiency: 92.00 Test Date: August 11, 2004 Test Start Time: 8:00 AM Test End Time: 12:00 PM Test Duration, hours: 4 Enter all data required in Section 1 - Note: Some cells are identified as calculated values - DO NOT enter values in these cells, imbedded formulas calculate values.
2. REFERENCE TEMPERATURES
2.1 Average Air Heater Inlet Temperature 101.63
3. SULFUR CAPTURE The calculation of efficiency for a circulating fluid bed steam generator that includes injection of a reactive sorbent material, such as limestone, to reduce sulfur dioxide emissions is an iterative calculation to minimize the number of parameters that have to be measured and the number of laboratory material analyses that must be performed. This both reduces the cost of the test and increases the accuracy by minimizing the impact of field and laboratory instrument inaccuracies.
To begin the process, assume a fuel flow rate. The fuel flow rate is required to complete the material balances necessary to determine the amount of limestone used and the effect of the limestone reaction on the boiler efficiency. The resulting boiler efficiency is used to calculate a value for the fuel flow rate. If the calculated flow rate is more than 1 percent different than the assumed flow rate, a new value for fuel flow rate is selected and the efficiency calculation is repeated. This process is repeated until the assumed value for fuel flow and the calculated value for fuel flow differ by less than 1 percent of of the value of the calculated fuel flow rate.
3.1 ASSUMED FUEL FLOW RATE, lb/h 174,614 lb/h
3.2 ASSUMED SULFUR EMISSIONS, fraction 0.0447 fraction Can get reading from CEMS system3.3 Sulfur Capture, fraction 0.9553
4. ASH PRODUCTION AND LIMESTONE CONSUMPTION
4.1 Accumulation of Bed Inventory 0 lb/h
4.2 Corrected Ash Carbon Content4.2.1 Bottom Ash, fraction 0.0064 lb/lb BA4.2.2 Fly Ash, fraction 0.0050 lb/lb FA
4.3 Bottom Ash Flow Rate4.3.1 Total bottom ash including bed change 20,831.0554960 lb/h
4.4 Limestone Flow Rate
Iterate to determine calcium to sulfur ratio and limestone flow rate. Enter an assumed value for the calcium to sulfur ratio. Compare resulting calculated calcium to sulfur ratio to assumed value. Change assumed value until the difference between the assumed value and the calculated value is less than 1 percent of the assumed value.
4.4.1 ASSUMED CALCIUM to SULFUR RATIO 2.4187 mole Ca/mole S4.4.2 Solids From Limestone - estimated 0.873350139 lb/lb limestone4.4.3 Limestone Flow Rate - estimated 50405 lb/h4.4.4 Calculated Calcium to Sulfur Ratio 2.418739973 mole Ca/mole S
Limestone Flow Rate from PI Data, lb/hr 50,4054.4.5 Difference Estimated vs Assumed - Ca:S -0.000111406 percent
4.4.6 Calculated Fly Ash Flow Rate 27,603 lb/h
4.4.7 Difference Calculated vs Measured (0.0000000002) percent
4.5 Total Dry Refuse4.5.1 Total Dry Refuse Hourly Flow Rate 48,434 lb/h4.5.2 Total Dry Refuse Per Pound Fuel 0.2774 lb/lb AF fuel
4.6 Heating Value Of Total Dry Refuse4.6.1 Average Carbon Content Of Ash 0.0056 fraction4.6.2 Heating Value Of Dry Refuse 81.23 Btu/lb
5. HEAT LOSS DUE TO DRY GAS
5.1 Carbon Burned Adjusted For Limestone5.1.1 Carbon Burned 0.8159 lb/lb AF fuel5.1.2 Carbon Adjusted For Limestone 0.8497 lb/lb AF fuel
al = (CaCO3l * (56.0794/100.08935)) + ((CaCO3l/CaS) * (80.0622/100.08935) * XSO2) + Wle = ((Wfea * af * ((Caf - (Cafa/(1 - Cfai)))) + Wbae' * (1 - Cba') * ((Cafa/(1 - Cfa)) - Caba))/((Cafa/(1 -
CALCULATION SECTION - ALL VALUES BELOW CALCULATED BY EMBEDDED FORMULAS - DO NOT ENTER DATA BELOW THIS LINE - EXCEPT ASSUMED VALUES FOR ITERATIVE CALCULATIONS
3 of 10
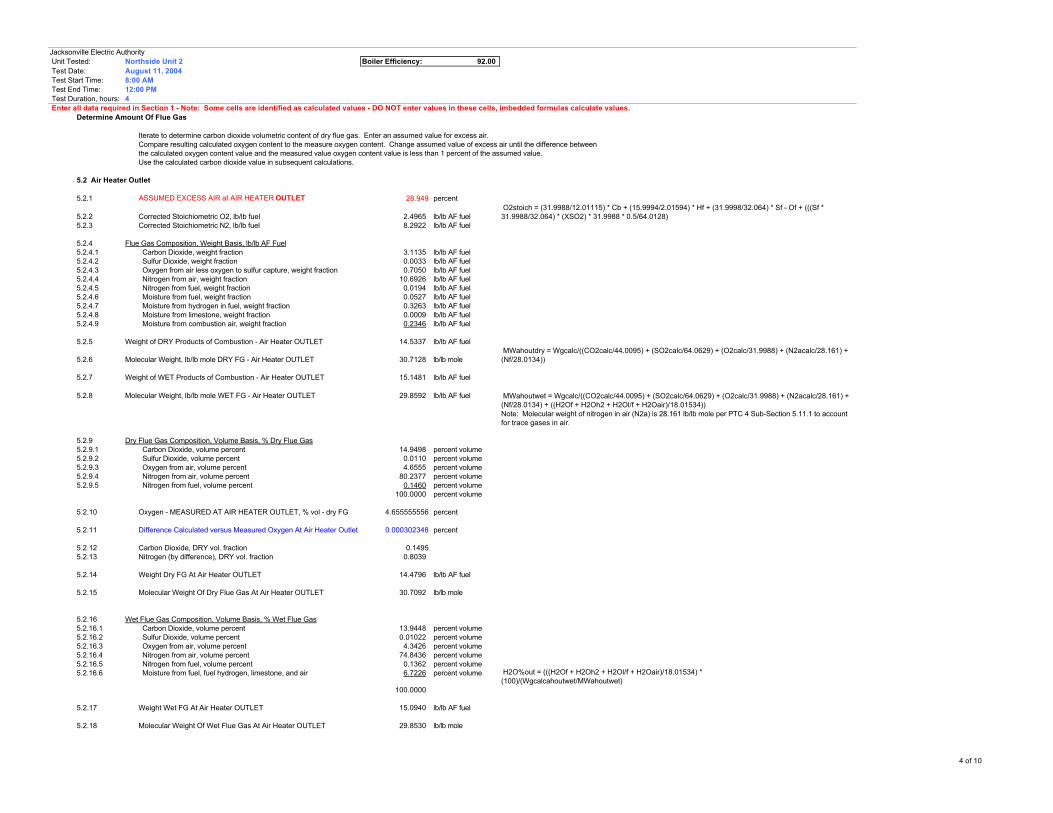
Jacksonville Electric Authority Unit Tested: Northside Unit 2 Boiler Efficiency: 92.00 Test Date: August 11, 2004 Test Start Time: 8:00 AM Test End Time: 12:00 PM Test Duration, hours: 4 Enter all data required in Section 1 - Note: Some cells are identified as calculated values - DO NOT enter values in these cells, imbedded formulas calculate values.
Determine Amount Of Flue Gas
Iterate to determine carbon dioxide volumetric content of dry flue gas. Enter an assumed value for excess air. Compare resulting calculated oxygen content to the measure oxygen content. Change assumed value of excess air until the difference between the calculated oxygen content value and the measured value oxygen content value is less than 1 percent of the assumed value. Use the calculated carbon dioxide value in subsequent calculations.
5.2 Air Heater Outlet
5.2.1 ASSUMED EXCESS AIR at AIR HEATER OUTLET 28.949 percent
5.2.2 Corrected Stoichiometric O2, lb/lb fuel 2.4965 lb/lb AF fuel5.2.3 Corrected Stoichiometric N2, lb/lb fuel 8.2922 lb/lb AF fuel
5.2.4 Flue Gas Composition, Weight Basis, lb/lb AF Fuel5.2.4.1 Carbon Dioxide, weight fraction 3.1135 lb/lb AF fuel5.2.4.2 Sulfur Dioxide, weight fraction 0.0033 lb/lb AF fuel5.2.4.3 Oxygen from air less oxygen to sulfur capture, weight fraction 0.7050 lb/lb AF fuel5.2.4.4 Nitrogen from air, weight fraction 10.6926 lb/lb AF fuel5.2.4.5 Nitrogen from fuel, weight fraction 0.0194 lb/lb AF fuel5.2.4.6 Moisture from fuel, weight fraction 0.0527 lb/lb AF fuel5.2.4.7 Moisture from hydrogen in fuel, weight fraction 0.3263 lb/lb AF fuel5.2.4.8 Moisture from limestone, weight fraction 0.0009 lb/lb AF fuel5.2.4.9 Moisture from combustion air, weight fraction 0.2346 lb/lb AF fuel
5.2.5 Weight of DRY Products of Combustion - Air Heater OUTLET 14.5337 lb/lb AF fuel
5.2.6 Molecular Weight, lb/lb mole DRY FG - Air Heater OUTLET 30.7128 lb/lb mole
5.2.7 Weight of WET Products of Combustion - Air Heater OUTLET 15.1481 lb/lb AF fuel
5.2.8 Molecular Weight, lb/lb mole WET FG - Air Heater OUTLET 29.8592 lb/lb AF fuel
5.2.9 Dry Flue Gas Composition, Volume Basis, % Dry Flue Gas5.2.9.1 Carbon Dioxide, volume percent 14.9498 percent volume5.2.9.2 Sulfur Dioxide, volume percent 0.0110 percent volume5.2.9.3 Oxygen from air, volume percent 4.6555 percent volume5.2.9.4 Nitrogen from air, volume percent 80.2377 percent volume5.2.9.5 Nitrogen from fuel, volume percent 0.1460 percent volume
100.0000 percent volume
5.2.10 Oxygen - MEASURED AT AIR HEATER OUTLET, % vol - dry FG 4.655555556 percent
5.2.11 Difference Calculated versus Measured Oxygen At Air Heater Outlet 0.000302348 percent
5.2.12 Carbon Dioxide, DRY vol. fraction 0.14955.2.13 Nitrogen (by difference), DRY vol. fraction 0.8039
5.2.14 Weight Dry FG At Air Heater OUTLET 14.4796 lb/lb AF fuel
5.2.15 Molecular Weight Of Dry Flue Gas At Air Heater OUTLET 30.7092 lb/lb mole
5.2.16 Wet Flue Gas Composition, Volume Basis, % Wet Flue Gas5.2.16.1 Carbon Dioxide, volume percent 13.9448 percent volume5.2.16.2 Sulfur Dioxide, volume percent 0.01022 percent volume5.2.16.3 Oxygen from air, volume percent 4.3426 percent volume5.2.16.4 Nitrogen from air, volume percent 74.8436 percent volume5.2.16.5 Nitrogen from fuel, volume percent 0.1362 percent volume5.2.16.6 Moisture from fuel, fuel hydrogen, limestone, and air 6.7226 percent volume
100.0000
5.2.17 Weight Wet FG At Air Heater OUTLET 15.0940 lb/lb AF fuel
5.2.18 Molecular Weight Of Wet Flue Gas At Air Heater OUTLET 29.8530 lb/lb mole
H2O%out = (((H2Of + H2Oh2 + H2Ol/f + H2Oair)/18.01534) * (100)/(Wgcalcahoutwet/MWahoutwet)
Note: Molecular weight of nitrogen in air (N2a) is 28.161 lb/lb mole per PTC 4 Sub-Section 5.11.1 to account for trace gases in air.
O2stoich = (31.9988/12.01115) * Cb + (15.9994/2.01594) * Hf + (31.9998/32.064) * Sf - Of + (((Sf * 31.9988/32.064) * (XSO2) * 31.9988 * 0.5/64.0128)
MWahoutwet = Wgcalc/((CO2calc/44.0095) + (SO2calc/64.0629) + (O2calc/31.9988) + (N2acalc/28.161) + (Nf/28.0134) + ((H2Of + H2Oh2 + H2Ol/f + H2Oair)/18.01534))
MWahoutdry = Wgcalc/((CO2calc/44.0095) + (SO2calc/64.0629) + (O2calc/31.9988) + (N2acalc/28.161) + (Nf/28.0134))
4 of 10
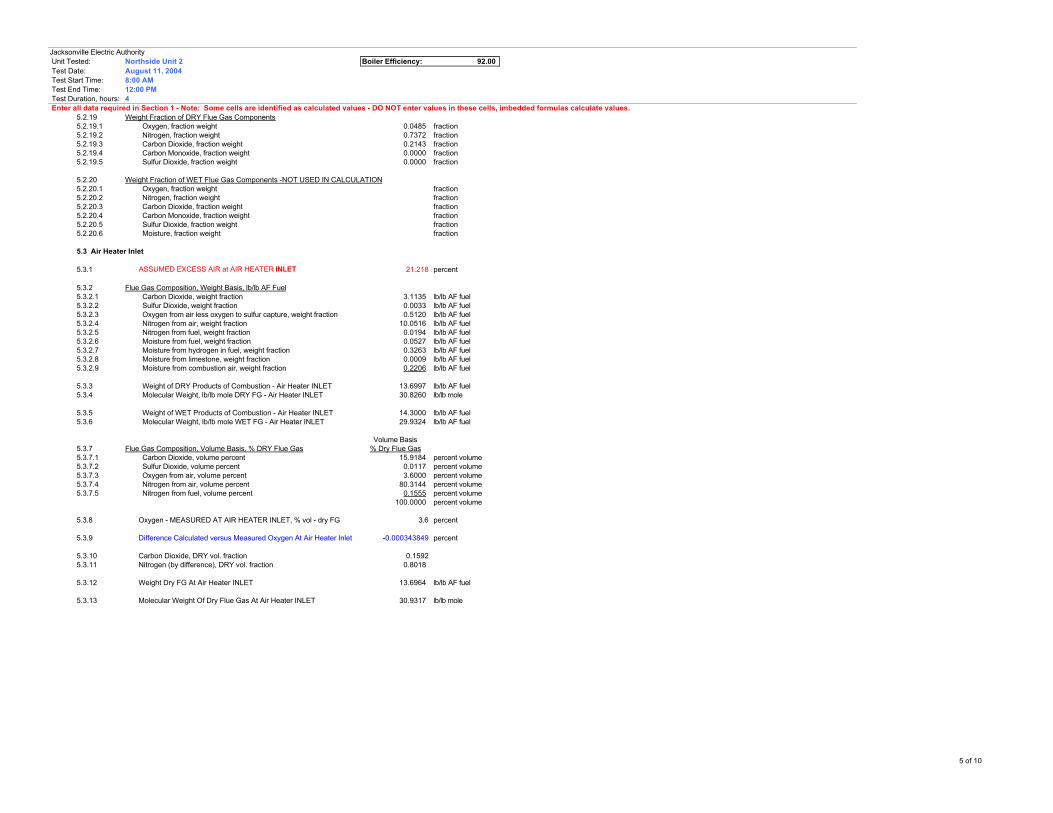
Jacksonville Electric Authority Unit Tested: Northside Unit 2 Boiler Efficiency: 92.00 Test Date: August 11, 2004 Test Start Time: 8:00 AM Test End Time: 12:00 PM Test Duration, hours: 4 Enter all data required in Section 1 - Note: Some cells are identified as calculated values - DO NOT enter values in these cells, imbedded formulas calculate values.
5.2.19 Weight Fraction of DRY Flue Gas Components5.2.19.1 Oxygen, fraction weight 0.0485 fraction5.2.19.2 Nitrogen, fraction weight 0.7372 fraction5.2.19.3 Carbon Dioxide, fraction weight 0.2143 fraction5.2.19.4 Carbon Monoxide, fraction weight 0.0000 fraction5.2.19.5 Sulfur Dioxide, fraction weight 0.0000 fraction
5.2.20 Weight Fraction of WET Flue Gas Components -NOT USED IN CALCULATION5.2.20.1 Oxygen, fraction weight fraction5.2.20.2 Nitrogen, fraction weight fraction5.2.20.3 Carbon Dioxide, fraction weight fraction5.2.20.4 Carbon Monoxide, fraction weight fraction5.2.20.5 Sulfur Dioxide, fraction weight fraction5.2.20.6 Moisture, fraction weight fraction
5.3 Air Heater Inlet
5.3.1 ASSUMED EXCESS AIR at AIR HEATER INLET 21.218 percent
5.3.2 Flue Gas Composition, Weight Basis, lb/lb AF Fuel5.3.2.1 Carbon Dioxide, weight fraction 3.1135 lb/lb AF fuel5.3.2.2 Sulfur Dioxide, weight fraction 0.0033 lb/lb AF fuel5.3.2.3 Oxygen from air less oxygen to sulfur capture, weight fraction 0.5120 lb/lb AF fuel5.3.2.4 Nitrogen from air, weight fraction 10.0516 lb/lb AF fuel5.3.2.5 Nitrogen from fuel, weight fraction 0.0194 lb/lb AF fuel5.3.2.6 Moisture from fuel, weight fraction 0.0527 lb/lb AF fuel5.3.2.7 Moisture from hydrogen in fuel, weight fraction 0.3263 lb/lb AF fuel5.3.2.8 Moisture from limestone, weight fraction 0.0009 lb/lb AF fuel5.3.2.9 Moisture from combustion air, weight fraction 0.2206 lb/lb AF fuel
5.3.3 Weight of DRY Products of Combustion - Air Heater INLET 13.6997 lb/lb AF fuel5.3.4 Molecular Weight, lb/lb mole DRY FG - Air Heater INLET 30.8260 lb/lb mole
5.3.5 Weight of WET Products of Combustion - Air Heater INLET 14.3000 lb/lb AF fuel5.3.6 Molecular Weight, lb/lb mole WET FG - Air Heater INLET 29.9324 lb/lb AF fuel
Volume Basis5.3.7 Flue Gas Composition, Volume Basis, % DRY Flue Gas % Dry Flue Gas5.3.7.1 Carbon Dioxide, volume percent 15.9184 percent volume5.3.7.2 Sulfur Dioxide, volume percent 0.0117 percent volume5.3.7.3 Oxygen from air, volume percent 3.6000 percent volume5.3.7.4 Nitrogen from air, volume percent 80.3144 percent volume5.3.7.5 Nitrogen from fuel, volume percent 0.1555 percent volume
100.0000 percent volume
5.3.8 Oxygen - MEASURED AT AIR HEATER INLET, % vol - dry FG 3.6 percent
5.3.9 Difference Calculated versus Measured Oxygen At Air Heater Inlet -0.000343849 percent
5.3.10 Carbon Dioxide, DRY vol. fraction 0.15925.3.11 Nitrogen (by difference), DRY vol. fraction 0.8018
5.3.12 Weight Dry FG At Air Heater INLET 13.6964 lb/lb AF fuel
5.3.13 Molecular Weight Of Dry Flue Gas At Air Heater INLET 30.9317 lb/lb mole
5 of 10
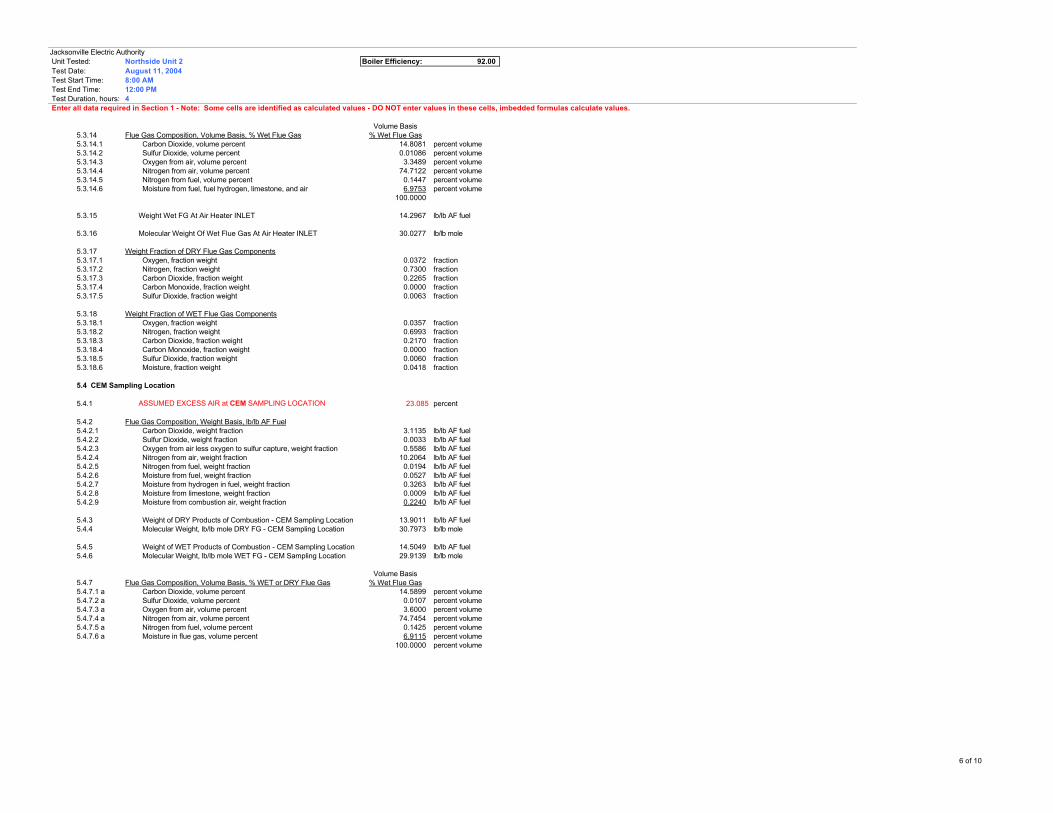
Jacksonville Electric Authority Unit Tested: Northside Unit 2 Boiler Efficiency: 92.00 Test Date: August 11, 2004 Test Start Time: 8:00 AM Test End Time: 12:00 PM Test Duration, hours: 4 Enter all data required in Section 1 - Note: Some cells are identified as calculated values - DO NOT enter values in these cells, imbedded formulas calculate values.
Volume Basis5.3.14 Flue Gas Composition, Volume Basis, % Wet Flue Gas % Wet Flue Gas5.3.14.1 Carbon Dioxide, volume percent 14.8081 percent volume5.3.14.2 Sulfur Dioxide, volume percent 0.01086 percent volume5.3.14.3 Oxygen from air, volume percent 3.3489 percent volume5.3.14.4 Nitrogen from air, volume percent 74.7122 percent volume5.3.14.5 Nitrogen from fuel, volume percent 0.1447 percent volume5.3.14.6 Moisture from fuel, fuel hydrogen, limestone, and air 6.9753 percent volume
100.0000
5.3.15 Weight Wet FG At Air Heater INLET 14.2967 lb/lb AF fuel
5.3.16 Molecular Weight Of Wet Flue Gas At Air Heater INLET 30.0277 lb/lb mole
5.3.17 Weight Fraction of DRY Flue Gas Components5.3.17.1 Oxygen, fraction weight 0.0372 fraction5.3.17.2 Nitrogen, fraction weight 0.7300 fraction5.3.17.3 Carbon Dioxide, fraction weight 0.2265 fraction5.3.17.4 Carbon Monoxide, fraction weight 0.0000 fraction5.3.17.5 Sulfur Dioxide, fraction weight 0.0063 fraction
5.3.18 Weight Fraction of WET Flue Gas Components5.3.18.1 Oxygen, fraction weight 0.0357 fraction5.3.18.2 Nitrogen, fraction weight 0.6993 fraction5.3.18.3 Carbon Dioxide, fraction weight 0.2170 fraction5.3.18.4 Carbon Monoxide, fraction weight 0.0000 fraction5.3.18.5 Sulfur Dioxide, fraction weight 0.0060 fraction5.3.18.6 Moisture, fraction weight 0.0418 fraction
5.4 CEM Sampling Location
5.4.1 ASSUMED EXCESS AIR at CEM SAMPLING LOCATION 23.085 percent
5.4.2 Flue Gas Composition, Weight Basis, lb/lb AF Fuel5.4.2.1 Carbon Dioxide, weight fraction 3.1135 lb/lb AF fuel5.4.2.2 Sulfur Dioxide, weight fraction 0.0033 lb/lb AF fuel5.4.2.3 Oxygen from air less oxygen to sulfur capture, weight fraction 0.5586 lb/lb AF fuel5.4.2.4 Nitrogen from air, weight fraction 10.2064 lb/lb AF fuel5.4.2.5 Nitrogen from fuel, weight fraction 0.0194 lb/lb AF fuel5.4.2.6 Moisture from fuel, weight fraction 0.0527 lb/lb AF fuel5.4.2.7 Moisture from hydrogen in fuel, weight fraction 0.3263 lb/lb AF fuel5.4.2.8 Moisture from limestone, weight fraction 0.0009 lb/lb AF fuel5.4.2.9 Moisture from combustion air, weight fraction 0.2240 lb/lb AF fuel
5.4.3 Weight of DRY Products of Combustion - CEM Sampling Location 13.9011 lb/lb AF fuel5.4.4 Molecular Weight, lb/lb mole DRY FG - CEM Sampling Location 30.7973 lb/lb mole
5.4.5 Weight of WET Products of Combustion - CEM Sampling Location 14.5049 lb/lb AF fuel5.4.6 Molecular Weight, lb/lb mole WET FG - CEM Sampling Location 29.9139 lb/lb mole
Volume Basis5.4.7 Flue Gas Composition, Volume Basis, % WET or DRY Flue Gas % Wet Flue Gas5.4.7.1 a Carbon Dioxide, volume percent 14.5899 percent volume5.4.7.2 a Sulfur Dioxide, volume percent 0.0107 percent volume5.4.7.3 a Oxygen from air, volume percent 3.6000 percent volume5.4.7.4 a Nitrogen from air, volume percent 74.7454 percent volume5.4.7.5 a Nitrogen from fuel, volume percent 0.1425 percent volume5.4.7.6 a Moisture in flue gas, volume percent 6.9115 percent volume
100.0000 percent volume
6 of 10

Jacksonville Electric Authority Unit Tested: Northside Unit 2 Boiler Efficiency: 92.00 Test Date: August 11, 2004 Test Start Time: 8:00 AM Test End Time: 12:00 PM Test Duration, hours: 4 Enter all data required in Section 1 - Note: Some cells are identified as calculated values - DO NOT enter values in these cells, imbedded formulas calculate values.
Volume Basis% Dry Flue Gas
5.4.7.1 b Carbon Dioxide, volume percent 15.6732 percent volume5.4.7.2 b Sulfur Dioxide, volume percent 0.0115 percent volume5.4.7.3 b Oxygen from air, volume percent 3.8673 percent volume5.4.7.4 b Nitrogen from air, volume percent 80.2950 percent volume5.4.7.5 b Nitrogen from fuel, volume percent 0.1531 percent volume5.4.7.6 b Moisture in flue gas, volume percent 0.0000 percent volume
100.0000 percent volume
5.4.8 Oxygen - MEASURED AT CEM SAMPLING LOCATION, % vol - wet FG 3.6 percent volume
5.4.9 Difference Calculated versus Measured Oxygen At CEM Sample Port In Stack0.000271249 percent
5.4.10 Sulfur Dioxide - MEASURE AT CEM SAMPLING LOCATION, ppm - dry FG 114.9 ppm
5.4.11 Difference Calculated versus Measure Sulfur Dioxide At CEM -5.90582E-05 percent
5.5 Determine Loss Due To Dry Gas
5.5.1 Enthalpy Coefficients For Gaseous Mixtures - From PTC 4 Sub-Section 5.19.11Oxygen
C0 -1.1891960E+02C1 4.2295190E-01C2 -1.6897910E-04C3 3.7071740E-07C4 -2.7439490E-10C5 7.384742E-14
5.5.2 a Flue Gas Constituent Enthalpy At tG15 4.613996E+015.5.3 a Flue Gas Constituent Enthalpy At tA8 5.409689E+00
Nitrogen C0 -1.3472300E+02C1 4.6872240E-01C2 -8.8993190E-05C3 1.1982390E-07C4 -3.7714980E-11C5 -3.5026400E-16
5.5.2 b Flue Gas Constituent Enthalpy At tG15 5.1220847E+015.5.3 b Flue Gas Constituent Enthalpy At tA8 6.0690264E+00
Carbon Dioxide C0 -8.5316190E+01C1 1.9512780E-01C2 3.5498060E-04C3 -1.7900110E-07C4 4.0682850E-11C5 1.0285430E-17
5.5.2 c Flue Gas Constituent Enthalpy At tG15 4.4578772E+015.5.3 c Flue Gas Constituent Enthalpy At tA8 5.0120044E+00
Carbon Monoxide C0 -1.3574040E+02C1 4.7377220E-01C2 -1.0337790E-04C3 1.5716920E-07C4 -6.4869650E-11C5 6.1175980E-15
5.5.2 d Flue Gas Constituent Enthalpy At tG15 5.1756420E+015.5.3 d Flue Gas Constituent Enthalpy At tA8 6.1223296E+00
7 of 10

Jacksonville Electric Authority Unit Tested: Northside Unit 2 Boiler Efficiency: 92.00 Test Date: August 11, 2004 Test Start Time: 8:00 AM Test End Time: 12:00 PM Test Duration, hours: 4 Enter all data required in Section 1 - Note: Some cells are identified as calculated values - DO NOT enter values in these cells, imbedded formulas calculate values.
Sulfur DioxideC0 -6.7416550E+01C1 1.8238440E-01C2 1.4862490E-04C3 1.2737190E-08C4 -7.3715210E-11C5 2.8576470E-14
5.5.2 e Flue Gas Constituent Enthalpy At tG15 3.2488333E+015.5.3 e Flue Gas Constituent Enthalpy At tA8 3.6868506E+00
General equation for constituent enthalpy: h = C0 + C1 * T + C2 * T² + C3 * T³ + C4 * T * T³ + C5 * T² * T³ T = degrees Kelvin = (°F + 459.7)/1.8
5.5.4 Flue Gas Enthalpy5.5.5 At Measured AH Outlet Temp - tG15 49.55 Btu/lb5.5.6 At Measured AH Air Inlet Temp - tA8 5.81 Btu/lb
5.5.7 Dry Flue Gas Loss, as tested 633.35 Btu/lb AF fuel
5.6 HHV Percent Loss, as tested 4.50 percent
6. HEAT LOSS DUE TO MOISTURE CONTENT IN FUEL
6.1 Water Vapor Enthalpy at tG15 & 1 psia 1188.57 Btu/lb6.2 Saturated Water Enthalpy at tA8 69.63 Btu/lb
6.3 Fuel Moisture Heat Loss, as tested 58.92 Btu/lb AF fuel
6.4 HHV Percent Loss, as tested 0.42 percent
7. HEAT LOSS DUE TO H2O FROM COMBUSTION OF H2 IN FUEL
7.1 H2O From H2 Heat Loss, as tested 365.08 Btu/lb AF fuel
7.2 HHV Percent Loss, as tested 2.59 percent
8. HEAT LOSS DUE TO COMBUSTIBLES (UNBURNED CARBON) IN ASH
8.1 Unburned Carbon In Ash Heat Loss 22.53 Btu/lb AF fuel
8.2 HHV Percent Loss, as tested 0.16 percent
9. HEAT LOSS DUE TO SENSIBLE HEAT IN TOTAL DRY REFUSE
9.1 Determine Dry Refuse Heat Loss Per Pound Of AF Fuel
9.1.1 Bottom Ash Heat Loss, as tested 3.97 Btu/lb AF fuel9.1.2 Fly Ash Heat Loss, as tested 5.78 Btu/lb AF fuel
9.2 Total Dry Refuse Heat Loss, as tested 9.76 Btu/lb AF fuel
9.3 HHV Percent Loss, as tested 0.07 percent
hwvtG15 = 0.4329 * tG15 + 3.958E-05 * (tG15)² + 1062.2 - PTC 4 Sub-Section 5.19.5
hFGtG15 = O2wt * hO2 + N2wt * hN2 + CO2wt * hCO2 + COwt * hCO + SO2wt * hSO2 hFGtA8 = O2wt * hO2 + N2wt * hN2 + CO2wt * hCO2 + COwt * hCO + SO2wt * hSO2
8 of 10
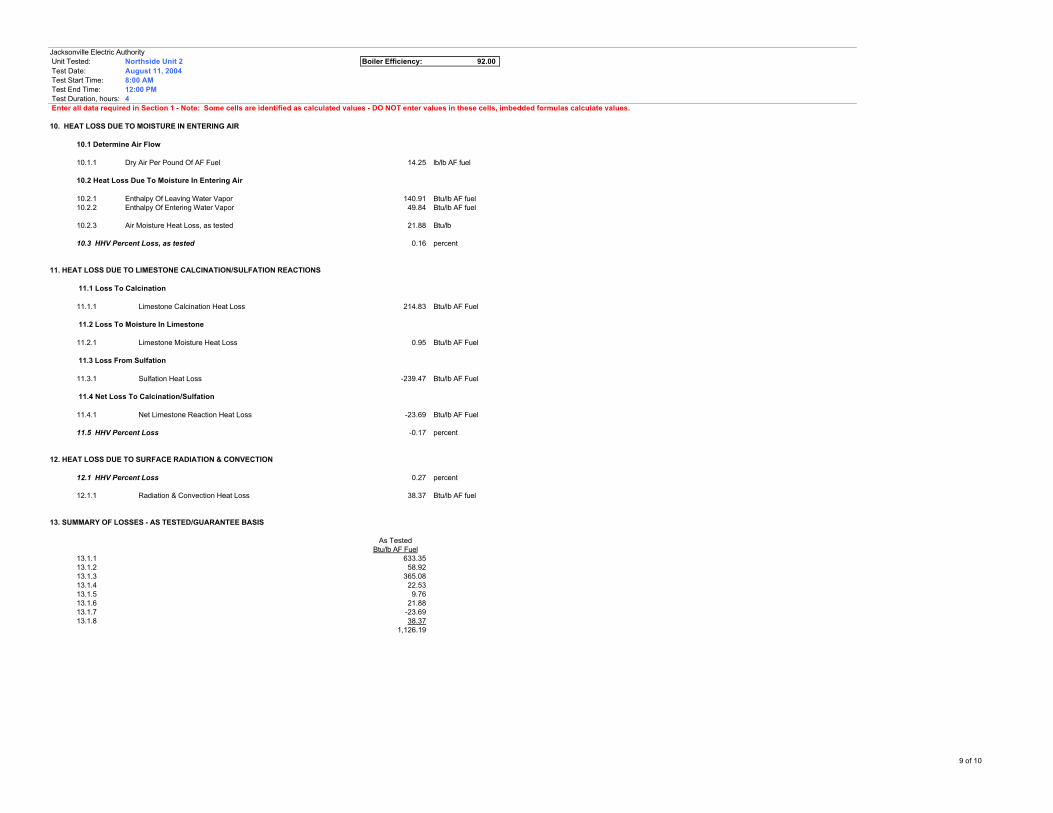
Jacksonville Electric Authority Unit Tested: Northside Unit 2 Boiler Efficiency: 92.00 Test Date: August 11, 2004 Test Start Time: 8:00 AM Test End Time: 12:00 PM Test Duration, hours: 4 Enter all data required in Section 1 - Note: Some cells are identified as calculated values - DO NOT enter values in these cells, imbedded formulas calculate values.
10. HEAT LOSS DUE TO MOISTURE IN ENTERING AIR
10.1 Determine Air Flow
10.1.1 Dry Air Per Pound Of AF Fuel 14.25 lb/lb AF fuel
10.2 Heat Loss Due To Moisture In Entering Air
10.2.1 Enthalpy Of Leaving Water Vapor 140.91 Btu/lb AF fuel10.2.2 Enthalpy Of Entering Water Vapor 49.84 Btu/lb AF fuel
10.2.3 Air Moisture Heat Loss, as tested 21.88 Btu/lb
10.3 HHV Percent Loss, as tested 0.16 percent
11. HEAT LOSS DUE TO LIMESTONE CALCINATION/SULFATION REACTIONS
11.1 Loss To Calcination
11.1.1 Limestone Calcination Heat Loss 214.83 Btu/lb AF Fuel
11.2 Loss To Moisture In Limestone
11.2.1 Limestone Moisture Heat Loss 0.95 Btu/lb AF Fuel
11.3 Loss From Sulfation
11.3.1 Sulfation Heat Loss -239.47 Btu/lb AF Fuel
11.4 Net Loss To Calcination/Sulfation
11.4.1 Net Limestone Reaction Heat Loss -23.69 Btu/lb AF Fuel
11.5 HHV Percent Loss -0.17 percent
12. HEAT LOSS DUE TO SURFACE RADIATION & CONVECTION
12.1 HHV Percent Loss 0.27 percent
12.1.1 Radiation & Convection Heat Loss 38.37 Btu/lb AF fuel
13. SUMMARY OF LOSSES - AS TESTED/GUARANTEE BASIS
As TestedBtu/lb AF Fuel
13.1.1 633.3513.1.2 58.9213.1.3 365.0813.1.4 22.5313.1.5 9.7613.1.6 21.8813.1.7 -23.6913.1.8 38.37
1,126.19
9 of 10

Jacksonville Electric Authority Unit Tested: Northside Unit 2 Boiler Efficiency: 92.00 Test Date: August 11, 2004 Test Start Time: 8:00 AM Test End Time: 12:00 PM Test Duration, hours: 4 Enter all data required in Section 1 - Note: Some cells are identified as calculated values - DO NOT enter values in these cells, imbedded formulas calculate values.
As TestedPercent Loss
13.1.9 Dry Flue Gas 4.5013.1.10 Moisture In Fuel 0.4213.1.11 H2O From H2 In Fuel 2.5913.1.12 Unburned Combustibles In Refuse 0.1613.1.13 Dry Refuse 0.0713.1.14 Moisture In Combustion Air 0.1613.1.15 Calcination/Sulfation -0.1713.1.16 Radiation & Convection 0.27
8.00
13.2 Boiler Efficiency (100 - Total Losses), percent 92.00
14. HEAT INPUT TO WATER & STEAM
14.1 Enthalpies14.1.1 Feedwater, Btu/lb 398.84 Btu/lb14.1.2 Blow Down, Btu/lb 579.65 Btu/lb14.1.3 Sootblowing, Btu/lb 0.00 Btu/lb14.1.4 Desuperheating Spray Water - Main Steam, Btu/lb 252.57 Btu/lb14.1.5 Main Steam, Btu/lb 1448.11 Btu/lb14.1.6 Desuperheating Spray Water - Reheat Steam, Btu/lb 284.40 Btu/lb14.1.7 Reheat Steam - Reheater Inlet, Btu/lb 1288.59 Btu/lb14.1.8 Reheat Steam - Reheater Outlet, Btu/lb 1510.25 Btu/lb
14.2 Heat Output 2,262,454,434 Btu/h2,263,192,023
15. HIGHER HEATING VALUE FUEL HEAT INPUT
15.1 Determine Fuel Heat Input Based on Calculated Efficiency
15.1.1 Fuel Heat Input 2,459,103,274 Btu/h
15.1.2 Fuel Burned - CALCULATED 174,614 lb/h
15.1.3 Difference Assumed versus Calculated Fuel Burned 2.08713E-05 percent
10 of 10
JEA Large-Scale CFB Combustion Demonstration Project
Fuel Capability Demonstration Test Report #4 - ATTACHMENTS 80 / 20 Blend Petroleum Coke and Pittsburgh 8 Coal Fuel
B&V Project 137064
ATTACHMENT C
CAE Test Report
Black & Veatch Corporation 10751 Deerwood Park Boulevard, Suite 130
Jacksonville, FL 32256
To the best of our knowledge, the data presented in this report are accurate and complete and error free, legible and representative of the actual emissions during the test program.
REPORT ON
LARGE SCALE CFB COMBUSTION DEMONSTRATION PROJECT 80% PETROLEUM COKE / 20% PITTSBURGH NO. 8 COAL
Performed for:
BLACK & VEATCH CORPORATION UNIT 2, SDA INLET AND STACK
JEA - NORTHSIDE GENERATING STATION
Client Reference No: 137064.96.1400 CleanAir Project No: 9475-4
Revision 0: September 16, 2004
Submitted by,
Robert A. Preksta Project Manager (412) 787-9130 [email protected]
Reviewed by,
Timothy D. Rodak Manager, Pittsburgh Regional Office
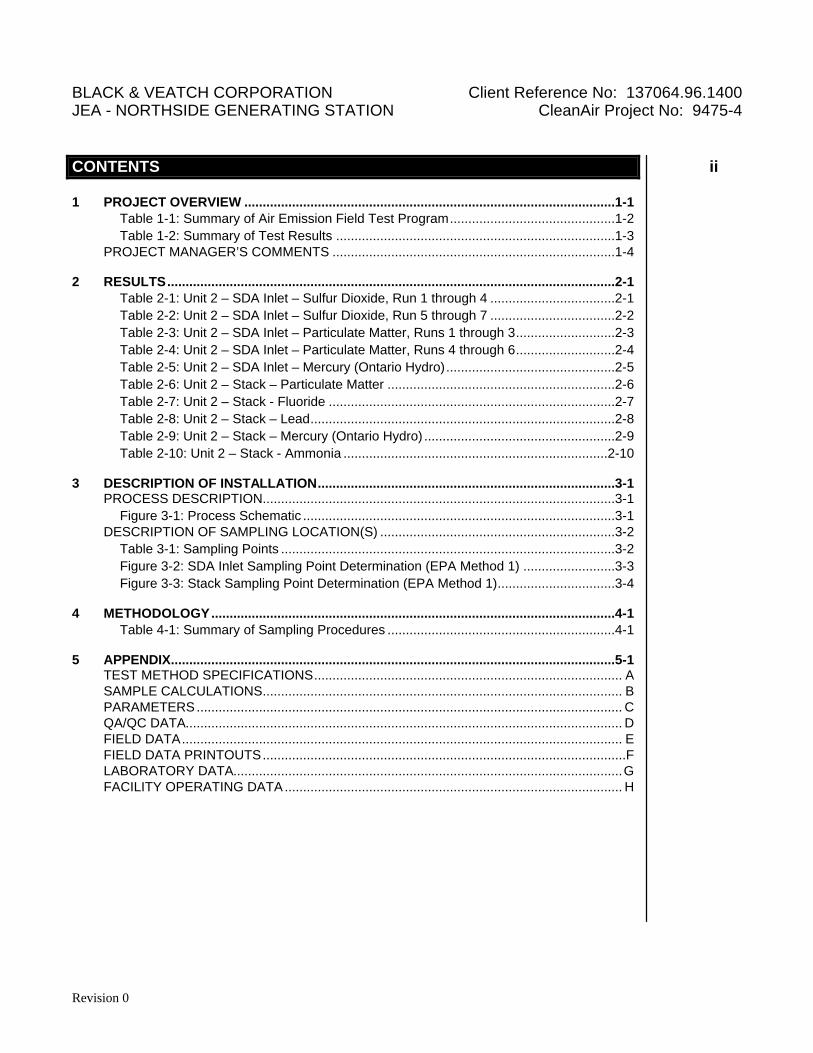
BLACK & VEATCH CORPORATION Client Reference No: 137064.96.1400 JEA - NORTHSIDE GENERATING STATION CleanAir Project No: 9475-4 CONTENTS ii
Revision 0
1 PROJECT OVERVIEW .....................................................................................................1-1 Table 1-1: Summary of Air Emission Field Test Program.............................................1-2 Table 1-2: Summary of Test Results ............................................................................1-3
PROJECT MANAGER’S COMMENTS .............................................................................1-4
2 RESULTS..........................................................................................................................2-1 Table 2-1: Unit 2 – SDA Inlet – Sulfur Dioxide, Run 1 through 4 ..................................2-1 Table 2-2: Unit 2 – SDA Inlet – Sulfur Dioxide, Run 5 through 7 ..................................2-2 Table 2-3: Unit 2 – SDA Inlet – Particulate Matter, Runs 1 through 3...........................2-3 Table 2-4: Unit 2 – SDA Inlet – Particulate Matter, Runs 4 through 6...........................2-4 Table 2-5: Unit 2 – SDA Inlet – Mercury (Ontario Hydro)..............................................2-5 Table 2-6: Unit 2 – Stack – Particulate Matter ..............................................................2-6 Table 2-7: Unit 2 – Stack - Fluoride ..............................................................................2-7 Table 2-8: Unit 2 – Stack – Lead...................................................................................2-8 Table 2-9: Unit 2 – Stack – Mercury (Ontario Hydro) ....................................................2-9 Table 2-10: Unit 2 – Stack - Ammonia ........................................................................2-10
3 DESCRIPTION OF INSTALLATION.................................................................................3-1 PROCESS DESCRIPTION................................................................................................3-1
Figure 3-1: Process Schematic .....................................................................................3-1 DESCRIPTION OF SAMPLING LOCATION(S) ................................................................3-2
Table 3-1: Sampling Points ...........................................................................................3-2 Figure 3-2: SDA Inlet Sampling Point Determination (EPA Method 1) .........................3-3 Figure 3-3: Stack Sampling Point Determination (EPA Method 1)................................3-4
4 METHODOLOGY..............................................................................................................4-1 Table 4-1: Summary of Sampling Procedures ..............................................................4-1
5 APPENDIX.........................................................................................................................5-1 TEST METHOD SPECIFICATIONS.................................................................................... A SAMPLE CALCULATIONS.................................................................................................. B PARAMETERS.................................................................................................................... C QA/QC DATA....................................................................................................................... D FIELD DATA........................................................................................................................ E FIELD DATA PRINTOUTS...................................................................................................F LABORATORY DATA..........................................................................................................G FACILITY OPERATING DATA............................................................................................ H
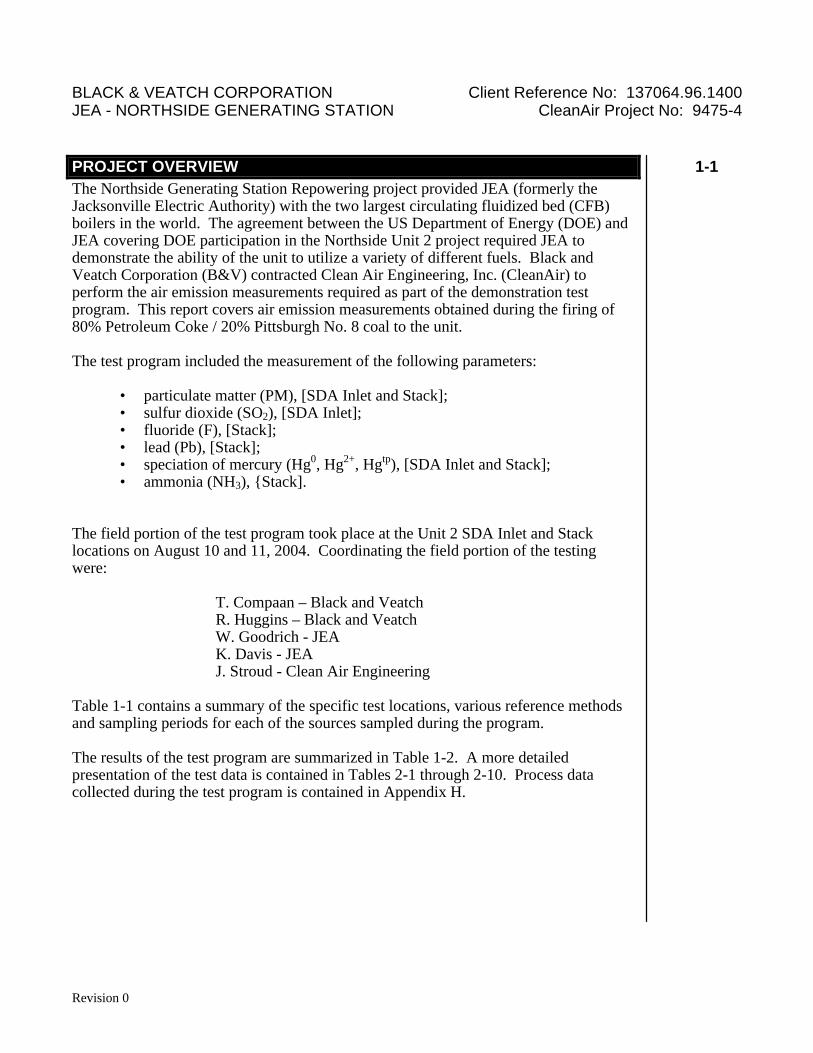
BLACK & VEATCH CORPORATION Client Reference No: 137064.96.1400 JEA - NORTHSIDE GENERATING STATION CleanAir Project No: 9475-4 PROJECT OVERVIEW 1-1
Revision 0
The Northside Generating Station Repowering project provided JEA (formerly the Jacksonville Electric Authority) with the two largest circulating fluidized bed (CFB) boilers in the world. The agreement between the US Department of Energy (DOE) and JEA covering DOE participation in the Northside Unit 2 project required JEA to demonstrate the ability of the unit to utilize a variety of different fuels. Black and Veatch Corporation (B&V) contracted Clean Air Engineering, Inc. (CleanAir) to perform the air emission measurements required as part of the demonstration test program. This report covers air emission measurements obtained during the firing of 80% Petroleum Coke / 20% Pittsburgh No. 8 coal to the unit. The test program included the measurement of the following parameters:
• particulate matter (PM), [SDA Inlet and Stack]; • sulfur dioxide (SO2), [SDA Inlet]; • fluoride (F), [Stack]; • lead (Pb), [Stack]; • speciation of mercury (Hg0, Hg2+, Hgtp), [SDA Inlet and Stack]; • ammonia (NH3), {Stack].
The field portion of the test program took place at the Unit 2 SDA Inlet and Stack locations on August 10 and 11, 2004. Coordinating the field portion of the testing were: T. Compaan – Black and Veatch R. Huggins – Black and Veatch W. Goodrich - JEA K. Davis - JEA J. Stroud - Clean Air Engineering Table 1-1 contains a summary of the specific test locations, various reference methods and sampling periods for each of the sources sampled during the program. The results of the test program are summarized in Table 1-2. A more detailed presentation of the test data is contained in Tables 2-1 through 2-10. Process data collected during the test program is contained in Appendix H.
1 Project Overview
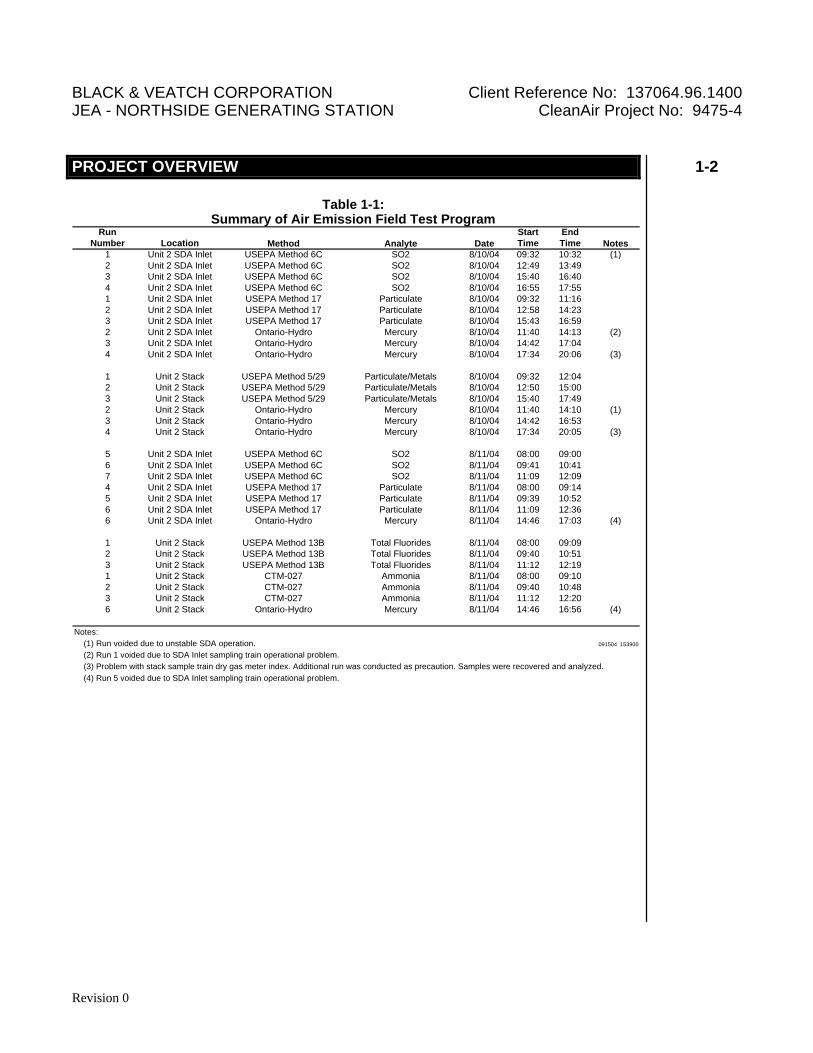
BLACK & VEATCH CORPORATION Client Reference No: 137064.96.1400 JEA - NORTHSIDE GENERATING STATION CleanAir Project No: 9475-4 PROJECT OVERVIEW 1-2
Revision 0
Table 1-1:
Summary of Air Emission Field Test Program Run
Number Location Method Analyte DateStart Time
End Time Notes
1 Unit 2 SDA Inlet USEPA Method 6C SO2 8/10/04 09:32 10:32 (1)2 Unit 2 SDA Inlet USEPA Method 6C SO2 8/10/04 12:49 13:493 Unit 2 SDA Inlet USEPA Method 6C SO2 8/10/04 15:40 16:404 Unit 2 SDA Inlet USEPA Method 6C SO2 8/10/04 16:55 17:551 Unit 2 SDA Inlet USEPA Method 17 Particulate 8/10/04 09:32 11:162 Unit 2 SDA Inlet USEPA Method 17 Particulate 8/10/04 12:58 14:233 Unit 2 SDA Inlet USEPA Method 17 Particulate 8/10/04 15:43 16:592 Unit 2 SDA Inlet Ontario-Hydro Mercury 8/10/04 11:40 14:13 (2)3 Unit 2 SDA Inlet Ontario-Hydro Mercury 8/10/04 14:42 17:044 Unit 2 SDA Inlet Ontario-Hydro Mercury 8/10/04 17:34 20:06 (3)
1 Unit 2 Stack USEPA Method 5/29 Particulate/Metals 8/10/04 09:32 12:042 Unit 2 Stack USEPA Method 5/29 Particulate/Metals 8/10/04 12:50 15:003 Unit 2 Stack USEPA Method 5/29 Particulate/Metals 8/10/04 15:40 17:492 Unit 2 Stack Ontario-Hydro Mercury 8/10/04 11:40 14:10 (1)3 Unit 2 Stack Ontario-Hydro Mercury 8/10/04 14:42 16:534 Unit 2 Stack Ontario-Hydro Mercury 8/10/04 17:34 20:05 (3)
5 Unit 2 SDA Inlet USEPA Method 6C SO2 8/11/04 08:00 09:006 Unit 2 SDA Inlet USEPA Method 6C SO2 8/11/04 09:41 10:417 Unit 2 SDA Inlet USEPA Method 6C SO2 8/11/04 11:09 12:094 Unit 2 SDA Inlet USEPA Method 17 Particulate 8/11/04 08:00 09:145 Unit 2 SDA Inlet USEPA Method 17 Particulate 8/11/04 09:39 10:526 Unit 2 SDA Inlet USEPA Method 17 Particulate 8/11/04 11:09 12:366 Unit 2 SDA Inlet Ontario-Hydro Mercury 8/11/04 14:46 17:03 (4)
1 Unit 2 Stack USEPA Method 13B Total Fluorides 8/11/04 08:00 09:092 Unit 2 Stack USEPA Method 13B Total Fluorides 8/11/04 09:40 10:513 Unit 2 Stack USEPA Method 13B Total Fluorides 8/11/04 11:12 12:191 Unit 2 Stack CTM-027 Ammonia 8/11/04 08:00 09:102 Unit 2 Stack CTM-027 Ammonia 8/11/04 09:40 10:483 Unit 2 Stack CTM-027 Ammonia 8/11/04 11:12 12:206 Unit 2 Stack Ontario-Hydro Mercury 8/11/04 14:46 16:56 (4)
Notes:091504 153900
(3) Problem with stack sample train dry gas meter index. Additional run was conducted as precaution. Samples were recovered and analyzed.
(1) Run voided due to unstable SDA operation.(2) Run 1 voided due to SDA Inlet sampling train operational problem.
(4) Run 5 voided due to SDA Inlet sampling train operational problem.
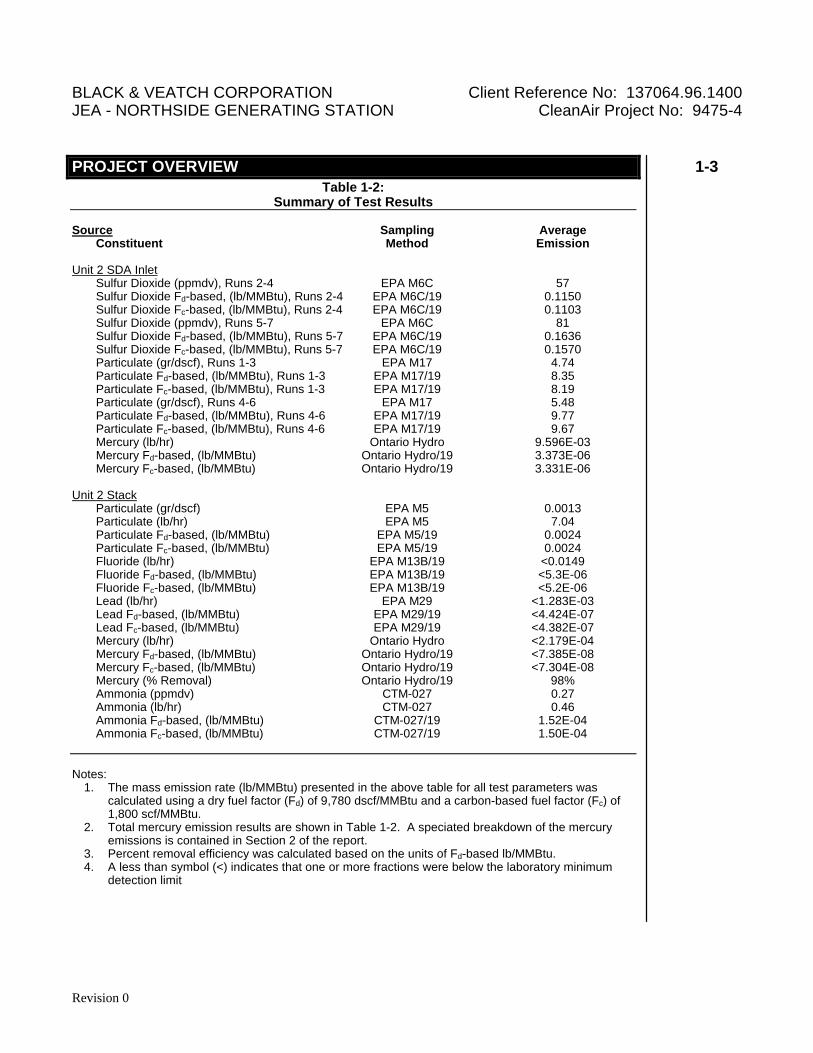
BLACK & VEATCH CORPORATION Client Reference No: 137064.96.1400 JEA - NORTHSIDE GENERATING STATION CleanAir Project No: 9475-4 PROJECT OVERVIEW 1-3
Revision 0
Table 1-2: Summary of Test Results
Source Sampling Average Constituent Method Emission Unit 2 SDA Inlet Sulfur Dioxide (ppmdv), Runs 2-4 EPA M6C 57 Sulfur Dioxide Fd-based, (lb/MMBtu), Runs 2-4 EPA M6C/19 0.1150 Sulfur Dioxide Fc-based, (lb/MMBtu), Runs 2-4 EPA M6C/19 0.1103 Sulfur Dioxide (ppmdv), Runs 5-7 EPA M6C 81 Sulfur Dioxide Fd-based, (lb/MMBtu), Runs 5-7 EPA M6C/19 0.1636 Sulfur Dioxide Fc-based, (lb/MMBtu), Runs 5-7 EPA M6C/19 0.1570 Particulate (gr/dscf), Runs 1-3 EPA M17 4.74 Particulate Fd-based, (lb/MMBtu), Runs 1-3 EPA M17/19 8.35 Particulate Fc-based, (lb/MMBtu), Runs 1-3 EPA M17/19 8.19 Particulate (gr/dscf), Runs 4-6 EPA M17 5.48 Particulate Fd-based, (lb/MMBtu), Runs 4-6 EPA M17/19 9.77 Particulate Fc-based, (lb/MMBtu), Runs 4-6 EPA M17/19 9.67 Mercury (lb/hr) Ontario Hydro 9.596E-03 Mercury Fd-based, (lb/MMBtu) Ontario Hydro/19 3.373E-06 Mercury Fc-based, (lb/MMBtu) Ontario Hydro/19 3.331E-06 Unit 2 Stack Particulate (gr/dscf) EPA M5 0.0013 Particulate (lb/hr) EPA M5 7.04 Particulate Fd-based, (lb/MMBtu) EPA M5/19 0.0024 Particulate Fc-based, (lb/MMBtu) EPA M5/19 0.0024 Fluoride (lb/hr) EPA M13B/19 <0.0149 Fluoride Fd-based, (lb/MMBtu) EPA M13B/19 <5.3E-06 Fluoride Fc-based, (lb/MMBtu) EPA M13B/19 <5.2E-06 Lead (lb/hr) EPA M29 <1.283E-03 Lead Fd-based, (lb/MMBtu) EPA M29/19 <4.424E-07 Lead Fc-based, (lb/MMBtu) EPA M29/19 <4.382E-07 Mercury (lb/hr) Ontario Hydro <2.179E-04 Mercury Fd-based, (lb/MMBtu) Ontario Hydro/19 <7.385E-08 Mercury Fc-based, (lb/MMBtu) Ontario Hydro/19 <7.304E-08 Mercury (% Removal) Ontario Hydro/19 98% Ammonia (ppmdv) CTM-027 0.27 Ammonia (lb/hr) CTM-027 0.46 Ammonia Fd-based, (lb/MMBtu) CTM-027/19 1.52E-04 Ammonia Fc-based, (lb/MMBtu) CTM-027/19 1.50E-04
Notes: 1. The mass emission rate (lb/MMBtu) presented in the above table for all test parameters was
calculated using a dry fuel factor (Fd) of 9,780 dscf/MMBtu and a carbon-based fuel factor (Fc) of 1,800 scf/MMBtu.
2. Total mercury emission results are shown in Table 1-2. A speciated breakdown of the mercury emissions is contained in Section 2 of the report.
3. Percent removal efficiency was calculated based on the units of Fd-based lb/MMBtu. 4. A less than symbol (<) indicates that one or more fractions were below the laboratory minimum
detection limit
BLACK & VEATCH CORPORATION Client Reference No: 137064.96.1400 JEA - NORTHSIDE GENERATING STATION CleanAir Project No: 9475-4 PROJECT OVERVIEW 1-4
Revision 0
PROJECT MANAGER’S COMMENTS Ontario Hydro Test Results Each Ontario Hydro sampling train consists of five (5) sample fractions. These fractions, starting from the sampling nozzle, consist of:
1. 0.1N HNO3 (Front-half Rinse) 2. Filter 3. KCl (Impingers 1 through 3) 4. HNO3-H2O2 (Impinger 4) 5. KMnO4 (Impingers 5 through 7)
An aliquot of each reagent and an unused filter where analyzed for mercury prior to use in the field as an added quality assurance program. All reagents and the filter blank were below the minimum detection limit for mercury. Results of the pre-blank analysis are contained in Appendix D. A total of six Ontario Hydro test runs were conducted. SDA Inlet Run 1 (sampling train impinger contents back-flushed) and SDA Inlet Run 5 (mid-test leak-check above limit) were voided prior to completion of the sampling runs. During Run 4 at the Stack location it was noticed that the dry gas meter index units digit had stopped advancing. The location technician manually kept track of the sampled volume for the remainder of the test run. The equipment was replaced prior to the beginning of Run 5. During the recovery of the Stack Run 4, the laboratory technician noted that the KCL sample (Impingers 1 through 3) required an amount of potassium permanganate (KMNO4) solution in a greater volume than previous samples be added during the normal recovery to maintain the solutions purple color. Based on this observation, an addition test (Run 6) was conducted at the SDA Inlet and Stack locations as a contingency. The samples from Runs 2, 3, 4 and 6 were all analyzed and are presented in the report. The additional KMNO4 solution required in the KCL (impingers 1 through 3) sample of Run 4 did not present any bias in the analysis and was therefore included in the overall test averages presented.
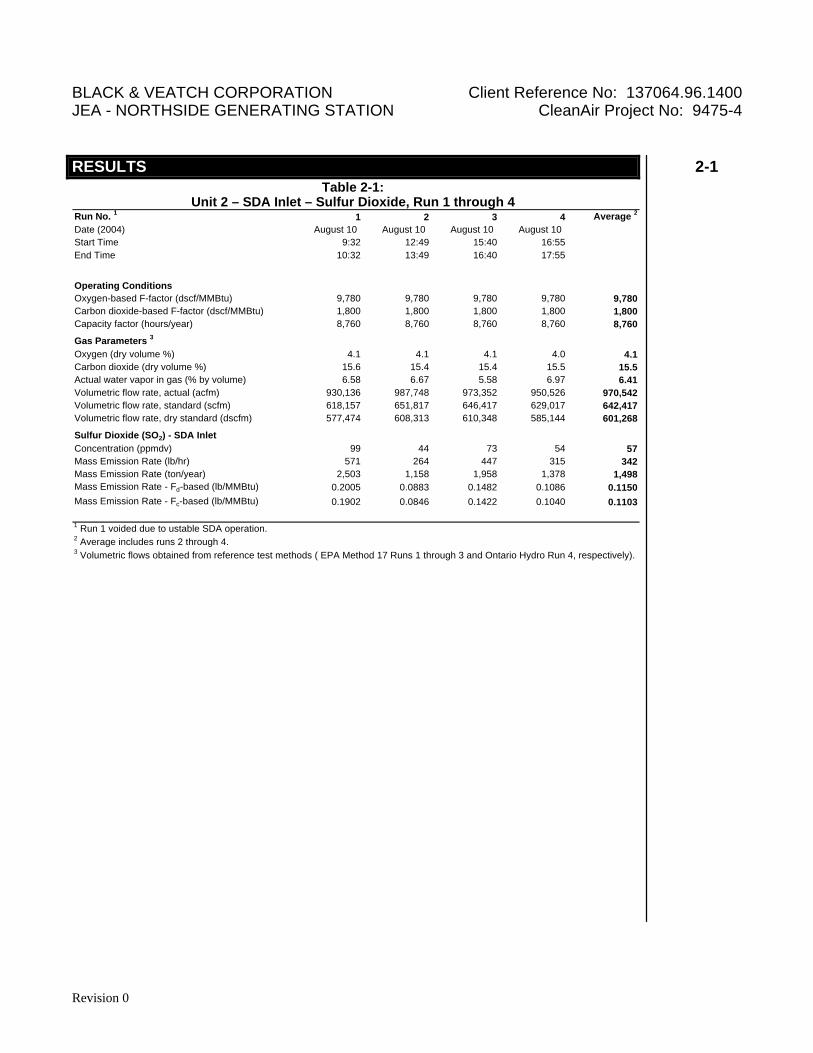
BLACK & VEATCH CORPORATION Client Reference No: 137064.96.1400 JEA - NORTHSIDE GENERATING STATION CleanAir Project No: 9475-4 RESULTS 2-1
Revision 0
Table 2-1: Unit 2 – SDA Inlet – Sulfur Dioxide, Run 1 through 4
Run No. 1 1 2 3 4 Average 2
Date (2004) August 10 August 10 August 10 August 10Start Time 9:32 12:49 15:40 16:55End Time 10:32 13:49 16:40 17:55
Operating ConditionsOxygen-based F-factor (dscf/MMBtu) 9,780 9,780 9,780 9,780 9,780Carbon dioxide-based F-factor (dscf/MMBtu) 1,800 1,800 1,800 1,800 1,800Capacity factor (hours/year) 8,760 8,760 8,760 8,760 8,760
Gas Parameters 3
Oxygen (dry volume %) 4.1 4.1 4.1 4.0 4.1Carbon dioxide (dry volume %) 15.6 15.4 15.4 15.5 15.5Actual water vapor in gas (% by volume) 6.58 6.67 5.58 6.97 6.41Volumetric flow rate, actual (acfm) 930,136 987,748 973,352 950,526 970,542Volumetric flow rate, standard (scfm) 618,157 651,817 646,417 629,017 642,417Volumetric flow rate, dry standard (dscfm) 577,474 608,313 610,348 585,144 601,268
Sulfur Dioxide (SO2) - SDA InletConcentration (ppmdv) 99 44 73 54 57Mass Emission Rate (lb/hr) 571 264 447 315 342Mass Emission Rate (ton/year) 2,503 1,158 1,958 1,378 1,498Mass Emission Rate - Fd-based (lb/MMBtu) 0.2005 0.0883 0.1482 0.1086 0.1150Mass Emission Rate - Fc-based (lb/MMBtu) 0.1902 0.0846 0.1422 0.1040 0.1103
1 Run 1 voided due to ustable SDA operation.2 Average includes runs 2 through 4.3 Volumetric flows obtained from reference test methods ( EPA Method 17 Runs 1 through 3 and Ontario Hydro Run 4, respectively).
2 Results
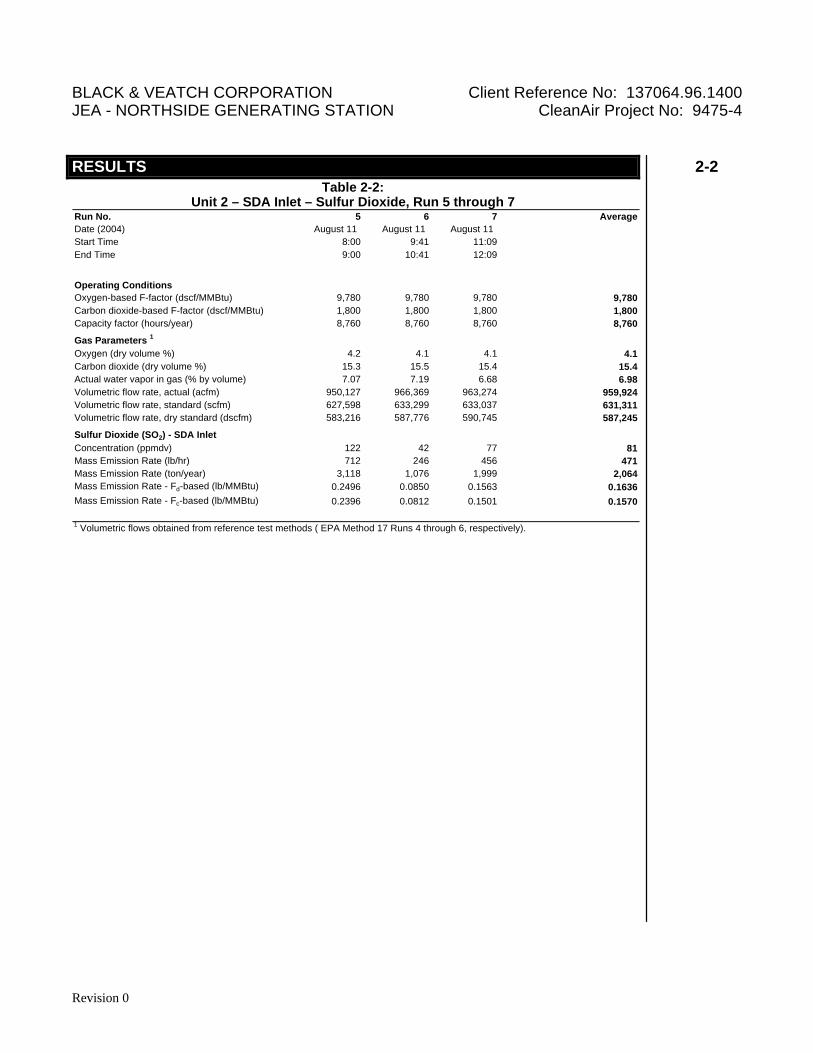
BLACK & VEATCH CORPORATION Client Reference No: 137064.96.1400 JEA - NORTHSIDE GENERATING STATION CleanAir Project No: 9475-4 RESULTS 2-2
Revision 0
Table 2-2: Unit 2 – SDA Inlet – Sulfur Dioxide, Run 5 through 7
Run No. 5 6 7 AverageDate (2004) August 11 August 11 August 11Start Time 8:00 9:41 11:09End Time 9:00 10:41 12:09
Operating ConditionsOxygen-based F-factor (dscf/MMBtu) 9,780 9,780 9,780 9,780Carbon dioxide-based F-factor (dscf/MMBtu) 1,800 1,800 1,800 1,800Capacity factor (hours/year) 8,760 8,760 8,760 8,760
Gas Parameters 1
Oxygen (dry volume %) 4.2 4.1 4.1 4.1Carbon dioxide (dry volume %) 15.3 15.5 15.4 15.4Actual water vapor in gas (% by volume) 7.07 7.19 6.68 6.98Volumetric flow rate, actual (acfm) 950,127 966,369 963,274 959,924Volumetric flow rate, standard (scfm) 627,598 633,299 633,037 631,311Volumetric flow rate, dry standard (dscfm) 583,216 587,776 590,745 587,245
Sulfur Dioxide (SO2) - SDA InletConcentration (ppmdv) 122 42 77 81Mass Emission Rate (lb/hr) 712 246 456 471Mass Emission Rate (ton/year) 3,118 1,076 1,999 2,064Mass Emission Rate - Fd-based (lb/MMBtu) 0.2496 0.0850 0.1563 0.1636Mass Emission Rate - Fc-based (lb/MMBtu) 0.2396 0.0812 0.1501 0.1570
1 Volumetric flows obtained from reference test methods ( EPA Method 17 Runs 4 through 6, respectively).
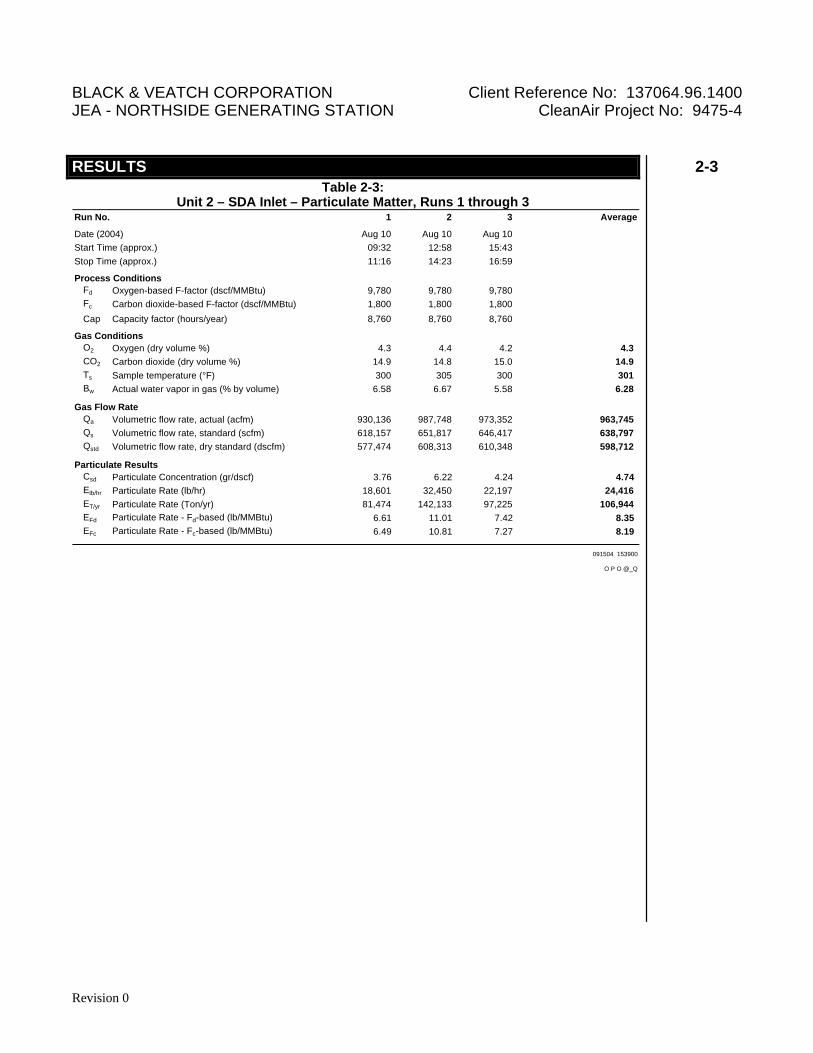
BLACK & VEATCH CORPORATION Client Reference No: 137064.96.1400 JEA - NORTHSIDE GENERATING STATION CleanAir Project No: 9475-4 RESULTS 2-3
Revision 0
Table 2-3: Unit 2 – SDA Inlet – Particulate Matter, Runs 1 through 3
Run No. 1 2 3 Average
Date (2004) Aug 10 Aug 10 Aug 10Start Time (approx.) 09:32 12:58 15:43Stop Time (approx.) 11:16 14:23 16:59
Process ConditionsFd Oxygen-based F-factor (dscf/MMBtu) 9,780 9,780 9,780Fc Carbon dioxide-based F-factor (dscf/MMBtu) 1,800 1,800 1,800
Cap Capacity factor (hours/year) 8,760 8,760 8,760
Gas ConditionsO2 Oxygen (dry volume %) 4.3 4.4 4.2 4.3CO2 Carbon dioxide (dry volume %) 14.9 14.8 15.0 14.9Ts Sample temperature (°F) 300 305 300 301Bw Actual water vapor in gas (% by volume) 6.58 6.67 5.58 6.28
Gas Flow RateQa Volumetric flow rate, actual (acfm) 930,136 987,748 973,352 963,745Qs Volumetric flow rate, standard (scfm) 618,157 651,817 646,417 638,797Qstd Volumetric flow rate, dry standard (dscfm) 577,474 608,313 610,348 598,712
Particulate ResultsCsd Particulate Concentration (gr/dscf) 3.76 6.22 4.24 4.74Elb/hr Particulate Rate (lb/hr) 18,601 32,450 22,197 24,416ET/yr Particulate Rate (Ton/yr) 81,474 142,133 97,225 106,944EFd Particulate Rate - Fd-based (lb/MMBtu) 6.61 11.01 7.42 8.35EFc Particulate Rate - Fc-based (lb/MMBtu) 6.49 10.81 7.27 8.19
091504 153900
O P O @_Q
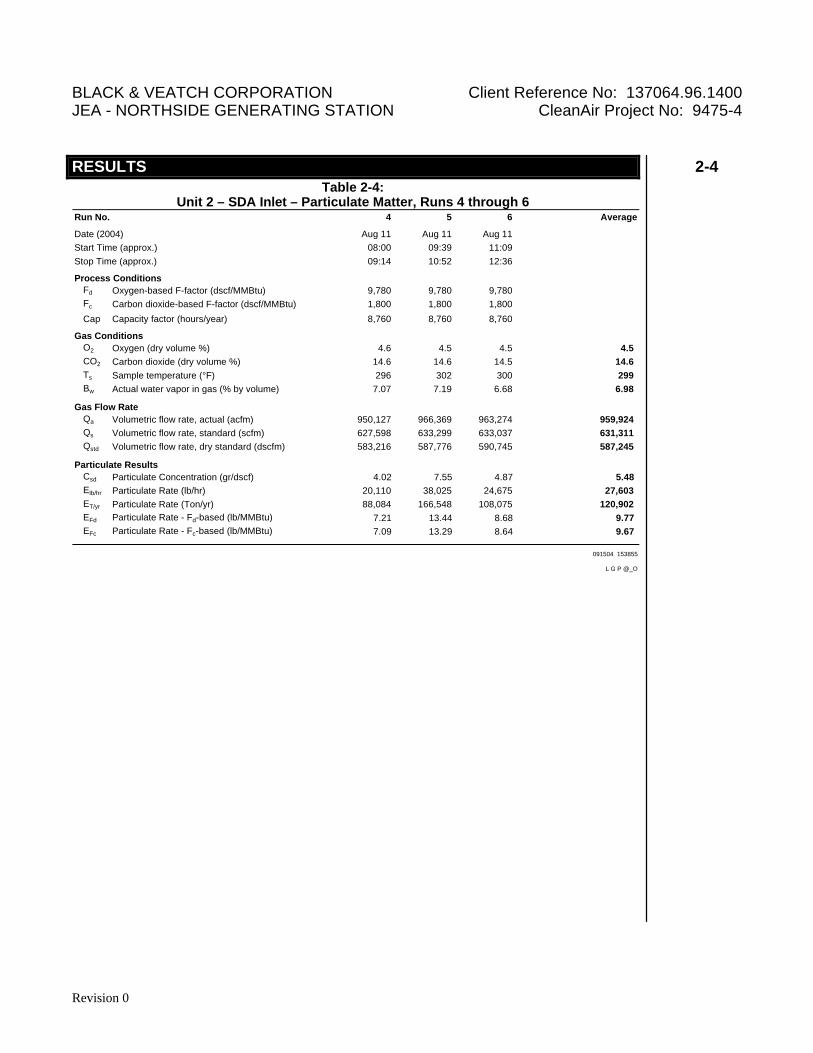
BLACK & VEATCH CORPORATION Client Reference No: 137064.96.1400 JEA - NORTHSIDE GENERATING STATION CleanAir Project No: 9475-4 RESULTS 2-4
Revision 0
Table 2-4: Unit 2 – SDA Inlet – Particulate Matter, Runs 4 through 6
Run No. 4 5 6 Average
Date (2004) Aug 11 Aug 11 Aug 11Start Time (approx.) 08:00 09:39 11:09Stop Time (approx.) 09:14 10:52 12:36
Process ConditionsFd Oxygen-based F-factor (dscf/MMBtu) 9,780 9,780 9,780Fc Carbon dioxide-based F-factor (dscf/MMBtu) 1,800 1,800 1,800
Cap Capacity factor (hours/year) 8,760 8,760 8,760
Gas ConditionsO2 Oxygen (dry volume %) 4.6 4.5 4.5 4.5CO2 Carbon dioxide (dry volume %) 14.6 14.6 14.5 14.6Ts Sample temperature (°F) 296 302 300 299Bw Actual water vapor in gas (% by volume) 7.07 7.19 6.68 6.98
Gas Flow RateQa Volumetric flow rate, actual (acfm) 950,127 966,369 963,274 959,924Qs Volumetric flow rate, standard (scfm) 627,598 633,299 633,037 631,311Qstd Volumetric flow rate, dry standard (dscfm) 583,216 587,776 590,745 587,245
Particulate ResultsCsd Particulate Concentration (gr/dscf) 4.02 7.55 4.87 5.48Elb/hr Particulate Rate (lb/hr) 20,110 38,025 24,675 27,603ET/yr Particulate Rate (Ton/yr) 88,084 166,548 108,075 120,902EFd Particulate Rate - Fd-based (lb/MMBtu) 7.21 13.44 8.68 9.77EFc Particulate Rate - Fc-based (lb/MMBtu) 7.09 13.29 8.64 9.67
091504 153855
L G P @_O
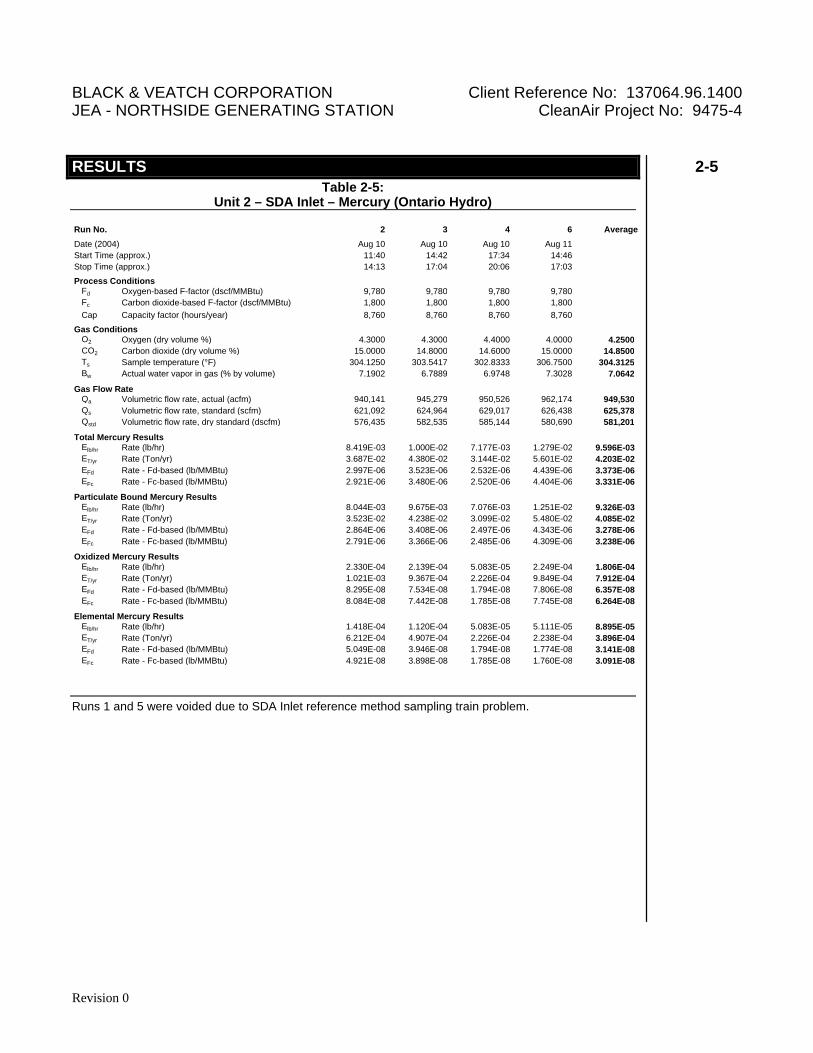
BLACK & VEATCH CORPORATION Client Reference No: 137064.96.1400 JEA - NORTHSIDE GENERATING STATION CleanAir Project No: 9475-4 RESULTS 2-5
Revision 0
Table 2-5: Unit 2 – SDA Inlet – Mercury (Ontario Hydro)
Run No. 2 3 4 6 Average
Date (2004) Aug 10 Aug 10 Aug 10 Aug 11Start Time (approx.) 11:40 14:42 17:34 14:46Stop Time (approx.) 14:13 17:04 20:06 17:03
Process ConditionsFd Oxygen-based F-factor (dscf/MMBtu) 9,780 9,780 9,780 9,780 Fc Carbon dioxide-based F-factor (dscf/MMBtu) 1,800 1,800 1,800 1,800 Cap Capacity factor (hours/year) 8,760 8,760 8,760 8,760
Gas Conditions O2 Oxygen (dry volume %) 4.3000 4.3000 4.4000 4.0000 4.2500CO2 Carbon dioxide (dry volume %) 15.0000 14.8000 14.6000 15.0000 14.8500Ts Sample temperature (°F) 304.1250 303.5417 302.8333 306.7500 304.3125Bw Actual water vapor in gas (% by volume) 7.1902 6.7889 6.9748 7.3028 7.0642
Gas Flow RateQa Volumetric flow rate, actual (acfm) 940,141 945,279 950,526 962,174 949,530Qs Volumetric flow rate, standard (scfm) 621,092 624,964 629,017 626,438 625,378Qstd Volumetric flow rate, dry standard (dscfm) 576,435 582,535 585,144 580,690 581,201
Total Mercury ResultsElb/hr Rate (lb/hr) 8.419E-03 1.000E-02 7.177E-03 1.279E-02 9.596E-03ET/yr Rate (Ton/yr) 3.687E-02 4.380E-02 3.144E-02 5.601E-02 4.203E-02EFd Rate - Fd-based (lb/MMBtu) 2.997E-06 3.523E-06 2.532E-06 4.439E-06 3.373E-06EFc Rate - Fc-based (lb/MMBtu) 2.921E-06 3.480E-06 2.520E-06 4.404E-06 3.331E-06
Particulate Bound Mercury ResultsElb/hr Rate (lb/hr) 8.044E-03 9.675E-03 7.076E-03 1.251E-02 9.326E-03ET/yr Rate (Ton/yr) 3.523E-02 4.238E-02 3.099E-02 5.480E-02 4.085E-02EFd Rate - Fd-based (lb/MMBtu) 2.864E-06 3.408E-06 2.497E-06 4.343E-06 3.278E-06EFc Rate - Fc-based (lb/MMBtu) 2.791E-06 3.366E-06 2.485E-06 4.309E-06 3.238E-06
Oxidized Mercury ResultsElb/hr Rate (lb/hr) 2.330E-04 2.139E-04 5.083E-05 2.249E-04 1.806E-04ET/yr Rate (Ton/yr) 1.021E-03 9.367E-04 2.226E-04 9.849E-04 7.912E-04EFd Rate - Fd-based (lb/MMBtu) 8.295E-08 7.534E-08 1.794E-08 7.806E-08 6.357E-08EFc Rate - Fc-based (lb/MMBtu) 8.084E-08 7.442E-08 1.785E-08 7.745E-08 6.264E-08
Elemental Mercury ResultsElb/hr Rate (lb/hr) 1.418E-04 1.120E-04 5.083E-05 5.111E-05 8.895E-05ET/yr Rate (Ton/yr) 6.212E-04 4.907E-04 2.226E-04 2.238E-04 3.896E-04EFd Rate - Fd-based (lb/MMBtu) 5.049E-08 3.946E-08 1.794E-08 1.774E-08 3.141E-08EFc Rate - Fc-based (lb/MMBtu) 4.921E-08 3.898E-08 1.785E-08 1.760E-08 3.091E-08
Runs 1 and 5 were voided due to SDA Inlet reference method sampling train problem.

BLACK & VEATCH CORPORATION Client Reference No: 137064.96.1400 JEA - NORTHSIDE GENERATING STATION CleanAir Project No: 9475-4 RESULTS 2-6
Revision 0
Table 2-6: Unit 2 – Stack – Particulate Matter
Run No. 1 2 3 Average
Date (2004) Aug 10 Aug 10 Aug 10Start Time (approx.) 09:32 12:50 15:40Stop Time (approx.) 12:04 15:00 17:49
Process ConditionsFd Oxygen-based F-factor (dscf/MMBtu) 9,780 9,780 9,780Fc Carbon dioxide-based F-factor (dscf/MMBtu) 1,800 1,800 1,800
Cap Capacity factor (hours/year) 8,760 8,760 8,760
Gas ConditionsO2 Oxygen (dry volume %) 5.1 4.6 4.5 4.7CO2 Carbon dioxide (dry volume %) 14.0 14.6 14.5 14.4Ts Sample temperature (°F) 222 222 223 222Bw Actual water vapor in gas (% by volume) 10.84 10.99 10.29 10.70
Gas Flow RateQa Volumetric flow rate, actual (acfm) 887,455 884,598 909,668 893,907Qs Volumetric flow rate, standard (scfm) 690,613 688,684 706,733 695,344Qstd Volumetric flow rate, dry standard (dscfm) 615,780 613,032 634,025 620,945
Particulate ResultsCsd Particulate Concentration (gr/dscf) 0.0015 0.0014 0.0011 0.0013Elb/hr Particulate Rate (lb/hr) 7.76 7.52 5.83 7.04ET/yr Particulate Rate (Ton/yr) 34.0 32.9 25.5 30.8EFd Particulate Rate - Fd-based (lb/MMBtu) 0.0027 0.0026 0.0019 0.0024EFc Particulate Rate - Fc-based (lb/MMBtu) 0.0027 0.0025 0.0019 0.0024
Average includes 3 runs.
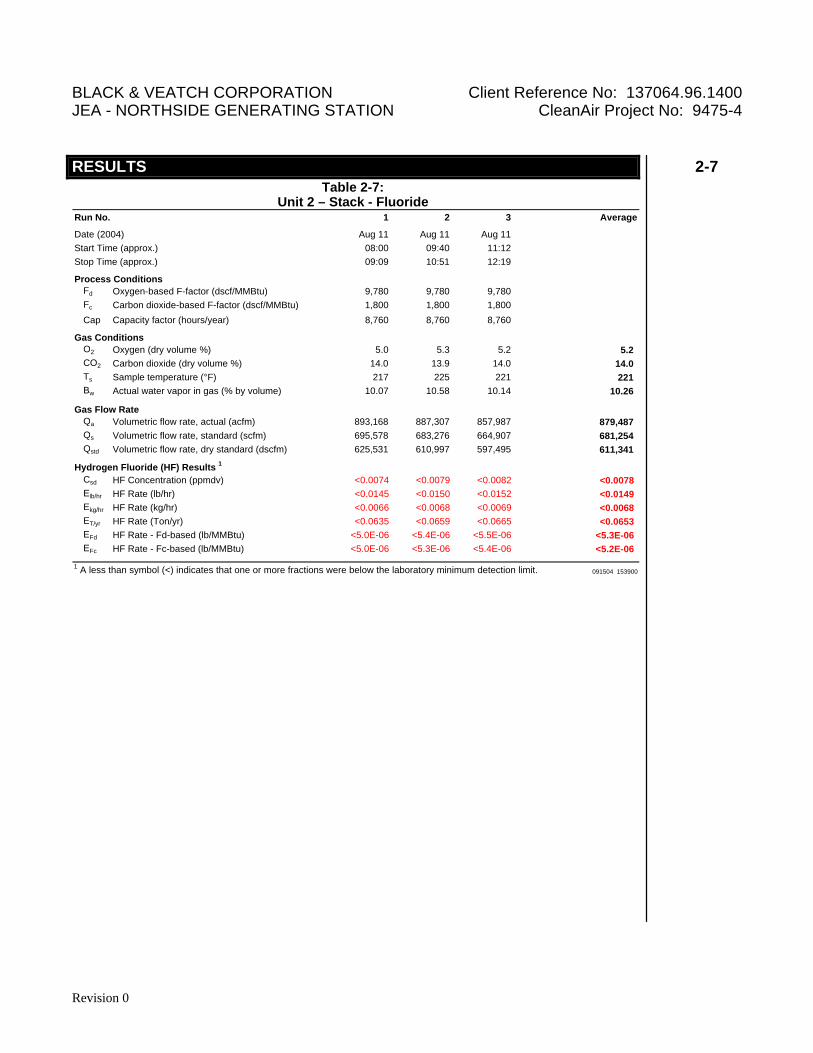
BLACK & VEATCH CORPORATION Client Reference No: 137064.96.1400 JEA - NORTHSIDE GENERATING STATION CleanAir Project No: 9475-4 RESULTS 2-7
Revision 0
Table 2-7: Unit 2 – Stack - Fluoride
Run No. 1 2 3 Average
Date (2004) Aug 11 Aug 11 Aug 11Start Time (approx.) 08:00 09:40 11:12Stop Time (approx.) 09:09 10:51 12:19
Process ConditionsFd Oxygen-based F-factor (dscf/MMBtu) 9,780 9,780 9,780Fc Carbon dioxide-based F-factor (dscf/MMBtu) 1,800 1,800 1,800
Cap Capacity factor (hours/year) 8,760 8,760 8,760
Gas ConditionsO2 Oxygen (dry volume %) 5.0 5.3 5.2 5.2CO2 Carbon dioxide (dry volume %) 14.0 13.9 14.0 14.0Ts Sample temperature (°F) 217 225 221 221Bw Actual water vapor in gas (% by volume) 10.07 10.58 10.14 10.26
Gas Flow RateQa Volumetric flow rate, actual (acfm) 893,168 887,307 857,987 879,487Qs Volumetric flow rate, standard (scfm) 695,578 683,276 664,907 681,254Qstd Volumetric flow rate, dry standard (dscfm) 625,531 610,997 597,495 611,341
Hydrogen Fluoride (HF) Results 1
Csd HF Concentration (ppmdv) <0.0074 <0.0079 <0.0082 <0.0078Elb/hr HF Rate (lb/hr) <0.0145 <0.0150 <0.0152 <0.0149Ekg/hr HF Rate (kg/hr) <0.0066 <0.0068 <0.0069 <0.0068ET/yr HF Rate (Ton/yr) <0.0635 <0.0659 <0.0665 <0.0653EFd HF Rate - Fd-based (lb/MMBtu) <5.0E-06 <5.4E-06 <5.5E-06 <5.3E-06EFc HF Rate - Fc-based (lb/MMBtu) <5.0E-06 <5.3E-06 <5.4E-06 <5.2E-06
1 A less than symbol (<) indicates that one or more fractions were below the laboratory minimum detection limit. 091504 153900
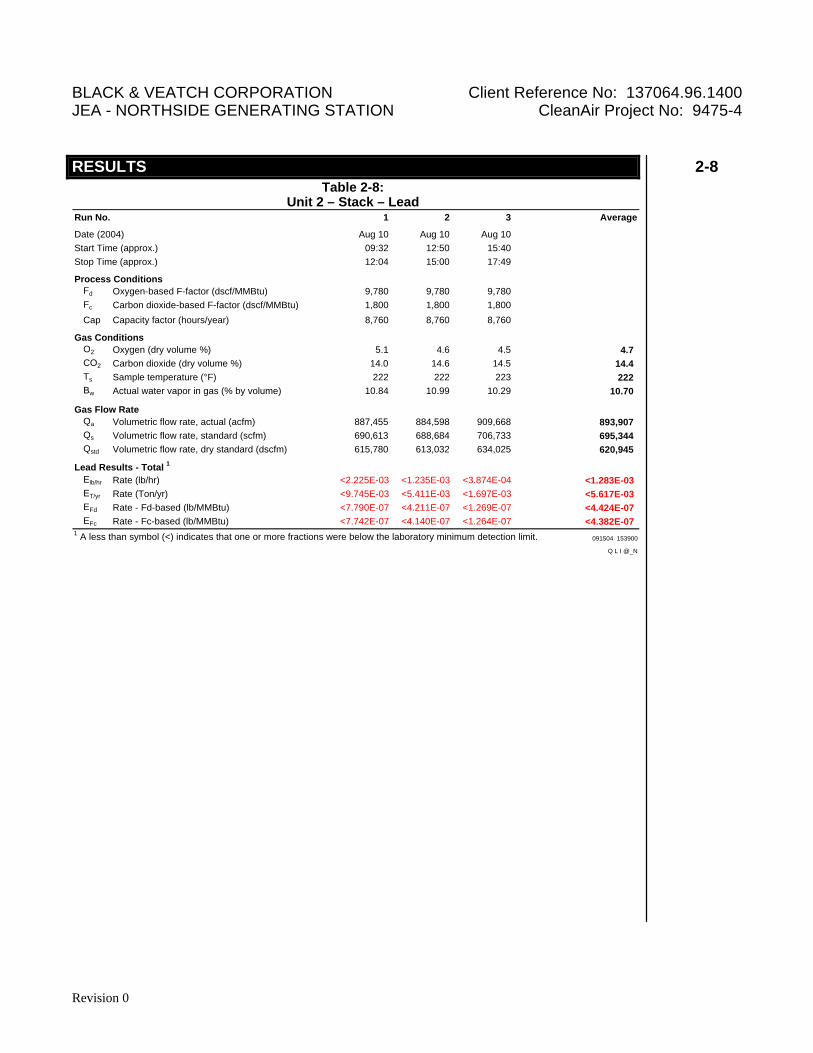
BLACK & VEATCH CORPORATION Client Reference No: 137064.96.1400 JEA - NORTHSIDE GENERATING STATION CleanAir Project No: 9475-4 RESULTS 2-8
Revision 0
Table 2-8: Unit 2 – Stack – Lead
Run No. 1 2 3 Average
Date (2004) Aug 10 Aug 10 Aug 10Start Time (approx.) 09:32 12:50 15:40Stop Time (approx.) 12:04 15:00 17:49
Process ConditionsFd Oxygen-based F-factor (dscf/MMBtu) 9,780 9,780 9,780Fc Carbon dioxide-based F-factor (dscf/MMBtu) 1,800 1,800 1,800
Cap Capacity factor (hours/year) 8,760 8,760 8,760
Gas ConditionsO2 Oxygen (dry volume %) 5.1 4.6 4.5 4.7CO2 Carbon dioxide (dry volume %) 14.0 14.6 14.5 14.4Ts Sample temperature (°F) 222 222 223 222Bw Actual water vapor in gas (% by volume) 10.84 10.99 10.29 10.70
Gas Flow RateQa Volumetric flow rate, actual (acfm) 887,455 884,598 909,668 893,907Qs Volumetric flow rate, standard (scfm) 690,613 688,684 706,733 695,344Qstd Volumetric flow rate, dry standard (dscfm) 615,780 613,032 634,025 620,945
Lead Results - Total 1
Elb/hr Rate (lb/hr) <2.225E-03 <1.235E-03 <3.874E-04 <1.283E-03ET/yr Rate (Ton/yr) <9.745E-03 <5.411E-03 <1.697E-03 <5.617E-03EFd Rate - Fd-based (lb/MMBtu) <7.790E-07 <4.211E-07 <1.269E-07 <4.424E-07EFc Rate - Fc-based (lb/MMBtu) <7.742E-07 <4.140E-07 <1.264E-07 <4.382E-07
1 A less than symbol (<) indicates that one or more fractions were below the laboratory minimum detection limit. 091504 153900
Q L I @_N

BLACK & VEATCH CORPORATION Client Reference No: 137064.96.1400 JEA - NORTHSIDE GENERATING STATION CleanAir Project No: 9475-4 RESULTS 2-9
Revision 0
Table 2-9: Unit 2 – Stack – Mercury (Ontario Hydro)
Run No. 2 3 4 6 Average
Date (2004) Aug 10 Aug 10 Aug 10 Aug 11Start Time (approx.) 11:40 14:42 17:34 14:46Stop Time (approx.) 14:10 16:53 20:05 16:56
Process ConditionsFd Oxygen-based F-factor (dscf/MMBtu) 9,780 9,780 9,780 9,780 Fc Carbon dioxide-based F-factor (dscf/MMBtu) 1,800 1,800 1,800 1,800 Cap Capacity factor (hours/year) 8,760 8,760 8,760 8,760
Gas ConditionsO2 Oxygen (dry volume %) 4.7000 4.6000 5.0000 4.6000 4.7250CO2 Carbon dioxide (dry volume %) 14.4000 14.6000 14.2000 14.4000 14.4000Ts Sample temperature (°F) 220.4583 221.7083 222.0833 220.7083 221.2396Bw Actual water vapor in gas (% by volume) 10.3893 9.9749 10.6272 10.2990 10.3226
Gas Flow RateQa Volumetric flow rate, actual (acfm) 895,569 884,328 882,007 868,644 882,637Qs Volumetric flow rate, standard (scfm) 698,378 688,347 686,163 672,297 686,296Qstd Volumetric flow rate, dry standard (dscfm) 625,821 619,685 613,243 603,058 615,452
Total Mercury ResultsElb/hr Rate (lb/hr) <4.628E-04 <2.168E-04 <8.703E-05 <1.050E-04 <2.179E-04ET/yr Rate (Ton/yr) <2.027E-03 <9.495E-04 <3.812E-04 <4.598E-04 <9.543E-04EFd Rate - Fd-based (lb/MMBtu) <1.555E-07 <7.311E-08 <3.041E-08 <3.638E-08 <7.385E-08EFc Rate - Fc-based (lb/MMBtu) <1.541E-07 <7.188E-08 <2.998E-08 <3.626E-08 <7.304E-08RE Removal Efficiency - Fd-based (lb/MMBtu) 94.8% 97.9% 98.8% 99.2% 98%
Particulate Bound Mercury ResultsElb/hr Rate (lb/hr) <2.152E-05 <3.172E-05 <2.176E-05 <4.199E-05 <2.925E-05ET/yr Rate (Ton/yr) <9.427E-05 <1.390E-04 <9.530E-05 <1.839E-04 <1.281E-04EFd Rate - Fd-based (lb/MMBtu) <7.232E-09 <1.070E-08 <7.602E-09 <1.455E-08 <1.002E-08EFc Rate - Fc-based (lb/MMBtu) <7.165E-09 <1.052E-08 <7.496E-09 <1.451E-08 <9.921E-09
Oxidized Mercury ResultsElb/hr Rate (lb/hr) 1.399E-04 1.163E-04 <4.352E-05 <4.199E-05 <8.543E-05ET/yr Rate (Ton/yr) 6.128E-04 5.095E-04 <1.906E-04 <1.839E-04 <3.742E-04EFd Rate - Fd-based (lb/MMBtu) 4.701E-08 3.923E-08 <1.520E-08 <1.455E-08 <2.900E-08EFc Rate - Fc-based (lb/MMBtu) 4.657E-08 3.857E-08 <1.499E-08 <1.451E-08 <2.866E-08
Elemental Mercury ResultsElb/hr Rate (lb/hr) 3.121E-04 8.460E-05 5.439E-05 6.298E-05 1.285E-04ET/yr Rate (Ton/yr) 1.367E-03 3.705E-04 2.382E-04 2.759E-04 5.629E-04EFd Rate - Fd-based (lb/MMBtu) 1.049E-07 2.853E-08 1.900E-08 2.183E-08 4.356E-08EFc Rate - Fc-based (lb/MMBtu) 1.039E-07 2.805E-08 1.874E-08 2.176E-08 4.311E-08
1 A less than symbol (<) indicates that one or more fractions were below the laboratory minimum detection limit. Runs 1 and 5 were voided due to SDA Inlet reference method sampling train problem.
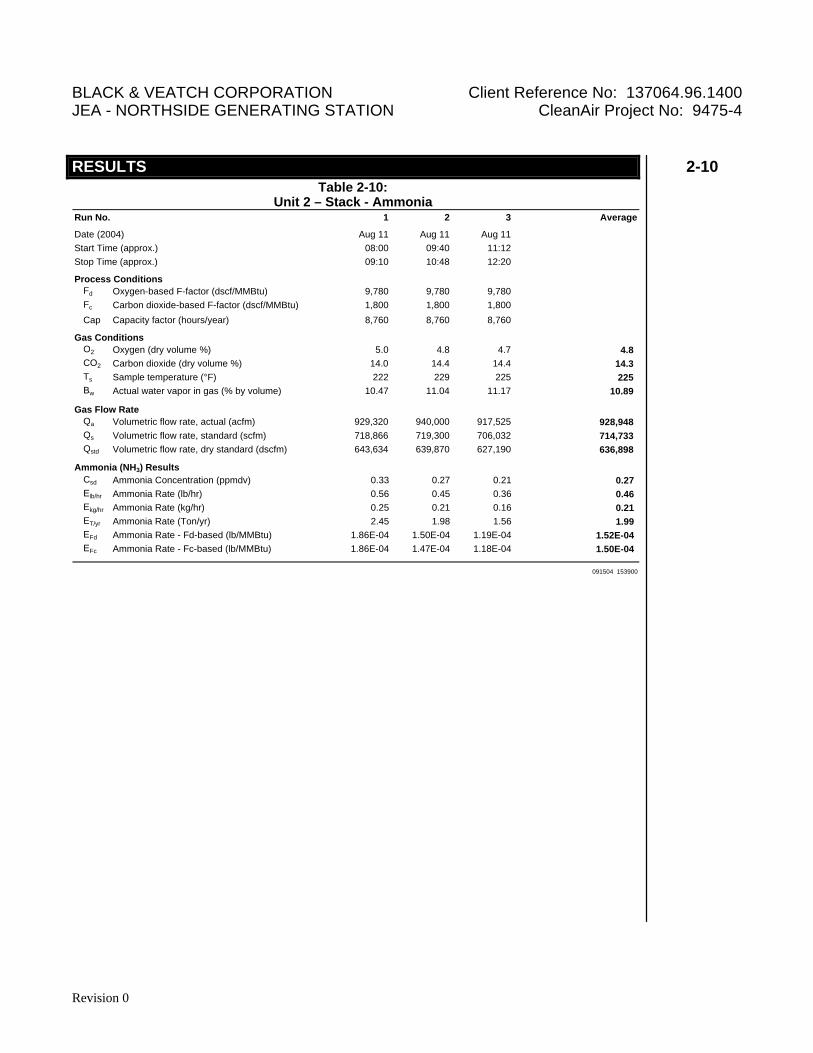
BLACK & VEATCH CORPORATION Client Reference No: 137064.96.1400 JEA - NORTHSIDE GENERATING STATION CleanAir Project No: 9475-4 RESULTS 2-10
Revision 0
Table 2-10: Unit 2 – Stack - Ammonia
Run No. 1 2 3 Average
Date (2004) Aug 11 Aug 11 Aug 11Start Time (approx.) 08:00 09:40 11:12Stop Time (approx.) 09:10 10:48 12:20
Process ConditionsFd Oxygen-based F-factor (dscf/MMBtu) 9,780 9,780 9,780Fc Carbon dioxide-based F-factor (dscf/MMBtu) 1,800 1,800 1,800
Cap Capacity factor (hours/year) 8,760 8,760 8,760
Gas ConditionsO2 Oxygen (dry volume %) 5.0 4.8 4.7 4.8CO2 Carbon dioxide (dry volume %) 14.0 14.4 14.4 14.3Ts Sample temperature (°F) 222 229 225 225Bw Actual water vapor in gas (% by volume) 10.47 11.04 11.17 10.89
Gas Flow RateQa Volumetric flow rate, actual (acfm) 929,320 940,000 917,525 928,948Qs Volumetric flow rate, standard (scfm) 718,866 719,300 706,032 714,733Qstd Volumetric flow rate, dry standard (dscfm) 643,634 639,870 627,190 636,898
Ammonia (NH3) ResultsCsd Ammonia Concentration (ppmdv) 0.33 0.27 0.21 0.27Elb/hr Ammonia Rate (lb/hr) 0.56 0.45 0.36 0.46Ekg/hr Ammonia Rate (kg/hr) 0.25 0.21 0.16 0.21ET/yr Ammonia Rate (Ton/yr) 2.45 1.98 1.56 1.99EFd Ammonia Rate - Fd-based (lb/MMBtu) 1.86E-04 1.50E-04 1.19E-04 1.52E-04EFc Ammonia Rate - Fc-based (lb/MMBtu) 1.86E-04 1.47E-04 1.18E-04 1.50E-04
091504 153900
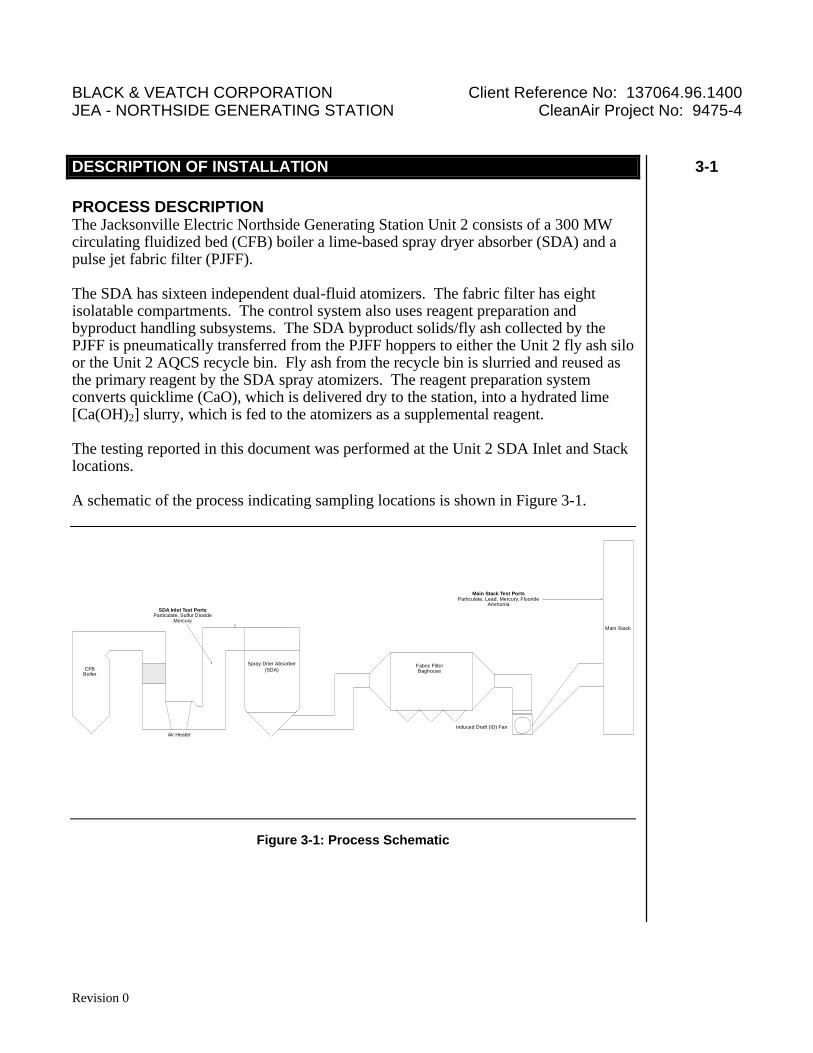
BLACK & VEATCH CORPORATION Client Reference No: 137064.96.1400 JEA - NORTHSIDE GENERATING STATION CleanAir Project No: 9475-4 DESCRIPTION OF INSTALLATION 3-1
Revision 0
PROCESS DESCRIPTION The Jacksonville Electric Northside Generating Station Unit 2 consists of a 300 MW circulating fluidized bed (CFB) boiler a lime-based spray dryer absorber (SDA) and a pulse jet fabric filter (PJFF). The SDA has sixteen independent dual-fluid atomizers. The fabric filter has eight isolatable compartments. The control system also uses reagent preparation and byproduct handling subsystems. The SDA byproduct solids/fly ash collected by the PJFF is pneumatically transferred from the PJFF hoppers to either the Unit 2 fly ash silo or the Unit 2 AQCS recycle bin. Fly ash from the recycle bin is slurried and reused as the primary reagent by the SDA spray atomizers. The reagent preparation system converts quicklime (CaO), which is delivered dry to the station, into a hydrated lime [Ca(OH)2] slurry, which is fed to the atomizers as a supplemental reagent. The testing reported in this document was performed at the Unit 2 SDA Inlet and Stack locations. A schematic of the process indicating sampling locations is shown in Figure 3-1.
CFBBoiler SNCR
Air Heater
Spray Drier Absorber(SDA)
SDA Inlet Test PortsParticulate, Sulfur Dioxide
Mercury
Fabric FilterBaghouse
Induced Draft (ID) Fan
Main Stack
Main Stack Test PortsParticulate, Lead, Mercury, Fluoride
Ammonia
Figure 3-1: Process Schematic
3 Description of Installation
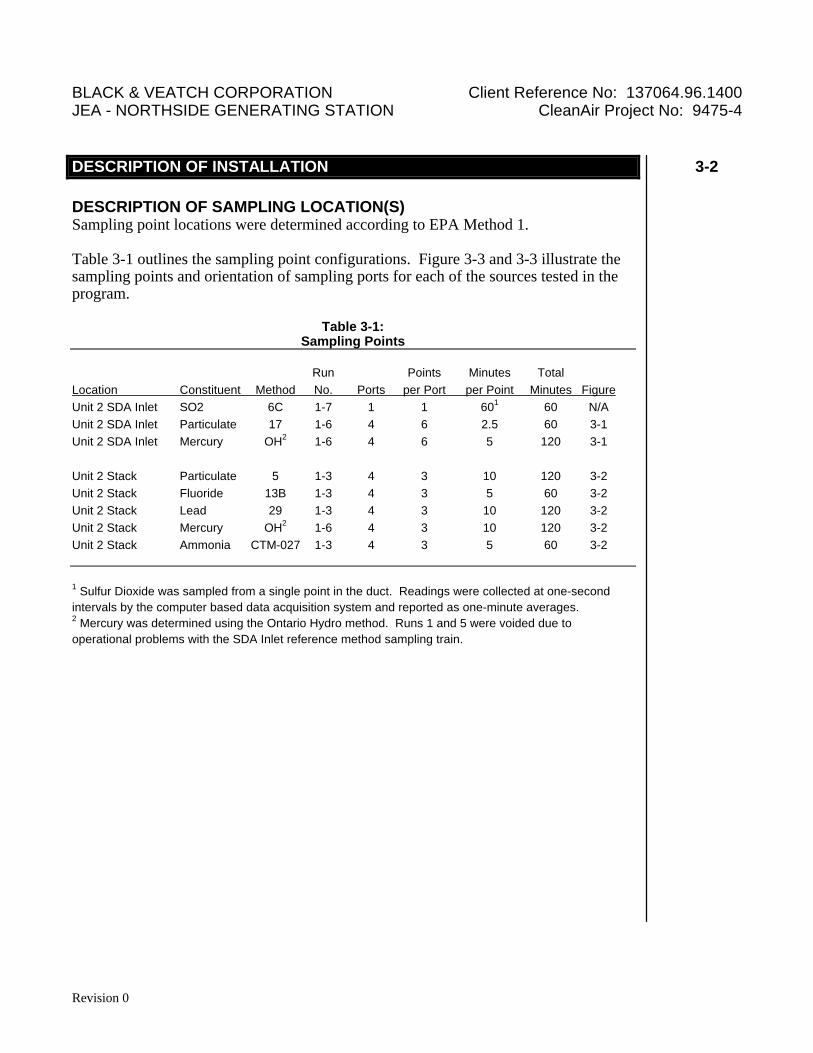
BLACK & VEATCH CORPORATION Client Reference No: 137064.96.1400 JEA - NORTHSIDE GENERATING STATION CleanAir Project No: 9475-4 DESCRIPTION OF INSTALLATION 3-2
Revision 0
DESCRIPTION OF SAMPLING LOCATION(S) Sampling point locations were determined according to EPA Method 1. Table 3-1 outlines the sampling point configurations. Figure 3-3 and 3-3 illustrate the sampling points and orientation of sampling ports for each of the sources tested in the program.
Table 3-1: Sampling Points
Run Points Minutes Total Location Constituent Method No. Ports per Port per Point Minutes Figure Unit 2 SDA Inlet SO2 6C 1-7 1 1 601 60 N/A Unit 2 SDA Inlet Particulate 17 1-6 4 6 2.5 60 3-1 Unit 2 SDA Inlet Mercury OH2 1-6 4 6 5 120 3-1 Unit 2 Stack Particulate 5 1-3 4 3 10 120 3-2 Unit 2 Stack Fluoride 13B 1-3 4 3 5 60 3-2 Unit 2 Stack Lead 29 1-3 4 3 10 120 3-2 Unit 2 Stack Mercury OH2 1-6 4 3 10 120 3-2 Unit 2 Stack Ammonia CTM-027 1-3 4 3 5 60 3-2 1 Sulfur Dioxide was sampled from a single point in the duct. Readings were collected at one-second intervals by the computer based data acquisition system and reported as one-minute averages. 2 Mercury was determined using the Ontario Hydro method. Runs 1 and 5 were voided due to operational problems with the SDA Inlet reference method sampling train.
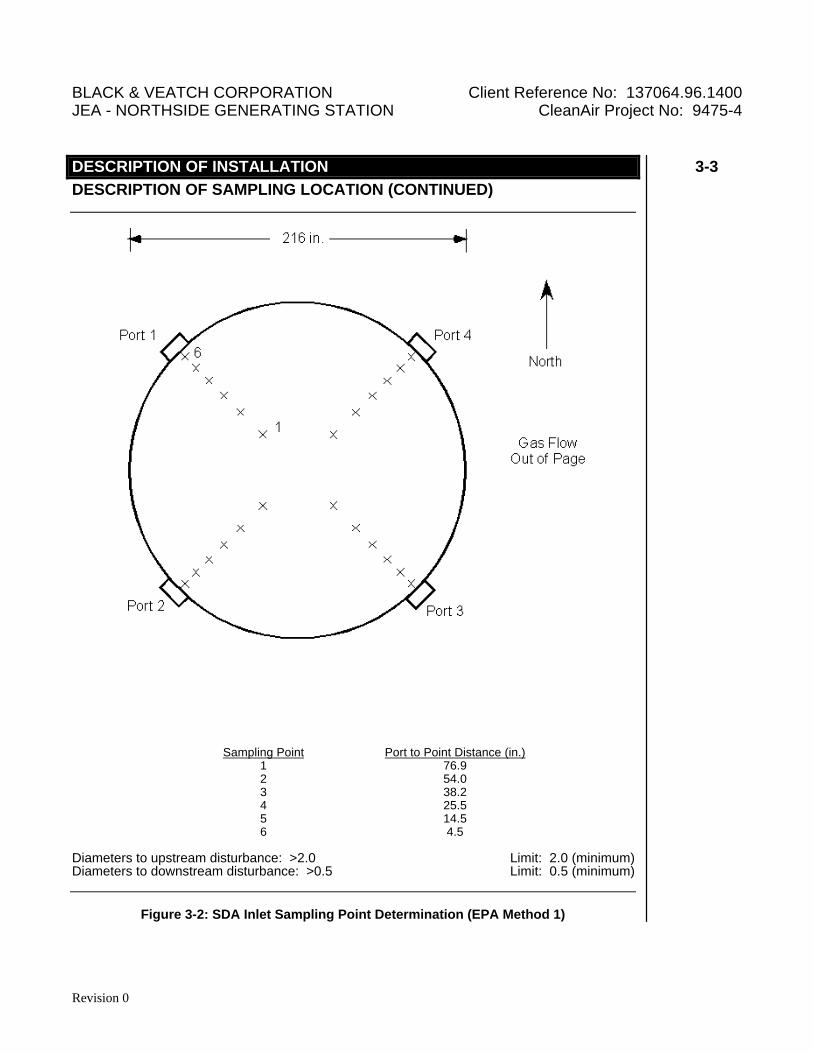
BLACK & VEATCH CORPORATION Client Reference No: 137064.96.1400 JEA - NORTHSIDE GENERATING STATION CleanAir Project No: 9475-4 DESCRIPTION OF INSTALLATION 3-3
Revision 0
DESCRIPTION OF SAMPLING LOCATION (CONTINUED)
Sampling Point Port to Point Distance (in.) 1 76.9 2 54.0 3 38.2 4 25.5 5 14.5 6 4.5 Diameters to upstream disturbance: >2.0 Limit: 2.0 (minimum) Diameters to downstream disturbance: >0.5 Limit: 0.5 (minimum)
Figure 3-2: SDA Inlet Sampling Point Determination (EPA Method 1)
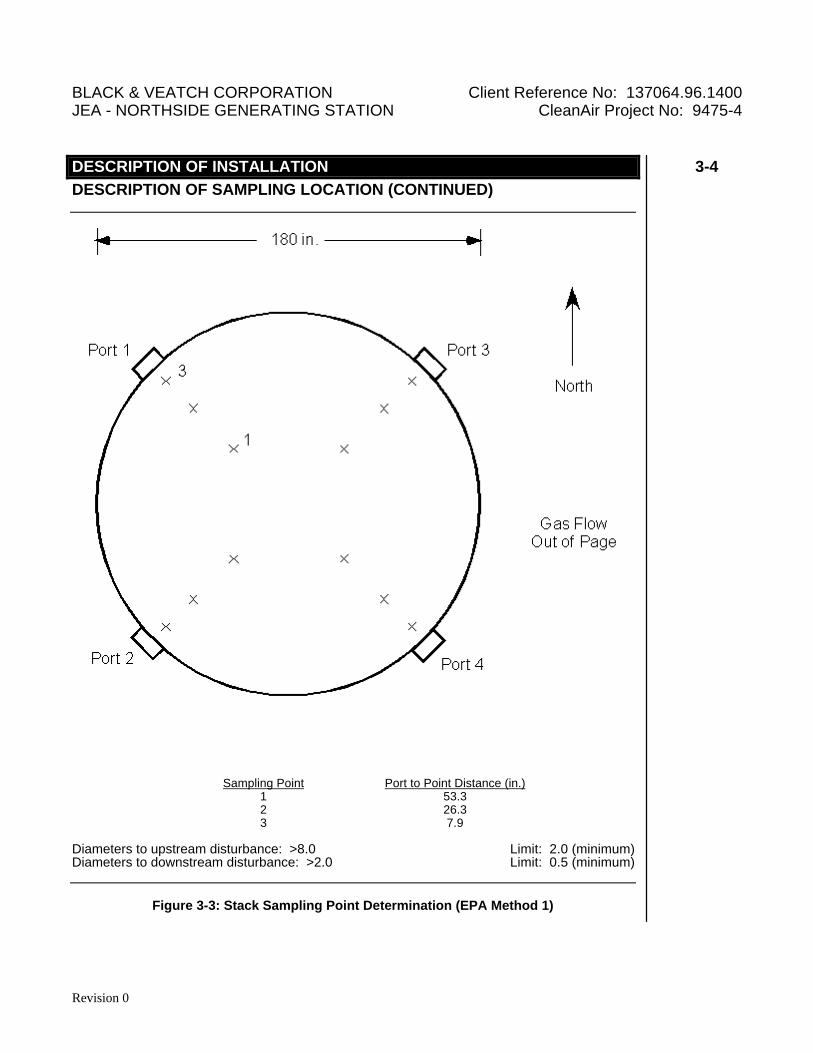
BLACK & VEATCH CORPORATION Client Reference No: 137064.96.1400 JEA - NORTHSIDE GENERATING STATION CleanAir Project No: 9475-4 DESCRIPTION OF INSTALLATION 3-4
Revision 0
DESCRIPTION OF SAMPLING LOCATION (CONTINUED)
Sampling Point Port to Point Distance (in.) 1 53.3 2 26.3 3 7.9 Diameters to upstream disturbance: >8.0 Limit: 2.0 (minimum) Diameters to downstream disturbance: >2.0 Limit: 0.5 (minimum)
Figure 3-3: Stack Sampling Point Determination (EPA Method 1)
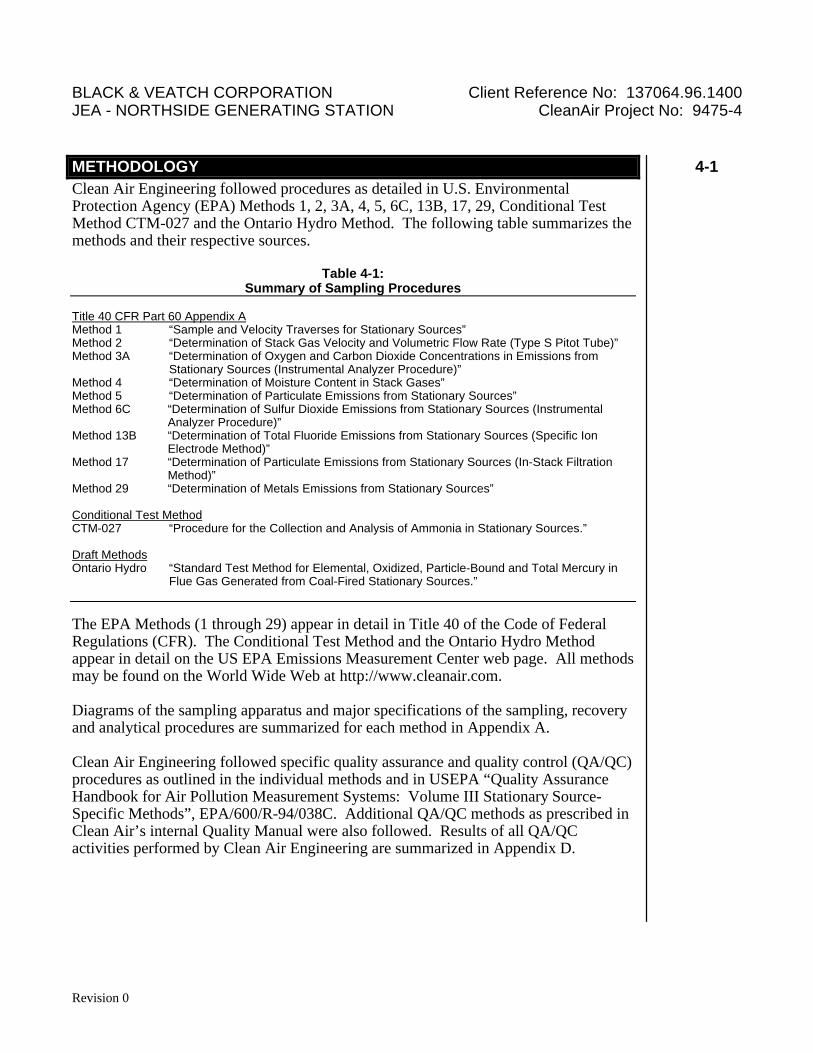
BLACK & VEATCH CORPORATION Client Reference No: 137064.96.1400 JEA - NORTHSIDE GENERATING STATION CleanAir Project No: 9475-4 METHODOLOGY 4-1
Revision 0
Clean Air Engineering followed procedures as detailed in U.S. Environmental Protection Agency (EPA) Methods 1, 2, 3A, 4, 5, 6C, 13B, 17, 29, Conditional Test Method CTM-027 and the Ontario Hydro Method. The following table summarizes the methods and their respective sources.
Table 4-1: Summary of Sampling Procedures
Title 40 CFR Part 60 Appendix A Method 1 “Sample and Velocity Traverses for Stationary Sources” Method 2 “Determination of Stack Gas Velocity and Volumetric Flow Rate (Type S Pitot Tube)” Method 3A “Determination of Oxygen and Carbon Dioxide Concentrations in Emissions from
Stationary Sources (Instrumental Analyzer Procedure)” Method 4 “Determination of Moisture Content in Stack Gases” Method 5 “Determination of Particulate Emissions from Stationary Sources” Method 6C “Determination of Sulfur Dioxide Emissions from Stationary Sources (Instrumental
Analyzer Procedure)” Method 13B “Determination of Total Fluoride Emissions from Stationary Sources (Specific Ion
Electrode Method)” Method 17 “Determination of Particulate Emissions from Stationary Sources (In-Stack Filtration
Method)” Method 29 “Determination of Metals Emissions from Stationary Sources” Conditional Test Method CTM-027 “Procedure for the Collection and Analysis of Ammonia in Stationary Sources.” Draft Methods Ontario Hydro “Standard Test Method for Elemental, Oxidized, Particle-Bound and Total Mercury in
Flue Gas Generated from Coal-Fired Stationary Sources.” The EPA Methods (1 through 29) appear in detail in Title 40 of the Code of Federal Regulations (CFR). The Conditional Test Method and the Ontario Hydro Method appear in detail on the US EPA Emissions Measurement Center web page. All methods may be found on the World Wide Web at http://www.cleanair.com. Diagrams of the sampling apparatus and major specifications of the sampling, recovery and analytical procedures are summarized for each method in Appendix A. Clean Air Engineering followed specific quality assurance and quality control (QA/QC) procedures as outlined in the individual methods and in USEPA “Quality Assurance Handbook for Air Pollution Measurement Systems: Volume III Stationary Source-Specific Methods”, EPA/600/R-94/038C. Additional QA/QC methods as prescribed in Clean Air’s internal Quality Manual were also followed. Results of all QA/QC activities performed by Clean Air Engineering are summarized in Appendix D.
4 Methodology
BLACK & VEATCH CORPORATION Client Reference No: 137064.96.1400 JEA - NORTHSIDE GENERATING STATION CleanAir Project No: 9475-4 APPENDIX
Revision 0
TEST METHOD SPECIFICATIONS.................................................................................... A SAMPLE CALCULATIONS.................................................................................................. B PARAMETERS.................................................................................................................... C QA/QC DATA....................................................................................................................... D FIELD DATA........................................................................................................................ E FIELD DATA PRINTOUTS...................................................................................................F LABORATORY DATA..........................................................................................................G FACILITY OPERATING DATA............................................................................................ H
5 Appendix
JEA Large-Scale CFB Combustion Demonstration Project
Fuel Capability Demonstration Test Report #4 - ATTACHMENTS 80 / 20 Blend Petroleum Coke and Pittsburgh 8 Coal Fuel
B&V Project 137064
ATTACHMENT D
PI Data Summary
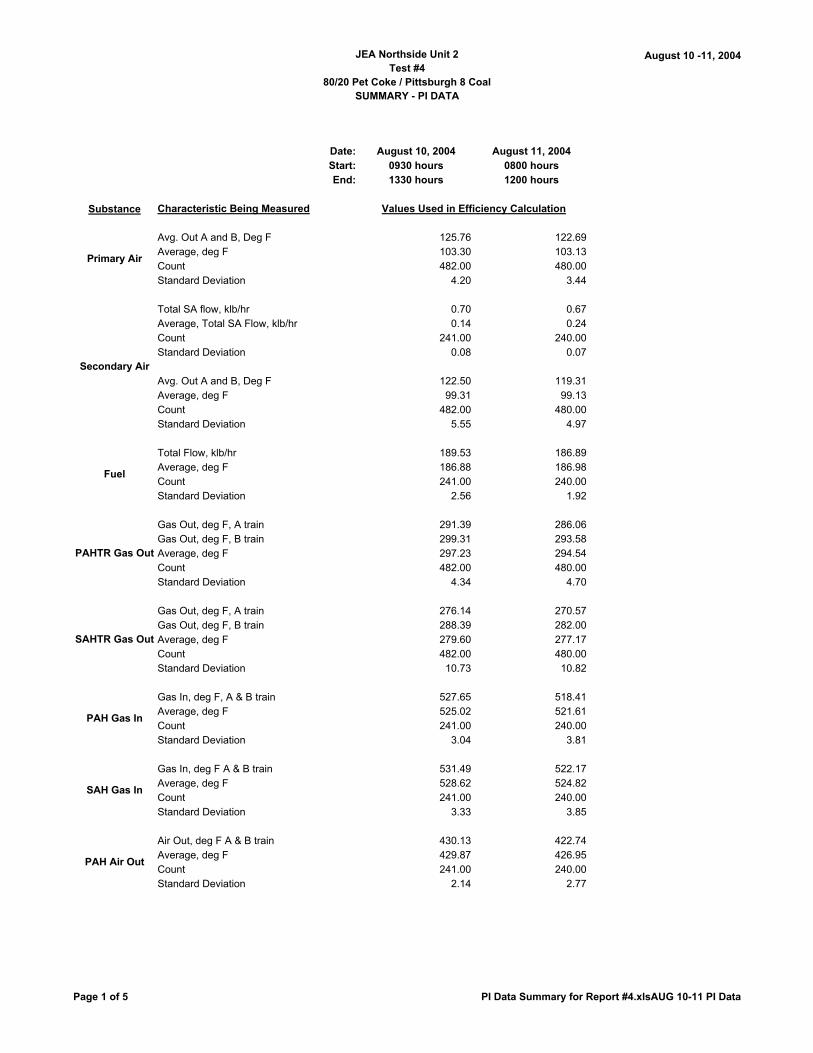
JEA Northside Unit 2Test #4
80/20 Pet Coke / Pittsburgh 8 CoalSUMMARY - PI DATA
August 10 -11, 2004
Date: August 10, 2004 August 11, 2004Start: 0930 hours 0800 hoursEnd: 1330 hours 1200 hours
Substance Characteristic Being Measured
Avg. Out A and B, Deg F 125.76 122.69Average, deg F 103.30 103.13Count 482.00 480.00Standard Deviation 4.20 3.44
Total SA flow, klb/hr 0.70 0.67Average, Total SA Flow, klb/hr 0.14 0.24Count 241.00 240.00Standard Deviation 0.08 0.07
Avg. Out A and B, Deg F 122.50 119.31Average, deg F 99.31 99.13Count 482.00 480.00Standard Deviation 5.55 4.97
Total Flow, klb/hr 189.53 186.89Average, deg F 186.88 186.98Count 241.00 240.00Standard Deviation 2.56 1.92
Gas Out, deg F, A train 291.39 286.06Gas Out, deg F, B train 299.31 293.58Average, deg F 297.23 294.54Count 482.00 480.00Standard Deviation 4.34 4.70
Gas Out, deg F, A train 276.14 270.57Gas Out, deg F, B train 288.39 282.00Average, deg F 279.60 277.17Count 482.00 480.00Standard Deviation 10.73 10.82
Gas In, deg F, A & B train 527.65 518.41Average, deg F 525.02 521.61Count 241.00 240.00Standard Deviation 3.04 3.81
Gas In, deg F A & B train 531.49 522.17Average, deg F 528.62 524.82Count 241.00 240.00Standard Deviation 3.33 3.85
Air Out, deg F A & B train 430.13 422.74Average, deg F 429.87 426.95Count 241.00 240.00Standard Deviation 2.14 2.77
Values Used in Efficiency Calculation
Primary Air
Secondary Air
Fuel
PAHTR Gas Out
SAHTR Gas Out
PAH Gas In
SAH Gas In
PAH Air Out
Page 1 of 5 PI Data Summary for Report #4.xlsAUG 10-11 PI Data
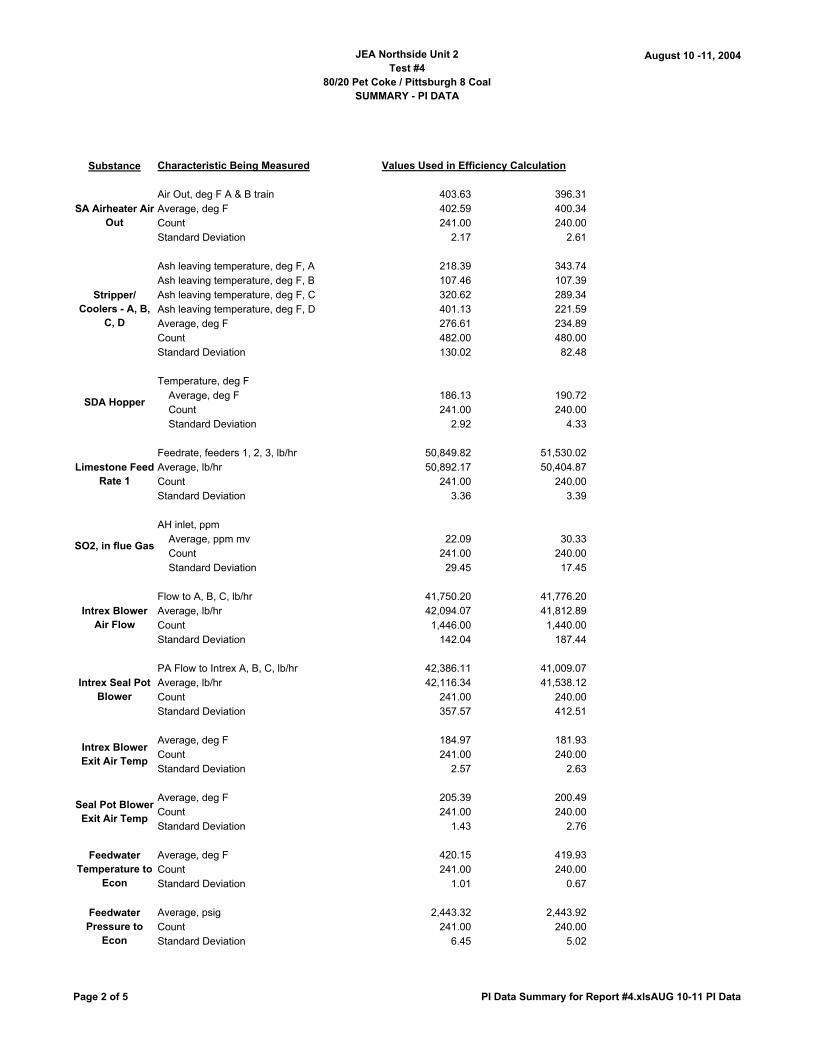
JEA Northside Unit 2Test #4
80/20 Pet Coke / Pittsburgh 8 CoalSUMMARY - PI DATA
August 10 -11, 2004
Substance Characteristic Being Measured Values Used in Efficiency Calculation
Air Out, deg F A & B train 403.63 396.31Average, deg F 402.59 400.34Count 241.00 240.00Standard Deviation 2.17 2.61
Ash leaving temperature, deg F, A 218.39 343.74Ash leaving temperature, deg F, B 107.46 107.39Ash leaving temperature, deg F, C 320.62 289.34Ash leaving temperature, deg F, D 401.13 221.59Average, deg F 276.61 234.89Count 482.00 480.00Standard Deviation 130.02 82.48
Temperature, deg FAverage, deg F 186.13 190.72Count 241.00 240.00Standard Deviation 2.92 4.33
Feedrate, feeders 1, 2, 3, lb/hr 50,849.82 51,530.02Average, lb/hr 50,892.17 50,404.87Count 241.00 240.00Standard Deviation 3.36 3.39
AH inlet, ppmAverage, ppm mv 22.09 30.33Count 241.00 240.00Standard Deviation 29.45 17.45
Flow to A, B, C, lb/hr 41,750.20 41,776.20Average, lb/hr 42,094.07 41,812.89Count 1,446.00 1,440.00Standard Deviation 142.04 187.44
PA Flow to Intrex A, B, C, lb/hr 42,386.11 41,009.07Average, lb/hr 42,116.34 41,538.12Count 241.00 240.00Standard Deviation 357.57 412.51
Average, deg F 184.97 181.93Count 241.00 240.00Standard Deviation 2.57 2.63
Average, deg F 205.39 200.49Count 241.00 240.00Standard Deviation 1.43 2.76
Average, deg F 420.15 419.93Count 241.00 240.00Standard Deviation 1.01 0.67
Average, psig 2,443.32 2,443.92Count 241.00 240.00Standard Deviation 6.45 5.02
SA Airheater Air Out
Stripper/ Coolers - A, B,
C, D
SDA Hopper
Limestone Feed Rate 1
SO2, in flue Gas
Intrex Blower Air Flow
Intrex Seal Pot Blower
Intrex Blower Exit Air Temp
Seal Pot Blower Exit Air Temp
Feedwater Temperature to
Econ
Feedwater Pressure to
Econ
Page 2 of 5 PI Data Summary for Report #4.xlsAUG 10-11 PI Data
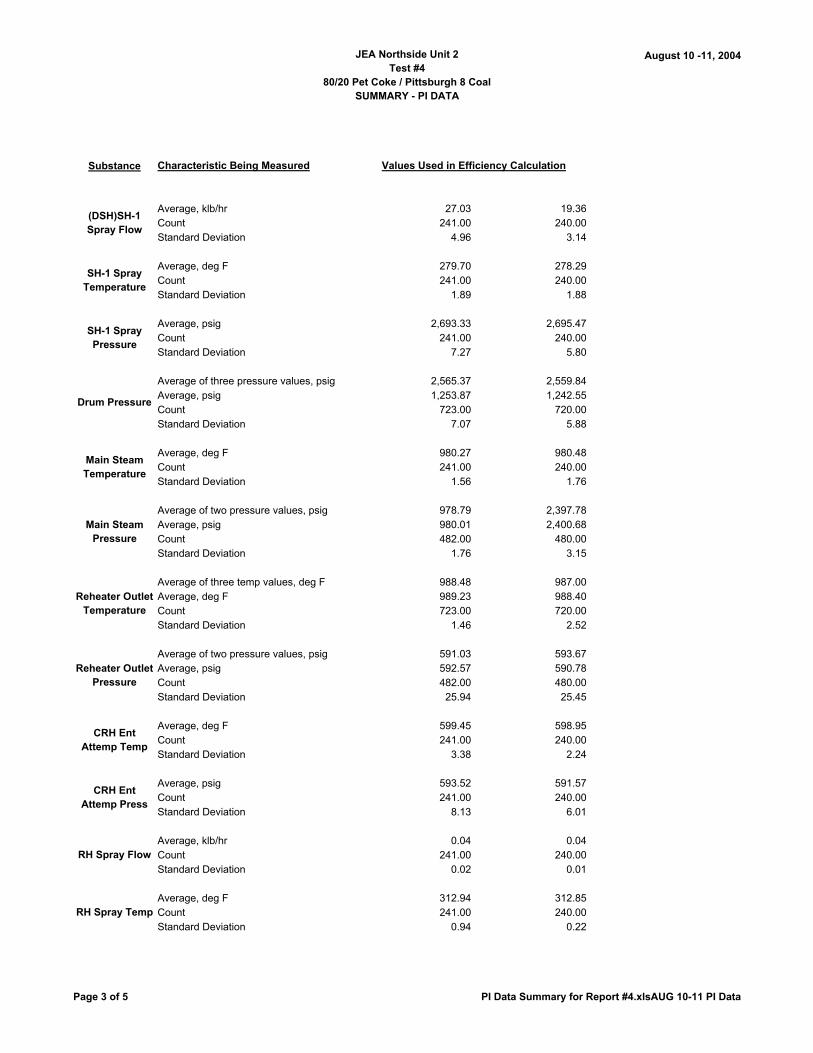
JEA Northside Unit 2Test #4
80/20 Pet Coke / Pittsburgh 8 CoalSUMMARY - PI DATA
August 10 -11, 2004
Substance Characteristic Being Measured Values Used in Efficiency Calculation
Average, klb/hr 27.03 19.36Count 241.00 240.00Standard Deviation 4.96 3.14
Average, deg F 279.70 278.29Count 241.00 240.00Standard Deviation 1.89 1.88
Average, psig 2,693.33 2,695.47Count 241.00 240.00Standard Deviation 7.27 5.80
Average of three pressure values, psig 2,565.37 2,559.84Average, psig 1,253.87 1,242.55Count 723.00 720.00Standard Deviation 7.07 5.88
Average, deg F 980.27 980.48Count 241.00 240.00Standard Deviation 1.56 1.76
Average of two pressure values, psig 978.79 2,397.78Average, psig 980.01 2,400.68Count 482.00 480.00Standard Deviation 1.76 3.15
Average of three temp values, deg F 988.48 987.00Average, deg F 989.23 988.40Count 723.00 720.00Standard Deviation 1.46 2.52
Average of two pressure values, psig 591.03 593.67Average, psig 592.57 590.78Count 482.00 480.00Standard Deviation 25.94 25.45
Average, deg F 599.45 598.95Count 241.00 240.00Standard Deviation 3.38 2.24
Average, psig 593.52 591.57Count 241.00 240.00Standard Deviation 8.13 6.01
Average, klb/hr 0.04 0.04Count 241.00 240.00Standard Deviation 0.02 0.01
Average, deg F 312.94 312.85Count 241.00 240.00Standard Deviation 0.94 0.22
(DSH)SH-1 Spray Flow
SH-1 Spray Temperature
SH-1 Spray Pressure
Drum Pressure
Main Steam Temperature
Main Steam Pressure
Reheater Outlet Temperature
Reheater Outlet Pressure
CRH Ent Attemp Temp
CRH Ent Attemp Press
RH Spray Flow
RH Spray Temp
Page 3 of 5 PI Data Summary for Report #4.xlsAUG 10-11 PI Data
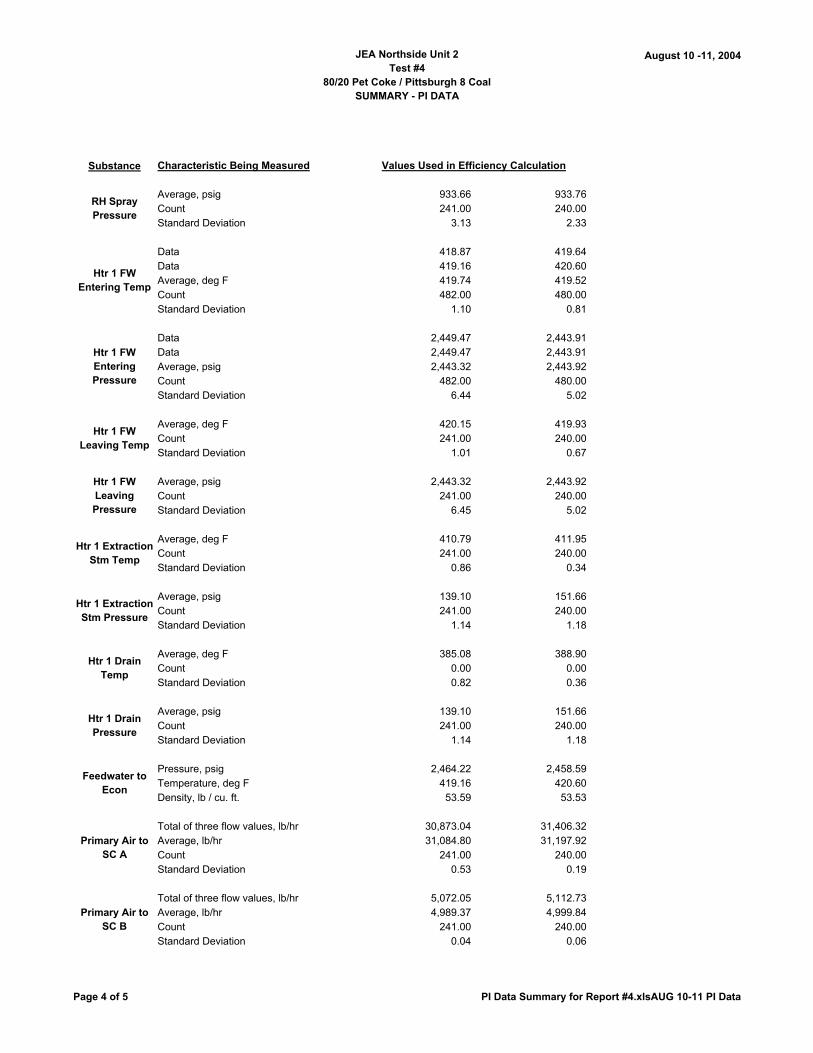
JEA Northside Unit 2Test #4
80/20 Pet Coke / Pittsburgh 8 CoalSUMMARY - PI DATA
August 10 -11, 2004
Substance Characteristic Being Measured Values Used in Efficiency Calculation
Average, psig 933.66 933.76Count 241.00 240.00Standard Deviation 3.13 2.33
Data 418.87 419.64Data 419.16 420.60Average, deg F 419.74 419.52Count 482.00 480.00Standard Deviation 1.10 0.81
Data 2,449.47 2,443.91Data 2,449.47 2,443.91Average, psig 2,443.32 2,443.92Count 482.00 480.00Standard Deviation 6.44 5.02
Average, deg F 420.15 419.93Count 241.00 240.00Standard Deviation 1.01 0.67
Average, psig 2,443.32 2,443.92Count 241.00 240.00Standard Deviation 6.45 5.02
Average, deg F 410.79 411.95Count 241.00 240.00Standard Deviation 0.86 0.34
Average, psig 139.10 151.66Count 241.00 240.00Standard Deviation 1.14 1.18
Average, deg F 385.08 388.90Count 0.00 0.00Standard Deviation 0.82 0.36
Average, psig 139.10 151.66Count 241.00 240.00Standard Deviation 1.14 1.18
Pressure, psig 2,464.22 2,458.59Temperature, deg F 419.16 420.60Density, lb / cu. ft. 53.59 53.53
Total of three flow values, lb/hr 30,873.04 31,406.32Average, lb/hr 31,084.80 31,197.92Count 241.00 240.00Standard Deviation 0.53 0.19
Total of three flow values, lb/hr 5,072.05 5,112.73Average, lb/hr 4,989.37 4,999.84Count 241.00 240.00Standard Deviation 0.04 0.06
RH Spray Pressure
Htr 1 FW Entering Temp
Htr 1 FW Entering Pressure
Htr 1 FW Leaving Temp
Htr 1 FW Leaving Pressure
Htr 1 Extraction Stm Temp
Htr 1 Extraction Stm Pressure
Htr 1 Drain Temp
Htr 1 Drain Pressure
Feedwater to Econ
Primary Air to SC A
Primary Air to SC B
Page 4 of 5 PI Data Summary for Report #4.xlsAUG 10-11 PI Data
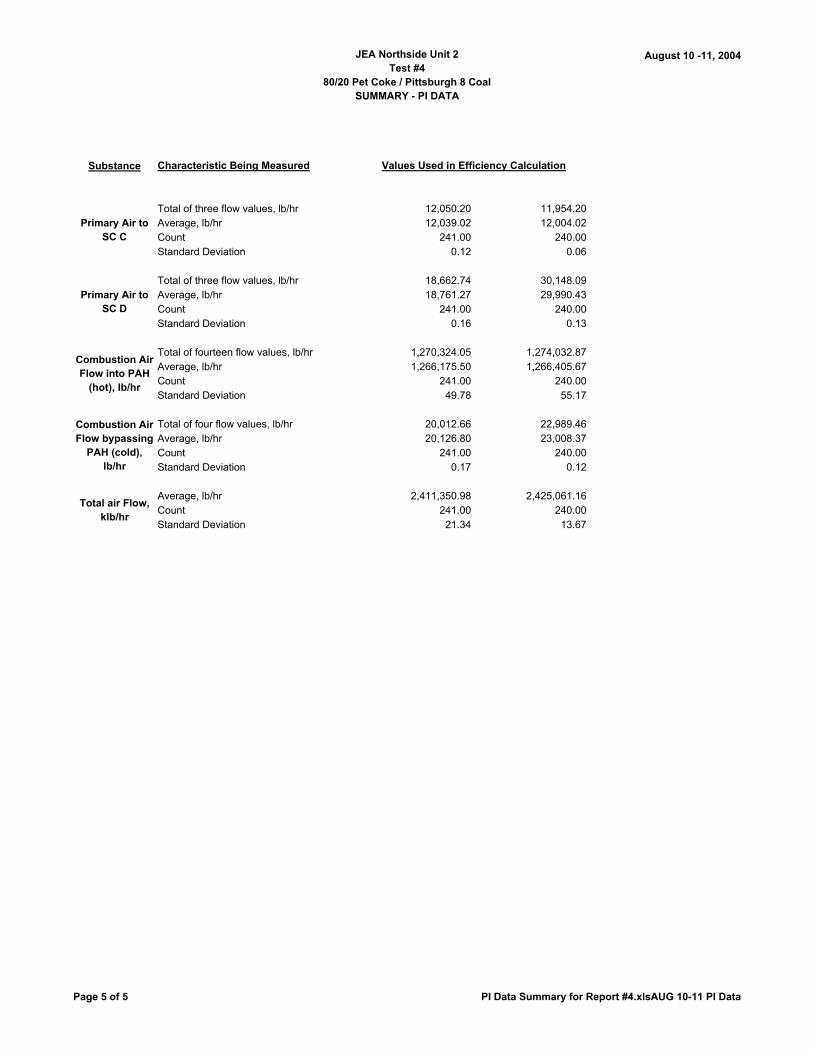
JEA Northside Unit 2Test #4
80/20 Pet Coke / Pittsburgh 8 CoalSUMMARY - PI DATA
August 10 -11, 2004
Substance Characteristic Being Measured Values Used in Efficiency Calculation
Total of three flow values, lb/hr 12,050.20 11,954.20Average, lb/hr 12,039.02 12,004.02Count 241.00 240.00Standard Deviation 0.12 0.06
Total of three flow values, lb/hr 18,662.74 30,148.09Average, lb/hr 18,761.27 29,990.43Count 241.00 240.00Standard Deviation 0.16 0.13
Total of fourteen flow values, lb/hr 1,270,324.05 1,274,032.87Average, lb/hr 1,266,175.50 1,266,405.67Count 241.00 240.00Standard Deviation 49.78 55.17
Total of four flow values, lb/hr 20,012.66 22,989.46Average, lb/hr 20,126.80 23,008.37Count 241.00 240.00Standard Deviation 0.17 0.12
Average, lb/hr 2,411,350.98 2,425,061.16Count 241.00 240.00Standard Deviation 21.34 13.67
Combustion Air Flow bypassing
PAH (cold), lb/hr
Total air Flow, klb/hr
Combustion Air Flow into PAH
(hot), lb/hr
Primary Air to SC D
Primary Air to SC C
Page 5 of 5 PI Data Summary for Report #4.xlsAUG 10-11 PI Data

JEA Large-Scale CFB Combustion Demonstration Project
Fuel Capability Demonstration Test Report #4 - ATTACHMENTS 80 / 20 Blend Petroleum Coke and Pittsburgh 8 Coal Fuel
B&V Project 137064
ATTACHMENT E
Abbreviation List - Refer to Section 1.2

JEA Large-Scale CFB Combustion Demonstration Project
Fuel Capability Demonstration Test Report #4 - ATTACHMENTS 80 / 20 Blend Petroleum Coke and Pittsburgh 8 Coal Fuel
B&V Project 137064
ATTACHMENT F
Isolation Valve List
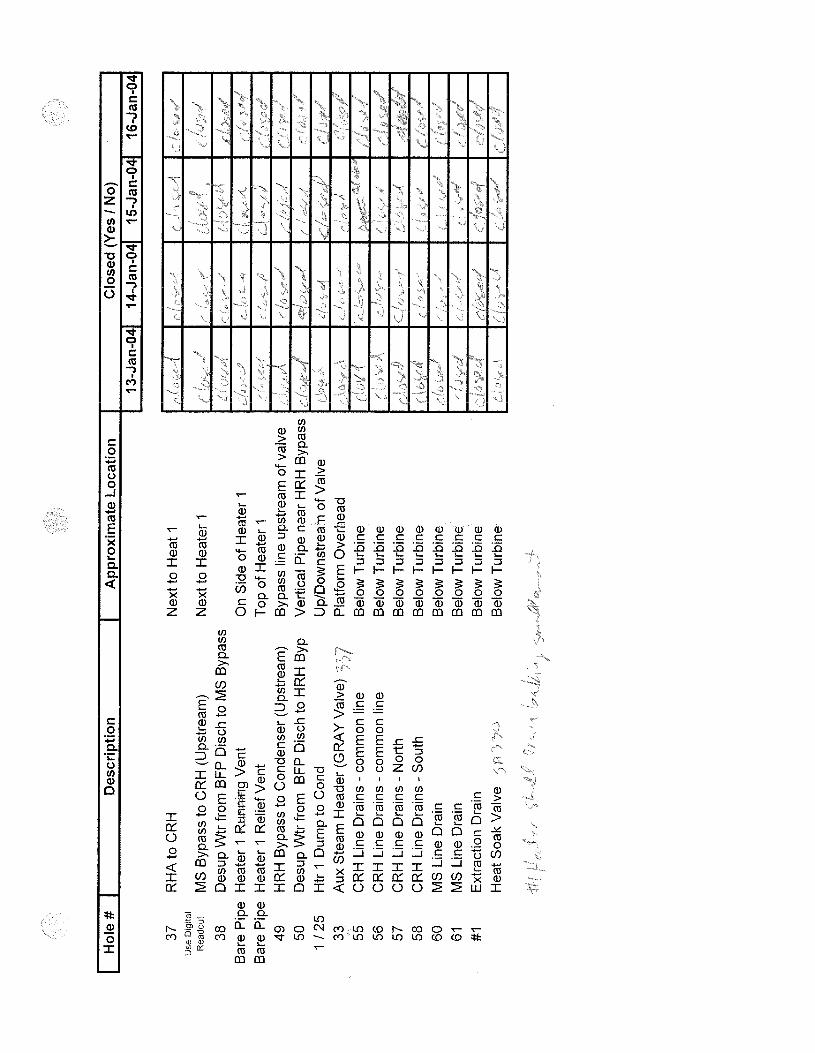
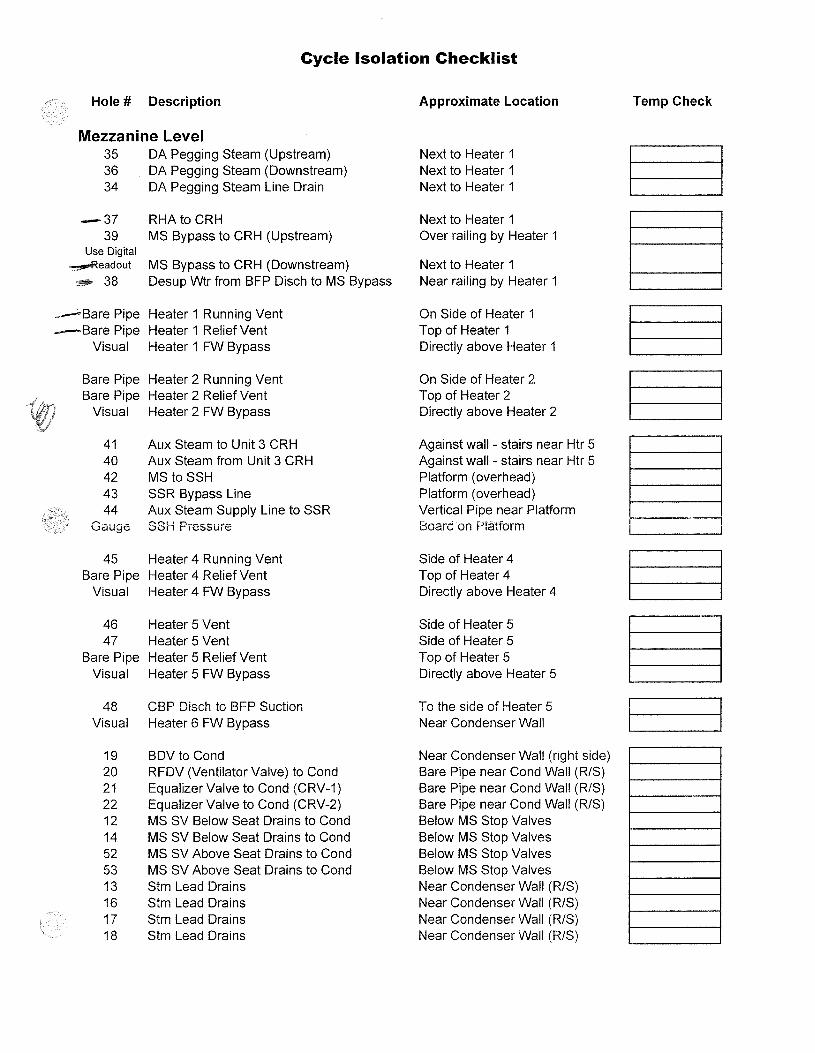
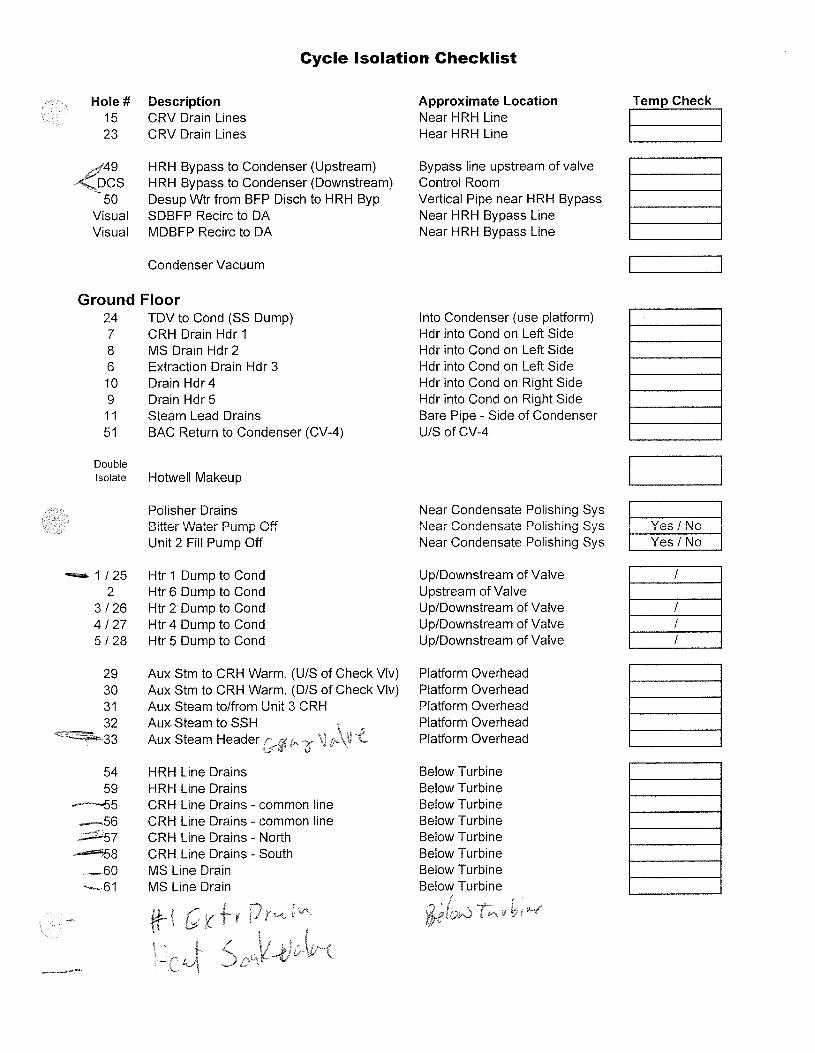
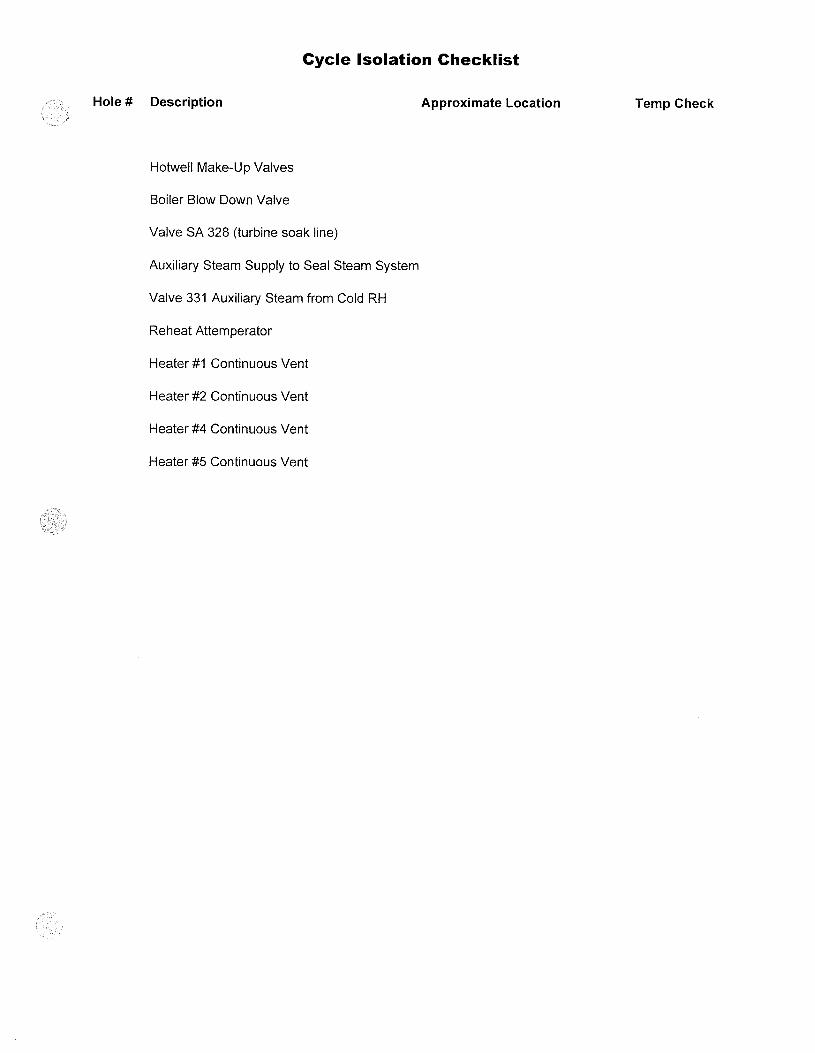
JEA Large-Scale CFB Combustion Demonstration Project
Fuel Capability Demonstration Test Report #4 - ATTACHMENTS 80 / 20 Blend Petroleum Coke and Pittsburgh 8 Coal Fuel
B&V Project 137064
ATTACHMENT G
Fuel Analyses - 80/20 Blend Pet Coke and Pittsburgh 8 Coal
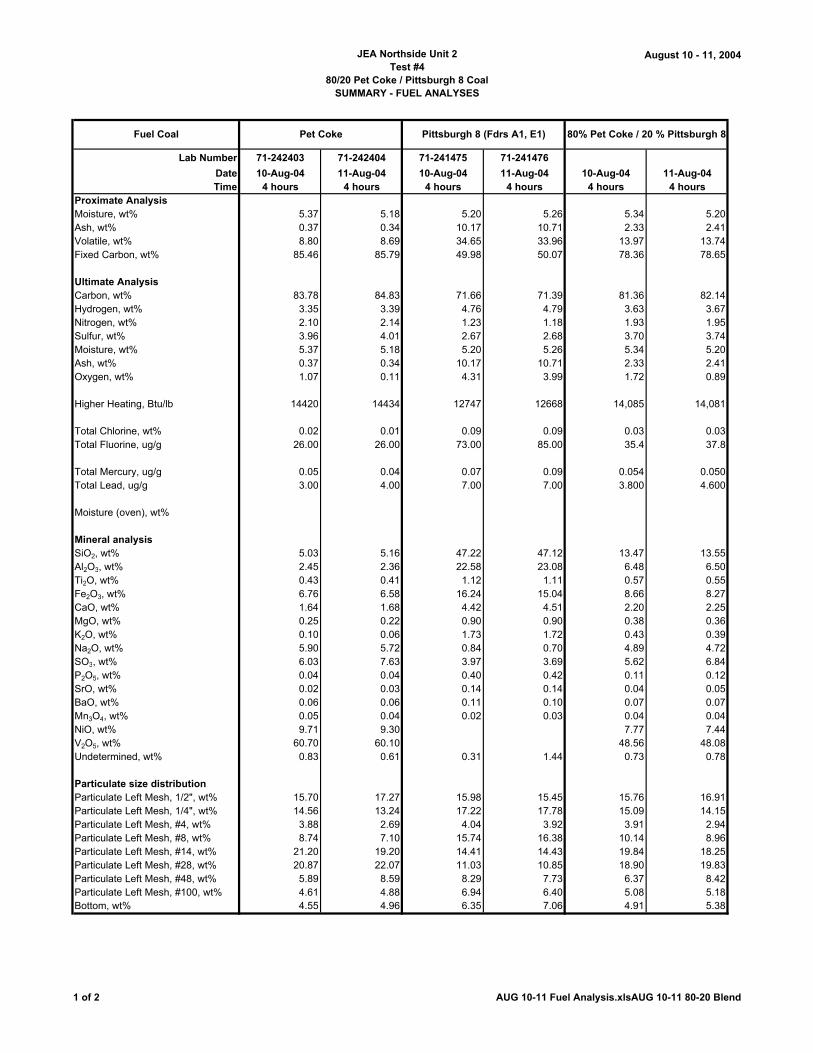
JEA Northside Unit 2Test #4
80/20 Pet Coke / Pittsburgh 8 CoalSUMMARY - FUEL ANALYSES
August 10 - 11, 2004
Lab Number 71-242403 71-242404 71-241475 71-241476
Date 10-Aug-04 11-Aug-04 10-Aug-04 11-Aug-04 10-Aug-04 11-Aug-04Time 4 hours 4 hours 4 hours 4 hours 4 hours 4 hours
Proximate AnalysisMoisture, wt% 5.37 5.18 5.20 5.26 5.34 5.20Ash, wt% 0.37 0.34 10.17 10.71 2.33 2.41Volatile, wt% 8.80 8.69 34.65 33.96 13.97 13.74Fixed Carbon, wt% 85.46 85.79 49.98 50.07 78.36 78.65
Ultimate AnalysisCarbon, wt% 83.78 84.83 71.66 71.39 81.36 82.14Hydrogen, wt% 3.35 3.39 4.76 4.79 3.63 3.67Nitrogen, wt% 2.10 2.14 1.23 1.18 1.93 1.95Sulfur, wt% 3.96 4.01 2.67 2.68 3.70 3.74Moisture, wt% 5.37 5.18 5.20 5.26 5.34 5.20Ash, wt% 0.37 0.34 10.17 10.71 2.33 2.41Oxygen, wt% 1.07 0.11 4.31 3.99 1.72 0.89
Higher Heating, Btu/lb 14420 14434 12747 12668 14,085 14,081
Total Chlorine, wt% 0.02 0.01 0.09 0.09 0.03 0.03Total Fluorine, ug/g 26.00 26.00 73.00 85.00 35.4 37.8
Total Mercury, ug/g 0.05 0.04 0.07 0.09 0.054 0.050Total Lead, ug/g 3.00 4.00 7.00 7.00 3.800 4.600
Moisture (oven), wt%
Mineral analysisSiO2, wt% 5.03 5.16 47.22 47.12 13.47 13.55Al2O3, wt% 2.45 2.36 22.58 23.08 6.48 6.50Ti2O, wt% 0.43 0.41 1.12 1.11 0.57 0.55Fe2O3, wt% 6.76 6.58 16.24 15.04 8.66 8.27CaO, wt% 1.64 1.68 4.42 4.51 2.20 2.25MgO, wt% 0.25 0.22 0.90 0.90 0.38 0.36K2O, wt% 0.10 0.06 1.73 1.72 0.43 0.39Na2O, wt% 5.90 5.72 0.84 0.70 4.89 4.72SO3, wt% 6.03 7.63 3.97 3.69 5.62 6.84P2O5, wt% 0.04 0.04 0.40 0.42 0.11 0.12SrO, wt% 0.02 0.03 0.14 0.14 0.04 0.05BaO, wt% 0.06 0.06 0.11 0.10 0.07 0.07Mn3O4, wt% 0.05 0.04 0.02 0.03 0.04 0.04NiO, wt% 9.71 9.30 7.77 7.44V2O5, wt% 60.70 60.10 48.56 48.08Undetermined, wt% 0.83 0.61 0.31 1.44 0.73 0.78
Particulate size distributionParticulate Left Mesh, 1/2", wt% 15.70 17.27 15.98 15.45 15.76 16.91Particulate Left Mesh, 1/4", wt% 14.56 13.24 17.22 17.78 15.09 14.15Particulate Left Mesh, #4, wt% 3.88 2.69 4.04 3.92 3.91 2.94Particulate Left Mesh, #8, wt% 8.74 7.10 15.74 16.38 10.14 8.96Particulate Left Mesh, #14, wt% 21.20 19.20 14.41 14.43 19.84 18.25Particulate Left Mesh, #28, wt% 20.87 22.07 11.03 10.85 18.90 19.83Particulate Left Mesh, #48, wt% 5.89 8.59 8.29 7.73 6.37 8.42Particulate Left Mesh, #100, wt% 4.61 4.88 6.94 6.40 5.08 5.18Bottom, wt% 4.55 4.96 6.35 7.06 4.91 5.38
Fuel Coal Pittsburgh 8 (Fdrs A1, E1)Pet Coke 80% Pet Coke / 20 % Pittsburgh 8
1 of 2 AUG 10-11 Fuel Analysis.xlsAUG 10-11 80-20 Blend
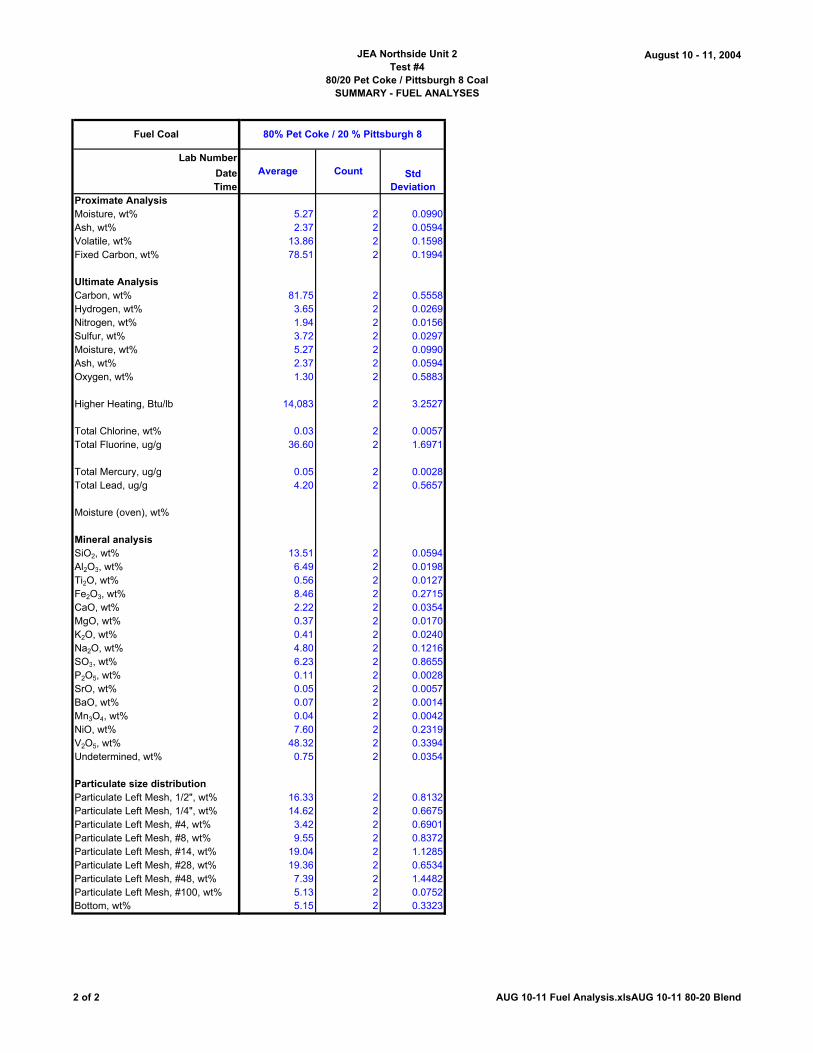
JEA Northside Unit 2Test #4
80/20 Pet Coke / Pittsburgh 8 CoalSUMMARY - FUEL ANALYSES
August 10 - 11, 2004
Lab Number
DateTime
Proximate AnalysisMoisture, wt%Ash, wt%Volatile, wt%Fixed Carbon, wt%
Ultimate AnalysisCarbon, wt%Hydrogen, wt%Nitrogen, wt%Sulfur, wt%Moisture, wt%Ash, wt%Oxygen, wt%
Higher Heating, Btu/lb
Total Chlorine, wt%Total Fluorine, ug/g
Total Mercury, ug/gTotal Lead, ug/g
Moisture (oven), wt%
Mineral analysisSiO2, wt%Al2O3, wt%Ti2O, wt%Fe2O3, wt%CaO, wt%MgO, wt%K2O, wt%Na2O, wt%SO3, wt% P2O5, wt%SrO, wt%BaO, wt%Mn3O4, wt%NiO, wt%V2O5, wt%Undetermined, wt%
Particulate size distributionParticulate Left Mesh, 1/2", wt%Particulate Left Mesh, 1/4", wt%Particulate Left Mesh, #4, wt%Particulate Left Mesh, #8, wt%Particulate Left Mesh, #14, wt%Particulate Left Mesh, #28, wt%Particulate Left Mesh, #48, wt%Particulate Left Mesh, #100, wt%Bottom, wt%
Fuel Coal
5.27 2 0.09902.37 2 0.0594
13.86 2 0.159878.51 2 0.1994
81.75 2 0.55583.65 2 0.02691.94 2 0.01563.72 2 0.02975.27 2 0.09902.37 2 0.05941.30 2 0.5883
14,083 2 3.2527
0.03 2 0.005736.60 2 1.6971
0.05 2 0.00284.20 2 0.5657
13.51 2 0.05946.49 2 0.01980.56 2 0.01278.46 2 0.27152.22 2 0.03540.37 2 0.01700.41 2 0.02404.80 2 0.12166.23 2 0.86550.11 2 0.00280.05 2 0.00570.07 2 0.00140.04 2 0.00427.60 2 0.2319
48.32 2 0.33940.75 2 0.0354
16.33 2 0.813214.62 2 0.66753.42 2 0.69019.55 2 0.8372
19.04 2 1.128519.36 2 0.65347.39 2 1.44825.13 2 0.07525.15 2 0.3323
Average Count Std Deviation
80% Pet Coke / 20 % Pittsburgh 8
2 of 2 AUG 10-11 Fuel Analysis.xlsAUG 10-11 80-20 Blend

JEA Large-Scale CFB Combustion Demonstration Project
Fuel Capability Demonstration Test Report #4 - ATTACHMENTS 80 / 20 Blend Petroleum Coke and Pittsburgh 8 Coal Fuel
B&V Project 137064
ATTACHMENT H
Limestone Analyses
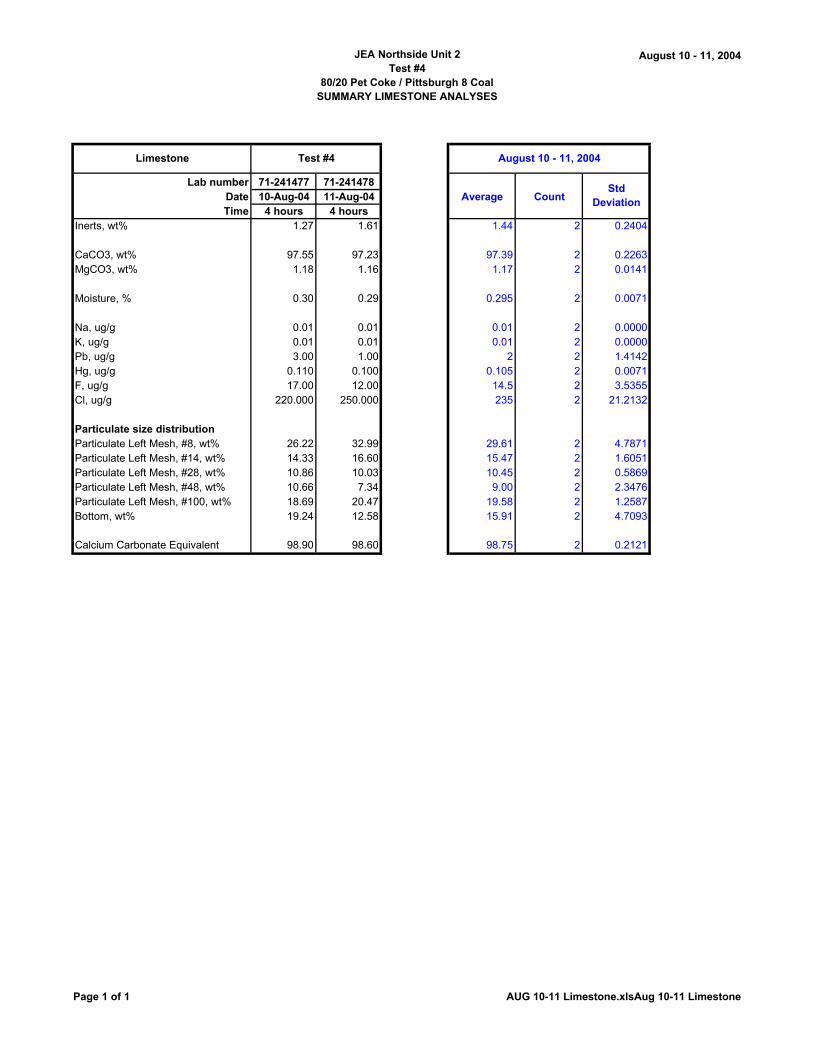
JEA Northside Unit 2Test #4
80/20 Pet Coke / Pittsburgh 8 CoalSUMMARY LIMESTONE ANALYSES
August 10 - 11, 2004
Lab number 71-241477 71-241478Date 10-Aug-04 11-Aug-04 Average CountTime 4 hours 4 hours
Inerts, wt% 1.27 1.61 1.44 2 0.2404
CaCO3, wt% 97.55 97.23 97.39 2 0.2263MgCO3, wt% 1.18 1.16 1.17 2 0.0141
Moisture, % 0.30 0.29 0.295 2 0.0071
Na, ug/g 0.01 0.01 0.01 2 0.0000K, ug/g 0.01 0.01 0.01 2 0.0000Pb, ug/g 3.00 1.00 2 2 1.4142Hg, ug/g 0.110 0.100 0.105 2 0.0071F, ug/g 17.00 12.00 14.5 2 3.5355Cl, ug/g 220.000 250.000 235 2 21.2132
Particulate size distributionParticulate Left Mesh, #8, wt% 26.22 32.99 29.61 2 4.7871Particulate Left Mesh, #14, wt% 14.33 16.60 15.47 2 1.6051Particulate Left Mesh, #28, wt% 10.86 10.03 10.45 2 0.5869Particulate Left Mesh, #48, wt% 10.66 7.34 9.00 2 2.3476Particulate Left Mesh, #100, wt% 18.69 20.47 19.58 2 1.2587Bottom, wt% 19.24 12.58 15.91 2 4.7093
Calcium Carbonate Equivalent 98.90 98.60 98.75 2 0.2121
Limestone
Std Deviation
August 10 - 11, 2004Test #4
Page 1 of 1 AUG 10-11 Limestone.xlsAug 10-11 Limestone

JEA Large-Scale CFB Combustion Demonstration Project
Fuel Capability Demonstration Test Report #4 - ATTACHMENTS 80 / 20 Blend Petroleum Coke and Pittsburgh 8 Coal Fuel
B&V Project 137064
ATTACHMENT I
Bed Ash Analyses
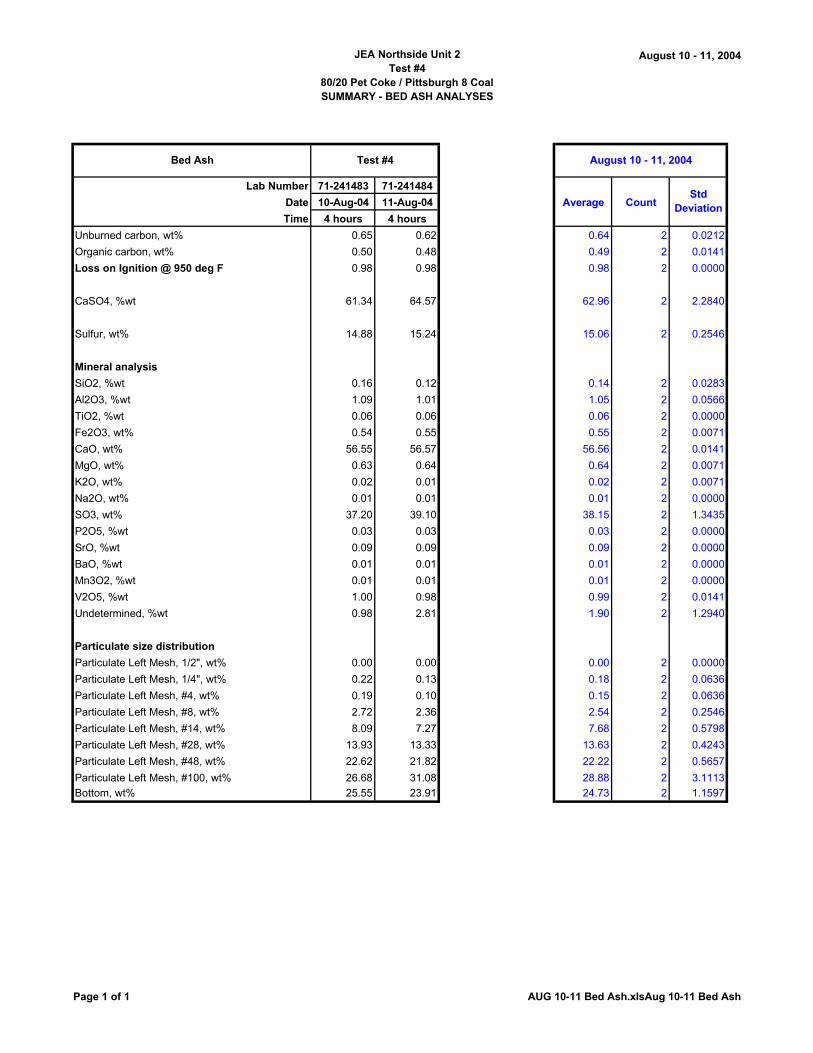
JEA Northside Unit 2Test #4
80/20 Pet Coke / Pittsburgh 8 CoalSUMMARY - BED ASH ANALYSES
August 10 - 11, 2004
Lab Number 71-241483 71-241484
Date 10-Aug-04 11-Aug-04 Average Count
Time 4 hours 4 hours
Unburned carbon, wt% 0.65 0.62 0.64 2 0.0212
Organic carbon, wt% 0.50 0.48 0.49 2 0.0141
Loss on Ignition @ 950 deg F 0.98 0.98 0.98 2 0.0000
CaSO4, %wt 61.34 64.57 62.96 2 2.2840
Sulfur, wt% 14.88 15.24 15.06 2 0.2546
Mineral analysis
SiO2, %wt 0.16 0.12 0.14 2 0.0283
Al2O3, %wt 1.09 1.01 1.05 2 0.0566
TiO2, %wt 0.06 0.06 0.06 2 0.0000
Fe2O3, wt% 0.54 0.55 0.55 2 0.0071
CaO, wt% 56.55 56.57 56.56 2 0.0141
MgO, wt% 0.63 0.64 0.64 2 0.0071
K2O, wt% 0.02 0.01 0.02 2 0.0071
Na2O, wt% 0.01 0.01 0.01 2 0.0000
SO3, wt% 37.20 39.10 38.15 2 1.3435
P2O5, %wt 0.03 0.03 0.03 2 0.0000
SrO, %wt 0.09 0.09 0.09 2 0.0000
BaO, %wt 0.01 0.01 0.01 2 0.0000
Mn3O2, %wt 0.01 0.01 0.01 2 0.0000
V2O5, %wt 1.00 0.98 0.99 2 0.0141
Undetermined, %wt 0.98 2.81 1.90 2 1.2940
Particulate size distribution
Particulate Left Mesh, 1/2", wt% 0.00 0.00 0.00 2 0.0000
Particulate Left Mesh, 1/4", wt% 0.22 0.13 0.18 2 0.0636
Particulate Left Mesh, #4, wt% 0.19 0.10 0.15 2 0.0636
Particulate Left Mesh, #8, wt% 2.72 2.36 2.54 2 0.2546
Particulate Left Mesh, #14, wt% 8.09 7.27 7.68 2 0.5798
Particulate Left Mesh, #28, wt% 13.93 13.33 13.63 2 0.4243
Particulate Left Mesh, #48, wt% 22.62 21.82 22.22 2 0.5657
Particulate Left Mesh, #100, wt% 26.68 31.08 28.88 2 3.1113Bottom, wt% 25.55 23.91 24.73 2 1.1597
Bed Ash August 10 - 11, 2004
Std Deviation
Test #4
Page 1 of 1 AUG 10-11 Bed Ash.xlsAug 10-11 Bed Ash
JEA Large-Scale CFB Combustion Demonstration Project
Fuel Capability Demonstration Test Report #4 - ATTACHMENTS 80 / 20 Blend Petroleum Coke and Pittsburgh 8 Coal Fuel
B&V Project 137064
ATTACHMENT J
Fly Ash (Air Heater and PJFF) Analyses
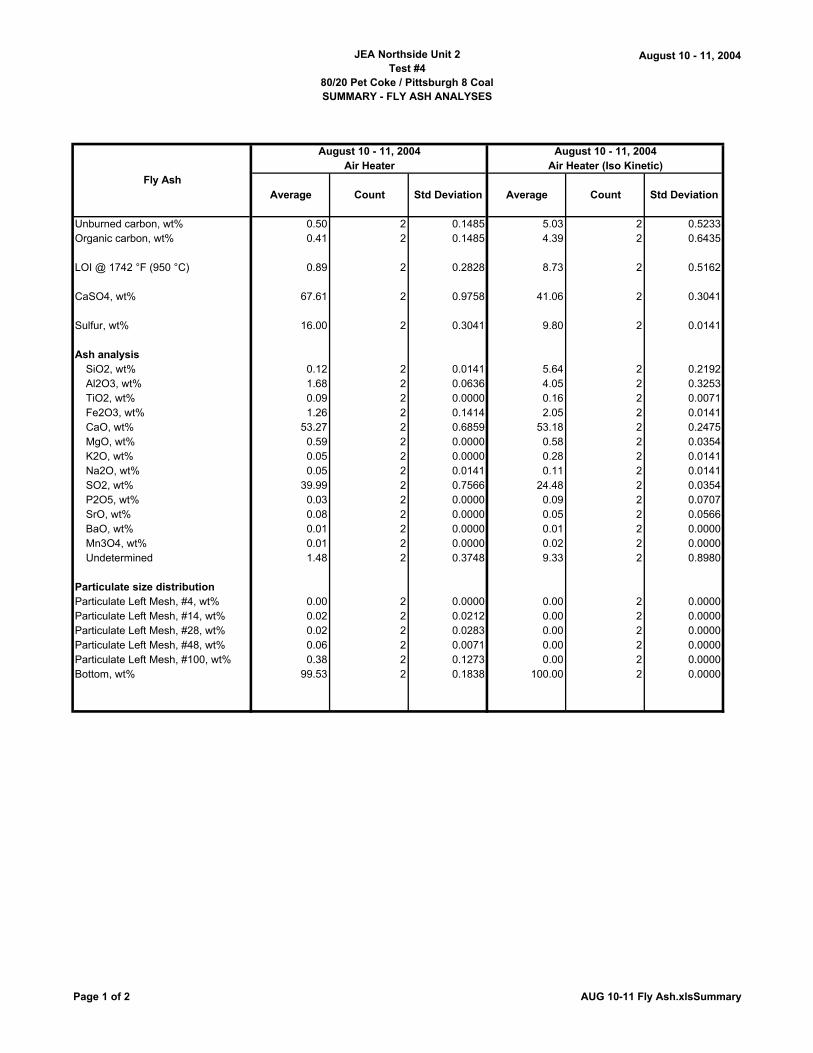
JEA Northside Unit 2Test #4
80/20 Pet Coke / Pittsburgh 8 CoalSUMMARY - FLY ASH ANALYSES
August 10 - 11, 2004
Average Count Std Deviation Average Count Std Deviation
Unburned carbon, wt% 0.50 2 0.1485 5.03 2 0.5233Organic carbon, wt% 0.41 2 0.1485 4.39 2 0.6435
LOI @ 1742 °F (950 °C) 0.89 2 0.2828 8.73 2 0.5162
CaSO4, wt% 67.61 2 0.9758 41.06 2 0.3041
Sulfur, wt% 16.00 2 0.3041 9.80 2 0.0141
Ash analysisSiO2, wt% 0.12 2 0.0141 5.64 2 0.2192Al2O3, wt% 1.68 2 0.0636 4.05 2 0.3253TiO2, wt% 0.09 2 0.0000 0.16 2 0.0071Fe2O3, wt% 1.26 2 0.1414 2.05 2 0.0141CaO, wt% 53.27 2 0.6859 53.18 2 0.2475MgO, wt% 0.59 2 0.0000 0.58 2 0.0354K2O, wt% 0.05 2 0.0000 0.28 2 0.0141Na2O, wt% 0.05 2 0.0141 0.11 2 0.0141SO2, wt% 39.99 2 0.7566 24.48 2 0.0354P2O5, wt% 0.03 2 0.0000 0.09 2 0.0707SrO, wt% 0.08 2 0.0000 0.05 2 0.0566BaO, wt% 0.01 2 0.0000 0.01 2 0.0000Mn3O4, wt% 0.01 2 0.0000 0.02 2 0.0000Undetermined 1.48 2 0.3748 9.33 2 0.8980
Particulate size distributionParticulate Left Mesh, #4, wt% 0.00 2 0.0000 0.00 2 0.0000Particulate Left Mesh, #14, wt% 0.02 2 0.0212 0.00 2 0.0000Particulate Left Mesh, #28, wt% 0.02 2 0.0283 0.00 2 0.0000Particulate Left Mesh, #48, wt% 0.06 2 0.0071 0.00 2 0.0000Particulate Left Mesh, #100, wt% 0.38 2 0.1273 0.00 2 0.0000Bottom, wt% 99.53 2 0.1838 100.00 2 0.0000
Fly Ash
August 10 - 11, 2004Air Heater
August 10 - 11, 2004Air Heater (Iso Kinetic)
Page 1 of 2 AUG 10-11 Fly Ash.xlsSummary
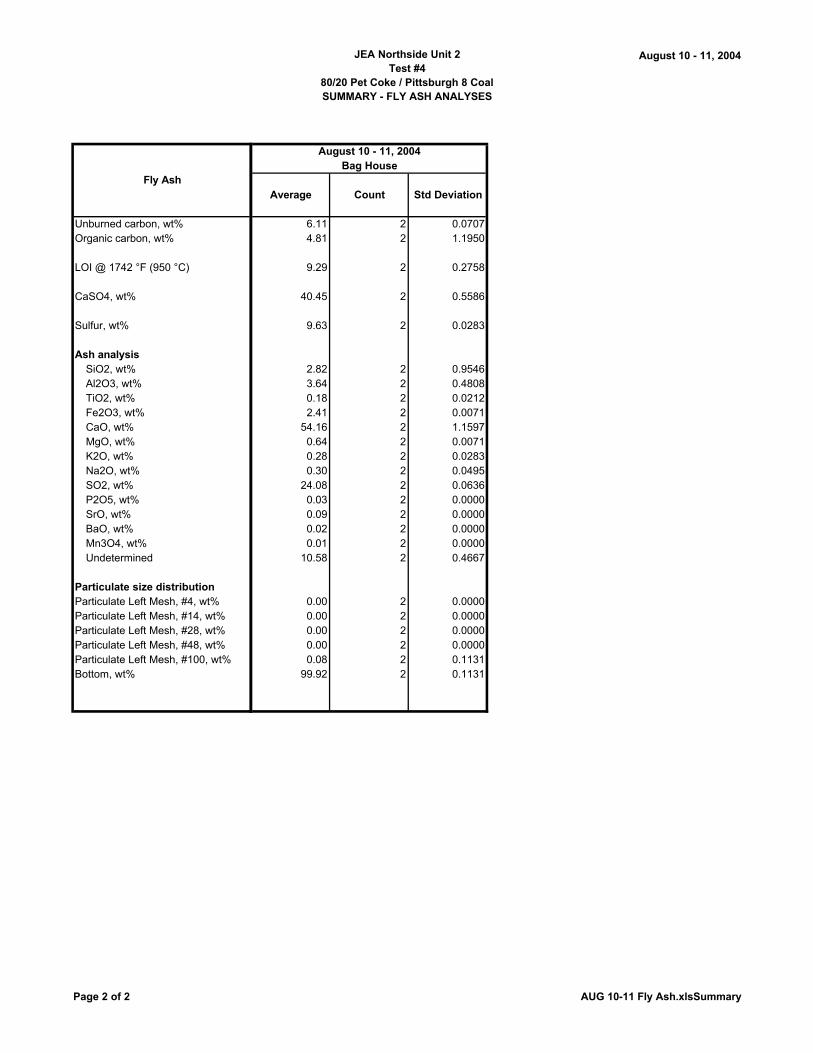
JEA Northside Unit 2Test #4
80/20 Pet Coke / Pittsburgh 8 CoalSUMMARY - FLY ASH ANALYSES
August 10 - 11, 2004
Unburned carbon, wt%Organic carbon, wt%
LOI @ 1742 °F (950 °C)
CaSO4, wt%
Sulfur, wt%
Ash analysisSiO2, wt%Al2O3, wt%TiO2, wt%Fe2O3, wt%CaO, wt%MgO, wt%K2O, wt%Na2O, wt%SO2, wt%P2O5, wt%SrO, wt%BaO, wt%Mn3O4, wt%Undetermined
Particulate size distributionParticulate Left Mesh, #4, wt%Particulate Left Mesh, #14, wt%Particulate Left Mesh, #28, wt%Particulate Left Mesh, #48, wt%Particulate Left Mesh, #100, wt%Bottom, wt%
Fly AshAverage Count Std Deviation
6.11 2 0.07074.81 2 1.1950
9.29 2 0.2758
40.45 2 0.5586
9.63 2 0.0283
2.82 2 0.95463.64 2 0.48080.18 2 0.02122.41 2 0.0071
54.16 2 1.15970.64 2 0.00710.28 2 0.02830.30 2 0.0495
24.08 2 0.06360.03 2 0.00000.09 2 0.00000.02 2 0.00000.01 2 0.0000
10.58 2 0.4667
0.00 2 0.00000.00 2 0.00000.00 2 0.00000.00 2 0.00000.08 2 0.1131
99.92 2 0.1131
August 10 - 11, 2004Bag House
Page 2 of 2 AUG 10-11 Fly Ash.xlsSummary
JEA Large-Scale CFB Combustion Demonstration Project
Fuel Capability Demonstration Test Report #4 - ATTACHMENTS 80 / 20 Blend Petroleum Coke and Pittsburgh 8 Coal Fuel
B&V Project 137064
ATTACHMENT K
Ambient Data, Aug. 12, 2004 & Aug. 13, 2004
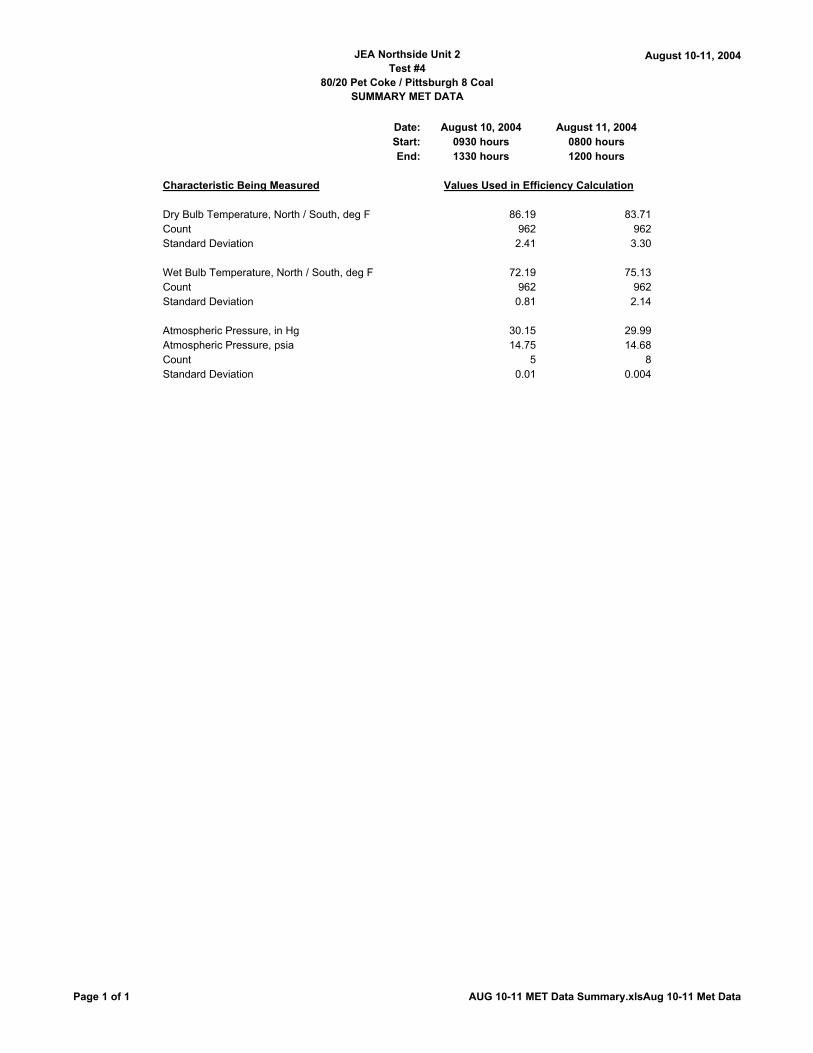
JEA Northside Unit 2Test #4
80/20 Pet Coke / Pittsburgh 8 CoalSUMMARY MET DATA
August 10-11, 2004
Date: August 10, 2004 August 11, 2004Start: 0930 hours 0800 hoursEnd: 1330 hours 1200 hours
Characteristic Being Measured
Dry Bulb Temperature, North / South, deg F 86.19 83.71Count 962 962Standard Deviation 2.41 3.30
Wet Bulb Temperature, North / South, deg F 72.19 75.13Count 962 962Standard Deviation 0.81 2.14
Atmospheric Pressure, in Hg 30.15 29.99Atmospheric Pressure, psia 14.75 14.68Count 5 8Standard Deviation 0.01 0.004
Values Used in Efficiency Calculation
Page 1 of 1 AUG 10-11 MET Data Summary.xlsAug 10-11 Met Data
JEA Large-Scale CFB Combustion Demonstration Project
Fuel Capability Demonstration Test Report #4 - ATTACHMENTS 80 / 20 Blend Petroleum Coke and Pittsburgh 8 Coal Fuel
B&V Project 137064
ATTACHMENT L
Partial Loads Ambient Data, Aug. 10, Aug. 11, 2004
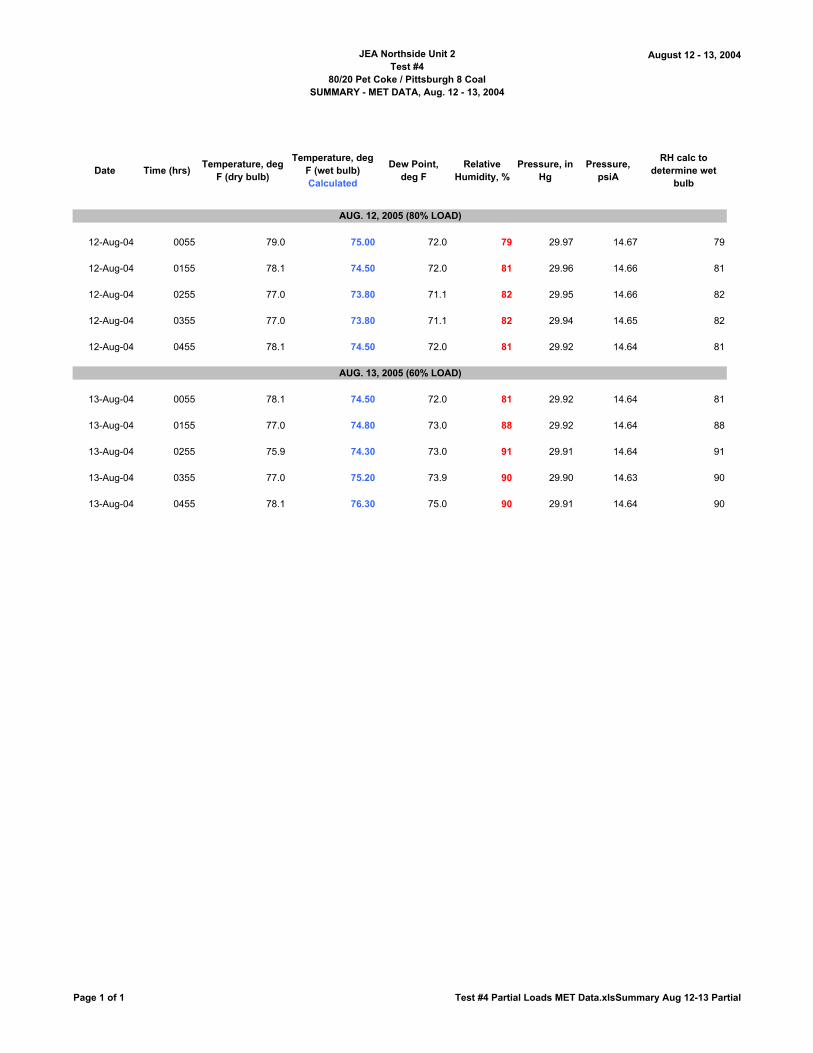
JEA Northside Unit 2Test #4
80/20 Pet Coke / Pittsburgh 8 CoalSUMMARY - MET DATA, Aug. 12 - 13, 2004
August 12 - 13, 2004
Date Time (hrs)Temperature, deg
F (dry bulb)
Temperature, deg F (wet bulb) Calculated
Dew Point, deg F
Relative Humidity, %
Pressure, in Hg
Pressure, psiA
RH calc to determine wet
bulb
12-Aug-04 0055 79.0 75.00 72.0 79 29.97 14.67 79
12-Aug-04 0155 78.1 74.50 72.0 81 29.96 14.66 81
12-Aug-04 0255 77.0 73.80 71.1 82 29.95 14.66 82
12-Aug-04 0355 77.0 73.80 71.1 82 29.94 14.65 82
12-Aug-04 0455 78.1 74.50 72.0 81 29.92 14.64 81
13-Aug-04 0055 78.1 74.50 72.0 81 29.92 14.64 81
13-Aug-04 0155 77.0 74.80 73.0 88 29.92 14.64 88
13-Aug-04 0255 75.9 74.30 73.0 91 29.91 14.64 91
13-Aug-04 0355 77.0 75.20 73.9 90 29.90 14.63 90
13-Aug-04 0455 78.1 76.30 75.0 90 29.91 14.64 90
AUG. 12, 2005 (80% LOAD)
AUG. 13, 2005 (60% LOAD)
Page 1 of 1 Test #4 Partial Loads MET Data.xlsSummary Aug 12-13 Partial
JEA Large-Scale CFB Combustion Demonstration Project
Fuel Capability Demonstration Test Report #4 - FIGURES 80 / 20 Blend Petroleum Coke and Pittsburgh 8 Coal Fuel
B&V Project 137064
FIGURES
FIGURE 1 - GENERAL ARRANGEMENT PLAN, DRAWING NO. 3847-1-100, REV. 3
FIGURE 2 - GENERAL ARRANGEMENT ELEVATION, DRAWING NO. 3847-1-101, REV. 3
FIGURE 3 - FABRIC FILTER EAST END ELEVATION, DRAWING NO. 3847-9-268, REV. 2
FIGURE 4 - GENERAL ARRANGEMENT UNIT 2 ISO VIEW (RIGHT SIDE), DRAWING NO. 43-7587-5-53
FIGURE 5 - GENERAL ARRANGEMENT UNIT 2 FRONT ELEVATION VIEW A-A, DRAWING NO. 43-7587-5-50, REV. C
FIGURE 6 - GENERAL ARRANGEMENT UNIT 2 SIDE ELEVATION, DRAWING NO. 43-7587-5-51, REV. C