frozen processed fish and
TRANSCRIPT

FROZEN PROCESSED FISH AND SHELLFISH
CONSUMPTION IN
INSTITUTIONS AND PUBLIC EATING PLACES
Atlanta , Georgia
UNITED STATES DEPARTMENT OF THE INTERIOR
FISH AND WILDLIFE SERVICE
BUREAU OF COMMERCIAL FISHERIES
WASHINGTON 2 5, D. C.
CIRCULAR 67
United States Department of the Interior, Fred A. Seaton, Secretary
Fish and Wildlife Service, Arnie J. Suomela, Commissioner
Bureau of Commercial Fisheries, Donald L. McKernan, Director
INSTITUTIONS AND PUBLIC EATING PLACES are amongthe best of all potential markets for frozen fishery products.In recognition of this, a survey was undertaken to obtaininformation on the consumption of frozen processed fish andshellfish in these establishments.
This study was conducted in ten selected cities by Crossley,S-D Surveys, Inc. , of New York City in order to obtain informationwhich could be used by the fishing industry to increase consumerdemand for fishery products. The data obtained for each city as
a result of this survey, together with an explanation of the methodsand procedures used, are published in a series as follows:
Circular 66 - Survey Methods and ProceduresCircular 67 - Atlanta, GeorgiaCircular 68 - Chicago, Illinois
Circular 69 - Cleveland, OhioCircular 70 - Denver, ColoradoCircular 71 - Houston, TexasCircular 72 - Los Angeles, CaliforniaCircular 73 - New York, New YorkCircular 74 - Omaha, NebraskaCircular 75 - Portland, OregonCircular 76 - Springfield, Massachusetts
This project was financed from funds provided by theSaltonstall-Kennedy Act to increase production andmarkets for the domestic fishing industry.
These publications are available upon request from the Director, Bureau of CommercialFisheries, U. S. Department of the Interior, Washington 25, D. C.

FROZEN PROCESSED FISH
AND SHELLFISH CONSUMPTION
IN INSTITUTIONS
AND
PUBLIC EATING PLACES
ATLANTA, GEORGIA
Prepared in the Division of Industrial Research and Services
Branch of Market Development
CIRCULAR 67
vVASHINGTON - NOVEMBER 1959


TABLE OF CONTENTS
Table Page
SUMMARY OF FINDINGS. 1 - 5
DETAILED FINDINGS
1 Did the Establishment Buy Sea Food in the Preceding^ ^^exvc xviomns . ..............aa........ ............. ......... o
2 Did the Establishment Buy Frozen Processed Sea Foodin the Preceding Twelve Months ? .............................. 7
3 Frozen Processed Fish Bought in November, 1958How Processed Before Purchase,. ., , ., ,
.
8 - 9
4 Quantity of Frozen Processed Fish Bought in November , 1958 ....... . 10
5 Satisfaction or Dissatisfaction with Prepreparation of FrozenProcessed Fish. ................... ..,.,. 11
6 Satisfaction and Dissatisfaction with Quality and Condition of
Frozen Processed Fish 12
7 Package Sizes of Frozen Processed Fish Bought in
November, 1958 and Average Number of Servings
8 Satisfaction and Dissatisfaction with Types and Sizes of
Frozen Processed Fish Packages 13
9 Percentage of Frozen Processed Fish Served Fried,Broiled, Baked, and in Other Ways ,..,..,....... 13
10 Frozen Processed Shellfish Bought in November, 1958How Processed Before Purchase. 14
11 Quantity of Frozen Processed Shellfish Bought in
IN UVcm L>C Aj ^7^O«o9a9eeaoe«a«*aa»*0*o»«»»o0*«*o*0«*oae«««09ooo IC^

Table Page
12 Satisfaction or Dissatisfaction with Prepreparation of
Frozen Processed Shellfish. o..»»<>o.oc..o
13 Satisfaction and Dissatisfaction with Quality ajid
Condition of Frozen Processed Shellfish . . ,
14 Package Sizes of Frozen Processed Shellfish Boughtin November, 1958 and Average Number of ServingsPer Pound . . » o o . gooo*o»aoo*ooo*o»*oooeoee*B»oooo
16
16
15 Satisfaction and Dissatisfaction with Types and Sizes
of Frozen Processed Shellfish Packages o . „ 0.....0.0. .....<> 1916 Percentage of Frozen Processed Shellfish Served
Fried, Broiled, Baked and in Other Ways » ... o <,.... o .. o . 19
17 Types of Portions Bought in November, 1958 2018 Quantity of Portions Bought in November, 1958 ..,.,.,,....,.„...... OQ
19 Amount of Portions Bought by Establishments, as
Compared to the Previous Year 2
1
ZO Satisfaction and Dissatisfaction with Quality and
21 Is the Quality of Portions Better than that of other
Frozen Processed Fish - For What Reasons ?....,.« ...........
.
2222 Advantages of Using Portions. ............ ..... . ................. 2223 Disadvantages of Using Portions 2324 Do Establishments Think Customers Prefer Portions
to Other Frozen Processed Fish - For WhatXXC a o yJlXo . •««o*««««ooo»osoeoo*»oeooeeeooaoao*»a»seoe»»««*eaooo ^U

Table
o s o a a <
O ••009»0«0*900*0a'
o*oeeoo*oe«*<
Page
25 Average Weight of Portions and Average Number of
OCiVlIlgS "Gl^ ir3,Cita.gGo o«»ooo»aaooooooo«o*«*oa*ooos»»oao»«ooaoo *? 4-
26 Satisfaction with the Size of Portions in a Package o......... 2427 Percentage of Portions Served Fried, Broiled,
l3a.iC6 Q I a,IlQ 111 vyLllC i W3,yS oooooeo9o«ooeo«o*ft*«o«ooooooo*ooo*oo* OCL
28 Do Establishments Cook Portions While Still Frozen ?..,.... 0.....0. ofi
29 Cost of Using Portions, as Compared to Other FrozenProcessed Fish and Reasons Why Portions areThought More or Less Expensive ....... o ..... o o,.. 0.0 .<,......
.
2630 When Ordering Portions from Suppliers, Do Establishments
Specify the Kind of Fish ? , , , , „
31 Would the Establishments Like to Have Other PortionControlled Sea Food Items Not Now Available ?.... 27
32 Reasons Establishments Did Not Buy Portions DuringNovember, 1958 ,. , .....
27
28
32 Was Price a Reason Establishments Did Not Buy Portions ?. 2833 Types of Supplier Providing Frozen Processed Sea Food
34 Distance of Establishment from Main Supplier of FrozenProcessed Sea Food. .............................
35 Frequency of Deliveries of Frozen Processed Sea Food36 Can Suppliers of Frozen Processed Sea Food Improve
Services to Establishments ? ,
29
30
31
32

Table Page
37 Amount Spent for Frozen Processed Sea Food DuringPreceding Twelve Months. .<,...o..o.o<.,......o..oo o...... 33
38 Profitability to Establishments of Frozen ProcessedSea Food and Other High Protein Foods .. o ......... .0 o 34
39 Do the Establishments Know they can buy GovernmentInspected or Graded Frozen Processed Sea Food ? 35
40 Do the Establishments Buy Government Inspected or
Graded Frozen Processed Sea Food ?..,.......................... 3541 Reasons Establishments Buy Government Inspected
or Graded Frozen Processed Sea Food 37
Xjuy WLore or x^ess r ............... .....o.............. ........."^J^
42 Has Government Inspection Affected the Amount of
Frozen Processed Sea Food Bought by the
43 If Government Inspected or Graded Frozen ProcessedSea Food were Available Would the Establishment
?
44 Previous Use of Frozen Processed Sea Food by
Nonusers and Reasons for Stopping Use or
45 Do Establishments Have Cold Storage Facilities
for Keeping Frozen Processed Sea Food?According to Type of Establishment andOaX6 S V OJLUIII6 »»*»««o»o«»»«ooeeo**oo«Q0*s»e«ooo»eoaoaogoe«o«OBO» -^O
46 According to Nonusers of Sea Food and Users NotUsing Frozen Processed Sea Foods 41

Table Page
DISTRIBUTION OF SAMPLE
a Total Receipts from Meals Served During 1957 or
b Amount Establishments Spent for Food Duringi'^rc VIOU.S J. W^GIVG iViOIXtJlS o»0»o««»«9o*»oo*9*e»oos»aoa««aeoao««o««oo 4- "^
c Percentage of Total Operating Cost Spent for
Food in Previous Twelve Months .,...0.. , o.. 44d Average Number of Meals Served by Establishments 4c-
e Average Price Per Meal Served. , 46
f Number of Regular Employees Engaged in PreparinganCi. OerVmg X OOU. oo.oo.»ooeoo..o.o....o.9o««o090aoo.o..o.ao«a.o. ^1
g Seating Capacity of Establishments ....<,...........,................. 47h Number of Days of the Week on Which Establishments
i Percentage of Establishments Serving Specialized TypesOX A. OOQq «oe9099999 9 O •9O9a0»99O9a9OO9O9O*99O9O*99*999«99a9e999Oe 49


SUMMARY OF FINDINGS
(Atlanta)
A. Use of Frozen Procea^ed Sea Food (Tables 1, g)
Four fifths of all the establishments in Atlanta said
they bought sea food in the previous twelve months.
Among buyers of sea food, the great majority said
they made purchases of ;;ea food in the frozen proc-essed form.
Fifty-six per cent of ail the establishments said theyhad bought fro^ea processed fish in November, 1958; k6
per cent said ^hey had bought fro/.en processed shell-fish ; and ^1 per cent said Ihey had bought p.'-rtjon'- .
Among institutions (such as schools and hospitals),the incidence of use of frozen proce:^sed sea food «a?greater than among public eating place.='.
.
Of the ten cities in the survey, Atlanta ranki=-d second,in terms of the percentage of all est,ablishm.-?nts buyingfrozen processed sea food.
B . Frozen Processed Fish - Purchases, Attitudes,and Practices
1. Purchases: Species and Amount of Pre-preparation (Tables 3> '<-)
More than two thirds of the users of frozenprocessed fish bought ocean perch fillets dur-ing November, 1958. This «as the most popularof the frozen processed fish items served inthis area.
Haddock fillets were also bought in large quan-tities by many establishments in Atlanta.
Ocean perch fillets were bought widely and in
substantial quantities in the Southern andMiddle Western cities included in the survey,while haddock fillets were popular purcha.^esin Omaha, Springfield and Cleveland.
Attitudes Toward Prepreparation and Qualityand Condition of Fish (Tables 5,~^
A great majority of Atlanta purchasers weresatisfied with the present prepreparation offish, and with the quality and condition ofthe fish.
This was generally true for the ten cities in-cluded in the survey.
3. Packaging of Fish (Tables 7, 8)
Atlanta establishments most typically boughtfrozen processed fish in 5 pound packages.Mackerel fillets were an exception, with 10
pound packages the most popular size forthis item.
Methods of Preparing and Serving Fish(Table 9)
Frying was the most popular method of preiar-ing fish among Atlanta establishments. Theaverage establishment served 71 per cent ofits fish fried. Frying was the leading methodin all ten cities of the study.

Frozen Processed Shellfish - Pxurchases,
Attitudes, and Practices
1 Purchases: Species and Type of Preprep-
aration (Tables 10, 11)
More than half of the frozen processed shell-
fish users in Atlanta bought breaded shrimp
in November, 195C. A third of the establish-
ments bought raw shrimp.
Raw lobster, however, led in Atlanta in terms
of total quant ity purchased
.
Breaded shrimp and raw shrimp were bought
widely and in large quantities in all of the
cities included in the study.
2. Attitudes Toward Prepreparation; TowardQuality and Condition of Shellfish(Tables 12, 13)
All but a few purchasers were satisfied with
the present prepreparation of shellfish, and
with the quality and condition of the shell-
fish which they bought
.
The same held generally true for the othercities in the survey.
3. Packaging of Shellfish (Tables Ih, 1$)
As with fish, shellfish was most frequentlybought in 5 pound packages in Atlanta.
k. Methods of Preparing and Serving Shellfish(Table 16)'
Frying was the most popular way of preparing shell-fish in Atlanta. The typical establislu.it.'.t served
three quarters of its shellfish fried.
A. with fish, frying '-
pa ' -'g shellfish in al
.
the leading method of pre-ten cities of the study.
D. Portion Controlled Sea Food - Purchases,Attitude.'!, and Practices
1. Purchases: Type of Prepreparation(Tables 1, 17, 18, 191
More than a fourth of all the establishmentsin Atlanta bought portions during November,
1958.
As with frozen processed sea food in general,Atlanta ranked second in percentage of estab-lishments buying portions.
In Atlanta, portions which were uncooked-breaded and uncooked-plain were the leadingitems in terms of the percentage of estab-lishments using them. In terms of quantitypurchased uncooked-breaded portions rankedfirst.
Three fourths of the purchasers of portionssaid that they were currently buying aboutthe same amount of portions as the year be-fore. Thirteen per cent said they were buy-ing more, and h per cent said they were buy-ing less.
2. Attitudes Toward Portions (Tables 20, 21,
22, 23, 2^
Nearly all establishments said they were sat-
isfied with the quality and condition of por-
tions.
About a quarter of the users of portions said
they thought the quality of portions was bet-ter than that of other frozen processed fish.

More than 60 per cent rated the quality as
about the same, while 5 per cent consideredthe quality poorer.
Major advantages cited for portions included:
ic ofUsersCiting
Size of portions, uniform portions 36Convenience, ease of preparation 'ik
Economy, no waste 25
Fast, timesaving 20
Can control food costs better -
know profit 16
About 30 per cent of the users cited some dis-advantage to using portions. The most frequentlymentioned disadvantage was that portions are not
economical.
Users of portions generally thought their cus-tomers liked portions as well as other types of
frozen processed fish, with fewer than 3 percent indicating that their customers likedportions less than other types of frozen proc-essed sea food.
3. Packaging of Portions (Tables 2$, 26)
Atlanta purchasers tended to buy portions in
larger packages than purchasers in other cities.The average weight of a package of portions forthe city was 7.6 pounds.
They also tended to buy individual portions oflarger size, and the average weight of an indi-vidual portion was 5-1 ounces.
Almost all establishmer. :s, in Atlanta and theother nine cities, said they were satisfiedwith the size of portions in the packages.
h . Methods of Preparing and Serving Portions(Tables 27, 28)
Frying was the most widely used method of pre-paring and serving portions with 86 per centof the establishments serving them this way.The average establishment served 65 per centof its portions fried.
Frying was the leading method in nine of theten cities of the study, the single exceptionbeing Springfield, Massachusetts, where bakingwas the most popular method of preparation.In Atlanta, the average establishmentserved 12 per cent of its portions broiledand 16 per rent baked.
Almost three fourths of the Atlanta establish-ments using portions cooked them while frozen.
Cost of Using Portions (Table 29)
Only a sixth of the establishments using por-tions said they were more expensive than otherforms of frozen processed fish. A large ma-jority of users considered them less expensive,
or rated them about the same.
Miscellaneous Findings About Portions(Tables 30, 31)
Virtually all Atlanta establishments said theyspecified the kind of fish when ordering por-tions.
Fewer than 2 per cent of the users suggested

any new portion items, not now available, which
they would like to have.
7. Honusers of Portions (Table 32)
Establishments which used frozen processed sea
food, but not portions, ^ve a number of reasons
for not buying portions: portions were too ex-
pensive, they served other types of fish, or
they sold comparatively little fish.
Price also figure^ as a reason for not buying
portions in Denver, Los Angeles, and Portland.
It was less important as a reason in the other
six cities of the survey.
E. Suppliers of Frozen Processed Sea Food
(Tables 33, i^ , 35, 3^
Establishments in Atlanta tended to buy frozen proc-
essed sea food from sea food wholesalers, usually less
than ten miles away, to have it delivered once a week,
and to be satisfied with the services of the suppliers.
Sea food wholesalers supplied 72 per cent of the estab-
lishments, while frozen food distributors accounted for
another 20 per cent.
Main suppliers were located less than ten miles from
the establishment, in 78 per cent of the cases.
In almost half the cases, deliveries were made once a
week, while deliveries were made from two to four times
a week in about a quarter of the establishments.
Only a small fraction of the purchasers said they could
think of ways in which the suppliers could improve their
services.
F. Expenditures for Frozen Pr cessed Sea Food;
Its Pr-fitability (Tables 37, 38)
A third of the establishments reporting in Atlantasaid that they spent less than $250 for frozen proc-essed sea food during the preceding twelve months.
The figures ranged upward to $100,000 and over, withthe median coming at $1+50.
Five eighths of the profit-making establish, ents whichexpressed an opinion, considered frozen processed sea
food more profitable than other high protein foods.
Government Inspection of Frozen Processed Sea
Food - Awareness, Effect, and Attitudes(Tables 39, ^0, ttl, k2)
All but 15 per cent of the establishments in Atlanta
were aware that they could buy frozen processed sea
food, which had been inspected or graded by the
United States Government.
Of those who were unaware, a small number said theywould buy more sea food if Government inspected sea
food were available. Most said either that they
did not know or would buy about the same amount.
Of the establishments aware that they could buyGovernment inspected or "graded sea food, almost all
had bought some. When purchasers were asked if the
inspection had affected the amount of frozen processed
sea food which they bought, 6 per cent said the in-
spection had caused them to buy more.
H. Nonusers of Frozen Processed Sea Food; Cold
Storage Facilities (Tables U3, kh, h5)
Most nonusers in Atlanta said they had never bought
frozen processed sea food with the main reason givep
being that they sold little or no fish.

Atiout one sixth of the Atlanta establishments who never had
used frozen processed sea food said that they did not have
suitable cold storage facilities. In oth'^r cities, though,
this reason was not often given.
Findings regarding cold storage facilities among nonusers
in Atlanta may be summarized as follows:
Total Nonusers of FrozenProcessed Sea Food 100
Have cold storage facilities 56
Don't use sea food at all Y!
Use sea food, but not frozenprocessed sea food 19
No cold storage facilities \ii^

DETAILED FINDINGS
Table 1
DID THE ESTABLISHMEMT BUY SEA FOOD IN THE PRECEDING TWELVE MONTHS?
According to Type of Establishment and Sales Volume
Total Establishments
Yes, bought sea food
Bought frozen processed sea foodBought frozen processed fishBought frozen processed shellfishBought portions
Total
(2^3)
i
100.0
82.4
72.3
26.7
Type of

Table 2
DID THE ESTABLISHMENT BUY FROZEM PROCESSED SEA FOOD IN THE FRECEDIMG TWELVE MOHTHS?
According to Type of Establishment and Sales Volume
Total Establishments PurchasingSea Food in Preceding 12 Months
Yes, bought frozen processed sea food
No, did not buy frozen processed sea food

Table 3
FROZEN PROCESSED FISH BOUGHT IN NOVEMBER, 1958 - HOW PROCESSED BEFORE PUBCHASE
According to Sales Volume
Total Users of FrozenProcessed Fish
CarpRaw
Catfish
BreadedFilletsBreaded filletsRaw
Total
Fillets

Table 3
(Contd.
)
FROZEN PROCESSED FISH BOUGHT IN NOVEMBEB, 1958 - HOW PROCESSED BEFORE PURCHASE(Continued)
According to Sales Volume
Less $40,000Than $10,000- and$10,000 39,999 Over
Less $1*0,000
Than $10,000- and
$10,000 39,999 Over
MulletFillets

Table 4
QUAMTITY OF FROZEN PROCESSED FISH BOUGHT Dl NOVEMBER, 1958
Average Number of Pounds

Table 5
SATISFACTION OR DISSATISFACTION WITH FREPREPARATION OF FROZEN PROCESSED FISH
TotalUsers
(1)
Total Purchases of Cod
Prefer more prepreparation of codPrefer less prepreparation of codPrefer prepreparation as it is
No answer
Total Purchases of Flounder
Prefer more prepreparation of flounderPrefer less prepreparation of flounderPrefer prepreparation as it is
No answer
Total Purchases of Haddock
Prefer more prepreparation of haddockPrefer less prepreparation of haddockPrefer prepreparation as it isNo answer
100.0
88.012.0
100.0
95.05.0
100.0
98.31-7
Total Purchases of Mackerel
Prefer more prepreparation of mackerelPrefer less prepreparation of mackerelPrefer prepreparation as it is
No answer
Total Purchases of Ocean Perch
Prefer more prepreparation of ocean perchPrefer less prepreparation of ocean perchPrefer prepreparation as it is
No answer
Total
Users
(1)
i
100.0
96.93'1
100,0
3B.1
1.9
(1) The percentages shown in the body of the table are computed on the totalnumber of purchases of each species of fish.
Many users bought more than one species. Some establishments also boughta species prepared in two different ways. For example, haddock filletsand haddock steaks. This was courited as two purchases of the species.
Because purchases of many species were few in number, the species are notincluded in the table.
11

Table 6
SATISFACTION AND DISSATISFACTION
WITH qjALITY AND CONDITION
OF FROZEN PROCESSED FISH
Total
Total Users of Frozen ProcessedFish, November, 1958 (lltl)
Satisfied
Dissatisfied
No answer
Table 7
PACKAGE SIZES OF FROZEN PROCESSED FISH BOUGHT IN NOVEMBER, 1936 AND AVERAGE NUMBER OF SERVINGS PER POUND(l)
Total Purchasers of
Flounder Fillets
1 pound packages
5 pound packages10 pound packages
20 poxind packages
No answer
100.0
6.736.713.3
13.330.0
Total Purchasers ofMackerel Fillets
89.6

Table 8
SATISFACTION AMD DISSATISFACTION
WITH TYPES AND SIZES OF FROZEN
PROCESSED FISH PACKAGES
Total
Total Users of Frozen ProcessedFl sh, November, I958 ( 1I4-I
)
Satisfied
Dissatisfied
Don ' t know
No answer
100.0
88.5
1.2
9-5
Total

Table 10
FBOZEH PROCESSED SHELLFISH BOUGHT IN NOVEMBER, 1958
HOW PROCESSED BEFORE PURCHASE
Total
Total Users of FrozenProcessed Shellfish (103)
Total
ClamsRaw; clean
CrabsCookedBreadedCooked and breadedCooked and deviledCooked and shreddedBreaded rollsDeviled and stuffedCrab meat - shelled and debellied,
frozen and cannedRaw; whole, clean
LobsterCookedBreadedCooked and shredded tailsCleaned and deheaded tailsRaw; whole, clean
100.0*
6.0
3.01-51-51-5
• 5
1.
3-
5.
12.
3.0.5
.5
k.o11.0
OystersBreadedCannedRaw; clean, shelled
ScallopsBreadedRaw; clean, shelled
ShrimpCookedBreadedCooked and breadedDeheaded, raw in shells
Broken piecesRaw; clean, deheaded, shelled
and deveined
11.0
• 5
21.0
5-522.0
3.
2
1
2
33.5
Denotes that percentages might add to more than the total because of more than one reply to a question.
14

Table 11
QUANTITY or FROZEN PROCESSED SHELLFISH BOUGHT IH NOVEMBER, 1958
TotalPounds
Average Nujiber of PoundsAll
EstablishmentsUser
Establishments
ClamsRaw; clean
CrabsCookedBreadedCooked and breadedCooked and deviledCooked and shreddedBreaded rollsDeviled and stuffed
Crab meat - shelled and debellied,
frozen and cannedRaw; whole, clean
LobsterCookedBreadedCooked and shredded tails
Raw; whole, clean
OystersBreadedCannedRaw; clean, shelled
ScallopsBreadedRaw; clean, shelled
ShrimpCookedBreadedCooked and breadedDeheaded, raw in shells
Broken piecesRaw; clean, deheaded, shelled
and deveined
1,631
1,080

Table 12
SATISFACTION OR DISSATISFACTION WITH FREFREPARATION OF FROZEN PROCESSED SHELLFISH
Total Purchases of Crabs
TotalUsers
(1)
i
100.0
Prefer more prepreparation of crabsPrefer less prepreparation of crabsPrefer prepreparation as it is
Total Purchases of Lobster
Prefer more prepreparation of lobsterPrefer less prepreparation of lobsterPrefer prepreparation as it is
Total Purchases of Oysters
Prefer more prepreparation of oystersPrefer less prepreparation of oystersPrefer prepreparation as it Is
No answer
Total Purchases of Scan ops
Prefer more prepreparation of scallopsPrefer less prepreparation of scallopsPrefer prepreparation as it is
Total Purchases of Shrimp
Prefer more prepreparation of shrimpPrefer less prepreparation of shrimpPrefer prepreparation as it is
TotalI'l-e'-H
:i
:
jco.n
iC.O
5
99-5
93.96.2
(l) The percentages shown in the body of the table are computed on
the total number of purchases of each species of shellfish.
Many establishments bought more than one species. Some estab-
lishments also bought a species prepared in two different ways.
For example, shrimp breaded and shrimp cooked. This was
counted as two purchases of the species.
Because pxirchases of some species—clams, abalone, and others--
were few in number, the species are not included in the table.
16
Table 13
SATISFACTION AND DISSATISFACTION
WITH QUALITY AND CONDITIQW OF
FROZEN PROCESSED SHFLLFISH
Total Users of Frozen Processed
Shellfish, November, 19^8
Satisfied
Dissatisfied
No answer
Total
(103)
i
100.0
95.0
1.5
3-5

Table 14
PACKAGE SIZES OF FROZEN PROCESSED SHELLFISH BOUGHT IH NOVEMBER, 1958 AMP AVERAGE HTMBEB OF SERVIMGS PER POUMD(I)
Total Purchasers of Crabs Raw
1 pound packages2 pound packages
3 pound packages
5 pound packages12 pound packagesNo answer
Total
100.0
20.012.016.016.0h.O
32.0
Total Purchasers ofOysters - Raw
Packages less than 1 pound1 pound packages
3 pound packagesk pound packages
5 pound packagesNo answer
Total
100.0
Ik.
7.
?•
50.
7.
Ik.
Total Purchasers ofLobster - Raw
1 pound packages
5 pound packages8 pound packages
17 pound packages50 pound packages and overNo answer
100.0
k.

Table 14
(Contd.)
PACKAGE SIZES OF FROZEM PROCESSED SHELLFISH BOUGHT IN NOVEMBER, 1958 AND AVERAGE NUMBER OF SERVIMGS PER POUND(I)""
(Continued)
Total
Total Purchasers ofScallops - Raw
1 pound packages2 pound packages
5 pound packages
No answer
Total Purchasers ofShrimp - Breaded
1 pound packages2 pound packages
3 pound packagesh pound packages
5 poimd packages6 pound packages8 pound packages10 pound packages50 pound packages and over
100.0
U.I*6.8
77-24.6
100.0
3-75.6
25.016.6
37.95.6
.9
2.81-9
Total Purchasers of Shrimp - Raw
2 pound packages
3 pound packages
5 pound packages6 pound packages18 pound packages30 pound packages50 pound packages and over
No answer
Average number of servings
per pound
Total
i
100.0
7.43.0
71.6
1.5h.^
3-0
3.0
Average number of servings
per pound 2.5
(1) The table shows figures for those species and types of
prepreparation which occur most often in the city.
Sometimes figures are shown for package sizes but not
average number of servings per pound. In these cases
the data on servings per pound is limited.
The percentages in tl« body of the table are based on
the r.umber of establishments which bought one specie?:
of pbellFish, preprepared in one manner.
18

SATISFACTION AND DISSATISFACTION
WITH TYPES AND SIZES OF FR02>EN
PROCESSED SHELLFISH PACKAGES
Total Users of FrozenProcessed Shellfish
Satisfied
Dissatisfied
No answer
(103)
100.0
98.5
1.0
.5
Table 16
PERCEMTAgE OF FROZEB PROCESSED SHELLFISB SERVED FRIED, BROILED, BAKED, AKD IN OTHER WAYS

Table 17
TYPES OF PORTIONS BOUGHT IN NOVEMBER, 1958
According to Type of Establishment
Table 18
gJANTITY OF PORTIONS BOUGHT IK NOVEKBER, 19^8
Average Number of Pounds
Total Users of Portions
Cooked - breaded
Cooked - plain
Uncooked - breaded
Ifticooked - plain
Total

Table 19
AMOUMT OF PORTIONS BOUGHT BY ESTABLISHMENTS,
AS COMPARED TO THE PREVIOUS YEAR
According to Type of Establishment
Total Users of Portions
Use more now
Use about the same
Use less now
Don ' t know

Table 21
IS THE QUALITY OF PORTIONS BETTER THAN THAT OF OTHER
FROZEN PROCESSED FISH - FOR WHAT REASONS?
Total Users of Portions
Say portions betterFresherUniform controlled serving - always same amountEase of preparation - saves time, laborQualityJust like them better - brand I buy is betterAll othersDon't know - no answer
Portions poorerPoor quality - inferior quality, can't tell
what is in themAll others
About the same
Don't know
No answer
Total
(65)
i
100.0
22.6*
2.61.7
-9
.91*.3
h.3
5.2
2.62.6
62.6
8.7
.9
Table 22
ADVANTAGES OF USING PORTIONS
Total Users of Portions, November, 1958
Size of portions - uniform, controlledserving, the right size service
Convenience, ease of preparation - save labor,
already prepared
Economical - no waste
Fast, tiraesaving - quicker to serve, prepare
Can control food cost better - know profit
No bones
Taste better
Don't know, no answer
Total
(65)
i
100.0*
35.6
33-9
25.2
20.0
15.6
9-5
.8
.8
^Denotes that percentages might add to more than the total because of more than one reply to a question
22

Table 23
DISADVANTAGES OF USING PORTIONS
Total Users of Portions
Not economical - more expensive to buy
Portions wrong size - too small
Quality not as good - not always sure what'
in them
Not enough demand - customers do not order
No disadvantages
Don't know, no answer
Total
(65)
•k
100.0*
15-7
5.2
2.6
1-7
71.3
6.1
Table 24
DO ESTABLISHMENTS THINK CUSTOKEBS PREFER PORTIONS TO OTHER
FROZEN PROCESSED FISH - FOR WHAT REASONS?
Total Users of Portions
Think customers like portions betterUniform controlled servings - always the
same amountAttractive - eye appealingCustomers order - seem to like themFaster quicker to serve - no waitingNo bones - safer for childrenEconomicalDon't know - no answer
Think customers like portions less
Think customers like portions about the same
Don't know
No answer
Total
(65)
100.0
27.8*
13.07.8h.J,
2.62.61.7
1.7
2.6
1*9.6
16.5
3.5
'*Denotes that percentages might add to more than the total because of more than one reply to a question.
23

Table 25
AVERAGE WEIGHT OF PORTIONS AND AVERAGE NUMBER
OF SERVINGS PER PACKAGE
Total users of portions, Movember, 1958
Average weight of package of portions, in pounds
Average number of servings per package
Average veight of individual servings, in ounces
Average weight of individuax portions, in ounces
Note: Average weight of portions does not equal
average weight of individual servings sincesome operators obtained more than one serv-ing from a portion, while other operatorsused more than one portion for a serving.
65
7.6
32.6
3.7
5.1
24
Table 26
SATISFACTION WITH THF SIZE OF
PORTIONS IN A PACKAGE
Total Users of Portions
Satisfied
Dissatisfied
Don ' t know, no answer
Total
(65)
i
100.0
91.
h
1.7

Table 27
PERCENTAGE OF PORTIOMS SERVED FRIED. BROILED, BAKED, AM) IM OTHER WAYS
According to Type of Establishment
Total Users of Portions
Total
(65)
100.0
Average percentage served 61*.
T
PublicEatingPlaces Institutions
(33)
100.0
76.8
(32)
100.0
Establishments

Table 28
DO ESTABLISHMENTS COCK PORTIONS WHILE STILL FROZEN?
According to Type of Establishment
Total Users of Portions
Yes, cook while frozen
No, do not cook while frozen
No answer
Total

Table 30
HHEM ORDERING PORTIONS FROM SUPPLIERS, DO ESTABLBHMEMTS
SPECIFY THE KIKD OF FISH?
According to Type of Establishment
Total Users of Portions
Specify kind of fish
Do not specify kind of fish

Table 32
REASONS ESTABLISHMEHTS DID MOT B'Jt PORTIONS DURING NOVEMBEa, 1958
Total
Total Estatlisfcitients Usirig Pjczen Proccsj::
Sea Food, but Not Portion (115)
t
100.0*
WAS PRICE A REASON ESTABLISHMENTS
DID NOT BUY PORTIONS?
Too expensive - chet^per to use fresh firii. cheaper to
prepare ourselvesServe other typer - perch, shrimp, halibut, etc., other
types Ejore popularSell, serve little or no fish - no aemani, calli for it
Prefer to prepare own - rnther bread rr.y owe. do not liKe way
it nrust be cooked, prefer own methods
Size of portions - prefer to cut own portions, want, larger
portions, get more with other kindsQ-ality not as good - doesn't meet our quality st-ii^d-irds,
can't tell what is in it
Use fresh fish - prefer fresh fish
Dli^like flavor - fresh fish has more flavor, no taste
to portion controlled sea foods
Don't like them so wouldn't serve themJust opened the restaurant - don't know- what we will handle
Not attractive - not eye appealingNo particular reason - just didn't
Wanted to change menu - try something -different
Co-Tipany makes the rules - policy against it
Didn't know it was available
All others
Don't know, no answer
29.'*
25.917. e
11.7
10.7
7.66.6
3-02.51.51.51.01.0
• 5
.5
1.5
3.6
Total Non-.-cers Who Did
Not Volunteer
Prii^e aG a Reasor:
yes. pri'-^e was a reason
No, price rfM^ not & reason
No .answer
*
lOP. ."/
19.1-
66.9
13-7
Denotes that percentages might add to more than the total because of more than one reply to a question.
28

Table 33
TYPES OF SUPPLIER PROVIDING FROZEN PROCESSED SEA FOOD TO ESTABLISHMENTS
According to Sales Volume

Table 34
DISTANCE OF ESTABLISHMENT FROM MAIN SUPPLIER OF FROZEN PRCXIESSED SEA FOOD
According to Location
Total Users of Frozen
Processed Sea Food
Less than 10 miles
10 - 50 miles
51 - 100 miles
More than 100 miles
Don't know
No answer

Table 35
FREQUENCY OF DELIVERIES OF FROZEN PROCESSED SEA FOOD
According to Type of Establishment and Sales Volume
Total Users of FrozenProcessed Sea Food
Every day
2 - i* times per week
Once a week
2-3 times per month
Once a month
Less than once a month

Table 36
CAN SUPPLIERS OF FROZEN PROCESSED SEA FOOD IMPROVE SERVICES TO ESTABLISHMENTS?
According to Sales Volume
Total Users of FrozenProcessed Sea Food
Yes, can improve services
No, cannot improve services
Total

Table 37
AMOUMT SPENT FOR FROZEN PROCESSED SEA FOOD DURIMG PRECEDING TWELVE MOHTHS
According to Sales Volume
Total Users of FrozenProcessed Sea Food
Spent under $250$250 - 499$500 - 999$1,000 - 2,1+99
$2,500 - 4,999$5,000 - 9,999$10,000 - 14,999$15,000 - 29,999
$30,000 - 49,999$50,000 - 99,999$100,000 and over
Total

Table 38
FROFITABILITY TO ESTABLISHMEMTS OF FROZEN PROCESSED SEA FOOD AND OTHER HIGH PROTEIN FOODS
According to Sales Volume
Total Users of FrozenProcessed Sea Food
Say sea food more profitable than otherhigh protein foods
Say beef more profitable than sea food
Say all foods the same In profitability
Say pork more profitable than sea food
Say miscellaneous other foods moreprofitable than sea food
Nonprofit establishments
Don't know
No answer

Table 39
DO THE ESTABLISHMENTS KNOW THEY CM BUY GOVERJJMEMT
INSPECTED OR GRADED FROZEN PROCESSED SEA FOOD?
According to Type of Establishment
Total Users of FrozenProcessed Sea Food
Yes, know they can
No, do not know they can

Table 40
DO THE ESTABLISHMEHTS BUT GOVERNMEHT IWSPECTED OR
GRADED FROZEN PROCESSED SEA FOOD?
According to Type of Establishment
Total Establishments KnowingGovernment Inspected orGraded Frozen ProcessedSea Food Was Available
Yes, do buy
No, do not buy
Total
(153)
100.0
97-3
Public

Table 41
REASONS ESTABLISHMEMTS BUY GPyERNMENT IMSPECTED OR GRADED FROZEN PROCESSED SEA FOOD
According to Type of Establishment
Total Purchasers of Government
Inspected or Graded Sea Food
Government inspected foods are safe - pure,
fresh, clean, no germs or disease
Best quality - use better products, more
uniform qualityOnly type available - it ' s all inspected,
that ' s what supplier carries
Public demands it
Easy to handle - easy to serve, ready to
cook, portion controlled
More economicalCompany demands that it ' s bought
Prefer Government inspected - wouldn't
buy any other
All others
Don't know, no answer
Total

Table 42Table 43
HAS GOVERNMEMT IMSPECTION AFFECTED THF AMOUHT OF FROZEN
PROCESSED SEA FOOD BOUGHT 3Y THE ESTAELI3HMEWT?
According to Type of Establishment
IF GOVERNMENT INSPECTED OR GRADED FROZEN
PROCESSED SEA FOOD WERE AVAILABLE WOULD
THE ESTABLISHMENT BUY MORE OR LESS?
Total Users of GovernmentInspected Frozen
Processed Sea Food
Buy more
Buy about the same
Buy less
Don't know
No answer
Total

Table 44
PREVIOUS USE OF FROZEN PROCESSED SEA FOOD BY HONUSEBS AND
REASONS FOR STOPPING USE OR FOR NEVER USING
Total Honusers of Frozen Processed Sea Food
Total
(63)
100.0
Have served frozen processed sea food before
No demand - didn't sell enough, no volume, customersprefer other foods
Lacked flavor - own prepared fish has better flavor
k.2
i^h
Have not served frozen processed sea food before
Sell little or no fish - no demand, call for it, notin that business
No storage facilities - no freezerUse fresh fish - prefer to serve fresh fish, fresh
fish available all yearUnable to handle preparation - no equipment, not
enough room, no time, would need extra helpLike taste, freshness of fresh fish - don't trust
frozen food, fresh fish tastes better, some frozenis kept too long
Don ' t know, no answer
93.3*
61*.
7
16.0
8,4
6.7
5.01.7
Don ' t know 2.5
*Denotes that percentages might add to more than the total because of more than one reply to a question.
39

Table 45
DO ESTftBUSKMEOTS HAVE COU STORAGE FACILITIES FOR KESPIN3 FROZEK PRXE3SED SEA FCCC-?
According to Type of Estatlishmerit and Sales Volume
Total Establishments
Yes, have cold storage facilities
Nc, do not have cold storage facilities
No answer
Total
(2!*3/
100 -C
83-3
l6.£
Tyoe of

Table 46
DO ESTABLISHMENTS HAVE COLD STORAGE FACILITIES FOR KEEPING FROZEN PROCESSED SEA FOOD?
According to Nonusers of Sea Food and Users Not Using Frozen Processed Sea Food
Total

DISTRIBUTION OF SAMPLE
(Tables a through i contain classification data regarding operations of the establishments)
Table a
TOTAL RECEIPTS FROK MEAL^ SERV'Er) D3IHG IPT OH LAST FI3CAI YEAf.
According to I'ype of Establisiiaienl
TotaJ EstafcllsnaectT
Total Receipts
Less tnar. $1C,00C
$10,00C - 39,999
$^C,OOC - 99,999
$10C,00C and over

Table b
AMOUNT ESTABLISHMEMTS SPEMT FOB FOOD DURING PREVIOUS TWELVE MONTHS
According to Type of Establishment and Sales Volume
Total Establishments
Spent iinder $1,000$1,000 - 2,1+99
$2,500 - 4,999$5,000 - 9,999$10,000 - iij-,999
$15,000 - 29,999$30,000 - U9,999
$50,000 - 99,999$100,000 - 2^9,999$250,000 and over

Table c
PERCKMTAGE OF TOTAL OPERATIHG COST SPEKT FOR FOOD IH PREVIOUS TWEI.VE MOUTHS
According to Type of Establishment and Sales Volume

Table d
AVERAGE NUMBEK OF MEALS SERVED B'l! ESTABLISHMENTS
According to Type of Establishmenr, and Sales Vc.lume
Total
Type of EstablishmentPublicEatingPlaces Institutions
Sales VolumeLess

Table e
AVERAGE PRICE PER MEAL SERVED
According to Type of Establishment and Sales Volume
Total Establishments
Under $.25$.25 - .k9
$.50 - .7k
$.75 - .99
$1.00 - 1.49$1.50 - 1.99$2.00 - 2.49$2.50 - 2.99
$3-00 - 3.99$4.00 - 4.99$5 . 00 and over
No answer
Nonprofit establishment

Table f
NUMBER OF REGULAR EMPLOYEES ENGAGED IN PREPARING AND SERVING FOOD
According to Sales Volume
Total establishments
Average number per establishment
Total
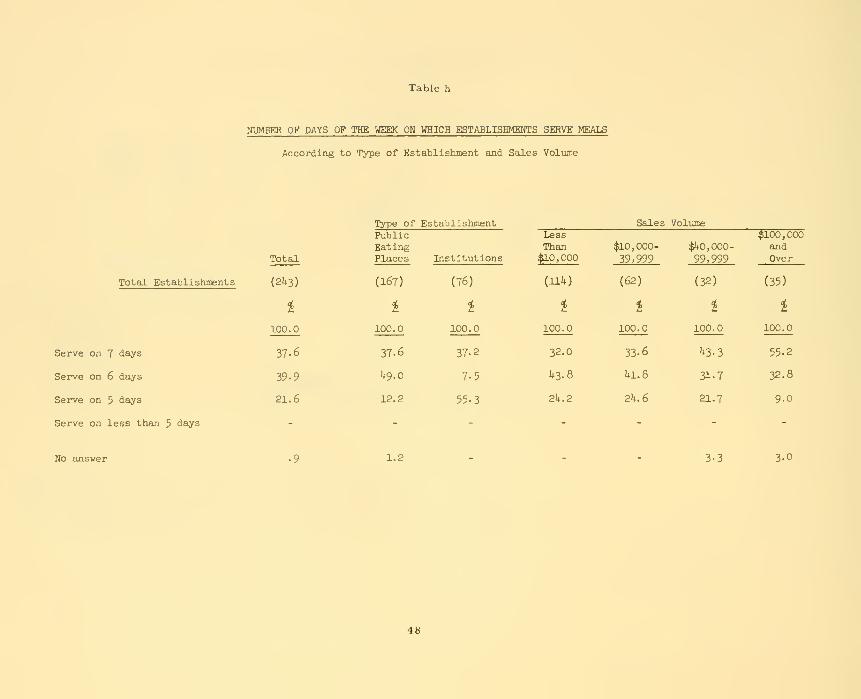
Table h
NUMBER OF DAYS OF THE WEEK OH WHICH ESTABLISHMEHTS SERVE MEALS
According to Type of Establishment and Sales Volume
Total Establishments
Serve on 7 days
Serve on 6 days
Serve on 5 days
Serve on less than 5 days

Table i
PERCEHTAGE OF ESTABLISHMENTS SERVING SPECIALIZED TYPES OF FOOD
According to Sales Volume
Total Establishments
Establishments with no specialty
Total


(