frost growth and densification in laminar flow over flat
TRANSCRIPT
Frost growth and densification in laminar flow over flat surfaces
Max Kandula
Abstract
ASRC Aerospace, John F. Kennedy Space Center, FL 32899, USA
E-mail address: [email protected]
One-dimensional frost growth and densification in laminar flow over flat surfaces has
been theoretically investigated. Improved representations of frost density and effective
thermal conductivity applicable to a wide range of frost circumstances have been
incorporated. The validity of the proposed model considering heat and mass diffusion in the
frost layer is tested by a comparison of the predictions with data from various investigators
for frost parameters including frost thickness, frost surface temperature, frost density and
heat flux. The test conditions cover a range of wall temperature, air humidity ratio, air
velocity, and air temperature, and the effect of these variables on the frost parameters has
been exemplified. Satisfactory agreement is achieved between the model predictions and the
various test data considered. The prevailing uncertainties concerning the role air velocity and
air temperature on frost development have been elucidated. It is concluded that that for flat
surfaces increases in air velocity have no appreciable effect on frost thickness but contribute
to significant frost densification, while increase in air temperatures results in a slight increase
the frost thickness and appreciable frost densification.
Nomenclature
h plate thickness (m)
c p specific heat (kJ/kg K)
D mass diffusion coefficient (m2/s)
h( convective heat transfer coefficient (W/m2 K)
hm convective mass transfer coefficient (kg/m2 s)
k thermal conductivity (W/m K)
k"de effective thermal conductivity of air with mass diffusion and eddy convection (W/m K)
k f effective thermal conductivity of frost (W/m K)
L plate length (m)
Lsv latent heat of sublimation (kJ/kg)
M molecular weight (kg/mol)
Nu Nusselt number, heL I k
p pressure (Pa)
Pv partial pressure of water vapor at temperature T (Pa)
Pvo partial pressure of water vapor at temperature To (Pa)
Pr Prandtl number
q heat flux (WI m2)
R universal gas constant (kJlkmol K)
Ra gas constant for air (kJ/kg K)
Rv gas constant for water vapor (kJ/kg K)
T temperature (K)
Tf frost temperature (K)
Ta;) freestream temperature (K)
u", freestream velocity (m/s)
W plate width (m)
x coordinate nomlal to the plate, i.e. along the frost thickness (m)
2

Greek Symbols
¢ relative humidity (%)
!If porosity (void fraction)
v kinematic viscosity (m2/s)
P f frost density (kg/mJ)
OJ humidity ratio of moist air, kg (water vapor)/kg(dry air) or kgv/kga
X solids (ice) fraction
Subscripts
o reference
continuous medium (stagnant gas)
2 solid particle (dispersed)
00 ambient (freestream)
a dry air
c eddy convection, critical
d diffusion
e effective medium
J frost
m melting
s frost surface
total (ambient)
v water vapor
1. Introduction
Frost formation represents an important consideration in cryogenics, refrigeration,
aerospace, meteorology and various process industries. Processes involving simultaneous
heat transfer and frost formation are occasioned in gas coolers, refrigerators, regenerators,
freeze-out purification of gases, cryopumping, and the storage of cryogenic liquids.
In reality, frost offers significant thermal resistance to heat transport in heat exchangers,
and increases the pressure drop in channels by flow restriction. Frost/icing on aircraft wings
3

causes significant aerodynamic penalties in lift and drag, leading to a decrease in lift and an
increase in drag. Frost/ice formation on cold fuel/oxidizer tanks and other components may
cause debris concerns when it is shed on critical components of launch vehicles. These
applications call for an accurate prediction of frost growth, frost density, frost surface
temperature, and total heat flux. A fundamental understanding of the nature of frost
formation and simultaneous heat and mass transfer during frost growth is thus of great
practical importance.
Frost forms when moist (humid) air comes in contact with a cold surface whose
temperature is less than the freezing temperature of water (273 K), and is less than the dew
point temperature, so that water vapor directly passes from a gaseous state to a solid state. A
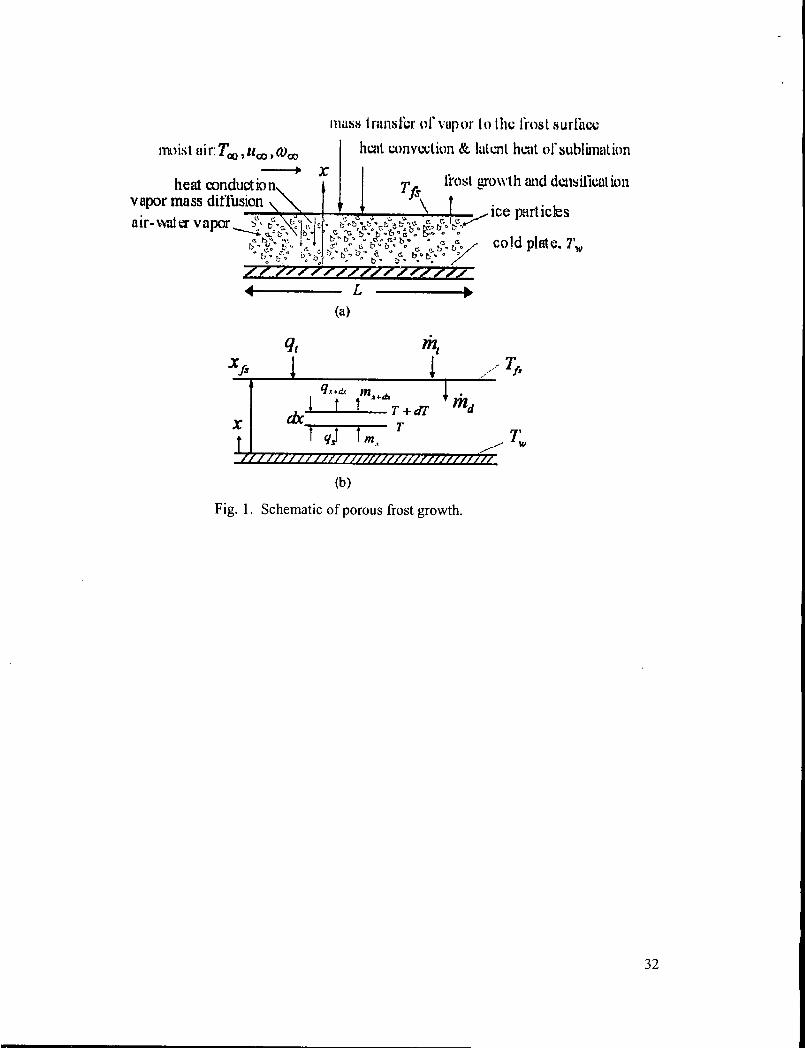
schematic of the frost layer is shown in Fig. 1. During frost formation, a portion of the total
mass flux of water vapor diffuses through the frost layer, and undergoes phase transformation
to ice which deposits on the existing frost crystals, resulting in frost densification (Jones and
Parker [1]; Na and Webb [2]). The remainder of vapor mass flux freezes at the frost surface,
and serves to increase the frost thickness. A review of frost formation in simple geometries
(flat plates, parallel plates, cylinders, and annuli) was provided by O'Neal and Tree [3].
Experimental studies for frost formation on flat surfaces were published by various
investigators; see Jones and Parker [1], Yonko and Sepsy [4], Ostin and Anderson [5], Lee et
al. [6,7], Cheng and Wu [8], Hermes et al. [9] among others. These studies' suggest that
during frost formation, frost thickness, frost surface temperature, frost density, and frost
thermal conductivity all increase continuously. Both the density and the thermal
conductivity are found to increase by an order of magnitude. As the frost layer thickens, the
insulating effect of the frost layer predominates resulting in an increased thermal resistance
of the frost layer and a decrease in heat transfer rate (Sherif et al. [10]). Measurements also
reveal that the frost growth, densification and heat flux depend on a number of parameters
such as frost density, frost surface temperature, plate surface temperature, and environmental
parameters (air humidity (tJoo, air velocity U"', air temperature Too, etc.). Experiments by
Ostin and Anderson [5] and others suggest that the frost growth depends strongly on the cold
plate temperature and the air humidity.
A number of theoretical models for frost formation on flat surfaces have been proposed
for frost fornlation on flat surfaces. Notable among these models include those of Brian et al.
4

[11,12], Jones and Parker [1], Sami and Duong [13], Sherifet a1. [10], Tao et al. [14], Sahin
[15], Le Gall et al. [16], Lee et al. [6], Cheng and Cheng [17], Na and Webb [2], Hermes et
al. [9]. These models differ primarily in the treatment of frost density and thermal
conductivity correlations and/or models and of mass diffusion within the frost layer. A
comprehensive review of various theoretical models is provided by Tao et a1. [14].
Notwithstanding the appearance of a large number of articles on frost growth
measurements and modeling, there exist some inconsistencies and uncertainties primarily
with regard to the role of air velocity and air temperature on frost growth and densification.
Yonko and Sepsy [4] report that for flat surfaces even though increasing air velocity has no
appreciable effect on frost thickness, the frost density is considerably increased. Data by Lee
et a1. [6] for flat plates suggest that increasing air velocity slightly increases the frost
thickness, but changes the frost surface temperature (and thus frost density) appreciably.
Measurements by Shah [18] on a circular plate indicate that higher Reynolds numbers and/or
higher gas temperatures yield higher frost density and a decrease in frost thickness (Sami and
Duong [13]). Data by Cheng and Wu [8] for flat plates indicate that increases in air velocity
or air temperature resulted in little change in frost thickness but produced a denser frost layer
on the basis of photographic (visual) examination.
In view of the aforementioned uncertainties in frost fom1ation, it is evident that a more
detailed understanding of the effects of frost parameters on the frost growth and
densification is requisite. It is the purpose of this work to further clarify the role of air
velocity and air temperature on the frost growth and densification processes. This objective is
carried out with the aid of a one-dimensional theoretical model proposed to predict the frost
growth and densification in laminar flow over flat surfaces. Improved fom1ulations for frost
density and frost conductivity valid for a wide range of conditions are incorporated. The
validity of the proposed model will be assessed by comparison with measurements frost
parameters includingFost growth, Fost slllface temperature, Fost density and Fost heat jIux
as reported by various investigators covering a range of test conditions including cold plate
temperature, air humidity. air velocity and air temperature.
5
2. Proposed Model
In the present work, we propose a one-dimensional model for frost growth and
densification along the lines of Jones and Parker [1] and Cheng and Cheng [17]. Improved
formulations of frost density and thermal conductivity, applicable for a wide range of frost
circumstances, are incorporated, and this marks an important difference between the present
model and those of other investigators.
2.1. Physical Assumptions
The following physical assumptions are made in the present analysis:
(i) Heat and mass diffusion within the frost layer are assumed quasi-steady and one
dimensional.
(ii) The frost layer grows in a direction normal to the cold plate surface with uniform frost
thickness along the plate length.
(iii) Frost density and thermal conductivity are independent of frost thickness, and represent
values averaged over the frost layer thickness. Thus at any instant, they are thus assumed
uniform within the frost layer. Measurements by Brian et al. [12] suggest that at any instant
during frost growth density variations within the frost layer are not significant.
(iv) The air pressure is uniform in the airstream and within the frost layer. Hermes et al. [9].
(v) The Lewis analogy for heat and mass transfer is applicable, and Lewis number of unity is
considered. Measurements and analysis by Lee et al. [6] indicate that Lewis number
increases with air velocity and air humidity, and is in the range of 0.7 to 1.0.
(vi) Both the heat and mass transfer coefficients at the frost surface are considered constant.
(vii) The gas spaces in the frost layer are small enough that heat transfer by natural
convection within the frost layer is negligible (Woodside [19]). Thermal radiation within the
frost layer is negligible, considering that the frost temperatures are low (Dietenberger [20]).
(viii) The total gas pressure is constant within the frost layer, and is equal to the atmospheric
pressure (Le Gall et al. [16)).
(ix) Soret and Dufour effects are negligible (Le Gall et al. [16]).
(x) The local humidity of air in the frost layer corresponds to saturation humidity at that
temperature (thermodynamic equilibrium).
6
(xi) It is also assumed that at the frost surface the water vapor is saturated. Strictly speaking
this assumption is somewhat tenuous, although many frost growth models consider this
assumption. Detailed investigations by Na and Webb [2] indicate that water vapor is
generally supersaturated at the frost surface rather than saturated, leading to appreciable
overprediction of the mass transfer rate of water vapor onto the frost surface. The
supersaturation degree (measure of departure of the actual water vapor pressure at the frost
surface to the saturated water vapor pressure at the frost surface) is strongly dependent on the
surface energy, which is a function of the surface coating governing the contact angle. In
view of the absence of such information in reported experimental data, we follow for the
present purposes the simplifying assumption of saturated vapor condition at the surface.
2.2. Frost Density and Effective Thermal Conductivity
The prediction of frost growth requires information concerning the average frost density
and effective frost thermal conductivity, both of which depend on the porosity of the frost
layer. The frost porosity If! is directly related to the frost density P f by the relation
If! = (I - P f / Pice )/(1 - P g / Pice) (Ia)
where Pice is the density of ice (usually taken as 917 kglm\ and Pg the density of air-vapor
mixture. The porosity is related to the solids (ice) fraction X by the relation
(1 b)
A detailed review of frost density and thermal conductivity correlations (and their range
of applicability) is provided by Tao et al. [14]. O'Neal and Tree [3], Shin et al. [21], and
Yang and Lee [22] presented a comprehensive list of the correlations for the effective
thermal conductivity of frost.
2.2.1. Frost Density
Recently, the author [23] reviewed the existing data and correlations for frost density, and
proposed a new and improved correlation in terms of dimensionless frost surface temperature
and flow Reynolds number for application to laminar forced flow over flat surfaces. This
correlation is based on simultaneous measurements of frost density and frost surface
temperature and is shown to be valid over a broad range of frost density, and is expressed 1;>y
7
!l = 0.58exp{ - [0.376 + 1.5(1- 8)](1- ~o,)} Pice
(2a)
where
~ = Re/Re r (2b)
In the preceding equation, 8 is the dimensionless frost surface temperature, and Rec is
the critical Reynolds number for laminar-turbulent transition. The Reynolds number is
defined by
Re = u",L/v (2c)
where L is the characteristic plate length, u'" is the air velocity, and v'" is the kinematic
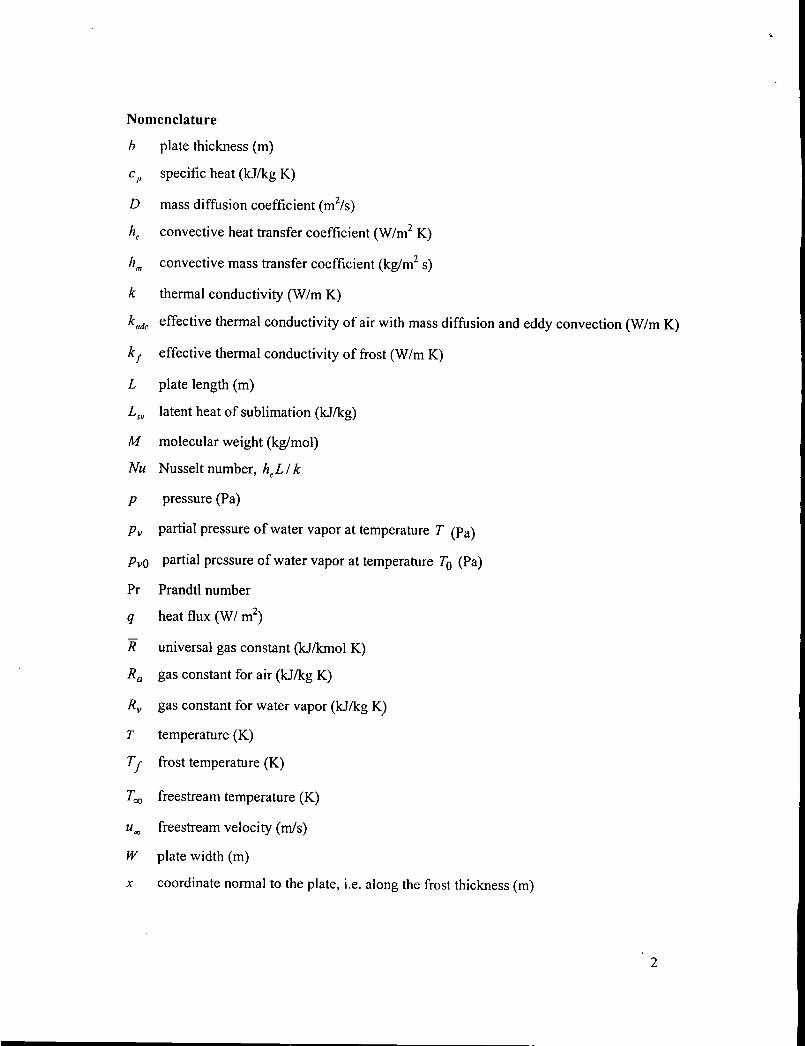
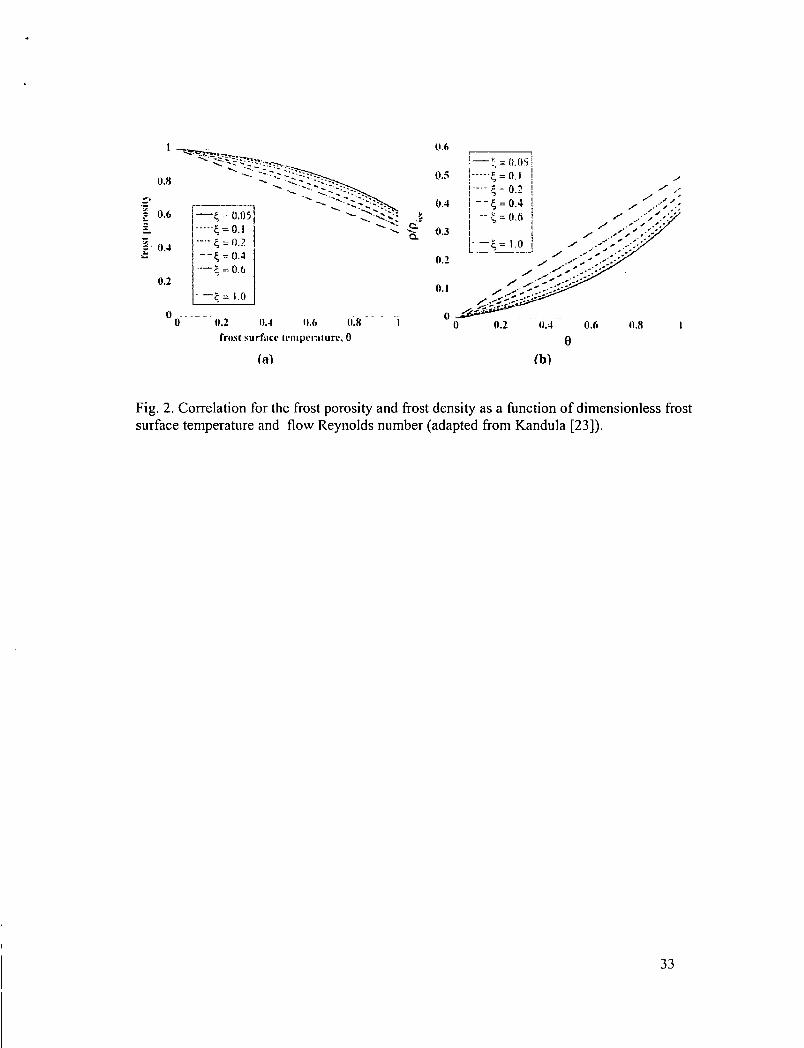
viscosity of the air. Fig. 2 (adapted from [23]), displays the variation of frost porosity and
density as a function of dimensionless frost surface temperature with Reynolds number as a
parameter. This model was validated over the full range of frost surface temperature. Note
that the widely used correlation of Hayashi et al. [24] expresses frost density dependent on
frost surface temperature only, and is known to considerably overpredict the frost density at
relatively high frost surface temperatures close to the melting temperature [14].
2.2.2. Effective Frost Thermal Conductivity
The effective thermal conductivity of frost k f is obtained from the work of the author
[25] on the basis of a porous packed bed model of Zehner-Schlunder [26] considering a unit
cell approach and one-dimensional heat flow (see Hsu et al. [27], Cheng and Hsu [28]):
~ = 1- ~1 -/If + 2~ [ (I -()~ In(-I ) -(B + I) - B-1 1 katie 1-91 (1-91)- t;B 2 I-t;B
(3a)
where
(3b)
In the preceding equations, katie denotes the effective (stagnant) thermal conductivity of
entrapped air considering mass diffusion and eddy convection. The shape factor B is related
to the porosity /If (defined by Eq. 1) by the relation
B ~ C[{I -/If )/ /If 1m (3c)
8

with m = 10/9. The constant C is taken as 2.5 for cylindrical particles (Zehner-Schlunder
[26]), which were found to represent frost structure and resulting frost them1al conductivity
satisfactorily [25). A detailed comparison of Zehner-Schlunder model with data (for spherical
particles) for ice to air thermal conductivity ratio ranging from 8 to 1200 and for various
values of solids fraction was recently presented by the author [29).
In the presence of mass diffusion and eddy convection, the effective thermal conductivity
of air kw'c is expressed as (Kandula [25])
(3d)
where k" is the molecular thermal conductivity of air, kd is the contribution of mass diffusion
to the effective thermal conductivity of air, and kc denotes the contribution of eddy
convection to the effective conductivity of air.
The mass diffusion contribution k" Eq. (4) is obtained as [25]
(3e)
In the preceding equation, D is the mass diffusivity of water vapor, Lsv is the latent heat of
sublimation, M a ,M f denote the molecular weights of air and water vapor respectively, Pvo
is the partial pressure of water vapor at reference temperature To, Rv is the gas constant for
water vapor, and TJ
is the frost temperature.
The effect of eddy convection [30] prevalent in the air pockets is shown to be
satisfactorily represented by the condition [25]
(3f)
From a more fundamental consideration the effects of eddy convection are intimately
related to the phenomenon oJtlzermal dispersion (see Cheng and Vortmeyer [31]; Hsu and
Cheng [32]). Convection in variable porosity media, including channeling effects, were
considered by Vafai [33).
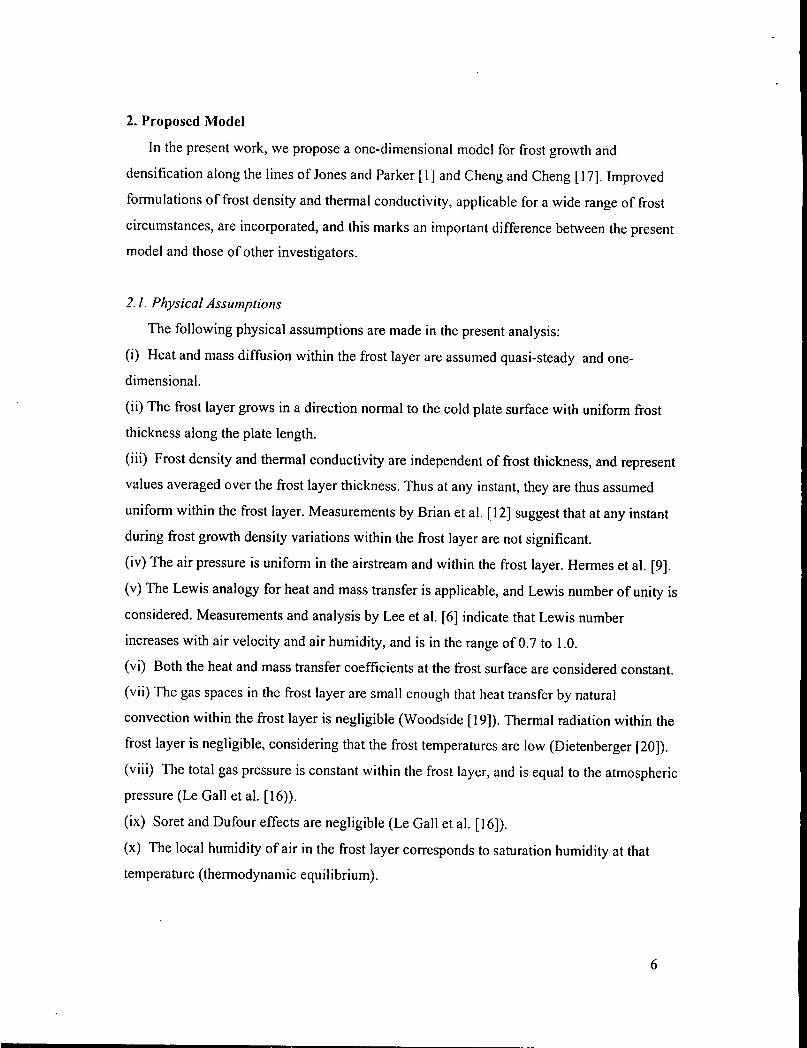
Thus the effective thermal conductivity of frost is obtained from Egs. (3a-3f). Fig. 3
(adapted from [25]) shows a comparison of the predicted thermal conductivity with the well
established correlations of Sturm et a!. [34], Van Dusen [35], and Ostin and Anderson [5].
More detailed comparisons of the predicted thermal conductivity with the measurements of
9
Pitman and Zuckerman [36], Brian et al. [36] and others at various temperatures are
presented in the author's work [25].
2.3. Governing Equations and Boundary Conditions
2.3.1. Governing Equations
An energy balance for an elemental frost thickness in the interior of the frost layer
(considering latent heat transport from the water vapor) can be expressed as [1], see Fig. 1):
k d2r = L dln x
j dx 2 sv dx
where Iii., stands for the local mass flux of water vapor in the x direction (normal to the
plate). The quantity lilx is given by the mass diffusion equation
. Ddpv m =- --.r dx
where PI' stands for the local density of water vapor in the frost layer, so that
drilx _ D d2 PI'
dx - - ---;L;2
2.3.2. Boundary and Initial Conditions
a. Mass Flux at the Frost Surface
(4a)
(4b)
(4c)
The total mass flux of water vapor transferred from moist air to the frost surface can be
written as
ril, = lIm (W" - Ws ) (5a)
where lIm denotes the convective mass transfer coefficient. The quantities WtI
' Ws are
respectively the humidity ratios in the atmospheric air and at the frost surface. Eq. (5a) can be
recast as (Jones and Parker [1])
. d ( ) dxs dpj . . m, =- xsPj =Pj-+xs--=me+m"
dl dt dt (5b)
(5c)
Eq. (5b) physically implies that a portion of the total mass flux of water vapor is diffused into
the existing frost layer before it freezes, and serves to increase the frost density. The
10
remainder of this vapor is transported to the frost surface and freezes at the frost surface, and
serves to increases the frost layer thickness (Jones and Parker [1); Na and Webb [2]).
b. Heat Flux at the Frost Surface
The total heat(energy) transferred from the air to the frost surface is comprised of two
components: sensible heat transfer (by convection) by virtue of the temperature difference,
and the latent heat of sublimation due to humidity difference. Mathematically,
where
qsen = he (T" - Tfs ~
In the preceding equation, ril, is given by Eq. (5b), and he is the convective heat transfer
coefficient. Eq. (6a) can be recast as
-[I (T -T)+ L dxs ] L dPf q, - Ie /I s P f sv dt + Xs sv dt
(6a)
(6b)
(6c)
The quantity in the parenthesis represents the energy crossing the frost surface by conduction
(Cheng and Cheng [17), so that
qcond = -kf ( ::J. = -[he (TI/ - TJ+ PfLsv (:: ]
c. Temperature Boundary Conditions at the Wall and the Frost Surface
The boundary temperatures are prescribed as
T=T w X=O
x = Xs
d. Initial Condition
(6d)
(7a)
(7b)
The initial condition is specified by the requirement that the frost thickness is zero. Thus
Xs = 0 t=O (8)
2.4. Temperature Distribution ill the Frost Layer
By virtue of the assumption that the frost density remains uniform across the frost layer
thickness, the amount of water vapor being frozen in the interior must be the same at all
locations in the frost layer (Jones and Parker [I]). Consequently, Eq. (4c) becomes
I I
dm In, _:C=_' d'( Xs
Thus Eq. (4a) governing the temperature field is expressed by
k {fT =-L (m,,] I /x2 sv
{, Xs
(9)
(14)
Substituting for lil d from Eq. (5c), and integrating twice with the appropriate boundary
conditions (Eqs. 6d, 7a and 7b), we finally arrive at the temperature distribution in the frost
layer as follows:
(lla)
C1 = ~sv [/dI:, - TJ+ hJllJ" -llJ.)] I
(llb)
Lsv [h ( ) dXs] C, =--- llJ -llJ -P -- k mas Idt
IXs (llc)
The temperature at the frost surface corresponding to x = x s can at once be obtained from
Eq. (lla) as follows (Cheng and Cheng [17]):
T, = 1>[:~ },(I;, ~ T,)+H \~" )[ h.(w. ~,",)+ PI ~' ]
2.5. Frost Layer Growth Rate
From Eqs. (5a) and (5b), the frost layer growth rate is obtained as
dx dPI II ({O -llJ )=P _s +x -
m (I s I dt s dt
On the basis of the correlation for the frost density (Eq. 2), we have
PI/Pice = O.SOexp«c1 + C2 (1- 0)](1- qO'S)}
Thus
dPI = dPI dO dTfs dxs dt dO dTls {irs dt
Performing the differentiation and rearranging, we finally obtain that
(12)
(J3a)
(l3b)
(l3c)
12
{h; , = _---:-____ 11="'..:..( w--",-' _-_w-=.s..:-.) ____ ---,-
dt { [( 0.5 ) 1] 1 dTJs } p( l+x, c2 I-c; +- ( )-. e T -T dx '" \\' S
(J3d)
2.6. Heat and Mass Transfer Coefficients
The convective heat transfer coefficient he for laminar force flow over a flat plate is
determined from the well-known correlation (Kays and Crawford [37])
Nu = O.664Re 1/2 Pr l/3
where the Nusselt number Nu and the Prandtl number Pr are defined by
(14a)
(l4b)
and k refers to the thermal conductivity of air The fluid properties for the boundary layer are
evaluated at the average film temperature.
The convective mass transfer coefficient 11m is obtained on the basis of Chilton-Colburn
analogy between heat and mass transfer (Eckert and Drake [38]), which is found to be
applicable under frosting conditions (O'Neal and Tree [5]):
Sh Le213 = Nu
where the Sherwood number Sh and the Lewis number Le are defined by
Sh = hmL / D, Le = a / D = Prj Sc
(l5a)
(I5b)
In the preceding equation, a = k / pcp represents the thermal diffusivity, Sc = D / v is the
Schmidt number, and c p is the specific heat of moist air. Consequently we have
11m = he /(pcpLe 2/3)
with specific heat of moist air quantity c p determined from the mixture relation
C p = C P" + {O" C 1".
A value of Le = I is considered in the present analysis.
( ISc)
(ISd)
13
2.7. Thermophysical Properties
The thennal conductivity of air is calculated as (Rohsenow and Hartnett [42];
Dietenberger [20])
[
TI/2 ] W k. = 2.646xlO- 13
) --air I + (2451 T 10121T m.K ( 16)
where T is in degrees Kelvin. The thennal conductivity of ice is obtained from the relation
(Dillard and Timmerhaus [43]; also Dietenberger [20])
kice = 6301 T W/(m.K)
where T is the absolute temperature (degrees K).
The mass diffusivity is determined from (Pruppachar and Eklett [39]) as
D = 2.11xl0-s(Tj
I TO)1.94 mlls
where T f is the frost temperature in degrees Kelvin, and To the reference temperature
(273.15 K).
The latent heat of sublimation of ice is determined from (Mago et al. [40])
Lfv = {-O.1083[1.8(T-273.16)+32]+2833} kJ/kg
where T is in degrees Kelvin.
(17)
(18)
( 19)
The humidity ratio of air at the frost surface (Os is determined from (Kays and Crawford
[37]):
(Os = 0.622pvs I(p, - P,.s) (20)
where p, is the total pressure in atm, Pvs is the saturation vapor pressure corresponding to the
frost surface temperature Tfs' The vapor pressure P"s is evaluated from standard curve-fits
(Mago et al. [40]; Flatau [41]).
3. Numerical Solution
The frost growth and frost surface temperature are obtained by numerically integrating
Eq. (l3d) in conjunction with Eqs. (6), (12) and (l3b), considering the initial condition
expressed by Eq. (8 ). The equation for the frost surface temperature is implicit. Initially a
frost surface temperature at t + ill is guessed, and a bisection method is used to iterate for the
frost surface temperature. A time step of ill = 0.1 sec is chosen. For stability of computation,
14
a very small value of Xs = 10-5 m is considered. The calculation is tenninated when the frost
surface reaches the melting temperature. From the calculated first surface temperature, the
frost density is evaluated with the aid ofEq. (2). The heat flux values (sensible, latent and
total) are subsequently obtained from Eq. (6a) and (6b).
The numerical solution is found to be robust over a wide range of test parameters
considered in the present investigation.
4. Results and Comparison
The validity of the proposed model is tested by a comparison of the predictions of frost
properties with test data from various investigators comprising a range of frost conditions
(cold plate temperature, ambient air humidity, air velocity, and air temperature). All the test
data chosen for comparison correspond to the geometry offlat surfaces. Although frost
thickness is measured in every test data, only certain data sets contain frost surface
temperature, frost density, and heat flux. Note that accurate frost surface temperature
measurement is relatively difficult. In all the comparisons, a value of Re c ::::: 105 appearing in
the frost density correlation, Eq. (2), has been considered for the model predictions [23].
4.1. Comparison with Data ofYonko and Sepsy [4J
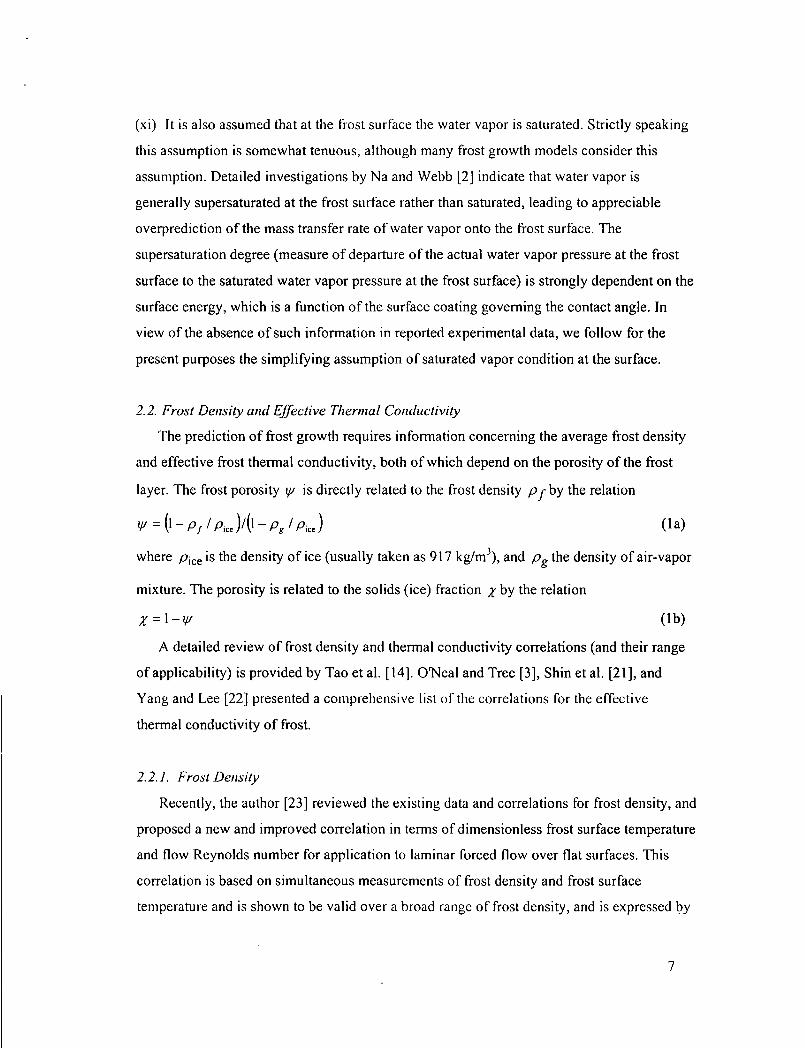
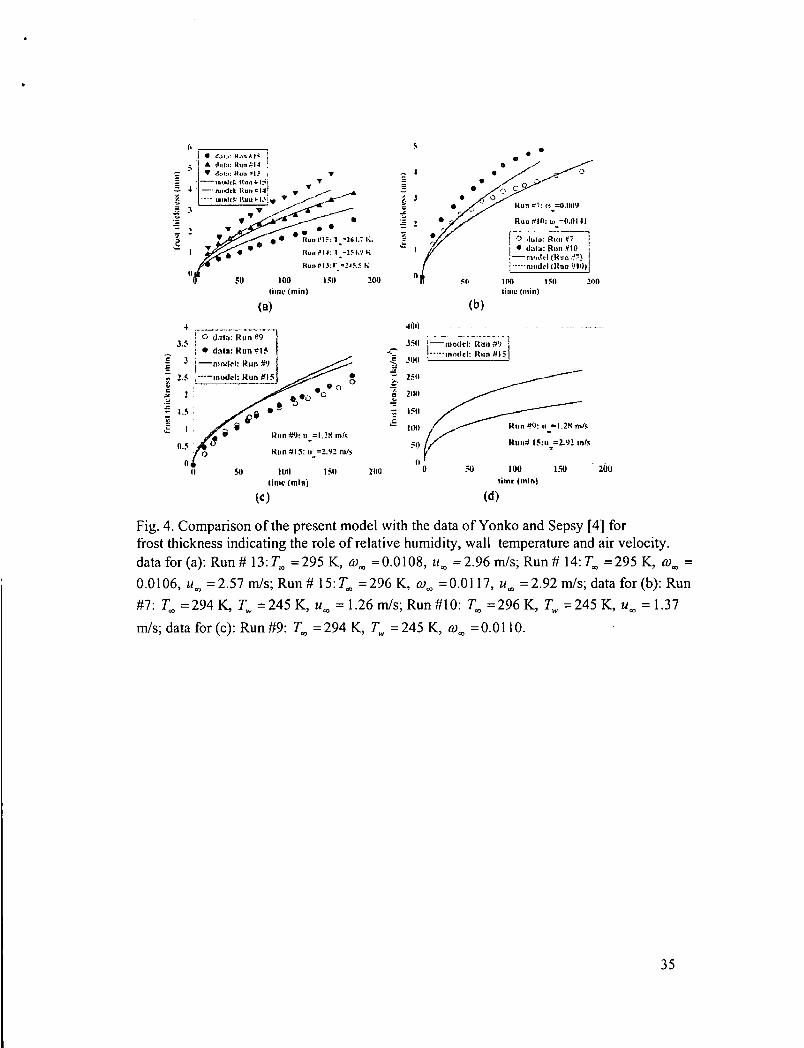
Figure 4a-4c displays a comparison of model predictions for frost thickness with the
experimental data ofYonko and Sepsy [4] on an aluminum plate. The test plate dimensions
are L = 0.3398 m, W = 0.1905 m, and b =0.0222 m. The frost thickness is measured to
within 0.13 mm with the aid of a micrometer working against a spring-loaded cross-slide.
UncertainLy in the measured frost thickness is about 0.13 111111. These data represent one of
the early measurements on frost fonnation, and have been very widely considered in the
comparison of many theoretical models of frost growth. No data on frost surface temperature,
frost density and heat flux were reported.
Figure 4a illustrates the comparison of frost growth for changing wall temperatures.
Three sets of data are considered here: Run #13: TO') = 295.1 K, Tw = 245.5 K, 1I", = 2.96 mis,
w", =0.0108 kgJkga (¢.,. = 65.8%); Run #14: Too =294.9 K, T". = 254.9 K, u'" = 2.57 mis,
(v", =0.0I06kgJkga (¢r. =64.4%); Run#15T", =295.8 K, T". =264.7 K, ulfJ =2.92 mis,
15

W", =0.0117 kgJkga (q)", =66.7%). The duration of the test is 150 min for Run #13, and 175
min for Runs # 14 and 15. Both the data and the model exhibit a monotonic increase in frost
thickness and a decrease in frost growth rate with elapsed time. The relatively high frost
growth rate is attributed to a thinner frost layer endowed with a lower thermal resistance. The
model describes the experimental trend that the frost thickness increases as the wall
temperature decreases as a consequence of increased heat transfer rate. The data suggest that
at 150 min, the frost thickness is nearly doubled (I I 0%) as the wall temperature increases by
20 OK from 246 K to 265 K, as remarked by Yonko and Sepsy [4]. For TIV = 255 K, excellent
agreement is achieved between the theory and the data for the entire duration. However there
is some overprediction at TIV = 265 K and underprediction at T". = 245 K. It is believed that
uncertainties in the frost density model in the crystal growth period (where the frost density
is low) could lead to errors in the predicted frost thickness, even though the growth rates in
the DBG (Densification and Bulk Growth) period are satisfactorily predicted. The predicted
frost surface temperature and frost density are found to increase with an increase in wall
temperature, as is to be expected.
Figure 4b shows a comparison of the model with measurements to reflect the effect of
relative humidity. Two sets of data are considered here: Run #7: Too = 294 K, Tw = 245 K,
Uoo = 1.26 mis, Woo =0.009 kgv/kga (q)", = 55.2%); Run #10: Too =296 K, Tw = 245 K, uOO =
1.37 mis, Woo =0.0141 kgv/kga (q)", = 78.1%). The test duration for Run #7 is 200 min, and
that for Run #10 is 140 min. The model is shown to describe the experimental trend of
increasing frost thickness with increasing humidity ratio as a result of increased mass transfer
rate. Satisfactory agreement between the prediction and the data is noticed for the two
humidity ratios considered. As remarked in Y onko and Sepsy [4], a 42 % increase in the
relative humidity (from 55.2 to 78.1 %) increased the frost thickness by roughly 28%. The
predicted surface temperature and frost density are found to increase with an increase in the
humidity ratio, as is to be expected.
A comparison of the model predictions with the data for frost thickness is presented in
Fig. 4c to highlight the influence of air velocity. Two sets of data are considered here for
comparison: Run #9: T", =294 K, T ... = 245 K, ltv) = 1.28 mis, w'" =0.0010 kgv/kga (q)", =
65.2%); Run #15: T", =296 K, TIV =265 K, u", =2.92 mis, w'" =0.0117 kgv/kga (q)" =
16
66.7%). The data indicate that, for the conditions considered, air velocity on frost thickness
has no appreciable effect on frost thickness as the air velocity is nearly doubled. The data
also reveal that (excepting for the early crystal growth period) there appears to be a
crossover point in time for the frost thickness as the air velocity increases: as the air velocity
is increased, the frost thickness is initially reduced, but later slightly increased at large times.
This behavior is clearly reproduced by the present model. Yonko and Sepsy [4] point out that
although the data for frost thickness at the two air velocities are nearly identical, the frost
densities for these test runs were quite different, although the density data are not reported.
Physically, higher air velocity enhances heat and mass transfer to the frost surface. An
increase in frost density with a nearly constant frost thickness implies that more vapor mass
is diffused through the frost layer, thus densifying the frost layer.
In order to clarify this matter theoretically the role of increased air velocity on frost
densification, Fig. 4d shows the predicted frost densities for Run #9 and 15. The model
indeed predicts that the frost densities are considerably different for the two air velocities
under consideration, in accordance with the observations ofYonko and Sepsy [4]. To the
author's knowledge, such a clarification with regard to the role of air velocity on frost
densification has not been previously exemplified well from a theoretical point of view.
From the foregoing comparisons, it is evident that the plate surface temperature has larger
effect on frost thickness than the relative humidity, while both the plate temperature and the
relative humidity have greater effect than the air velocity. These experimental facts are
satisfactorily described by the present model.
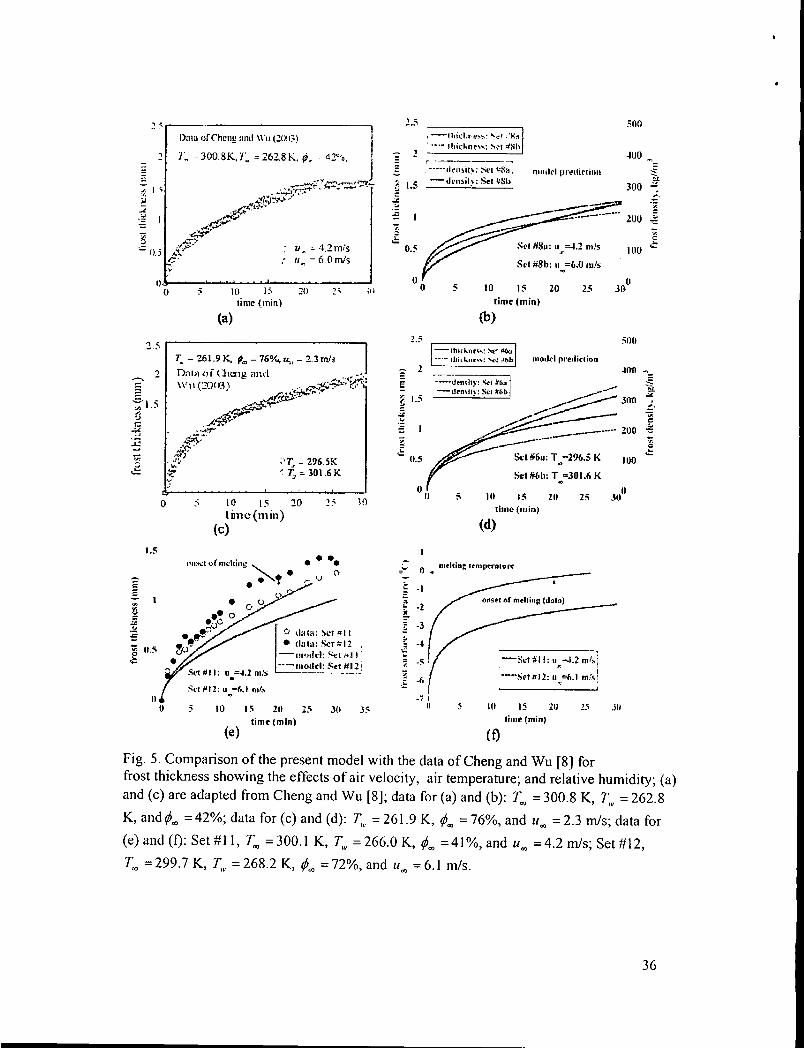
4.2. Comparison with Data o/Cheng and Wu f8}
The effects of air velocity and air temperature on frost thickness and frost density are
illuminated in Fig. 5 by a comparison of the model predictions with the experimental data of
Cheng and Wu [8]. The square copper plate has dimensions of L = W = 0.056 m, and a
thickness b = 6 mm. The test duration is 30 min, and thus correspond to early stages of frost
formation with a high resolution in time. Frost thickness is measured by a microscopic image
system (registering data every five seconds). The uncertainty in the measured frost thickness
is stated as 0.007 mm (0.3%). No data on frost surface temperature, frost density, and heat
flux are reported.
17
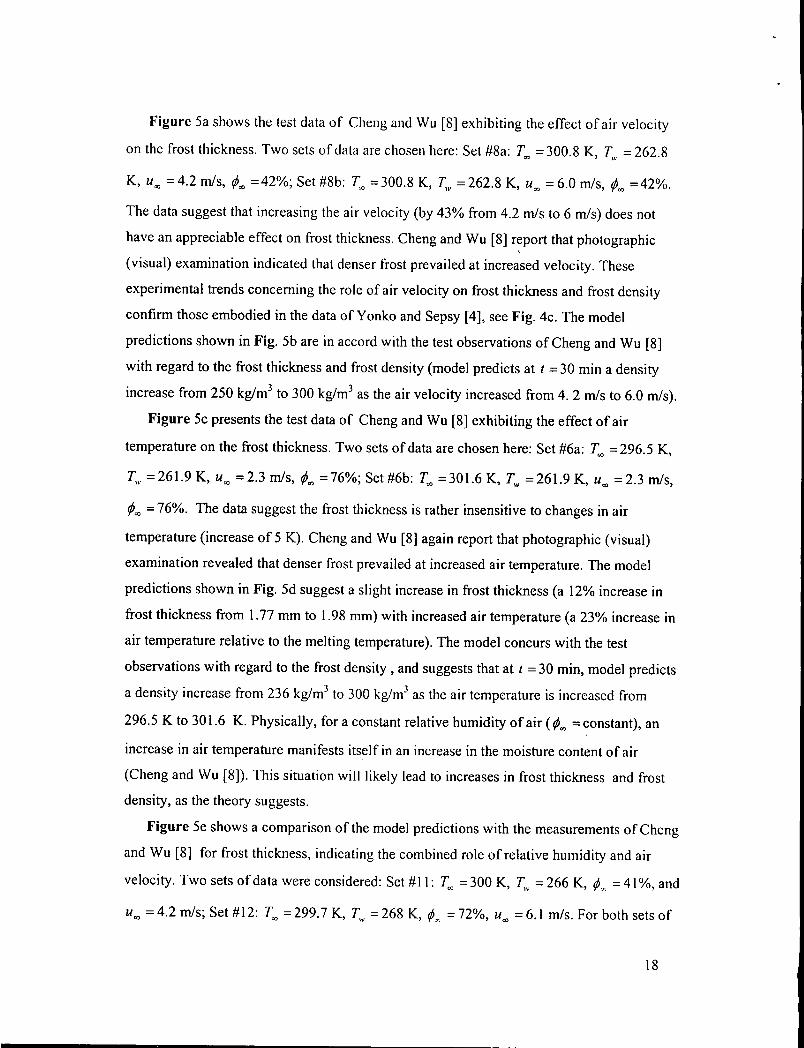
Figure Sa shows the test data of Cheng and Wu [8] exhibiting the effect of air velocity
on the frost thickness. Two sets of data are chosen here: Set #8a: T", = 300.8 K, Tw = 262.8
K, u", = 4.2 mis, r/J", = 42%; Set #8b: T", = 300.8 K, Tw = 262.8 K, u'" = 6.0 mis, r/J", = 42%.
The data suggest that increasing the air velocity (by 43% from 4.2 mls to 6 m/s) does not
have an appreciable effect on frost thickness. Cheng and Wu [8] report that photographic
(visual) examination indicated that denser frost prevailed at increased velocity. These
experimental trends concerning the role of air velocity on frost thickness and frost density
confirm those embodied in the data ofYonko and Sepsy [4], see Fig. 4c. The model
predictions shown in Fig. 5b are in accord with the test observations of Cheng and Wu [8]
with regard to the frost thickness and frost density (model predicts at t = 30 min a density
increase from 250 kg/m3 to 300 kg/m3 as the air velocity increased from 4. 2 mls to 6.0 mls).
Figure 5c presents the test data of Cheng and Wu [8] exhibiting the effect of air
temperature on the frost thickness. Two sets of data are chosen here: Set #6a: T", = 296.5 K,
1'..,. = 261.9 K, u", = 2.3 mis, r/J", = 76%; Set #6b: T", = 301.6 K, Tw = 261.9 K, u'" = 2.3 mis,
r/J", = 76%. The data suggest the frost thickness is rather insensitive to changes in air
temperature (increase of 5 K). Cheng and Wu [8] again report that photographic (visual)
examination revealed that denser frost prevailed at increased air temperature. The model
predictions shown in Fig. 5d suggest a slight increase in frost thickness (a 12% increase in
frost thickness from 1.77 mm to 1.98 mm) with increased air temperature (a 23% increase in
air temperature relative to the melting temperature). The model concurs with the test
observations with regard to the frost density, and suggests that at t = 30 min, model predicts
a density increase from 236 kg/m3 to 300 kg/m3 as the air temperature is increased from
296.5 K to 301.6 K. Physically, for a constant relative humidity of air (r/J", = constant), an
increase in air temperature manifests itself in an increase in the moisture content of air
(Cheng and Wu [8]). This situation will likely lead to increases in frost thickness and frost
density, as the theory suggests.
Figure 5e shows a comparison of the model predictions with the measurements of Cheng
and Wu [8] for frost thickness, indicating the combined role of relative humidity and air
velocity. Two sets of data were considered: Set #11: Too = 300 K, TIV = 266 K, ¢" = 41 %, and
u'" = 4.2 mls; Set # 12: T", = 299.7 K, TIV = 268 K, ¢er. = 72%, u'" = 6.1 m/s. For both sets of
18
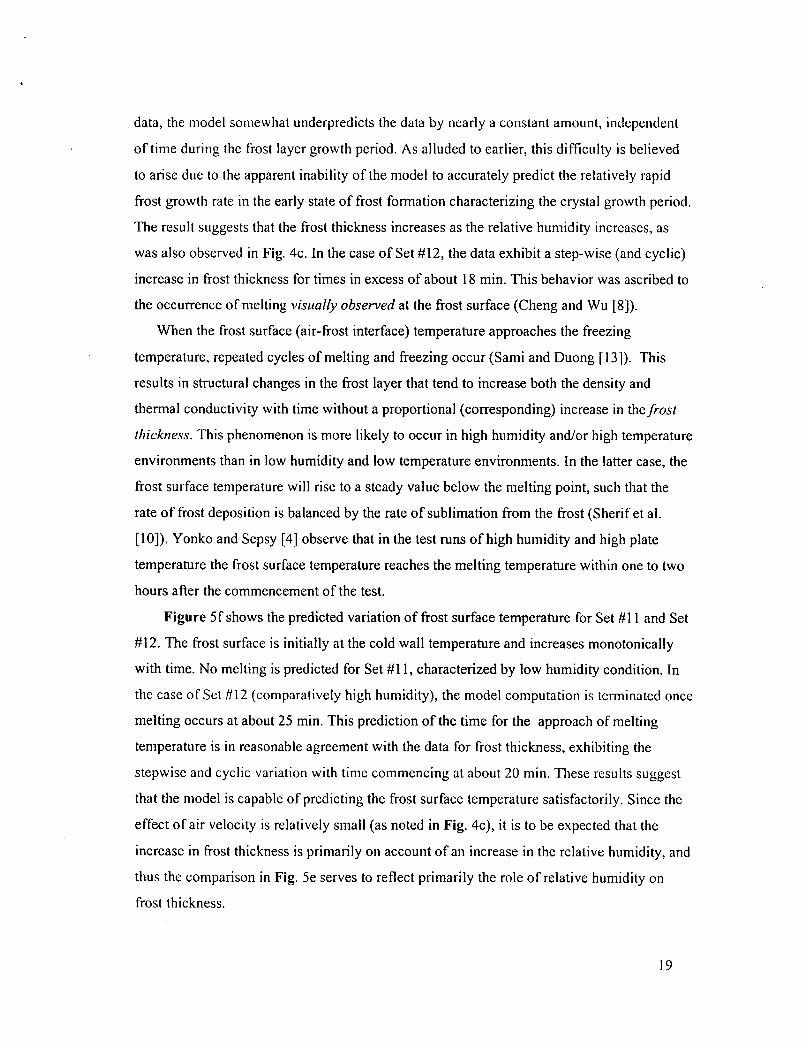
data, the model somewhat underpredicts the data by nearly a constant amount, independent
of time during the frost layer growth period. As alluded to earlier, this difficulty is believed
to arise due to the apparent inability of the model to accurately predict the relatively rapid
frost growth rate in the early state of frost formation characterizing the crystal growth period.
The result suggests that the frost thickness increases as the relative humidity increases, as
was also observed in Fig. 4c. In the case of Set #12, the data exhibit a step-wise (and cyclic)
increase in frost thickness for times in excess of about 18 min. This behavior was ascribed to
the occurrence of melting visually observed at the frost surface (Cheng and Wu [8)).
When the frost surface (air-frost interface) temperature approaches the freezing
temperature, repeated cycles of melting and freezing occur (Sami and Duong [13 D. This
results in structural changes in the frost layer that tend to increase both the density and
thermal conductivity with time without a proportional (corresponding) increase in the frost
thickness. This phenomenon is more likely to occur in high humidity and/or high temperature
environments than in low humidity and low temperature environments. In the latter case, the
frost surface temperature will rise to a steady value below the melting point, such that the
rate of frost deposition is balanced by the rate of sublimation from the frost (Sherif et al.
[10)). Yonko and Sepsy [4] observe that in the test runs of high humidity and high plate
temperature the frost surface temperature reaches the melting temperature within one to two
hours after the commencement of the test.
Figure 5 f shows the predicted variation of frost surface temperature for Set # II and Set
#12. The frost surface is initially at the cold wall temperature and increases monotonically
with time. No melting is predicted for Set #11, characterized by low humidity condition. In
the case of Set # 12 (comparatively high humidity), the model computation is tenninated once
melting occurs at about 25 min. This prediction of the time for the approach of melting
temperature is in reasonable agreement with the data for frost thickness, exhibiting the
stepwise and cyclic variation with time commencing at about 20 min. These results suggest
that the model is capable of predicting the frost surface temperature satisfactorily. Since the
effect of air velocity is relatively small (as noted in Fig. 4c), it is to be expected that the
increase in frost thickness is primarily on account of an increase in the relative humidity, and
thus the comparison in Fig. 5e serves to reflect primarily the role of relative humidity on
frost thickness.
19
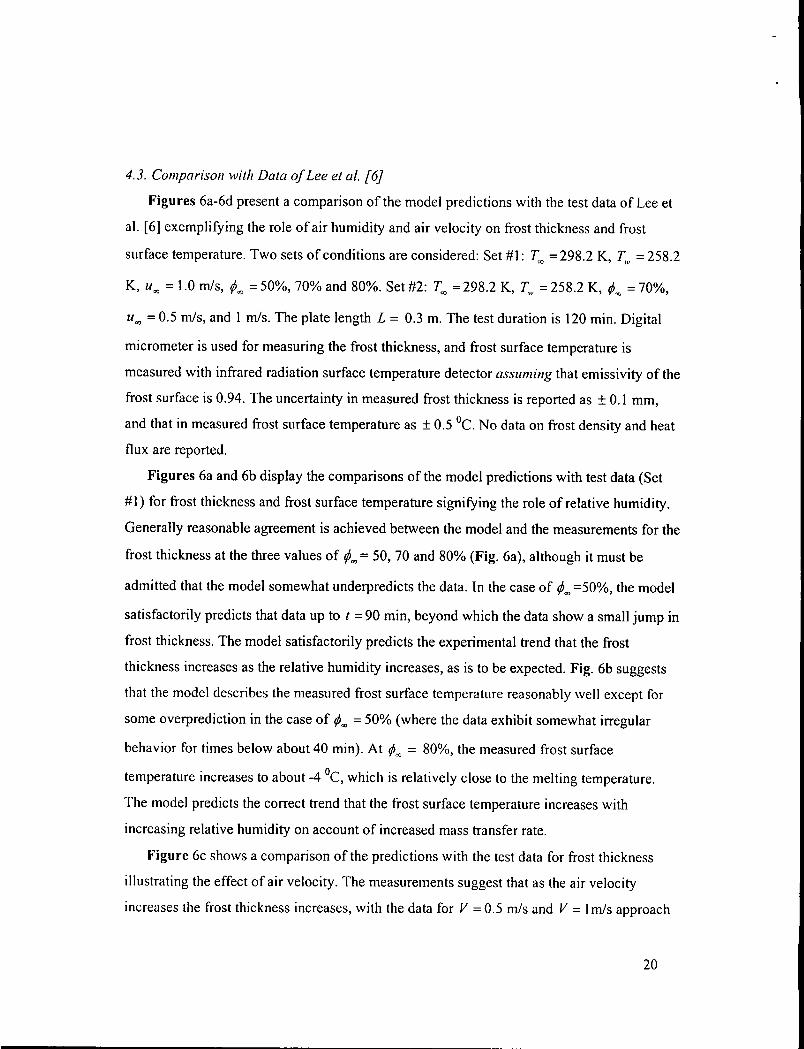
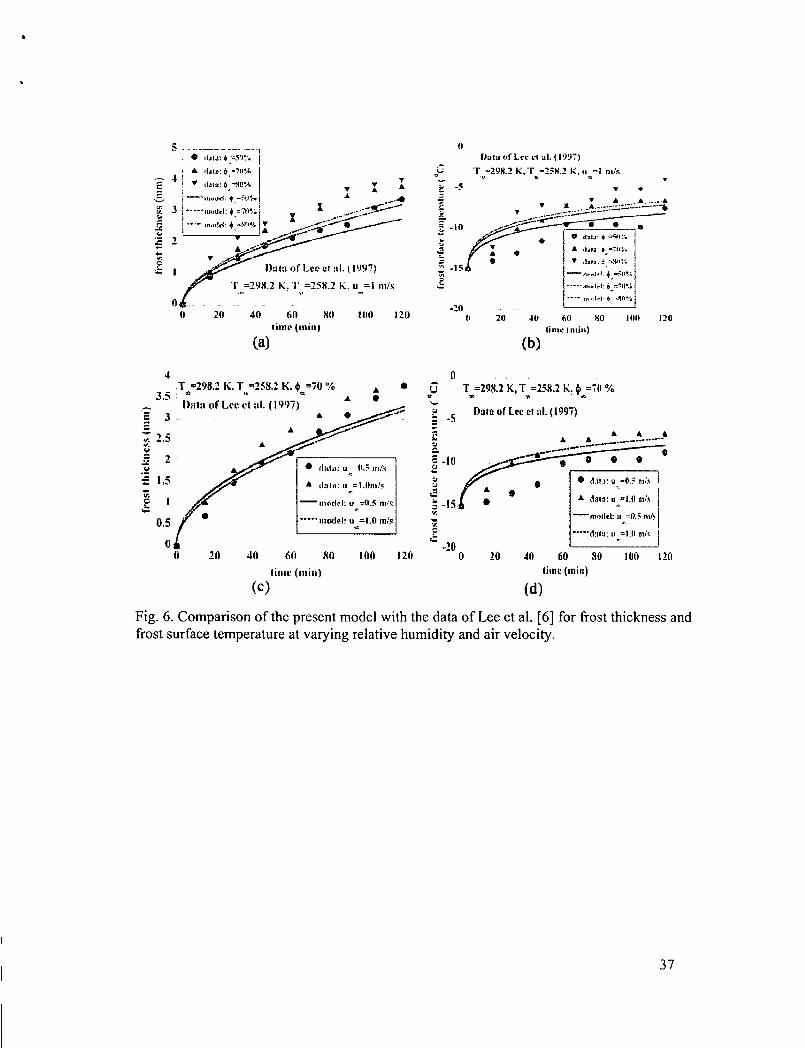
4.3. Comparison with Data of Lee et af. [6]
Figures 6a-6d present a comparison of the model predictions with the test data of Lee et
al. [6] exemplifying the role of air humidity and air velocity on frost thickness and frost
surface temperature. Two sets of conditions are considered: Set #1: T", = 298.2 K, T,,, = 258.2
K, u'" = 1.0 mis, r/Joc = 50%, 70% and 80%. Set #2: T", =298.2 K, T,,, = 258.2 K, r/J", = 70%,
U'" = 0.5 mis, and I mls. The plate length L = 0.3 m. The test duration is 120 min. Digital
micrometer is used for measuring the frost thickness, and frost surface temperature is
measured with infrared radiation surface temperature detector assuming that emissivity of the
frost surface is 0.94. The uncertainty in measured frost thickness is reported as ± 0.1 mm,
and that in measured frost surface temperature as ± 0.5 0c. No data on frost density and heat
flux are reported.
Figures 6a and 6b display the comparisons of the model predictions with test data (Set
#1) for frost thickness and frost surface temperature signifying the role of relative humidity.
Generally reasonable agreement is achieved between the model and the measurements for the
frost thickness at the three values of rp", = 50, 70 and 80% (Fig. 6a), although it must be
admitted that the model somewhat underpredicts the data. In the case of rp'" =50%, the model
satisfactorily predicts that data up to t = 90 min, beyond which the data show a small jump in
frost thickness. The model satisfactorily predicts the experimental trend that the frost
thickness increases as the relative humidity increases, as is to be expected. Fig. 6b suggests
that the model describes the measured frost surface temperature reasonably well except for
some overprediction in the case of r/J", = 50% (where the data exhibit somewhat irregular
behavior for times below about 40 min). At r/J", = 80%, the measured frost surface
temperature increases to about -4 °c, which is relatively close to the melting temperature.
The model predicts the correct trend that the frost surface temperature increases with
increasing relative humidity on account of increased mass transfer rate.
Figure 6c shows a comparison of the predictions with the test data for frost thickness
illustrating the effect of air velocity. The measurements suggest that as the air velocity
increases the frost thickness increases, with the data for V = 0.5 mls and V = I mls approach
20

each other for times in excess of about 110 minutes. The model is seen to satisfactory
represent the observed frost thickness. According to the model, the air velocity effect on frost
thickness is not appreciable, as already noted in Figs. 4c, 5a and 5b .. Fig. 6d shows a
comparison of the frost surface temperature. The model compares welI with data for frost
surface temperature for u'" = 0.5 mls and 1 mis, considering the irregular behavior in the data
for u'" = 0.5 mls. The model predicts the correct trend that the frost surface temperature (and
thus the frost density) increases as the air velocity increases. This is to be expected because
as the velocity increases heat and mass transfer rates increase, resulting in frost densification,
as alluded to earlier.
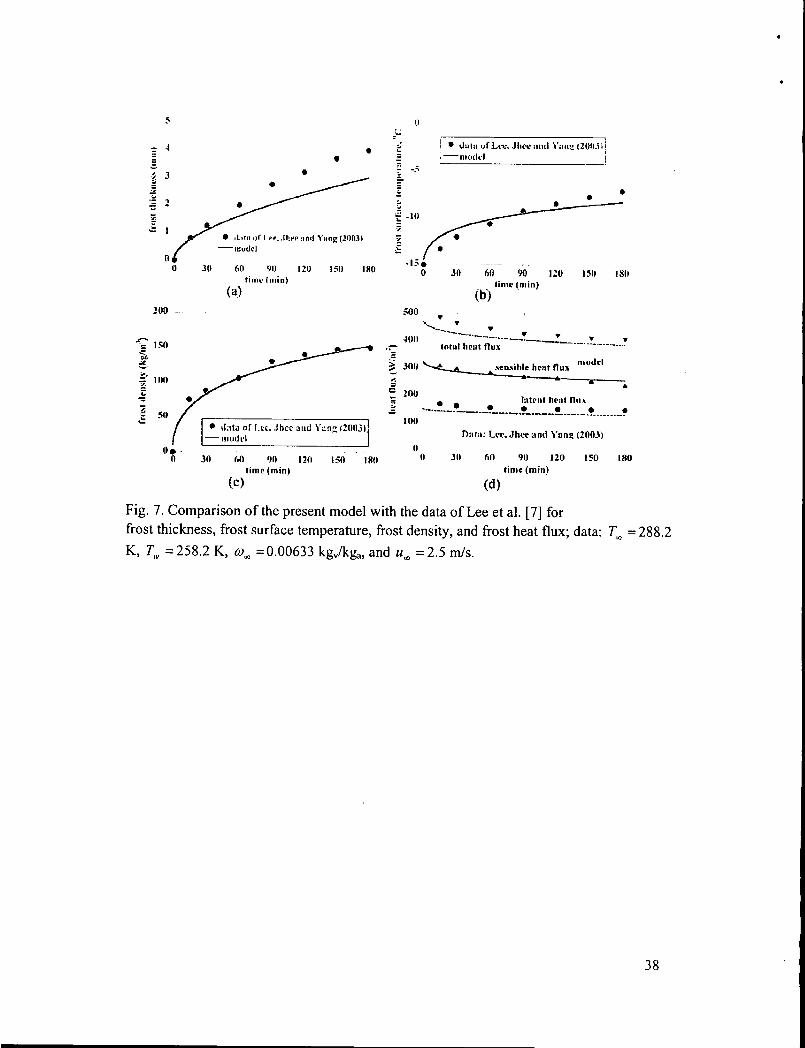
4.4. Comparison with Data of Lee et al. [7]
Figures 7a-7d display respectively the comparison of the predictions with the
measurements of Lee et al. [7] for frost thickness, frost surface temperature, frost density,
and heat flux. The test conditions are: T", = 288.2 K, TIV = 258.2 K, w'" = 0.00633 kgv/kga,
and u'" = 2.5 mls. The test plate has dimensions of L = 0.3 m and W = 0.15 m. The thickness
of the frost layer is measured by a digital thermometer, and the frost surface temperature is
measured by an infrared thermometer. The frost density is measured by weighing the frost
mass with the aid of a chemical balance and the known (measured) frost thickness at t = 15,
30,60,90, 120, 150 and 180 min. The uncertainty in the measurements are: 5.57% in x s '
4.36% in Tfs , 6.94% in P f and 3.69% in the total heat flux qlol' The temperature and
humidity of the inlet/outlet air in the test section are measured by type-T thermocouples and
humidity sensors respectively (Lee et al. [7]).
From Fig. 7a, it is evident that there is considerable deviation between the prediction and
the data for frost thickness for times in excess of about 90 min, with a maximum deviation I
mm at t = 120 min (25% error), even though the predicted growth rate is seen to be
reasonably satisfactory. This error is compared to the uncertainty in the measured frost
thickness of 6%. It is however noticed that there is considerable agreement between the
theory and the data in the initial growth period (t < 30 min).
The frost surface temperature prediction is seen to be satisfactory as evident from Fig. 7b.
At t = 180 min, the model prediction is within about 1.0 DC of the test data. As pointed out in
21

Lee et al. [7], there are very few experimental data for frost surface temperature reported in
the literature on account of the difficulty of measurement with a reasonable accuracy. The
surface temperature increases relatively rapidly during the early stage of frost growth where
the frost layer grows fast, but the rate of increase in frost surface temperature diminishes with
time as the frost growth rate' decreases.
Figure 7c displays a comparison of the predicted frost density with the measurements.
Excellent agreement is noted between the theory and experiments during the entire test
period. The frost density increases rapidly in the early stage of frost growth (less than about
30 min), and the rate of increase of frost density is small for times in excess of about 120
min. As the frost density is correlated with the frost surface temperature, a good agreement
between the theory with the data for frost surface temperature also results in similar
agreement in frost density prediction.
Figure 7d presents a comparison of the frost predictions with the measurements of
sensible heat flux, latent heat flux and total heat flux (sensible and latent). The data suggest
that the sensible heat flux is considerably larger than the latent heat flux (by a factor of about
two), and decreases continuously during frost formation as the surface temperature of the
frost layer increases with its growth (Lee et al. [7]). On the other hand, the latent heat flux
remains fairly constant with time, following a small drop at the commencement of frost
formation. The results also suggest that the total heat flux reduces from about 500 W/m2 at
t = 15 min to about 400 W/m2 at t = 180 min (a 25% drop).
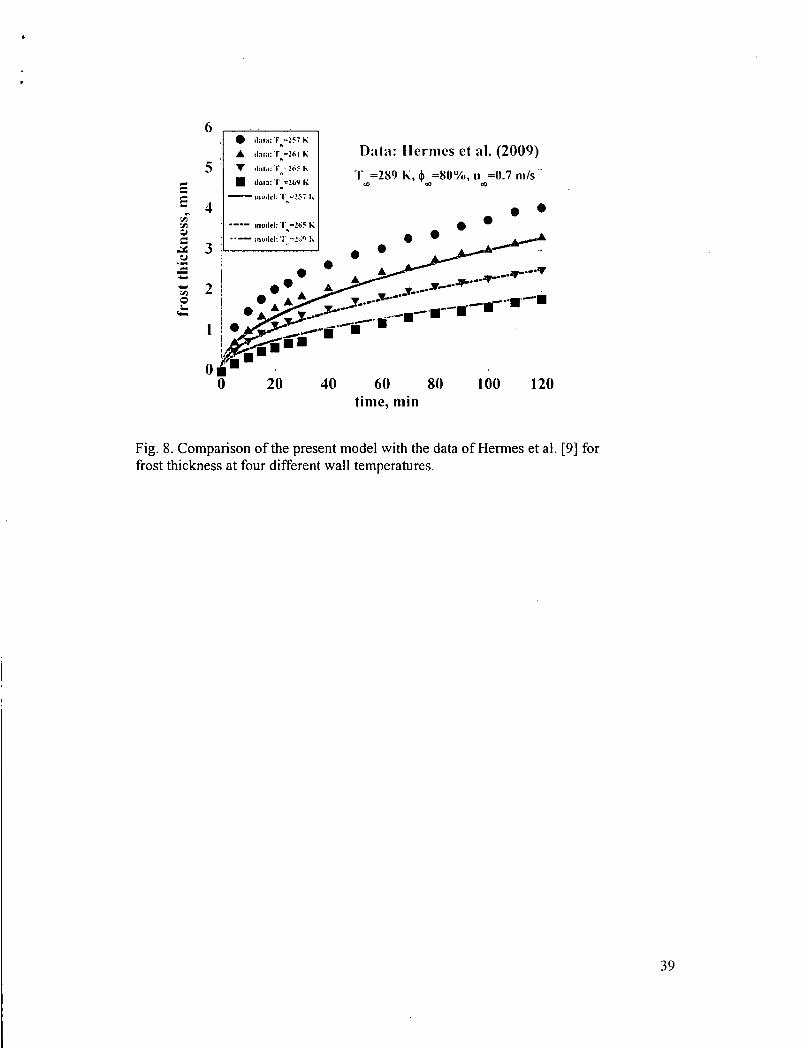
4.5. Comparison with Data of Hermes et al. [9J
Recently Hermes et al. [9] reported measurements of frost thickness, frost density and
frost surface temperature. The measurements were performed on a square test plate with
dimensions of L = W = 0.1 m. Two separate sets of measurements were obtained for frost
growth and frost density. The test conditions for the frost thickness measurement are: T", =
289.2 K and 295.2 K, T. .. = 257.2 K to 269.2 K, rp~ = 50% and 80%, and u", =0.7 mls and
1.0 mls. The test duration is 120 min. The test conditions for frost density measurements are:
T", =289.2 K and 295.2 K, T. .. = 258 K, 261 K, 265 K and 269 K, rp", = 50% and 80%, U", =
0.7 mis, and t = 60 min and 120 min. The frost thickness is measured by a digital camera in
22

conjunction with image processing. TI1e density (mass) is measured by an electronic scale.
The surface temperature is measured by an infrared camera. The measurement uncertainties
are: ± 5JLIl1 (± 2%) in frost thickness, ± 5% in frost density, and ± 0.2 °c in frost temperature.
Figure 8 shows a comparison of the predictions with the test data of Hermes et al. [9] for
frost thickness for various wall temperatures at T", =289 K, u", =0.7 mls andq)" = 80%. The
present model favorably compares with the measurements for various wall temperatures,
except for T.v = 257 K where the error is relatively large. Both the data and the model
indicate that the frost growth increases with a decrease in the cold plate temperature, as is to
be expected. It is noticed that in the early frost growth period, the predicted frost thickness
generally exceeds the test data for relatively high wall temperatures, while for the low wall
temperature the trend is opposite. This observation again suggests that that the early growth
period is important for accurate frost growth prediction.
Table 1 shows a comparison of the predictions with the data of Hermes et al. [9] for frost
thickness, frost surface temperature and frost density at t = 60 and 120 min, for T", = 289 K,
u'" = 0.7 mis, ¢'" = 50 % and 80 % and Tw = 15, -l 0 and -5 Dc. The results suggest that with a
decrease in wall temperature, the frost thickness increases, while the frost surface
temperature and the frost density decrease. This effect arises due to an augmentation in the
supercooling degree that results in a higher overall mass flux and a lower frost density
(Hermes [9]). It is also noticed form the data that as the relative humidity increases, the frost
thickness increases with an accompanying increase in frost surface temperature and frost
density. These trends are correctly reproduced by the model. In general, the model
satisfactorily describes the data for frost growth, frost surface temperature and frost density
for t = 60 min and 120 min.
5. Discussion
It is pertinent to enumerate major differences between the present model and the existing
models such as those of Jones and Parker [1], Cheng and Cheng [17], and Na and Webb [2].
Jones and Parker [l] consider that the energy crossing the frost surface by conduction
qcond = -k J( ~~} = -[he (r, - T,)+ 'II, L".] (21 )
23
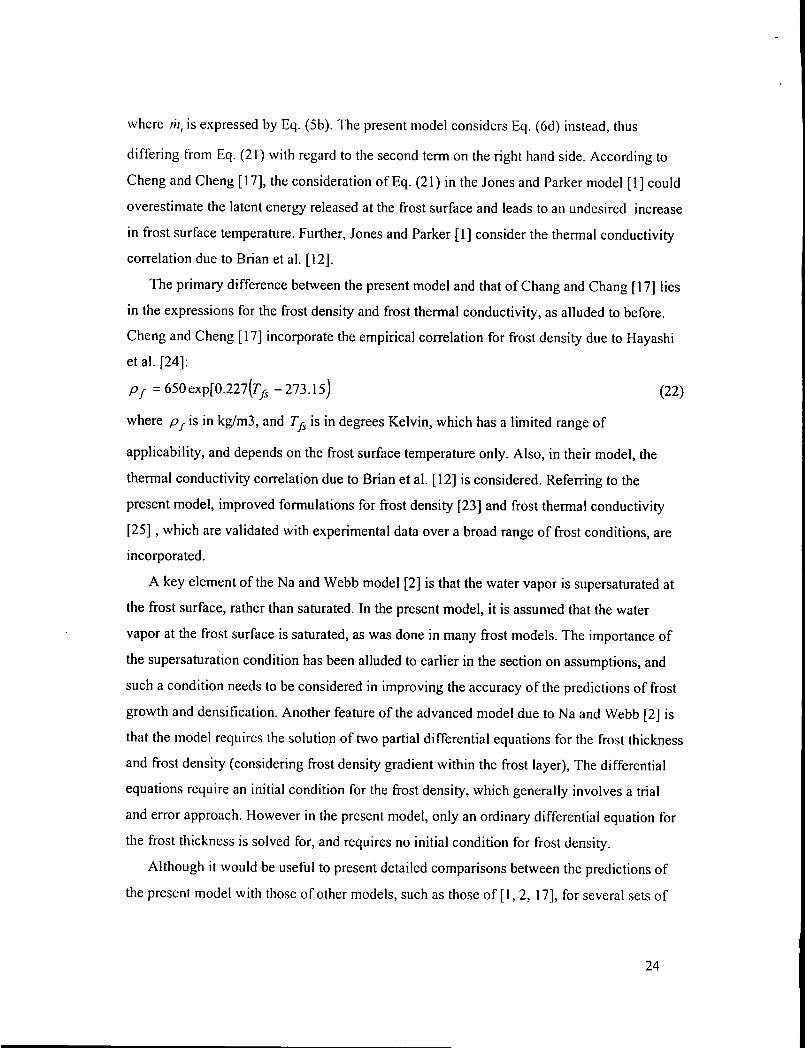
where Iii, is expressed by Eg. (5b). The present model considers Eg. (6d) instead, thus
differing from Eg. (21) with regard to the second term on the right hand side. According to
Cheng and Cheng [17], the consideration ofEq. (21) in the Jones and Parker model [1] could
overestimate the latent energy released at the frost surface and leads to an undesired increase
in frost surface temperature. Further, Jones and Parker [1] consider the thermal conductivity
correlation due to Brian et al. [12].
The primary difference between the present model and that of Chang and Chang [17] lies
in the expressions for the frost density and frost thermal conductivity, as alluded to before.
Cheng and Cheng [17] incorporate the empirical correlation for frost density due to Hayashi
et al. [24]:
PI = 650exp[O.227(Tft -273.15) (22)
where P J is in kglm3, and Tft is in degrees Kelvin, which has a limited range of
applicability, and depends on the frost surface temperature only. Also, in their model, the
thermal conductivity correlation due to Brian et al. [12] is considered. Referring to the
present model, improved formulations for frost density [23] and frost thermal conductivity
[25] , which are validated with experimental data over a broad range of frost conditions, are
incorporated.
A key element of the Na and Webb model [2] is that the water vapor is supersaturated at
the frost surface, rather than saturated. In the present model, it is assumed that the water
vapor at the frost surface is saturated, as was done in many frost models. The importance of
the supersaturation condition has been alluded to earlier in the section on assumptions, and
such a condition needs to be considered in improving the accuracy of the predictions of frost
growth and densification. Another feature of the advanced model due to Na and Webb [2] is
that the model requires the solutio.n of two partial differential equations for the frost thickness
and frost density (considering frost density gradient within the frost layer), The differential
equations require an initial condition for the frost density, which generally involves a trial
and error approach. However in the present model, only an ordinary differential equation for
the frost thickness is solved for, and requires no initial condition for frost density.
Although it would be useful to present detailed comparisons between the predictions of
the present model with those of other models, such as those of [I, 2, 17], for several sets of
24
data covering a broad range of parameters, the author believes that such an undertaking calls
for an elaborate effort, which is outside of the scope of the present investigation. The author
hopes to accomplish such a comparison in a future investigation.
It is expected that the proposed model can be easily extended to include the effects of
variable parameters (wall temperature, relative humidity of air, air temperature, and air
velocity) to deal with important practical problems. [n this connection, it may be pointed out
that Ellgas and Pfitzner [44) recently modeled the pulsed injection of cryogenic hydrogen
into humid air (complex configuration with unsteady flow) by coupling a simple one
dimensional frost model to a commercial CFD code.
6. Conclusions
The proposed model frost growth and densification is shown to compare well with the
test data, and is found to satisfactorily predict the frost thickness, frost surface temperature,
frost density, and frost heat flux within the range of test conditions considered. It is revealed
that the plate temperature has the greatest effect on frost thickness, and that both the plate
temperature and relative humidity have considerably larger effect on frost thickness relative
to the air velocity and air temperature. The model also exemplifies the experimental
observation that the air velocity does not have appreciable effect on frost thickness, even
though the frost density increases significantly as a result of increasing air velocity. The air
temperature slightly increases the frost thickness, while it contributes to appreciable frost
densification. The satisfactory comparisons of the model with test data over a wide range test
of conditions suggests that the frost density and thermal conductivity models implemented in
the proposed model seem to be well representative of the actual conditions.
Acknowledgments
The author would like to thank the reviewers for helpful suggestions in improving the
manuscript.
25
References
[I] B.W. Jones, J.D. Parker, Frost formation with varying environmental parameters, 1.
Heat Transfer 97 (1975) 255-259.
[2] B. Na, R.L. Webb, A new model for frost growth, Int. J. Heat Mass Transfer 47 (5)
(2004) 925-936.
[3] D.L. O'Neal, D.R Tree, A review of frost formation in simple geometries, ASHRAE
Trans. 91 (1985) 267-28l.
[4] J.D. Yonko, C.F. Sepsy, An investigation of the thermal conductivity of frost while
forming on a flat horizontal plate, ASHRAE Trans. 73 (part I) (1967), Paper No. 2043,
1.1-l.1l.
[5] R. Qstin, R., S. Anderson, Frost growth parameters in a forced air stream, Int. J. of Heat
Mass Transfer 34 (4/5) (1991) 1009-1017.
[6] K-S. Lee, W.S. Kim, T.H. Lee, A one-dimensional model for frost formation on a cold
flat surface, Int. 1. Heat and Mass Transfer 40 (18) (1997) 4359-4365.
[7] K-S. Lee, S. Jhee, D-K. Yang, Prediction of the frost formation on a cold flat surface,
Int. J. Heat and Mass Transfer 46 (200 (2003) 3789-3796.
[8] C-H, Cheng, K-K. Wu, Observations of early-stage frost formation on a cold plate in
atmospheric air flow, 1. of Heat Transfer 125 (2003) 95-102.
[9] C.J.L. Hermes, RO. Picucco, l.R. Barbosa, Jr., C. Melo, A study of frost growth and
densification on flat surfaces, Experimental Thermal Fluid Sci. 33 (2009) 371-379.
[10] S.A. Sherif, S.P. Raju, M.M: Padki, A.B. Chen, A semi-empirical transient method for
modeling frost formation on a flat plate, Int. l. of Refrigeration 16 (5) (1993) 321-329.
[11] P.L.T. Brian, RC. Reid, 1. Brazinsky, Cryogenic frost properties, Cryogenic
Technology 5 (1969) 205-212.
[12] P.L.T. Brian, RC. Reid, Y.T. Shah, Frost deposition on cold surfaces, I&EC
Fundamentals 9 (3) (1970) 375-380.
[13] S.M. Sami, T. Duong, Mass and heat transfer during frost growth, ASRAE
Transactions 95 91) (1989) 158-165.
[14] Y.X. Tao, R.W. Besant, K.S. Rezkellah, A mathematical model for predicting the
densification and growth of frost on a flat plate, Int. J. Heat and Mass transfer 36 (2)
(1993) 353-363.
26
[15] Sahin, A. G., An experimental study on the initiation and growth of frost fom1ation on a
horizontal plate, Experimental Heat Transfer 7 (1994) 85-95.
[16] R. Le Gall, J.M. Grillot, C. Jallut, Modeling of frost growth and densification, Int. J.
of Heat Mass Transfer 40 (130 (1997) 3177-3187.
[17] C-H. Cheng, y-c. Cheng, Predictions offrost growth on a cold plate in atmospheric air,
Int. J. Heat Mass Transfer 28 (7) (200 I) 953-962.
[18] Y. T. Shah, Theory of frost formation, Ph. D. Thesis, Massachusetts Institute of
Technology, 1969.
[19] W. Woodside, Calculation of the thermal conductivity of porous media, Canadian J. of
Phys. 36 (7) (1958) 815-823.
[20] M.A. Dietenberger, Generalized correlation of the water frost thermal conductivity, Int.
J. Heat Mass Transfer 26 (4) (1983) 607-619.
[21] J. Shin, A. V. Tikhonov, C. Kim, Experimental study on frost structure on surfaces with
different hydrophilicity: Density and thermal conductivity, J. Heat transfer 125 (2003)
84-94.
[22] D-K. Yang, K-S. Lee, Dimensionless correlation of frost properties on a cold plate, Int.
J. Refrigeration 27 (1) (2004) 89-96.
[23] M. Kandula, Correlation of water frost thermal conductivity in laminar flow over flat
surfaces. submitted to Special Topics and Reviews in Porous Media, July 2010.
[24] Y. Hayashi, A. Aoki, S. Adachi, K. Hori, Study of frost properties correlating with
frost formation types, J. of Heat Transfer 99 (1997) 239-245.
[25] M. Kandula, On the effective thermal conductivity of frost considering mass diffusion
and eddy convection, Special Topics and Reviews in Porous Media 1 (4) (2010) 321-
336.
[26] P. Zehner, E.U. Schlunder, Thermal conductivity of granular materials at moderate
temperatures (in German), Chemic Ingr. Tech. 42 (1970) 933-94l.
[27] Hsu, C.T., P. Cheng, K.W. Wong, Modified Zehner-Schlunder models for stagnant
thermal conductivity of porous media, Int. J. of Heat Mass Transfer 37 (17) (1994)
2751-2759.
[28] P. Cheng, C-T. Hsu, The effective stagnant thermal conductivity of porous media with
periodic stmctures, J. of Porous Media 2 (I) (1999) 19-38.
27

[29] M. Kandula, On the effective them1al conductivity of porous packed beds with unifonn
spherical particles, accepted/or publicatioll ill J. of Porous Media, February 2010.
[30] G. Biguria, L.A. Wenzel, Measurement and correlation of water frost conductivity and
density, I&EC Fundamentals 9 (I) (1970) 129-138.
[31] P. Cheng, D. Vortmeyer, Transverse thermal dispersion and wall channeling in a
packed bed with forced convective flow, Chern. Engng. Sci. 9 (1988) 2523-2532.
[32] c.T., Hsu, P. Cheng, Thermal dispersion in a porous medium, Int. J. of Heat and Mass
Transfer 33 (8) (1990) 1587-1597, 1990.
[33] K. Vafai, Convective flow and heat transfer in variable-porosity media, J. Fluid
Mechanics 147 (1984) 233-259.
[34] M. Sturm, J. Holmgen, M. Konig, K. Morris, The thermal conductivity of seasonal
snow, J. Glaciology 43 (143) (1997) 26-41.
[35] M.S. Van Dtlsen, International Critical Tables 5, McGraw-Hili Book Co., 1929, p. 216.
[36] D. Pitman, B. Zuckerman, Effective thermal conductivity of snow at -88°, _27°, and -
5°C, J. of Applied Phys. 38 (1967) 2698-2699.
[37] W.M. Kays, M.E. Crawford, Convective Heat and Mass Transfer, second ed., McGraw
Hill, New York, 1980.
[38] E.R.G. Eckert, R.M. Drake, Analysis of Heat and Mass Transfer, McGraw-Hili, New
York, 1972.
[39] H.R Pruppacher, J.D. Klett, Microphysics of Clouds and Precipitation, Reidel,
Dordrecht, 1978.
[40] P.G. Mago, S.A. Sherif, Frost formation and heat transfer on a cold surface in ice fog,
AIAA-2004-164, 2004.
[41] PJ. Flatau, R.L. Walka, R. L., W.R Cotton, Polynomial fits to saturation vapor
pressure, J. of Meteorology 31 (1992) 1507-1513.
[42] W.M. Rohsenow, J.P. Hartnett, Handbook of Heat Transfer, McGraw-Hili, New York,
1973.
[43] D.S. Dillard, K.D. Timmerhaus, Low temperature thermal conductivity of selected
dielectric crystalline solids, in Thermal Conductivity, in: C.T. Ho and RE. Taylor
(Ed.), Proceedings of the 8th Conference, Plenum Press, New York, 1969, pp. 949-967.
28
[44] S. Ellgas, M. Pfitzner, Modeling frost formation within a commercial CFO code,
Numerical Heat Transfer, Part A 53 (2008) 485-506.
29

Figure Captions
Fig. I. Schematic of porous frost growth.
Fig. 2. Correlation for the frost porosity and frost density as a function of dimensionless frost
surface temperature and flow Reynolds number (adapted from Kandula [23]).
Fig. 3. Comparisons of predicted thermal conductivity offrost with the correlations of Sturm
et al. [34], Van Deusen [35], and Ostin and Anderson [5].
Fig. 4. Comparison of the present model with the data ofYonko and Sepsy [4] for
frost thickness indicating the role of relative humidity, wall temperature and air velocity.
data for (a): Run # 13: T., = 295 K, OJ", =0.0108, U., = 2.96 m/s; Run # 14: T., = 295 K, OJ", =
0.0106, u., =2.57m1s; Run # 15:T", =296K, OJ., =0.0117, u'" =2.92 mls; data for (b): Run
#7: Too = 294 K, Tw = 245 K, u'" = 1.26 mls; Run #10: T", =296 K, TIV = 245 K, uOO = 1.37
m/s; data for (c): Run #9: Too = 294 K, TIV = 245 K, OJ", =0.009.
Fig. 5. Comparison of the present model with the data of Cheng and Wu [8] for
frost thickness showing the effects of air velocity, air temperature; and relative humidity; (a)
and (c) are adapted from Cheng and Wu [8]; data for (a) and (b): T", = 300.8 K, Tw = 262.8
K, and ¢'" = 42%; data for (c) and (d): TIV = 261.9 K, ¢'" = 76%, and U., = 2.3 mls; data for
(e) and (f): Set #11, T", =300.1 K, TIV = 266 K, ¢'" =41%, and u'" =4.2 mls; Set #12, T", =
299.7 K, Tw =268 K, ¢'" =72%, and u'" =6.1 mls.
Fig. 6. Comparison of the present model with the data of Lee et al. [6] for
frost thickness and frost surface temperature at varying relative humidity and air velocity.
Fig. 7. Comparison of the present model with the data of Lee et al. [7] for
frost thickness, frost surface temperature, frost density, and frost heat flux; data: T., = 288.2
K, T ... = 258.2 K, OJ", = 0.00633 kgikga, and u'" = 2.5 mls.
Fig. 8. Comparison of the present model with the data of Hermes et al. [9] for
frost thickness at four different wall temperatures.
Table Captions
Table I. Comparison of predictions with the test data of Hermes et al. [9] for frost parameters
(test conditions: Too = 289.2 K, li", =0.7 m/s).
30
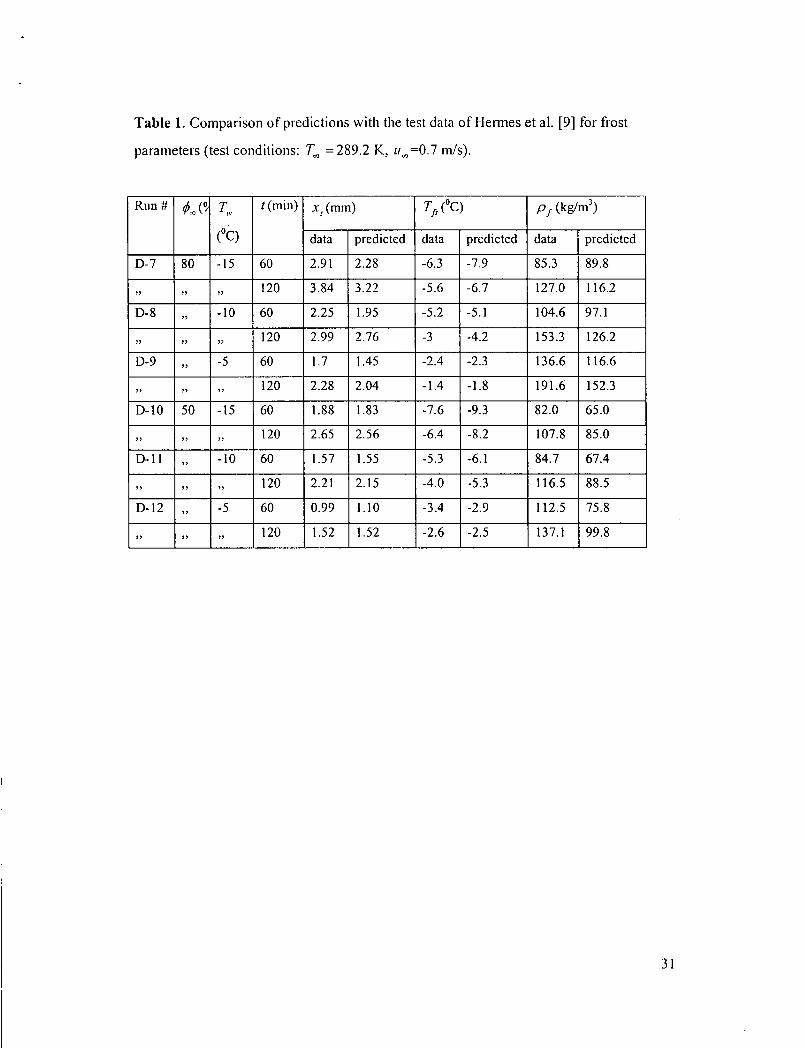
Table 1. Comparison of predictions with the test data ofl-Iennes et al. [9] for frost
parameters (test conditions: Too = 289.2 K, uOO =0.7 m/s).
Run # rp", (0 Til" t (min) xs(mm) Tft (0C) PI (kg/m3
)
(0(;) data predicted data predicted data predicted
0-7 80 -15 60 2.91 2.28 -6.3 -7.9 85.3 89.8
" " " 120 3.84 3.22 -5.6 -6.7 127.0 116.2
0-8 "
-10 60 2.25 1.95 -5.2 -5.1 104.6 97.1
" " " 120 2.99 2.76 -3 -4.2 153.3 126.2
0-9 "
-5 60 1.7 1.45 -2.4 -2.3 136.6 116.6
" " " 120 2.28 2.04 -1.4 -1.8 191.6 152.3
0-10 50 -15 60 1.88 1.83 -7.6 -9.3 82.0 65.0
" " " 120 2.65 2.56 -6.4 -8.2 107.8 85.0
0-11 "
-10 60 1.57 1.55 -5.3 -6.1 84.7 67.4
" " " 120 2.21 2.15 -4.0 -5.3 116.5 88.5
0-12 "
-5 60 0.99 1.10 -3.4 -2.9 112.5 75.8
" " " 120 1.52 1.52 -2.6 -2.5 137.1 99.8
31
mus:; trunsti;r nfvupor to the frost surfuce
hCCll cunvccliun & latent hcut of sublumltion
L (a)
(b)
Fig. 1. Schematic of porous frost growth.
32
.'-1; = 0.6 0.2
. -~ = 1.0
o 0- - -- - . 11.2 1).4 1.1.6 0:8
frosl ~UrfaCl' 1l'I1IPl'I~IIUrC. 0
(a)
U.6
i
(b)
Fig. 2. Correlation for the frost porosity and frost density as a function of dimensionless frost surface temperature and flow Reynolds number (adapted from Kandula [23]).
33

100
80
60
40
20
'i'\)turm ('t nL f"i' .
-----CorrealtiOIl ufVan DClIsen (1929) I
,_.- (orrelation of Os tin and Anderson (1991) .. _- Theory (diffllsion-convection~ k Ik =1)
l' I
, . , . , I
, I , . , . , I , .'
'------------------,~ ,. T = 258 K
f
.--=::::,:.~~
, .'
" I , / , " ./ " . ./ , .
" ~" ,".~/'
,,,;,,";-
, .. j
~'-"~~~'
-.. ~.-o ~=.::c-a.":a . .,$'.! ---1'_- ___ , ________ _
o 0.2 0.4 0.6 0.8 1
~ Fig, 3, Comparisons of predicted thermal conductivity of frost with the correlations of Sturm et al. [34], Van Deusen [35], and Ostin and Anderson [5]; adapted from Kandula [25]),
34
II
4
3.5
~u 100 lilll~ (lIIin)
(0)
Ii (; <131.: Hun'!')
i • d~la: Hun "15 E E
J 1-011><101: Itun t;')
,. 2.5 ,···-1000.1: Uun /l1~ ,.. c
~ ,.
1 .
15,
150
~ I,
o.~
O.
Run -::Q: 1IZ'=I.~~ m;"
Run #15: u,,.. =2. ~2 mlS
II lUll lilllc(minj
(e)
I~II
200
2110
• • .. .. ..,---•• ._~o
J .. • y." 0>:::: to :0.lIiI9 r ~
• , Run "10;", -0.0141
:(, (b)
. f ~~ :Iutu: R';;l;#'~-l i • dOli.: Run #10 i ~-m~Htd(,Jbn~~) ! 1"u-mm.lcHRan i!llhi
1M 200 lillie (min)
lim«min,
(d)
Fig. 4. Comparison of the present model with the data ofYonko and Sepsy [4] for frost thickness indicating the role of relative humidity, wall temperature and air velocity. data for (a): Run # 13: Too = 295 K, OJoo = 0.0 I 08, u", = 2.96 mls; Run # 14: Too = 295 K, OJoo =
0.0106, u'" = 2.57 mls; Run # 15: T", = 296 K, OJ", = 0.0117, u'" = 2.92 mls; data for (b): Run
#7: Too = 294 K, Tw = 245 K, u'" = 1.26 mls; Run #10: T", = 296 K, Tw = 245 K, u'" = 1.37
m/s; data for (c): Run #9: T", =294 K, Tw = 245 K, OJ", =0.0110.
35
2'r-------------------------------, Dma "fCheng ami \\'11 (:!(i.'~)
J~ 0 300.8K, t. = 262.8 K. ¢, . 42"'0.
timel.min)
2.;; ,-lhid.'·6':>~ 'I!' :lH~ L ....... 1 hichOf": ~{·t #Nh
. -----dl"lI~ir~: ~11.:Ra.
~ 1.5 '-.JI·n;il~:Stl#Sb: 01"11.1 pr~llirli"l1
'" .~
,. .:
O.!'
II o
Sct IiHu: u ~ =-1,2 m!s
Sct 118b: II =6.0 lUIs ~
10 IS 20 2S lime (min)
:ino
.. ()O -. :;:::
300 ]f ,. '-
2UU ~ :!:
100 .E
(a) (b)
o
J.~
11 o
;'T> - 296.51( , T, = lO1.6K
:' 10 15 20 l imc (m in)
(c)
10
OO"'IQ(lIlching ~ • .. , • ••• ()
5 10
(e)
I~
) r.
o <I~la:~fRII • data: SeT!;I! ,
-",·,tld:""Ii+II: ---modd: .s~t 1112 !
211 3(1
tim~(mlnl
2.5 ;;00
=- 2 e ~ 1.5 :. .::
~ .E
0.5
lIIodd JlloellicrioD ~oo ~_
5 ·····lfm,.il\: tr\et "6.\1 -tJrn\il;-: Sel #(.b -- Jf ~.-- 3110,. ./'.,./--=--- ]
d _--··200 ---,,-----_. -- Sd #611: T ~ -296.5 K
Set If6h: T., =301.6 K
III 15 2Il 25 time (miJl)
(d)
100
,.. = .::
C' 0 ... IIItl(in~ ffnlpCnllU~
-7 I II 5
(f)
-Sctlill: "~ "-'.2011,
--···S~t 1112: II "1\.1 Ini.~ .,
15 21) 25 JU lime (min)
Fig. 5. Comparison of the present model with the data of Cheng and Wu [8] for frost thickness showing the effects of air velocity, air temperature; and relative humidity; (a)
and (c) are adapted from Cheng and Wu [8]; data for (a) and (b): T", = 300.8 K, Tw = 262.8
K, and¢", =42%; data for (c) and (d): 1'". = 261.9 K, ¢'" = 76%, and u'" = 2.3 mls; data for
(e) and (f): Set #11, T"" =300.1 K, 1'", =266.0 K, ¢"" =41%, and u'" =4.2 mls; Set #12,
T", =299.7 K, 1'", =268.2 K, ¢'" =72%, and U", =6.1 mls.
36
II 211 40 fill 1111 1110 lime Imin,
(a)
" T =298.2 K. T =258.2 K. ~ =70 % 3.5 Q'J " IX
... • 3
-;. 2.5 '" :: ~ 2 .~ .. 1.5 .. '" ~
0.5
o o
nata (If LI'l~ dOli. (1997)
fI~LtU: u - tt.~ m/.~ ., • d:Hll: II =1.0ml:;;
-m(\riC'l: tJ =O.!' m;~
----·lIIooel: u =1.0 IIIls
20 411 60 100
lime (min)
(C)
120
•
120
II I)utu or Le,' "1 .. I. (1997)
~c T . .,=298.2 K, T ... =25H.2 K. "'01)=1 m/s
~ ~ 9 •
~ y __ •• ..-! .. _ .... . J-:..::::.:~.:.:.:.:.::-~.;:.::.:: ~ 'f .... ____ -... _____ ~--
f _I°tf~_~:::,:,::: I' =. ... ,10113. e ""~I";:' .,. -IS . ~ -m-.!!,I. + -:,n~~ ::> •
c!:: ----. t'l11I11r+" ;;:'1W~
-!O 1--'- ClI"lld'" ~ .. 'O-:.~
(I 20 -10 60 11111 120 Cim('lmin)
(b)
o T =29l!.2 K, T =258.2 K, ~ =70 % ~ ~ ~
Datil or Lee et 111. (1997)
;: lit. .. ..
~ E-IO .= '"' ~ ~ -;-1:1 '" ;. ~
-20
•
o 20
... .. --_.----_. ---_.-.-- . • 0 • •
•
40
(d)
• d.H;': U ~05 nI;'
.a. dal3: U ~ =I.U .,i~ I -mJ)(lfl: If,,..·::O.~ n\/~ I ----·iI:"': II =1.0.,i, I
'--______ 1
60 SO 100 120 lime (min)
Fig. 6. Comparison of the present model with the data of Lee et al. [6] for frost thickness and frost surface temperature at varying relative humidity and air velocity.
37
5
~
-, . 3 . ,. ~
.:.: . ~ ~
~ ..s
0
200
~ 150 g !::. lUll "Z ~
0
o. -
• •
• ,I.tll "r I" • .Ibp "n,l Yllng (2110]) -mouel
•
30 (,0 911 120 150 180 .il1lt·lmin)
(a)
• dat.! nr I.~(. .Jhec ,uti Yang 12UIIJI
o 30 911 12/1 150 1110 rime (min)
(C)
0 -~ ..
-5
~ :: :-. ;:
-IU ~ :;. ., ~
i • <1"hl "r Ln:. Jh("\" "1Il1 \'('IIl! aUnJi ,-mudd
• • •
120 1511 IXU lim~ (min,
(b) .
:;00 ... ........... .
400 -"--".-.---.--~_-!'__'" y 101,,1 henl nux -------_._-_ ..
~ JOn ~ sco .• ihle hen' nux modd -----4·----·· ____ •• ____ T& __ ___
" :;
c 20U ..
• latenl henl nnx ~ .. -.. ---._ .... _!t_._.,_ ... _ ... !.. ______ ! ________ ~
IOU
Dnla: Ll"I:.Jhl~"ml Yan~ (200_\)
IJ o 30 60 90 no 150 180
.ime (min)
(d)
Fig. 7. Comparison of the present model with the data of Lee et al. [7] for frost thickness, frost surface temperature, frost density, and frost heat flux; data: TO? = 288.2
K, TIV = 258.2 K, CtJ", = 0.00633 kgvlk~, and u'" = 2.5 mls.
38
... = . ~ >J'J ~
= ~ ~ . --= ..... ..... <JJ o
c!:
6 • dal:t:T '-'-2~7 k: " ... IIiU:I:T =261 " · 5 ... Ilal.,: T . 2(;~ I, · • dOla: 'J' cZ6Q h: ·
I --muIlel:T ""!57 h., 4 ' . ! ---- mode-I: T =26:' K I •
3
• •
Data: Hermes ct al. (2009)
T =289 h., 4> =80'X., tJ =0.7 m/s <0 '" '"
• • • • • • • •
... --.•. ", .... ....... 2 • • It. JIf_'.'JII'-'.' .... y.... .
! ..... ~ •••• JI-.'. ._.-..•. -. ! .... ll-'- _ .• --. ! .... ~.... -' .~,-.
1 ~i. • ~-Pii·-.· ! ....::::: .... i. .••
O· . o 20 40 60 80 100 120
time, min
Fig. 8. Comparison of the present model with the data of Hermes et al. [9] for frost thickness at four different wall temperatures.
39