front cover theme - vermilion energy
TRANSCRIPT


FRONT COVER THEME As illustrated by the front cover photo of our operations in Germany, Vermilion’s integration of sustainability throughout our business recognizes that we are part of a larger whole: the environments and communities in which we operate. We are therefore committed to conducting our activities in a manner that will protect the health and safety of both. This includes understanding our role in the evolving energy transition within the broader context of the United Nations Sustainable Development Goals (“SDGs”). We believe this approach, in which sustainability is embedded in our corporate strategy, supports Vermilion’s long-term economic viability while building a better future for our stakeholders through enhanced economic, environmental and community wellbeing.

Disclaimer Certain statements included or incorporated by reference in this document may constitute forward looking statements or financial outlooks underapplicable securities legislation. Such forward looking statements or information typically contain statements with words such as "anticipate", "believe","expect", "plan", "intend", "estimate", "propose", "project", or similar words suggesting future outcomes or statements regarding an outlook. Forwardlooking statements or information in this document may include, but are not limited to: capital expenditures; business strategies and objectives; operationaland financial performance; estimated reserve quantities and the discounted net present value of future net revenue from such reserves; petroleum andnatural gas sales; future production levels (including the timing thereof) and rates of average annual production growth; exploration and developmentplans; acquisition and disposition plans and the timing thereof; operating and other expenses, including the payment and amount of future dividends;royalty and income tax rates; and the timing of regulatory proceedings and approvals.
Such forward looking statements or information are based on a number of assumptions, all or any of which may prove to be incorrect. In addition toany other assumptions identified in this document, assumptions have been made regarding, among other things: the ability of Vermilion to obtainequipment, services and supplies in a timely manner to carry out its activities in Canada and internationally; the ability of Vermilion to market crude oil,natural gas liquids, and natural gas successfully to current and new customers; the timing and costs of pipeline and storage facility construction andexpansion and the ability to secure adequate product transportation; the timely receipt of required regulatory approvals; the ability of Vermilion to obtainfinancing on acceptable terms; foreign currency exchange rates and interest rates; future crude oil, natural gas liquids, and natural gas prices; andmanagement’s expectations relating to the timing and results of exploration and development activities. Although Vermilion believes that the expectations reflected in such forward looking statements or information are reasonable, undue reliance shouldnot be placed on forward looking statements because Vermilion can give no assurance that such expectations will prove to be correct. Financial outlooksare provided for the purpose of understanding Vermilion’s financial position and business objectives, and the information may not be appropriate forother purposes. Forward looking statements or information are based on current expectations, estimates, and projections that involve a number of risksand uncertainties which could cause actual results to differ materially from those anticipated by Vermilion and described in the forward looking statementsor information. These risks and uncertainties include, but are not limited to: the ability of management to execute its business plan; the risks of the oiland gas industry, both domestically and internationally, such as operational risks in exploring for, developing and producing crude oil, natural gas liquids,and natural gas; risks and uncertainties involving geology of crude oil, natural gas liquids, and natural gas deposits; risks inherent in Vermilion's marketingoperations, including credit risk; the uncertainty of reserves estimates and reserves life and estimates of resources and associated expenditures; theuncertainty of estimates and projections relating to production and associated expenditures; potential delays or changes in plans with respect toexploration or development projects; Vermilion's ability to enter into or renew leases on acceptable terms; fluctuations in crude oil, natural gas liquids,and natural gas prices, foreign currency exchange rates and interest rates; health, safety, and environmental risks; uncertainties as to the availabilityand cost of financing; the ability of Vermilion to add production and reserves through exploration and development activities; the possibility that governmentpolicies or laws may change or governmental approvals may be delayed or withheld; uncertainty in amounts and timing of royalty payments; risksassociated with existing and potential future law suits and regulatory actions against Vermilion; and other risks and uncertainties described elsewherein this document or in Vermilion's other filings with Canadian securities regulatory authorities. The forward looking statements or information contained in this document are made as of the date hereof and Vermilion undertakes no obligation toupdate publicly or revise any forward looking statements or information, whether as a result of new information, future events, or otherwise, unlessrequired by applicable securities laws. This document contains metrics commonly used in the oil and gas industry. These oil and gas metrics do not have any standardized meaning or standardmethods of calculation and therefore may not be comparable to similar measures presented by other companies where similar terminology is used andshould therefore not be used to make comparisons. Natural gas volumes have been converted on the basis of six thousand cubic feet of natural gasto one barrel of oil equivalent. Barrels of oil equivalent (boe) may be misleading, particularly if used in isolation. A boe conversion ratio of six thousandcubic feet to one barrel of oil is based on an energy equivalency conversion method primarily applicable at the burner tip and does not represent a valueequivalency at the wellhead. Financial data contained within this document are reported in Canadian dollars, unless otherwise stated.
Vermilion Energy Inc. ■ Page 1 ■ 2019 Third Quarter Report

Abbreviations$M thousand dollars$MM million dollarsAECO the daily average benchmark price for natural gas at the AECO ‘C’ hub in Albertabbl(s) barrel(s)bbls/d barrels per dayboe barrel of oil equivalent, including: crude oil, condensate, natural gas liquids, and natural gas (converted on the basis of
one boe for six mcf of natural gas)boe/d barrel of oil equivalent per dayGJ gigajoulesLSB light sour blend crude oil reference pricembbls thousand barrelsmcf thousand cubic feetmmcf/d million cubic feet per dayNBP the reference price paid for natural gas in the United Kingdom at the National Balancing Point Virtual Trading Point.NGLs natural gas liquids, which includes butane, propane, and ethanePRRT Petroleum Resource Rent Tax, a profit based tax levied on petroleum projects in AustraliaTTF the price for natural gas in the Netherlands, quoted in megawatt hours of natural gas, at the Title Transfer Facility Virtual
Trading PointWTI West Texas Intermediate, the reference price paid for crude oil of standard grade in US dollars at Cushing, Oklahoma
Vermilion Energy Inc. ■ Page 2 ■ 2019 Third Quarter Report
Highlights• Q3 2019 production averaged 97,239 boe/d, a decrease of 6% from the prior quarter. The lower production level resulted from a number of plant
turnarounds, unplanned downtime, and weather delays. Higher production in the US and France was more than offset by lower production in Canada, Netherlands, Ireland and Australia.
• We have reduced our 2019 capital investment guidance by $10 million to $520 million. With nine months of results in place, we are revising our 2019 annual production guidance range to 100,000 to 101,000 boe/d to account for the unplanned downtime and lower capital investment. We expect to deliver annual production at the mid-point of this revised guidance range, reflecting strong year-over-year production per share growth of 5%.
• Fund flows from operations ("FFO") for Q3 2019 was $216 million ($1.39/basic share(1)), a decrease of 3% from the previous quarter, primarily due to lower production volumes and weaker commodity prices. FFO for Q3 2019 decreased 17% from the same quarter last year as increased production was more than offset by weaker global commodity pricing.
• In the United States, Q3 2019 production averaged 4,925 boe/d, an increase of 12% from the prior quarter, primarily driven by contributions from our 2019 drilling program, which continues to perform above our expectations. New well results were partially offset by a longer-than-expected turnaround at a third-party operated gas plant.
• In Central and Eastern Europe, we drilled one (1.0 net) exploration well in Croatia during Q3 2019, which resulted in a second consecutive gas discovery. The well tested at a rate of 17.2 mmcf/d(2). We were also provisionally awarded the SA-07 license in Croatia, adding approximately 500,000 net acres to our portfolio, which will bring our total licensed acreage to approximately 2.4 million net acres in the country.
• In France, Q3 2019 production averaged 10,347 boe/d, an increase of 6% from the prior quarter. Production volumes in the Paris Basin were no longer restricted after restart of the Grandpuits refinery in mid-August.
• In Canada, Q3 2019 production averaged 58,504 boe/d, a decrease of 5% from the prior quarter. The decrease was primarily due to planned turnarounds and project delays caused by abnormally wet weather.
• In the Netherlands, Q3 2019 production averaged 7,429 boe/d, a decrease of 17% from the prior quarter, primarily due to a planned turnaround and subsequent repairs required on a gas compression facility.
• In Ireland, Q3 2019 production averaged 43 mmcf/d (7,202 boe/d), a decrease of 12% from the prior quarter. The decrease was primarily due to a planned plant turnaround and unplanned downtime at the Corrib natural gas processing facility. The downtime, which was unrelated to the plant turnaround, was remedied by early October.
• In Australia, Q3 2019 production averaged 5,564 bbl/d, a decrease of 17% from the previous quarter primarily due to well management and unplanned vessel maintenance on the Wandoo platform.
• Our Board of Directors has approved a 2020 Exploration and Development ("E&D") capital budget of $450 million, with associated production guidance of 100,000 to 103,000 boe/d. Our 2020 budget reflects continued emphasis on returning capital to investors, while still providing modest production growth. Within this budget, we also continue to advance strategic capital projects associated with early-stage exploration and development activities.
• We have elected to phase out the Dividend Reinvestment Plan ("DRIP"), prorating the available DRIP shares by 25% each quarter starting in Q1 2020, until completely eliminated in Q4 2020.
• Vermilion received top quartile rankings for 2019 for our industry sector in both the Sustainalytics ESG Rating and SAM (formerly known as RobecoSAM) annual Corporate Sustainability Assessment ("CSA"). These agencies analyze sustainability performance across economic, environmental, governance and social criteria, and the CSA is also the basis of the Dow Jones Sustainability Indices. Our 2019 Sustainability Report is available on our corporate website at: http://sustainability.vermilionenergy.com.
(1) Non-GAAP Financial Measure. Please see the “Non-GAAP Financial Measures” section of the accompanying Management’s Discussion and Analysis.(2) Berak-01 well (100% working interest) tested at a rate of 17.2 mmcf/d during a four-hour flow period with a stabilized flowing wellhead pressure of 908 psi on a
0.875 inch diameter choke. A final shut in wellhead pressure of 1,186 psi was recorded following the flow test. The flow test continued an additional 12 hours atreduced choke sizes to minimize flaring. No formation water was produced during the test. The well logged 21 feet of net gas pay with an average porosity of32% from the Upper Miocene Pannonian sandstone occurring within a gross measured depth interval of 3,006-3,033 feet. Test results are not necessarilyindicative of long-term performance or ultimate recovery.
Vermilion Energy Inc. ■ Page 3 ■ 2019 Third Quarter Report

($M except as indicated) Q3 2019 Q2 2019 Q3 2018 YTD 2019 YTD 2018FinancialPetroleum and natural gas sales 391,935 428,043 508,411 1,301,061 1,221,178Fund flows from operations 216,153 222,738 260,705 692,463 616,310 Fund flows from operations ($/basic share) (1) 1.39 1.44 1.71 4.49 4.51 Fund flows from operations ($/diluted share) (1) 1.39 1.42 1.69 4.45 4.46Net earnings (loss) (10,229) 2,004 (15,099) 31,322 (51,723) Net earnings (loss) ($/basic share) (0.07) 0.01 (0.10) 0.20 (0.38)Capital expenditures 127,879 92,607 146,185 422,539 354,634Acquisitions 4,657 8,623 198,173 29,307 1,756,736Asset retirement obligations settled 3,586 4,907 2,986 12,090 9,203Cash dividends ($/share) 0.690 0.690 0.690 2.070 2.025Dividends declared 107,176 106,884 105,192 319,609 282,801 % of fund flows from operations 50% 48% 40% 46% 46%Net dividends (1) 98,316 98,111 100,872 294,872 238,865 % of fund flows from operations 45% 44% 39% 43% 39%Payout (1) 229,781 195,625 250,043 729,501 602,702 % of fund flows from operations 106% 88% 96% 105% 98%Net debt 2,001,870 1,950,509 2,034,086 2,001,870 2,034,086Net debt to trailing twelve months fund flows from operations 2.19 2.03 2.55 2.19 2.55OperationalProduction Crude oil and condensate (bbls/d) 47,242 48,964 47,152 48,455 36,318 NGLs (bbls/d) 7,772 8,107 6,839 7,925 5,878 Natural gas (mmcf/d) 253.36 275.60 253.38 268.88 241.42 Total (boe/d) 97,239 103,003 96,222 101,193 82,433Average realized prices Crude oil and condensate ($/bbl) 73.45 79.46 85.84 75.38 84.98 NGLs ($/bbl) 6.14 11.25 27.97 13.25 26.61 Natural gas ($/mcf) 2.43 3.09 5.35 3.56 5.30Production mix (% of production) % priced with reference to WTI 39% 38% 37% 38% 30% % priced with reference to Dated Brent 19% 18% 18% 18% 21% % priced with reference to AECO 26% 26% 26% 26% 26% % priced with reference to TTF and NBP 16% 18% 19% 18% 23%Netbacks ($/boe) Operating netback (1) 28.22 29.62 34.85 29.80 33.26 Fund flows from operations netback 23.73 24.15 29.69 24.89 27.59 Operating expenses 11.55 11.04 11.13 11.85 10.94 General and administration expenses 1.50 1.70 1.51 1.53 1.75Average reference prices WTI (US $/bbl) 56.45 59.81 69.50 57.06 66.75 Edmonton Sweet index (US $/bbl) 51.79 55.19 62.68 52.34 60.69 Saskatchewan LSB index (US $/bbl) 52.01 55.54 63.35 52.81 60.61 Dated Brent (US $/bbl) 61.94 68.82 75.27 64.65 72.13 AECO ($/mcf) 1.06 1.03 1.19 1.64 1.48 NBP ($/mcf) 4.50 5.44 10.95 6.08 10.12 TTF ($/mcf) 4.40 5.75 10.92 6.08 10.00Average foreign currency exchange rates CDN $/US $ 1.32 1.34 1.31 1.33 1.29 CDN $/Euro 1.47 1.50 1.52 1.49 1.54Share information ('000s)Shares outstanding - basic 155,505 155,032 152,497 155,505 152,497Shares outstanding - diluted (1) 159,260 158,633 155,747 159,260 155,747Weighted average shares outstanding - basic 155,254 154,795 152,432 154,326 136,585Weighted average shares outstanding - diluted (1) 155,421 156,844 153,839 155,673 138,258
(1) The above table includes non-GAAP financial measures which may not be comparable to other companies. Please see the “Non-GAAP Financial Measures”section of the accompanying Management’s Discussion and Analysis.
Vermilion Energy Inc. ■ Page 4 ■ 2019 Third Quarter Report

Message to ShareholdersThe third quarter of 2019 continued to be an exceptionally difficult period for energy investors, as the upstream oil and gas sector traded down to multi-year lows and significantly underperformed the broader equity market. Vermilion was not spared. Our stock price declined over 30% during the quarter,bringing our current dividend yield to approximately 14%. While we are certainly disappointed with our share price performance, we would like to stressthat Vermilion’s dividend policy is not based on the market price of our shares. Our dividend policy is based on the fundamental economic sustainabilityand free cash flow generation of our business, which remains strong.
The capital markets environment for oil and gas companies has changed dramatically over recent years due to a multitude of factors, including poorinvestment returns from energy issuers, increased focus on ESG and SRI mandates, and a growing concern about the future of fossil fuels amongstboth investors and the general public. This has led to valuation multiple compression across the entire sector with many companies, including Vermilion,trading significantly below their historical valuation metrics. Despite these changing capital market dynamics, the oil and gas sector is a vital contributorto the global economy and will be around for many decades to support the long-term energy transition. During this transition, we believe there issignificant value to be realized from responsible energy investment, and that Vermilion is optimally positioned to prosper in this industry and marketenvironment. Our belief in Vermilion is founded in the economic sustainability of our business model and our leadership in environmental sustainabilityin the upstream oil and gas sector.
Throughout our 25-year history, we have repeatedly made the necessary adjustments to adapt to the changing landscape around us. Our businessmodel has focused on sustainable growth and income, which we have successfully delivered to our shareholders over the years. Vermilion has paidover $39 per share in distributions and dividends since 2003 and generated compounded growth in production per share of over 8% annually since2012. Our investment cycle time is short with minimal fixed commitments. Consequently, we have flexibility to adjust our investment and growth levelsto provide the combination of return of capital and growth which we think will maximize shareholder value in a changing capital market environment.Based on the current market and commodity environment, we believe a strategy that is even more focused on free cash flow generation will create themost value for our shareholders. As such, for 2020, while maintaining our dividend at current levels, we have elected to reduce our production growthrate and to introduce additional flexibility in how we return capital to investors.
This lower growth strategy was embedded in the preparation of our 2020 budget as well as our capital plans for the remainder of 2019. For 2019, wehave reduced capital investment by $10 million, and now expect to invest $520 million. As a result of this reduced level of investment and after accountingfor higher-than-expected downtime and weather delays, we have correspondingly reduced our 2019 annual production guidance to 100,000 to 101,000boe/d. We expect to deliver annual production at the mid-point of this revised guidance range, reflecting strong year-over-year production per sharegrowth of 5%. Our Board of Directors has approved a 2020 capital budget of $450 million with associated production guidance of 100,000 to 103,000boe/d. This budget is designed to deliver modest production growth of about 1%. The 2020 budget includes approximately $20 million of strategiccapital associated with early-stage exploration and development activities. These activities will lay the groundwork for future development and productiongrowth from a highly economic asset base.
During the third quarter we received approval from the TSX for a normal course issuer bid (“NCIB”), which will allow us to buy back up to 7.75 millionshares. With this approval, we intend to use the NCIB in combination with debt reduction when we have excess free cash flow available (beyonddividends) to enhance per share growth. We will also be phasing out our DRIP over the course of the next year, prorating the available DRIP sharesby 25% each quarter starting in Q1 2020 until the DRIP is completely eliminated in Q4 2020. The DRIP has been a shareholder service that we haveprovided since our first income distribution in 2003, with discounted share purchases offered until 2018. We recognize that the elimination of the DRIPmay be a disappointment to some shareholders. Nonetheless, we feel that in an environment of lower trading commissions, the establishment of ourNCIB, and lower energy issuer valuation multiples, the elimination of the DRIP is in the best interests of our broad shareholder group.
We remain committed to maximizing value for our shareholders over the long-term through a combination of a sustainable dividend, low financialleverage, share buybacks, and production growth as appropriate. In addition, we will remain disciplined in our acquisition strategy as we continue toevaluate strategic opportunities that fit within our business model and add value for existing shareholders. Our highest financial priority is our balancesheet, and under no circumstance will we do anything that jeopardizes Vermilion’s long-term financial stability. We have a robust balance sheet withtermed-out borrowing, strong liquidity, and a very low cost of debt. Coupled with low operating leverage due to high margins, a diversified product mix,and a strong hedge position, our balance sheet provides us with the flexibility to weather volatility in commodity prices.
Q3 2019 Operations Review
Our Q3 2019 operational results were impacted by several planned turnarounds, a high level of unplanned downtime, weather related delays and a moderate carry-over impact from the refinery outage in France. As a result, our Q3 2019 production decreased 6% from the prior quarter to 97,239 boe/d, with variances discussed by business unit below. We generated FFO of $216 million in the third quarter, down by 3% from the prior quarter, with positive contributions from hedging gains, lower G&A expense, and lower taxes partially offsetting lower production and commodity prices.
Vermilion Energy Inc. ■ Page 5 ■ 2019 Third Quarter Report

Europe
In France, Q3 2019 production averaged 10,347 boe/d, an increase of 6% from the prior quarter. Production volumes in the Paris Basin returned tonear full capacity in mid-August following the restart of the Grandpuits refinery which had been offline due to a failure on its main feedstock pipeline.Most of our wells in the Paris Basin have returned to pre-shutdown production levels, although some wells continue to clean up and workover activityis continuing to restore full productivity. The net impact from the refinery outage reduced our Q3 2019 production volumes by approximately 400 boe/d. In the Aquitaine Basin, production was consistent with the prior quarter as we successfully completed our 2019 workover campaign, which continuesto yield results above our expectations.
In the Netherlands, Q3 2019 production averaged 7,429 boe/d, a decrease of 17% from the prior quarter. The decrease was primarily due to a plannedturnaround and unexpected downtime to repair a gas compressor, which extended the length of the turnaround. The combined impact was a reductionin Netherlands production of approximately 1,200 boe/d in Q3 2019. Our facilities have returned to service and production has been restored. We arecurrently in the process of drilling the Weststellingwerf well (0.5 net), representing our first drilling activity in the Netherlands since 2017, and we expectdrilling to be completed before the end of the year.
In Ireland, production averaged 43 mmcf/d (7,202 boe/d) in Q3 2019, a decrease of 12% from the prior quarter. The decrease was primarily due toplanned and unplanned downtime at the Corrib natural gas processing facility and natural decline. Our planned turnaround was successfully completedas scheduled in mid-September. Later in the month, we identified the need for repairs in one of the plant auxiliary systems which necessitated shuttingthe plant down for approximately 10 days spanning the end of Q3 and early Q4 2019. The combined impact of the planned and unplanned downtimewas approximately 800 boe/d in Q3.
In Germany, production in Q3 2019 averaged 3,269 boe/d, a decrease of 6% from the prior quarter. The decrease was primarily due to unplanneddowntime on several operated and non-operated assets, partially offset by contributions from successful workovers performed earlier this year. Followingthe successful drilling of the Burgmoor Z5 (46% working interest) well, completed early in the third quarter of 2019, we continue to evaluate tie-inalternatives and expect to bring the well on production in late 2020.
In Central and Eastern Europe ("CEE"), we drilled one (1.0 net) natural gas exploration well in Croatia during Q3 2019, which resulted in a secondconsecutive gas discovery, testing at a rate of 17.2 mmcf/d(2). During the third quarter, we were also provisionally awarded the SA-07 license in Croatia,which is contiguous with our existing land position and will add approximately 500,000 net acres to our portfolio in the country. Vermilion continues tobe the largest onshore landholder in Croatia, with total licensed acreage of approximately 2.4 million net acres, including the new SA-07 block. InHungary, we began tie-in activities for the Mh-21 (0.3 net) and Battonya E-09 (1.0 net) wells, drilled in the second and third quarters of 2019, respectively,and expect to bring them on production during the fourth quarter of 2019.
North America
In Canada, production averaged 58,504 boe/d in Q3 2019, a decrease of 5% from the prior quarter. The decrease was primarily due to plannedturnarounds (700 boe/d impact) and project delays caused by abnormally wet weather (2,100 boe/d impact). We drilled or participated in 40 (38.3 net)wells in the third quarter of 2019, all of which were drilled in Saskatchewan, as no drilling in Alberta was possible due to wet conditions throughout thesummer. Well activity in Alberta, including tie-in and completions, was delayed until late September due to extremely wet ground, three months laterthan when we typically resume post-break-up activity. We brought 41 (36.2 net) wells on production in Saskatchewan and three (2.5 net) wells onproduction in Alberta during the quarter. We have continued to realize capital and operating efficiencies in our southeast Saskatchewan assets, achievinga 10% improvement in drilling, completion, equipping and tie-in (“DCET”) costs on our Q3 2019 open-hole drilling program compared to our Q1 2019program.
In the United States, Q3 2019 production averaged 4,925 boe/d, representing an increase of 12% from the prior quarter. The increase was primarilydriven by production contributions from our 2019 Hilight drilling campaign, as we successfully completed and brought on production four (4.0 net) wellsduring the third quarter. The increased production was partially offset by planned and unplanned third-party gas plant maintenance, which reducedproduction by approximately 200 boe/d. The first two wells drilled in the quarter were brought on production in late August and achieved an averagepeak IP30 rate of approximately 600 boe/d per well (86% oil and NGLs). The other two wells were brought on production at the end of September andare currently producing at an average rate of approximately 500 boe/d per well (92% oil and NGLs). We continue to progress along the learning curvein reducing costs since our Hilight acquisition one year ago, with a 20% DCET cost reduction in our H2 2019 program to-date compared to our H1 2019program. As a result of these cost savings, we have added two (1.5 net) wells to our 2019 program and plan to drill these wells in Q4 2019.
Australia
In Australia, production averaged 5,564 bbl/d in Q3 2019, a decrease of 17% from the previous quarter, primarily due to well management and unplannedvessel maintenance on the Wandoo platform. We plan to conduct facility upgrades in Q4 2019 to increase fluid handling capacity, which will necessitatea shutdown of the Wandoo platform for an estimated eight days in the fourth quarter of 2019.
Vermilion Energy Inc. ■ Page 6 ■ 2019 Third Quarter Report
2020 Budget
Our Board of Directors has approved an exploration and development capital expenditure budget of $450 million, with associated production guidanceof 100,000 to 103,000 boe/d. As previously communicated, we are placing less emphasis on production growth as we navigate the current commodityprice and capital markets environment.
We plan to drill 13 (8.7 net) wells in Europe. In addition, we plan to continue significant workover programs in France, Netherlands and Germany, andfacility optimization in Ireland. The capital budget includes approximately $20 million of strategic, non-production-adding capital invested to facilitateour long-term future growth plans in Europe.
In North America, our activity will focus on our three core areas of southeast Saskatchewan (light oil), west-central Alberta (condensate-rich naturalgas), and the Powder River Basin in Wyoming (light oil). We have made significant progress on improving the capital and operating efficiencies on theNorth American assets we acquired in 2018, and we plan to continue that trend in 2020.
Assuming WTI oil prices remain at approximately US$55/bbl in 2020, and holding all other commodities at the October 11, 2019 commodity strip, wewould more than cover our dividend and capital investment. Excess cash generated beyond our capital program and dividend commitment will beallocated to a combination of debt reduction and share buybacks. Our top financial priorities in 2020 will be balance sheet and dividend protection, andwe maintain the capital investment flexibility to reduce capital outlays if required by lower commodity prices.
Europe
In France, our 2020 E&D capital budget of $57 million represents a 23% reduction from our 2019 spending. While we do not intend to invest in anynew wells in 2020, we plan to continue with our workover and asset optimization programs in both the Paris and Aquitaine Basins. These workoverprograms are expected to maintain production at roughly the same level in 2020 as we have averaged in 2019.
Our 2020 E&D budget in the Netherlands of $18 million represents a 22% decrease from 2019. While significant progress has been made on ourpermitting efforts, we will plan for modest growth in the Netherlands in 2020 as we reschedule our slate of capital projects in the context of a lowercorporate growth rate target. We plan to drill or participate in three (0.6 net) wells. Assuming success on the Weststellingwerf well (0.5 net) currentlybeing drilled, we plan to bring this well on production during the first half of 2020. We will continue to advance our well permitting throughout the yearin order to compile a backlog of projects for implementation beginning in 2021.
In Ireland, we plan to invest approximately $3 million of E&D capital in 2020 as we continue to focus on facility maintenance and compression optimization.
In Germany, our 2020 E&D capital budget of $18 million represents a decrease of 18% year-over-year. In addition to our planned workover and facilityprogram, we plan to drill sidetracks in three (3.0 net) of our operated oil wells and begin drilling activities on one (0.6 net) exploratory gas prospect.
In Central and Eastern Europe, our 2020 E&D budget will be approximately the same as in 2019, building on the success we had in 2019 and layingthe groundwork for future growth. We plan to invest $20 million in E&D capital expenditures in 2020. While the majority of this capital program will befocused on following-up our successful 2019 drilling program, a portion of the budget will be directed to strategic infrastructure investments in Croatiaand Slovakia, notably the commencement of construction of natural gas compression facilities in each country. In 2020, we plan to drill six (4.5 net)wells in CEE comprised of two (2.0 net) wells in Croatia, one (1.0 net) well in Hungary and three (1.5 net) wells in Slovakia.
North America
In Canada, we plan to invest $250 million of E&D capital in 2020, a decrease of 14% from our 2019 capital program. We plan to drill 107 (95.5 net)wells in Canada in 2020, comprised of 87 (76.3 net) light oil wells in southeast Saskatchewan and 20 (19.2 net) wells in Alberta. In addition to the drillingprogram, we will also continue to focus on our waterflood program in southeast Saskatchewan, as well as production and facility optimization opportunities,as we have in previous years.
In the United States, our 2020 E&D capital budget of $59 million represents a 4% increase from our 2019 capital program. We plan to drill 10 (9.6 net)wells on our Hilight asset in Wyoming. This expanded drilling program will allow us to capitalize on the efficiencies we have achieved since the Hilightacquisition and to continue to increase production in the Powder River Basin.
Vermilion Energy Inc. ■ Page 7 ■ 2019 Third Quarter Report

Australia
In Australia, our 2020 E&D budget of $25 million will focus primarily on workovers and facility modifications to increase artificial lift capacity and facilitythroughput.
E&D Capital Investment by Country
Country2020 Budget*
($MM)2019 Budget
($MM)2020 vs. 2019
% Change2020
Gross Wells2020
Net WellsCanada 250 292 (14)% 107 95.5France 57 74 (23)% — —Netherlands 18 23 (22)% 3 0.6Germany 18 22 (18)% 4 3.6Ireland 3 1 200 % — —Australia 25 31 (19)% — —USA 59 57 4 % 10 9.6Central and Eastern Europe 20 20 — % 6 4.5Total E&D Capital Expenditures 450 520 (13)% 130 113.8
E&D Capital Investment by Category
Category2020 Budget*
($MM)2019 Budget
($MM)2020 vs. 2019
% ChangeDrilling, completion, new well equipment and tie-in, workovers and recompletions 350 380 (8)%Production equipment and facilities 70 100 (30)%Seismic, land and other 30 40 (25)%Total E&D Capital Expenditures 450 520 (13)%
*2020 Budget reflects foreign exchange assumptions of CAD/USD 1.32, CAD/EUR 1.48, and CAD/AUD 0.90.
Dividend Reinvestment Plan
We have elected to phase out the Dividend Reinvestment Plan ("DRIP"), prorating the available DRIP shares by 25% each quarter starting in Q1 2020.It is our intention to increase this proration each quarter throughout next year, such that the DRIP will be eliminated by the fourth quarter of 2020.
Commodity Hedging
Vermilion hedges to manage commodity price exposures and increase the stability of our cash flows, providing additional certainty with regard to theexecution of our dividend and capital programs. In aggregate, as of October 29, 2019, we currently have 51% of our expected net-of-royalty productionhedged for Q4 2019. More than half of our Q4 2019 corporate hedge position consists of two-way collars and three-way structures, which allowparticipation in price increases up to contract ceilings. For 2020, approximately one-third of our production is hedged, with 54% of our hedge positionin participating structures.
With respect to individual products within our product mix, we have currently hedged 74% of anticipated European natural gas volumes for Q4 2019.We have also hedged 75% of our anticipated full-year 2020 European natural gas volumes at prices which are expected to provide for strong projecteconomics and free cash flows. At present, 47% of our expected Q4 oil production is hedged. For Q4 2019, 51% of our North American natural gasproduction is priced away from AECO, due to diversification hedges to financially sell at the SoCal Border and at Henry Hub for a portion of our Albertanatural gas production, and because 16% of our North American gas production is located in Saskatchewan and Wyoming.
Vermilion Energy Inc. ■ Page 8 ■ 2019 Third Quarter Report
Sustainability
Vermilion received top quartile rankings for 2019 for our industry sector in both the Sustainalytics ESG Rating and SAM (formerly known as RobecoSAM)annual Corporate Sustainability Assessment ("CSA"). These agencies analyze sustainability performance across economic, environmental, governanceand social criteria, and the CSA is also the basis of the Dow Jones Sustainability Indices. We believe the integration of sustainability principles into ourbusiness is the right thing to do, increases shareholder return, and reduces long-term risks to our business model. These ratings demonstrate ourcommitment to maintaining leadership in sustainability and ESG performance. Our 2019 Sustainability Report is available on our corporate website at:http://sustainability.vermilionenergy.com.
(signed “Anthony Marino”)
Anthony MarinoPresident & Chief Executive OfficerOctober 30, 2019
(1) Non-GAAP Financial Measure. Please see the “Non-GAAP Financial Measures” section of Management’s Discussion and Analysis.
(2) Berak-01 well (100% working interest) tested at a rate of 17.2 mmcf/d during a four-hour flow period with a stabilized flowing wellhead pressure of 908 psi on a0.875 inch diameter choke. A final shut in wellhead pressure of 1,186 psi was recorded following the flow test. The flow test continued an additional 12 hours atreduced choke sizes to minimize flaring. No formation water was produced during the test. The well logged 21 feet of net gas pay with an average porosity of32% from the Upper Miocene Pannonian sandstone occurring within a gross measured depth interval of 3,006-3,033 feet. Test results are not necessarilyindicative of long-term performance or ultimate recovery.
Vermilion Energy Inc. ■ Page 9 ■ 2019 Third Quarter Report

Management's Discussion and Analysis
Vermilion Energy Inc. ■ Page 10 ■ 2019 Third Quarter Report
The following is Management’s Discussion and Analysis (“MD&A”), dated October 30, 2019, of Vermilion Energy Inc.’s (“Vermilion”, “we”, “our”, “us” orthe “Company”) operating and financial results as at and for the three and nine months ended September 30, 2019 compared with the correspondingperiods in the prior year.
This discussion should be read in conjunction with the unaudited condensed consolidated interim financial statements for the three and nine monthsended September 30, 2019 and the audited consolidated financial statements for the years ended December 31, 2018 and 2017, together with theaccompanying notes. Additional information relating to Vermilion, including its Annual Information Form, is available on SEDAR at www.sedar.com oron Vermilion’s website at www.vermilionenergy.com.
The unaudited condensed consolidated interim financial statements for the three and nine months ended September 30, 2019 and comparativeinformation have been prepared in Canadian dollars, except where another currency has been indicated, and in accordance with IAS 34, "InterimFinancial Reporting", as issued by the International Accounting Standards Board ("IASB").
This MD&A includes references to certain financial and performance measures which do not have standardized meanings prescribed by InternationalFinancial Reporting Standards ("IFRS"). These measures include:
• Fund flows from operations: Fund flows from operations is a measure of profit or loss in accordance with IFRS 8 “Operating Segments”. Pleasesee "Segmented Information" in the "Notes to the Condensed Consolidated Interim Financial Statements" for a reconciliation of fund flows fromoperations to net earnings. We analyze fund flows from operations both on a consolidated basis and on a business unit basis in order to assessthe contribution of each business unit to our ability to generate income necessary to pay dividends, repay debt, fund asset retirement obligationsand make capital investments.
• Net debt: Net debt is a capital management measure in accordance with IAS 1 "Presentation of Financial Statements". Net debt is comprised oflong-term debt plus current liabilities less current assets and represents Vermilion's net financing obligations after adjusting for the timing of workingcapital fluctuations. Net debt excludes non-current lease obligations which are secured by a corresponding right-of-use asset. Please see "Capitaldisclosures" in the "Notes to the Condensed Consolidated Interim Financial Statements" for additional information.
• Netbacks: Netbacks are per boe and per mcf performance measures used in the analysis of operational activities. We assess netbacks both ona consolidated basis and on a business unit basis in order to compare and assess the operational and financial performance of each business unitversus other business units and also versus third party crude oil and natural gas producers.
In addition, this MD&A includes references to certain financial measures which are not specified, defined, or determined under IFRS and are thereforeconsidered non-GAAP financial measures. These non-GAAP financial measures are unlikely to be comparable to similar financial measures presentedby other issuers. For a full description of these non-GAAP financial measures and a reconciliation of these measures to their most directly comparableGAAP measures, please refer to “Non-GAAP Financial Measures”.

Condensate PresentationWe report our condensate production in Canada and the Netherlands business units within the crude oil and condensate production line. We believethat this presentation better reflects the historical and forecasted pricing for condensate, which is more closely correlated with crude oil pricing than withpricing for propane, butane and ethane (collectively “NGLs” for the purposes of this report).
Vermilion Energy Inc. ■ Page 11 ■ 2019 Third Quarter Report

GuidanceOn October 25, 2018, we released our 2019 capital budget and related guidance. On February 27, 2019, we deferred some activity to later in the yearand reallocated capital between business units, although the 2019 total budget and production guidance remained unchanged. On October 31, 2019,we reduced our 2019 capital expenditure guidance to $520 million and our 2019 annual production guidance to 100,000 to 101,000 boe/d.
We released our 2020 capital budget and associated production guidance concurrent with the release of our Q3 2019 results.
The following table summarizes our guidance:
Date Capital Expenditures ($MM) Production (boe/d)2019 Guidance2019 Guidance October 25, 2018 530 101,000 to 106,0002019 Guidance October 31, 2019 520 100,000 to 101,0002020 Guidance2020 Guidance October 31, 2019 450 100,000 to 103,000
Vermilion Energy Inc. ■ Page 12 ■ 2019 Third Quarter Report

Vermilion's BusinessVermilion is a Calgary, Alberta based international oil and gas producer focused on the acquisition, exploration, development, and optimization ofproducing properties in North America, Europe, and Australia. We manage our business through our Calgary head office and our international businessunit offices. This MD&A separately discusses each of our business units in addition to our corporate segment.
Vermilion Energy Inc. ■ Page 13 ■ 2019 Third Quarter Report

Consolidated Results Overview
Q3 2019 Q2 2019 Q3 2018Q3/19 vs.
Q2/19Q3/19 vs.
Q3/18 YTD 2019 YTD 20182019 vs.
2018Production
Crude oil and condensate (bbls/d) 47,242 48,964 47,152 (3.5)% 0.2% 48,455 36,318 33.4%
NGLs (bbls/d) 7,772 8,107 6,839 (4.1)% 13.6% 7,925 5,878 34.8%
Natural gas (mmcf/d) 253.36 275.60 253.38 (8.1)% —% 268.88 241.42 11.4%
Total (boe/d) 97,239 103,003 96,222 (5.6)% 1.1% 101,193 82,433 22.8%
SalesCrude oil and condensate (bbls/d) 48,979 47,337 46,368 3.5% 5.6% 49,120 35,749 37.4%
NGLs (bbls/d) 7,772 8,107 6,839 (4.1)% 13.6% 7,925 5,878 34.8%
Natural gas (mmcf/d) 253.36 275.60 253.38 (8.1)% —% 268.88 241.42 11.4%
Total (boe/d) 98,976 101,377 95,437 (2.4)% 3.7% 101,858 81,864 24.4%
(Draw) build in inventory (mbbls) (159) 149 73 (182) 155
Financial metricsFund flows from operations ($M) 216,153 222,738 260,705 (3.0)% (17.1)% 692,463 616,310 12.4%
Per share ($/basic share) 1.39 1.44 1.71 (3.5)% (18.7)% 4.49 4.51 (0.4)%
Net (loss) earnings ($M) (10,229) 2,004 (15,099) N/A (32.3)% 31,322 (51,723) N/A
Per share ($/basic share) (0.07) 0.01 (0.10) N/A (30.0)% 0.20 (0.38) N/A
Net debt ($M) 2,001,870 1,950,509 2,034,086 2.6% (1.6)% 2,001,870 2,034,086 (1.6)%
Cash dividends ($/share) 0.690 0.690 0.690 —% —% 2.070 2.025 2.2%
ActivityCapital expenditures ($M) 127,879 92,607 146,185 38.1% (12.5)% 422,539 354,634 19.1%
Acquisitions ($M) 4,657 8,623 198,173 29,307 1,756,736
Gross wells drilled 47.00 35.00 65.00 148.00 112.00
Net wells drilled 45.31 27.88 58.97 136.13 102.85
Vermilion Energy Inc. ■ Page 14 ■ 2019 Third Quarter Report
Financial performance review
Q3 2019 vs. Q2 2019
Net loss of $10.2MM in Q3 2019 compared to net earnings of $2.0MM in Q2 2019
50
0
-50
$MM
Q2 2019Deferred tax Other
Unrealized derivatives, foreign exchange
Fund flows from operationsQ3 2019
"Other" contains depletion and depreciation, equity based compensation, accretion, and unrealized other
$2.0
$30.2 $8.3
$(44.1) $(6.6) $(10.2)
• We recorded a net loss for Q3 2019 of $10.2 million ($0.07/basic share) compared to net earnings of $2.0 million ($0.01/basic share) in Q2 2019.This quarter-over-quarter decrease in net earnings was primarily attributable to an unrealized loss on foreign exchange of $50.7 million (comparedto an unrealized gain of $41.8 million for Q2 2019). This decrease was partially offset by a decrease in deferred tax expense of $30.2 million.

3% decrease in fund flows from operations from Q2 2019 to Q3 2019
250
175
100
$MM
Q2 2019 OtherSales volume
Pricing net of derivatives
Royalties, transportation, operating expenseQ3 2019
"Other" contains general and administration, corporate income taxes, interest, realized foreign exchange, and realized other
$222.7 $12.2 $11.9
$(25.2) $(5.4)
$216.2
• We generated fund flows from operations of $216.2 million during Q3 2019, a slight decrease of 3% from Q2 2019 despite more significant decreasesin commodity prices quarter-over-quarter, which included an 11% decrease in Dated Brent and a 23% decrease in TTF prices.
• We were able to mitigate a portion of the impact of commodity prices with our hedge program, which is designed to reduce volatility in our cashflows. Decreases in commodity prices reduced our realized price per barrel by $3.36 per boe, which was partially offset by a $2.52 per boe increasein realized derivative gains.
• In addition, we were able to reduce a portion of the impact of commodity prices by reducing our corporate costs, included in "Other" in the abovechart. We realized a 9% reduction in interest expense as a result of our cross currency interest rate swaps entered into in Q2 2019 and an 11%reduction in general and administration expense.
Q3 2019 vs. Q3 2018
Net loss of $10.2MM in Q3 2019 compared to a net loss of $15.1MM in Q3 2018
100
25
-50
-125
$MM
Q3 2018
Unrealized derivatives, foreign exchange
Fund flows from operations OtherDeferred tax
Q3 2019
"Other" contains depletion and depreciation, equity based compensation, accretion, and unrealized other
$(15.1)
$66.0
$(44.6) $(11.0) $(5.5) $(10.2)
• We recorded a net loss for Q3 2019 of $10.2 million ($0.07/basic share) compared to a net loss of $15.1 million ($0.10/basic share) in Q3 2018.This change is primarily driven by an unrealized gain on derivative instruments of $17.8 million in Q3 2019 (compared to an unrealized loss of$75.8 million in Q3 2018) offset by an unrealized foreign exchange loss of $50.7 million in Q3 2019 (compared to an unrealized loss of $23.0 millionin Q3 2018). This was partially offset by a decrease in funds flow from operations of $44.6 million.
Vermilion Energy Inc. ■ Page 15 ■ 2019 Third Quarter Report

17% decrease in fund flows from operations from Q3 2018 to Q3 2019
300
250
200
150
$MM
Q3 2018Sales volume
Pricing net of derivatives Other
Royalties, transportation, operating expenseQ3 2019
"Other" contains general and administration, corporate income taxes, interest, realized FX, and realized other
$260.7$20.2
$(62.3) $(1.6) $(0.8)
$216.2
• We generated fund flows from operations of $216.2 million in Q3 2019, a decrease from $260.7 million in Q3 2018. We increased our sales volumesyear-over-year by 4% following the successful drilling campaigns in Australia and the United States. The resulting increase in revenues were offsetby lower commodity prices.
Vermilion Energy Inc. ■ Page 16 ■ 2019 Third Quarter Report
YTD 2019 vs. YTD 2018
Net earning $31.3MM in YTD 2019 compared to net loss of $51.7MM in YTD 2018
250
0
-250
$MM
Q3 2018
Unrealized derivatives, foreign exchange, and other
Fund flows from operations OtherDeferred tax
Q3 2019
"Other" contains depletion and depreciation, equity based compensation, accretion, and unrealized other
$(51.7)
$178.0$76.2
$(111.8)$(59.4)
$31.3
• For the nine months ended September 30, 2019, net earnings of $31.3 million were recorded compared to a net loss of $51.7 million for thecomparable period in 2018. The increase in net earnings resulted from a year-over-year increase in fund flows from operations of $76.2 milliondue to increased sales volumes offset by related incremental expenses associated with the increased volumes and lower commodity prices. Theincrease in net earnings is also due to lower unrealized losses year over year. For the nine months ended September 30, 2019, we recognizedan unrealized gain on foreign exchange of $14.4 million and an unrealized loss on derivative instruments of $27.1 million (compared to unrealizedlosses of $26.9 million and $163.8 million respectively, for the comparable period in 2018). These increases to net earnings were partially offsetby an increase of $100.6 million in depletion and depreciation expense associated with higher sales volumes.

12% increase in fund flows from operations from YTD 2018 to YTD 2019
1,500
1,000
500
0
$MM
Q3 2018Sales volume
Royalties, transportation, operating expense Other OtherQ3 2019
"Other" contains general and administration, current income taxes, interest, realized foreign exchange, and realized other
$616.3$299.9
$(121.6) $(26.5) $(26.5)
$692.5
• Fund flows from operations increased 12% for the nine months ended September 30, 2019 versus the same period in 2018 due to a 24% increasein sales volumes. Our consolidated realized price decreased by 14% from $54.64/boe to $46.79/boe due to weaker crude oil and natural gaspricing.
• We were able to mitigate a portion of the impact of commodity prices with our hedge program, which is designed to reduce volatility in our cashflows. Decreases in commodity prices reduced our realized price per barrel by $7.85 per boe, which was partially offset by a $5.92 per boe increasein realized derivative gains.
Vermilion Energy Inc. ■ Page 17 ■ 2019 Third Quarter Report
Production review
Q3 2019 vs. Q2 2019 • Consolidated average production of 97,239 boe/d during Q3 2019 decreased 6% compared to Q2 2019 production of 103,003 boe/d. Production
increased in the United States from organic growth and in France as production volumes in the Paris Basin returned to near full capacity in mid-August following the impact of a third party refinery outage in Q2 2019. These increases were offset by lower production as a result of a numberof operated and non-operated plant turnarounds during the quarter, unplanned downtime in Netherlands and Ireland, and weather delays.
Q3 2019 vs. Q3 2018 • Consolidated average production of 97,239 boe/d in Q3 2019 represented an increase of 1% from Q3 2018 due to growth in the United States,
Canada, and Australia. In the United States, production growth resulted from an acquisition in Q3 2018 and organic drilling activity, includingbringing on production four (4.0 net) wells in Q3 2019. In Canada, production growth resulted from the continued development of our southeastSaskatchewan light oil development and our Mannville condensate-rich resource play. Production in Australia increased due to the two-well drillingprogram brought on production in Q1 2019. These increases were partially offset by lower production in Ireland and France.
YTD 2019 vs. YTD 2018 • For the nine months ended September 30, 2019, consolidated average production of 101,193 boe/d represented an increase of 23% from the
comparable period in 2018 due to growth in Canada, the United States, Australia, and the Netherlands. In Canada, production increased as aresult of acquisitions in 2018 and continued organic growth. In the United States, production increases resulted from an acquisition in Q3 2018and eight (8.0 net) wells drilled and brought on production in year-to-date 2019. Production in Australia increased due to the two-well drillingprogram brought on production in Q1 2019. In the Netherlands, production increased as a result of a new well brought on production in Q3 2018and from a successful workover program in the first half of 2019.

Activity review
Q3 2019 capital expenditures of $127.9MM by business unit
Canada: 57%
United States: 16%
Corporate: 6%
France: 14%Netherlands: 2%
Germany: 3%Australia: 2%
• For the three months ended September 30, 2019, capital expenditures of $127.9 million primarily related to activity in Canada, the United States,and France. In Canada, capital expenditures of $70.0 million included the drilling of 40.0 (38.3 net) wells, all of which were drilled in Saskatchewan.Capital expenditures of $21.1 million in the United States related to drilling, completing and bringing on production four (4.0 net) wells. In France,capital expenditures of $18.1 million related to workovers and facility costs.
Vermilion Energy Inc. ■ Page 18 ■ 2019 Third Quarter Report
Sustainability review
Dividends• Declared dividends of $0.23 per common share per month throughout 2019, resulting in total dividends declared of $2.07 per common share for
the nine months ended September 30, 2019.
Long-term debt and net debt• Long-term debt increased to $2.0 billion as at September 30, 2019 from $1.8 billion as at December 31, 2018. This increase was primarily a result
of increased borrowings on the revolving credit facility and was partially offset by the impact of the stronger Canadian dollar on our US-denominatedSenior Unsecured Notes.
• Net debt increased to $2.0 billion as at September 30, 2019, from $1.9 billion at December 31, 2018, primarily due to increased borrowings on ourrevolving credit facility.
• The ratio of net debt to trailing twelve months fund flows from operations decreased to 2.19 (December 31, 2018 - 2.30) as the increase to netdebt was offset by higher trailing twelve months fund flows from operations.

Benchmark Commodity Prices
Q3 2019 Q2 2019 Q3 2018Q3/19 vs.
Q2/19Q3/19 vs.
Q3/18YTD2019
YTD2018
2019 vs.2018
Crude oil WTI ($/bbl) 74.55 80.00 90.83 (6.8)% (17.9)% 75.84 85.95 (11.8)% WTI (US $/bbl) 56.45 59.81 69.50 (5.6)% (18.8)% 57.06 66.75 (14.5)% Edmonton Sweet index ($/bbl) 68.39 73.82 81.92 (7.4)% (16.5)% 69.57 78.14 (11.0)% Edmonton Sweet index (US $/bbl) 51.79 55.19 62.68 (6.2)% (17.4)% 52.34 60.69 (13.8)% Saskatchewan LSB index ($/bbl) 68.68 74.28 82.79 (7.5)% (17.0)% 70.19 78.04 (10.1)% Saskatchewan LSB index (US $/bbl) 52.01 55.54 63.35 (6.4)% (17.9)% 52.81 60.61 (12.9)% Canadian C5+ Condensate index ($/bbl) 68.70 74.70 87.22 (8.0)% (21.2)% 70.19 85.24 (17.7)% Canadian C5+ Condensate index (US $/bbl) 52.02 55.85 66.74 (6.9)% (22.1)% 52.81 66.20 (20.2)% Dated Brent ($/bbl) 81.80 92.05 98.37 (11.1)% (16.8)% 85.93 92.87 (7.5)% Dated Brent (US $/bbl) 61.94 68.82 75.27 (10.0)% (17.7)% 64.65 72.13 (10.4)%Natural gas AECO ($/mcf) 1.06 1.03 1.19 2.9% (10.9)% 1.64 1.48 10.8% NBP ($/mcf) 4.50 5.44 10.95 (17.3)% (58.9)% 6.08 10.12 (39.9)% NBP (€/mcf) 3.07 3.62 7.20 (15.2)% (57.4)% 4.07 6.58 (38.1)% TTF ($/mcf) 4.40 5.75 10.92 (23.5)% (59.7)% 6.08 10.00 (39.2)% TTF (€/mcf) 3.00 3.82 7.18 (21.5)% (58.2)% 4.07 6.50 (37.4)% Henry Hub ($/mcf) 2.94 3.53 3.80 (16.7)% (22.6)% 3.55 3.74 (5.1)% Henry Hub (US $/mcf) 2.23 2.64 2.90 (15.5)% (23.1)% 2.67 2.90 (7.9)%Average exchange ratesCDN $/US $ 1.32 1.34 1.31 (1.5)% 0.8% 1.33 1.29 3.1%CDN $/Euro 1.47 1.50 1.52 (2.0)% (3.3)% 1.49 1.54 (3.2)%Realized PricesCrude oil and condensate ($/bbl) 73.45 79.46 85.84 (7.6)% (14.4)% 75.38 84.98 (11.3)%NGLs ($/bbl) 6.14 11.25 27.97 (45.4)% (78.0)% 13.25 26.61 (50.2)%Natural gas ($/mcf) 2.43 3.09 5.35 (21.4)% (54.6)% 3.56 5.30 (32.8)%Total ($/boe) 43.04 46.40 57.90 (7.2)% (25.7)% 46.79 54.64 (14.4)%
Dated Brent (38% of Q3 2019sales volumes)
WTI (6% of Q3 2019 salesvolumes)
Canadian C5+ (8% of Q3 2019sales volumes)
Crude oil and condensaterealized price
Saskatchewan LSB (41% of Q32019 sales volumes)
Edmonton Sweet index (7% ofQ3 2019 sales volumes)
Q3 2019 realized crude oil and condensate price was a 7% premium to Edmonton Sweet Index
115.00
95.00
75.00
55.00
35.00
$/bbl
Q3 2018 Q4 2018 Q1 2019 Q2 2019 Q3 2019
• Crude oil prices fell in Q3 2019 relative to Q2 2019, driven by softening sentiment on global oil demand growth. By the end of Q3 2019,quarter-over-quarter WTI and Brent prices decreased by 7% and 11% respectively, in Canadian dollar terms. For the three months endedSeptember 30, 2019, WTI and Brent prices in Canadian dollar terms decreased by 18% and 17%, respectively, versus the comparable periodin the prior year.
Vermilion Energy Inc. ■ Page 19 ■ 2019 Third Quarter Report

• In Canadian dollar terms, quarter-over-quarter, the Edmonton Sweet differential narrowed by $0.02/bbl to a discount of $6.16/bbl against WTI,and the Saskatchewan LSB differential widened by $0.15/bbl to a discount of $5.87/bbl against WTI.
• Vermilion's crude oil production benefits from light oil pricing and no exposure to significantly discounted heavy crude oil. Approximately 38%of our Q3 2019 crude oil and condensate production was priced at the Dated Brent index (which averaged a premium to WTI of US$5.49/bbl), while the remainder of our crude oil and condensate production was priced at the Saskatchewan LSB, Canadian C5+, Edmonton Sweet,and WTI indices. Saskatchewan LSB and Canadian C5+ typically have lower differentials than the more significantly constrained WCS andMSW markers, making Vermilion's North American crude oil production price-advantaged relative to other North American benchmark prices.
NBP (17% of Q3 2019 salesvolumes)
TTF (23% of Q3 2019 salesvolumes)
Natural gas realized price
Henry Hub (3% of Q3 2019sales volumes)
AECO (57% of Q3 2019 salesvolumes)
Q3 2019 realized natural gas price was a $1.37/mcf premium to AECO
14.00
12.00
10.00
8.00
6.00
4.00
2.00
0.00
$/mmb
tu
Q3 2018 Q4 2018 Q1 2019 Q2 2019 Q3 2019
• In Canadian dollar terms, market prices for European natural gas (TTF and NBP) declined by 17% and 24% respectively in Q3 2019 comparedto Q2 2019 primarily due to persistent oversupply during the summer, when demand is seasonally low.
• Natural gas prices at AECO in Q3 2019 increased by 3% compared to Q2 2019.• For Q3 2019, average European natural gas prices represented a $3.39/mcf premium to AECO and a $1.51/mcf premium to Henry Hub
pricing. Approximately 40% of our natural gas production in Q3 2019 benefited from this premium European pricing. As a result, our consolidatednatural gas realized price was a $1.37/mcf premium to AECO.
CDN $/Euro
CDN $/US $
Quarter-over-quarter, the Canadian dollar strengthened slightly versus the Euro and USD
1.60
1.50
1.40
1.30
1.20
CDN
$/FX
Q3 2018 Q4 2018 Q1 2019 Q2 2019 Q3 2019
• For the three months ended September 30, 2019, the Canadian dollar strengthened slightly against the US dollar quarter-over-quarter. • For the three months ended September 30, 2019, the Canadian dollar strengthened slightly against the Euro quarter-over-quarter.
Vermilion Energy Inc. ■ Page 20 ■ 2019 Third Quarter Report

Canada Business UnitOverview
Production and assets focused in West Pembina near Drayton Valley, Alberta and in southeast Saskatchewan and Manitoba.• Potential for three significant resource plays sharing the same surface infrastructure in the West Pembina region in Alberta:
– Mannville condensate-rich gas (2,400 - 2,700m depth) - in development phase– Cardium light oil (1,800m depth) - modest investment at present– Duvernay condensate-rich gas (3,200 - 3,400m depth) - no investment at present
• Southeast Saskatchewan light oil development:– Targeting the Mississippian Midale (1,400 - 1,700m depth), Frobisher/Alida (1,200 - 1,400m depth) and Ratcliffe (1,800 - 1,900m) formations
Operational and financial review
Canada business unit($M except as indicated) Q3 2019 Q2 2019 Q3 2018
Q3/19 vs.Q2/19
Q3/19 vs.Q3/18 YTD 2019 YTD 2018
2019 vs.2018
Production and salesCrude oil and condensate (bbls/d) 27,682 28,844 28,477 (4.0)% (2.8)% 28,558 18,323 55.9%NGLs (bbls/d) 6,632 7,352 6,126 (9.8)% 8.3% 6,983 5,611 24.5%Natural gas (mmcf/d) 145.14 151.87 136.77 (4.4)% 6.1% 149.44 123.54 21.0%Total (boe/d) 58,504 61,507 57,397 (4.9)% 1.9% 60,447 44,524 35.8%
Production mix (% of total)Crude oil and condensate 47% 47% 50% 47% 41%NGLs 12% 12% 10% 12% 13%Natural gas 41% 41% 40% 41% 46%
ActivityCapital expenditures 69,963 29,083 89,837 140.6% (22.1)% 227,101 187,646 21.0%Acquisitions 1,746 2,655 6,146 19,061 1,561,731Gross wells drilled 40.00 28.00 65.00 126.00 101.00Net wells drilled 38.31 22.87 58.97 116.12 91.85
Financial resultsSales 188,073 212,944 243,016 (11.7)% (22.6)% 621,173 484,864 28.1%Royalties (23,909) (20,711) (33,801) 15.4% (29.3)% (69,951) (59,112) 18.3%Transportation (10,404) (9,781) (9,057) 6.4% 14.9% (30,877) (18,783) 64.4%Operating (57,851) (60,404) (55,577) (4.2)% 4.1% (181,859) (115,435) 57.5%General and administration (5,793) (7,405) (1,316) (21.8)% 340.2% (15,917) (3,907) 307.4%Fund flows from operations 90,116 114,643 143,265 (21.4)% (37.1)% 322,569 287,627 12.1%
Netbacks ($/boe)Sales 34.94 38.04 46.02 (8.1)% (24.1)% 37.64 39.89 (5.6)%Royalties (4.44) (3.70) (6.40) 20.0% (30.6)% (4.24) (4.86) (12.8)%Transportation (1.93) (1.75) (1.72) 10.3% 12.2% (1.87) (1.55) 20.6%Operating (10.75) (10.79) (10.52) (0.4)% 2.2% (11.02) (9.50) 16.0%General and administration (1.08) (1.32) (0.25) (18.2)% 332.0% (0.96) (0.32) 200.0%Fund flows from operations netback 16.74 20.48 27.13 (18.3)% (38.3)% 19.55 23.66 (17.4)%
Realized pricesCrude oil and condensate ($/bbl) 66.45 72.52 79.86 (8.4)% (16.8)% 68.16 78.92 (13.6)%NGLs ($/bbl) 5.57 10.61 27.82 (47.5)% (80.0)% 12.79 26.47 (51.7)%Natural gas ($/mcf) 1.16 1.12 1.44 3.6% (19.4)% 1.58 1.47 7.5%Total ($/boe) 34.94 38.04 46.02 (8.1)% (24.1)% 37.64 39.89 (5.6)%
Reference pricesWTI (US $/bbl) 56.45 59.81 69.50 (5.6)% (18.8)% 57.06 66.75 (14.5)%Edmonton Sweet index ($/bbl) 68.39 73.82 81.92 (7.4)% (16.5)% 69.57 78.14 (11.0)%Saskatchewan LSB index ($/bbl) 68.68 74.28 82.79 (7.5)% (17.0)% 70.19 78.04 (10.1)%Canadian C5+ Condensate index ($/bbl) 68.70 74.70 87.22 (8.0)% (21.2)% 70.19 85.24 (17.7)%AECO ($/mcf) 1.06 1.03 1.19 2.9% (10.9)% 1.64 1.48 10.8%
Vermilion Energy Inc. ■ Page 21 ■ 2019 Third Quarter Report

Production• Q3 2019 production decreased 5% from the prior quarter due to planned turnarounds and project delays caused by abnormally wet weather.
Quarterly production increased 2% year-over-year primarily due to our 2019 drilling activity.
Activity reviewVermilion drilled 40 (38.3 net) operated wells in Canada during Q3 2019.
Alberta– In Q3 2019, we completed two (2.0 net) operated wells, and brought on production two (2.0 net) operated wells and one (0.5 net) non-operated
well in Alberta.– In 2019, we have drilled or participated in 14 (13.5 net) wells in Alberta.
Saskatchewan– In Q3 2019, we drilled 40 (38.3 net) operated wells, completed 39 (37.6 net) operated wells and three (0.5 net) non-operated wells, and
brought 38 (35.7 net) operated wells and three (0.5 net) non-operated wells on production in Saskatchewan.– In 2019, we have drilled or participated in 112 (102.6 net) wells in Saskatchewan.
Sales• The realized price for our crude oil and condensate production in Canada is linked to WTI subject to market conditions in western Canada as
reflected by the Saskatchewan LSB, Canadian Condensate C5+, and Edmonton Sweet index prices. The realized price of our natural gas inCanada is based on the AECO index.
• Q3 2019 sales per boe decreased 8% compared to Q2 2019 due to lower crude oil, condensate and NGL prices which was partially offset by highernatural gas prices.
• Q3 2019 sales per boe decreased 24% versus Q3 2018 due to a decrease in all reference prices. • Year-to-date 2019 sales per boe decreased 6% versus the same period in 2018 due to a decrease in crude oil, condensate and NGL prices. This
was partially offset by an increase in production weighting to crude oil and condensate and higher natural gas prices.
Royalties• Q3 2019 royalties as a percentage of sales of 12.7% increased from 9.7% in Q2 2019 primarily due to a favourable adjustment associated with
gas cost allowance received in the prior quarter.• For the three and nine months ended Q3 2019, royalties as a percentage of sales of 12.7% and 11.3%, respectively, decreased from 13.9% and
12.2% in the comparable prior year periods. This decrease was due to the effect of lower crude oil prices on sliding scale royalties coupled withlower average royalty rates for new wells brought on production.
Transportation• Q3 2019 transportation expense on a dollar and per unit basis increased slightly from Q2 2019 and Q3 2018 due to the impact of a prior period
adjustment recorded in the current quarter.• Transportation expense for the nine months ended September 30, 2019 increased on a per unit basis versus the comparable period in 2018 due
to an increased weighting towards crude oil production, which incurs a higher transportation expense.
Operating• Operating expense on both a basis remained relatively consistent in Q3 2019 as compared to to Q2 2019 and Q3 2018. • For the nine months ended September 30, 2019, operating expense increased on a per unit basis versus the comparable period in 2018. On a
dollar basis, the increase in operating expense was driven by higher production volumes during 2019. On a per unit basis, the increase in operatingexpense was primarily attributable to the impact of increased crude oil production, which has higher associated per unit operating expense.
Vermilion Energy Inc. ■ Page 22 ■ 2019 Third Quarter Report

France Business UnitOverview
• Entered France in 1997.• Largest oil producer in France, constituting approximately three-quarters of domestic oil production.• Low base decline producing assets comprised of large conventional oil fields with high working interests located in the Aquitaine and Paris Basins.• Identified inventory of workover, waterflood, and infill drilling opportunities.
Operational and financial review
France business unit($M except as indicated) Q3 2019 Q2 2019 Q3 2018
Q3/19 vs.Q2/19
Q3/19 vs.Q3/18 YTD 2019 YTD 2018
2019 vs.2018
ProductionCrude oil (bbls/d) 10,347 9,800 11,407 5.6% (9.3)% 10,493 11,377 (7.8)%Natural gas (mmcf/d) — — — —% —% 0.25 — —%Total (boe/d) 10,347 9,800 11,407 5.6% (9.3)% 10,535 11,377 (7.4)%
SalesCrude oil (bbls/d) 11,112 10,190 11,482 9.0% (3.2)% 10,852 11,025 (1.6)%Natural gas (mmcf/d) — — — —% —% 0.25 — —%
Total (boe/d) 11,112 10,190 11,482 9.0% (3.2)% 10,894 11,025 (1.2)%Inventory (mbbls)
Opening crude oil inventory 297 332 300 325 197Crude oil production 952 892 1,049 2,865 3,106Crude oil sales (1,022) (927) (1,056) (2,963) (3,010)Closing crude oil inventory 227 297 293 227 293
ActivityCapital expenditures 18,139 25,671 15,779 (29.3)% 15.0% 65,896 62,750 5.0%Gross wells drilled — 1.00 — 4.00 5.00Net wells drilled — 1.00 — 4.00 5.00
Financial resultsSales 81,676 84,540 100,840 (3.4)% (19.0)% 248,918 274,713 (9.4)%Royalties (11,476) (10,871) (12,765) 5.6% (10.1)% (33,630) (34,805) (3.4)%Transportation (6,183) (9,041) (2,013) (31.6)% 207.2% (18,394) (7,184) 156.0%Operating (15,098) (14,305) (13,733) 5.5% 9.9% (45,139) (40,675) 11.0%General and administration (3,379) (3,551) (3,365) (4.8)% 0.4% (10,585) (10,378) 2.0%Current income taxes (3,419) (5,346) (6,913) (36.0)% (50.5)% (16,465) (14,200) 16.0%Fund flows from operations 42,121 41,426 62,051 1.7% (32.1)% 124,705 167,471 (25.5)%
Netbacks ($/boe)Sales 79.89 91.17 95.46 (12.4)% (16.3)% 83.69 91.27 (8.3)%Royalties (11.23) (11.72) (12.08) (4.2)% (7.0)% (11.31) (11.56) (2.2)%Transportation (6.05) (9.75) (1.91) (37.9)% 216.8% (6.18) (2.39) 158.6%Operating (14.77) (15.43) (13.00) (4.3)% 13.6% (15.18) (13.51) 12.4%General and administration (3.31) (3.83) (3.19) (13.6)% 3.8% (3.56) (3.45) 3.2%Current income taxes (3.34) (5.77) (6.54) (42.1)% (48.9)% (5.54) (4.72) 17.4%Fund flows from operations netback 41.19 44.67 58.74 (7.8)% (29.9)% 41.92 55.64 (24.7)%
Reference pricesDated Brent (US $/bbl) 61.94 68.82 75.27 (10.0)% (17.7)% 64.65 72.13 (10.4)%Dated Brent ($/bbl) 81.80 92.05 98.37 (11.1)% (16.8)% 85.93 92.87 (7.5)%
Vermilion Energy Inc. ■ Page 23 ■ 2019 Third Quarter Report

Production• Q3 2019 production increased 6% from the prior quarter. Production volumes in the Paris Basin returned to near full capacity in mid-August
following the restart of the Grandpuits refinery which had been offline due to a failure on its main feedstock pipeline. In the Aquitaine Basin,production was relatively consistent with the prior quarter as we successfully completed our 2019 workover campaign, which continues to yieldresults above our expectations. Quarterly production decreased 9% year-over-year as a result of the third party refinery outage.
Activity review• During Q3 2019, we continued to execute workovers in the Aquitaine Basin, while workover activities in the Paris Basin were deferred as a result
of the third party refinery outage.• We plan to continue our workover and optimization programs in the Aquitaine and Paris Basins throughout 2019.
Sales • Crude oil in France is priced with reference to Dated Brent. • For the three and nine months ended September 30, 2019, sales per boe decreased versus all comparable periods, consistent with decreases in
the Dated Brent reference price.
Royalties• Royalties in France relate to two components: RCDM (levied on units of production and not subject to changes in commodity prices) and R31
(based on a percentage of sales).• For the three and nine months ended September 30, 2019, royalties as a percentage of sales of 14.1% and 13.5%, respectively, were higher than
the comparable periods due to the impact of RCDM royalties and lower sales prices.
Transportation• Transportation expense decreased in Q3 2019 compared to Q2 2019 due to the aforementioned refinery outage, which had a greater impact on
Q2 2019 than Q3 2019. During the refinery outage, we used alternate delivery points and transportation methods for our crude oil production inthe basin, resulting in an increase to our transportation costs during the shutdown.
• Transportation expense for the three and nine months ended September 30, 2019 increased versus the comparable periods in the prior year dueto the aforementioned refinery outage.
Operating• Q3 2019 operating expense increased due to an electricity credit received in Q2 2019 and the impact of expenditure timing. Operating expense
on a per unit basis was lower compared to Q2 2019 despite the increase on a dollar basis as a result of higher production volumes.• For the three and nine months ended September 30, 2019 compared to the same periods in the prior year, operating expense increased on both
a dollar and per unit basis due primarily to higher electricity prices in the current year.
General and administration• Fluctuations in general and administration expense for all comparable periods were due to the timing of expenditures and allocations from our
corporate segment.
Current income taxes• In France, current income taxes are applied to taxable income, after eligible deductions, at a statutory rate of 32.0%.• Full year effective tax rates are estimated each quarter based on forecasted commodity prices and operational results. The estimated full year
effective tax rate is applied on a pro-rata basis to quarterly results. As such, fluctuations between the reporting periods occur due to changes inestimated tax rates.
• For 2019, the effective rate on current taxes, inclusive of corporate allocations, is expected to be between 9% to 11% of pre-tax fund flows fromoperations. This is subject to change in response to production variations, commodity price fluctuations, the timing of capital expenditures, andother eligible in-country adjustments.
• On December 21, 2017, the French Parliament approved the Finance Bill for 2018. The Finance Bill for 2018 provides for a progressive decreaseof the French corporate income tax rate from 34.4% to 25.8% by 2022, with the first reduction in 2019 to 32.0%.
Vermilion Energy Inc. ■ Page 24 ■ 2019 Third Quarter Report

Netherlands Business UnitOverview
• Entered the Netherlands in 2004.• Second largest onshore operator.• Interests include 26 onshore licenses (all operated) and 17 offshore licenses (all non-operated).• Licenses include more than 930,000 net acres of land, 90% of which is undeveloped.
Operational and financial review
Netherlands business unit($M except as indicated) Q3 2019 Q2 2019 Q3 2018
Q3/19 vs.Q2/19
Q3/19 vs.Q3/18 YTD 2019 YTD 2018
2019 vs.2018
Production and salesCondensate (bbls/d) 82 100 84 (18.0)% (2.4)% 92 83 10.8%Natural gas (mmcf/d) 44.08 52.90 44.37 (16.7)% (0.7)% 49.47 44.21 11.9%Total (boe/d) 7,429 8,917 7,479 (16.7)% (0.7)% 8,336 7,452 11.9%
ActivityCapital expenditures 3,028 4,577 5,056 (33.8)% (40.1)% 13,954 15,029 (7.2)%Acquisitions — — 2,874 908 5,773
Financial resultsSales 18,729 28,327 41,793 (33.9)% (55.2)% 87,642 112,979 (22.4)%Royalties (279) (446) (1,049) (37.4)% (73.4)% (1,339) (2,644) (49.4)%Operating (6,396) (7,686) (5,812) (16.8)% 10.0% (22,367) (19,916) 12.3%General and administration (300) (704) (320) (57.4)% (6.3)% (1,896) (1,238) 53.2%Current income taxes (462) (2,575) 1,729 (82.1)% N/A (7,237) (9,069) (20.2)%Fund flows from operations 11,292 16,916 36,341 (33.2)% (68.9)% 54,803 80,112 (31.6)%
Netbacks ($/boe)Sales 27.40 34.91 60.74 (21.5)% (54.9)% 38.51 55.54 (30.7)%Royalties (0.41) (0.55) (1.52) (25.5)% (73.0)% (0.59) (1.30) (54.6)%Operating (9.36) (9.47) (8.45) (1.2)% 10.8% (9.83) (9.79) 0.4%General and administration (0.44) (0.87) (0.47) (49.4)% (6.4)% (0.83) (0.61) 36.1%Current income taxes (0.68) (3.17) 2.51 (78.5)% N/A (3.18) (4.46) (28.7)%Fund flows from operations netback 16.51 20.85 52.81 (20.8)% (68.7)% 24.08 39.38 (38.9)%
Realized pricesCondensate ($/bbl) 69.12 79.10 82.32 (12.6)% (16.0)% 72.08 77.08 (6.5)%Natural gas ($/mcf) 4.49 5.73 10.08 (21.6)% (55.5)% 6.36 9.22 (31.0)%Total ($/boe) 27.40 34.91 60.74 (21.5)% (54.9)% 38.51 55.54 (30.7)%
Reference pricesTTF ($/mcf) 4.40 5.75 10.92 (23.5)% (59.7)% 6.08 10.00 (39.2)%TTF (€/mcf) 3.00 3.82 7.18 (21.5)% (58.2)% 4.07 6.50 (37.4)%
Vermilion Energy Inc. ■ Page 25 ■ 2019 Third Quarter Report
Production• Q3 2019 production decreased 17% from the prior quarter primarily due to a planned turnaround and unexpected downtime to repair a gas
compressor, which extended the length of the turnaround. Quarterly production was relatively consistent year-over year.
Activity review• We are currently in the process of drilling the Weststellingwerf well (0.5 net), representing our first drilling activity in the Netherlands since 2017,
and we expect drilling to be completed before the end of the year.
Sales• The price of our natural gas in the Netherlands is based on the TTF index.• For the three and nine months ended September 30, 2019, sales on a per unit basis decreased versus all comparable periods, consistent with
decreases in the TTF reference price.
Royalties• In the Netherlands, certain wells are subject to overriding royalties while some wells are subject to royalties that take effect only when specified
production levels are exceeded. As such, royalty expense may fluctuate from period to period depending on the amount of production from thosewells.
• Royalties in Q3 2019 represented 1.5% of sales. Effective March 1, 2019, certain royalty rights were acquired which resulted in lower royalties.
Transportation• Our production in the Netherlands is not subject to transportation expense as gas is sold at the plant gate.
Operating• Q3 2019 operating expense per boe was relatively consistent with the prior quarter. Compared to the same quarter of the prior year, Q3 2019
operating expense per boe was higher due to timing of activity.• For the nine months ended September 30, 2019, operating expense per boe remained consistent as compared to the same period in 2018.
General and administration • Fluctuations in general and administration expense for all comparable periods were due to the timing of expenditures and allocations from our
corporate segment.
Current income taxes• In the Netherlands, current income taxes are applied to taxable income, after eligible deductions and a 10% uplift deduction applied to operating
expenses, eligible general and administration expenses, and tax deductions for depletion and asset retirement obligations, at a tax rate of 50%.• Full year effective tax rates are estimated each quarter based on forecasted commodity prices and operational results. The estimated full year
effective tax rate is applied on a pro-rata basis to quarterly results. As such, fluctuations between the reporting periods occur due to changes inestimated tax rates.
• For 2019, the effective rate on current taxes, inclusive of corporate allocations, is expected to be between 6% to 8% of pre-tax fund flows fromoperations. This is subject to change in response to production variations, commodity price fluctuations, the timing of capital expenditures, andother eligible in-country adjustments.
Vermilion Energy Inc. ■ Page 26 ■ 2019 Third Quarter Report
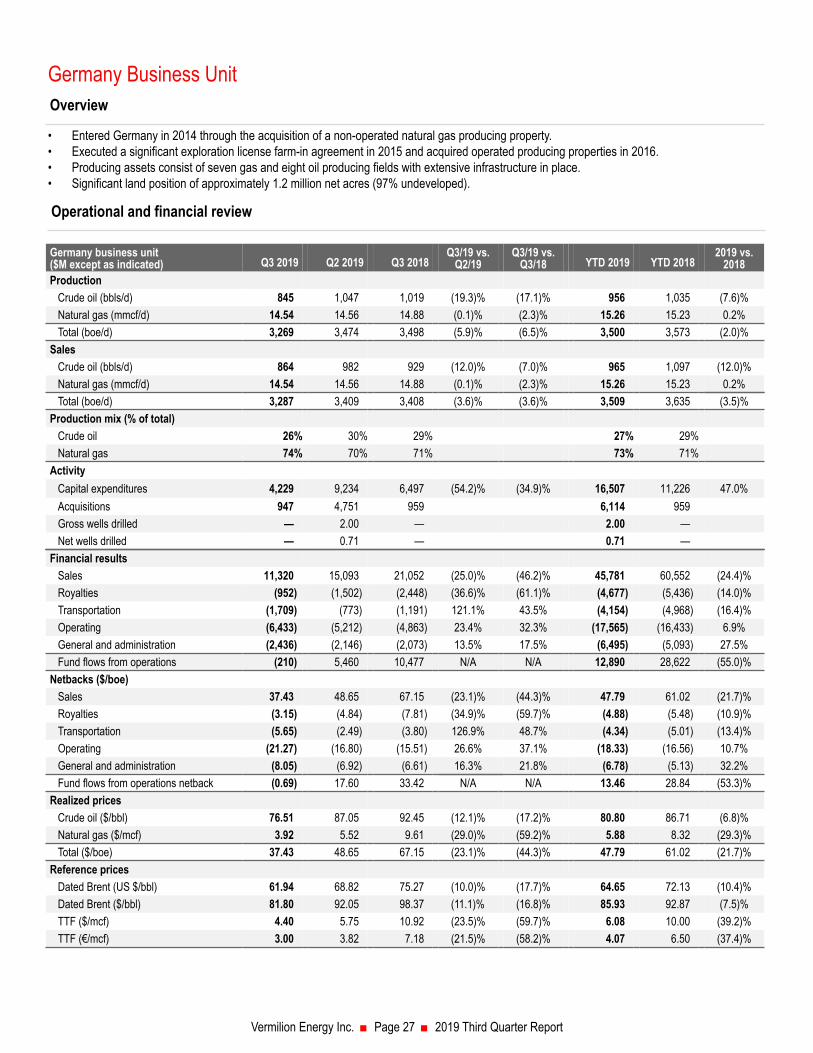
Germany Business UnitOverview
• Entered Germany in 2014 through the acquisition of a non-operated natural gas producing property.• Executed a significant exploration license farm-in agreement in 2015 and acquired operated producing properties in 2016.• Producing assets consist of seven gas and eight oil producing fields with extensive infrastructure in place.• Significant land position of approximately 1.2 million net acres (97% undeveloped).
Operational and financial review
Germany business unit($M except as indicated) Q3 2019 Q2 2019 Q3 2018
Q3/19 vs.Q2/19
Q3/19 vs.Q3/18 YTD 2019 YTD 2018
2019 vs.2018
ProductionCrude oil (bbls/d) 845 1,047 1,019 (19.3)% (17.1)% 956 1,035 (7.6)%Natural gas (mmcf/d) 14.54 14.56 14.88 (0.1)% (2.3)% 15.26 15.23 0.2%Total (boe/d) 3,269 3,474 3,498 (5.9)% (6.5)% 3,500 3,573 (2.0)%
SalesCrude oil (bbls/d) 864 982 929 (12.0)% (7.0)% 965 1,097 (12.0)%Natural gas (mmcf/d) 14.54 14.56 14.88 (0.1)% (2.3)% 15.26 15.23 0.2%Total (boe/d) 3,287 3,409 3,408 (3.6)% (3.6)% 3,509 3,635 (3.5)%
Production mix (% of total)Crude oil 26% 30% 29% 27% 29%Natural gas 74% 70% 71% 73% 71%
ActivityCapital expenditures 4,229 9,234 6,497 (54.2)% (34.9)% 16,507 11,226 47.0%Acquisitions 947 4,751 959 6,114 959Gross wells drilled — 2.00 — 2.00 —Net wells drilled — 0.71 — 0.71 —
Financial resultsSales 11,320 15,093 21,052 (25.0)% (46.2)% 45,781 60,552 (24.4)%Royalties (952) (1,502) (2,448) (36.6)% (61.1)% (4,677) (5,436) (14.0)%Transportation (1,709) (773) (1,191) 121.1% 43.5% (4,154) (4,968) (16.4)%Operating (6,433) (5,212) (4,863) 23.4% 32.3% (17,565) (16,433) 6.9%General and administration (2,436) (2,146) (2,073) 13.5% 17.5% (6,495) (5,093) 27.5%Fund flows from operations (210) 5,460 10,477 N/A N/A 12,890 28,622 (55.0)%
Netbacks ($/boe)Sales 37.43 48.65 67.15 (23.1)% (44.3)% 47.79 61.02 (21.7)%Royalties (3.15) (4.84) (7.81) (34.9)% (59.7)% (4.88) (5.48) (10.9)%Transportation (5.65) (2.49) (3.80) 126.9% 48.7% (4.34) (5.01) (13.4)%Operating (21.27) (16.80) (15.51) 26.6% 37.1% (18.33) (16.56) 10.7%General and administration (8.05) (6.92) (6.61) 16.3% 21.8% (6.78) (5.13) 32.2%Fund flows from operations netback (0.69) 17.60 33.42 N/A N/A 13.46 28.84 (53.3)%
Realized pricesCrude oil ($/bbl) 76.51 87.05 92.45 (12.1)% (17.2)% 80.80 86.71 (6.8)%Natural gas ($/mcf) 3.92 5.52 9.61 (29.0)% (59.2)% 5.88 8.32 (29.3)%Total ($/boe) 37.43 48.65 67.15 (23.1)% (44.3)% 47.79 61.02 (21.7)%
Reference pricesDated Brent (US $/bbl) 61.94 68.82 75.27 (10.0)% (17.7)% 64.65 72.13 (10.4)%Dated Brent ($/bbl) 81.80 92.05 98.37 (11.1)% (16.8)% 85.93 92.87 (7.5)%TTF ($/mcf) 4.40 5.75 10.92 (23.5)% (59.7)% 6.08 10.00 (39.2)%TTF (€/mcf) 3.00 3.82 7.18 (21.5)% (58.2)% 4.07 6.50 (37.4)%
Vermilion Energy Inc. ■ Page 27 ■ 2019 Third Quarter Report

Production• Q3 2019 production decreased 6% from the prior quarter and 7% year-over-year due to unplanned downtime on several operated and non-operated
assets, partially offset by contributions from successful workovers performed earlier this year.
Activity review• During Q3 2019, we continued to evaluate tie-in alternatives for the Burgmoor Z5 (46% working interest) well, which was tested early in the third
quarter of 2019.• For the remainder of 2019, we plan to continue evaluating and performing workover opportunities on our operated asset base.
Sales• The price of our natural gas in Germany is based on the NCG and GPL indexes, which are both highly correlated to the TTF benchmark. Crude
oil in Germany is priced with reference to Dated Brent. • For the three and nine months ended September 30, 2019, sales per boe decreased versus all comparable periods due to decreases in crude oil
and natural gas reference prices.
Royalties• Our production in Germany is subject to state and private royalties on sales after certain eligible deductions. • Royalties as a percentage of sales was relatively consistent for the three and nine months ended September 30, 2019 versus all comparable
periods.
Transportation• Transportation expense in Germany relates to costs incurred to deliver natural gas from the processing facility to the customer and deliver crude
oil to the refinery.• Transportation expense in Q3 2019 increased compared to both Q2 2019 and Q3 2018 due to prior period adjustments.• Transportation expense for the nine months ended September 30, 2019 was lower than the comparable period in the prior year largely due to
lower gas transportation costs following a credit received in Q2 2019 from the transportation network operator.
Operating• Operating expense on a dollar and per unit basis for the three and nine months ended September 30, 2019 increased versus all comparable
periods due to timing of activities.
General and administration• Fluctuations in general and administration expense for all comparable periods were due to the timing of expenditures and allocations from our
corporate segment.
Current income taxes• As a result of our tax pools in Germany, we do not expect to incur current income taxes for 2019 in the Germany Business Unit. This is subject to
change in response to production variations, commodity price fluctuations, the timing of capital expenditures, and other eligible in-countryadjustments
Vermilion Energy Inc. ■ Page 28 ■ 2019 Third Quarter Report

Ireland Business UnitOverview
• Entered Ireland in 2009 with an investment in the offshore Corrib gas field.• The Corrib gas field is located offshore northwest Ireland and comprises of six offshore wells, offshore and onshore sales and transportation pipeline
segments, as well as a natural gas processing facility.• In Q4 2018, Vermilion assumed operatorship of the Corrib Natural Gas Project (the "Corrib Project") and increased its ownership stake by 1.5%
to 20% following the completion of a strategic partnership with Canada Pension Plan Investment Board (“CPPIB”).
Operational and financial review
Ireland business unit($M except as indicated) Q3 2019 Q2 2019 Q3 2018
Q3/19 vs.Q2/19
Q3/19 vs.Q3/18 YTD 2019 YTD 2018
2019 vs.2018
Production and salesNatural gas (mmcf/d) 43.21 49.21 51.38 (12.2)% (15.9)% 48.01 56.23 (14.6)%Total (boe/d) 7,202 8,201 8,563 (12.2)% (15.9)% 8,002 9,372 (14.6)%
ActivityCapital expenditures 354 84 (50) 321.4% N/A 449 84 434.5%
Financial resultsSales 16,722 25,936 50,228 (35.5)% (66.7)% 82,450 151,765 (45.7)%Transportation (1,130) (1,155) (1,460) (2.2)% (22.6)% (3,451) (4,014) (14.0)%Operating (3,136) (2,631) (3,354) 19.2% (6.5)% (9,577) (10,869) (11.9)%General and administration (1,436) (242) (3,597) 493.4% (60.1)% (2,007) (6,349) (68.4)%Fund flows from operations 11,020 21,908 41,817 (49.7)% (73.6)% 67,415 130,533 (48.4)%
Netbacks ($/boe)Sales 25.24 34.75 63.76 (27.4)% (60.4)% 37.74 59.32 (36.4)%Transportation (1.71) (1.55) (1.85) 10.3% (7.6)% (1.58) (1.57) 0.6%Operating (4.73) (3.53) (4.26) 34.0% 11.0% (4.38) (4.25) 3.1%General and administration (2.17) (0.32) (4.57) 578.1% (52.5)% (0.92) (2.48) (62.9)%Fund flows from operations netback 16.63 29.35 53.08 (43.3)% (68.7)% 30.86 51.02 (39.5)%
Reference pricesNBP ($/mcf) 4.50 5.44 10.95 (17.3)% (58.9)% 6.08 10.12 (39.9)%NBP (€/mcf) 3.07 3.62 7.20 (15.2)% (57.4)% 4.07 6.58 (38.1)%
Vermilion Energy Inc. ■ Page 29 ■ 2019 Third Quarter Report

Production• Q3 2019 production decreased 12% from the prior quarter and 16% year-over-year due to planned and unplanned downtime at the Corrib natural
gas processing facility and natural decline.
Activity review• During Q3 2019, we completed a planned plant turnaround.• For the remainder of 2019, we will continue to evaluate further optimization opportunities as we progress through our first year as operator of the
Corrib Project.
Sales• The price of our natural gas in Ireland is based on the NBP index.• Sales per boe for the three and nine months ended September 30, 2019 decreased versus all comparable periods consistent with decreases in
the NBP reference price.
Royalties• Our production in Ireland is not subject to royalties.
Transportation• Transportation expense in Ireland relates to payments under a ship-or-pay agreement.• Transportation expense for Q3 2019 versus Q2 2019 remained relatively consistent.• Transportation expense for the three and nine months ended September 30, 2019 decreased versus the comparable periods in the prior year due
to a lower ship-or-pay obligation in the current year.
Operating• Q3 2019 operating expense increased compared to Q2 2019 due to timing of activity.• For the three and nine months ended September 30, 2019, operating expense decreased versus the comparable periods in the prior year due to
Vermilion's focus on cost management following our appointment as operator in December 2018.
General and administration• Fluctuations in general and administration expense versus all comparable periods is primarily due to the timing of expenditures and allocations
from our corporate segment.
Current income taxes• Given the significant level of investment in Corrib and the resulting tax pools, we do not expect to incur current income taxes in the Ireland Business
Unit for the foreseeable future.
Vermilion Energy Inc. ■ Page 30 ■ 2019 Third Quarter Report
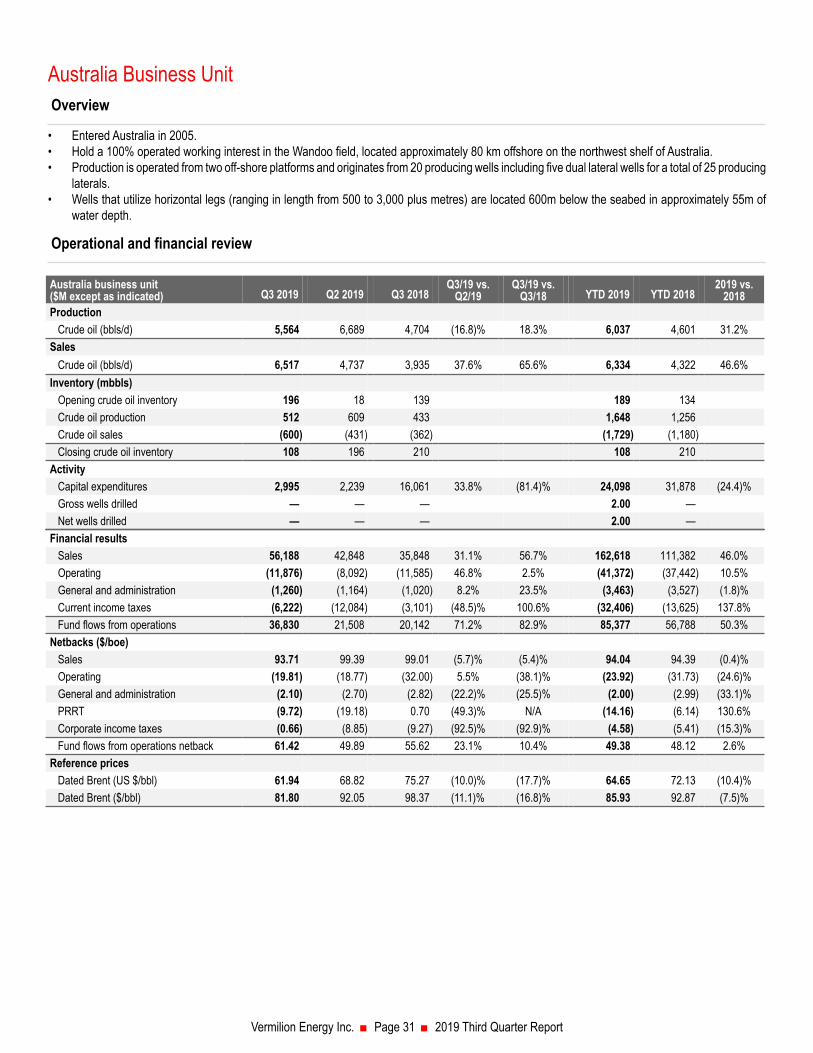
Australia Business UnitOverview
• Entered Australia in 2005.• Hold a 100% operated working interest in the Wandoo field, located approximately 80 km offshore on the northwest shelf of Australia.• Production is operated from two off-shore platforms and originates from 20 producing wells including five dual lateral wells for a total of 25 producing
laterals.• Wells that utilize horizontal legs (ranging in length from 500 to 3,000 plus metres) are located 600m below the seabed in approximately 55m of
water depth.
Operational and financial review
Australia business unit($M except as indicated) Q3 2019 Q2 2019 Q3 2018
Q3/19 vs.Q2/19
Q3/19 vs.Q3/18 YTD 2019 YTD 2018
2019 vs.2018
ProductionCrude oil (bbls/d) 5,564 6,689 4,704 (16.8)% 18.3% 6,037 4,601 31.2%
SalesCrude oil (bbls/d) 6,517 4,737 3,935 37.6% 65.6% 6,334 4,322 46.6%
Inventory (mbbls)Opening crude oil inventory 196 18 139 189 134Crude oil production 512 609 433 1,648 1,256Crude oil sales (600) (431) (362) (1,729) (1,180)Closing crude oil inventory 108 196 210 108 210
ActivityCapital expenditures 2,995 2,239 16,061 33.8% (81.4)% 24,098 31,878 (24.4)%Gross wells drilled — — — 2.00 —Net wells drilled — — — 2.00 —
Financial resultsSales 56,188 42,848 35,848 31.1% 56.7% 162,618 111,382 46.0%Operating (11,876) (8,092) (11,585) 46.8% 2.5% (41,372) (37,442) 10.5%General and administration (1,260) (1,164) (1,020) 8.2% 23.5% (3,463) (3,527) (1.8)%Current income taxes (6,222) (12,084) (3,101) (48.5)% 100.6% (32,406) (13,625) 137.8%Fund flows from operations 36,830 21,508 20,142 71.2% 82.9% 85,377 56,788 50.3%
Netbacks ($/boe)Sales 93.71 99.39 99.01 (5.7)% (5.4)% 94.04 94.39 (0.4)%Operating (19.81) (18.77) (32.00) 5.5% (38.1)% (23.92) (31.73) (24.6)%General and administration (2.10) (2.70) (2.82) (22.2)% (25.5)% (2.00) (2.99) (33.1)%PRRT (9.72) (19.18) 0.70 (49.3)% N/A (14.16) (6.14) 130.6%Corporate income taxes (0.66) (8.85) (9.27) (92.5)% (92.9)% (4.58) (5.41) (15.3)%Fund flows from operations netback 61.42 49.89 55.62 23.1% 10.4% 49.38 48.12 2.6%
Reference pricesDated Brent (US $/bbl) 61.94 68.82 75.27 (10.0)% (17.7)% 64.65 72.13 (10.4)%Dated Brent ($/bbl) 81.80 92.05 98.37 (11.1)% (16.8)% 85.93 92.87 (7.5)%
Vermilion Energy Inc. ■ Page 31 ■ 2019 Third Quarter Report

Production• Q3 2019 production decreased 17% quarter-over-quarter primarily due to well management and unplanned vessel maintenance on the Wandoo
platform. Production increased 18% year-over-year primarily due to the production contribution from the two (2.0 net) well drilling program completedat the end of January 2019.
• Production volumes are managed to targets while meeting customer demands and the requirements of long-term supply agreements.
Activity review• In 2019, we will continue to focus on adding value through asset optimization and proactive maintenance.
Sales • Crude oil in Australia is priced with reference to Dated Brent and from 2012 to 2018 has sold at an average premium of US$3-5 per bbl to Dated
Brent.• Q3 2019 sales increased compared to Q2 2019 due to higher sales volumes resulting from increased liftings in the current quarter. This increase
in sales volumes was partially offset by lower sales per boe due to a decrease in the Dated Brent reference price.• Sales increased for the three and nine months ended September 30, 2019 versus the comparable periods in 2018, despite decreases in the Dated
Brent reference pricing, due to the timing of sales in the relevant periods.
Royalties and transportation• Our production in Australia is not subject to royalties or transportation expense as crude oil is sold directly at the Wandoo B platform.
Operating• Q3 2019 operating expense increased compared to Q2 2019 on a dollar and per boe basis due to increased maintenance activity during the quarter.• For the three and nine months ended September 30, 2019 versus the comparable periods in the prior year, operating expense per unit decreased
primarily due to lower diesel usage and lower helicopter costs.
General and administration • Fluctuations in general and administration expense for all comparable periods are primarily due to the timing of expenditures and allocations from
our corporate segment.
Current income taxes• In Australia, current income taxes include both PRRT and corporate income taxes. PRRT is a profit based tax applied at a rate of 40% on sales
less eligible expenditures, including operating expenses and capital expenditures. Corporate income taxes are applied at a rate of 30% on taxableincome after eligible deductions, which include PRRT paid.
• Full year effective tax rates are estimated each quarter based on forecasted commodity prices and operational results. The estimated full yeareffective tax rate is applied on a pro-rata basis to quarterly results. As such, fluctuations between the reporting periods occur due to changes inestimated tax rates.
• For 2019, the effective rate on current taxes, inclusive of corporate allocations, is expected to be between 24% to 26% of pre-tax fund flows fromoperations. This is subject to change in response to production variations, commodity price fluctuations, the timing of capital expenditures, andother eligible in-country adjustments.
Vermilion Energy Inc. ■ Page 32 ■ 2019 Third Quarter Report

United States Business UnitOverview
• Entered the United States in 2014 and acquired additional producing assets in the Hilight field in 2018.• Interests include approximately 146,800 net acres of land (70% undeveloped) in the Powder River Basin of northeastern Wyoming.• Tight oil development targeting the Turner Sands at depths of approximately 1,500m (East Finn) and 2,600m (Hilight).
Operational and financial review
United States business unit($M except as indicated) Q3 2019 Q2 2019 Q3 2018
Q3/19 vs.Q2/19
Q3/19 vs.Q3/18 YTD 2019 YTD 2018
2019 vs.2018
Production and salesCrude oil (bbls/d) 2,722 2,483 1,461 9.6% 86.3% 2,319 900 157.7%NGLs (bbls/d) 1,140 754 714 51.2% 59.7% 942 268 251.5%Natural gas (mmcf/d) 6.38 7.06 4.82 (9.6)% 32.4% 6.45 1.81 256.4%Total (boe/d) 4,925 4,414 2,979 11.6% 65.3% 4,335 1,469 195.1%
Production mix (% of total)Crude oil 55% 56% 49% 53% 61%NGLs 23% 17% 24% 22% 18%Natural gas 22% 27% 27% 25% 21%
ActivityCapital expenditures 21,064 12,964 11,386 62.5% 85.0% 54,064 37,956 42.4%Acquisitions 1,964 1,217 187,987 3,224 188,066Gross wells drilled 4.00 1.00 — 8.00 5.00Net wells drilled 4.00 1.00 — 8.00 5.00
Financial resultsSales 19,227 18,355 14,551 4.8% 32.1% 52,479 23,840 120.1%Royalties (4,874) (4,583) (3,444) 6.3% 41.5% (13,390) (6,017) 122.5%Operating (4,400) (3,542) (2,633) 24.2% 67.1% (11,374) (3,573) 218.3%General and administration (2,005) (1,571) (2,397) 27.6% (16.4)% (5,467) (4,910) 11.3%Fund flows from operations 7,948 8,659 6,077 (8.2)% 30.8% 22,248 9,340 138.2%
Netbacks ($/boe)Sales 42.43 45.69 53.10 (7.1)% (20.1)% 44.34 59.45 (25.4)%Royalties (10.76) (11.41) (12.57) (5.7)% (14.4)% (11.31) (15.00) (24.6)%Operating (9.71) (8.82) (9.61) 10.1% 1.0% (9.61) (8.91) 7.9%General and administration (4.43) (3.91) (8.75) 13.3% (49.4)% (4.62) (12.24) (62.3)%Fund flows from operations netback 17.53 21.55 22.17 (18.7)% (20.9)% 18.80 23.30 (19.3)%
Realized pricesCrude oil ($/bbl) 68.91 70.98 87.34 (2.9)% (21.1)% 69.60 84.23 (17.4)%NGLs ($/bbl) 9.44 17.49 29.22 (46.0)% (67.7)% 16.72 29.53 (43.4)%Natural gas ($/mcf) 1.67 1.74 2.01 (4.0)% (16.9)% 2.34 2.01 16.4%Total ($/boe) 42.43 45.69 53.10 (7.1)% (20.1)% 44.34 59.45 (25.4)%
Reference pricesWTI (US $/bbl) 56.45 59.81 69.50 (5.6)% (18.8)% 57.06 66.75 (14.5)%WTI ($/bbl) 74.55 80.00 90.83 (6.8)% (17.9)% 75.84 85.95 (11.8)%Henry Hub (US $/mcf) 2.23 2.64 2.90 (15.5)% (23.1)% 2.67 2.90 (7.9)%Henry Hub ($/mcf) 2.94 3.53 3.80 (16.7)% (22.6)% 3.55 3.74 (5.1)%
Vermilion Energy Inc. ■ Page 33 ■ 2019 Third Quarter Report

Production• Q3 2019 production increased 12% from the prior quarter due to production contributions from our first half 2019 Hilight drilling campaign, as four
(4.0 net) wells were completed and brought on production during the quarter. Quarterly production increased 65% year-over-year primarily dueto the production associated with an acquisition we completed in August 2018 and the results of our 2019 drilling program to date.
Activity• During Q3 2019, we drilled four (4.0 net) Turner horizontal wells in the Hilight field and brought all four wells on production.• In 2019, we have drilled eight (8.0 net) Turner horizontal wells in the Hilight field.
Sales• The price of our crude oil in the United States is directly linked to WTI and subject to local market differentials within the United States. The price
of our natural gas in the United States is based on the Henry Hub index.• For the three and nine months ended September 30, 2019 versus all comparable periods, sales increased due to increased production, which
more than offset the decrease in sales per boe resulting from lower commodity prices. Royalties• Our production in the United States is subject to federal and private royalties, severance tax, and ad valorem tax. • For the three and nine months ended September 30, 2019, royalties as a percentage of sales were relatively consistent versus all comparable
periods.
Operating• Q3 2019 operating expense increased compared to Q2 2019 primarily due to expenditure timing.• For the three and nine months ended September 30, 2019 compared to the same periods in the prior year, operating expense increased primarily
due to incremental expenses associated with the year-over-year production increase.
General and administration• Fluctuations in general and administration expense for all comparable periods were due to the incremental staffing of the United States corporate
office, timing of expenditures, and allocations from our corporate segment.
Current income taxes• As a result of our tax pools in the United States, we do not expect to incur current income taxes in the United States Business Unit for the foreseeable
future.
Vermilion Energy Inc. ■ Page 34 ■ 2019 Third Quarter Report

CorporateOverview
• Our Corporate segment includes costs related to our global hedging program, financing expenses, and general and administration expenses thatare primarily incurred in Canada and are not directly related to the operations of our business units. Gains or losses relating to Vermilion's globalhedging program are allocated to Vermilion's business units for statutory reporting and income tax purposes.
• Results of our activities in Central and Eastern Europe are also included in the Corporate segment.
Operational and financial review
Corporate($M) Q3 2019 Q2 2019 Q3 2018 YTD 2019 YTD 2018Production and sales
Natural gas (mmcf/d) — — 1.17 — 0.39Total (boe/d) — — 195 — 66
ActivityCapital expenditures 8,107 8,755 1,619 20,470 8,065Acquisitions — — 207 — 207Gross wells drilled 3.00 3.00 — 6.00 1.00Net wells drilled 3.00 2.30 — 5.30 1.00
Financial resultsSales — — 1,083 — 1,083Royalties — — (279) — (279)Sales of purchased commodities 41,449 75,335 — 146,323 —Purchased commodities (41,449) (75,335) — (146,323) —Operating (2) (9) (201) (242) (201)General and administration recovery (expense) 2,957 1,086 854 3,423 (3,713)Current income taxes (250) (104) (862) (504) (1,159)Interest expense (19,661) (21,568) (19,772) (62,208) (51,932)Realized gain (loss) on derivatives 36,968 14,191 (37,365) 61,507 (82,939)Realized foreign exchange loss (3,348) (1,569) (3,100) (6,967) (5,651)Realized other income 372 191 177 7,447 608Fund flows from operations 17,036 (7,782) (59,465) 2,456 (144,183)
Vermilion Energy Inc. ■ Page 35 ■ 2019 Third Quarter Report

Production review• There was no production from our CEE business unit during the third quarter of 2019.
Activity review• In Q3 2019, we drilled one (1.0 net) natural gas exploration well in Croatia and one (1.0 net) natural gas exploration well in Hungary. • During the third quarter, we were provisionally awarded the SA-07 license in Croatia, adding approximately 500,000 net acres to our portfolio in
the country. The new license is contiguous with our existing land position and will bring our total licensed acreage to approximately 2.4 million netacres.
Purchased commodities• Purchased commodities and the associated sales relate to amounts purchased from third parties, primarily to manage positions on pipelines. There
is no net impact on fund flows from operations.
General and administration• Fluctuations in general and administration expense for the three and nine months ended September 30, 2019 versus all comparable periods were
due to allocations to the various business unit segments.
Current income taxes• Taxes in our corporate segment relate to holding companies that pay current taxes in foreign jurisdictions.
Interest expense• Interest expense in Q3 2019 decreased versus Q2 2019 as a result of cross currency interest rate swaps entered into in Q2 2019 that a Euro debt
obligation and lower our interest costs.• For the three months ended September 30, 2019, interest expense remained relatively consistent with the comparative period in 2018. • For the nine months ended September 30, 2019, interest expense increased versus the comparative period in 2018 due to higher drawings on the
revolving credit facility, partially offset by the impact of the aforementioned cross currency interest rate swaps.
Realized gain or loss on derivatives• The realized gain on derivatives for the three and nine months ended September 30, 2019 is related primarily to receipts for our crude oil hedges.• A listing of derivative positions as at September 30, 2019 is included in “Supplemental Table 2” of this MD&A.
Realized other income• Realized other income recognized in the nine months ended September 30, 2019, relates primarily to amounts received pursuant to a negotiated
settlement of a legal matter in Canada.
Vermilion Energy Inc. ■ Page 36 ■ 2019 Third Quarter Report

Financial Performance Review($M except per share) Q3 2019 Q2 2019 Q1 2019 Q4 2018 Q3 2018 Q2 2018 Q1 2018 Q4 2017Petroleum and natural gas sales 391,935 428,043 481,083 456,939 508,411 394,498 318,269 317,341Net earnings (loss) (10,229) 2,004 39,547 323,373 (15,099) (61,364) 24,740 8,645Net earnings (loss) per share
Basic (0.07) 0.01 0.26 2.12 (0.10) (0.46) 0.20 0.07 Diluted (0.07) 0.01 0.26 2.10 (0.10) (0.46) 0.20 0.07
The following table shows the calculation of fund flows from operations:
Q3 2019 Q2 2019 Q3 2018 YTD 2019 YTD 2018 $M $/boe $M $/boe $M $/boe $M $/boe $M $/boe
Petroleum and natural gas sales 391,935 43.04 428,043 46.40 508,411 57.90 1,301,061 46.79 1,221,178 54.64Royalties (41,490) (4.56) (38,113) (4.13) (53,786) (6.13) (122,987) (4.42) (108,293) (4.85)Petroleum and natural gas revenues 350,445 38.48 389,930 42.27 454,625 51.77 1,178,074 42.37 1,112,885 49.79Transportation (19,426) (2.13) (20,750) (2.25) (13,721) (1.56) (56,876) (2.05) (34,949) (1.56)Operating (105,192) (11.55) (101,881) (11.04) (97,758) (11.13) (329,495) (11.85) (244,544) (10.94)General and administration (13,652) (1.50) (15,697) (1.70) (13,234) (1.51) (42,407) (1.53) (39,115) (1.75)PRRT (5,826) (0.64) (8,268) (0.90) 254 0.03 (24,494) (0.88) (7,246) (0.32)Corporate income taxes (4,527) (0.50) (11,841) (1.28) (9,401) (1.07) (32,118) (1.16) (30,807) (1.38)Interest expense (19,661) (2.16) (21,568) (2.34) (19,772) (2.25) (62,208) (2.24) (51,932) (2.32)Realized gain (loss) on derivative instruments 36,968 4.06 14,191 1.54 (37,365) (4.26) 61,507 2.21 (82,939) (3.71)Realized foreign exchange loss (3,348) (0.37) (1,569) (0.17) (3,100) (0.35) (6,967) (0.25) (5,651) (0.25)Realized other income 372 0.04 191 0.02 177 0.02 7,447 0.27 608 0.03Fund flows from operations 216,153 23.73 222,738 24.15 260,705 29.69 692,463 24.89 616,310 27.59
Fluctuations in fund flows from operations may occur as a result of changes in production levels, commodity prices, and costs to produce petroleumand natural gas. In addition, fund flows from operations may be affected by the timing of crude oil shipments in Australia and France. When crude oilinventory is built up, the related operating expense, royalties, and depletion expense are deferred and carried as inventory on the consolidated balancesheet. When the crude oil inventory is subsequently drawn down, the related expenses are recognized.
The following table shows a reconciliation from fund flows from operations to net (loss) earnings:
Q3 2019 Q2 2019 Q3 2018 YTD 2019 YTD 2018Fund flows from operations 216,153 222,738 260,705 692,463 616,310Equity based compensation (15,564) (14,593) (13,056) (53,000) (43,767)Unrealized gain (loss) on derivative instruments 17,817 (30,605) (75,829) (27,065) (163,770)Unrealized foreign exchange gain (loss) (50,679) 41,798 (23,044) 14,377 (26,877)Unrealized other expense (347) (69) (203) (621) (597)Accretion (8,701) (8,147) (8,041) (24,834) (23,014)Depletion and depreciation (174,077) (184,131) (166,343) (535,237) (434,621)Deferred tax 5,169 (24,987) 10,712 (34,761) 24,613Net (loss) earnings (10,229) 2,004 (15,099) 31,322 (51,723)
Fluctuations in net income from period-to-period are caused by changes in both cash and non-cash based income and charges. Cash based items arereflected in fund flows from operations. Non-cash items include: equity based compensation expense, unrealized gains and losses on derivativeinstruments, unrealized foreign exchange gains and losses, accretion, depletion and depreciation expense, and deferred taxes. In addition, non-cashitems may also include gains resulting from business combinations or charges resulting from impairment or impairment reversals.
Vermilion Energy Inc. ■ Page 37 ■ 2019 Third Quarter Report

Equity based compensationEquity based compensation expense relates primarily to non-cash compensation expense attributable to long-term incentives granted to directors,officers, and employees under security-based arrangements, including the Vermilion Incentive Plan ("VIP"), a security-based compensation arrangement("Five-Year Compensation Arrangement"), and the Deferred Share Unit Plan ("DSU Plan").
Equity based compensation expense in Q3 2019 was relatively consistent to Q2 2019. For the three and nine months ended September 30, 2019,equity based compensation expense increased versus the comparable periods in 2018 primarily due to a higher value of outstanding share awards in2019. Unrealized gain or loss on derivative instrumentsUnrealized gain or loss on derivative instruments arise as a result of changes in future commodity price forecasts. As Vermilion uses derivative instrumentsto manage the commodity price exposure of our future crude oil and natural gas production, we will normally recognize unrealized gains on derivativeinstruments when future commodity price forecasts decline and vice-versa. As derivative instruments are settled, the unrealized gain or loss previouslyrecognized is reversed, and the settlement results in a realized gain or loss on derivative instruments.
For the three and nine months ended September 30, 2019, we recognized an unrealized gain on derivative instruments of $17.8 million and an unrealizedloss on derivative instruments of $27.1 million. The unrealized gain of $17.8 million in the three months ended September 30, 2019 resulted primarilyfrom an unrealized gain of $37.6 million on our cross currency interest rate swaps, partially offset by an unrealized loss of $19.8 million on our commodityderivative instruments, primarily due to an increase in European natural gas price forecasts and realized gains in the quarter.
The unrealized loss on derivative instruments of $27.1 million for the nine months ended September 30, 2019 resulted primarily from our USD-to-CADcross currency interest rate swaps. These USD-to-CAD cross currency interest rate swaps are entered into on a monthly basis to hedge the foreignexchange movements on USD borrowings on our revolving credit facility. As such, unrealized gains and losses on our cross currency interest swapsare offset by unrealized losses and gains on foreign exchange relating to the underlying USD borrowings from our revolving credit facility.
Unrealized foreign exchange gains or lossesAs a result of Vermilion’s international operations, Vermilion has monetary assets and liabilities denominated in currencies other than the Canadiandollar. These monetary assets and liabilities include cash, receivables, payables, long-term debt, derivative instruments and intercompany loans.Unrealized foreign exchange gains and losses result from translating these monetary assets and liabilities from their underlying currency to the Canadiandollar.
In 2019, unrealized foreign exchange gains and losses primarily results from:
• The translation of Euro denominated intercompany loans from Vermilion Energy Inc. to our international subsidiaries. An appreciation in theEuro against the Canadian dollar will result in an unrealized foreign exchange gains (and vice-versa). Under IFRS, the offsetting foreignexchange loss or gain is recorded as a currency translation adjustment within other comprehensive income. As a result, consolidatedcomprehensive income reflects the offsetting of these translation adjustments while net earnings reflects only the parent company's side ofthe translation.
• The translation of USD borrowings on our revolving credit facility. The unrealized foreign exchange gains or losses on these borrowings areoffset by unrealized derivative gains or losses on associated USD-to-CAD cross currency interest rate swaps (discussed further above).
• The translation of our USD denominated senior unsecured notes for the period from December 31, 2018 to June 12, 2019. Effective June12, 2019, the USD senior notes were hedged by a USD-to-CAD cross currency interest rate swap.
For the three months ended September 30, 2019, the impact of the Euro weakening against the Canadian dollar resulted in a $12.3 million unrealizedloss on our intercompany loans. This was coupled with an unrealized loss of $38.4 million on our USD borrowings from our revolving credit facility(which is offset by the aforementioned unrealized gain on derivative instruments).
For the nine months ended September 30, 2019, the impact of the Euro weakening against the Canadian dollar resulted in a $34.9 million unrealizedloss on our intercompany loans. This was partially offset by a $19.8 million unrealized gain on our USD denominated senior unsecured notes for theperiod from December 31, 2018 to June 12, 2019 (when the USD senior notes were hedged by a USD-to-CAD cross currency interest rate swap) anda $29.5 million unrealized gain on our USD borrowings from our revolving credit facility (which is offset by the aforementioned unrealized loss onderivative instruments).
As at September 30, 2019, a $0.01 appreciation of the Euro against the Canadian dollar would result in a $2.0 million increase to net earnings as aresult of an unrealized gain on foreign exchange. In contrast, a $0.01 appreciation of the US dollar against the Canadian dollar would result in a $0.1million decrease to net earnings as a result of an unrealized loss on foreign exchange.
Vermilion Energy Inc. ■ Page 38 ■ 2019 Third Quarter Report

AccretionAccretion expense is recognized to update the present value of the asset retirement obligation balance. Accretion expense in Q3 2019 was relativelyconsistent with Q2 2019 and Q3 2018. For the nine months ended September 30, 2019, accretion expense increased versus the comparable periodin 2018, primarily attributable to new obligations recognized following acquisition activity in 2018.
Depletion and depreciationDepletion and depreciation expense is recognized to allocate the cost of capital assets over the useful life of the respective assets. Depletion anddepreciation expense per unit of production is determined for each depletion unit (which are groups of assets within a specific production area that havesimilar economic lives) by dividing the sum of the net book value of capital assets and future development costs by total proved plus probable reserves.
Fluctuations in depletion and depreciation expense are primarily the result of changes in produced crude oil and natural gas volumes and changes indepletion and depreciation per unit. Fluctuations in depletion and depreciation per unit are the result of changes in reserves, future development costs,and relative production mix.
Depletion and depreciation on a per boe basis for Q3 2019 of $19.12 remained relatively consistent from $19.96 in Q2 2019. For the three and ninemonths ended September 30, 2019, depletion and depreciation on a per boe basis of $19.12 and $19.25 respectively, remained relatively consistentwith $18.95 and $19.45 in the respective comparable periods in 2018.
Deferred taxDeferred tax assets arise when the tax basis of an asset exceeds its accounting basis (known as a deductible temporary difference). Conversely,deferred tax liabilities arise when the tax basis of an asset is less than its accounting basis (known as a taxable temporary difference). Deferred taxassets are recognized only to the extent that it is probable that there are future taxable profits against which the deductible temporary difference canbe utilized. Deferred tax assets and liabilities are measured at the enacted or substantively enacted tax rate that is expected to apply when the assetis realized or the liability is settled.
As such, fluctuations in deferred tax expenses and recoveries primarily arise as a result of: changes in the accounting basis of an asset or liability withouta corresponding tax basis change (e.g. when derivative assets and liabilities are marked-to-market or when accounting depletion differs from taxdepletion), changes in available tax losses (e.g. if they are utilized to offset taxable income), changes in estimated future taxable profits resulting in ade-recognition or re-recognition of deferred tax assets, and changes in enacted or substantively enacted tax rates.
For the three and nine months ended September 30, 2019, deferred tax recovery of $5.2 million and deferred tax expense of $34.8 million, respectively,was recognized. The recovery primarily related to deferred taxes on unrealized foreign exchange gains. The nine months ended expense primarilyrelated to the de-recognition of a portion of non-expiring tax loss pools in Ireland as there is uncertainty as to Vermilion's ability to fully utilize such lossesbased on commodity price forecasts as at September 30, 2019.
Vermilion Energy Inc. ■ Page 39 ■ 2019 Third Quarter Report

Financial Position Review
Balance sheet strategy
We believe that our balance sheet supports our defined growth initiatives and our focus is on managing and maintaining a conservative balance sheet.To ensure that our balance sheet continues to support our defined growth initiatives, we regularly review whether our forecast of fund flows fromoperations is sufficient to finance planned capital expenditures, dividends, and abandonment and reclamation expenditures. To the extent that fundflows from operations forecasts are not expected to be sufficient to fulfill such expenditures, we will evaluate our ability to finance any shortfall with debt(including borrowing using the unutilized capacity of our existing revolving credit facility), issue equity, or by reducing some or all categories of expendituresto ensure that total expenditures do not exceed available funds.
To ensure that we maintain a conservative balance sheet, we monitor the ratio of net debt to fund flows from operations.
We remain focused on maintaining and strengthening our balance sheet by aligning our exploration and development capital budget with forecastedfund flows from operations to target a payout ratio (a non-GAAP financial measure) of approximately 100%. We continually monitor for changes inforecasted fund flows from operations as a result of changes to forward commodity prices and as appropriate, we will adjust our exploration anddevelopment capital plans. As a result of our focus on this payout ratio target, we intend for the ratio of net debt to fund flows from operations to trendtowards 1.5 over time.
Net debt
Net debt is reconciled to long-term debt, as follows:
As at($M) Sep 30, 2019 Dec 31, 2018Long-term debt 1,954,471 1,796,207Current liabilities 398,233 563,199Current assets (350,834) (429,877)Net debt 2,001,870 1,929,529
Ratio of net debt to trailing twelve months fund flows from operations 2.19 2.30
As at September 30, 2019, net debt increased to $2.0 billion (December 31, 2018 - $1.9 billion) primarily due to the impact of increased borrowings onthe revolving credit facility to fund our capital program, coupled with a $24.3 million decrease in net current derivative assets. The ratio of net debt totrailing twelve months fund flows from operations decreased to 2.19 (December 31, 2018 - 2.30) as the increase to net debt was offset by higher trailingtwelve months fund flows from operations.
Long-term debt
The balances recognized on our balance sheet are as follows:
As at($M) Sep 30, 2019 Dec 31, 2018Revolving credit facility 1,561,669 1,392,206Senior unsecured notes 392,802 404,001Long-term debt 1,954,471 1,796,207
Vermilion Energy Inc. ■ Page 40 ■ 2019 Third Quarter Report

Revolving Credit FacilityIn Q2 2019, we negotiated an amendment to our $2.1 billion revolving credit facility to extend the maturity to May 31, 2023. The amendment includedchanges to the financial covenants, as described below.
As at September 30, 2019, Vermilion had in place a bank revolving credit facility maturing May 31, 2023 with terms and outstanding positions as follows:
As at($M) Sep 30, 2019 Dec 31, 2018Total facility amount 2,100,000 1,800,000Amount drawn (1,561,669) (1,392,206)Letters of credit outstanding (10,600) (15,400)Unutilized capacity 527,731 392,394
As at September 30, 2019, the revolving credit facility was subject to the following financial covenants:
As atFinancial covenant Limit Sep 30, 2019 Dec 31, 2018Consolidated total debt to consolidated EBITDA Less than 4.0 1.90 1.72Consolidated total senior debt to consolidated EBITDA Less than 3.5 1.52 1.34Consolidated EBITDA to consolidated interest expense Greater than 2.5 13.36 14.57
In Q2 2019, our financial covenants were updated to replace the consolidated total senior debt to total capitalization covenant with an interest coveragecovenant (calculated as consolidated EBITDA to consolidated interest expense) and to add provisions relating to our liability management ratings inAlberta and Saskatchewan. If our security adjusted liability management ratings fall below specified limits in a province, a portion of the asset retirementobligations are included in the definitions of consolidated total debt and consolidated total senior debt. An event of default occurs if our security adjustedliability management ratings breach additional lower limits for a period greater than 90 days. As of September 30, 2019, Vermilion's liability managementratings were higher than the specified levels and as such no amounts relating to asset retirement obligations were included in the calculation ofconsolidated total debt and consolidated total senior debt.
Our financial covenants include financial measures defined within our revolving credit facility agreement that are not defined under IFRS. These financialmeasures are defined by our revolving credit facility agreement as follows:• Consolidated total debt: Includes all amounts classified as “Long-term debt”, “Current portion of long-term debt”, and “Lease obligations” (including
the current portion included within "Accounts payable and accrued liabilities" but excluding operating leases as defined under IAS 17) on ourbalance sheet.
• Consolidated total senior debt: Defined as consolidated total debt excluding unsecured and subordinated debt.• Consolidated EBITDA: Defined as consolidated net earnings before interest, income taxes, depreciation, accretion and certain other non-cash
items, adjusted for the impact of the acquisition of a material subsidiary.• Total interest expense: Includes all amounts classified as "Interest expense", but excluding interest on operating leases as defined under IAS 17.
Senior Unsecured NotesOn March 13, 2017, Vermilion issued US$300.0 million of senior unsecured notes at par. The notes bear interest at a rate of 5.625% per annum, paidsemi-annually on March 15 and September 15, and mature on March 15, 2025. As direct senior unsecured obligations of Vermilion, the notes rankequally in right of payment with existing and future senior indebtedness of the Company.
The senior unsecured notes were recognized at amortized cost and include the transaction costs directly related to the issuance.
Vermilion may, at its option, redeem the senior unsecured notes prior to maturity as follows:• Prior to March 15, 2020, Vermilion may redeem up to 35% of the original principal amount of the senior unsecured notes with the proceeds of
certain equity offerings by the Company at a redemption price of 105.625% of the principal amount, plus any accrued and unpaid interest to butexcluding the applicable redemption date.
• Prior to March 15, 2020, Vermilion may redeem some or all of the senior unsecured notes at a price equal to 100% of the principal amount of thesenior unsecured notes, plus a “make-whole” premium and any accrued and unpaid interest.
• On or after March 15, 2020, Vermilion may redeem some or all of the senior unsecured notes at the redemption prices set forth in the followingtable, plus any accrued and unpaid interest.
Vermilion Energy Inc. ■ Page 41 ■ 2019 Third Quarter Report

Year Redemption price2020 104.219%2021 102.813%2022 101.406%2023 and thereafter 100.000%
Cross currency interest rate swapsOn June 12, 2019, Vermilion entered into a series of cross currency interest rate swaps with a syndicate of banks. The cross currency interest rateswaps mature March 15, 2025 and include regular cash receipts and payments on March 15 and September 15 of each year. On a net basis, the crosscurrency interest swaps result in Vermilion receiving US dollar interest and principal amounts equal to the interest and principal payments under theUS $300.0 million of senior unsecured notes. In exchange, Vermilion will make interest and principal payments equal to €265.0 million at a rate of3.275%.
The cross currency interest rate swaps were executed as two separate sets of instruments, wherein Vermilion:• Receives US dollar interest and principal amounts equal to US$300.0 million of debt at 5.625% interest and pays Canadian dollar interest and
principal amounts equal to $398.5 million of debt at 5.40% interest. • Receives Canadian dollar interest and principal amounts equal to $398.5 million of debt at 5.40% interest and pays Euro interest and principal
amounts equal to €265.0 million at a rate of 3.275%.
Shareholders' capital
Beginning with the April 2018 dividend paid on May 15, 2018, we increased our monthly dividend by 7%, to $0.23 per share from $0.215 per share.The dividend increase in Q2 2018 was our fourth dividend increase (previously Vermilion's distribution in the income trust era) since we began payinga distribution in 2003.
In total, dividends declared for the nine months ended September 30, 2019 were $319.6 million.
The following table outlines our dividend payment history:
Date Monthly dividend per unit or shareJanuary 2003 to December 2007 $0.170January 2008 to December 2012 $0.190January 2013 to December 2013 $0.200January 2014 to March 2018 $0.215April 2018 onwards $0.230
Our policy with respect to dividends is to be conservative and maintain a low ratio of dividends to fund flows from operations. During low commodityprice cycles, we will initially maintain dividends and allow the ratio to rise. Should low commodity price cycles remain for an extended period of time,we will evaluate the necessity of changing the level of dividends, taking into consideration capital development requirements, debt levels, and acquisitionopportunities.
Although we expect to be able to maintain our current dividend, fund flows from operations may not be sufficient to fund cash dividends, capitalexpenditures, and asset retirement obligations. We will evaluate our ability to finance any shortfall with debt, issuances of equity, or by reducing someor all categories of expenditures to ensure that total expenditures do not exceed available funds.
On August 7, 2019, the Toronto Stock Exchange ("TSX") approved the notice of our intention to commence a normal course issuer bid ("the NCIB").The NCIB allows Vermilion to purchase up to 7,750,000 common shares (representing approximately 5% of shares outstanding common shares)beginning August 9, 2019 and ending August 8, 2020. Any common shares that are purchased under the NCIB will be canceled upon their purchase.As at September 30, 2019, no shares have been purchased pursuant to the NCIB.
Vermilion Energy Inc. ■ Page 42 ■ 2019 Third Quarter Report

The following table reconciles the change in shareholders’ capital:
Shareholders’ Capital Number of Shares ('000s) Amount ($M)Balance at December 31, 2018 152,704 4,008,828Shares issued for the Dividend Reinvestment Plan 898 24,737Vesting of equity based awards 1,223 45,636Equity based compensation 437 13,553Share-settled dividends on vested equity based awards 243 7,987Balance as at September 30, 2019 155,505 4,100,741
As at September 30, 2019, there were approximately 2.3 million equity based compensation awards outstanding. As at October 30, 2019, there wereapproximately 155.7 million common shares issued and outstanding.
Vermilion Energy Inc. ■ Page 43 ■ 2019 Third Quarter Report
Asset Retirement Obligations As at September 30, 2019, asset retirement obligations were $633.5 million compared to $650.2 million as at December 31, 2018. The decrease in asset retirement obligations is largely attributable to the impact of the Euro weakening against the Canadian dollar. This decreasewas partially offset by an overall decrease in the discount rates applied to the abandonment obligation and accretion expense. Vermilion calculatedthe present value of the obligations using a credit-adjusted risk-free rate, calculated using a credit spread of 4.9% (2018 - 4.0%). The risk-free ratesused as inputs to discount the obligations were as follows:
Sep 30, 2019 Dec 31, 2018Canada 1.5 % 2.2%France 0.5 % 1.6%Netherlands (0.5)% 0.4%Germany (0.1)% 0.9%Ireland 0.4 % 1.6%Australia 1.3 % 2.6%USA 2.1 % 2.7%
Off Balance Sheet ArrangementsWe have not entered into any guarantee or off balance sheet arrangements that would materially impact our financial position or results of operations.
Risk Management Vermilion is exposed to various market and operational risks. For a discussion of these risks, please see Vermilion's MD&A and Annual InformationForm, each for the year ended December 31, 2018 available on SEDAR at www.sedar.com or on Vermilion’s website at www.vermilionenergy.com.
Critical Accounting EstimatesThe preparation of financial statements in accordance with IFRS requires management to make estimates, judgments and assumptions that affectreported assets, liabilities, revenues and expenses, gains and losses, and disclosures of any possible contingencies. These estimates and assumptionsare developed based on the best available information which management believed to be reasonable at the time such estimates and assumptions weremade. As such, these assumptions are uncertain at the time estimates are made and could change, resulting in a material impact on Vermilion’sconsolidated financial statements. Estimates are reviewed by management on an ongoing basis and as a result may change from period to period dueto the availability of new information or changes in circumstances. Additionally, as a result of the unique circumstances of each jurisdiction that Vermilionoperates in, the critical accounting estimates may affect one or more jurisdictions. There have been no material changes to our critical accountingestimates used in applying accounting policies for the three and nine months ended September 30, 2019. Further information, including a discussionof critical accounting estimates, can be found in the notes to the Consolidated Financial Statements and annual MD&A for the year ended December 31,2018, available on SEDAR at www.sedar.com or on Vermilion’s website at www.vermilionenergy.com.
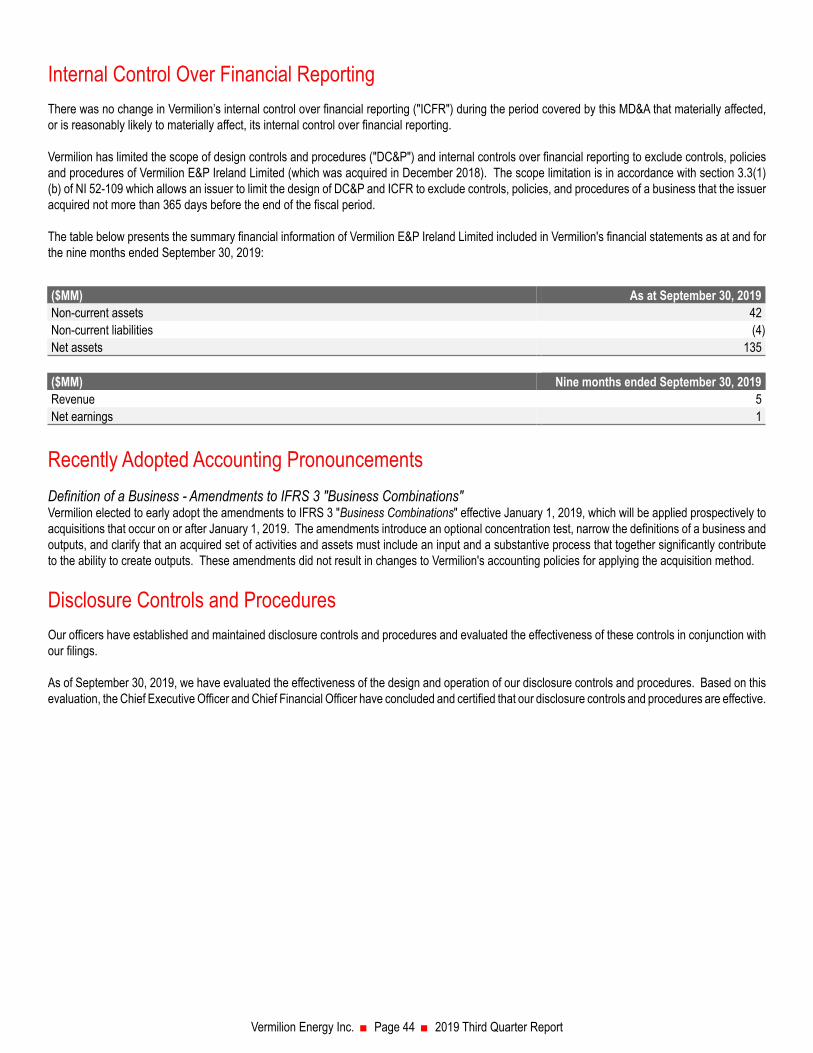
Internal Control Over Financial ReportingThere was no change in Vermilion’s internal control over financial reporting ("ICFR") during the period covered by this MD&A that materially affected,or is reasonably likely to materially affect, its internal control over financial reporting.
Vermilion has limited the scope of design controls and procedures ("DC&P") and internal controls over financial reporting to exclude controls, policiesand procedures of Vermilion E&P Ireland Limited (which was acquired in December 2018). The scope limitation is in accordance with section 3.3(1)(b) of NI 52-109 which allows an issuer to limit the design of DC&P and ICFR to exclude controls, policies, and procedures of a business that the issueracquired not more than 365 days before the end of the fiscal period.
The table below presents the summary financial information of Vermilion E&P Ireland Limited included in Vermilion's financial statements as at and forthe nine months ended September 30, 2019:
($MM) As at September 30, 2019Non-current assets 42Non-current liabilities (4)Net assets 135
($MM) Nine months ended September 30, 2019Revenue 5Net earnings 1
Vermilion Energy Inc. ■ Page 44 ■ 2019 Third Quarter Report
Recently Adopted Accounting PronouncementsDefinition of a Business - Amendments to IFRS 3 "Business Combinations"Vermilion elected to early adopt the amendments to IFRS 3 "Business Combinations" effective January 1, 2019, which will be applied prospectively toacquisitions that occur on or after January 1, 2019. The amendments introduce an optional concentration test, narrow the definitions of a business andoutputs, and clarify that an acquired set of activities and assets must include an input and a substantive process that together significantly contributeto the ability to create outputs. These amendments did not result in changes to Vermilion's accounting policies for applying the acquisition method.
Disclosure Controls and ProceduresOur officers have established and maintained disclosure controls and procedures and evaluated the effectiveness of these controls in conjunction withour filings. As of September 30, 2019, we have evaluated the effectiveness of the design and operation of our disclosure controls and procedures. Based on thisevaluation, the Chief Executive Officer and Chief Financial Officer have concluded and certified that our disclosure controls and procedures are effective.

Supplemental Table 1: Netbacks The following table includes financial statement information on a per unit basis by business unit. Liquids includes crude oil, condensate, and NGLs.Natural gas sales volumes have been converted on a basis of six thousand cubic feet of natural gas to one barrel of oil equivalent.
Q3 2019 YTD 2019 Q3 2018 YTD 2018Liquids Natural Gas Total Liquids Natural Gas Total Total Total
$/bbl $/mcf $/boe $/bbl $/mcf $/boe $/boe $/boeCanadaSales 54.69 1.16 34.94 57.37 1.58 37.64 46.02 39.89Royalties (7.19) (0.09) (4.44) (7.39) 0.04 (4.24) (6.40) (4.86)Transportation (2.52) (0.18) (1.93) (2.41) (0.18) (1.87) (1.72) (1.55)Operating (12.64) (1.34) (10.75) (12.93) (1.38) (11.02) (10.52) (9.50)Operating netback 32.34 (0.45) 17.82 34.64 0.06 20.51 27.38 23.98General and administration (1.08) (0.96) (0.25) (0.32)Fund flows from operations netback 16.74 19.55 27.13 23.66FranceSales 79.89 — 79.89 83.98 1.76 83.69 95.46 91.27Royalties (11.18) — (11.23) (11.33) (0.75) (11.31) (12.08) (11.56)Transportation (6.05) — (6.05) (6.21) — (6.18) (1.91) (2.39)Operating (14.77) — (14.77) (15.24) — (15.18) (13.00) (13.51)Operating netback 47.89 — 47.84 51.20 1.01 51.02 68.47 63.81General and administration (3.31) (3.56) (3.19) (3.45)Current income taxes (3.34) (5.54) (6.54) (4.72)Fund flows from operations netback 41.19 41.92 58.74 55.64NetherlandsSales 69.12 4.49 27.40 72.08 6.36 38.51 60.74 55.54Royalties — (0.07) (0.41) — (0.10) (0.59) (1.52) (1.30)Operating — (1.58) (9.36) — (1.66) (9.83) (8.45) (9.79)Operating netback 69.12 2.84 17.63 72.08 4.60 28.09 50.77 44.45General and administration (0.44) (0.83) (0.47) (0.61)Current income taxes (0.68) (3.18) 2.51 (4.46)Fund flows from operations netback 16.51 24.08 52.81 39.38GermanySales 76.51 3.92 37.43 80.80 5.88 47.79 67.15 61.02Royalties (2.50) (0.56) (3.15) (4.08) (0.86) (4.88) (7.81) (5.48)Transportation (16.54) (0.30) (5.65) (11.97) (0.24) (4.34) (3.80) (5.01)Operating (25.75) (3.28) (21.27) (24.66) (2.66) (18.33) (15.51) (16.56)Operating netback 31.72 (0.22) 7.36 40.09 2.12 20.24 40.03 33.97General and administration (8.05) (6.78) (6.61) (5.13)Fund flows from operations netback (0.69) 13.46 33.42 28.84IrelandSales — 4.20 25.24 — 6.29 37.74 63.76 59.32Transportation — (0.28) (1.71) — (0.26) (1.58) (1.85) (1.57)Operating — (0.79) (4.73) — (0.73) (4.38) (4.26) (4.25)Operating netback — 3.13 18.80 — 5.30 31.78 57.65 53.50General and administration (2.17) (0.92) (4.57) (2.48)Fund flows from operations netback 16.63 30.86 53.08 51.02
Vermilion Energy Inc. ■ Page 45 ■ 2019 Third Quarter Report

(1) Vermilion considers Australian PRRT to be an operating item and, accordingly, has included PRRT in the calculation of operating netbacks. Currentincome taxes presented above excludes PRRT.
Q3 2019 YTD 2019 Q3 2018 YTD 2018Liquids Natural Gas Total Liquids Natural Gas Total Total Total
$/bbl $/mcf $/boe $/bbl $/mcf $/boe $/boe $/boeAustraliaSales 93.71 — 93.71 94.04 — 94.04 99.01 94.39Operating (19.81) — (19.81) (23.92) — (23.92) (32.00) (31.73)PRRT (1) (9.72) — (9.72) (14.16) — (14.16) 0.70 (6.14)Operating netback 64.18 — 64.18 55.96 — 55.96 67.71 56.52General and administration (2.10) (2.00) (2.82) (2.99)Corporate income taxes (0.66) (4.58) (9.27) (5.41)Fund flows from operations netback 61.42 49.38 55.62 48.12United StatesSales 51.36 1.67 42.43 54.33 2.34 44.34 53.10 59.45Royalties (13.02) (0.43) (10.76) (13.82) (0.62) (11.31) (12.57) (15.00)Operating (10.25) (1.29) (9.71) (9.96) (1.42) (9.61) (9.61) (8.91)Operating netback 28.09 (0.05) 21.96 30.55 0.30 23.42 30.92 35.54General and administration (4.43) (4.62) (8.75) (12.24)Fund flows from operations netback 17.53 18.80 22.17 23.30
Total CompanySales 64.23 2.43 43.04 66.75 3.56 46.79 57.90 54.64Realized hedging (loss) gain 2.39 1.05 4.06 1.53 0.51 2.21 (4.26) (3.71)Royalties (7.46) (0.11) (4.56) (7.62) (0.06) (4.42) (6.13) (4.85)Transportation (2.96) (0.17) (2.13) (2.89) (0.16) (2.05) (1.56) (1.56)Operating (13.90) (1.40) (11.55) (14.60) (1.39) (11.85) (11.13) (10.94)PRRT (1) (1.12) — (0.64) (1.57) — (0.88) 0.03 (0.32)Operating netback 41.18 1.80 28.22 41.60 2.46 29.80 34.85 33.26General and administration (1.50) (1.53) (1.51) (1.75)Interest expense (2.16) (2.24) (2.25) (2.32)Realized foreign exchange loss (0.37) (0.25) (0.35) (0.25)Other income 0.04 0.27 0.02 0.03Corporate income taxes (0.50) (1.16) (1.07) (1.38)Fund flows from operations netback 23.73 24.89 29.69 27.59
Vermilion Energy Inc. ■ Page 46 ■ 2019 Third Quarter Report

Supplemental Table 2: Hedges The prices in these tables may represent the weighted averages for several contracts. The weighted average price for the portfolio of options listedbelow may not have the same payoff profile as the individual contracts. As such, the presentation of the weighted average prices is purely for indicativepurposes. The following tables outline Vermilion’s outstanding risk management positions as at September 30, 2019:
Bought PutVolume
Weighted Average
Bought PutSold Call
Volume
Weighted Average
Sold CallSold Put Volume
Weighted AverageSold Put
Swap Volume
Weighted Average
Swap
Crude Oil Period Exercise date (1) Currency (bbl/d) Price / bbl (bbl/d) Price / bbl (bbl/d) Price / bbl (bbl/d) Price / bbl
Dated Brent
Swap Oct 2019 - Dec 2019 CAD — — — — — — 1,350 91.76
3-Way Collar Oct 2019 - Dec 2019 USD 1,500 63.03 1,500 71.67 1,500 55.00 — —
3-Way Collar Oct 2019 - Jun 2020 USD 1,000 65.00 1,000 72.50 1,000 55.00 — —
Swap Oct 2019 - Dec 2019 USD — — — — — — 4,250 69.32
Swaption Jan 2020 - Dec 2020 Dec 31, 2019 USD — — — — — — 5,000 61.55
WTI
Swap Oct 2019 - Dec 2019 CAD — — — — — — 1,050 81.41
3-Way Collar Oct 2019 - Dec 2019 USD 1,250 55.20 1,250 64.05 1,250 46.00 — —
3-Way Collar Oct 2019 - Mar 2020 USD 2,500 57.40 2,000 62.38 2,500 50.20 — —
3-Way Collar Oct 2019 - Jun 2020 USD 6,750 52.78 3,500 60.09 6,750 44.33 — —
Swap Oct 2019 - Dec 2019 USD — — — — — — 2,000 60.00
Swap Oct 2019 - Mar 2020 USD — — — — — — 1,500 59.17
Bought PutVolume
Weighted Average
Bought PutSold Call
Volume
Weighted Average
Sold CallSold Put Volume
Weighted AverageSold Put
Swap Volume
Weighted Average
Swap
North American Gas Period Exercise date (1) Currency (mmbtu/d)Price /
mmbtu (mmbtu/d)Price /
mmbtu (mmbtu/d)Price /
mmbtu (mmbtu/d)Price /
mmbtu
AECO
Collar Nov 2019 - Mar 2020 CAD 10,426 1.58 10.426 2.56 — — — —
Swap Apr 2020 - Oct 2020 CAD — — — — — — 10,426 1.39
AECO Basis (AECO less NYMEX Henry Hub)
Swap Oct 2019 USD — — — — — — 10,000 (1.65)
Swap Oct 2019 - Jun 2020 USD — — — — — — 2,500 (0.93)
Swap Nov 2019 - Mar 2020 USD — — — — — — 30,000 (0.94)
Swap Apr 2020 - Oct 2020 USD — — — — — — 50,000 (1.12)
Swap Nov 2020 - Mar 2021 USD — — — — — — 30,000 (1.11)
Swap Apr 2021 - Oct 2021 USD — — — — — — 35,000 (1.10)
Swap Nov 2021 - Mar 2022 USD — — — — — — 30,000 (1.10)
Swap Apr 2022 - Oct 2022 USD — — — — — — 35,000 (1.09)(1) The sold swaption instrument allows the counterparty, at the specified date, to enter into a derivative instrument contract with Vermilion at the above detailed terms.
Vermilion Energy Inc. ■ Page 47 ■ 2019 Third Quarter Report

Bought PutVolume
Weighted Average
Bought PutSold Call
Volume
Weighted Average
Sold CallSold Put Volume
Weighted AverageSold Put
Swap Volume
Weighted Average
Swap
European Gas Period Exercise date (1) Currency (mmbtu/d)Price /
mmbtu (mmbtu/d) Price /mmbtu (mmbtu/d)
Price /mmbtu (mmbtu/d)
Price /mmbtu
NBP
3-Way Collar Oct 2019 - Dec 2019 EUR 17,197 4.97 17,197 5.65 17,197 3.79 — —
3-Way Collar (2) Oct 2019 - Mar 2020 EUR 7,370 5.57 7,370 6.74 7,370 4.10 — —
3-Way Collar (2) Oct 2019 - Dec 2020 EUR 7,370 4.96 7,370 5.76 7,370 3.74 — —
3-Way Collar (2) Jan 2020 - Dec 2020 EUR 22,111 5.19 22,111 5.78 22,111 4.05 — —
3-Way Collar (2) Jan 2020 - Dec 2021 EUR 12,284 5.41 12,284 — 5.44 12,284 3.90 — —
3-Way Collar (2) Oct 2020 - Mar 2021 EUR 7,370 5.57 9,827 6.16 7,370 4.10 — —
3-Way Collar (2) Oct 2020 - Jun 2022 EUR 12,283 5.33 12,283 6.10 12,283 3.60 — —
3-Way Collar (2) Jan 2021 - Dec 2021 EUR 17,197 5.53 17,197 5.98 17,197 4.19 — —
3-Way Collar (2) Oct 2021 - Mar 2022 EUR 7,370 5.57 7,370 6.74 7,370 4.10 — —
Swaption Jan 2020 - Mar 2020 Dec 31, 2019 EUR — — — — — — 2,047 7.33
Swaption Oct 2020 - Jun 2022 Jun 30, 2020 EUR — — — — — — 2,457 5.86
Swaption Oct 2020 - Jun 2022 Sep 30, 2020 EUR — — — — — — 2,457 6.15
Swaption Jan 2021 - Sep 2022 Jun 30, 2020 EUR — — — — — — 2,457 5.86
Swaption Jan 2021 - Sep 2022 Jun 30, 2020 USD — — — — — — 2,457 6.45
NBP Basis (NBP less NYMEX Henry Hub)
Collar Oct 2019 - Sep 2020 USD 7,500 2.07 7,500 4.00 — — — —
Collar Jan 2020 - Mar 2020 USD 2,500 3.50 2,500 4.00 — — — —
Collar Jan 2020 - Dec 2020 USD 7,500 3.15 7,500 3.97 — — — —
Collar Oct 2020 - Dec 2020 USD 2,500 3.50 2,500 4.00 — — — —
Bought PutVolume
Weighted Average
Bought PutSold Call
Volume
Weighted Average
Sold CallSold Put Volume
Weighted AverageSold Put
Swap Volume
Weighted Average
Swap
European Gas Period Exercise date Currency (mmbtu/d)Price /
mmbtu (mmbtu/d) Price /mmbtu (mmbtu/d)
Price /mmbtu (mmbtu/d)
Price /mmbtu
TTF
3-Way Collar Oct 2019 - Dec 2019 EUR 23,339 4.86 23,339 5.59 23,339 3.36 — —
3-Way Collar Jan 2020 - Dec 2020 EUR 7,370 5.37 7,370 6.25 7,370 3.81 — —
3-Way Collar Apr 2020 - Sep 2020 EUR 2,457 5.33 2,457 5.86 2,457 3.81 — —
Put Spread Apr 2020 - Sep 2020 EUR 3,685 5.35 — — 3,685 3.52 — —
Swap Oct 2019 - Dec 2019 EUR — — — — — — 15,969 4.92
Swap Apr 2020 - Jun 2020 EUR — — — — — — 4,913 5.54
Swap Jul 2020 EUR — — — — — — 4,913 5.36
Swap Sep 2020 EUR — — — — — — 4,913 5.54
TTF Basis (TTF less NYMEX Henry Hub)
Collar Apr 2020 - Sep 2020 USD 2,500 3.50 2,500 4.00 — — — —
Swap Apr 2020 - Sep 2020 USD — — — — — — 5,000 3.21
Cross Currency Interest Rate Receive Notional Amount Receive Rate Pay Notional Amount Pay Rate
Swap Oct 2019 1,139,217,113 USD LIBOR + 1.70% 1,504,900,000 CAD CDOR + 1.27%
Swap Jun 2019 - Mar 2025 300,000,000 USD 5.625% 265,048,910 EUR 3.275%
VET Equity Swaps Notional Amount Share Volume
Swap Oct 2019 - Oct 2021 33,688,050 CAD 1,500,000
Swap Oct 2019 - Sep 2021 47,202,300 CAD 2,250,000(1) The sold swaption instrument allows the counterparty, at the specified date, to enter into a derivative instrument contract with Vermilion at the above detailed terms.(2) The weighted average sold call price in the 3-way collars contains sold calls priced in USD that have been translated to EUR using foreign exchange forward rates as at September 30, 2019.
Vermilion Energy Inc. ■ Page 48 ■ 2019 Third Quarter Report

Supplemental Table 3: Capital Expenditures and Acquisitions By classification ($M) Q3 2019 Q2 2019 Q3 2018 YTD 2019 YTD 2018Drilling and development 117,123 75,149 142,116 389,563 343,483Exploration and evaluation 10,756 17,458 4,069 32,976 11,151Capital expenditures 127,879 92,607 146,185 422,539 354,634
Acquisitions 4,657 8,623 193,677 29,307 307,622Shares issued for acquisition — — — — 1,235,221Long-term debt net of working capital assumed — — 4,496 — 213,893Acquisitions 4,657 8,623 198,173 29,307 1,756,736
By category ($M) Q3 2019 Q2 2019 Q3 2018 YTD 2019 YTD 2018Drilling, completion, new well equip and tie-in, workoversand recompletions 93,681 70,636 118,317 338,875 283,364
Production equipment and facilities 28,722 12,323 26,964 58,490 53,330Seismic, studies, land and other 5,476 9,648 904 25,174 17,940Capital expenditures 127,879 92,607 146,185 422,539 354,634Acquisitions 4,657 8,623 198,173 29,307 1,756,736Total capital expenditures and acquisitions 132,536 101,230 344,358 451,846 2,111,370
Capital expenditures by country ($M) Q3 2019 Q2 2019 Q3 2018 YTD 2019 YTD 2018Canada 69,963 29,083 89,837 227,101 187,646France 18,139 25,671 15,779 65,896 62,750Netherlands 3,028 4,577 5,056 13,954 15,029Germany 4,229 9,234 6,497 16,507 11,226Ireland 354 84 (50) 449 84Australia 2,995 2,239 16,061 24,098 31,878United States 21,064 12,964 11,386 54,064 37,956Corporate 8,107 8,755 1,619 20,470 8,065Total capital expenditures 127,879 92,607 146,185 422,539 354,634
Acquisitions by country ($M) Q3 2019 Q2 2019 Q3 2018 YTD 2019 YTD 2018Canada 1,746 2,655 6,146 19,061 1,561,731Netherlands — — 2,874 908 5,773Germany 947 4,751 959 6,114 959United States 1,964 1,217 187,987 3,224 188,066Corporate — — 207 — 207Total acquisitions 4,657 8,623 198,173 29,307 1,756,736
In 2019, included in cash expenditures on acquisitions of $29.3 million is: $12.2 million net paid to vendors in relation to the purchase of assets from other oil and gasproducers; $3.6 million in asset improvements incurred subsequent to acquisitions for compliance with safety, environmental, and Vermilion's operating standards;$3.7 million paid to acquire land; $0.9 million paid to acquire royalty interests, and $8.9 million relating to the carry component of farm-in arrangements.
Vermilion Energy Inc. ■ Page 49 ■ 2019 Third Quarter Report
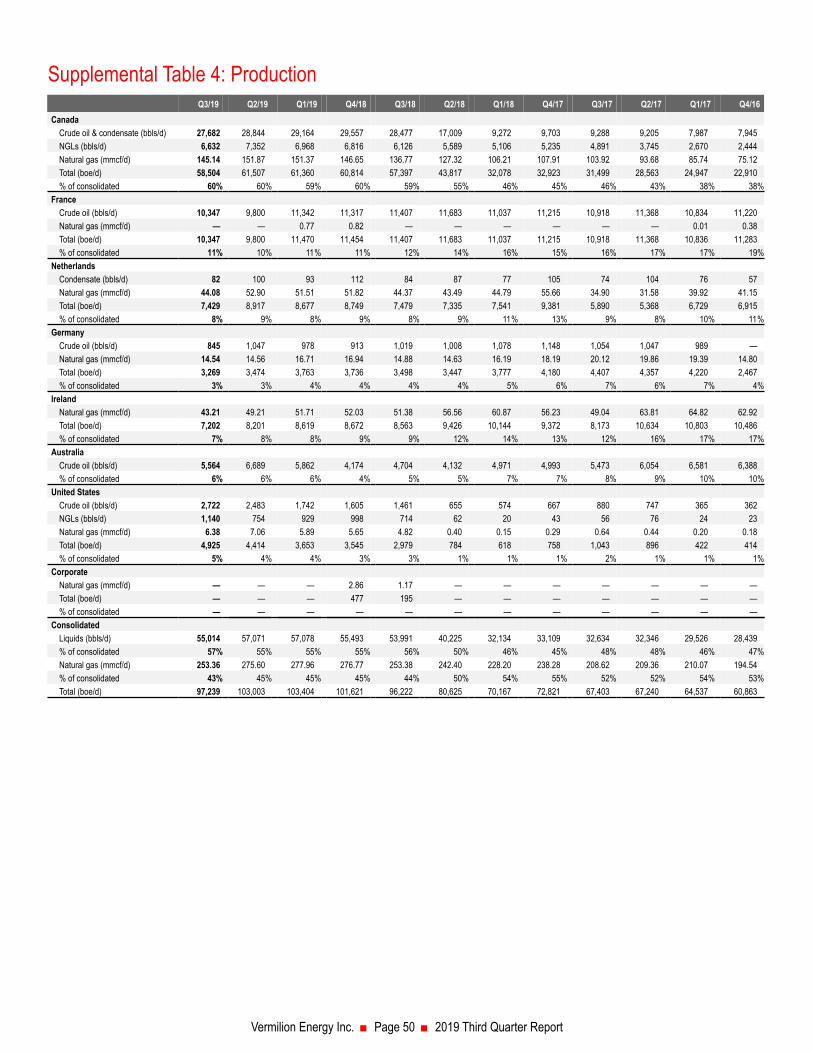
Supplemental Table 4: ProductionQ3/19 Q2/19 Q1/19 Q4/18 Q3/18 Q2/18 Q1/18 Q4/17 Q3/17 Q2/17 Q1/17 Q4/16
CanadaCrude oil & condensate (bbls/d) 27,682 28,844 29,164 29,557 28,477 17,009 9,272 9,703 9,288 9,205 7,987 7,945NGLs (bbls/d) 6,632 7,352 6,968 6,816 6,126 5,589 5,106 5,235 4,891 3,745 2,670 2,444Natural gas (mmcf/d) 145.14 151.87 151.37 146.65 136.77 127.32 106.21 107.91 103.92 93.68 85.74 75.12Total (boe/d) 58,504 61,507 61,360 60,814 57,397 43,817 32,078 32,923 31,499 28,563 24,947 22,910% of consolidated 60% 60% 59% 60% 59% 55% 46% 45% 46% 43% 38% 38%
FranceCrude oil (bbls/d) 10,347 9,800 11,342 11,317 11,407 11,683 11,037 11,215 10,918 11,368 10,834 11,220Natural gas (mmcf/d) — — 0.77 0.82 — — — — — — 0.01 0.38Total (boe/d) 10,347 9,800 11,470 11,454 11,407 11,683 11,037 11,215 10,918 11,368 10,836 11,283% of consolidated 11% 10% 11% 11% 12% 14% 16% 15% 16% 17% 17% 19%
NetherlandsCondensate (bbls/d) 82 100 93 112 84 87 77 105 74 104 76 57Natural gas (mmcf/d) 44.08 52.90 51.51 51.82 44.37 43.49 44.79 55.66 34.90 31.58 39.92 41.15Total (boe/d) 7,429 8,917 8,677 8,749 7,479 7,335 7,541 9,381 5,890 5,368 6,729 6,915% of consolidated 8% 9% 8% 9% 8% 9% 11% 13% 9% 8% 10% 11%
GermanyCrude oil (bbls/d) 845 1,047 978 913 1,019 1,008 1,078 1,148 1,054 1,047 989 —Natural gas (mmcf/d) 14.54 14.56 16.71 16.94 14.88 14.63 16.19 18.19 20.12 19.86 19.39 14.80Total (boe/d) 3,269 3,474 3,763 3,736 3,498 3,447 3,777 4,180 4,407 4,357 4,220 2,467% of consolidated 3% 3% 4% 4% 4% 4% 5% 6% 7% 6% 7% 4%
IrelandNatural gas (mmcf/d) 43.21 49.21 51.71 52.03 51.38 56.56 60.87 56.23 49.04 63.81 64.82 62.92Total (boe/d) 7,202 8,201 8,619 8,672 8,563 9,426 10,144 9,372 8,173 10,634 10,803 10,486% of consolidated 7% 8% 8% 9% 9% 12% 14% 13% 12% 16% 17% 17%
AustraliaCrude oil (bbls/d) 5,564 6,689 5,862 4,174 4,704 4,132 4,971 4,993 5,473 6,054 6,581 6,388% of consolidated 6% 6% 6% 4% 5% 5% 7% 7% 8% 9% 10% 10%
United StatesCrude oil (bbls/d) 2,722 2,483 1,742 1,605 1,461 655 574 667 880 747 365 362NGLs (bbls/d) 1,140 754 929 998 714 62 20 43 56 76 24 23Natural gas (mmcf/d) 6.38 7.06 5.89 5.65 4.82 0.40 0.15 0.29 0.64 0.44 0.20 0.18Total (boe/d) 4,925 4,414 3,653 3,545 2,979 784 618 758 1,043 896 422 414% of consolidated 5% 4% 4% 3% 3% 1% 1% 1% 2% 1% 1% 1%
CorporateNatural gas (mmcf/d) — — — 2.86 1.17 — — — — — — —Total (boe/d) — — — 477 195 — — — — — — —% of consolidated — — — — — — — — — — — —
ConsolidatedLiquids (bbls/d) 55,014 57,071 57,078 55,493 53,991 40,225 32,134 33,109 32,634 32,346 29,526 28,439% of consolidated 57% 55% 55% 55% 56% 50% 46% 45% 48% 48% 46% 47%Natural gas (mmcf/d) 253.36 275.60 277.96 276.77 253.38 242.40 228.20 238.28 208.62 209.36 210.07 194.54% of consolidated 43% 45% 45% 45% 44% 50% 54% 55% 52% 52% 54% 53%Total (boe/d) 97,239 103,003 103,404 101,621 96,222 80,625 70,167 72,821 67,403 67,240 64,537 60,863
Vermilion Energy Inc. ■ Page 50 ■ 2019 Third Quarter Report

YTD 2019 2018 2017 2016 2015 2014Canada
Crude oil & condensate (bbls/d) 28,558 21,154 9,051 9,171 11,357 12,491NGLs (bbls/d) 6,983 5,914 4,144 2,552 2,301 1,233Natural gas (mmcf/d) 149.44 129.37 97.89 84.29 71.65 55.67Total (boe/d) 60,447 48,630 29,510 25,771 25,598 23,001% of consolidated 61% 56% 45% 40% 46% 47%
FranceCrude oil (bbls/d) 10,493 11,362 11,084 11,896 12,267 11,011Natural gas (mmcf/d) 0.25 0.21 — 0.44 0.97 —Total (boe/d) 10,535 11,396 11,085 11,970 12,429 11,011% of consolidated 10% 13% 16% 19% 23% 22%
NetherlandsCondensate (bbls/d) 92 90 90 88 99 77Natural gas (mmcf/d) 49.47 46.13 40.54 47.82 44.76 38.20Total (boe/d) 8,336 7,779 6,847 8,058 7,559 6,443% of consolidated 8% 9% 10% 13% 14% 13%
GermanyCrude oil (bbls/d) 956 1,004 1,060 — — —Natural gas (mmcf/d) 15.26 15.66 19.39 14.90 15.78 14.99Total (boe/d) 3,500 3,614 4,291 2,483 2,630 2,498% of consolidated 3% 4% 6% 4% 5% 5%
IrelandNatural gas (mmcf/d) 48.01 55.17 58.43 50.89 0.03 —Total (boe/d) 8,002 9,195 9,737 8,482 5 —% of consolidated 8% 11% 14% 13% — —
AustraliaCrude oil (bbls/d) 6,037 4,494 5,770 6,304 6,454 6,571% of consolidated 6% 5% 8% 10% 12% 13%
United StatesCrude oil (bbls/d) 2,319 1,078 666 393 231 49NGLs (bbls/d) 942 452 50 29 7 —Natural gas (mmcf/d) 6.45 2.78 0.39 0.21 0.05 —Total (boe/d) 4,335 1,992 781 457 247 49% of consolidated 4% 2% 1% 1% — —
CorporateNatural gas (mmcf/d) — 1.02 — — — —Total (boe/d) — 169 — — — —% of consolidated — — — — — —
ConsolidatedLiquids (bbls/d) 56,380 45,548 31,915 30,433 32,716 31,432% of consolidated 56% 52% 47% 48% 60% 63%Natural gas (mmcf/d) 268.88 250.33 216.64 198.55 133.24 108.85% of consolidated 44% 48% 53% 52% 40% 37%Total (boe/d) 101,193 87,270 68,021 63,526 54,922 49,573
Vermilion Energy Inc. ■ Page 51 ■ 2019 Third Quarter Report

Non-GAAP Financial Measures This MD&A includes references to certain financial measures which do not have standardized meanings and may not be comparable to similar measurespresented by other issuers. These financial measures include fund flows from operations, a measure of profit or loss in accordance with IFRS 8“Operating Segments” (please see Segmented Information in the Notes to the Condensed Consolidated Interim Financial Statements) and net debt, ameasure of capital in accordance with IAS 1 “Presentation of Financial Statements” (please see Capital Disclosures in the Notes to the CondensedConsolidated Interim Financial Statements).
In addition, this MD&A includes financial measures which are not specified, defined, or determined under IFRS and are therefore considered non-GAAPfinancial measures and may not be comparable to similar measures presented by other issuers. These non-GAAP financial measures include:
Acquisitions: The sum of acquisitions from the Consolidated Statements of Cash Flows, Vermilion common shares issued as consideration, theestimated value of contingent consideration, the amount of acquiree's outstanding long-term debt assumed plus or net of acquired working capital deficitor surplus. We believe that including these components provides a useful measure of the economic investment associated with our acquisition activity.
Capital expenditures: The sum of drilling and development and exploration and evaluation from the Consolidated Statements of Cash Flows. Weconsider capital expenditures to be a useful measure of our investment in our existing asset base. Capital expenditures are also referred to as E&Dcapital.
Cash dividends per share: Represents cash dividends declared per share and is a useful measure of the dividends a common shareholder wasentitled to during the period.
Covenants: The financial covenants on our revolving credit facility contain non-GAAP measures. The definitions for these financial covenants areincluded in Financial Position Review.
Diluted shares outstanding: The sum of shares outstanding at the period end plus outstanding awards under the VIP, based on current estimates offuture performance factors and forfeiture rates.
Free cash flow: Represents fund flows from operations in excess of capital expenditures. We use free cash flow to determine the funding availablefor investing and financing activities, including payment of dividends, repayment of long-term debt, reallocation to existing business units, and deploymentinto new ventures. We also assess free cash flow as a percentage of fund flows from operations, which is a measure of the percentage of fund flowsfrom operations that is retained for incremental investing and financing activities.
Fund flows from operations per basic and diluted share: Management assesses fund flows from operations on a per share basis as we believethis provides a measure of our operating performance after taking into account the issuance and potential future issuance of Vermilion common shares.Fund flows from operations per basic share is calculated by dividing fund flows from operations by the basic weighted average shares outstanding asdefined under IFRS. Fund flows from operations per diluted share is calculated by dividing fund flows from operations by the sum of basic weightedaverage shares outstanding and incremental shares issuable under the equity based compensation plans as determined using the treasury stockmethod.
Net dividends: We define net dividends as dividends declared less proceeds received for the issuance of shares pursuant to the Dividend ReinvestmentPlan. Management monitors net dividends and net dividends as a percentage of fund flows from operations to assess our ability to pay dividends.
Operating netback: Sales less royalties, operating expense, transportation costs, PRRT, and realized hedging gains and losses presented on a perunit basis. Management assesses operating netback as a measure of the profitability and efficiency of our field operations. In contrast, fund flows fromoperations netback also includes general and administration expense, corporate income taxes and interest. Fund flows from operations netback isused by management to assess the profitability of our business units and Vermilion as a whole.
Payout: We define payout as net dividends plus drilling and development costs, exploration and evaluation costs and asset retirement obligationssettled. Management uses payout and payout as a percentage of fund flows from operations (also referred to as the sustainability ratio) to assessthe amount of cash distributed back to shareholders and re-invested in the business for maintaining production and organic growth.
Return on capital employed (ROCE): ROCE is a measure that we use to analyze our profitability and the efficiency of our capital allocation process.ROCE is calculated by dividing net earnings before interest and taxes ("EBIT") by average capital employed over the preceding twelve months. Capitalemployed is calculated as total assets less current liabilities while average capital employed is calculated using the balance sheets at the beginningand end of the twelve-month period.
Vermilion Energy Inc. ■ Page 52 ■ 2019 Third Quarter Report

The following tables reconcile net dividends, payout, and diluted shares outstanding from their most directly comparable GAAP measures as presentedin our financial statements:
($M) Q3 2019 Q2 2019 Q3 2018 YTD 2019 YTD 2018Dividends declared 107,176 106,884 105,192 319,609 282,801Shares issued for the Dividend Reinvestment Plan (8,860) (8,773) (4,320) (24,737) (43,936)Net dividends 98,316 98,111 100,872 294,872 238,865Drilling and development 117,123 75,149 142,116 389,563 343,483Exploration and evaluation 10,756 17,458 4,069 32,976 11,151Asset retirement obligations settled 3,586 4,907 2,986 12,090 9,203Payout 229,781 195,625 250,043 729,501 602,702 % of fund flows from operations 106% 88% 96% 105% 98%
('000s of shares) Q3 2019 Q2 2019 Q3 2018Shares outstanding 155,505 155,032 152,497Potential shares issuable pursuant to the VIP 3,755 3,601 3,250Diluted shares outstanding 159,260 158,633 155,747
The following tables reconciles the calculation of return on capital employed:
Twelve Months Ended($M) Sep 30, 2019 Sep 30, 2018Net earnings (loss) 354,695 (43,078)Taxes 160,981 (4,516)Interest expense 83,035 65,642EBIT 598,711 18,048Average capital employed 5,426,400 4,500,719Return on capital employed 11% —%
Vermilion Energy Inc. ■ Page 53 ■ 2019 Third Quarter Report

Consolidated Interim Financial Statements Consolidated Balance Sheet thousands of Canadian dollars, unaudited
Note September 30, 2019 December 31, 2018AssetsCurrentCash and cash equivalents 10,227 26,809Accounts receivable 246,522 260,322Crude oil inventory 16,150 27,751Derivative instruments 46,387 95,667Prepaid expenses 28,387 19,328Total current assets 347,673 429,877
Derivative instruments 21,720 1,215Deferred taxes 199,925 219,411Exploration and evaluation assets 6 312,946 303,295Capital assets 5 5,076,872 5,316,873Total assets 5,959,136 6,270,671
LiabilitiesCurrentAccounts payable and accrued liabilities 310,560 449,651Dividends payable 9 35,766 35,122Derivative instruments 16,049 41,016Income taxes payable 32,697 37,410Total current liabilities 395,072 563,199
Derivative instruments 26,423 17,527Long-term debt 8 1,954,471 1,796,207Lease obligations 98,288 108,189Asset retirement obligations 7 633,513 650,164Deferred taxes 317,305 318,134Total liabilities 3,425,072 3,453,420
Shareholders' equityShareholders’ capital 9 4,100,741 4,008,828Contributed surplus 72,289 78,478Accumulated other comprehensive income 45,545 118,182Deficit (1,684,511) (1,388,237)Total shareholders' equity 2,534,064 2,817,251Total liabilities and shareholders' equity 5,959,136 6,270,671
Approved by the Board
(Signed “Catherine L. Williams”) (Signed “Anthony Marino”)
Catherine L. Williams, Director Anthony Marino, Director
Vermilion Energy Inc. ■ Page 54 ■ 2019 Third Quarter Report

Consolidated Statements of Net (Loss) Earnings and Comprehensive Loss thousands of Canadian dollars, except share and per share amounts, unaudited
Three Months Ended Nine Months EndedNote Sep 30, 2019 Sep 30, 2018 Sep 30, 2019 Sep 30, 2018
RevenuePetroleum and natural gas sales 391,935 508,411 1,301,061 1,221,178Royalties (41,490) (53,786) (122,987) (108,293)Sales of purchased commodities 41,449 — 146,323 —Petroleum and natural gas revenue 391,894 454,625 1,324,397 1,112,885
ExpensesPurchased commodities 41,449 — 146,323 —Operating 105,192 97,758 329,495 244,544Transportation 19,426 13,721 56,876 34,949Equity based compensation 15,564 13,056 53,000 43,767(Gain) loss on derivative instruments (54,785) 113,194 (34,442) 246,709Interest expense 19,661 19,772 62,208 51,932General and administration 13,652 13,234 42,407 39,115Foreign exchange loss (gain) 54,027 26,144 (7,410) 32,528Other (income) expense (25) 26 (6,826) (11)Accretion 7 8,701 8,041 24,834 23,014Depletion and depreciation 5, 6 174,077 166,343 535,237 434,621
396,939 471,289 1,201,702 1,151,168(Loss) earnings before income taxes (5,045) (16,664) 122,695 (38,283)
TaxesDeferred (5,169) (10,712) 34,761 (24,613)Current 10,353 9,147 56,612 38,053
5,184 (1,565) 91,373 13,440
Net (loss) earnings (10,229) (15,099) 31,322 (51,723)
Other comprehensive lossCurrency translation adjustments (24,388) (20,592) (83,993) (4,983)Unrealized gains on derivatives designated as cash flow hedges 8 3,373 — 4,749 —Unrealized gains on derivatives designated as net investment hedges 8 6,815 — 6,607 —Comprehensive loss (24,429) (35,691) (41,315) (56,706)
Net (loss) earnings per shareBasic (0.07) (0.10) 0.20 (0.38)Diluted (0.07) (0.10) 0.20 (0.38)
Weighted average shares outstanding ('000s)Basic 155,254 152,432 154,326 136,585Diluted 155,254 152,432 155,673 136,585
Vermilion Energy Inc. ■ Page 55 ■ 2019 Third Quarter Report

Consolidated Statements of Cash Flows thousands of Canadian dollars, unaudited
Three Months Ended Nine Months EndedNote Sep 30, 2019 Sep 30, 2018 Sep 30, 2019 Sep 30, 2018
OperatingNet (loss) earnings (10,229) (15,099) 31,322 (51,723)Adjustments:
Accretion 7 8,701 8,041 24,834 23,014Depletion and depreciation 5, 6 174,077 166,343 535,237 434,621Unrealized (gain) loss on derivative instruments (17,817) 75,829 27,065 163,770Equity based compensation 15,564 13,056 53,000 43,767Unrealized foreign exchange loss (gain) 50,679 23,044 (14,377) 26,877Unrealized other expense 347 203 621 597Deferred taxes (5,169) (10,712) 34,761 (24,613)
Asset retirement obligations settled 7 (3,586) (2,986) (12,090) (9,203)Changes in non-cash operating working capital 16,034 52,325 (77,454) 29,570Cash flows from operating activities 228,601 310,044 602,919 636,677
InvestingDrilling and development 5 (117,123) (142,116) (389,563) (343,483)Exploration and evaluation 6 (10,756) (4,069) (32,976) (11,151)Acquisitions 5 (4,657) (193,677) (29,307) (307,622)Changes in non-cash investing working capital (31,476) 8,122 (49,846) 9,158Cash flows used in investing activities (164,012) (331,740) (501,692) (653,098)
FinancingBorrowings on the revolving credit facility 8 17,533 113,895 196,944 237,061Payments on lease obligations (9,337) (5,441) (20,525) (13,679)Cash dividends (98,207) (100,841) (294,228) (230,047)Cash flows (used in) from financing activities (90,011) 7,613 (117,809) (6,665)Foreign exchange gain (loss) on cash held in foreign currencies 585 (1,027) — 519
Net change in cash and cash equivalents (24,837) (15,110) (16,582) (22,567)Cash and cash equivalents, beginning of period 35,064 39,104 26,809 46,561Cash and cash equivalents, end of period 10,227 23,994 10,227 23,994
Supplementary information for cash flows from operating activities Interest paid 25,455 24,914 68,410 56,084 Income taxes paid 14,753 1,505 61,325 35,631
Vermilion Energy Inc. ■ Page 56 ■ 2019 Third Quarter Report

Consolidated Statements of Changes in Shareholders' Equity thousands of Canadian dollars, unaudited
Nine Months EndedNote September 30, 2019 September 30, 2018
Shareholders' capital 9Balance, beginning of period 4,008,828 2,650,706Shares issued for acquisition — 1,234,676Shares issued for the Dividend Reinvestment Plan 24,737 43,936Vesting of equity based awards 45,636 54,057Equity based compensation 13,553 10,626Share-settled dividends on vested equity based awards 7,987 7,773Balance, end of period 4,100,741 4,001,774
Contributed surplusBalance, beginning of period 78,478 84,354Equity based compensation 39,447 33,141Vesting of equity based awards (45,636) (54,057)Balance, end of period 72,289 63,438
Accumulated other comprehensive incomeBalance, beginning of period 118,182 71,829Currency translation adjustments (83,993) (4,983)Gains on derivatives designated as cash flow hedges 8 5,685 —Amount reclassified from cash flow hedge reserve to net (loss) earnings (936) —Gains on derivatives designated as net investment hedges 8 4,102 —Amount reclassified from net investment hedge reserve to net (loss) earnings 2,505 —Balance, end of period 45,545 66,846
DeficitBalance, beginning of period (1,388,237) (1,264,003)Net loss (earnings) 31,322 (51,723)Dividends declared 9 (319,609) (282,801)Share-settled dividends on vested equity based awards (7,987) (7,773)Balance, end of period (1,684,511) (1,606,300)
Total shareholders' equity 2,534,064 2,525,758
Vermilion Energy Inc. ■ Page 57 ■ 2019 Third Quarter Report

Notes to the Condensed Consolidated Interim Financial Statements for the three and ninemonths ended September 30, 2019 and 2018tabular amounts in thousands of Canadian dollars, except share and per share amounts, unaudited
Vermilion Energy Inc. ■ Page 58 ■ 2019 Third Quarter Report
1. Basis of presentation
Vermilion Energy Inc. (the “Company” or “Vermilion”) is a corporation governed by the laws of the Province of Alberta and is actively engaged in thebusiness of crude oil and natural gas exploration, development, acquisition and production.
These condensed consolidated interim financial statements are in compliance with International Accounting Standard (“IAS”) 34, “Interim FinancialReporting”. Except as described in Notes 2 and 3, these condensed consolidated interim financial statements have been prepared using the sameaccounting policies and methods of computation as Vermilion’s consolidated financial statements for the year ended December 31, 2018.
These condensed consolidated interim financial statements should be read in conjunction with Vermilion’s consolidated financial statements for theyear ended December 31, 2018, which are contained within Vermilion’s Annual Report for the year ended December 31, 2018 and are available onSEDAR at www.sedar.com or on Vermilion’s website at www.vermilionenergy.com.
These condensed consolidated interim financial statements were approved and authorized for issuance by the Board of Directors of Vermilion onOctober 30, 2019.
2. Significant accounting policies
On June 12, 2019, Vermilion entered into a series of cross currency interest rate swaps with a syndicate of banks. The details of these derivativeinstruments are disclosed in Note 8 (Long-term debt). Vermilion designated these derivative instruments as hedging instruments in qualifying hedgingrelationships. As such, effective June 12, 2019, Vermilion has adopted the following policies relating to hedge accounting.
Hedge AccountingHedge accounting is applied to financial instruments designated as hedging instruments in qualifying hedging relationships. Qualifying hedgerelationships may include cash flow hedges, fair value hedges, and hedges of net investments in foreign operations. The purpose of hedge accountingis to represent the effect of Vermilion's risk management activities that use financial instruments to manage exposures arising from specific risks thataffect net earnings.
In order to apply hedge accounting, the eligible hedging instrument must be highly effective in offsetting the exposure to changes in the eligible hedgeditem. This effectiveness is assessed at inception and at the end of each reporting period thereafter. At the inception of the hedge, formal designationand documentation is required of the hedging relationship and Vermilion's risk management objective and strategy for undertaking the hedge.
For cash flow hedges and net investment hedges, gains and losses on the hedging instrument are recognized in the consolidated statement of earningsin the same period in which the transaction associated with the hedged item occurs. Where the hedging instrument is a derivative instrument, a derivativeasset or liability is recognized on the balance sheet at fair value (included in "Derivative instruments") with the effective portion of the gain or lossrecorded to other comprehensive income. Any gain or loss associated with the ineffective portion of a hedging relationship, which is expected to beimmaterial, is immediately recognized in the consolidated statement of net earnings as other income or expense.
If a hedging relationship no longer qualifies for hedge accounting, any gain or loss resulting from the discontinuation of hedge accounting is deferredin other comprehensive income until the forecasted transaction date. If the forecasted transaction is no longer expected to occur, any gain or lossresulting from the discontinuation of hedge accounting is immediately recognized in the consolidated statement of net earnings.
3. Changes in accounting pronouncements
Definition of a Business - Amendments to IFRS 3 "Business Combinations"Vermilion elected to early adopt the amendments to IFRS 3 "Business Combinations" effective January 1, 2019, which will be applied prospectively toacquisitions that occur on or after January 1, 2019. The amendments introduce an optional concentration test, narrow the definitions of a business andoutputs, and clarify that an acquired set of activities and assets must include an input and a substantive process that together significantly contributeto the ability to create outputs. These amendments did not result in changes to Vermilion's accounting policies for applying the acquisition method.
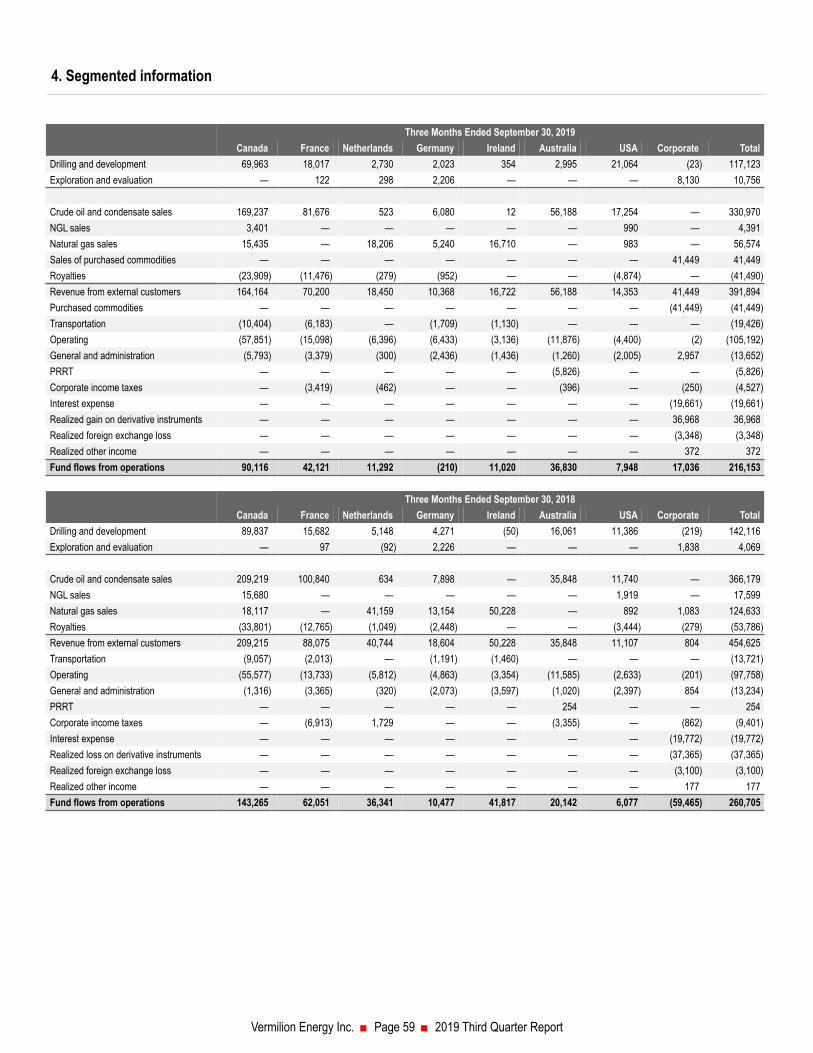
4. Segmented information
Vermilion Energy Inc. ■ Page 59 ■ 2019 Third Quarter Report
Three Months Ended September 30, 2019Canada France Netherlands Germany Ireland Australia USA Corporate Total
Drilling and development 69,963 18,017 2,730 2,023 354 2,995 21,064 (23) 117,123Exploration and evaluation — 122 298 2,206 — — — 8,130 10,756
Crude oil and condensate sales 169,237 81,676 523 6,080 12 56,188 17,254 — 330,970NGL sales 3,401 — — — — — 990 — 4,391Natural gas sales 15,435 — 18,206 5,240 16,710 — 983 — 56,574Sales of purchased commodities — — — — — — — 41,449 41,449Royalties (23,909) (11,476) (279) (952) — — (4,874) — (41,490)Revenue from external customers 164,164 70,200 18,450 10,368 16,722 56,188 14,353 41,449 391,894Purchased commodities — — — — — — — (41,449) (41,449)Transportation (10,404) (6,183) — (1,709) (1,130) — — — (19,426)Operating (57,851) (15,098) (6,396) (6,433) (3,136) (11,876) (4,400) (2) (105,192)General and administration (5,793) (3,379) (300) (2,436) (1,436) (1,260) (2,005) 2,957 (13,652)PRRT — — — — — (5,826) — — (5,826)Corporate income taxes — (3,419) (462) — — (396) — (250) (4,527)Interest expense — — — — — — — (19,661) (19,661)Realized gain on derivative instruments — — — — — — — 36,968 36,968Realized foreign exchange loss — — — — — — — (3,348) (3,348)Realized other income — — — — — — — 372 372Fund flows from operations 90,116 42,121 11,292 (210) 11,020 36,830 7,948 17,036 216,153
Three Months Ended September 30, 2018Canada France Netherlands Germany Ireland Australia USA Corporate Total
Drilling and development 89,837 15,682 5,148 4,271 (50) 16,061 11,386 (219) 142,116Exploration and evaluation — 97 (92) 2,226 — — — 1,838 4,069
Crude oil and condensate sales 209,219 100,840 634 7,898 — 35,848 11,740 — 366,179NGL sales 15,680 — — — — — 1,919 — 17,599Natural gas sales 18,117 — 41,159 13,154 50,228 — 892 1,083 124,633Royalties (33,801) (12,765) (1,049) (2,448) — — (3,444) (279) (53,786)Revenue from external customers 209,215 88,075 40,744 18,604 50,228 35,848 11,107 804 454,625Transportation (9,057) (2,013) — (1,191) (1,460) — — — (13,721)Operating (55,577) (13,733) (5,812) (4,863) (3,354) (11,585) (2,633) (201) (97,758)General and administration (1,316) (3,365) (320) (2,073) (3,597) (1,020) (2,397) 854 (13,234)PRRT — — — — — 254 — — 254Corporate income taxes — (6,913) 1,729 — — (3,355) — (862) (9,401)Interest expense — — — — — — — (19,772) (19,772)Realized loss on derivative instruments — — — — — — — (37,365) (37,365)Realized foreign exchange loss — — — — — — — (3,100) (3,100)Realized other income — — — — — — — 177 177Fund flows from operations 143,265 62,051 36,341 10,477 41,817 20,142 6,077 (59,465) 260,705

Nine Months Ended September 30, 2019Canada France Netherlands Germany Ireland Australia USA Corporate Total
Total assets 3,096,572 847,956 226,687 268,862 554,724 220,312 428,774 315,249 5,959,136Drilling and development 227,101 65,772 13,295 4,451 449 24,098 54,064 333 389,563Exploration and evaluation — 124 659 12,056 — — — 20,137 32,976
Crude oil and condensate sales 532,245 248,797 1,803 21,292 16 162,618 44,068 — 1,010,839NGL sales 24,375 — — — — — 4,299 — 28,674Natural gas sales 64,553 121 85,839 24,489 82,434 — 4,112 — 261,548Sales of purchased commodities — — — — — — — 146,323 146,323Royalties (69,951) (33,630) (1,339) (4,677) — — (13,390) — (122,987)Revenue from external customers 551,222 215,288 86,303 41,104 82,450 162,618 39,089 146,323 1,324,397Purchased commodities — — — — — — — (146,323) (146,323)Transportation (30,877) (18,394) — (4,154) (3,451) — — — (56,876)Operating (181,859) (45,139) (22,367) (17,565) (9,577) (41,372) (11,374) (242) (329,495)General and administration (15,917) (10,585) (1,896) (6,495) (2,007) (3,463) (5,467) 3,423 (42,407)PRRT — — — — — (24,494) — — (24,494)Corporate income taxes — (16,465) (7,237) — — (7,912) — (504) (32,118)Interest expense — — — — — — — (62,208) (62,208)Realized gain on derivative instruments — — — — — — — 61,507 61,507Realized foreign exchange loss — — — — — — — (6,967) (6,967)Realized other income — — — — — — — 7,447 7,447Fund flows from operations 322,569 124,705 54,803 12,890 67,415 85,377 22,248 2,456 692,463
Nine Months Ended September 30, 2018Canada France Netherlands Germany Ireland Australia USA Corporate Total
Total assets 3,107,386 864,425 199,212 284,368 575,195 227,055 327,353 333,636 5,918,630Drilling and development 187,646 62,581 15,671 7,776 84 31,878 37,956 (109) 343,483Exploration and evaluation — 169 (642) 3,450 — — — 8,174 11,151
Crude oil and condensate sales 394,897 274,713 1,741 25,962 — 111,382 20,690 — 829,385NGL sales 40,544 — — — — — 2,160 — 42,704Natural gas sales 49,423 — 111,238 34,590 151,765 — 990 1,083 349,089Royalties (59,112) (34,805) (2,644) (5,436) — — (6,017) (279) (108,293)Revenue from external customers 425,752 239,908 110,335 55,116 151,765 111,382 17,823 804 1,112,885Transportation (18,783) (7,184) — (4,968) (4,014) — — — (34,949)Operating (115,435) (40,675) (19,916) (16,433) (10,869) (37,442) (3,573) (201) (244,544)General and administration (3,907) (10,378) (1,238) (5,093) (6,349) (3,527) (4,910) (3,713) (39,115)PRRT — — — — — (7,246) — — (7,246)Corporate income taxes — (14,200) (9,069) — — (6,379) — (1,159) (30,807)Interest expense — — — — — — — (51,932) (51,932)Realized loss on derivative instruments — — — — — — — (82,939) (82,939)Realized foreign exchange loss — — — — — — — (5,651) (5,651)Realized other income — — — — — — — 608 608Fund flows from operations 287,627 167,471 80,112 28,622 130,533 56,788 9,340 (144,183) 616,310
Vermilion Energy Inc. ■ Page 60 ■ 2019 Third Quarter Report

Reconciliation of fund flows from operations to net earnings:
Three Months Ended Nine Months EndedSep 30, 2019 Sep 30, 2018 Sep 30, 2019 Sep 30, 2018
Fund flows from operations 216,153 260,705 692,463 616,310Accretion (8,701) (8,041) (24,834) (23,014)Depletion and depreciation (174,077) (166,343) (535,237) (434,621)Unrealized gain (loss) on derivative instruments 17,817 (75,829) (27,065) (163,770)Equity based compensation (15,564) (13,056) (53,000) (43,767)Unrealized foreign exchange (loss) gain (50,679) (23,044) 14,377 (26,877)Unrealized other expense (347) (203) (621) (597)Deferred tax 5,169 10,712 (34,761) 24,613Net (loss) earnings (10,229) (15,099) 31,322 (51,723)
Vermilion Energy Inc. ■ Page 61 ■ 2019 Third Quarter Report
5. Capital assets
The following table reconciles the change in Vermilion's capital assets:
2019Balance at January 1 5,316,873Acquisitions 29,307Additions 389,563Increase in right-of-use assets 12,201Transfers from exploration and evaluation assets 1,039Depletion and depreciation (518,354)Changes in asset retirement obligations 10,743Foreign exchange (164,500)Balance at September 30 5,076,872
Q3 2019 impairment assessment
On a quarterly basis, Vermilion performs an assessment as to whether any cash generating units (“CGUs”) have indicators of impairment. Whenindicators of impairment are identified, Vermilion assesses the recoverable amount of the applicable CGU based on the higher of the estimated fairvalue less costs to sell and value in use as at the reporting date. The estimated recoverable amount takes into account commodity price forecasts,expected production, estimated costs and timing of development, and undeveloped land values.
Due to a decrease in the European natural gas price forecast issued by GLJ and the resulting reduction in forecast revenues in our Ireland segment,Vermilion estimated the recoverable amount of our Ireland CGU. The recoverable amount, based on fair value less costs of disposal, was estimatedusing a 9% after-tax discount rate derived from proved plus probable reserve estimates.
The following commodity price estimates, as issued by GLJ Petroleum Consultants effective October 1, 2019, were applied:
2020 2021 2022 2023 2024 2025 2026 2027 2028 2029NBP (€/mmbtu) 5.80 5.95 6.09 6.30 6.52 6.74 6.74 6.74 6.74 6.87
Based on the above assumptions, the estimated recoverable amount exceeded the carrying value of our Ireland CGU. As such, no impairment wasrecorded in the three and nine months ended September 30, 2019.
Changes in any of the key judgments, such as a revision in reserves, changes in forecast commodity prices, foreign exchange rates, capital or operatingcosts would impact the estimated recoverable amount. As at September 30, 2019, a 1% increase in the assumed after-tax discount rate would reducethe estimated recoverable amount by $17.4 million (resulting in a $0.1 million impairment) while a 5% decrease in revenues (due to a decrease incommodity price forecasts or reserve estimates) would reduce the estimated recoverable amount by $19.2 million (resulting in a $1.9 million impairment).

6. Exploration and evaluation assets
The following table reconciles the change in Vermilion's exploration and evaluation assets:
2019Balance at January 1 303,295Additions 32,976Changes in asset retirement obligations 53Transfers to capital assets (1,039)Depreciation (13,967)Foreign exchange (8,372)Balance at September 30 312,946
Vermilion Energy Inc. ■ Page 62 ■ 2019 Third Quarter Report
7. Asset retirement obligations
The following table reconciles the change in Vermilion’s asset retirement obligations:
2019Balance at January 1 650,164Additional obligations recognized 577Changes in estimated abandonment timing and costs (137)Obligations settled (12,090)Accretion 24,834Changes in discount rates 10,356Foreign exchange (40,191)Balance at September 30 633,513
8. Long-term debt
The following table summarizes Vermilion’s outstanding long-term debt:
As atSep 30, 2019 Dec 31, 2018
Revolving credit facility 1,561,669 1,392,206Senior unsecured notes 392,802 404,001Long-term debt 1,954,471 1,796,207
The fair value of the revolving credit facility is equal to its carrying value due to the use of short-term borrowing instruments at market rates of interest.The fair value of the senior unsecured notes as at September 30, 2019 was $382.7 million.
The following table reconciles the change in Vermilion’s long-term debt:
2019Balance at January 1 1,796,207Borrowings on the revolving credit facility 196,944Amortization of transaction costs and prepaid interest 150Foreign exchange (38,830)Balance at September 30 1,954,471
Revolving credit facilityAt September 30, 2019, Vermilion had in place a bank revolving credit facility maturing May 31, 2023 with the following terms:
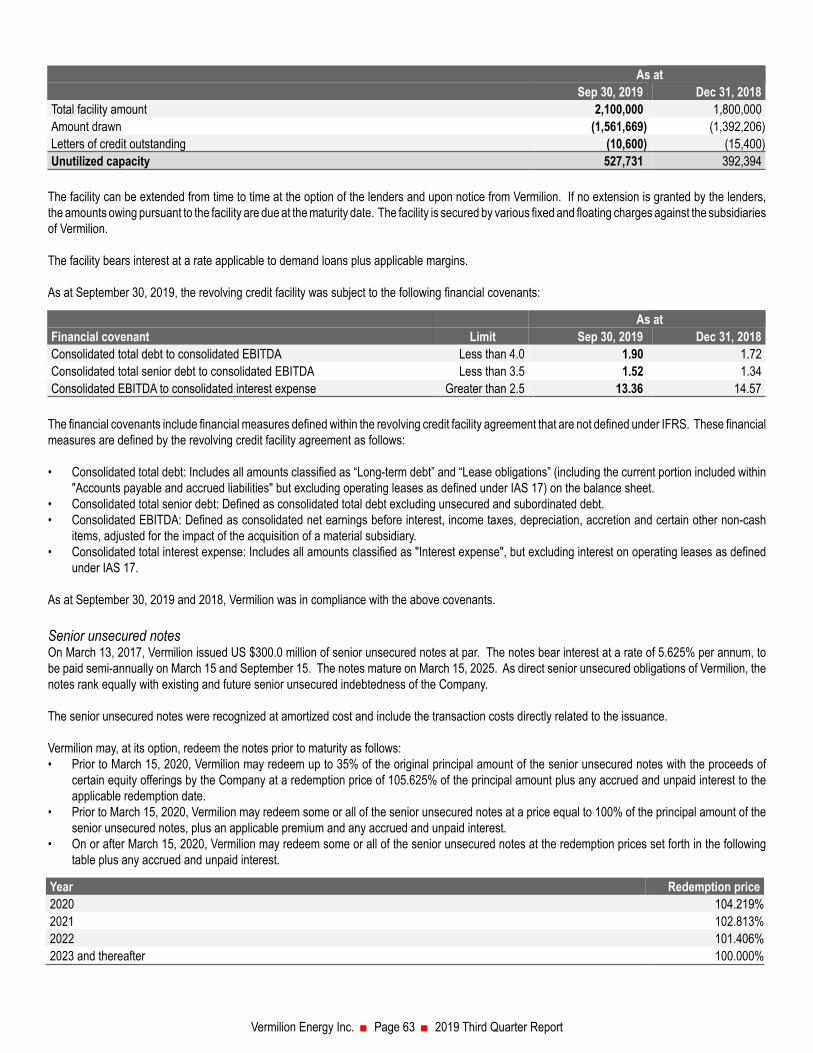
As atSep 30, 2019 Dec 31, 2018
Total facility amount 2,100,000 1,800,000Amount drawn (1,561,669) (1,392,206)Letters of credit outstanding (10,600) (15,400)Unutilized capacity 527,731 392,394
The facility can be extended from time to time at the option of the lenders and upon notice from Vermilion. If no extension is granted by the lenders,the amounts owing pursuant to the facility are due at the maturity date. The facility is secured by various fixed and floating charges against the subsidiariesof Vermilion.
The facility bears interest at a rate applicable to demand loans plus applicable margins.
As at September 30, 2019, the revolving credit facility was subject to the following financial covenants:
As atFinancial covenant Limit Sep 30, 2019 Dec 31, 2018Consolidated total debt to consolidated EBITDA Less than 4.0 1.90 1.72Consolidated total senior debt to consolidated EBITDA Less than 3.5 1.52 1.34Consolidated EBITDA to consolidated interest expense Greater than 2.5 13.36 14.57
The financial covenants include financial measures defined within the revolving credit facility agreement that are not defined under IFRS. These financialmeasures are defined by the revolving credit facility agreement as follows:
• Consolidated total debt: Includes all amounts classified as “Long-term debt” and “Lease obligations” (including the current portion included within"Accounts payable and accrued liabilities" but excluding operating leases as defined under IAS 17) on the balance sheet.
• Consolidated total senior debt: Defined as consolidated total debt excluding unsecured and subordinated debt.• Consolidated EBITDA: Defined as consolidated net earnings before interest, income taxes, depreciation, accretion and certain other non-cash
items, adjusted for the impact of the acquisition of a material subsidiary.• Consolidated total interest expense: Includes all amounts classified as "Interest expense", but excluding interest on operating leases as defined
under IAS 17.
As at September 30, 2019 and 2018, Vermilion was in compliance with the above covenants.
Senior unsecured notesOn March 13, 2017, Vermilion issued US $300.0 million of senior unsecured notes at par. The notes bear interest at a rate of 5.625% per annum, tobe paid semi-annually on March 15 and September 15. The notes mature on March 15, 2025. As direct senior unsecured obligations of Vermilion, thenotes rank equally with existing and future senior unsecured indebtedness of the Company.
The senior unsecured notes were recognized at amortized cost and include the transaction costs directly related to the issuance.
Vermilion may, at its option, redeem the notes prior to maturity as follows:• Prior to March 15, 2020, Vermilion may redeem up to 35% of the original principal amount of the senior unsecured notes with the proceeds of
certain equity offerings by the Company at a redemption price of 105.625% of the principal amount plus any accrued and unpaid interest to theapplicable redemption date.
• Prior to March 15, 2020, Vermilion may redeem some or all of the senior unsecured notes at a price equal to 100% of the principal amount of thesenior unsecured notes, plus an applicable premium and any accrued and unpaid interest.
• On or after March 15, 2020, Vermilion may redeem some or all of the senior unsecured notes at the redemption prices set forth in the followingtable plus any accrued and unpaid interest.
Year Redemption price2020 104.219%2021 102.813%2022 101.406%2023 and thereafter 100.000%
Vermilion Energy Inc. ■ Page 63 ■ 2019 Third Quarter Report

Cross currency interest rate swapsOn June 12, 2019, Vermilion entered into a series of cross currency interest rate swaps with a syndicate of banks. Vermilion applied hedge accountingto these derivative instruments. The cross currency interest rate swaps mature March 15, 2025 and include regular cash receipts and payments onMarch 15 and September 15 of each year. On a net basis, the cross currency interest swaps result in Vermilion receiving US dollar interest and principalamounts equal to the interest and principal payments under the US $300.0 million of senior unsecured notes. In exchange, Vermilion will make interestand principal payments equal to €265.0 million at a rate of 3.275%.
The cross currency interest rate swaps were executed as two separate sets of instruments:• US dollar to Canadian dollar ("USD-to-CAD") cross currency interest rate swaps: Vermilion receives US dollar interest and principal amounts equal
to US$300.0 million of debt at 5.625% interest and pays Canadian dollar interest and principal amounts equal to $398.5 million of debt at 5.40%interest.
• Canadian dollar to Euro ("CAD-to-EUR") cross currency interest rate swaps: Vermilion receives Canadian dollar interest and principal amountsequal to $398.5 million of debt at 5.40% interest and pays Euro interest and principal amounts equal to €265.0 million at a rate of 3.275%.
The USD-to-CAD cross currency interest swaps have been designated as the hedging instrument in a cash flow hedge to mitigate the risk of thefluctuation of interest and principal cash flows due to changes in foreign currency rates related to the Senior Unsecured Notes described above. Theforward element of the swap contract is treated as the excluded component and is initially recognized within other comprehensive income. The excludedcomponent is amortized to net earnings in interest expense on a systematic basis. As the timing and amount of the cash flows received on the USD-to-CAD cross currency interest rate swaps offset the timing and amount of the cash flows paid on the senior unsecured notes, the economic relationshipis expected to be highly effective. The change in the value of the hedged item associated with a change in spot foreign exchange rates is initiallyrecognized in other comprehensive income. This change is reclassified from other comprehensive income to net earnings (and recorded as an foreignexchange gain or loss) to offset the associated foreign exchange gain or loss recognized on the senior unsecured notes.
The CAD-to-EUR cross currency interest rate swaps have been designated as the hedging instrument in a net investment hedge to mitigate the effectivechange in exchange rates on our net investments in Euro denominated foreign subsidiaries. The change in the value of the hedged item associatedwith a change in spot foreign exchange rates is initially recognized in other comprehensive income. This change is reclassified from other comprehensiveincome to net earnings (and recorded as a foreign exchange gain or loss) only if the net investment is disposed of by sale. The forward element of theswap contract is treated as the excluded component and is initially recognized within other comprehensive income. The excluded component is amortizedto net earnings in interest expense on a systematic basis.
Vermilion Energy Inc. ■ Page 64 ■ 2019 Third Quarter Report
9. Shareholders' capital
The following table reconciles the change in Vermilion’s shareholders’ capital:
2019Shareholders’ Capital Shares ('000s) AmountBalance at January 1 152,704 4,008,828Shares issued for the Dividend Reinvestment Plan 898 24,737Vesting of equity based awards 1,223 45,636Shares issued for equity based compensation 437 13,553Share-settled dividends on vested equity based awards 243 7,987Balance at September 30 155,505 4,100,741
Dividends declared to shareholders for the nine months ended September 30, 2019 were $319.6 million (2018 - $282.8 million).
Subsequent to the end of the period and prior to the condensed consolidated interim financial statements being authorized for issue, Vermilion declareddividends of $35.8 million or $0.23 per share.

10. Capital disclosures
Vermilion defines capital as net debt (long-term debt plus net working capital) and shareholders’ capital. In managing capital, Vermilion reviews whetherfund flows from operations is sufficient to fund capital expenditures, dividends, and asset retirement obligations.
The following table calculates Vermilion’s ratio of net debt to trailing twelve month fund flows from operations:
Sep 30, 2019 Sep 30, 2018Long-term debt 1,954,471 1,728,889Current liabilities 398,233 629,893Current assets (350,834) (324,696)Net debt 2,001,870 2,034,086
Ratio of net debt to trailing twelve months fund flows from operations 2.19 2.55
Vermilion Energy Inc. ■ Page 65 ■ 2019 Third Quarter Report
11. Financial instruments
The following table summarizes the increase (positive values) or decrease (negative values) to net earnings before tax due to a change in the value ofVermilion’s financial instruments as a result of a change in the relevant market risk variable. This analysis does not attempt to reflect any interdependenciesbetween the relevant risk variables.
Sep 30, 2019Currency risk - Euro to Canadian dollar$0.01 increase in strength of the Canadian dollar against the Euro (2,008)$0.01 decrease in strength of the Canadian dollar against the Euro 2,008
Currency risk - US dollar to Canadian dollar$0.01 increase in strength of the Canadian dollar against the US $ 104$0.01 decrease in strength of the Canadian dollar against the US $ (104)
Commodity price risk - Crude oilUS $5.00/bbl increase in crude oil price used to determine the fair value of derivatives (26,206)US $5.00/bbl decrease in crude oil price used to determine the fair value of derivatives 36,814
Commodity price risk - European natural gas€0.5/GJ increase in European natural gas price used to determine the fair value of derivatives (27,826)€0.5/GJ decrease in European natural gas price used to determine the fair value of derivatives 32,167

DIRECTORS
Lorenzo Donadeo 1Calgary, Alberta
Larry J. Macdonald 2, 4, 6, 8
Chairman & CEO, Point Energy Ltd. Calgary, Alberta
Carin Knickel 6, 8, 12
Golden, Colorado
Stephen P. Larke 4, 6, 12
Calgary, Alberta
Loren M. Leiker 10
McKinney, Texas
Timothy R. Marchant 7, 10, 11
Calgary, Alberta
Anthony MarinoCalgary, Alberta
Robert Michaleski 4, 5
Calgary, Alberta
William Roby 8, 9, 12
Katy, Texas
Catherine L. Williams 3, 6
Calgary, Alberta
1 Chairman of the Board2 Lead Director3 Audit Committee Chair (Independent) 4 Audit Committee Member5 Governance and Human Resources Committee Chair__(Independent) 6 Governance and Human Resources Committee Member7 Health, Safety and Environment Committee Chair __(Independent)8 Health, Safety and Environment Committee Member9 Independent Reserves Committee Chair (Independent) 10 Independent Reserves Committee Member11 Sustainability Committee Chair (Independent)12 Sustainability Committee Member
OFFICERS AND KEY PERSONNELCANADA
Anthony MarinoPresident & Chief Executive Officer
Lars GlemserVice President & Chief Financial Officer Mona JasinskiExecutive Vice President, People and Culture
Michael KaluzaExecutive Vice President & Chief Operating Officer
Dion HatcherVice President Canada Business Unit
Terry HergottVice President Marketing
Kyle PrestonVice President Investor Relations
Jenson Tan Vice President Business Development
Daniel GouletDirector Corporate HSE
Jeremy KalanukDirector Operations Accounting
Bryce KremnicaDirector Field Operations - Canada Business Unit
Steve ReeceDirector Information Technology & Information Systems
Tom RafterDirector Land - Canada Business Unit
Robert (Bob) J. EngbloomCorporate Secretary
UNITED STATESScott SeatterManaging Director - U.S. Business Unit
Timothy R. MorrisDirector U.S. Business Development - U.S. Business Unit
EUROPEGerard SchutVice President European Operations
Sylvain NothhelferManaging Director - France Business Unit
Sven TummersManaging Director - Netherlands Business Unit
Bill LiutkusManaging Director - Germany Business Unit
Darcy KerwinManaging Director - Ireland Business Unit
Bryan SrallaManaging Director - Central & Eastern Europe BusinessUnit
AUSTRALIABruce D. LakeManaging Director - Australia Business Unit
AUDITORS
Deloitte LLPCalgary, Alberta
BANKERS
The Toronto-Dominion Bank
Bank of Montreal
Canadian Imperial Bank of Commerce
Export Development Canada
National Bank of Canada
Royal Bank of Canada
The Bank of Nova Scotia
Wells Fargo Bank N.A., Canadian Branch
HSBC Bank Canada
Bank of America N.A., Canada Branch
Citibank N.A., Canadian Branch - Citibank Canada
JPMorgan Chase Bank, N.A., Toronto Branch
La Caisse Centrale Desjardins du Québec
Alberta Treasury Branches
Canadian Western Bank
Goldman Sachs Lending Partners LLC
Barclays Bank PLC
EVALUATION ENGINEERS
GLJ Petroleum Consultants Ltd.Calgary, Alberta
LEGAL COUNSEL
Norton Rose Fulbright Canada LLPCalgary, Alberta
TRANSFER AGENT
Computershare Trust Company of Canada
STOCK EXCHANGE LISTINGS
The Toronto Stock Exchange (“VET”)The New York Stock Exchange (“VET”)
INVESTOR RELATIONSKyle PrestonVice President Investor Relations403-476-8431 TEL403-476-8100 FAX1-866-895-8101 IR TOLL [email protected]
Vermilion Energy Inc. ■ Page 66 ■ 2019 Third Quarter Report