from water risk to value creation - indiaenvironmentportal · 2014-11-05 · from water risk to...
TRANSCRIPT

01
From water risk to value creation
Written on behalf of 573 investors with US$60 trillion in assets
CDP Global Water Report 2014
Written by [email protected]

0302
Contents
CEO Foreword 4
Executive summary 6
Introduction 8
Water scarcity: evaporating growth? 10
A rising tide of awareness and action 14
What corporate water stewardship means to business 20
Conclusion: Time to take responsibility over water 24
Sector summaries 26
Appendices 44
Important Notice
The contents of this report may be used by anyone providing acknowledgement is given to CDP. This does not represent a license to repackage or resell any of the data reported to CDP and presented in this report. If you intend to repackage or resell any of the contents of this report, you need to obtain express permission from CDP before doing so.
CDP has prepared the data and analysis in this report based on responses to the 2014 water information request. No representation or warranty (express or implied) is given by CDP or any of its contribu-tors as to the accuracy or completeness of the information and opinions contained in this report. You should not act upon the information contained in this publication without obtaining specific professional advice. To the extent permitted by law, CDP and its contributors do not accept or assume any liability, responsibility or duty of care for any consequences of you or anyone else acting, or refraining to act, in reliance on the information contained in this report or for any decision based on it. All information and views expressed herein by CDP and its contributors are based on their judgment at the time of this report and are subject to change without notice due to economic, political, industry and firm-specific factors. Guest commentaries where included in this report reflect the views of their respective authors; their inclusion is not an endorsement of them.
CDP and its contributors, their affiliated member firms or companies, or their respective shareholders, members, partners, principals, directors, officers and/or employees, may have a position in the securi-ties of the companies discussed herein. The securities of the companies mentioned in this document may not be eligible for sale in some states or countries, nor suitable for all types of investors; their value and the income they produce may fluctuate and/or be adversely affected by exchange rates.
‘CDP’ refers to CDP Worldwide, a United Kingdom company limited by guarantee, registered as a United Kingdom charity number 1122330.
© 2014 CDP Worldwide. All rights reserved.
573Investors managing US$60 trillion in assets asked the largest companies in the world what they are doing about water. 836 were asked to respond.
To read 2014 company responses in full please go to www.cdp.net/en-US/Results/Pages/responses.aspx

0504
Although the global economy has bounced back from crisis it demonstrates serious fragility. As we embrace recovery we must remember that we face steep financial risk if we do not mitigate increasing water related challenges in some regions.
The unprecedented environmental challenges confronted today – safeguarding water, reducing greenhouse gas emissions, and preventing the destruction of forests – are also economic problems that demand national and international attention. One irrefutable fact filtering through to companies and investors: the bottom line is at risk from environmental crises.
The economic impact of growing global demands for both the quantity and quality of water is becoming better understood. More than 70% of the western United States has been hit by drought. Losses to California’s agricultural sector now total about US$2.2 billion this year. China has been suffering from a nationwide shortage of both water and energy resources. The government boosted its water investment budget by 7% this year, and plans to start construction of 172 major water projects by 2020.
Over two thirds of Global 500 companies reporting to CDP this year face substantive water risks, therefore investing to conserve, manage or obtain water has become crucial for some sectors. The Coca-Cola Company along with its bottlers have spent nearly US$2 billion to reduce its water use and improve water quality. Nestlé put aside approximately US$43 million for water efficiency and wastewater treatment facilities at its plants last year and BHP Billiton has made a near US$2 billion investment in a desalination plant in Chile, to ensure adequate water is available for its desert mining operations.
Investor engagement on these issues is increasing. As mainstream investors begin to recognize the real value
at risk, we are seeing more action from some of the 573 investors who request corporate water disclosure through CDP. Norwegian pension fund and lead sponsor of CDP’s water program, Norges Bank Investment Management, with assets worth over US$800 billion, expects companies to demonstrate strategies for water and climate change management.
There is growing momentum on the policy front. In the EU, some 6,000 companies will be required to disclose on specific environmental, social and governance criteria, including water, as part of their mainstream reporting to investors. The Climate Disclosure Standards Board is working hard to provide a clear framework to support companies in this new disclosure requirement.
Leading companies increasingly recognize that business as usual approaches to water management are no longer sufficient. A shift in practice is required if companies are to realize the true benefits of water stewardship, achieve business resilience and competitive advantage. CDP’s system of measurement, transparency and accountability drives positive change on water management in the world of business and investment.
We are standing at a juncture in history. With the prospect of a global climate deal coming from the United Nations, governments, cities, the private sector and civil society have a great opportunity to take bold actions and build momentum in the run up to the Paris 2015 meeting. The decisions we make today can lead us to a profitable and secure future. A future that we can all be proud of.
Paul Simpson CEO CDP
One irrefutable fact is filtering through to companies and investors: the bottom line is at risk from environmental crises.
Paul Simpson CEO, CDP
CEO foreword
318increase in investor signatories since 2010
%
US$60 TRILLIONassets under management
0706
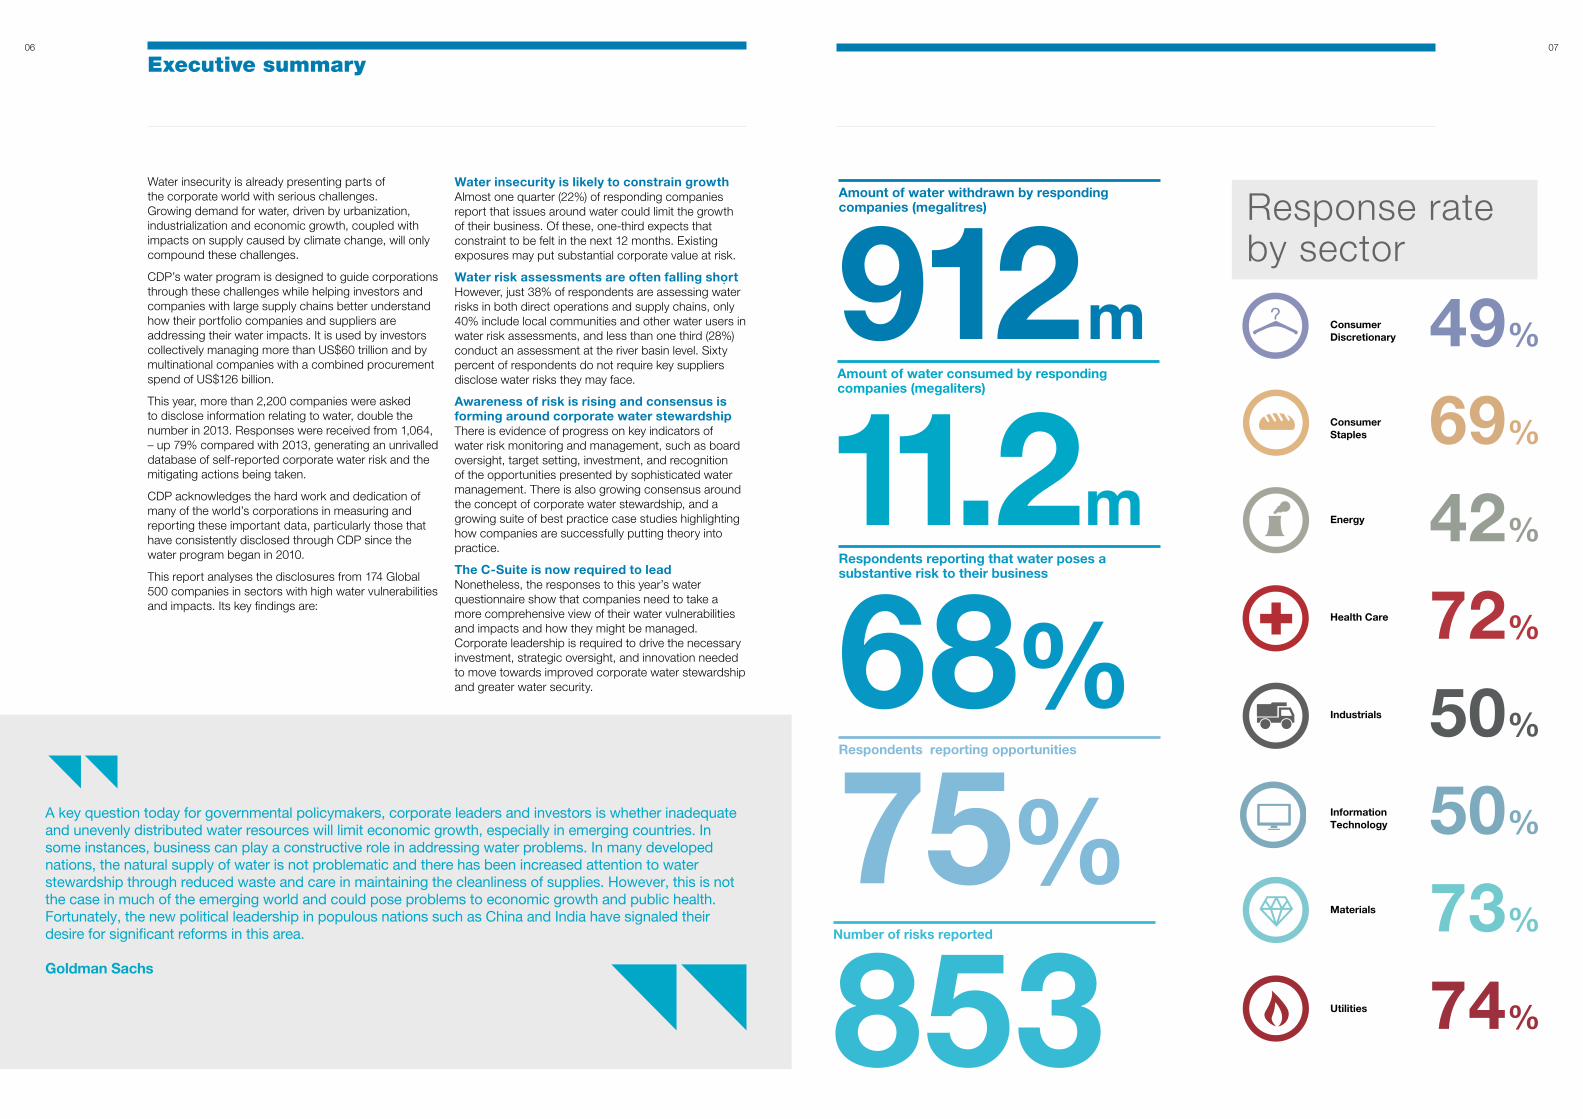
Amount of water consumed by responding companies (megaliters)
11.2m
Amount of water withdrawn by responding companies (megalitres)
912m
Respondents reporting that water poses a substantive risk to their business
68%Respondents reporting opportunities
75%Number of risks reported
853
Executive summary
Water insecurity is already presenting parts of the corporate world with serious challenges. Growing demand for water, driven by urbanization, industrialization and economic growth, coupled with impacts on supply caused by climate change, will only compound these challenges.
CDP’s water program is designed to guide corporations through these challenges while helping investors and companies with large supply chains better understand how their portfolio companies and suppliers are addressing their water impacts. It is used by investors collectively managing more than US$60 trillion and by multinational companies with a combined procurement spend of US$126 billion.
This year, more than 2,200 companies were asked to disclose information relating to water, double the number in 2013. Responses were received from 1,064, – up 79% compared with 2013, generating an unrivalled database of self-reported corporate water risk and the mitigating actions being taken.
CDP acknowledges the hard work and dedication of many of the world’s corporations in measuring and reporting these important data, particularly those that have consistently disclosed through CDP since the water program began in 2010.
This report analyses the disclosures from 174 Global 500 companies in sectors with high water vulnerabilities and impacts. Its key findings are:
Water insecurity is likely to constrain growth Almost one quarter (22%) of responding companies report that issues around water could limit the growth of their business. Of these, one-third expects that constraint to be felt in the next 12 months. Existing exposures may put substantial corporate value at risk.
Water risk assessments are often falling short However, just 38% of respondents are assessing water risks in both direct operations and supply chains, only 40% include local communities and other water users in water risk assessments, and less than one third (28%) conduct an assessment at the river basin level. Sixty percent of respondents do not require key suppliers disclose water risks they may face.
Awareness of risk is rising and consensus is forming around corporate water stewardship There is evidence of progress on key indicators of water risk monitoring and management, such as board oversight, target setting, investment, and recognition of the opportunities presented by sophisticated water management. There is also growing consensus around the concept of corporate water stewardship, and a growing suite of best practice case studies highlighting how companies are successfully putting theory into practice.
The C-Suite is now required to lead Nonetheless, the responses to this year’s water questionnaire show that companies need to take a more comprehensive view of their water vulnerabilities and impacts and how they might be managed. Corporate leadership is required to drive the necessary investment, strategic oversight, and innovation needed to move towards improved corporate water stewardship and greater water security.
Health care
PharmaceuticalsIndustrials
Materials Utilities
Energy Consumer staples
Consumer discretionary
Consumer Discretionary 49%
Health care
PharmaceuticalsIndustrials
Materials Utilities
Energy Consumer staples
Consumer discretionary
Consumer Staples 69%
Health care
PharmaceuticalsIndustrials
Materials Utilities
Energy Consumer staples
Consumer discretionary
Energy 42%
IT
Information Technology 50%
Health care
PharmaceuticalsIndustrials
Materials Utilities
Energy Consumer staples
Consumer discretionary
Health Care 72%
Health care
PharmaceuticalsIndustrials
Materials Utilities
Energy Consumer staples
Consumer discretionary
Materials 73%
Health care
PharmaceuticalsIndustrials
Materials Utilities
Energy Consumer staples
Consumer discretionary
Industrials 50%
Health care
PharmaceuticalsIndustrials
Materials Utilities
Energy Consumer staples
Consumer discretionary
Utilities 74%
Response rate by sector
A key question today for governmental policymakers, corporate leaders and investors is whether inadequate and unevenly distributed water resources will limit economic growth, especially in emerging countries. In some instances, business can play a constructive role in addressing water problems. In many developed nations, the natural supply of water is not problematic and there has been increased attention to water stewardship through reduced waste and care in maintaining the cleanliness of supplies. However, this is not the case in much of the emerging world and could pose problems to economic growth and public health. Fortunately, the new political leadership in populous nations such as China and India have signaled their desire for significant reforms in this area.
Goldman Sachs

0908
We praise companies that publicly disclose information via CDP. Water scarcity is a priority issue for ICCR, and companies that respond to CDP’s water questionnaire signal to our investor coalition, which represents over US$100 billion in assets under management, that they are strategically measuring and addressing water related risks. CDP’s water questionnaire provides investors with access to material data, consistently reported, on assessment and actions that lead to more responsible use of freshwater resources.
ICCR (Interfaith Center on Corporate Responsibility)
The availability of water poses a strategic risk to a large and growing number of companies. Competition for scarce water resources is leading to business disruption, brand damage and the loss of the license to operate. A lack of water, or insufficient water of the right quality, can cut or even halt production. An inability to access water can constrain corporate growth.
This is of growing concern to institutional investors as evidenced by investors’ support for CDP’s water program. This year, 573 investors used the program – up 8% since last year and up 318% since 2010. These investors collectively represent US$60 trillion in assets.
Coupled with multinational companies such as BMW, L’Oreal, Johnson & Johnson, and Unilever, which collectively command an annual procurement spend of US$216 billion1, investors are pressing a growing number of companies on this issue. The chairs of more than 2,200 companies received CDP’s water questionnaire in 2014, more than double the number approached last year.
This report presents the analysis of responses from companies in the Global 500 index (which comprises the largest 500 companies in the FTSE Global Equity Index Series), which are in sectors2 determined to have high vulnerability to the challenges posed by water insecurity. Of these 302 companies, 174 responded to their investor requests in 2014.
CDP investor signatories are essentially seeking the answer to one question: what shareholder value is put at risk by poor management of water exposures?
They are concerned about potential impacts to the bottom line, and about the threats that poorly understood and managed water impacts pose to the future performance of their investments.
They use CDP not only to gather this information but to also provide a framework that supports their portfolio companies in their endeavors to become better water stewards.
While some of the water performance metrics tracked by CDP have improved, disclosure rates remained static between 2013 and 2014. It should be a concern that 42% of Global 500 companies requested to disclose information related to water issues failed to do so. For example, 58% of the Energy sector and more than half the Consumer Discretionary (51%) and Industrials (50%) sectors did not respond.
CDP data shows that water may pose a risk to corporate growth. CDP analysis suggests that the risk may still be poorly understood and therefore under-reported. If companies are to address the potential threat that water exposures pose to their current profitability and future growth this needs to change.
Introduction
1 Calculated by the reported average procurement spend by CDP Supply Chain members in 2013.2 CDP’s water program focuses on the following Global Industry Classification Standard (GICS) sectors: Consumer Discretionary, Consumer Staples, Energy, Health Care, Industrials, Information Technology, Materials, and Utilities.
Defining water stress
The CEO Water Mandate defines water stress as having three core components:
water availability;
water quality; and
water accessibility.
Water stress refers to the ability (or lack thereof) to meet both the human and ecological demand for water. Compared to water scarcity, water stress is a broader concept as it considers several physical aspects related to water resources, including scarcity, but also water quality, environmental flows and the accessibility of water.
Meaningful action to mitigate water stress, and therefore corporate water risk, requires consideration and a response to each. ‘First-mover’ companies have rapidly acknowledged that a comprehensive approach to tackling water stress and associated corporate risks can be a complex undertaking. However by understanding the complexities of water stress, companies are learning that an effective response requires more than simply reducing the quantity of water used.
As part of its Corporate Water Disclosure Guidelines; the CEO Water Mandate in collaboration with CDP, The Nature Conservancy, WRI and others put forth conceptual definitions for water-related terms used in different contexts or interchangeably. These terms are namely “water scarcity”, “water stress”, and “water risk”. This work can be explored in more detail at www.ceowatermandate.org/disclosure

1110
Materials73%
27%
Utilities71%
43%
Information Technology61%
28%
Water scarcity: evaporating growth?
The findings from CDP’s analysis are clear; 68% of Global 500 respondents report exposure to water related risk that could generate a substantive change in their business, operations or revenue. Company disclosures further show that the lack of adequate water may pose a clear risk to growth. 22% of responding companies anticipate that issues around water could limit the growth of their business. Of these, one-third expect that constraint to be felt in the next 12 months.
The pressures are well understood. Companies report the primary drivers of reported risks to be physical (60%), such as water stress or scarcity or declining water quality. Organizations also grapple with higher water prices, rising discharge costs, regulatory limits on withdrawals or discharges and community opposition. Overlaid on these is climate change, which is set to make precipitation and water availability less predictable, and demographic and economic growth, which will see demand for limited water resources increase.
In total, respondents identified 667 substantive risks to direct operations, and 186 risks to their supply chains. 43% of these risks are anticipated to impact either now or in the next three years.
The consequences for companies and their investors may be serious. Our analysis indicates that substantive corporate value may be at risk due to worsening water insecurity. Production could slow or halt. Disputes over water could lead to reputational damage. Assets in water-stressed regions could become stranded if assumptions made about water availability and access prove inaccurate, regulatory responses are unanticipated, or if risk mitigation plans are not put in place.
The effect on shareholder value can be dramatic. In April 2013, Barrick Gold announced it was suspending construction on its Pascua-Lama mine over concerns about local groundwater pollution. In October, it announced it was shelving the project – after investing US$5 billion – as it worked through a dialogue process with local communities. Rio Tinto has walked away from the Pebble Mine copper and gold project in Alaska, in the face of growing concerns about its effect on salmon fisheries. BHP Billiton needed to make an almost US$2 billion investment in a desalination plant in Escondida, Chile, to ensure adequate water is available for its mining operations in the Atacama desert.
Our analysis indicates that respondents in high risk, high-impact sectors are mindful of the risks posed by growing challenges around water security. Almost three-quarters (74%) have evaluated how water quality and quantity affects their growth strategy. But too few are taking a sufficiently long-term view of the issue. Only 35% are considering how water issues could impact their growth strategy 10 years or more into the future. And this is despite studies from the likes of management consultants McKinsey that suggest that, without action, global water demand could outstrip supply by up to 40% by 2030.
In onshore operations, high demand for water resources inflates prices and legislative changes restrict access to these resources. Changes in prices and restrictions on accessing water resources impacts the cost of land based drilling activities. Apache has invested in technology to increase recycling and reuse of water in drilling operations and to utilize other water sources that are not in high demand, reducing exposure to potential future full legislative changes.
ApacheFigure 1: Sectors most exposed to substantive
water risks
Figure 1a: Sectors most impacted by water in reporting period
Figure 2: Number of risks reported by country
Figure 3: Expected timeframe for risks to materialize (% of risks reported)
Figure 4: Respondents evaluating how water could impact business growth strategy (% of respondents)
43%
24%
15%
15%
Current - 3 years
more than 6 years
4-6 years
Unknown
Consumer Discretionary91%
36%
Consumer Staples87%
55%
Energy73%
27%
Health Care69%
35%
Industrials53%
21%
Utilities
Materials
Energy
Consumer Staples
Consumer Staples
Energy
86%
77%
82%
61%
81%
41%
191United States
of America
51Mexico
48India
40
Australia
38
Spain
35
China
23
Brazil
22
Chile
21
United Kingdom
29
South Africa
% evaluated over one year or more
% evaluated over next 10 years
1312
Water scarcity: evaporating growth?
These pressures are likely to be felt most keenly in the high-growth emerging markets that offer the greatest corporate opportunity, countries such as Brazil, China, India and Mexico. According to the World Bank, almost 40% of the groundwater use in Mexico is estimated to be above the recharge rate. And the aquifers upon which Mexico City depends for nearly three-quarters of its water supplies, are being exploited 80 times faster than they are replenished.
Given the increasing water challenges facing many parts of the world, and the long-term nature of many corporate investments, such short-term focus is at best imprudent. Despite increasing awareness of the challenges posed by water insecurity, the data suggests that respondents may be underestimating, and under-reporting, water risk.
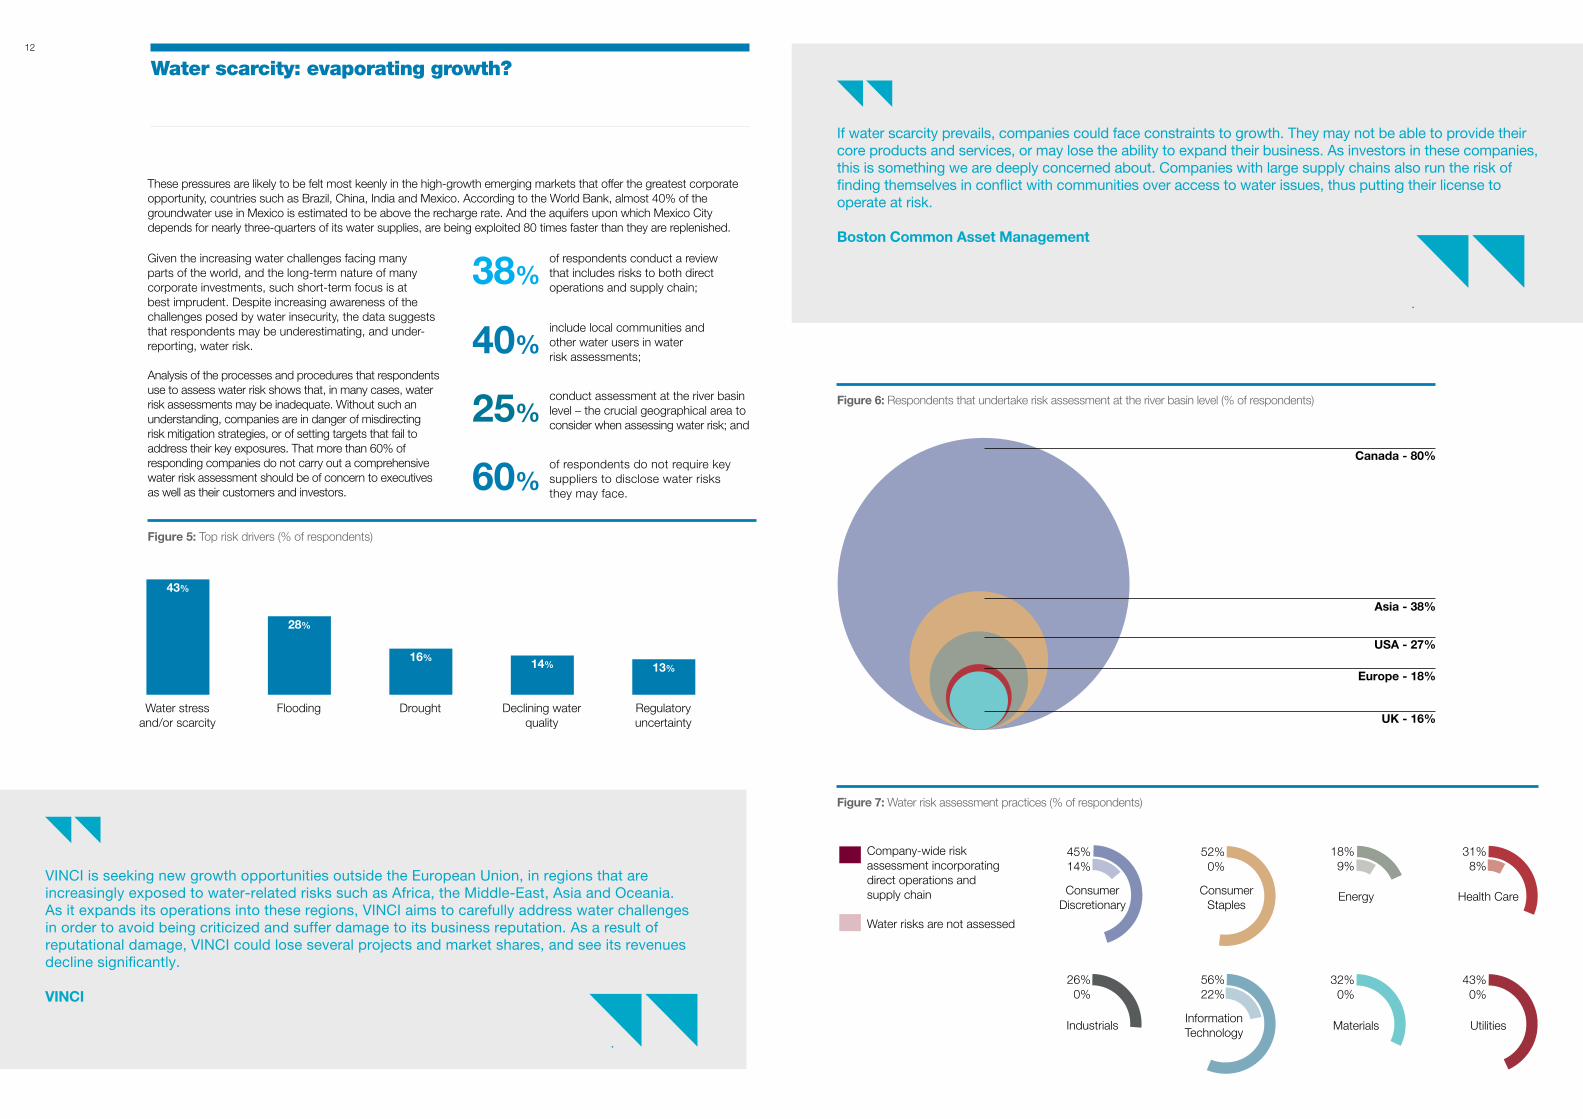
Analysis of the processes and procedures that respondents use to assess water risk shows that, in many cases, water risk assessments may be inadequate. Without such an understanding, companies are in danger of misdirecting risk mitigation strategies, or of setting targets that fail to address their key exposures. That more than 60% of responding companies do not carry out a comprehensive water risk assessment should be of concern to executives as well as their customers and investors.
38%of respondents conduct a review that includes risks to both direct operations and supply chain;
40%include local communities and other water users in water risk assessments;
25%conduct assessment at the river basin level – the crucial geographical area to consider when assessing water risk; and
60%of respondents do not require key suppliers to disclose water risks they may face.
If water scarcity prevails, companies could face constraints to growth. They may not be able to provide their core products and services, or may lose the ability to expand their business. As investors in these companies, this is something we are deeply concerned about. Companies with large supply chains also run the risk of finding themselves in conflict with communities over access to water issues, thus putting their license to operate at risk.
Boston Common Asset Management
Figure 7: Water risk assessment practices (% of respondents)
Figure 5: Top risk drivers (% of respondents)
43%
Water stress and/or scarcity
13%
Regulatory uncertainty
28%
Flooding
16%
Drought
14%
Declining water quality
Figure 6: Respondents that undertake risk assessment at the river basin level (% of respondents)
UK - 16%
Europe - 18%
USA - 27%
Asia - 38%
Canada - 80%
Consumer Discretionary
45%14%
Industrials
26%0%
Consumer Staples
52%0%
Information Technology
56%22%
Energy
18%9%
Materials
32%0%
Health Care
31%8%
Utilities
43%0%
Company-wide risk assessment incorporating direct operations and supply chain
Water risks are not assessed
VINCI is seeking new growth opportunities outside the European Union, in regions that are increasingly exposed to water-related risks such as Africa, the Middle-East, Asia and Oceania. As it expands its operations into these regions, VINCI aims to carefully address water challenges in order to avoid being criticized and suffer damage to its business reputation. As a result of reputational damage, VINCI could lose several projects and market shares, and see its revenues decline significantly.
VINCI

1514
A rising tide of awareness and action
Despite the lack of depth of many companies’ water risk assessment, the good news is that respondents are increasingly acknowledging the importance of water security as a corporate issue. The responses to CDP’s water questionnaire this year show clear progress on some of the most important indicators of effective water risk monitoring and management. Corporate performance is slowly improving in the aggregate, and a wealth of experience is being accrued that will prove invaluable to those companies taking their first steps towards comprehensive water risk management and improved water stewardship.
Examples of improved management include:
82% of respondents report setting goals and targets this year. These goals are typically measured against units of production – such as drinks giant SABMiller’s target of reducing water in their breweries by 25% by 2015 compared with 2008, or electronics firm Canon’s goal of reducing water use by 1% per unit of production each year.
Other firms have gone a step further, and have committed to absolute targets. Personal care company Kimberly-Clarke announced a goal to reduce water use 25% below 2010 levels by 2015. Pharma giant AstraZeneca has set a target to reduce absolute water use by 25% by 2015 against a 2010 baseline. Aerospace firm Lockheed Martin aims to reduce absolute water use by 25% by 2020 against a 2010 baseline.
This year, ultimate responsibility for water issues lies at board level in 62% of respondents, up from 58% in 2013. 62%
7%
One in three respondents now incorporate key performance indicators into their water management processes.
42% of respondents have publicly demonstrated a commitment to water.
More than half of respondents consider the impact of increasing regulation around water in their risk assessment processes.
1in3
incr
ease
from
201
3
42%Higher levels of board oversight
%

1716
29%
Consumer Staples
29%
Utilities
16%
Industrials
9%
Materials
16%
Consumer Staples
16%
Industrials
36%
Utilities
16%
Industrials
28%
Information Technology
36%
Utilities
14%
Materials
21%
Utilities
71%
Consumer Staples
33%
Information Technology
18%
Materials
14%
Energy
29%
Utilities
42%
Health Care
21%
Industrials
Furthermore, analysis shows that companies exposed to water risk are prepared to invest – in technological improvements, monitoring, and staff training, among other things – to minimize those risks.
In technological solutions, where drinks company The Coca-Cola Company has invested more than US$1 billion since 2001 in wastewater treatment, working with bottlers to reduce their impact on water systems. Carmaker General Motors notes that where it expands operations in water-stressed areas it deploys “additional capital” for water reuse and recycling facilities. Canadian energy firm Suncor has earmarked around US$400 million of capital expenditure to its oil sands ‘tactical water strategy’.
In monitoring, where Brazilian mining firm Vale has invested US$8 million in monitoring systems to track changes in precipitation patterns, allowing it to take any preventive measures necessary.
In human resources, where numerous companies disclose that they are investing in staff training in water management. For example, Spanish clothing company Inditex trained staff at 101 wet-processing factories in 2013 on efficient water use, management of chemical products and correct wastewater treatment, as part of its Zero Discharge project.
These investments are, by definition, a cost to the businesses making them, at least in the near-term. But the sentiment frequently expressed by responding companies is that these investments allow companies to continue and/or grow their operations and help to reduce the value at risk from water stress.
While water stewardship comes at a price, it also promises opportunities to cut costs or increase revenues. No fewer than 75% of responding companies report that water offers operational, strategic, or market opportunities.
A rising tide of awareness and action
Figure 8: Sectors that most frequently reported defined targets (% of respondents)
Figure 9: Sectors that most frequently reported defined goals (% of respondents)
Working with farmers who supply coffee to the Company, Nestlé provides training and support for new technology to decrease water use in the coffee production process. As a result, water usage in coffee production was reduced from 40 liters to 3-5 liters of water per kilogram of coffee produced.
Nestlé
Cummins Inc. has already seen incremental investment in certain facilities, such as wastewater recycling systems, in operations located in water-stressed regions. While recognized as an increased cost, it has not significantly influenced the business strategy or success in an adverse manner, compared to the benefits the company realizes for operating in these regions.
Cummins Inc.
Absolute reduction of water withdrawals
14%
Consumer Discretionary
14%
Utilities
Educate customers
10%
Consumer Staples
6%
Information Technology
7%
Utilities
Reduction in consumptive volumes
15%
Health Care
Engage with public policy makers
12%
Health Care
17%
Information Technology
9%
Materials
Reduction of water intensity
55%
Consumer Discretionary
32%
Industrials
Engage with suppliers
26%
Consumer Staples
23%
Health Care
21%
Utilities
Water pollution prevention
19%
Health Care
11%
Information Technology
Increase access to WASH*
10%
Consumer Staples
14%
Energy
14%
Materials
Strengthen links with local community
17%
Information Technology
Sustainable agriculture
29%
Consumer Staples
4%
Health Care
Watershed remediation and habitat restoration, ecosystem preservation
18%
Consumer Discretionary
23%
Materials
*Access to water, sanitation and hygiene
10%
Consumer Staples
We commit to protect water resources and to improve water use efficiency by improving water management at relevant production sites; developing and providing products and technologies that improve water use efficiency and quality; and supporting community and research projects that promote the responsible use of water.
Bayer

1918
A rising tide of awareness and action
Types of opportunities reported globally
103
88
Numerous companies report reduced costs as a result of improved water efficiency.
UK drinks company Diageo Plc has reduced the volume of its water withdrawals by nearly 1 million cubic meters this reporting year and estimates the cost savings associated with this reduction to be approximately US$3.2 million.
The introduction of a new soldering practice at Cisco significantly reduced water use and wastewater, saving the US electronics manufacturer more than US$1 million/year.
In terms of new markets,
Bayer Crop Sciences is developing plant strains that can thrive in water-stressed areas, and is promoting efficient irrigation techniques.
Chemicals giant BASF estimates that water saving, recycling, reuse and drinking water treatment products offer the company potential sales of US$1 billion up to 2020.
A number of energy respondents see opportunity where water challenges meet climate concerns, with both Sempra Energy and Exelon in the US noting that energy efficiency programs and renewables investments offer the dual benefit of lower emissions and less water use.
Indeed, the vast majority (90%) of responding companies are starting to integrate water considerations into their business strategy formulation, in response to the growing necessity to invest to meet water challenges and the opportunities presented by water stewardship.
But concern remains that the response to corporate water risk may still be insufficient. Analysis suggests that the focus of many interventions remains on direct exposures and operational improvements. While focusing on water usage is an important first step, companies continuing with such a narrow focus may be missing opportunities or overlooking serious risks.
While the engagement that we are undoubtedly seeing around water management may protect a company’s ability to operate in the short term, a longer-term, more comprehensive view of water exposures and impacts is necessary.
According to Gianluca Manca from Eurizon Capital, “The global economy will favor businesses that take a pro-active approach to water stewardship.” What engaged investors want to see, and what leading companies are beginning to implement, are integrated, strategic, corporate water stewardship strategies in response to water risks.
COST SAVINGS
Improved water efficiency
8
REGULATORY
CHANGES
78Sales of new products and services
71bra
nd v
alu
eIncreased
Staff retention
6

2120
Diageo sees an opportunity to gain competitive advantage through performance which drives a reputation for leadership in water stewardship. We seek to achieve leadership by setting aggressive, industry-leading targets for water efficiency within direct operations; by collaborating locally and internationally to address the global water crisis; by working with third party manufacturers and suppliers in key agricultural sourcing locations to mitigate local water scarcity; and by providing access to clean drinking water and sanitation for communities in water-stressed areas.
Diageo
Corporate water stewardship is an emerging concept, and consensus is forming as to how it will be defined and put into practice.
The Alliance for Water Stewardship’s International Water Stewardship Standard, launched in April 2014, offers 28 core criteria grouped in six steps, under the headings Commit, Gather & Understand, Plan, Implement, Evaluate, and Communicate & Disclose.
Conservation group WWF describes a five-step journey, from water awareness, through taking internal action, to working collectively and influencing governance.
Through its CEO Water Mandate, the UN Global Compact provides a reporting framework companies can use to guide them through the stages of corporate water stewardship, including identifying and managing water-related business risk, and helping to sustainably manage shared resources.
The effective mitigation of corporate water risk involves not only an understanding of a company’s water dependency, but the context in which it operates, and how this relates to other water users.
It involves collective action with other stakeholders and policymakers to ensure equitable and sustainable access to water resources. It also involves ensuring those water impacts are sustainable at the river basin level, both in the near term, and in the context of future corporate growth, with appropriate and ambitious target setting. And of course, it starts with appropriate reporting and disclosure.
A corporate water stewardship approach allows companies to report and react meaningfully, rationally and in ways that will give confidence to all stakeholders, including investors, customers, policymakers and NGOs. By focusing on company risks and impacts, companies are able to establish priorities, set measureable goals, take meaningful action and contribute to greater water security for all.
By taking the lead in our industry in water stewardship H&M will engage with our customers and other stakeholders on our commitment to ensure water is used sustainably throughout our value chain, increasing customer perception of H&M as a sustainable brand and preferred retailer. We have adopted a water strategy based on WWF’s 5-step model of corporate water stewardship:
1. Water awareness;
2. Knowledge of impact;
3. Internal action;
4. Stakeholder engagement;
5. Influence governance.
H&M
What corporate water stewardship means to business
In order to promote water stewardship as well as the resilience of BASF in the face of water related risks, the German chemical company aims to achieve sustainable water management at all sites in water stressed areas by 2020 through the application of the European Water Stewardship (EWS) standard, created by the European Water Partnership (EWP). In 2013, BASF was awarded a gold-level certification for its extensive application of the EWS standard and water management at the production site in Tarragona, Spain. This was followed by the Verbund site in Ludwigshafen receiving the EWS standard gold-level certification in 2014.
Applying the European Water Stewardship (EWS) standard at all sites in water stressed areas by 2020, BASF aims to:
Assist in the evaluation of current and future water availability at local level, addressing estimates of future changes to water availability;
Help in the analysis of water availability and quality parameters through water management at the local level; and
Aid alignment of public policy positions with internal water stewardship goals where water withdrawals and wastewater discharges comply with national, state and local regulations and permit authorizations.
BASF

2322
How might a company move towards water stewardship? The questionnaire that forms the basis of CDP’s water program incorporates the steps needed for companies to become sustainable in their water use in addition to effectively managing water risks and impacts. It complements, reflects and builds on the foundations set by AWS, WWF and the UN Global Compact. Its use can help guide companies on a journey towards improved corporate water stewardship.
Disclosure via CDP enables the sharing of the myriad examples of companies moving in the right direction, as the below shows.
An understanding of the conditions within the river basins where the risk is located
Cement company Lafarge S.A. carries out water risk assessments on an annual basis within river basins and has set two objectives to enhance local watershed sustainability, including ensuring 100% of operations in water impacted areas engage local stakeholders in developing local watershed sustainability plans and reduce water impacts by 2020.
Spanish electric utility Endesa carries out analysis using the WBCSD Global Water Tool at basin level and uses data for total renewable water resources per person for each watershed. The analysis is performed out to 2025.
Comprehensive monitoring of a company’s water risk, both in terms of direct operations and within the supply chain
German utility E.ON notes that “the monitoring of the total volume of water withdrawals is an important part of E.ON´s water management”, across its power generation fleet. The company considers this in the context of permitting requirements, national and local regulations, and internally driven environmental improvements.
Car manufacturer General Motors has conducted a water life-cycle analysis throughout its component supply chain up to the fifth tier of suppliers, to quantify current and future water exposures
Reducing the impact on water resources
The Coca-Cola Company has set a target to reduce its water footprint by 75% in 2020 compared with 2004 levels, and had reached a 62% reduction by 2013.
By 2020, water abstraction by Unilever’s global factory network will be at or below 2008 levels, despite significantly higher levels of production. In 2013, the consumer goods giant had achieved a 74% reduction in abstraction compared with 1995 levels.
What corporate water stewardship means to business
Through our CEO Water Mandate commitments, we will work within the communities where we operate, as appropriate by location, to facilitate access to water, sanitation and hygiene, and promote sustainable management of water resources by using outreach opportunities, such as the Global Week of Caring and Ford Volunteer Corps’ seasonal initiatives, to support water stewardship
Ford Motor Company
As the manager of about EUR140billion of pension assets, water risk is affecting PGGM investments in a variety of ways. The problem however, is that the business value at water risk remains unclear because company information water is rarely comparable. CDP’s work on improving and standardizing water risk disclosure is therefore vital in helping PGGM assess the water risk in our portfolios.
PGGM Investments
Working with the regulators and policymakers
Drinks firm Diageo anticipates that its operations in Nairobi will face restrictions on their growth within five years as a rising local population outpaces water supplies. In response, it has established a collaborative effort between government, local industry and NGOs to identify and implement solutions to the water scarcity problem.
Chemicals company Bayer says it is actively “promoting public policies that tackle local water challenges”. For example, in the United States it participates on the Texas Water Development Board, the state’s water planning agency.
Cooperation with key stakeholders within river basins
British American Tobacco describes its work with local communities to understand water supply and demand, and avoid competition over scarce resources, as “a key focus area”. It also considers water utilities and suppliers as “key stakeholders”, given the potential for competition over water.
Chemicals company BASF cites “continuous exchange with our stakeholders” as a “fixed component of our sustainability management”. It runs 84 community advisory panels to ensure good relationships with those living near production sites.
Behind these corporate initiatives lies a clear business case. Companies that better understand and manage their water exposures across their value chain, engage in collective action and incorporate future water considerations into their growth plans are likely to be better able to protect and build shareholder value. They are also likely to be better positioned to exploit new opportunities and ultimately to grow within the constraints imposed by scare natural resources.

2524
Water shortages and poor water quality can cause production shortfalls, price volatility, higher energy costs, regulatory action, competition and social unrest. Because of these material risks, Calvert expects companies we own to measure, mitigate and disclose information about their water risks and water management strategies. Corporate water disclosure allows Calvert to assess how well a potential investment is positioned for sustainable growth and responsible business and in turn, aides Calvert in offering our investors responsible investment opportunities.
Calvert Investments
Conclusion: Time to take responsibility over water
The global water crisis presents many businesses with a unique set of challenges. In some cases, companies may be able to engineer solutions that secure their own water needs. However, this may do little to address the underlying risk drivers. There is little advantage to being a clean fish in a dirty pond.
Furthermore, those parts of the world that offer the greatest potential for economic growth in the years to come are also those that are at most risk from water stress. Business as usual approaches to growth may therefore need to be re-visited and re-evaluated.
Government clearly has a greater role to play. Almost one-third of Global 500 respondents report that they face regulatory risks to their direct operations, and they identify 152 such risks where they require policy clarity from government. The message from business is that it wants to see transparency, longevity and consistency in terms of water management policy interventions.
But companies also need to ask searching questions of their own water impacts, and how those impacts and associated corporate risks are to be mitigated. CDP data clearly shows that corporate water risk assessments are frequently insufficiently rigorous, given the nature of the risks these companies may face, and the potential value at stake.
Companies will also need to innovate. With global water stress predicted to increase, opportunities will be created to help society better manage water resources – opportunities such as the potential identified by Nokia to apply mobile telecoms technology to water use-related data gathering.
But some may also need to innovate in terms of rethinking business models to thrive in a more water-constrained world.
This year’s report is a call to the C-Suite to adopt a corporate water stewardship approach, taking ownership of the water impact of the companies they run, and to take responsibility for water externalities, building greater business resilience. The business case for action is both clear and compelling – ensuring business continuity, securing an ongoing license to operate, and protecting brand value. CDP provides a voluntary framework that can support the changes that companies will need to make to secure business value.
What is required is leadership from the top. Water stewardship requires investment, in both financial and human capital terms. Business leaders, their investors and policy makers must move quickly, efficiently and collectively if the global challenges posed by water insecurity are to be addressed.

2726
Sector Summaries
Consumer Discretionary
Consumer Staples
Energy
Health Care
Industrials
Information Technology
Materials
Utilities
CDP is increasing its focus on a number of key sectors, prioritized for their ability to impact upon or be impacted by climate change, water stress and deforestation. This will help to drive more targeted and effective action by companies to reduce greenhouse gas emissions, safeguard water resources and prevent the destruction of forests. This move towards greater sector focus is a result of consultation with stakeholders including investors and responding companies.
CDP will be implementing this approach gradually over the next three years. Initially through the focus on our climate change program and then expanding the work to cover water and additional environmental areas. In 2014, the sector approach started with the oil and gas sector which has been prioritized for its relevance to climate change. The aim is to produce data that is more meaningful to investors, reduce reporting requirements for key sectors, incentivize transparency and catalyze sector-specific action
The sector approach involves: Consulting directly with investors and industry representatives. Our
intent is to assess the relevance of existing CDP questions that oil and gas companies have been requested to disclose to date, both from CDPs climate change and water questionnaires as well as from the supplementary oil and gas sector module;
Developing sector specific guidance to drive standardization and support reporting companies;
Developing a sector specific scoring methodology to assess the level of detail and comprehensiveness of oil and gas companies disclosures and their level of action taken; and
In the longer term, introducing changes to CDP’s Online Response System (ORS) to provide more intuitive means to report sector-specific information.
Benefits include: Collecting the most relevant and usable information for investors,
decision makers and other stakeholders;
Focusing companies on disclosing and taking action on key issues identified for their relevance to the environment and investors; and
Providing a more meaningful assessment on companies’ progress on reducing greenhouse gas emissions, safeguarding water resources and preventing the destruction of forests.
CDP sector development
2928
Health care
PharmaceuticalsIndustrials
Materials Utilities
Energy Consumer staples
Consumer discretionary
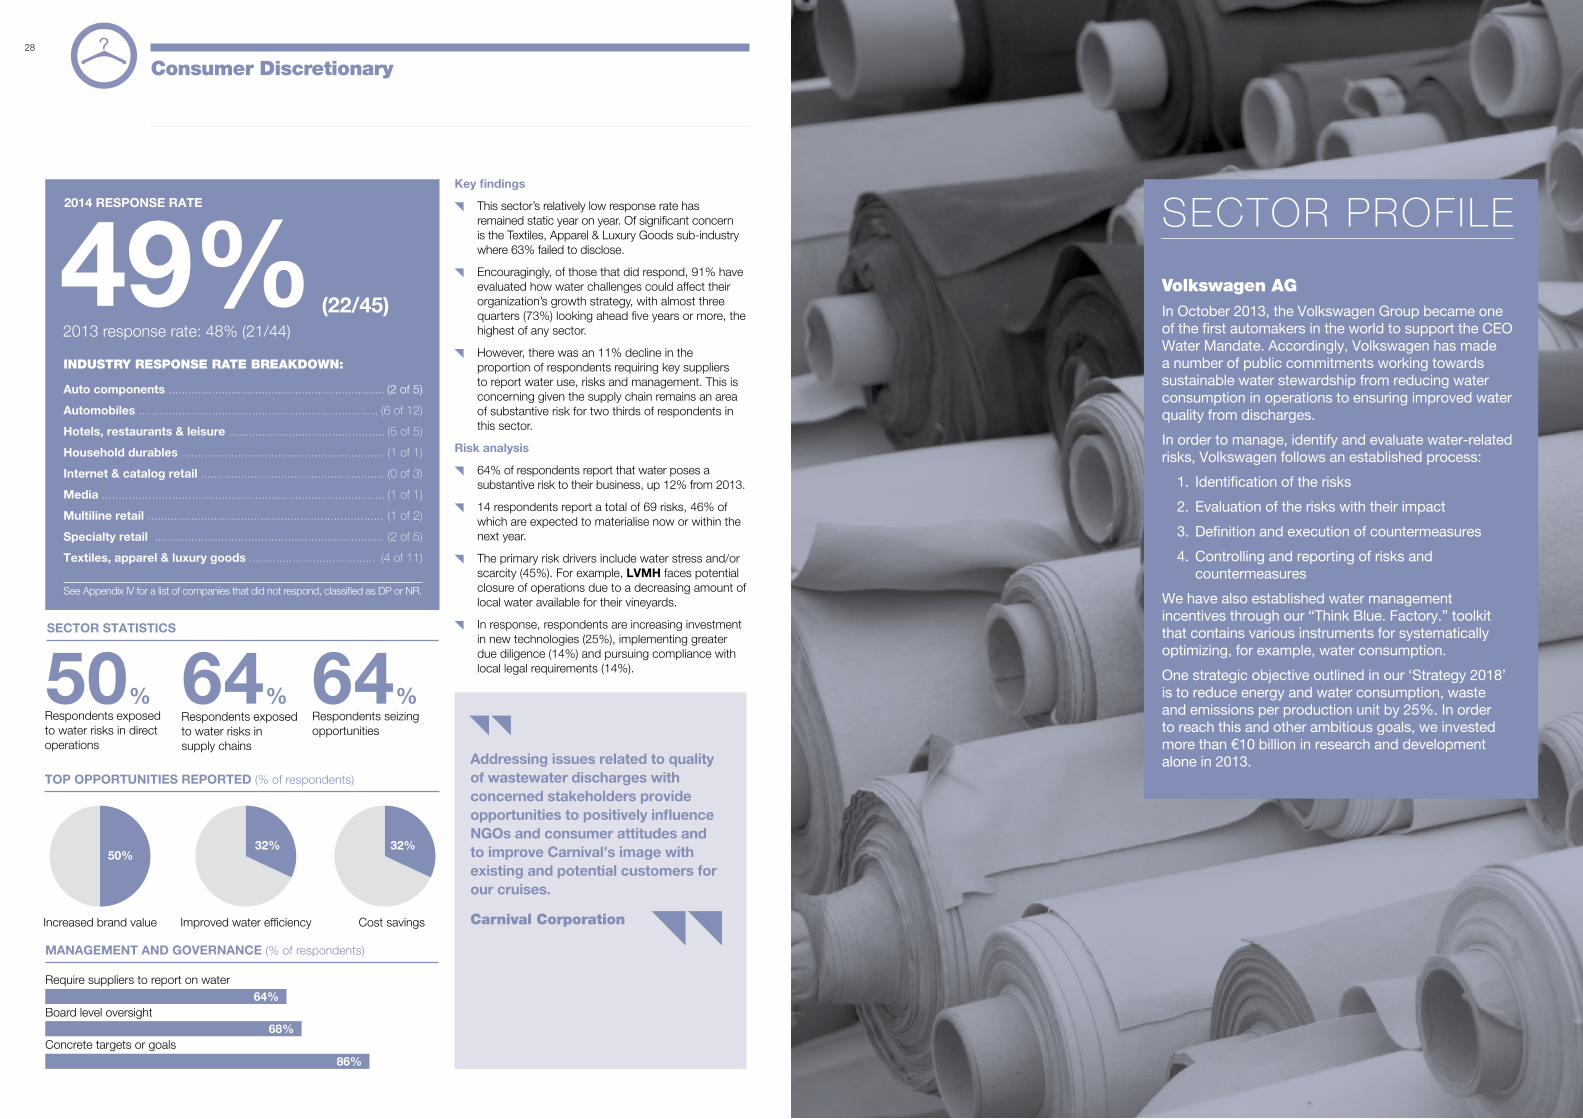
Consumer Discretionary
49%(22/45)
2014 RESPONSE RATE
INDUSTRY RESPONSE RATE BREAKDOWN:
Auto components ................................................................. (2 of 5)
Automobiles ........................................................................ (6 of 12)
Hotels, restaurants & leisure ............................................... (5 of 5)
Household durables ............................................................. (1 of 1)
Internet & catalog retail ....................................................... (0 of 3)
Media ..................................................................................... (1 of 1)
Multiline retail ....................................................................... (1 of 2)
Specialty retail ..................................................................... (2 of 5)
Textiles, apparel & luxury goods ...................................... (4 of 11)
See Appendix lV for a list of companies that did not respond, classified as DP or NR.
Key findings
This sector’s relatively low response rate has remained static year on year. Of significant concern is the Textiles, Apparel & Luxury Goods sub-industry where 63% failed to disclose.
Encouragingly, of those that did respond, 91% have evaluated how water challenges could affect their organization’s growth strategy, with almost three quarters (73%) looking ahead five years or more, the highest of any sector.
However, there was an 11% decline in the proportion of respondents requiring key suppliers to report water use, risks and management. This is concerning given the supply chain remains an area of substantive risk for two thirds of respondents in this sector.
Risk analysis
64% of respondents report that water poses a substantive risk to their business, up 12% from 2013.
14 respondents report a total of 69 risks, 46% of which are expected to materialise now or within the next year.
The primary risk drivers include water stress and/or scarcity (45%). For example, LVMH faces potential closure of operations due to a decreasing amount of local water available for their vineyards.
In response, respondents are increasing investment in new technologies (25%), implementing greater due diligence (14%) and pursuing compliance with local legal requirements (14%).50%
Respondents exposed to water risks in direct operations
64%Respondents exposed to water risks in supply chains
64%Respondents seizing opportunities
SECTOR STATISTICS
TOP OPPORTUNITIES REPORTED (% of respondents)
50%
Increased brand value
32%
Improved water efficiency
32%
Cost savings
Addressing issues related to quality of wastewater discharges with concerned stakeholders provide opportunities to positively influence NGOs and consumer attitudes and to improve Carnival’s image with existing and potential customers for our cruises.
Carnival Corporation
MANAGEMENT AND GOVERNANCE (% of respondents)
64%Require suppliers to report on water
68%Board level oversight
86%Concrete targets or goals
SECTOR PROFILE
Volkswagen AGIn October 2013, the Volkswagen Group became one of the first automakers in the world to support the CEO Water Mandate. Accordingly, Volkswagen has made a number of public commitments working towards sustainable water stewardship from reducing water consumption in operations to ensuring improved water quality from discharges.
In order to manage, identify and evaluate water-related risks, Volkswagen follows an established process:
1. Identification of the risks
2. Evaluation of the risks with their impact
3. Definition and execution of countermeasures
4. Controlling and reporting of risks and countermeasures
We have also established water management incentives through our “Think Blue. Factory.” toolkit that contains various instruments for systematically optimizing, for example, water consumption.
One strategic objective outlined in our ‘Strategy 2018’ is to reduce energy and water consumption, waste and emissions per production unit by 25%. In order to reach this and other ambitious goals, we invested more than €10 billion in research and development alone in 2013.
2013 response rate: 48% (21/44)

3130
42%
Consumer Staples
69%(31/45)
2014 RESPONSE RATE
INDUSTRY BREAKDOWN
Beverages ...............................................................................(7 of 8)
Food & Staples Retailing ..................................................... (6 of 13)
Food Products ......................................................................(7 of 10)
Household Products ..............................................................(4 of 5)
Personal Products .................................................................(2 of 2)
Tobacco ..................................................................................(5 of 7)
See Appendix lV for a list of companies that did not respond, classified as DP or NR.
Key findings
Almost half (45%) of respondents in this sector experienced detrimental impacts related to water challenges in the reporting year.
Despite this sector having the highest number of respondents (77%) reporting exposure to supply chain risks, 48% do not require key suppliers to report water use, risks or management.
While 71% of respondents set a target to reduce water intensity, less than a third report goals that contribute to supply chain resilience such as engaging with suppliers (26%) or pursuing sustainable agriculture (29%).
Risk analysis
81% of respondents report that water poses a substantive risk to their business, up from 74% in 2013.
25 respondents report a total of 188 risks, a quarter of which are expected to materialise now or within the next year.
The primary risk drivers include increased or projected water stress and/or scarcity (47%), flooding (8%) and declining water quality (8%).
In an effort to mitigate risk of higher operating costs from increased water stress, the Kellogg Company, aims to reduce water consumption at their Omaha plant through employee engagement, asset care programs, and capital projects that are expected to cost less than US$500,000.
Other respondents with in the sector are pursuing engagement with suppliers (11%) and increased investment in new technology (9%).
77%Respondents exposed to water risks in direct operations
77%Respondents exposed to water risks in supply chains
84%Respondents seizing opportunities
SECTOR STATISTICS
TOP OPPORTUNITIES REPORTED
45%
Improved water efficiency
45%
Cost savings Increased brand value
An un-interrupted supply of water is critical to maintaining production, thus meeting market and consumer demand for our products. Water of sufficient quality is vital to protecting the quality of our products. In addition, as a valued member of the local communities in which we operate, we consider our broader ‘license to operate’ ensuring we are not seen through our operations as depriving local communities of water resources.
British American Tobacco
MANAGEMENT AND GOVERNANCE (% of respondents)
52%Require suppliers to report on water
71%Board level oversight
84%Concrete targets or goals
SECTOR PROFILE
Colgate-Palmolive CompanyAt Colgate-Palmolive Company, water quality and quantity is vital to our organization’s long-term growth. As a result, we have included a fundamental pillar in our Sustainability Strategy – Making Every Drop of Water Count.
Colgate has committed to reduce the water consumed in the manufacture of our products by 40 percent compared to 2005. We are on track, so far reducing intensity by 33 percent compared to 2005 – avoiding enough water consumption to fill 5,700 Olympic-size swimming pools. Further, as part of our “5% for the Planet” capital funding initiative, Colgate expects sites to allocate a minimum of 1 percent of capital investments towards water reduction projects each year. We have also implemented company-wide projects to improve water efficiency. For example, our LEED(R)3-certified manufacturing facilities have adopted various water reduction strategies to minimize fresh water use and overall community impacts.
As many of our consumer products require water for use, consumers have a powerful role to play in helping the environment as they use our products. Colgate has therefore committed to promote water conservation awareness among over two billion consumers. Our global “Save Water” logo has been included on the packaging of many of our products, and in 2013, we reached over 250 million consumers with water conservation messaging.
We have also committed to work with local and global organizations to help promote access to clean water. Through Colgate’s sponsorship in 2013, Water For People reached over 10,000 people with water, sanitation systems and health and hygiene education in both India and Guatemala.
2013 response rate: 76% (37/49)
Health care
PharmaceuticalsIndustrials
Materials Utilities
Energy Consumer staples
Consumer discretionary
3 LEED(R) is a trademark owned by the U.S. Green Building Council and is used by permission

3332
Health care
PharmaceuticalsIndustrials
Materials Utilities
Energy Consumer staples
Consumer discretionary
Energy
42%(22/53)
2014 RESPONSE RATE
INDUSTRY BREAKDOWN:
Energy Equipment & Services ..............................................(2 of 5)
Oil, Gas & Consumable Fuels ...........................................(20 of 48)
See Appendix lV for a list of companies that did not respond, classified as DP or NR.
Key findings
This sector lags behind its peers in almost all elements of corporate water disclosure, with the lowest response rate for the fourth consecutive year.
Further, only 18% of respondents undertake a comprehensive water risk assessment and fewer than a third (32%) have assessed how water challenges may constrain long term (more than 5 years) business growth.
Risk analysis
82% of respondents report that water poses a substantive risk to their business.
18 respondents report a total of 100 risks, 44% of which are expected to materialise now or within the next three years. Only 6% of respondents report long-term risks (more than six years).
Physical risk drivers dominate, including water stress and/or scarcity (20%), seasonal supply variability (15%) and flooding (10%).
In response, respondents are pursuing compliance with local legal requirements or company internal standards (13%), engagement with suppliers (11%) and engagement with policy makers (9%). For example, Apache Corporation actively monitors the legislative landscape in order to anticipate changes in water regulations in an effort to reduce the likelihood of potential future restrictions.
82%Respondents exposed to water risks in direct operations
27%Respondents exposed to water risks in supply chains
77%Respondents seizing opportunities
SECTOR STATISTICS
TOP OPPORTUNITIES REPORTED
32%
Improved water efficiency
27%
Cost savings
18%
Sales of new products and
services
Suncor has developed models and tools that allow it to understand available water quantity and quality at the local level. This analysis frequently involves some scenario analysis however; more sophisticated models/tools are being developed to capture basin level projections that would better inform local water risks.
Suncor Energy Inc.MANAGEMENT AND GOVERNANCE (% of respondents)
18%Require suppliers to report on water
50%Board level oversight
77%Concrete targets or goals
SECTOR PROFILE
Sasol LimitedWe require a reliable supply of water of good quality to run its operations - primarily to generate steam and cool processes - making water a vital input for our operations
The Sasol risk management process is used to identify and rank Sasol’s top water risks and further annual strategy reviews are undertaken and regularly updated. An annual detailed analysis of the water risk facing South African operations which are dependent on the integrated Vaal River System is undertaken and further monitoring of key changes and developments around the top risk is reported on quarterly.
In response to physical risk, particularly water scarcity, we have initiated water conservation partnerships with municipalities to drive beyond fence line water savings to advance water security for all catchment users. In an effort to mitigate regulatory risk, we pro-actively engage with the National Department of Water Affairs on policy and regulatory matters in South Africa.
2013 response rate: 47% (26/55)

3534
Health care
PharmaceuticalsIndustrials
Materials Utilities
Energy Consumer staples
Consumer discretionary
Health Care
72%(26/36)
2014 RESPONSE RATE
INDUSTRY BREAKDOWN:
Biotechnology ........................................................................(4 of 7)
Health Care Equipment & Supplies ......................................(5 of 7)
Health Care Providers & Services ........................................(0 of 1)
Life Sciences Tools & Services ............................................(1 of 1)
Pharmaceuticals ................................................................(16 of 20)
See Appendix lV for a list of companies that did not respond, classified as DP or NR.
Key findings
69% of respondents have assessed the viability of their organization’s growth strategies, with 62% looking five years into the future or more.
However, risks may be overlooked as less than one third (31%) undertake comprehensive and robust water risk assessments and only 35% consider local communities and other water users in those assessments.
Risk analysis
65% of respondents report that water poses a substantive risk to their business.
17 respondents report a total of 116 risks, only 18% of which, are expected to materialize in the short term (up to 3 years) and more than half (52%) expected to materialise in the long term (up to 6 years) – a situation distinct to this sector.
The primary risk drivers include increased or projected water stress and/or scarcity (49%) as well as regulatory drivers (23%) such as changes to water allocation and higher water prices.
Respondents are setting site-specific targets (24%) in response in addition to investing in infrastructure (15%). For example, Celegene Corporation is investing in water efficiency projects and infrastructure that reduce overall consumption quantity at their facilities.65%
Respondents exposed to water risks in direct operations
42%Respondents exposed to water risks in supply chains
69%Respondents seizing opportunities
SECTOR STATISTICS
TOP OPPORTUNITIES REPORTED
42%
Improved water efficiency
31%
Cost savings
12%
Sales of new products and
services
We know that stakeholder conflicts could have a negative impact on our business by preventing cooperative relationships and reliability of supply. As water scarcity increases, increased conflict is predicted. In an effort to mitigate this risk we have begun a process of dialogue with local stakeholders.
Takeda Pharmaceutical Company Limited
MANAGEMENT AND GOVERNANCE (% of respondents)
42%Require suppliers to report on water
69%Board level oversight
81%Concrete targets or goals
SECTOR PROFILE
MerckMerck’s approach to Environmental, Health and Safety is guided by one simple principle - we demonstrate respect and care for the health and well-being of people and the environment in everything we do. Our commitment to water stewardship is formalized in our water policy, strategy and vision and affirmed via our endorsement of the United Nations CEO Water Mandate.
In 2011, Merck established a US$100 million capital fund to invest in the company’s water and wastewater infrastructure with the goal of reducing water demand, improving water and wastewater quality, strengthening our compliance position, improving operational efficiency and reducing the discharge of active pharmaceutical compounds and biologics from our manufacturing plants. To date, over 35 projects have been chartered and US$67 million committed. Full benefit realization of the capital investments is expected by 2017 and is forecast to reduce our demand for fresh water by 1.5 billion gallons per year and to cut our annual operating costs by approximately US$1.5 million. The water saving projects have focused on water reuse, reduction of once-thru-water, and energy efficiency. All of the project work is aligned with our corporate water standard which establishes core requirements and expectations for our facilities with regard to water supply, discharge, storm water management, spill control and continuous improvement.
Merck will continue to work towards improved corporate water stewardship as we strive to discover better ways to deliver greater value to both shareholders and society.
2013 response rate: 74% (23/31)

3736
Industrials
50%(19/38)
2014 RESPONSE RATE
INDUSTRY BREAKDOWN:
Aerospace & Defense .........................................................(3 of 12)
Building Products .................................................................(1 of 1)
Construction & Engineering ................................................(1 of 1)
Electrical Equipment ............................................................(3 of 5)
Industrial Conglomerates ....................................................(3 of 8)
Machinery ..............................................................................(6 of 9)
Trading Companies and Distributers ..................................(2 of 2)
See Appendix lV for a list of companies that did not respond, classified as DP or NR.
Key findings
26% of respondents undertake robust water risk assessments and the majority (82%) do not require key suppliers to report water use, risks and management.
Further, more than a quarter of respondents (26%) have not evaluated how water challenges could affect their organization’s growth strategy suggesting that risks may be overlooked.
Despite an encouragingly high proportion of respondents setting targets and goals (84%), the proportion of respondents with board level oversight on water has dropped by 5% since 2013 to 58%.
Risk analysis
53% of respondents report that water poses a substantive risk to their business.
10 respondents report a total of 43 risks, the fewest of any sector. 70% of these risks are expected to materialise within the next year - the highest of any sector. For example, Deere & Company anticipate higher operating costs in the next year as a result of increased water scarcity in Mexico and plan to focus on reducing water consumption as a result.
Physical risks dominate; including increased or projected water stress and/or scarcity (61%), flooding (18%), drought or climate change (12%).
A limited range of response strategies was reported, with 22% of respondents reporting increased investment in new technology or infrastructure.53%
Respondents exposed to water risks in direct operations
26%Respondents exposed to water risks in supply chains
74%Respondents seizing opportunities
SECTOR STATISTICS
TOP OPPORTUNITIES REPORTED
53%
Sales of new products and services
21%
Increased brand value
16%
Cost savings
Water is an important component to the manufacturing and support systems of several of our products. Because of this, 3M continues to actively understand, manage and work toward reducing our corporate water footprint while providing innovative solutions to our customers. We have a vested interest in preserving and improving water availability and quality relative to our operations and the communities we serve.
3M Company
MANAGEMENT AND GOVERNANCE (% of respondents)
16%Require suppliers to report on water
58%Board level oversight
84%Concrete targets or goals
SECTOR PROFILE
Royal PhillipsRoyal Philips understands that the availability of adequate quantities of water of high enough quality is crucial for the business. As a result, the company integrates water risk assessments into local plant management activities, and embeds them into quality management processes and ISO14001. Potential risks are monitored at local plant level, as well as at country level and reported to Group level.
As part of the company’s Green Manufacturing 2015 program, a commitment was made to reduce water withdrawal by 10% by 2015, with a base year of 2007. Progress in reaching this commitment is reviewed quarterly by the Sustainability Board as part of our internal reporting mechanism.
Philips has also signed the CEO Water Mandate acknowledging that in order to operate in a more sustainable manner, and contribute to the vision of the UN Global Compact and the realization of the Millennium Development Goals, it has a responsibility to make water-resources management a priority.
2013 response rate: 47% (18/38)
Health care
PharmaceuticalsIndustrials
Materials Utilities
Energy Consumer staples
Consumer discretionary

3938
IT
Information Technology
50%(18/36)
2014 RESPONSE RATE
INDUSTRY BREAKDOWN:
Communications Equipment ...............................................(3 of 4)
Computer & Peripherals .......................................................(2 of 3)
Electronic Equipment, Instruments & Component ............(2 of 5)
Internet Software & Services ...............................................(1 of 8)
IT Services .............................................................................(1 of 4)
Office Electronics ..................................................................(1 of 1)
Semiconductors & Semiconductor Equipment ..................(7 of 9)
Software ................................................................................(1 of 2)
See Appendix lV for a list of companies that did not respond, classified as DP or NR.
Key findings
While there was an 8% decrease in response rate this year compared to last, there are encouraging signs of progress in corporate water stewardship among respondents.
This sector the highest percentage (56%) of respondents undertaking a robust, company-wide water risk assessment.
Water governance is also improving with more than half (56%) requiring key suppliers to report on their water use, risks and management, and 50% now setting responsibility for water challenges at the board level –increases of 14% and 19% respectively since 2013.
Risk analysis
50% of respondents report that water poses a substantive risk to their business, the lowest of any sector.
9 respondents report a total of 50 risks, 31% of which are expected to impact within the next 3 years and 32% of which are expected to impact six years into the future.
Physical risk drivers dominate, including flooding (21%), increased water stress and/or scarcity (17%), drought (9%), and declining water quality (13%). For example, EMC Corporation anticipates higher operating costs resulting from disruption to operations as a result of declining water quality.
In response, respondents are pursuing compliance with local legal requirements (20%), increased investment in new technologies (18%) and engagement with policy makers (10%).
44%Respondents exposed to water risks in direct operations
39%Respondents exposed to water risks in supply chains
64%Respondents seizing opportunities
SECTOR STATISTICS
TOP OPPORTUNITIES REPORTED
39%
Sales of new products and services
33%
Cost savings
28%
Improved water efficiency
Water management is an integral part of our facilities’ oversight activities. Approximately 33% of our water usage is comprised of reclaimed water. We implement best practices to reduce all water usage in our facilities.
QUALCOMM IncMANAGEMENT AND GOVERNANCE (% of respondents)
56%Require suppliers to report on water
50%Board level oversight
78%Concrete targets or goals
SECTOR PROFILE
Hitachi, Ltd.There are three pillars that lie central to our vision. The company is committed to global warming prevention, resource conservation and ecosystems preservation. We have a goal to achieve a more sustainable society by promoting global production that reduces the environmental detriments of a product throughout its life cycle.
In 2013, Hitachi set a target for business sites outside Japan of a 26% reduction of water use per unit. A 39% reduction was achieved. The use of water was substantially reduced by reclaiming wastewater, using improved treatment facilities and reusing the reclaimed water in plants. As a result, water use in 2013 was 42% lower than the water use per unit in 2005.
Hitachi, Ltd. strives to devote significant management resources, including capital expenditures and R&D, and is making investments in corporate acquisitions and new projects to strengthen our social innovation business.
2013 response rate: 54% (14/26)

4140
Materials
73%(22/30)
2014 RESPONSE RATE
INDUSTRY BREAKDOWN:
Chemicals ......................................................................... (11 of 14)
Construction Materials ........................................................ (1 of 2)
Metals & Mining ................................................................ (10 of 13)
Paper & Forest Products ..................................................... (0 of 1)
See Appendix lV for a list of companies that did not respond, classified as DP or NR.
Key findings
Almost half of respondents (45%) experienced detrimental impacts related to water in the last reporting year, higher than the average of 30% and the second highest amongst all sectors.
Less than a third of respondents (32%) undertake a comprehensive and robust water risk assessment that incorporates both direct operations and supply chain.
A significant proportion of respondents have committed to both goals and targets this year, 86%.
Risk analysis
64% of respondents report that water poses a substantive risk to their business.
14 respondents report a total of 118 risks, 47% of which are expected to materialise within the next three years. 22% of reported risks have an unknown time frame.
A wide range of risk drivers were reported with 54% physical including increased water stress and/or scarcity, 33% regulatory such as increased difficulty in obtaining operations permits and 7% reputational.
Respondents are pursuing a wide range of response strategies including engagement with suppliers (11%), engagement with policy makers (8%), compliance with local legal requirements (7%), increased capital expenditure (7%), and supplier diversification (6%). For example, Anglo American implements water efficiency and conservation measures and works with government to develop sector water efficiency targets aligned with principles of water conservation and demand management.
64%Respondents exposed to water risks in direct operations
23%Respondents exposed to water risks in supply chains
86%Respondents seizing opportunities
SECTOR STATISTICS
TOP OPPORTUNITIES REPORTED
45%
Sales of new products and services
41%
Cost savings
27%
Increased brand value
Water availability is important for Syngenta’s growth, especially for the development of our product portfolio. Changes in water availability directly affect agriculture in terms of growing seasons, pests and crop productivity, and as a result alters demand for our products.
Syngenta International AG
MANAGEMENT AND GOVERNANCE (% of respondents)
32%Require suppliers to report on water
64%Board level oversight
86%Concrete targets or goals
SECTOR PROFILE
EcolabIn 2013, we invested US$188 million in research and development, with sustainability as a strategic driver in many on-going projects. We anticipate greater water shortages could occur as a result of climate change, therefore Ecolab deploys many strategies to help customers use less water and these technologies may also decrease the overall energy requirements, resulting in both reduced water use and a lower carbon footprint.
By working continuously with our customers, we are able to support their needs through innovation; producing new products and solutions that improve production efficiency and reduce water resource and consumption, both of which result in significant operational cost savings to our own company and to our customers.
2013 response rate: 74% (29/39)
Health care
PharmaceuticalsIndustrials
Materials Utilities
Energy Consumer staples
Consumer discretionary

4342
Utilities
74%(14/19)
2014 RESPONSE RATE
INDUSTRY BREAKDOWN:
Electric Utilities ...................................................................(7 of 11)
Gas Utilities ...........................................................................(1 of 2)
Multi-Utilities .........................................................................(6 of 6)
See Appendix lV for a list of companies that did not respond, classified as DP or NR.
Key findings
Half of respondents in the Utilities sector experienced detrimental impacts related to water in the reporting year, the highest of any sector.
But this sector also anticipates significant opportunities, with 79% of respondents expecting to capitalise on cost savings and increased brand value.
71% of respondents report including future potential regulatory changes at a local level into their water risk assessments, again much higher than the average of 55%.
Risk analysis
86% of respondents report that water poses a substantive risk to their business.
12 respondents report a total of 100 risks, almost half (48%) of which are expected to materialise within the next three years.
The primary risk drivers include increased water stress and/or scarcity (28%) and regulatory uncertainty (18%).
In response, respondents are increasing investment in new technology and/or infrastructure (27%) and working towards integrated water management (11%). For example, E.ON SE is implementing operational and infrastructure improvements that will enhance the reliability of their generation assets and distribution networks.
86%Respondents exposed to water risks in direct operations
36%Respondents exposed to water risks in supply chains
79%Respondents seizing opportunities
SECTOR STATISTICS
TOP OPPORTUNITIES REPORTED
50%
Cost savings
50%
Increased brand value
50%
Improved water efficiency
GDF SUEZ has developed a number of water commitments based on the CEO Water Mandate initiative including: identifying sites exposed to water risk and developing a local action plan for each; complying with local legislation; develop an action plan on water extraction and discharge for all sites identified as being exposed to water risk; measuring the water footprint of all activities and improving disclosure and transparency on water
GDF SUEZ
MANAGEMENT AND GOVERNANCE (% of respondents)
36%Require suppliers to report on water
57%Board level oversight
71%Concrete targets or goals
SECTOR PROFILE
EDFThe EDF group has been committed to three fundamental principles since the 6th World Water Forum held in 2012. These principles are:
Investing necessary resources in the development of methods and instruments to assess the water footprint of its electricity generation activities;
Controlling the water footprint arising from its electricity generation activities; and,
Creating local value and incorporating the aim of minimizing our water footprint in the design phase of the development of any electricity generation project.
In the Durance hydro dams (France), EDF encourages farmers to save water through an agreement which commits EDF to pay back part of the savings if targeted objectives are reached over a six year period. As a result, agricultural water consumption decreased by 35%. This is a ‘win-win’ situation not only because it allows EDF to increase the availability of water resources (and thus hydroelectric power) in dams but also because it increases the productive efficiency during peak demand.
2013 response rate: 70% (16/23)
Health care
PharmaceuticalsIndustrials
Materials Utilities
Energy Consumer staples
Consumer discretionary

4544
Appendix I - Summary of key indicators by sector
Key Indicators Consumer Discretionary
Consumer Staples Energy Health Care Industrials Information
Technology Materials Utilities 2014 Global 500
2013 Global 500
Total respondents 22 31 22 26 19 18 22 14 174 180
Public respondents 11 27 18 24 13 14 14 14 135 149
Non-public respondents 11 4 4 2 6 4 8 0 39 31
Response rate 49% 69% 42% 72% 50% 50% 73% 74% 58% 59%
Current State
Respondents that have evaluated how water quality and quantity could impact business growth over the next year or more
91% 87% 73% 69% 53% 61% 73% 71% 74% New
Respondents that have experienced water-related business impacts in the reporting year
23% 45% 41% 15% 21% 0% 45% 50% 30% New
Water risk assessment
Respondents that undertake water risk assessments at the river basin scale
18% 32% 32% 12% 21% 28% 36% 21% 25% New
Respondents that factor estimates of future potential regulatory changes at a local level into their water risk assessments
59% 58% 50% 50% 53% 39% 59% 71% 55% New
Respondents that factor local communities into their water risk assessments
41% 58% 59% 58% 47% 56% 68% 71% 40% New
Respondents that require key suppliers to report water use, risks and management
64% 52% 18% 42% 16% 56% 32% 36% 40% 37%
Water risks & opportunities
Respondents exposed to risks in either direct operations or supply chain
64% 81% 82% 65% 53% 50% 64% 86% 68% 70%
Respondents exposed to risks in direct operations
50% 77% 82% 65% 53% 44% 64% 86% 66% 66%
Respondents exposed to risks in supply chain
64% 77% 27% 42% 26% 39% 23% 36% 44% 39%
Respondents exposed to risks in both direct operations and supply chain
50% 74% 27% 42% 26% 33% 23% 36% 41% New
Respondents that identify opportunity 64% 84% 77% 69% 74% 61% 86% 79% 75% 77%
Accounting
Respondents that report water withdrawals 91% 97% 86% 96% 79% 94% 91% 93% 91% 99%
Respondents that report water discharge 68% 87% 68% 85% 58% 89% 82% 93% 79% New
Respondents that monitor all water aspects for more than 50% of facilities at risk
18% 45% 50% 31% 16% 22% 45% 50% 35% New
Respondents that verify (>1%) total volume of water withdrawal data by source for at risk facilities
32% 42% 27% 42% 32% 11% 32% 57% 34% New
Respondents that verify (>1%) water discharge quality data by destination for at risk facilities
18% 26% 18% 23% 5% 6% 18% 57% 21% New
Governance & Strategy
Respondents with water integrated into their business strategy
91% 97% 86% 88% 100% 67% 91% 100% 90% New
Respondents with board level oversight of water policy, strategy or plan
68% 71% 50% 69% 58% 50% 64% 57% 62% 58%
Respondents with a water policy with goals and guidelines for action
91% 84% 45% 73% 58% 56% 64% 57% 68% New
Compliance
Respondents subject to significant penalties and/or fines
14% 48% 32% 15% 37% 17% 36% 21% 29% New
Targets and initiatives
Respondents with goals or targets in place 45% 71% 18% 50% 42% 50% 45% 57% 48% New
Respondents reporting targets with quantitative actions to manage water resources
73% 84% 32% 77% 63% 56% 59% 57% 64% New
Respondents reporting qualitative goals leading towards improved corporate water stewardship
59% 71% 64% 54% 63% 72% 73% 71% 66% New
Respondents that align public policy position with water stewardship
18% 23% 18% 15% 11% 11% 18% 36% 18% New
Key Indicators Australia France Germany Japan Spain Switzerland United Kingdom
United States of America
Total respondents 2 14 9 16 4 6 19 75
Public respondents 2 10 5 7 4 5 17 67
Non-public respondents 0 4 4 9 0 1 2 8
Response rate 50% 70% 75% 70% 80% 67% 83% 58%
Current State
Respondents that have evaluated how water quality and quantity could impact business growth over the next year or more
50% 79% 78% 63% 100% 83% 89% 68%
Respondents that have experienced water-related business impacts in the reporting year
0% 29% 56% 13% 75% 50% 32% 25%
Water risk assessment
Respondents that undertake water risk assessments at the river basin scale
0% 14% 33% 6% 50% 33% 21% 28%
Respondents that factor estimates of future potential regulatory changes at a local level into their water risk assessments
50% 71% 78% 50% 100% 17% 47% 48%
Respondents that factor local communities into their water risk assessments
0% 64% 56% 69% 75% 17% 58% 49%
Respondents that require key suppliers to report water use, risks and management
0% 43% 56% 56% 50% 33% 37% 36%
Water risks & opportunities
Respondents exposed to risks in either direct operations or supply chain
50% 79% 78% 63% 100% 50% 74% 64%
Respondents exposed to risks in direct operations 50% 71% 67% 63% 75% 50% 74% 61%
Respondents exposed to risks in supply chain 0% 50% 56% 50% 50% 50% 47% 40%
Respondents exposed to risks in both direct operations and supply chain
0% 43% 44% 50% 25% 50% 47% 37%
Respondents that identify opportunity 0% 86% 78% 75% 100% 67% 84% 72%
Accounting
Respondents that report water withdrawals 100% 93% 100% 81% 100% 100% 100% 89%
Respondents that report water discharge 50% 93% 100% 81% 100% 100% 89% 68%
Respondents that monitor all water aspects for more than 50% of facilities at risk
50% 50% 44% 38% 50% 33% 53% 28%
Respondents that verify (>1%) total volume of water withdrawal data by source for at risk facilities
100% 71% 56% 31% 75% 33% 37% 20%
Respondents that verify (>1%) water discharge quality data by destination for at risk facilities
100% 50% 44% 31% 75% 33% 32% 5%
Governance & Strategy
Respondents with water integrated into their business strategy 100% 100% 100% 88% 100% 67% 89% 91%
Respondents with board level oversight of water policy, strategy or plan
50% 86% 89% 88% 50% 100% 74% 44%
Respondents with a water policy with goals and guidelines for action
100% 93% 78% 81% 100% 67% 53% 63%
Compliance
Respondents subject to significant penalties and/or fines 0% 21% 11% 13% 25% 50% 42% 31%
Targets and initiatives
Respondents with goals or targets in place 0% 100% 100% 75% 100% 83% 84% 77%
Respondents reporting targets with quantitative actions to manage water resources
0% 14% 11% 19% 0% 17% 11% 20%
Respondents reporting qualitative goals leading towards improved corporate water stewardship
0% 14% 33% 19% 25% 33% 16% 17%
Respondents that align public policy position with water stewardship
0% 7% 33% 0% 50% 17% 32% 15%
Appendix II - Summary of key indicators by geography

4746
Appendix III - Response status and sector by company
Company name Status for report Ticker Country HQ
Consumer Discretionary
adidas AG DP ADS GR GermanyAmazon.com Inc. NR AMZN US USA
Astra International NR ASII IJ Indonesia
BMW AG AQ (NP) BMW GR GermanyBridgestone Corporation AQ (NP) 5108 JP JapanCarnival Corporation AQ CCL US United KingdomChristian Dior AQ (NP) CDI FP FranceCompagnie Financière Richemont SA AQ CFR VX SwitzerlandCompass AQ (NP) CPG LN United KingdomContinental AG DP CON GR GermanyDaimler AG AQ (NP) DAI GR GermanyDenso Corporation DP 6902 JP JapanFord Motor Company AQ F US USAFuji Heavy Industries Ltd. DP 7270 JP JapanGeneral Motors Company AQ GM US USAH&M Hennes & Mauritz AB AQ HMB SS SwedenHermes International DP RMS FP FranceHonda Motor Company NR 7267 JP JapanHyundai Mobis NR 012330 KS South KoreaHyundai Motor Company NR 005380 KS South KoreaInditex AQ ITX SM SpainJohnson Controls AQ (NP) JCI US USAKering AQ KER FP FranceLowe's Companies, Inc. DP LOW US USALuxottica Group DP LUX IM ItalyLVMH AQ MC FP FranceMcDonald's Corporation AQ (NP) MCD US USANetflix, Inc. NR NFLX US USANIKE Inc. DP NKE US USANissan Motor Co., Ltd. AQ (NP) 7201 JP JapanPanasonic Corporation AQ (NP) 6752 JP JapanPrada NR 1913 HK ItalyRenault DP RNO FP FranceS.A.C.I. Falabella NR FALAB CI ChileStarbucks Corporation AQ SBUX US USASwatch Group DP UHRN SW SwitzerlandTarget Corporation AQ TGT US USAThe Home Depot, Inc. NR HD US USAThe Priceline Group Inc NR PCLN US USAThomson Reuters Corporation AQ (NP) TRI US USATJX Companies, Inc. DP TJX US USAToyota Motor Corporation DP 7203 JP JapanVF Corporation NR VFC US USAVolkswagen AG AQ VOW3 GR GermanyYum! Brands, Inc. AQ (NP) YUM US USA
Consumer Staples
Altria Group, Inc. AQ MO US USAAmbev - Cia de Bebidas das Américas AQ (SA) ABEV3 BZ BrazilAnheuser Busch InBev AQ ABI BB BelgiumArcher Daniels Midland DP ADM US USAAssociated British Foods AQ ABF LN United KingdomBeiersdorf AG AQ BEI GR GermanyBritish American Tobacco AQ BATS LN United KingdomCarrefour DP CA FP FranceColgate Palmolive Company AQ CL US USACostco Wholesale Corporation DP COST US USACVS Caremark Corporation AQ CVS USDanone AQ (NP) BN FP France
Company name Status for report Ticker Country HQ
Diageo Plc AQ DGE LN United KingdomGeneral Mills Inc. AQ GIS US USAHeineken NV AQ HEIA NA NetherlandsHenkel AG & Co. KGaA AQ (NP) HEN3 GR GermanyImperial Tobacco Group AQ IMT LN United KingdomITC Limited AQ ITC IN IndiaJapan Tobacco Inc. NR 2914 JP JapanKellogg Company AQ K US USAKimberly-Clark Corporation AQ KMB US USAKraft Foods NR KRFT US USAL'Oréal AQ OR FP FranceMagnit NR MGNT RX RussiaMondelez International Inc AQ MDLZ US USANestlé AQ NESN VX SwitzerlandPepsiCo, Inc. AQ PEP US USAPernod Ricard AQ RI FP FrancePhilip Morris International AQ PM US USAProcter & Gamble Company DP PG US USAReckitt Benckiser AQ (NP) RB/ LN United KingdomReynolds American Inc. NR RAI US USASABMiller AQ SAB LN United KingdomSeven & I Holdings Co., Ltd. AQ 3382 JP JapanSysco Corporation AQ SYY US USATesco NR TSCO LN United KingdomThe Coca-Cola Company AQ KO US USAUnilever Nv Cva AQ (SA) UNA NA NetherlandsUnilever plc AQ ULVR LN United KingdomWal Mart de Mexico AQ (NP) WALMEXV MM MexicoWalgreen Company NR WAG US USAWal-Mart Stores, Inc. NR WMT US USAWesfarmers AQ WES AU AustraliaWhole Foods Market, Inc. AQ WFM US USAWoolworths Limited NR WOW AU Australia
Energy
Anadarko Petroleum Corporation AQ APC US USAApache Corporation AQ APA US USABaker Hughes Incorporated AQ (NP) BHI US USABG Group AQ BG/ LN United KingdomBP AQ BP/ LN United KingdomCanadian Natural Resources Limited DP CNQ CN CanadaCenovus Energy Inc. AQ CVE CN CanadaChevron Corporation DP CVX US USACNOOC NR 883 HK ChinaCoal India NR COAL IN IndiaConocoPhillips NR COP US USADevon Energy Corporation AQ DVN US USAEcopetrol Sa AQ ECOPETL CB ColombiaEnbridge Inc. NR ENB CN CanadaEni SpA AQ (NP) ENI IM ItalyEOG Resources, Inc. AQ EOG US USAExxon Mobil Corporation DP XOM US USAFormosa Petrochemical NR 6505 TT TaiwanGazprom OAO AQ GAZP RM RussiaHalliburton Company AQ (L) HAL US USAHess Corporation AQ HES US USAHusky Energy Inc. AQ HSE CN CanadaImperial Oil DP IMO CN CanadaKinder Morgan Inc. DP KMI US USALukoil NR LKOH RX RussiaMarathon Oil Corporation AQ (NP) MRO US USAMarathon Petroleum DP MPC US USANational Oilwell Varco, Inc. NR NOV US USANoble Energy, Inc. AQ NBL US USANovatek AQ NVTK RM RussiaOccidental Petroleum Corporation AQ OXY US USAOil & Natural Gas NR ONGC IN IndiaPETROCHINA Company Limited NR 857 HK ChinaPetróleo Brasileiro SA - Petrobras DP PETR4 BZ BrazilPhillips 66 NR PSX US USAPioneer Natural Resources NR PXD US USAPTT AQ (NP) PTT TB ThailandReliance Industries NR RIL IN India
Company name Status for report Ticker Country HQ
Repsol DP REP SM SpainRosneft NR ROSN RM RussiaRoyal Dutch Shell DP RDSA NA NetherlandsSasol Limited AQ SOL SJ South AfricaSchlumberger Limited NR SLB US USASpectra Energy Corp DP SE US USAStatoil ASA AQ STL NO NorwaySuncor Energy Inc. AQ SU CN CanadaSurgutneftegas NR SNGSP RM RussiaTenaris S.A. NR TEN IM LuxembourgTotal DP FP FP FranceTransCanada Corporation DP TRP CN CanadaValero Energy Corporation DP VLO US USAWilliams Companies, Inc. NR WMB US USAWoodside Petroleum NR WPL AU Australia
Health Care
Abbott Laboratories AQ ABT US USAAbbVie Inc AQ (NP) ABBV US USAActavis plc. DP ACT US USAAlexion Pharmaceuticals NR ALXN US USAAllergan, Inc. AQ AGN US USAAmgen, Inc. AQ AMGN US USAAstellas Pharma Inc. AQ 4503 JP JapanAstraZeneca AQ AZN LN United KingdomBaxter International Inc. NR BAX US USABayer AG AQ BAYN GR GermanyBecton, Dickinson and Co. AQ BDX US USABiogen Idec Inc. AQ BIIB US USABristol-Myers Squibb AQ BMY US USACelgene Corporation AQ CELG US USACovidien Ltd. AQ COV US IrelandCSL AQ CSL AU AustraliaEli Lilly & Co. AQ LLY US USAEssilor International AQ (NP) EI FP FranceGilead Sciences, Inc. NR GILD US USAGlaxoSmithKline AQ GSK LN United KingdomHCA NR HCA US USAJohnson & Johnson AQ JNJ US USAMedtronic, Inc. AQ MDT US USAMerck & Co., Inc. AQ MRK US USANovartis AQ NOVN VX SwitzerlandNovo Nordisk A/S DP NOVOB DC DenmarkPfizer Inc. AQ PFE US USARegeneron Pharmaceuticals, Inc. DP REGN US USARoche Holding AG AQ ROG VX SwitzerlandSANOFI AQ SAN FP FranceShire AQ SHP LN IrelandStryker Corporation NR SYK US USATakeda Pharmaceutical Company Limited
AQ 4502 JP Japan
Teva Pharmaceutical Industries Ltd DP TEVA IT IsraelThermo Fisher Scientific Inc. AQ TMO US USAValeant Pharmaceuticals International, Inc. NR VRX US Canada
Industrials
3M Company AQ MMM US USAABB NR ABBN VX SwitzerlandAirbus Group DP AIR FP NetherlandsAtlas Copco AQ (NP) ATCOA SS SwedenBAE Systems DP BA/ LN United KingdomBoeing Company NR BA US USACaterpillar Inc. DP CAT US USACummins Inc. AQ CMI US USADanaher Corporation DP DHR US USADeere & Company AQ DE US USAEaton Corporation AQ ETN US USAEmerson Electric Co. AQ (L) EMR US USAFanuc Corporation NR 6954 JP JapanGeneral Dynamics Corporation NR GD US USAGeneral Electric Company AQ GE US USAHoneywell International Inc. DP HON US USAHutchison Whampoa NR 13 HK Hong KongIllinois Tool Works, Inc. AQ (NP) ITW US USA
Company name Status for report Ticker Country HQ
Jardine Matheson NR JM SP Hong KongJardine Strategic NR JS SP Hong KongKubota Corporation AQ (NP) 6326 JP JapanLockheed Martin Corporation AQ LMT US USAMitsubishi Corporation AQ (NP) 8058 JP JapanMitsubishi Electric Corporation AQ 6503 JP JapanMitsubishi Heavy Industries, Ltd. AQ 7011 JP JapanMitsui & Co., Ltd. AQ (NP) 8031 JP JapanNorthrop Grumman Corp DP NOC US USAPACCAR Inc IN PCAR US USAPrecision Castparts Corp. NR PCP US USARaytheon Company AQ RTN US USARolls-Royce DP RR/ LN United KingdomRoyal Philips AQ PHIA NA NetherlandsSafran NR SAF FP FranceSaint-Gobain AQ SGO FP FranceSchneider Electric DP SU FP FranceSiemens Aktiengesellschaft DP SIE GR GermanyUnited Technologies Corporation AQ (NP) UTX US USAVinci AQ DG FP France
Information Technology
Apple Inc. NR AAPL US USAApplied Materials Inc. AQ AMAT US USAARM Holdings AQ ARM LN United KingdomASML Holding DP ASML NA NetherlandsAutomatic Data Processing, Inc. AQ ADP US USACanon Inc. AQ 7751 JP JapanCielo SA DP CIEL3 BZ BrazilCisco Systems, Inc. AQ CSCO US USACorning Incorporated DP GLW US USAeBay Inc. NR EBAY US USAEMC Corporation AQ (L) EMC US USAEricsson DP ERICB SS SwedenFacebook NR FB US USAGoogle Inc. NR GOOG US USAHewlett-Packard AQ HPQ US USAHitachi, Ltd. AQ 6501 JP JapanHon Hai Precision Industry NR 2317 TT TaiwanIntel Corporation AQ INTC US USAKeyence Corporation NR 6861 JP JapanLinkedIn Corp. NR LNKD US USAMasterCard Incorporated DP MA US USAMicron Technology, Inc. DP MU US USAMicrosoft Corporation AQ MSFT US USANaver NR 035420 KS South KoreaNokia Group AQ NOK1V FH FinlandOracle Corporation DP ORCL US USAQUALCOMM Inc. AQ QCOM US USASamsung Electronics AQ (NP) 005930 KS South KoreaSK Hynix AQ (NP) 000660 KS South KoreaTaiwan Semiconductor Manufacturing AQ (NP) 2330 TT TaiwanTE Connectivity AQ TEL US USATencent Holdings NR 700 HK Hong KongTexas Instruments Incorporated AQ TXN US USAVisa NR V US USAYahoo Japan Corporation AQ (NP) 4689 JP JapanYahoo! Inc. NR YHOO US USA
Materials
Air Liquide AQ (NP) AI FP FranceAir Products & Chemicals, Inc. AQ (NP) APD US USAAnglo American AQ AAL LN United KingdomArcelor Mittal AQ (NP) MT NA LuxembourgBarrick Gold Corporation AQ ABX CN CanadaBASF SE AQ BAS GR GermanyBHP Billiton AQ BHP AU United KingdomE.I. du Pont de Nemours and Company AQ DD US USAEcolab Inc. AQ ECL US USAFreeport-McMoRan Copper & Gold Inc. AQ FCX US USAGlencore Xstrata plc AQ (NP) GLEN LN SwitzerlandGrupo Mexico S.A.B. de CV NR GMEXICOB MMMexicoHolcim Ltd NR HOLN VX SwitzerlandInternational Paper Company DP IP US USA
RespondersKey to response status:
AQ Answered questionnaireAQ (NP) Answered questionnaire but response not made publicAQ (SA) Company is either a subsidiary or has merged during
the reporting process; see Company in parenthesis for further information
AQ (L) Answered questionnaire after submission deadlineDP Declined to participateNR No Response

4948
Company name Status for report Ticker Country HQ
Lafarge S.A. AQ LG FP FranceLinde AG AQ (NP) LIN GR GermanyLyondellBasell Industries Cl A DP DLY GR NetherlandsMMC Norilsk Nickel OSJC NR GMKN RX RussiaMonsanto Company NR MON US USANippon Steel & Sumitomo Metal Corporation
AQ (NP) 5401 JP Japan
POSCO AQ 005490 KS South KoreaPotash Corporation of Saskatchewan Inc. AQ (NP) POT CN CanadaPPG Industries, Inc. AQ PPG US USAPraxair, Inc. DP PX US USARio Tinto AQ RIO LN United KingdomShin-Etsu Chemical Co., Ltd. AQ (NP) 4063 JP JapanSouthern Copper Corporation NR SCCO PE PeruSyngenta International AG AQ SYNN VX SwitzerlandThe Dow Chemical Company AQ DOW US USAVale AQ VALE3 BZ Brazil
Utilities
American Electric Power Company, Inc. AQ AEP US USACentrica AQ CNA LN United KingdomDominion Resources, Inc. AQ D US USADuke Energy Corporation NR DUK US USAE.ON SE AQ EOAN GR GermanyEDF AQ EDF FP FranceEndesa AQ ELE SM SpainENEL SpA AQ ENEL IM ItalyExelon Corporation AQ EXC US USAGas Natural SDG SA AQ GAS SM SpainGDF Suez AQ GSZ FP FranceHong Kong & China Gas Company Limited NR 3 HK Hong KongIberdrola SA AQ IBE SM SpainKorea Electric Power Corporation NR 015760 KS South KoreaNational Grid AQ NG/ LN United KingdomNextEra Energy, Inc. NR NEE US USASempra Energy AQ SRE US USASSE DP SSE LN United KingdomThe Southern Company AQ SO US USA
Company name Status for report Ticker Country HQ
Consumer Discretionary
BYD AQ 1211 HK ChinaCaesars Entertainment AQ (NP) HET US USACoway Co Ltd AQ (NP) 021240 KS South KoreaFiat AQ (NP) F IM ItalyGrupo Televisa S.A. AQ TLEVICPO MM MexicoHankook Tire Co Ltd AQ (NP) 161390 KS South KoreaMahindra & Mahindra AQ MM IN IndiaMotherson Sumi Systems AQ (NP) MSS IN IndiaMRF LTD AQ (NP) MRF IN IndiaPrimeAsia Leather Company AQ (NP) USAReed Elsevier Group AQ REL LN United KingdomSheraton Textiles AQ (NP) 0329938D SJ South AfricaStaples, Inc. AQ SPLS US USASun International Ltd AQ SUI SJ South AfricaTakata Corporation AQ 7312 JP JapanToyota Boshoku Corporation AQ 3116 JT JapanValeo Sa AQ FR FP FranceYokohama Rubber Company, Limited AQ 5101 JP Japan
Consumer Staples
BRF S.A AQ (NP) BRFS3 BZ BrazilBunge AQ BG US USACoca-Cola HBC AG AQ CCH LN GreeceCOCA-COLA İÇECEK A.Ş. AQ CCOLA TI TurkeyDistell Group Ltd AQ DST SJ South AfricaFresherized Foods AQ (NP) 9840762Z US USA
Company name Status for report Ticker Country HQ
JBS S/A AQ (NP) JBSS3 BZ BrazilMarfrig Alimentos S.A. AQ MRFG3 BZ BrazilMETRO AG AQ (NP) MEO GR GermanyNordzucker AQ (NP) 3112Z GR GermanyOlam International AQ OLAM SP Singapore
Energy
Crescent Point Energy Corporation AQ CPG CN CanadaEncana Corporation AQ ECA CN CanadaEnerplus Corporation AQ ERF CN CanadaEssar Oil AQ ESOIL IN IndiaPTT Exploration & Production Public Company Limited
AQ (NP) PTTEP TB Thailand
Financials
Banco Santander AQ SAN SM SpainBank of America AQ BAC US USAIndustrial Development Corporation AQ (NP) South AfricaMahindra Lifespace Developers Limited AQ MLIFE IN IndiaSanlam AQ SLM SJ South AfricaUnum Group AQ (NP) UNM US USA
Health Care
CICOR TECHNOLOGIES AQ CICN SW IndonesiaColoplast A/S AQ (NP) COLOB DC DenmarkAllied Electronics Corporation Ltd (Altron) AQ ATN SJ South Africa
Industrials
CSX Corporation AQ CSX US USADeutsche Post AG AQ (NP) DPW GR GermanyFurukawa Electric Co., Ltd. AQ (NP) 5801 JP JapanGS Yuasa Corporation AQ 6674 JP JapanHindustan Construction Company AQ HCC IN IndiaHyundai E&C AQ (NP) 000720 KS South KoreaLayne Christensen Company AQ LAYN US USAMorgan Advanced Materials AQ MGAM LN United KingdomNabtesco Corporation AQ (NP) 6268 JP JapanNippon Sheet Glass Company, Ltd AQ (NP) 5202 JT JapanNippon Yusen Kaisha Line AQ (NP) 9101 JP JapanNisshinbo Holdings Inc. AQ (NP) 3105 JP JapanNTN Corporation AQ 6472 JP JapanObrascon Huarte Lain (OHL) AQ OHL SM SpainOwens Corning AQ OC US USAParsons Brinckerhoff Limited AQ 1615842Z LN United KingdomReynders Label Printing AQ 3718338Z BB BelgiumRoyal BAM Group nv AQ BAMNB NA NetherlandsSamsung C&T AQ (NP) 000830 KS South KoreaSamsung Engineering AQ 028050 KS South KoreaSandvik AB AQ (NP) SAND SS SwedenSecom Co., Ltd. AQ 9735 JP JapanSEKEM Holding AQ (NP) EgyptSM Investments AQ SM PM PhilippinesSouth African Post Office AQ South AfricaTAV HAVALİMANLARI HOLDİNG A.Ş. AQ (NP) TAVHL TI TurkeyUnion Pacific Corporation AQ UNP US USAUPS AQ UPS US USAWECKERLE AQ (NP) 6302495Z GR Germany
Information Technology
Advanced Micro Devices, Inc AQ AMD US USAAlps Electric Co., Ltd. AQ 6770 JP JapanAU Optronics AQ (NP) 2409 TT TaiwanBel Fuse Inc. AQ BELFA US USADell Inc. AQ DELL US USAFujitsu Ltd. AQ 6702 JP JapanGOLD CIRCUIT ELECTRONICS LTD AQ (NP) 2368 TT TaiwanHCL Technologies AQ HCLT IN IndiaIbiden Co., Ltd. AQ (NP) 4062 JP JapanInfosys Limited AQ (NP) INFO IN IndiaIntegrated Device Technology, Inc. AQ IDTI US USAInternational Business Machines (IBM) AQ IBM US USAInternational Rectifier AQ IRF US USAIO Data Centers AQ (NP) 0109011D US USAJDS Uniphase Corp. AQ JDSU US USALexmark International, Inc. AQ LXK US USALG Display AQ (NP) 034220 KS South KoreaMarvell Technology Group, Ltd. AQ MRVL US USA
Other responding companies
Appendix III - Response status and sector by company
Company name Status for report Ticker Country HQ
Molex Incorporated AQ MOLX US USAQuanta Computer AQ 2382 TT TaiwanSamsung Electro-Mechanics Co., Ltd. AQ (NP) 009150 KS South KoreaTaiyo Yuden Co., Ltd. AQ (NP) 6976 JP JapanTata Consultancy Services AQ (NP) TCS IN IndiaTech Mahindra AQ TECHM IN IndiaTeradyne Inc. AQ TER US USA
Materials
AkzoNobel AQ AKZA NA NetherlandsAquarius Platinum AQ AQP AU BermudaBraskem S/A AQ (NP) BRKM3 BZ BrazilCatalyst Paper Corporation AQ CTL CN CanadaChina Steel AQ 2002 TT TaiwanCia. Siderurgica Nacional - CSN AQ (NP) CSNA3 BZ BrazilCroda International AQ CRDA LN United KingdomDaicel Corporation AQ (NP) 4202 JP JapanDS Smith Plc AQ SMDS LN United KingdomDuratex S/A AQ DTEX3 BZ BrazilFIRMENICH SA AQ 4282549Z SwitzerlandGivaudan SA AQ GIVN VX SwitzerlandGoldcorp Inc. AQ G CN CanadaHitachi Chemical Company, Ltd. AQ 4217 JP JapanHudBay Minerals Inc. AQ HBM CN CanadaHyundai Steel AQ (NP) 004020 KS South KoreaIAMGOLD Corporation AQ (NP) IMG CN CanadaImerys AQ (NP) NK FP FranceIsrael Chemicals AQ ICL IT IsraelJSW Steel AQ JSTL IN IndiaKemira Corporation AQ KRA1V FH FinlandKlabin S/A AQ KLBN4 BZ BrazilKoninklijke DSM AQ DSM NA NetherlandsLG Chem AQ (NP) 051910 KS South KoreaLynas Corporation AQ LYC AU AustraliaMahindra Sanyo Special Steel Pvt. Ltd AQ 0821582D IN IndiaMetsä Board AQ METSB FH FinlandNorsk Hydro AQ NHY NO NorwayPanAust AQ (NP) PNA AU AustraliaResolute Forest Products Inc. AQ 5150998Q CN CanadaScaw South Africa (pty) Ltd AQ (NP) 0325554D SJ South AfricaSK Chemicals AQ (NP) 006120 KS South KoreaSmurfit Kappa Group PLC AQ SKG ID IrelandSolvay S.A. AQ SOLB BB BelgiumStora Enso Oyj AQ (NP) STERV FH FinlandTata Chemicals AQ TTCH IN IndiaTata Steel AQ TATA IN IndiaTeck Resources Limited AQ TCK/B CN CanadaToyobo Co., Ltd. AQ 3101 JP JapanUPM-Kymmene Corporation AQ (NP) UPM1V FH Finland
Telecommunication Services
AT&T Inc. AQ T US USASprint Nextel Corporation AQ S US USA
Utilities
ACCIONA S.A. AQ ANA SM SpainColbun SA AQ (NP) COLBUN CI ChileEDP - Energias de Portugal S.A. AQ EDP PL PortugalHK Electric Investments AQ 2638 HK Hong KongKorea East-West Power AQ (NP) KEWSPO KS South KoreaRWE AG AQ RWE GR GermanySnam S.P.A AQ SRG IM Italy

5150
Appendix IV - Investor signatories
3Sisters Sustainable Management LLCAberdeen Asset ManagementABRAPP - Associação Brasileira das Entidades Fechadas de Previdência ComplementarAchmea BVACTIAMActive Earth Investment ManagementAcuity Investment ManagementAddenda Capital Inc.Advanced Investment PartnersAdvantage Asset Managers (Pty) LtdAEGON-INDUSTRIAL Fund Management Co., LtdAK PORTFÖY YÖNETİMİ A.Ş.Alberta Investment Management Corporation (AIMCo)Alberta Teachers Retirement FundAlcyone FinanceAllenbridgeEpic Investment AdvisersAlliance TrustAllianz Elementar Versicherungs-AGAllianz Global Investors AGAllianz GroupAltira GroupAmpegaGerling Investment GmbHAmundi AMAntera Gestão de Recursos S.A.APG GroupAppleseed FundApsara Capital LLPArisaig PartnersArjuna CapitalAs You SowASB Community TrustASM Administradora de Recursos S.A.ASN BankAssicurazioni Generali SpaATI Asset ManagementAtlantic Asset Management Pty LtdAustralian Ethical InvestmentAustralianSuperAvaron Asset Management ASAvivaAviva InvestorsBAE Systems Pension SchemeBaillie Gifford & Co.BaltCapBanco Comercial Português SABanco do Brasil PrevidênciaBanco do Brasil S/ABanco Espírito Santo SABanco Nacional de Desenvolvimento Economico e Social (BNDES)Banco Popular EspanolBanco SabadellBanco SantanderBanesprev – Fundo Banespa de Seguridade SocialBANIF SABank of AmericaBank J. Safra Sarasin AGBank VontobelBankhaus Schelhammer & Schattera Kapitalanlagegesellschaft m.b.H.BankinterBanque DegroofBanque Libano-FrançaiseBarclaysBasellandschaftliche KantonalbankBASF Sociedade de Previdência ComplementarBaumann and Partners S.A.Bayern LBBayernInvest Kapitalanlagegesellschaft mbH
BBC Pension Trust LtdBBVABedfordshire Pension FundBeetle CapitalBefimmo SABentall KennedyBerenberg BankBlom Investment BankBlumenthal FoundationBNP Paribas Investment PartnersBoston Common Asset Management, LLCBP Investment Management LimitedBreckinridge Capital AdvisorsBritish Airways PensionsBritish Coal Staff Superannuation SchemeBC Investment Management CorporationBrown AdvisoryBSW Wealth PartnersBT Financial GroupBT Investment ManagementCAAT Pension PlanCadiz Holdings LimitedCAI Corporate Assets International AGCaisse de dépôt et placement du QuébecCaisse des DépôtsCaixa de Previdência dos Funcionários do Banco do Nordeste do Brasil (CAPEF)Caixa Econômica FederalCaixa Geral de DepósitosCalifornia Public Employees' Retirement System (CalPERS)California State Teachers' Retirement System (CalSTRS)California State TreasurerCalvert Investment Management, IncCanada Pension Plan Investment Board (CPPIB)Canadian Labour Congress Staff Pension FundCAPESESPCapital Innovations, LLCCapricorn Investment GroupCareSuperCaser Pensiones E.G.F.PCatherine Donnelly FoundationCatholic SuperCBRE Group, Inc.Cbus Superannuation FundCCLA Investment Management LtdCDF Asset ManagementCedrus Asset ManagementCeleste Funds ManagementCentral Finance Board of the Methodist ChurchCeresChange Investment ManagementQuilter Cheviot Asset ManagementCTBC Financial Holding Co., LtdChristian Brothers Investment Services Inc.Christian SuperChristopher Reynolds FoundationChurch Commissioners for EnglandChurch of England Pensions BoardCleantech Invest AGClearBridge InvestmentsClimate Change Capital Group LtdCM-CIC Asset ManagementColonial First State Global Asset Management LimitedComgestComite syndical national de retraite BâtirenteCommInsureCommonwealth Bank of AustraliaCommonwealth Superannuation CorporationCompton Foundation, Inc.Concordia Versicherungs-Gesellschaft a.G.Confluence Capital Management LLCConnecticut Retirement Plans and Trust FundsConser InvestCo-operative Asset ManagementCo-operative Financial Services (CFS)Crayna Capital, LLCCredit Agricole
Daegu BankDaesung Capital ManagementDaiwa Securities Group Inc.Dalton Nicol ReidDana Investment Advisorsde Pury Pictet Turrettini & Cie S.A.DekaBank Deutsche GirozentraleDelta Lloyd Asset ManagementDemeter PartnersDeutsche Bank AGDevelopment Bank of Japan Inc.Candriam Investors GroupDIP - Danske civil- og akademiingeniørers PensionskasseDLM INVISTA ASSET MANAGEMENT S/ADomini Social Investments LLCDongbu InsuranceDoughty Hanson & Co.Earth Capital Partners LLPEast Capital ABEcclesiastical Investment ManagementEcofi Investissements - Groupe Credit CooperatifEdward W. Hazen FoundationEEA Group LtdEkoElan Capital PartnersElement Investment ManagersEnvironment Agency Active Pension fundEnvironmental Investment Services AsiaEpworth Investment ManagementEquilibrium Capital Groupequinet Bank AGErik Penser FondkommissionErste Asset ManagementErste Group Bank AGEssex Investment Management Company, LLCESSSuperEthos FoundationEtica SGREureka Funds ManagementEurizon Capital SGR S.p.A.Evangelical Lutheran Church in Canada Pension Plan for Clergy and Lay WorkersEvangelical Lutheran Foundation of Eastern CanadaEvangelisch-Luth. Kirche in BayernF&C Asset ManagementFAELCE – Fundacao Coelce de Seguridade SocialFAPERS- Fundação Assistencial e Previdenciária da Extensão Rural do Rio Grande do SulFederal FinanceFédéris Gestion d'ActifsFIDURA Capital Consult GmbHFIM Asset Management LtdFIM ServicesFinance S.A.Financiere de l'EchiquierFIPECq - Fundação de Previdência Complementar dos Empregados e Servidores da FINEP, do IPEA, do CNPqFirst Affirmative Financial NetworkFirst Commercial BankFirst State InvestmentsFirstrand LimitedFive Oceans Asset ManagementFlorida State Board of Administration (SBA)FolketrygdfondetFolksamFondation de LuxembourgFondo Pensione Gruppo Intesa Sanpaolo - FAPAFonds de Réserve pour les Retraites – FRRForma Futura Invest AGFRANKFURT-TRUST Investment Gesellschaft mbHFriends Fiduciary CorporationFukoku Capital Management IncFUNCEF - Fundação dos Economiários FederaisFundação AMPLA de Seguridade Social - BrasiletrosFundação Atlântico de Seguridade SocialFundação Banrisul de Seguridade Social
Fundação de Assistência e Previdência Social do BNDES - FAPESFundação Forluminas de Seguridade Social - FORLUZFundação Itaipu BR - de Previdência e Assistência SocialFundação Promon de Previdência SocialFundação Rede Ferroviaria de Seguridade Social – ReferFundação Vale do Rio Doce de Seguridade Social - VALIAFUNDIÁGUA - FUNDAÇÃO DE PREVIDENCIA COMPLEMENTAR DA CAESBFuturegrowth Asset ManagementGameChange Capital LLCGemway AssetsGeneral Equity Group AGGenerali Deutschland Holding AGGeneration Investment ManagementGerman Equity Trust AGGlobal Forestry Capital S.a.r.l.Globalance BankGLS Gemeinschaftsbank eGGOOD GROWTH INSTITUT für globale Vermögensentwicklung mbHGood SuperGovernance for OwnersGovernment Employees Pension Fund (“GEPF”), Republic of South AfricaGPT GroupGreater Manchester Pension FundGreen Cay Asset ManagementGreen Century Capital ManagementGROUPAMA EMEKLİLİK A.Ş.GROUPAMA SİGORTA A.Ş.Groupe Crédit CoopératifGroupe Investissement Responsable Inc.GROUPE OFI AMGrupo Santander BrasilGruppo Monte PaschiHarbour Asset ManagementHarrington Investments, IncHauck & Aufhäuser Asset Management GmbHHazel Capital LLPHealthcare of Ontario Pension Plan (HOOPP)Helaba Invest Kapitalanlagegesellschaft mbHHenderson Global InvestorsHermes Fund ManagersHESTA SuperHIP InvestorHolden & PartnersHSBC Holdings plcHumanisHyundai Marine & Fire Insurance Co., Ltd.Hyundai Securities Co., Ltd.IBK SecuritiesIDBI Bank LtdIllinois State Board of InvestmentIlmarinen Mutual Pension Insurance CompanyImpax Asset Management Group plcIndependent Planning GroupIndustrial Bank of KoreaIndustrial Development CorporationInflection Point Capital ManagementING GroupInsight Investment Management (Global) LtdInstituto Infraero de Seguridade Social - INFRAPREVInstituto Sebrae De Seguridade Social - SEBRAEPREVIntegre Wealth Management of Raymond JamesInterfaith Center on Corporate Responsibility (ICCR)IntReal KAGInvestec plcInvesting for GoodInvestor Environmental Health NetworkIrish Life Investment ManagersJessie Smith Noyes FoundationJMEPS Trustees LimitedJPMorgan Chase & Co.Jubitz Family Foundation
Jupiter Asset ManagementKagiso Asset ManagementKaiser Ritter Partner Privatbank AG (Schweiz)KB Kookmin BankKBC Asset Management NVKCPS and CompanyKDB Asset Management Co., Ltd.Kepler CheuvreuxKEPLER-FONDS Kapitalanlagegesellschaft m. b. H.KEVAKeyCorpKfW BankengruppeKillik & Co LLPKiwi Income Property TrustKleinwort Benson InvestorsKLP InsuranceKorea Technology Finance CorporationKPA PensionLa Banque Postale Asset ManagementLa Financiere ResponsableLampe Asset Management GmbHLBBW Asset Management Investmentgesellschaft mbHLD Lønmodtagernes DyrtidsfondLegal and General Investment ManagementLegg Mason, Inc.LGT Capital Management Ltd.LGT Capital PartnersLight Green Advisors, LLCLimestone Investment ManagementLiving Planet Fund Management Company S.A.Lloyds Banking GroupLocal Authority Pension Fund ForumLocal Government SuperLOGOS PORTFÖY YÖNETIMI A.Ş.London Pensions Fund AuthorityLothian Pension FundLUCRF SuperMainFirst Bank AGMAMA Sustainable Incubation AGMAPFREMaple-Brown AbbottMarc J. Lane Investment Management, Inc.Maryknoll SistersMaryland State TreasurerMatrix GroupMcLean BuddenMeeschaert Gestion PrivéeMerck Family FundMercy Investment Services, Inc.Mergence Africa Investments (Pty) LimitedMetallRente GmbHMetzler Investment GmbhMidas International Asset ManagementMiller/Howard InvestmentsMirae Asset Global Investments Co. Ltd.Mirae Asset SecuritiesMissionary Oblates of Mary ImmaculateMistra, Foundation for Strategic Environmental ResearchMitsubishi UFJ Financial Group, Inc.Mitsui Sumitomo Insurance Co.,LtdMizuho Financial Group, Inc.MNMomentum Manager of Managers (Pty) LtdMonega Kapitalanlagegesellschaft mbHMongeral Aegon Seguros e Previdência S.A.Morgan StanleyMTAA Superannuation FundMutual Insurance Company Pension-FenniaNatcan Investment ManagementNathan Cummings Foundation, TheNational Australia BankNational Bank of CanadaNational Grid Electricity Group of the Electricity Supply Pension SchemeNational Grid UK Pension SchemeNational Pensions Reserve Fund of Ireland
National Union of Public and General Employees (NUPGE)Nativus Sustainable InvestmentsNatixis SANatural Investments LLCNedbank LimitedNeedmor FundNelson Capital Management, LLCNeuberger BermanNew Alternatives Fund Inc.New Amsterdam Partners LLCNew ForestsNew Mexico State TreasurerNew Resource BankNew York State Common Retirement Fund (NYSCRF)Newground Social InvestmentNewton Investment Management LimitedNGS SuperNH-CA Asset ManagementNikko Asset Management Co., Ltd.Nipponkoa Insurance Company, LtdNORD/LB Kapitalanlagegesellschaft AGNordea Investment ManagementNorfolk Pension FundNorges Bank Investment Management (NBIM)North Carolina State TreasurerNorthern Ireland Local Government Officers' Superannuation Committee (NILGOSC)Northern TrustNorthStar Asset Management, IncNorthward CapitalNorthwest and Ethical Investments L.P. (NEI Investments)OceanRock Investments Inc.Oddo & Cieoeco capital Lebensversicherung AGÖKOWORLDOMERS Administration CorporationOntario Teachers' Pension PlanOP Fund Management Company LtdOppenheim & Co LimitedOpplysningsvesenets fond (The Norwegian Church Endowment)OPSEU Pension Trust (OP Trust)Oregon State TreasurerOrion Energy SystemsOsmosis Investment ManagementPanahpurPark FoundationParnassus InvestmentsPax World FundsPensioenfonds VervoerPension Protection FundPensionsmyndighetenPeople's Choice Credit UnionPerpetual InvestmentsPETROS - Fundação Petrobras de Seguridade SocialPFA PensionPGGMPhillips, Hager & North Investment Management Ltd.PhiTrust Active InvestorsPictet Asset Management SAPinstripe Management GmbHPioneer InvestmentsPiper Hill Partners, LLCPKAPluris Sustainable Investments SAPNC Financial Services Group, Inc.Pohjola Asset Management LtdPortfolio 21 InvestmentsPREVHAB PREVIDÊNCIA COMPLEMENTARPREVI Caixa de Previdência dos Funcionários do Banco do BrasilPREVIG Sociedade de Previdência ComplementarProgressive Asset Management, Inc.Provinzial Rheinland HoldingPrudential Investment ManagementPsagot Investment House LtdPSP Investments
573 financial institutions with assets of US$60 trillion were signatories to the CDP 2013 water questionnaire dated February 1st 2014

5352
Wisconsin, Iowa, & Minnesota Coalition for Responsible InvestmentWoori BankYork UniversityYouville Provident Fund Inc.Zegora Investment ManagementZevin Asset ManagementZurich Cantonal Bank
Q Capital Partners Co. LtdQBE Insurance GroupQuotient Investors LLCRabobankRaiffeisen Fund Management Hungary Ltd.Raiffeisen Kapitalanlage-Gesellschaft m.b.H.Railpen InvestmentsRathbone Greenbank InvestmentsRCM (Allianz Global Investors)Real Grandeza Fundação de Previdência e Assistência SocialREI SuperRepresentative Body of the Church in WalesRiver Twice Capital Advisors, LLCRoyal London Asset ManagementRobecoRobecoSAM AGRobert & Patricia Switzer FoundationRockefeller Asset ManagementRose Foundation for Communities and the EnvironmentRothschild & Cie Gestion GroupRoyal Bank of CanadaRoyal Bank of Scotland GroupRREEF Investment GmbHRussell InvestmentsSampension KP Livsforsikring A/SSamsung Fire & Marine InsuranceSamsung SecuritiesSanlamSanta Fé Portfolios LtdaSantam LtdSarasin & PartnersSAS Trustee CorporationSchrodersScottish Widows Investment PartnershipSEB Asset Management AGSeligson & Co Fund Management PlcSentinel FundsSERPROS - Fundo MultipatrocinadoService Employees International Union Benefit FundsServite FriarsSeventh Swedish National Pension Fund (AP7)SHARE - Shareholder Association for Research & EducationShinhan BankShinhan BNP Paribas Investment Trust Management Co., LtdShinkin Asset Management Co., LtdSiemens Kapitalanlagegesellschaft mbHSignet Capital Management LtdSisters of St Francis of PhiladelphiaSisters of St. DominicSkandinaviska Enskilda Banken AB (SEB AB)Smith Pierce, LLCSocial(k)Società reale mutua di assicurazioniSocrates Fund ManagementSolaris Investment ManagementSompo Japan Nipponkoa Holdings, IncSonen Capital LLCSopher Investment ManagementSoprise! LLPSouthPeak Investment ManagementSPF Beheer bvSpring Water Asset Management, LLCSprucegrove Investment Management LtdStandard CharteredStandard Chartered Korea LimitedStandard Life InvestmentsState Street CorporationStatewideSuperStocklandStrathclyde Pension FundStratus GroupSuperfund Asset Management GmbHSustainable CapitalSustainable Development Capital LLPSustainable Insight Capital Management
Svenska Kyrkan, Church of SwedenSvenska Kyrkans PensionskassaSwedbankSwift FoundationSwisscanto Holding AGSycomore Asset ManagementSyntrus Achmea Asset ManagementT.SINAİ KALKINMA BANKASI A.Ş.TD Asset Management (TD Asset Management Inc. and TDAM USA Inc.)Telluride AssociationTelstra SuperTerra Global Capital, LLCTerraVerde Capital Management LLCTfL Pension FundThe Brainerd FoundationThe Bullitt FoundationThe Central Church Fund of FinlandThe Children's Investment Fund FoundationThe Clean Yield GroupThe Council of Lutheran ChurchesThe Daly FoundationThe Environmental Investment Partnership LLPThe Joseph Rowntree Charitable TrustThe Korea Teachers PensionThe New SchoolThe Pension Plan For Employees of the Public Service Alliance of CanadaThe Pinch GroupThe Russell Family FoundationThe Sandy River Charitable FoundationThe Sisters of St. AnnThe Sustainability GroupThe United Church of Canada - General CouncilThe University of Edinburgh Endowment FundThe Wellcome TrustThreadneedle Asset ManagementTobamTokio Marine & Nichido Fire Insurance Co., Ltd.Toronto Atmospheric FundTrillium Asset Management, LLCTriodos BankTri-State Coalition for Responsible InvestmentTrusteam FinanceTurner InvestmentsUBI BancaUnion Asset Management Holding AGUnion Investment Privatfonds GmbHUnionenUNISON staff pension schemeUniSuperUnitarian Universalist AssociationUnity CollegeUniversities Superannuation Scheme (USS)Vancity Group of CompaniesVCH Vermögensverwaltung AGVeris Wealth PartnersVermont State TreasurerVexiom Capital, L.P.VicSuperVictorian Funds Management CorporationVIETNAM HOLDING ASSET MANAGEMENT LTD.Vinva Investment ManagementVoigt & CollegenWaikato Community TrustWalden Asset Management, a division of Boston Trust & Investment Management CompanyWARBURG - HENDERSON Kapitalanlagegesellschaft für Immobilien mbHWARBURG INVEST KAPITALANLAGEGESELLSCHAFT MBHWater Asset Management, LLCWespath Investment ManagementWest Yorkshire Pension FundWestfield Capital Management Company, LPWestLB Mellon Asset Management (WMAM)Westpac Banking CorporationWHEB Asset ManagementWhite Owl Capital AG
Appendix IV - Investor signatories
5554
Notes

56
CDP Contacts
Paul DickinsonExecutive Chairman
Paul SimpsonChief Executive Officer
Frances WayCo-Chief Operating Officer
Sue HowellsCo-Chief Operating Officer
Cate LambHead of Water
Morgan GillespyAccount Manager - Water
Sarah RobertsonSenior Program Officer, Water
CDP UKThird Floor, The Quadrant4 Thomas More SquareLondon E1W 1YWTel: +44 (0) 20 7970 5660
CDP Board of Trustees
Chairman: Alan BrownWellcome Trust
James CameronClimate Change Capital & ODI
Ben GoldsmithWHEB
Chris PageRockefeller Philanthropy Advisors
Jeremy Smith
Takejiro Sueyoshi
Tessa Tennant
Martin WiseRelationship Capital Partners
CDP Advisors
Lord Adair Turner
Rear Admiral Neil Morisetti CB
Design and production
www.productionstudios.co.uk
For access to a database of public responses for analysis, benchmarking and learning best practices, please contact [email protected].
This report is available for download from www.cdp.net.
Our sincere thanks are extended to the following
Individuals Constantina Bichta, Isabelle Juillard Thompsen, Jason Morrison, Martin Ginster, Piet Klop, Stuart Orr, William Ambrose
Companies Colgate-Palmolive, Merck
Organizations Bloomberg, Alliance for Water Stewardship, Defra, European Water Partnership, Global Reporting Initiative, IIGC, INCR, Interfaith Center on Corporate Responsibility, Investor Group on Climate Change, National Business Initiative (South Africa), Net Balance Foundation, Norges Bank Investment Management, United Nations Global Compact, United Nations Principles for Responsible Investing, World Resources Institute, WWF