from trades to turbines: the art and science of wind ... wind atlas analysis and application ......
TRANSCRIPT

From Trades to Turbines: The Art and Science ofWind Energy Resource Assessment
Hans E. Jørgensen, Andrea Hahmann, Jake Badger, Niels G. Mortensen and J. Carsten Hansen
Wind Energy Division, Risø DTURoskilde, Denmark
Risø DTU, Technical University of Denmark
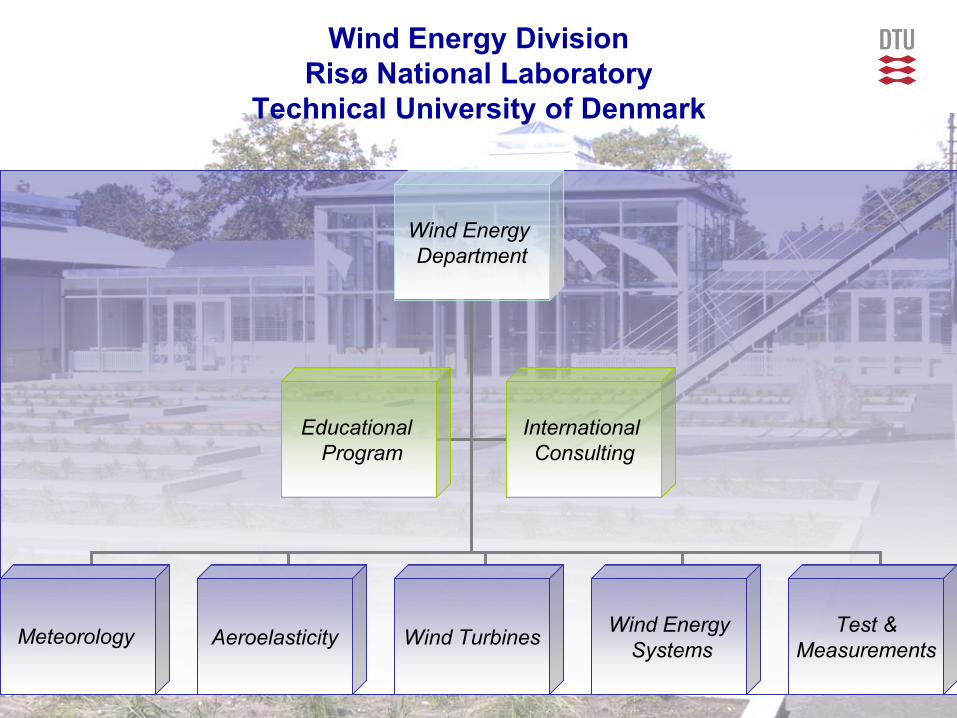
Wind Energy DivisionRisø National Laboratory
Technical University of Denmark
Wind Energy Department
Aeroelasticity Wind Turbines
Educational Program
International Consulting
Wind EnergySystems
Test &MeasurementsMeteorology

Risø DTU, Technical University of Denmark
Outline• Introduction • Wind power resource assessment• Observational wind atlases• Numerical wind atlas – statistical-dynamical downscaling• Examples of recent wind atlases – going the extra step• Preview of future work: dynamical downscaling • Final comments

Risø DTU, Technical University of Denmark
The problemDetermining the wind resources accurately is important and difficult
Main parameters governingwind power economics:• Investment costs• Operation and maintenance costs• Electricity production / Wind resources• Turbine lifetime• Discount rate
• Wind speed, U [m/s]• Kinetic energy flux, P = ½ρU3 [W/m2]• ΔU of 5% (e.g. U=8.0+0.4m/s) ΔP of 15%
• Wind resources are in fact more P than U• Both U and P are statistical distributions• We measure U (and D) in one point in space, butneed it in the entire atmospheric boundary layer

Risø DTU, Technical University of Denmark
Observational wind atlas
Inputs – measured time-series of wind speed and
direction – observed wind climate– terrain topography – elevation, roughness
and obstacles – digitised maps, SRTM, Google Earth
Outputs– generalised regional wind climate for the
specific location Applications
– energy production estimate for wind farms in the region near the meteorological station
• This Regional Wind Climate is the hypothetical wind climate for an ideal, featureless and completely flat terrain with a uniform surface roughness, assuming the same overall atmospheric conditions as those of the measuring position.

Risø DTU, Technical University of Denmark
~500 W/m2
Mean wind~7.5 m/s
Wind resource map for Denmark
The wind atlasis more than asimple map –input “wind climate” files arealso provided

Risø DTU, Technical University of Denmark
Wind atlas study for Mali
WAsP showing a resource map for an area around the Gao measurement site at 100 m resolution.
WAsP calculates wind resource for new sites and heights above ground level.
Gao met. station better turbine site

Risø DTU, Technical University of Denmark
Verification on micro-scale modelsCFD were used to find the 10 positions
The Bolund Experiment and Blind ComparisonBechmann et al.
10

Risø DTU, Technical University of Denmark
11
Z=5m
Z=2m
The Bolund Experiment and Blind ComparisonBechmann et al.
Speed-up along line A

Risø DTU, Technical University of Denmark
Conclusions on CFDThe Blind Comparison
1. Uncertainty of less than 3% - We have a long way! CFD guides would help somewhat.
2. Recommendation: RANS is today's main workhorse, LES has not matured yet.
3. 7 diff. CFD solvers in top 10: The user is more important than the solver.
12The Bolund Experiment and Blind ComparisonBechmann et al.
Risø DTU, Technical University of Denmark
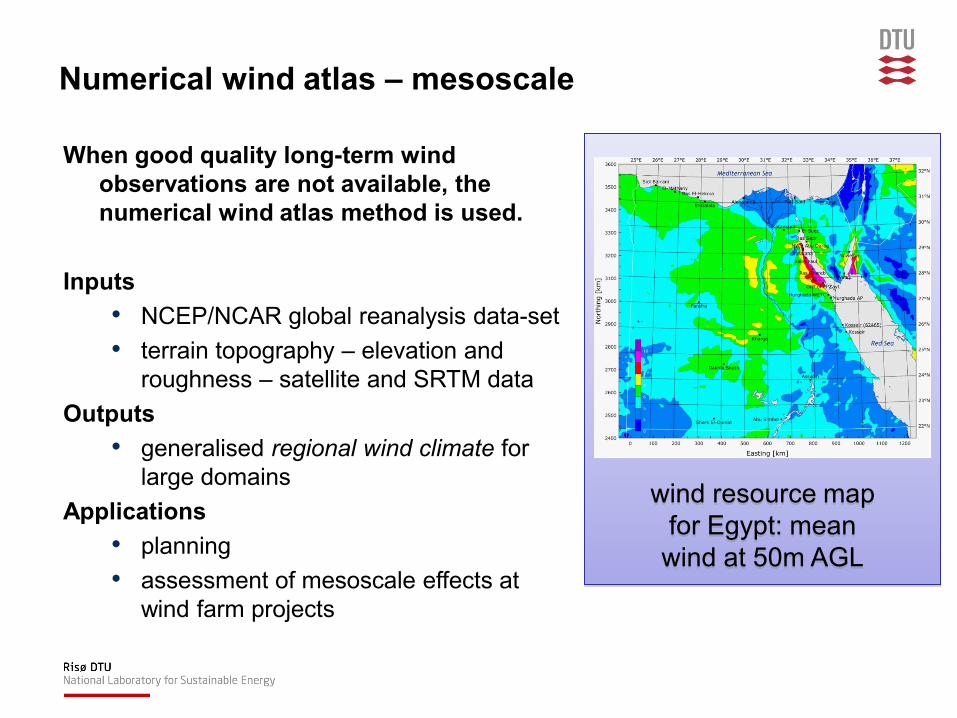
Numerical wind atlas – mesoscale
When good quality long-term wind observations are not available, the numerical wind atlas method is used.
Inputs • NCEP/NCAR global reanalysis data-set• terrain topography – elevation and
roughness – satellite and SRTM dataOutputs
• generalised regional wind climate for large domains
Applications• planning• assessment of mesoscale effects at
wind farm projects
wind resource map for Egypt: mean
wind at 50m AGL

Risø DTU, Technical University of Denmark
Beneficial features of the numerical wind atlas methods developed at RISØ-DTU
• Classification system– statistical-dynamical downscaling methods allow for a much less resource
demanding evaluation of climatological wind resources• full 30-year period: 263000 hours to be simulated• Risø DTU’s KAMM/WAsP method: 900 hours (1/290th full period)• CMA’s WRF method: 14400 hours (1/18th full period)
• Verification method– comparison of modelling based results against measurements provides quality
check– gives an estimate of bias and random errors
• Sensitivity testing and uncertainty estimation– exploration of the most important model parameters– indicates possible sources of errors and targets areas for improvement– may be used to generate associated maps of uncertainty

Risø DTU, Technical University of Denmark
Downscaling model chain
large-scale
~150 wind classes~200 km
Reanalysis dataNCEP/NCA30 years
meso-scale
wind resource maps + generalized wind climate data and maps
~2 – 10 km
micro-scale
wind resource maps + turbine production + wake modelling, …
~1 m – 2 km

Risø DTU, Technical University of Denmark
Orography and roughness length
Risø DTU, Technical University of Denmark
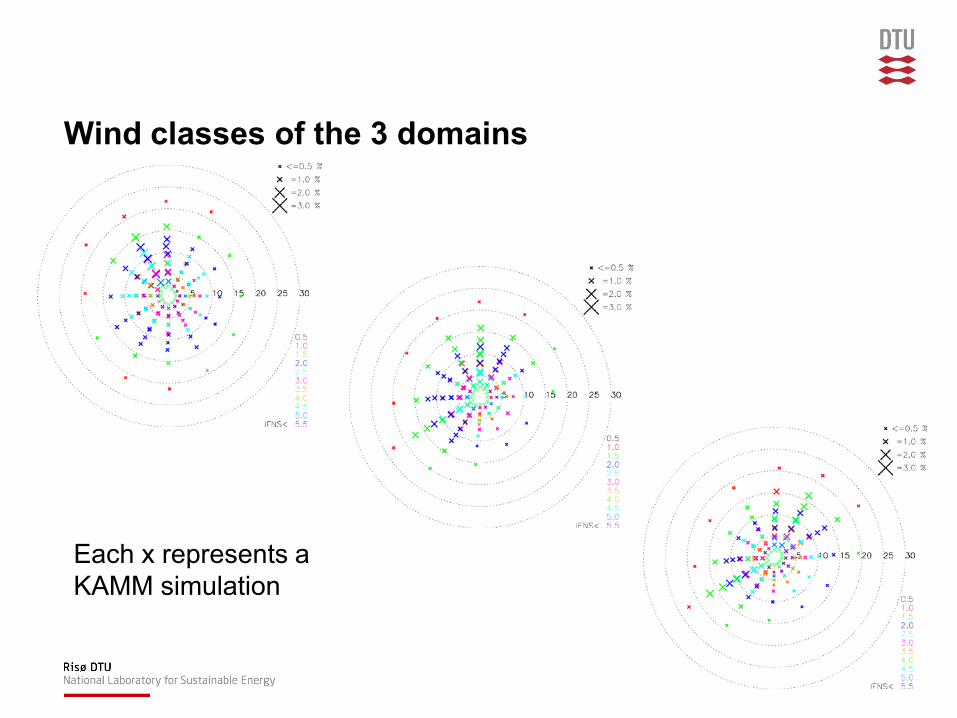
Wind classes of the 3 domains
Each x represents a KAMM simulation

Risø DTU, Technical University of Denmark
Wind resource maps (5 km resolution)wind speed at 100 m
mean simulated wind
• annual mean wind speed for 1978-2007
• wind class weighting from NCEP/NCAR 1978-2007

Risø DTU, Technical University of Denmark
Generalizing wind climatesPost-processing
Example: simulated wind wind corrected to standard conditions
flat terrain with homogeneous roughness (z0 = 3cm)
same roughness flat
~30km
low roughness flat
same roughness orographic speed-up
z0 = 3cmz0 = 0.02 cm

Risø DTU, Technical University of Denmark
Generalized wind maps (5 km resolution)wind speed at 100 m
mean generalized wind
• annual mean wind speed for 1978-2007
• standardized surface conditions
• flat terrain, roughness 3cm everywhere
• wind class weighting from NCEP/NCAR 1978-2007

Risø DTU, Technical University of Denmark
Numerical Wind Atlas - Downscaling steps
G
Global
Local
Global wind resources
Regional
Mesoscale modelingKAMM/WAsPMM5, WRF, etc.
Microscale modeling(WAsP, other
linear/nonlinear models)
KAMM: Karlsruher non-hydrostatic mesoscale model WAsP: Wind Atlas Analysis and Application (widely used wind resource tool)

Risø DTU, Technical University of Denmark
Simple/Fast/Cheap Complex/Slow/Expensive
Risø Wind Atlas
Interpolation Statistical-dynamical
Fully dynamical
wind classes from large
pressure field
wind profiles atmos stab.
terrain elevationsurface roughness
wind maps for eachwind class wind resource map
Mes
osca
leM
odel
+ frequency distributions of wind classes

Risø DTU, Technical University of Denmark
Original mesoscale model domains

Risø DTU, Technical University of Denmark24
The Wind Atlas Method
• Determine the large-scale wind forcing of a region based on long-term, but spatially coarse, dataset.
• Classify the geostrophic wind (and stability) time-series into wind classes
• Use a mesoscale model (KAMM) to determine how topography modifies the large-scale wind defined by each wind class.
125 wind classes for Southern S. Africa – mean sea level geostrophic wind
(NCEP/NCAR reanalysis)
frequency (%)
wind speed (m/s)
Risø DTU, Technical University of Denmark25
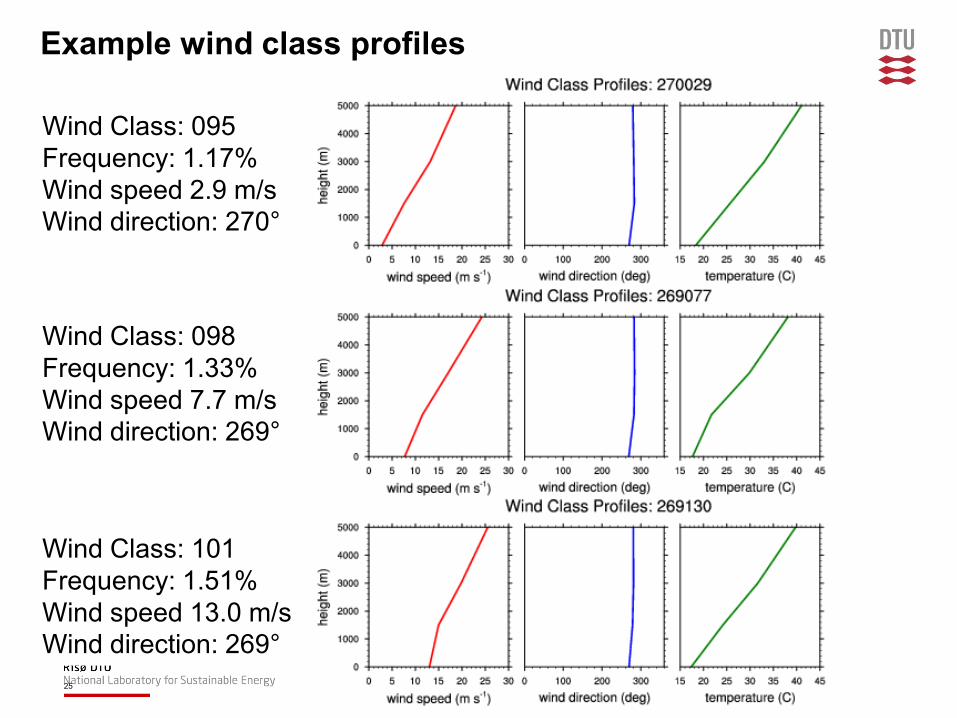
Example wind class profiles
Wind Class: 095Frequency: 1.17%Wind speed 2.9 m/sWind direction: 270°
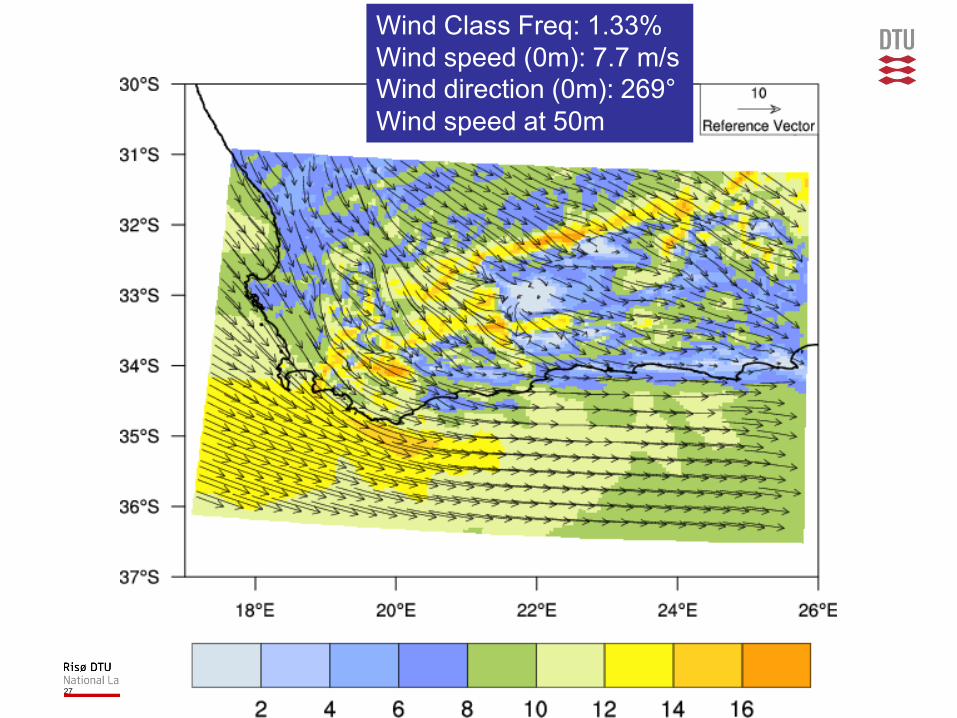
Wind Class: 098Frequency: 1.33%Wind speed 7.7 m/sWind direction: 269°
Wind Class: 101Frequency: 1.51%Wind speed 13.0 m/sWind direction: 269°

Risø DTU, Technical University of Denmark26
Wind Class Freq: 1.17%Wind speed (0m): 2.9 m/sWind direction (0m): 270°Simulated winds at 50m
Risø DTU, Technical University of Denmark27
Wind Class Freq: 1.33%Wind speed (0m): 7.7 m/sWind direction (0m): 269°Wind speed at 50m

Risø DTU, Technical University of Denmark28
Wind Class Freq: 1.51%Wind speed (0m):13.0 m/sWind direction (0m): 269°Wind speed at 50m

Risø DTU, Technical University of Denmark29
Simulated wind climate
= wind speed at z m a.g.l. for wind class i.
= frequency of wind class i, a function of xand y.
= mean wind speed at z m a.g.l.
u (x, y,z) =fi∑ (x, y) ui(x, y,z)
fi(x, y)∑),,( zyxui
),,( zyxu
),( yxfi

Risø DTU, Technical University of Denmark30
Simulated wind climatemean wind speed [m/s] at 50m
Generalized wind climatemean corrected wind speed [m/s] at 50m flat terrain z0=3cm

Risø DTU, Technical University of Denmark31
Validation against observationsErrors at 50m computed from all available observationsU = wind; P = power density
U rms 5%P rms 16%dx = 5km
U rms 10%P rms 34%dx = 2.5km U rms 7%
P rms 17%dx = 5km
Frank, H. P., O. Rathmann, N. G. Mortensen, L. Landberg: The Numerical Wind Atlas – The KAMM/WAsP Method. (2001)
Ireland
Denmark
Portugal

Risø DTU, Technical University of Denmark
Preliminary calculations for South AfricaMean wind speed (m/s) at 50 m
unverified output, do not use these numbers

Risø DTU, Technical University of Denmark
Preliminary calculations for South AfricaMean wind speed (m/s) at 50 m
unverified output, do not use these numbers

Risø DTU, Technical University of Denmark
Preliminary calculations for South AfricaMean wind speed (m/s) at 50 m
unverified output, do not use these numbers

Risø DTU, Technical University of Denmark
Resolution is key in applications

Risø DTU, Technical University of Denmark
Mesoscale vs. Microscale – effect of model resolution
• KAMM wind resource map only• Grid cell size 5120 m• Wind farm of five 2 MW turbines• Estimated AEP = 39 GWh
• KAMM/WAsP wind resource map• Grid cell size 20 m• Wind farm of five 2 MW turbines• Estimated AEP = 55 GWh

Risø DTU, Technical University of Denmark
Comparing area wind power density
• wind power density [W/m**2] at 50 m a.g.l.
• contours at 0.95 and 0.05 full range of 10 km results

Risø DTU, Technical University of Denmark
Power density fractile plot
Big differences in whole area mean, related to the variance
of the wind speed within the test area
Very large (~100%)
enhancement for the
microscale modelling for windy fractile
Wind power density at 50 m a.g.l.

Risø DTU, Technical University of Denmark
Wind Atlas for NE China (Dongbei)
21-aug-2008Title of the presentati
41
• Some text about the atlas

Risø DTU, Technical University of Denmark
Simple/Fast/Cheap Complex/Slow/Expensive
Risø Wind Atlas
Interpolation Statistical-dynamical
Fully dynamical
wind classes from large scale wind
wind profiles atmos stab.
terrain elevationsurface roughness
wind maps for eachwind class wind resource map
Mes
osca
leM
odel
+ frequency distributions of wind classes

Risø DTU, Technical University of Denmark
Simple/Fast/Cheap Complex/Slow/Expensive
Risø Wind Atlas
Interpolation Statistical-dynamical
Fully dynamical
wind resource map
entire collection of large-scale atmos. conditions
wind maps for everylarge-scale day
MO
DEL
Dynamical downscaling

Risø DTU, Technical University of Denmark
Linear interpolation
Risø DTU, Technical University of Denmark
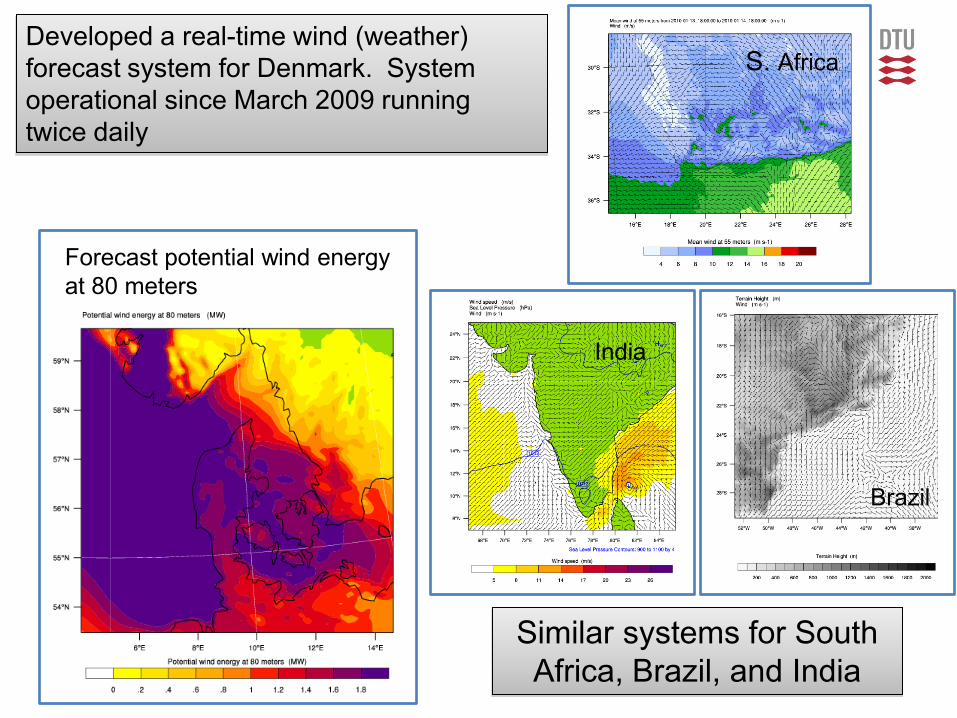
Developed a real-time wind (weather) forecast system for Denmark. System operational since March 2009 running twice daily
Forecast potential wind energy at 80 meters
Similar systems for South Africa, Brazil, and India
India
S. Africa
Brazil

Risø DTU, Technical University of Denmark
Verification of WRF real-time wind forecast system over Denmark
WRF topography and configurationΔx = 18, 6 and 2km 10-meter wind speed mean error (WRF-OBS) for
the months of June and October 2009
daytime nighttime

Risø DTU, Technical University of Denmark
Verification at Høvsøre test site, 116 m mast
WRF grid pointused in verification
Høvsøremast
OBS10 m
WRF10 m
OBS100 m
WRF100 m
Wind speed distributions at 10 and 100 meters
OBS100 m
WRF100 m
Computed from all 4-27 hour forecasts (1200 UTC run)May – October 2009

Risø DTU, Technical University of Denmark
Verification at Høvsøre test site
Comparison of profiles from the flat andhomogeneous sector (minimize site effects) at Høvsøre
Averaged diurnal cycleof various quantities
U2/U1=(z2/z1)α
U10
U100
u*
heatflux

Risø DTU, Technical University of Denmark
Conclusions• The method used to generate mesoscale wind atlas is presented.• Preliminary, unverified modeling results for South Africa are
presented. • The importance of downscaling mesoscale results to the
microscale is emphasized.• The dynamical downscaling method is introduced• Validation results of mesoscale weather forecasts for Denmark
illustrate the difficulties in modeling the vertical wind profile.
East London – 01Sep2008 Risø National Laboratory • Technical
U i it f D k

Risø DTU, Technical University of Denmark
The goal…
Thanks to Niels Mortensen

Risø DTU, Technical University of Denmark
End of story
Thanks to Niels Mortensen

Risø DTU, Technical University of DenmarkWAsPEngineering Course November 2007
After the end off story Site assessment in IEC 61400-1
Checklist• Extreme winds • Shear of vertical wind profile• Flow inclination• Background turbulence• Wake turbulence• Wind-speed distribution
Class Vref
I 50 m/s
II 42.5 m/s
III 37.5 m/s
IV* 30 m/s
S Designer specifies