from the western boundary currents to the pacific...
TRANSCRIPT

From the western boundary currents to the Pacific EquatorialUndercurrent: Modeled pathways and water mass evolutions
Mélanie Grenier,1 Sophie Cravatte,1,2 Bruno Blanke,3 Christophe Menkes,4,5
Ariane Koch-Larrouy,1,2 Fabien Durand,1,6 Angélique Melet,7 and Catherine Jeandel1,8
Received 29 July 2011; revised 21 October 2011; accepted 25 October 2011; published 30 December 2011.
[1] The hydrological and geochemical properties of the waters constituting the PacificEquatorial Undercurrent (EUC) determine the properties of the equatorial cold tongue.Understanding and quantifying the various EUC origins is therefore of prime importance.For this purpose, a high-resolution (1/4°) interannual oceanic simulation was analyzedfrom the western tropical Pacific boundaries to 140°W, using a Lagrangian framework.Waters from the Low-Latitude Western Boundary Currents (LLWBCs) transiting fromVitiaz Strait (the main contributor), from Solomon Strait, and via the Mindanao Currentwere identified as the principal sources to the EUC. Waters conveyed by the interior oceanoff equator are negligible till 180°E. The LLWBCs’ waters represent 87% of the EUCtransport at 156°E out of which the New Guinea Coastal Undercurrent (NGCU) is as largeas 47%. The EUC meridional distribution suggests that the waters originating fromSolomon Strait and Mindanao Current mostly remain in the hemisphere from which theyoriginate. Contrastingly, Vitiaz Strait waters are found in both hemispheres. The verticalEUC distribution shows that the lower layer of the EUC is mainly composed of VitiazStrait waters. Finally, the source transport distributions were characterized, at theirorigin and within the EUC, as a function of density. These distributions showed thatwaters flowing through Vitiaz Strait at densities higher than those of the EUC (down tosq = 27.2 kg m�3) undergo a diapycnal mixing and lighten during their journey to join theEUC. This lightening supports the suggestion that the NGCU is a major source for theEUC geochemical enrichment.
Citation: Grenier, M., S. Cravatte, B. Blanke, C. Menkes, A. Koch-Larrouy, F. Durand, A. Melet, and C. Jeandel (2011), Fromthe western boundary currents to the Pacific Equatorial Undercurrent: Modeled pathways and water mass evolutions, J. Geophys.Res., 116, C12044, doi:10.1029/2011JC007477.
1. Introduction
[2] Along the equatorial Pacific, the Equatorial Under-current (EUC) flows eastward as a powerful narrow tongue,salty and oxygenated, from north of Papua New Guinea(PNG) to the coast of South America [e.g., Johnson et al.,2002]. The EUC is 500 km wide, centered on the 200 mdepth in the western part of the basin, and then it graduallyshoals along its 14,000 km pathway. It upwells in the easternequatorial Pacific into the overlying South Equatorial
Current (SEC) and diverges from the equator. The EUCtransports a variety of density horizons (approximately from23 to 26.5 kg m�3) and other properties [Tsuchiya et al.,1989; Gouriou and Toole, 1993]. It is the main source ofwater masses upwelled in the equatorial cold tongue in thecentral eastern Pacific.[3] In terms of biogeochemistry, the equatorial Pacific
upwelling supports � 20% of the world’s primary produc-tion [Chavez and Barber, 1987; Chavez and Toggweiler,1995], but it is also a high-nutrient, low-chlorophyll(HNLC) region, a characterization arising from the relativelylow-chlorophyll content compared to what would beexpected from the high concentration of macronutrients. Theconsensus is that the region is limited by micronutrients,among which iron seems to be the main limitation [Martinet al., 1994; Murray et al., 1994; Gordon et al., 1997;Landry et al., 1997]. Although the EUC is possibly the mainmicronutrient conveyor to the equatorial Pacific, data arestill lacking to completely characterize its role on the ironfluxes supporting primary production in the equatorialupwelling [Gordon et al., 1997; Slemons et al., 2009, 2010].[4] The transports of EUC water in the central eastern
Pacific are known to be dependent on the EUC sources.
1LEGOS, Université de Toulouse, UPS, OMP-PCA, Toulouse, France.2LEGOS, IRD, Toulouse, France.3Laboratoire de Physique des Océans, UMR 6523, CNRS/IFREMER/
IRD/UBO, Université de Bretagne Occidentale, UFR Sciences, Brest,France.
4LOCEAN, UPMC/IRD/CNRS/MNHN, Université Pierre et MarieCurie, Paris, France.
5LOCEAN-IRD Nouméa, Nouméa, New Caledonia.6LEGOS-IRD Nouméa, Nouméa, New Caledonia.7LEGI, UMR 5519, CNRS, Université de Grenoble, Grenoble, France.8LEGOS, CNRS, Toulouse, France.
Copyright 2011 by the American Geophysical Union.0148-0227/11/2011JC007477
JOURNAL OF GEOPHYSICAL RESEARCH, VOL. 116, C12044, doi:10.1029/2011JC007477, 2011
C12044 1 of 16

Improving our knowledge about the EUC sources and theirhydrological and geochemical properties is important fortwo reasons. First, water masses conveyed by this current areprimary constituents of the equatorial thermocline watersand are therefore suspected to play a crucial role in climatevariations and in modulation of the ENSO (El Niño South-ern Oscillation) cycle. Indeed, on the one hand, it has beensuggested that the EUC is advecting spiciness anomalies(density-compensating temperature and salinity anomalies)formerly subducted in the subtropics. These anomalies mayeventually contribute to the decadal changes observed in thestructure of the equatorial pycnocline and partly explain theobserved decadal variability of ENSO [e.g., Schneider,2004]. On the other hand, variations of EUC transport maylead to variations of nutrient supplies to the photic layer[Ryan et al., 2006; Slemons et al., 2009; Gorgues et al.,2010], therefore modifying key elements of the food websuch as the primary production of the HNLC area andinvolving climatic and economic (fisheries) consequences.[5] The main pathways of the EUC water sources have
been previously studied. As a summary, Figure 1 presents aschematic view of the circulation in the western tropicalPacific, building on Figure 1 from Fine et al. [1994] andKashino et al. [2007] and Plate 2 from Schott et al. [2004].EUC water sources are mainly subducted in the subtropicsand advected by meridional convergence in the pycnoclinefollowing either an interior oceanic pathway [Johnson andMcPhaden, 1999; Schott et al., 2004] or the Low-LatitudeWestern Boundary Currents (LLWBCs) [Tsuchiya et al.1989; Fine et al., 1994]. The LLWBCs converge in thewestern equatorial Pacific, where the circulation is compli-cated (Figure 1). From the north, the Mindanao Current(MC) flows southward along the Philippine Islands [Wijffelset al., 1995; Kashino et al., 2007] and feeds the Indonesian
Throughflow, the North Equatorial Countercurrent (NECC)and the EUC [Fine et al., 1994]. From the south, a doubleboundary current system flows through and east of the Sol-omon Sea [Melet et al., 2010a; Cravatte et al., 2011]. Themain branch, the New Guinea Coastal Undercurrent(NGCU), flows northwestward along PNG, exiting the Sol-omon Sea through Vitiaz Strait [Lindstrom et al., 1987;Tsuchiya et al., 1989; Ueki et al., 2003]. The second branch,the New Ireland Coastal Undercurrent (NICU) flows alongthe eastern coast of New Ireland [Butt and Lindstrom, 1994;Melet et al., 2010a]. It is fed by the current flowing throughSolomon Strait, by the SEC and potentially by a westernboundary current flowing along the Solomon Islands, theSolomon Island Coastal Undercurrent (SICU), described byMelet et al. [2010a]. These authors found that, climatologi-cally, half of the NICU turns westward in the Bismarck Seato join the NGCU, and half directly retroflects into the EUC.This retroflection would be the most direct route for sub-tropical thermocline water on its way to the equator via thewestern boundary.[6] More quantitatively, several model studies [Blanke
and Raynaud, 1997; Rodgers et al., 2003; Fukumori et al.,2004; Goodman et al., 2005] estimated that 2/3 of theEUC sources are located in the southern Pacific and 1/3 inthe northern Pacific. Using climatological simulations,Blanke and Raynaud [1997] estimated that more than 60%of the southern supply flows along the southwesternboundaries. The global climate model used by Goodmanet al. [2005] suggested that, seasonally, more than half ofthe Pacific EUC at 140°W originates south of the equator.These authors also concluded that LLWBCs were majorcontributors to the EUC flow, transporting 3/4 of the EUCwaters. In contrast, Izumo et al. [2002] found a more bal-anced contribution from both hemispheres, when modeling
Figure 1. Schematic map of the major surface currents (solid arrows) and subsurface currents (dashedarrows) in the western tropical Pacific Ocean: westward North Equatorial Current (NEC) and South Equa-torial Current (SEC); equatorward Mindanao Current (MC), New Guinea Coastal Undercurrent (NGCU),New Ireland Coastal Undercurrent (NICU), and Solomon Island Coastal Undercurrent (SICU); and east-ward Hiri Current (HC), North and South Subsurface Countercurrents (NSCC and SSCC), North andSouth Equatorial Countercurrents (NECC and SECC), and Equatorial Undercurrent (EUC). The MindanaoEddy (ME), the Halmahera Eddy (HE), and the New Guinea Eddy (NGE) are also shown. Vitiaz andSolomon Straits and the St. George’s Channel are identified in red.
GRENIER ET AL.: PACIFIC MODELED PATHWAYS AND WATER MASS EVOLUTIONS C12044C12044
2 of 16

the sources of the EUC outcropping water during the rapidtransition between El Niño and La Niña events, in May1998.[7] Several questions remain concerning the EUC sources.
Most of the previous numerical studies defined the southernLLWBCs as a broad region west of 160°E, without distin-guishing the NGCU from the NICU. Differentiating theseroutes may be important for the EUC in several ways. First,the longitude at which waters join the EUC, as well as theirtransit time, may change depending on the sources withpotential repercussions on the rapidity of the equatorialresponse to changes in the southwest Pacific circulation.Also, whether waters transit or not through the Solomon Seais important for the definition of the equatorial water massgeochemical properties. Indeed, the PNG coast has beenhypothesized to be the primary source of micronutrients forthe deeper layers of the EUC [Mackey et al., 2002]. Lacanand Jeandel [2001] suggested that NGCU waters wereenriched in lithogenic inputs by dissolution of continentalmaterial as they flowed along the PNG slope. This hypoth-esis was confirmed by Slemons et al. [2010, also Particulateiron, aluminium and manganese in the Pacific equatorialundercurrent and low latitude western boundary currentsources, submitted toMarine Chemistry, 2011], who showedhigh concentrations of total dissolvable iron and particulateiron in the western equatorial Pacific, decreasing eastwardbut persisting to 140°W in the lower EUC. Hence, under-standing the role and routes of the respective sources of theEUC waters is of crucial importance in understanding theconcentrations of micro and macronutrients supporting pri-mary production in the eastern Pacific.[8] Surprisingly enough, little is known about (1) the
distribution of these hydrographic sources within the EUC,(2) the evolution of this distribution from the western to thecentral equatorial Pacific, and (3) the densities of the sourcesfeeding the EUC. While some hypotheses have been madeon the basis of water mass hydrological properties [e.g.,Tsuchiya et al., 1989], the lack of observational data over along time range prevents precise determination of the abovementioned processes. In order to circumvent that problem,realistic numerical modeling seems a particularly useful toolfor studying the various sources of the EUC.[9] This study will specifically address the following
questions: how do the northern and southern hemispheresources organize to shape the EUC waters along its path tothe eastern Pacific? Which density layers are conveyed fromeach source within the EUC? Our results will help improveour characterization of the biogeochemical supply towardthe eastern equatorial upwelling region.[10] The present study focuses on the sources of the EUC
along its pathway from 156°E to 140°W, using a 1/4° reso-lution Ocean General Circulation Model (OGCM) and aquantitative Lagrangian analysis. The absolute and relativecontributions of the various sources composing the EUCwere investigated in order to improve our knowledge aboutthe fate of the water masses conveyed by the LLWBCs thatpotentially carry an important part of the nutrients to theHNLC area.[11] Section 2 describes the numerical tools used in this
study. The EUC sources and related transports from 156°Eto 140°W are presented in section 3 as well as the distri-bution of the various sources within the EUC at 165°E.
Section 4 focuses on the water density characterization ofthe EUC sources downstream and within the EUC at 165°E.We discuss the results and conclusions in section 5.
2. Methodology
2.1. The OGCM
2.1.1. Description[12] We used the global interannual reference simulation
(47 years, from 1958 to 2004) of the DRAKKAR project,referred to as “ORCA025-G70” [Barnier et al., 2006]. Themodel had a 0.25° eddy-permitting horizontal resolution.The vertical grid had 46 levels, with a resolution rangingfrom 6 m near the surface to 250 m at 5750 m. The depth ofthe bottom cell was variable (the so-called “partial-step”)and was adjusted to match the true depth of the ocean for abetter representation of small topographic slopes. The dif-fusion of tracers was performed along isopycnal surfacesthrough a Laplacian operator while dissipation of momen-tum was performed along geopotential surfaces using abiharmonic operator. The horizontal eddy viscosity anddiffusivity coefficients were 300 m2 s�1 and �1.5 1011 m4
s�2 at the equator, respectively. They decreased polewardproportionally to the size and the cubic size of the modelgrid cells, respectively. The vertical eddy viscosity and dif-fusivity coefficients were computed from a 1.5-order turbu-lent closure scheme based on a prognostic equation for theturbulent kinetic energy (TKE) [Blanke and Delecluse,1993] and a diagnostic equation for the dissipation andmixing turbulent length scales.[13] Surface wind stresses and heat fluxes were computed
from the CORE bulk formulae [Large and Yeager, 2004],which used data from ERA40 [Uppala et al., 2005] for years1958 to 2001, and ECMWF analysis for years 2002–2004.The change in 2002 resulted in a spurious adjustment of theupper ocean especially in the tropics [Molines et al., 2006].To avoid this problem in our study, we limited our analysisto the end of 2001. The initial conditions for temperature andsalinity were derived from Levitus et al.’s [1998] climato-logical data set for midlatitudes and low latitudes. Modeloutputs consisted of 5 day means. Note that with this spatialresolution, the St. George’s Channel in the BismarckArchipelago was closed and Vitiaz Strait was 630 m deepand 55 km wide at the surface. The ORCA025-G70 simu-lation has been widely used (http://www.drakkar-ocean.eu/)and we refer the reader to Molines et al. [2006] for moredetails on the simulation.2.1.2. Validation[14] The realism of our simulation was first assessed by
comparing the simulated currents to observations. Along thePNG coast, current observations were available from amooring deployed during a 5 year period from 1995 to 2000[Ueki et al., 2003]. At the equator, zonal current observa-tions were available from the TAO-TRITON array [Hayeset al., 1991; McPhaden, 1988]. At some equatorial sites(147°E, 156°E, 165°E, 170°W, 140°W and 110°W),acoustic Doppler current profilers (ADCP) and/or mechani-cal current meters were deployed and measured ocean cur-rents down to 300 m. Owing to instrumental failure, the timeseries have missing values at some times and depths. For thepurpose of comparison with the model outputs, the dailycurrent observations were averaged into 5 day bins, and the
GRENIER ET AL.: PACIFIC MODELED PATHWAYS AND WATER MASS EVOLUTIONS C12044C12044
3 of 16
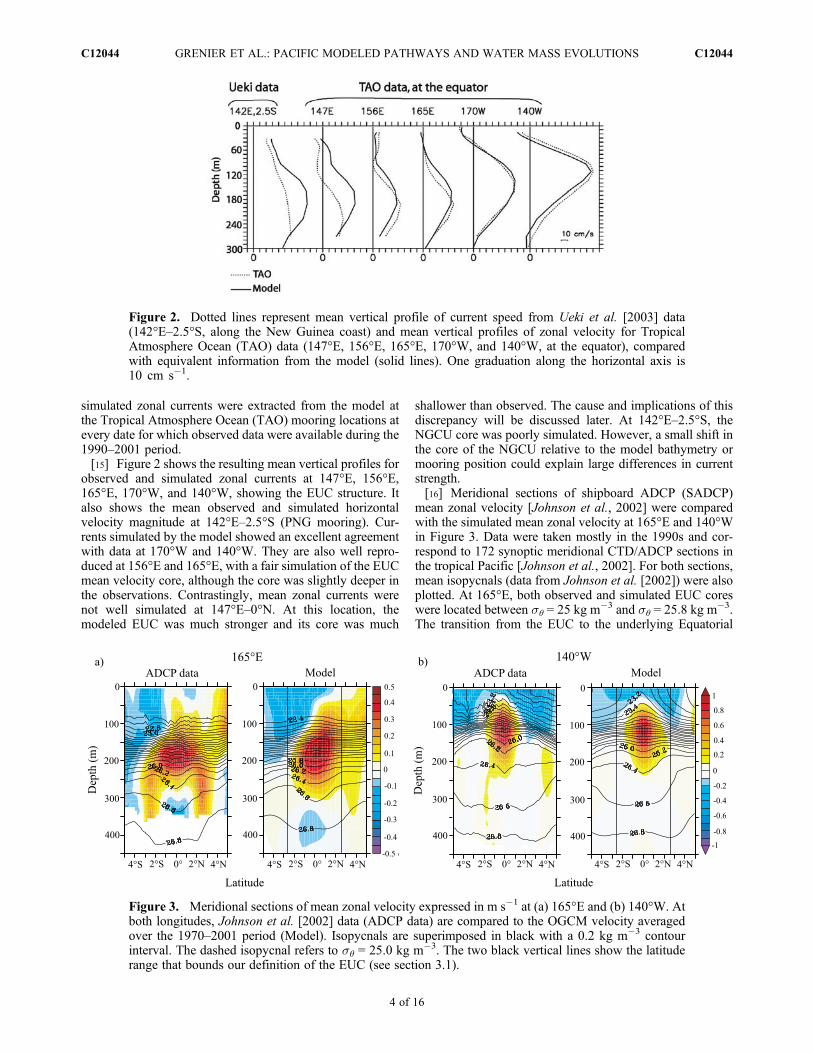
simulated zonal currents were extracted from the model atthe Tropical Atmosphere Ocean (TAO) mooring locations atevery date for which observed data were available during the1990–2001 period.[15] Figure 2 shows the resulting mean vertical profiles for
observed and simulated zonal currents at 147°E, 156°E,165°E, 170°W, and 140°W, showing the EUC structure. Italso shows the mean observed and simulated horizontalvelocity magnitude at 142°E–2.5°S (PNG mooring). Cur-rents simulated by the model showed an excellent agreementwith data at 170°W and 140°W. They are also well repro-duced at 156°E and 165°E, with a fair simulation of the EUCmean velocity core, although the core was slightly deeper inthe observations. Contrastingly, mean zonal currents werenot well simulated at 147°E–0°N. At this location, themodeled EUC was much stronger and its core was much
shallower than observed. The cause and implications of thisdiscrepancy will be discussed later. At 142°E–2.5°S, theNGCU core was poorly simulated. However, a small shift inthe core of the NGCU relative to the model bathymetry ormooring position could explain large differences in currentstrength.[16] Meridional sections of shipboard ADCP (SADCP)
mean zonal velocity [Johnson et al., 2002] were comparedwith the simulated mean zonal velocity at 165°E and 140°Win Figure 3. Data were taken mostly in the 1990s and cor-respond to 172 synoptic meridional CTD/ADCP sections inthe tropical Pacific [Johnson et al., 2002]. For both sections,mean isopycnals (data from Johnson et al. [2002]) were alsoplotted. At 165°E, both observed and simulated EUC coreswere located between sq = 25 kg m�3 and sq = 25.8 kg m�3.The transition from the EUC to the underlying Equatorial
Figure 3. Meridional sections of mean zonal velocity expressed in m s�1 at (a) 165°E and (b) 140°W. Atboth longitudes, Johnson et al. [2002] data (ADCP data) are compared to the OGCM velocity averagedover the 1970–2001 period (Model). Isopycnals are superimposed in black with a 0.2 kg m�3 contourinterval. The dashed isopycnal refers to sq = 25.0 kg m�3. The two black vertical lines show the latituderange that bounds our definition of the EUC (see section 3.1).
Figure 2. Dotted lines represent mean vertical profile of current speed from Ueki et al. [2003] data(142°E–2.5°S, along the New Guinea coast) and mean vertical profiles of zonal velocity for TropicalAtmosphere Ocean (TAO) data (147°E, 156°E, 165°E, 170°W, and 140°W, at the equator), comparedwith equivalent information from the model (solid lines). One graduation along the horizontal axis is10 cm s�1.
GRENIER ET AL.: PACIFIC MODELED PATHWAYS AND WATER MASS EVOLUTIONS C12044C12044
4 of 16

Intermediate Current (EIC) was slightly too deep in themodel. The main discrepancy concerns the observed welldeveloped Subsurface Countercurrents (SCCs), also calledTsuchiya Jets, between 200 m and 350 m depth at 3°N and3°S, which would require higher vertical resolution andsmaller viscosity in the model for appropriate representation[Marin et al., 2000; Stockdale et al., 1998]. In the centralPacific, at 140°W, the width, depth, current intensity, anddensity ranges of the EUC were in very good agreement withobservations and the SEC was also realistically reproducedin the model.[17] To conclude, the location and intensity of the mean
modeled LLWBCs and EUC (especially east of 147°E) werecorrectly simulated. The transports and locations of thewestern boundary currents in Vitiaz Strait, Solomon Strait,and along the Mindanao coast (not shown) were also con-sistent with previous observations and transport estimates[Cravatte et al., 2011; Wijffels et al., 1995; Dutrieux et al.,2008]. These model performances allowed us to analyzewater pathways and transports between the LLWBCs andthe EUC with some confidence in the robustness of ourresults. The implications of our findings of the discrepanciesbetween the modeled and observed currents will be dis-cussed in section 5.
2.2. The ARIANE Lagrangian Tool
[18] ARIANE is an off-line diagnostic tool dedicated tothe computation of 3D streamlines in a given velocity field(as the output of an OGCM) and subsequent water massesanalyzes on the basis of multiple particle trajectories [Blankeand Raynaud, 1997; Blanke et al., 1999]. In this study, weused 5 day average outputs of the zonal and meridionalvelocity fields as well as salinity (S) and temperature (T)fields. The temporal integration of these fields allows tracingof the average origin (backward integration) or fate (forwardintegration) of selected water masses. Here, the averagebehavior was determined thanks to the injection of particlesover a long period (20 years) that integrated the interannualvariability present in the simulated data. Turbulent diffusionprocesses were not used to calculate the trajectories, asparticles are only advected by the modeled velocity. Instead,effects of turbulent mixing on the followed water masseswere provided implicitly by the along-trajectory changes intracer properties (T and S).[19] Using the ORCA025-G70 “C” grid [see Arakawa,
1972] we defined several segments that form, with the landgrid cells, a closed oceanic domain. One of these segmentswas used as the injection segment, where particles wereseeded at each time step for the grid cells where the
Figure 4. (a) Control sections used in the Lagrangian backward experiment started at 140°W. Thetranslucent sections show the eastern limits for the experiment started at 156°E, with other sectionsunchanged. The domain of integration is bounded by eight interception sections (in color) and an injec-tion section (across the EUC, in black) that also acts as an interception section over its whole extent.TheLagrangian stream function of the mass transfer, associated with each source and integrated both in timeand depth, is shown with a 0.5 Sv contour interval as thin pink lines and thick blue lines for the EUCstudied at 156°E and at 140°W, respectively, for waters originating from (b) Vitiaz Strait, (c) SolomonStrait, (d) Mindanao Current, (e) east of Solomon Islands, and (f ) northern interior Pacific Ocean. Thetransport value of each source is reported close to the EUC section, at 156°E and 140°W, in bold pinkand bold blue, respectively (in Sv). The transport values in italic detail, for sections representing interiorocean sources, the part that eventually flows along the boundaries and the part that flows through interiorpathways (in Sv).
GRENIER ET AL.: PACIFIC MODELED PATHWAYS AND WATER MASS EVOLUTIONS C12044C12044
5 of 16
transverse velocity was inward the domain (i.e., these par-ticles will enter the domain the following time step). Othersegments were “interception” segments (see Figure 4a forthe segment locations and details). For a backward integra-tion from the injection section, they represented the locationsof the diverse origins of the followed water masses. Fol-lowing Blanke et al. [1999], each seeded particle was bear-ing an infinitesimal transport and the sum of all thetransports amounts to the available inflow. Owing to waterincompressibility, a given particle conserves its infinitesimalmass along its trajectory. A water mass can be defined by aset of particles that match selected position, velocity ordensity criterion. Thus, this mass-preserving method allowsquantifying the transport of a given water mass, adding upthe elementary transports of the particles that compose it.Note that the segment where particles were injected also actsas an interception section over its whole extent. It was usedto quantify the water flowing initially westward in the SECor in the EIC, and joining the EUC afterward. This zonalsea-saw motion is referred to as recirculation (see Figure 5).
3. Pathways of the EUC Sources
3.1. Experiments
[20] The main difficulty in estimating the transport of theEUC is definitional: there are several eastward currents close
to the EUC (Figures 1 and 3), and it is somewhat arbitraryto define the boundaries between the EUC, the NorthEquatorial Countercurrent (NECC) to the north, the SCCson both flanks and the Equatorial Intermediate Current(EIC) below. In this study, we defined the EUC as the east-ward flow greater than 0.1 m s�1, in the latitude band from2.625°N to 2.625°S and in the density range from 22.4 kgm�3 to 26.8 kg m�3 (Figure 3). The shallower limit in densitywas chosen to distinguish the EUC flow from the eastwardsurface jets occasionally generated by westerly winds. Thedeeper limit in density was chosen to avoid inclusion ofwaters from the westward EIC that reverses seasonally[Marin et al., 2010]. A stronger constraint for the magnitudeof the zonal velocity, added to a density definition, results ina loss of waters at the edge of the EUC. On the contrary, wewould get some intrusions from the NECC or from the EICwithin our EUC definition if only the sign of the velocity wasimposed.[21] Four experiments were performed, in which particles
were injected into the EUC at 156°E, 165°E, 180°, and140°W, respectively, and integrated backward in time untilthey reach one of the 8 source sections defined in Figure 4and Table 1. Particles were injected from the end of 2001to the beginning of 1982 (i.e., for 20 years), and followedbackward for 11 years. These time ranges were chosen tohave a long enough temporal integration so that a maximum
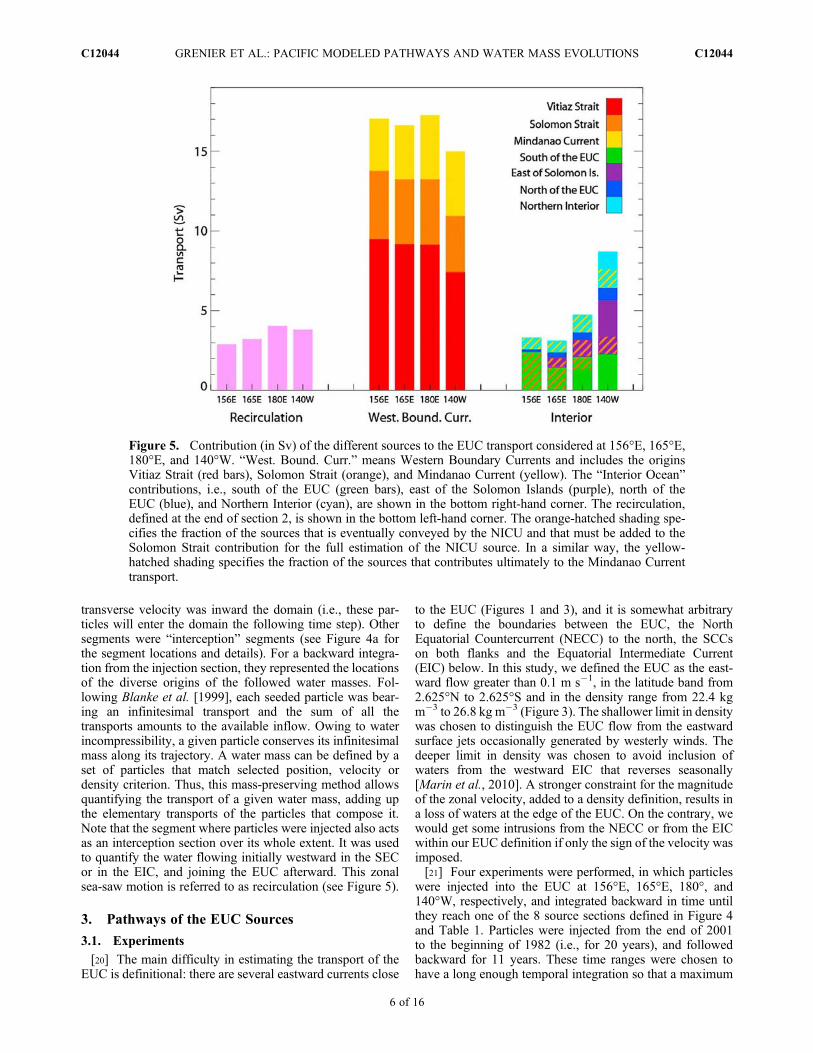
Figure 5. Contribution (in Sv) of the different sources to the EUC transport considered at 156°E, 165°E,180°E, and 140°W. “West. Bound. Curr.” means Western Boundary Currents and includes the originsVitiaz Strait (red bars), Solomon Strait (orange), and Mindanao Current (yellow). The “Interior Ocean”contributions, i.e., south of the EUC (green bars), east of the Solomon Islands (purple), north of theEUC (blue), and Northern Interior (cyan), are shown in the bottom right-hand corner. The recirculation,defined at the end of section 2, is shown in the bottom left-hand corner. The orange-hatched shading spe-cifies the fraction of the sources that is eventually conveyed by the NICU and that must be added to theSolomon Strait contribution for the full estimation of the NICU source. In a similar way, the yellow-hatched shading specifies the fraction of the sources that contributes ultimately to the Mindanao Currenttransport.
GRENIER ET AL.: PACIFIC MODELED PATHWAYS AND WATER MASS EVOLUTIONS C12044C12044
6 of 16

of fluid particles exited the closed domain by one of theeight sections (see eleventh row in Table 2). The verticallyintegrated and time averaged stream functions obtainedseparately for each source are shown for 156°E and 140°Win Figure 4. The transport values of each EUC source aresummarized for the four experiments in Table 2 and dis-played in Figure 5.
3.2. EUC Sources at 156°E
[22] A large majority of the EUC waters considered at156°E passes first through the LLWBCs (87%, amongwhich 13% originate from interior sections and flow ulti-mately via the LLWBCs, as specified by the yellow andorange hatches in Figure 5), whereas 12% originate fromeast of 156°E, conveyed by westward currents, and recir-culate within the EUC (Figure 5 and Table 2). The LLWBCscontribution comes mostly from the south. 40% of the EUC
waters flow through Vitiaz Strait, within the NGCU, and28% flow east of New Ireland within the NICU. The NICUis mainly fed by the flow exiting through Solomon Strait(4.3 Sv, 18% of the EUC waters), and directly by the SEC(2.4 Sv, 10% of the EUC waters). Thus, in our model, 58%of the EUC waters at 156°E pass first through the SolomonSea. Only 18% of the EUC waters originate from theMindanao Current.[23] The pathways of the waters composing the EUC at
156°E are shown in Figure 4 (pink lines). They are quitecomplex. The flow originating from Vitiaz Strait (Figure 4b)overshoots the equator and splits into three different bran-ches before retroflecting into the EUC.[24] 1. The westernmost flow (�1.5–2 Sv) retroflects
southwestward into the Halmahera Sea (Figure 1), turnsaround the Halmahera coast, and recirculates into the Hal-mahera Eddy (HE) to reach the EUC. Its associated transportis well preserved, in absolute contribution, all along itseastward transport within the EUC. Such a pathway wasalready suggested by observations from Gordon and Fine[1996, Figure 1] and from Hautala et al. [1996] and wassimulated in the BRAN model [Schiller et al., 2008].[25] 2. The central flow (�3.5 Sv at 156°E) directly
recirculates in the Halmahera Eddy (HE) after crossing theequator and reaches the EUC. This pathway is also consis-tent with former observations [e.g., Kashino et al., 1996]that reported intrusions of southern hemisphere saline watersas far north as 5°–6°N.[26] 3. Finally, the main branch originating from Vitiaz
Strait and feeding the EUC, i.e., the easternmost one(�4 Sv at 156°E), retroflects into the EUC north of theequator via the New Guinea Eddy (Figure 1) without recir-culating in the HE.[27] The NICU waters (Figures 4c and 4e) are mostly
advected westward toward the PNG coast before reachingthe EUC. The whole flow through Solomon Strait(Figure 4c) is advected southwestward into the BismarckSea before being conveyed northwestward by the NGCU.Then, these Solomon Strait–originating waters follow thesame pathway as the Vitiaz Strait water masses describedabove. The major part of the SEC vein joining the NICU
Table 1. Coordinates of the Sections Delimiting Our Domain
Sections Longitude Latitude
EUC (recirculation) 155.6°E or 164.9°E or179.9°E or 140.1°W
2.624°N–2.624°S
Vitiaz Strait 147.4°E–148.9°E 5.865°SSolomon Strait 152.1°E–154.6°E 5.118°SIndonesian Seas 124.4°E–126.4°E,
127.1°E–140.4°E,116.4°E,117.6°E,119.9°E–122.9°E,123.1°E
8.345°S,8.345°S,
8.345°S–3.872°S,6.610°N–8.345°N,
10.32°N,8.593°N–9.087°N
Mindanao Current 126.4°E–127.4°E 8.098°NEast of Solomon Islands 155.4°E–164.9°E
or 155.4°E–179.9°Eor 155.4°E–140.1°W
5.865°S
Northern Interior 127.4°E–155.6°Eor 127.4°E–164.9°Eor 127.4°E–179.9°Eor 127.4°E–140.1°W
8.098°N
South of the EUC 155.6°E or 164.9°E or179.9°E or 140.1°W
5.865°S–2.624°S
North of the EUC 155.6°E or 164.9°E or179.9°E or 140.1°W
2.624°N–8.098°N
Table 2. Summary of the Source Transports Feeding the 156°E EUC, the 165°E EUC, the 180°E EUC, and the 140°W EUCa
Sections
156°E-EUC 165°E-EUC 180°E-EUC 140°W-EUC
Sv % Sv % Sv % Sv %
EUC (recirculation) 2.9 12 3.2 14 4.0 15 3.8 14Vitiaz Strait 9.5* 41 9.2* 40 9.1* 35 7.4* 26Solomon Strait 4.3* 18 4.1* 18 4.1* 16 3.5* 13Indonesian Seas 0.1* 0 0.1* 0 0.1* 0 0.1* 0Mindanao Current 3.3* 14 3.4* 15 4.0* 15 4.0* 14East of Solomon Islands - - 0.6 (0.6*) 3 (3) 1.1 (1.1*) 4 (4) 3.4 (1.3*) 12 (5)South of the EUC 2.4 (2.4*) 10 1.5 (1.5*) 6 (6) 2.1 (0.8*) 8 (3) 2.3 8Northern Interior 0.7 (0.7*) 3 (3) 0.7 (0.6*) 3 (3) 1.1 (1.0*) 4 (4) 2.3 (1.2*) 8 (4)North of the EUC 0.2 1 0.3 1 0.3 2 0.8 3Surface 0.0 0 0.0 0 0.0 0 0.0 0Temporal interception 0.1 0 0.1 0 0.2 1 0.5 2Total 23.4 100 23.1 100 26.3 1000 28.0 100LLWBCs 20.3* 87 19.5* 84 20.5* 78 17.5* 63Interior pathways 0.2 1 0.4 2 1.8 7 6.3 23
aTransports on the left are in sverdrups, and those on the right are in percent. Numbers in parentheses show the fraction of transport that transits ultimatelythrough the NICU and the Mindanao Current. The “temporal interception” criterion corresponds to transport that did not reach any section before the end ofthe temporal integration. Asterisks refer to transport conveyed by the LLWBCs; the total of this transport is given in the thirteenth row. Contribution ofInterior Ocean off the equator is given in the fourteenth row.
GRENIER ET AL.: PACIFIC MODELED PATHWAYS AND WATER MASS EVOLUTIONS C12044C12044
7 of 16

along the New Ireland coast (2 Sv out of 2.4 Sv) followsabout the same pathway as the flow exiting from SolomonStrait (Figure 4e). The remaining 0.4 Sv retroflects into theEUC north of New Ireland. This pattern differs from theresults of P. Dutrieux et al. (Direct measurements of inter-mediate and upper ocean currents in the western tropicalPacific, manuscript in preparation, 2011) and Melet et al.[2010a]. Indeed, the latter study estimates that 3/5 of theNICU directly retroflects in the EUC north of New Ireland.Here, less than 10% of the NICU waters follow thispathway.[28] The thermocline waters that feed the EUC from the
Mindanao Current (Figures 4d and 4f) mainly flow withinthe Celebes Sea, feeding the Indonesian Throughflow,before bifurcating toward the EUC through the northern partof the HE toward the EUC. This is fully consistent withprevious observations [Fine et al., 1994; Kashino et al.,1996; Lukas et al., 1996].[29] The travel time of water masses from their sources to
the EUC at 156°E varies between one and two yearsdepending on their route. Half of the particles conveyed bythe southern LLWBCs reach the EUC at 156°E in about 15–16 months. Most of the waters originating in Vitiaz Straittravel in around 9 months. For the NICU origin, waters reachthe EUC in about either 4 months or 1 year. The 4 monthroute corresponds to NICU water masses retroflecting intothe EUC north of New Ireland: this is the fastest and shortestwestern boundary route to the EUC of our study. The 1 yearpath corresponds to the NICU route via the NGCU. Mind-anao Current water masses have a longer travel time than thesouthern hemisphere sources. Half of the particles reach theEUC at 156°E after 2 years of transit.[30] The EUC recirculation represents the transport that
flows back to the initial section, being converted or not intoanother hydrological class than the one defined at theinjection. Whereas the injection over the EUC at 165°E iscontrolled by density and velocity criteria, the whole verticalplan at 165°E, from 2.625°N to 2.625°S and from the sur-face to the ocean bottom, becomes an interception sectionfor the particles integrated backward in time. The recircula-tion around 165°E is associated with waters flowing initiallywestward at 165°E in the SEC or in the EIC, and joining theEUC later. Half of particles recirculating between the SECand the EUC remain during a year within the domain ofintegration. The particles participating in the lower recircu-lation, between the EIC and the EUC, have a longer medianage, equal to one and a half year.
3.3. From 156°E to 140°W: Evolution of the Transportsof the EUC Sources
[31] The source contributions of the EUC, taken at dif-ferent longitudes, are represented in Figure 5. This allowsfollowing the evolution of the relative importance of theEUC sources along the equator, from its origin in the west-ern Pacific to 140°W. One must be attentive here about thedistinction between “Western Boundary Currents” versus“Interior Ocean.” Indeed, “Interior Ocean” refers to sectionslocated in the open ocean. However, a part of the southern“Interior Ocean” transport converges toward the New Irelandcoast and is conveyed ultimately by the NICU (orange hat-ched portions in Figure 5). Consequently, this transport
should be added to the Solomon Strait transport for the esti-mation of NICU supplies. A similar remark applies for theyellow-hatched portion of the northern interior transportthat flows within the MC (Figure 5).3.3.1. Evolution of the Interior Pathways’Contributions to the EUC[32] At 156°E and 165°E, almost all the waters that com-
pose the EUC passed first through the LLWBCs (Figure 5).As expected, contributions from interior oceanic pathwaysincrease progressively from 156°E to 140°W, and becomesignificant only east of 180°. At 140°W, 32% of the EUCsources originate from interior sections among which 23%follow interior pathways all along their route (see non-hatched interior fraction in Figure 5 and Table 2). Interiorsouthern supplies are larger than their northern counterpart.This hemispheric difference is likely due to the existence ofa high potential vorticity ridge in the North Pacific, locatedunder the Intertropical Convergence Zone, which limits theconnection between the Northern Interior Pacific Ocean andthe equator [e.g., Liu et al., 1994; Lu and McCreary, 1995;Johnson and McPhaden, 1999; Fukumori et al., 2004].3.3.2. Evolution of the Western BoundaryContributions[33] Interestingly, the Mindanao Current contribution
increases between 156°E and 140°W (Figure 5 and Table 2).However, only 50% of the MC-originating waters flowingwithin the EUC at 140°W flow already in the EUC at 156°E.The other 50% are first conveyed eastward by the NECC,converging progressively toward the equator after 175°E,before they eventually enter the EUC (Figures 4d and 4f).This is in agreement with the results of Johnson andMcPhaden [1999].[34] Surprisingly, the Vitiaz Strait contribution to the EUC
transport decreases from 9.5 Sv to 7.4 Sv between 156°Eand 140°W, meaning that 2.1 Sv of Vitiaz Strait–originatingwaters exit the EUC during its eastward advection from156°E to 140°W. More generally, a decrease of 20% of thesouthern LLWBCs supplies is observed between 156°E and140°W, partly compensated by MC supplies. Actually,about 1/3 of the EUC waters coming from each westernboundary section at 156°E does not reach 140°W.[35] Forward Lagrangian experiments were performed for
each of the LLWBCs’ sources to identify where and howthese waters are leaking from the EUC between 156°E and140°W. We isolated the waters that feed the 156°E EUCfrom each LLWBCs’ section, and advected them from156°E to 140°W (not shown). The major part of theLLWBCs’ waters present within the EUC at 156°E but notanymore at 140°W exit the EUC through the lateral limits at2.625°N and 2.625°S. 40% of the transport losses of theVitiaz Strait source leak out at the northern EUC boundary,30% at the southern one, and 20% recirculates in the SEC orthe EIC. This spatial distribution of Vitiaz Strait losses iscoherent with the fact that a larger part of this source crossesthe equator north of PNG and transits within the EUC in itsnorthern part. 76% of MC source transport losses leak out ofthe EUC to the north whereas 56% of the loss of NICUsource transport leaks out to the south, suggesting a greaterreturn of the northern sources to their own hemisphere.These lateral losses mainly result from equatorial divergenceof the waters located above the EUC core.
GRENIER ET AL.: PACIFIC MODELED PATHWAYS AND WATER MASS EVOLUTIONS C12044C12044
8 of 16

3.4. Structure of the EUC at 165°E as a Functionof Its Origins
[36] The effective velocity (m s�1) contributions of thevarious sources of the EUC at 165°E are shown as a functionof latitude and depth in Figure 6. For each source, a com-plementary graph shows its contribution as a percentage ofthe EUC transport.[37] Interestingly, the water masses originating from the
MC or Solomon Strait are confined to their respectivehemispheres (Figures 6b and 6c), whereas the waters origi-nating from the NGCU spread almost uniformly within theEUC (Figure 6a). More precisely, the EUC water massesflowing from the NGCU are characterized by a core centeredon 190 m and extending from 110 m to 260 m. They rep-resent more than 60% of the total EUC transport between0.5°S and 1°N, between 180 m and 280 m depth. Thus, thesewaters constitute the major contribution to the EUC waters,especially at the equator and below 200 m.[38] At 165°E, Solomon Strait waters feeding the EUC are
centered on 0.9°S and 190 m depth where they representmore than 40% of the total EUC transport (Figure 6b). Theyextend from 2°S to 1°N and are the major component of thesouthern part of the EUC, between 100 m and 250 m depth.Waters from the SEC joining the NICU (Southern Interiorsection, Figure 6d) feed a small part of the 165°E EUC, witha core centered on 180 m, between 2°S and 0.5°S. They areeven more confined in the southern EUC part than SolomonStrait–originating waters.
[39] The Mindanao Current water core is centered on1.2°N, at 170 m depth (Figure 6c). This source extendsfrom 0.2°S to the northern EUC boundary. It contributes tomore than 50% of the total 165°E-EUC transport, between150 and 200 m depth, from the northern EUC boundary to1°N. Thus, MC waters are the main component of thenorthern EUC.[40] Finally, a large part of the EUC transports at 165°E
above 100 m depth or below 280–300 m depth consist ofrecirculating waters. Thus, the upper and lower depth limitsof the EUC are mainly fed by the waters conveyed by thesurrounding westward flowing currents such as the SEC orthe EIC.[41] Interestingly, these model results confirm the findings
of Tsuchiya et al. [1989] based on water mass hydrologicalproperties observed during WEPOCS cruises. Indeed, theseauthors suggested that the major source of the EUC is CoralSea water transported by the NGCU. They also suggestedthat at 143°E, between 0.5°N and 2°N, the northern portionof the EUC contains northern hemisphere waters. Down-stream, at 155°E, their observations suggested that thesouthern portion of the EUC contains the tropical waterflowing north of New Ireland and Solomon Islands.[42] These findings are summarized in Figure 7, and the
locations of the various sources within the EUC at severallongitudes are represented in Figure 7. We decided to rep-resent the dominant sources of the EUC as functions ofdepth and latitude (for more details about the definition of
Figure 6. Contribution of the major sources to the EUC zonal velocity profile at 165°E, expressed eitheras an “effective velocity” (left graphs, in m s�1) or as a fraction of the local EUC velocity (right graphs,in percent): (a) Vitiaz Strait, (b) Solomon Strait, (c) Mindanao Current, (d) Southern Interior (east ofSolomon Islands + south of the EUC), and (e) recirculation. Regions where the velocity is less than0.025 m s�1 are blanked out. The “effective velocity” is obtained by the remapping on the injection sectionof the infinitesimal transports carried by particles with a specific origin. (f) The sum of the individualvelocity components provides the mean EUC zonal velocity profile. (g) Explanation of the color bar.The associated transport is reported (in Sv) on the top left corner of the total EUC and of the “effectivevelocity” of each source.
GRENIER ET AL.: PACIFIC MODELED PATHWAYS AND WATER MASS EVOLUTIONS C12044C12044
9 of 16

“dominant source,” see the caption of Figure 7). It showsthat along its pathway from 156°E to 140°W, the centralEUC, throughout its depth, including its core, is dominatedby Vitiaz Strait waters. These waters also dominate thelower part of the EUC, between 1°S and 1°N, till 140°W.Mindanao Current and Solomon Strait waters are dominantin their respective hemispheres, poleward of 0.8°, sur-rounding Vitiaz Strait waters around the EUC core depth.The contribution of Mindanao Current waters remainsimportant in the northern part of the EUC till 140°W,whereas the Solomon Strait waters are replaced by waterscoming from southern interior pathways. The upper part ofthe EUC is mainly ventilated by SEC waters and, from eastof 180°, by interior oceanic pathways in its southern part. Animportant conclusion is that the EUC waters below 200 mmostly originate from the NGCU all along the equator from156°E to 140°W. Below 280–300 m, EUC waters mainlycome from EIC recirculation. This is an important result forthe issue of EUC micronutrient enrichment, and this pointwill be discussed in section 5.
4. Maxima Transport of Sources and AssociatedDensities
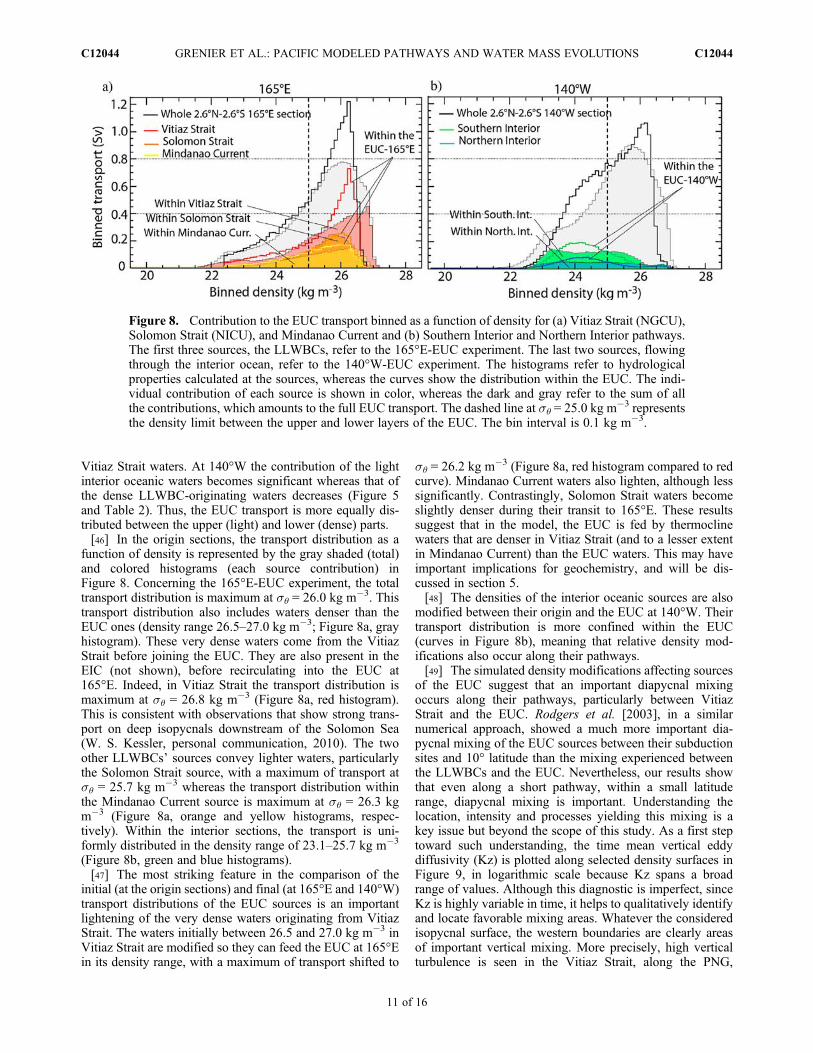
[43] We now examine precisely the density range associ-ated with each EUC source. For this purpose, we analyzedthe transport distribution as a function of potential density atthe origin sections and within the EUC at 165°E or at 140°W(Figure 8). Two different longitudes are considered because,as seen in section 3, interior oceanic sources do not con-tribute significantly to the EUC at 165°E, whereas theyrepresent 23% of the total EUC at 140°W (Table 2). Thus,the density distributions were examined at 165°E for theLLWBC sources and at 140°W for the interior oceanic
sources (Figures 8a and 8b, respectively). Two curves arededuced from simulation with the Lagrangian tool repre-senting the initial and final hydrological properties of eachfluid particle. In Figure 8, gray histograms and black curvesrepresent the transport distribution of all sources defined inTable 1, at their origin sections (coordinates in Table 1) andwithin the EUC, respectively. Colored histograms andcurves show the same information for each LLWBC orinterior source taken individually.[44] Within the EUC at 165°E the total density distribution
is characterized by a maximum of transport at sq = 26.2 kgm�3 (Figure 8a, black curve). This density is close to thelower EUC boundary defined at sq = 26.8 kg m�3. Thetransport distribution of waters flowing from Vitiaz Strait,maximum at sq = 26.2 kg m�3, is clearly determining theshape of the total transport distribution, although contribu-tions from the Solomon Strait and Mindanao Current sourcesremain significant. However, the maximum of transport ofthese two sources, occurring at sq = 26.0 kg m�3, is slightlyless dense than that of Vitiaz Strait (Figure 8a, orange andyellow curves). During its eastward transit (to 140°W), thetransport distribution of the total EUC remains maximum atsq = 26.2 kg m�3 but is less confined to denser waters as thedistribution is seen to broaden (Figure 8b). The apparentshift toward lighter densities results from contributions ofinterior oceanic sources which are, at 140°W, centered onsq = 24.2 kg m�3 (Figure 8b, black, green, and blue curves)that is within the EUC upper layer (Figure 3b).[45] These results confirm the vertical distribution of the
EUC sources illustrated in Figures 6 and 7, the densest watersoriginating from Vitiaz Strait. Moreover, these transportdistributions show that (1) the EUC maximum of transport islocated in its lower part, below sq = 25.0 kg m�3, and (2) thismaximum of transport is primarily constituted by dense
Figure 7. Recapitulative diagram of the dominant constituents of the EUC as a function of depth andlatitude. The dominant source is the source that represents the largest transport within the grid cell. A redgrid cell means that the largest part of transport comes from Vitiaz Strait. However, other sources cancontribute to the transport existing in this grid cell, but their transports are smaller. The color code isthe same as that in Figure 5, and the mean zonal velocity profile is contoured in black with a 0.1 m s�1
interval (0.2 m s�1 interval for 140°W) for the EUC considered at (a) 156°E, (b) 165°E, (c) 180°E, and(d) 140°W.
GRENIER ET AL.: PACIFIC MODELED PATHWAYS AND WATER MASS EVOLUTIONS C12044C12044
10 of 16
Vitiaz Strait waters. At 140°W the contribution of the lightinterior oceanic waters becomes significant whereas that ofthe dense LLWBC-originating waters decreases (Figure 5and Table 2). Thus, the EUC transport is more equally dis-tributed between the upper (light) and lower (dense) parts.[46] In the origin sections, the transport distribution as a
function of density is represented by the gray shaded (total)and colored histograms (each source contribution) inFigure 8. Concerning the 165°E-EUC experiment, the totaltransport distribution is maximum at sq = 26.0 kg m�3. Thistransport distribution also includes waters denser than theEUC ones (density range 26.5–27.0 kg m�3; Figure 8a, grayhistogram). These very dense waters come from the VitiazStrait before joining the EUC. They are also present in theEIC (not shown), before recirculating into the EUC at165°E. Indeed, in Vitiaz Strait the transport distribution ismaximum at sq = 26.8 kg m�3 (Figure 8a, red histogram).This is consistent with observations that show strong trans-port on deep isopycnals downstream of the Solomon Sea(W. S. Kessler, personal communication, 2010). The twoother LLWBCs’ sources convey lighter waters, particularlythe Solomon Strait source, with a maximum of transport atsq = 25.7 kg m�3 whereas the transport distribution withinthe Mindanao Current source is maximum at sq = 26.3 kgm�3 (Figure 8a, orange and yellow histograms, respec-tively). Within the interior sections, the transport is uni-formly distributed in the density range of 23.1–25.7 kg m�3
(Figure 8b, green and blue histograms).[47] The most striking feature in the comparison of the
initial (at the origin sections) and final (at 165°E and 140°W)transport distributions of the EUC sources is an importantlightening of the very dense waters originating from VitiazStrait. The waters initially between 26.5 and 27.0 kg m�3 inVitiaz Strait are modified so they can feed the EUC at 165°Ein its density range, with a maximum of transport shifted to
sq = 26.2 kg m�3 (Figure 8a, red histogram compared to redcurve). Mindanao Current waters also lighten, although lesssignificantly. Contrastingly, Solomon Strait waters becomeslightly denser during their transit to 165°E. These resultssuggest that in the model, the EUC is fed by thermoclinewaters that are denser in Vitiaz Strait (and to a lesser extentin Mindanao Current) than the EUC waters. This may haveimportant implications for geochemistry, and will be dis-cussed in section 5.[48] The densities of the interior oceanic sources are also
modified between their origin and the EUC at 140°W. Theirtransport distribution is more confined within the EUC(curves in Figure 8b), meaning that relative density mod-ifications also occur along their pathways.[49] The simulated density modifications affecting sources
of the EUC suggest that an important diapycnal mixingoccurs along their pathways, particularly between VitiazStrait and the EUC. Rodgers et al. [2003], in a similarnumerical approach, showed a much more important dia-pycnal mixing of the EUC sources between their subductionsites and 10° latitude than the mixing experienced betweenthe LLWBCs and the EUC. Nevertheless, our results showthat even along a short pathway, within a small latituderange, diapycnal mixing is important. Understanding thelocation, intensity and processes yielding this mixing is akey issue but beyond the scope of this study. As a first steptoward such understanding, the time mean vertical eddydiffusivity (Kz) is plotted along selected density surfaces inFigure 9, in logarithmic scale because Kz spans a broadrange of values. Although this diagnostic is imperfect, sinceKz is highly variable in time, it helps to qualitatively identifyand locate favorable mixing areas. Whatever the consideredisopycnal surface, the western boundaries are clearly areasof important vertical mixing. More precisely, high verticalturbulence is seen in the Vitiaz Strait, along the PNG,
Figure 8. Contribution to the EUC transport binned as a function of density for (a) Vitiaz Strait (NGCU),Solomon Strait (NICU), and Mindanao Current and (b) Southern Interior and Northern Interior pathways.The first three sources, the LLWBCs, refer to the 165°E-EUC experiment. The last two sources, flowingthrough the interior ocean, refer to the 140°W-EUC experiment. The histograms refer to hydrologicalproperties calculated at the sources, whereas the curves show the distribution within the EUC. The indi-vidual contribution of each source is shown in color, whereas the dark and gray refer to the sum of allthe contributions, which amounts to the full EUC transport. The dashed line at sq = 25.0 kg m�3 representsthe density limit between the upper and lower layers of the EUC. The bin interval is 0.1 kg m�3.
GRENIER ET AL.: PACIFIC MODELED PATHWAYS AND WATER MASS EVOLUTIONS C12044C12044
11 of 16

Mindanao and Celebes coasts, north of New Ireland, withinthe Halmahera Eddy and within the New Guinea Eddy(NGE). Between 150°E to 165°W, Kz is weak along theequator and insignificant elsewhere (Figure 9). East of165°W, along the equator, mixing is important, owing tovertical current shear. Along the 24.0 kg m-3 isopycnal sur-face, between 5°S and 6°N, it strengthens significantly(Figure 9, top). This indicates that EUC waters undergocontinuously mixing along their pathway to the easternPacific.[50] These Kz distributions are coherent with the fact that
Vitiaz Strait waters are the most modified along their transit,compared to other sources. Indeed, they flow through areasof high Kz all along their travel from their source to 150°E(Figures 4b and 9). However, this conclusion does not holdfor the Solomon Strait waters, which follow a similar routeto Vitiaz Strait waters, without flowing along the PNGcoast. An ongoing detailed analysis of the present modeland other simulations together with field data will help tobetter understand and quantify these differences. Along sq =24.0 kg m�3, the high equatorial Kz, east of 165°W suggestsa favorable area for the property modifications of the interioroceanic sources which is coherent with the interior sourcemodifications observed in Figure 8.[51] The EUC is not the sole destination of water carried
by the LLWBCs. Figure 10 shows the fate of the totalequatorward transport incoming at the western boundary
sections. Waters from the NGCU also feed the NECC,mainly in the surface layer (not shown). About half of thewaters flowing through Vitiaz Strait within the density range26.9–27.2 kg m�3 join the equatorial intermediate waters,and 30% feed the Indonesian Throughflow. Only a negligi-ble fraction flows northward below the MC. This resultconflicts with Qu and Lindstrom’s [2004] paper that shows anorthward intrusion of intermediate waters to 15°N, but itagrees with the observational and numerical results of Zenket al. [2005]. Indeed, the later authors observed two fatesfor the Antarctic Intermediate Water (AAIW): the eastwardSouthern and Northern Intermediate Countercurrents (SICCand NICC) centered on 2°S and 2°N, respectively, and thedeep throughflow into the Celebes Sea.[52] The destination of the Solomon Strait outflow is
almost entirely the EUC in the density range 23.0–26.0 kgm�3 (Figure 10b). At higher densities, most of the flowrecirculates within the strait, and a peak transport centeredon 27.2 kg m�3, corresponding to the AAIW, reaches theequatorial intermediate current system.[53] Finally, the smallest equatorial Pacific supply comes
from the Mindanao Current (Figure 10c). Indeed, almosthalf of the total flow, initially distributed between sq =21.1 kg m�3 and sq = 27.2 kg m�3, feeds the Indonesianthroughflow. An important southward flow centered onsq = 27.8 kg m�3 recirculates or feeds the equatorial andnorthern interior sections. This transport corresponds to
Figure 9. Time mean vertical eddy diffusion mapped with a logarithmic scale along (top) sq =24.0 kg m�3, (middle) sq = 24.5 kg m�3, and (bottom) sq = 26.2 kg m�3. The 24.0 kg m�3 isopycnal sur-face corresponds to the upper layer core of interior oceanic sources. The 24.5 and 26.2 kg m�3 isopycnalsurfaces illustrate the initial upper and lower layer cores of the LLWBCs’ sources, respectively, and cor-respond to the central and lower thermocline.
GRENIER ET AL.: PACIFIC MODELED PATHWAYS AND WATER MASS EVOLUTIONS C12044C12044
12 of 16

deep waters; the spin-up of the model is however too short(8 years, from 1950 to 1957) compared with the advectivetime scales of these waters to allow us to draw conclu-sions on these water masses.
5. Conclusions and Discussion
[54] This study investigated the supply of water to theEUC from the Low-Latitude Western Boundary Currents ofthe western Pacific. In this area, defined as a water masscrossroads by Fine et al. [1994], converging northern andsouthern hemisphere waters meet in the vicinity of theequator and mix together. Thus, their contribution to theEUC transport and their properties evolve along their path-ways to the EUC. Since the EUC is the main source ofwaters for the equatorial upwelling, improving our knowl-edge about its sources is crucial.[55] We used a Lagrangian framework applied to a 1/4°
resolution OGCM to quantify the transports, pathways anddensity evolution of the waters that form the EUC from156°E to 140°W. Our model results mostly confirm thepathways deduced from previous observational studies[Tsuchiya et al., 1989; Fine et al., 1994; Kashino et al.,1996]. Yet, the modeled analysis used in this studyallowed a more detailed and quantified description of thesepathways. We notably found that the EUC waters at 156°Emainly come from the South Pacific LLWBCs, with 40% ofthe EUC transport due to waters originating from the NGCUat Vitiaz Strait and 28% from the NICU east of New Ireland.The North Pacific LLWBC, the Mindanao Current, alsosignificantly feeds up to 18% of the transport of the EUC.Most of these MC waters circulate into the Celebes Sea, and/or around the Halmahera Eddy before joining the equatorialband. Our results suggest that the contribution of theLLWBCs to the EUC is higher than formerly thought: westof the dateline, they supply almost the entire EUC transport.[56] This study brings new information about the distri-
bution of sources within the EUC. In our model, watersconveyed by the NGCU from Vitiaz Strait are the majorcontributors to the EUC transport and feed its central andlower parts on both sides of the equator. Waters conveyed bythe Mindanao Current and by the NICU remain within thenorthern (0°–2°N) and southern (2°S–1°N) portions of theEUC, respectively. The Interior Ocean ventilates the upperpart of the EUC in each hemisphere while the lowest part ofthe EUC is fed by recirculation from the equatorial inter-mediate waters.[57] Interestingly, our model also suggests that the EUC is
fed by waters flowing through Vitiaz Strait and along thePNG coasts at higher densities than those of the EUC (downto sq = 27.2 kg m�3). These waters undergo an importantdensity modification between Vitiaz Strait and the EUC at165°E with notably a substantial lightening of dense watersthat eventually enter the equatorial band within the range ofEUC densities.[58] Waters flowing equatorward in the MC and NICU
that are incorporated into the EUC have lower densitiesthan Vitiaz Strait water masses. As a consequence, thewaters originating from other sources than the NGCU (MC,Solomon Strait and interior pathways) are less modified indensity, but also undergo mixing. Some strong vertical eddydiffusivity exists in many areas of the western equatorial
Figure 10. Transport distribution as a function of densityof the equatorward inflow through the three LLWBC sec-tions: (a) Vitiaz Strait, (b) Solomon Strait, and (c) alongMindanao coast. The full inflow is shown in the gray back-ground, whereas the fraction that eventually reaches the2.625°S–2.625°N section at 165°E is shown in the fore-ground, with bright colors when it is conveyed by the EUCand with dark colors when it is conveyed by other equatorialcurrents (SEC, EIC, or deeper currents). Here, the Lagrang-ian particles are injected only during 10 years, from 1971 to1980, to allow a temporal integration 10 years longer thanthat for the backward experiment and thus to interceptslower deep currents.
GRENIER ET AL.: PACIFIC MODELED PATHWAYS AND WATER MASS EVOLUTIONS C12044C12044
13 of 16

Pacific. Eastern coasts of New Guinea, New Guinea andHalmahera Eddies, New Ireland and Mindanao islandsappear to be areas of increased turbulence for the upper,central and lower thermocline. In the upper thermocline,vertical mixing also occurs east of 165°W along the equatorwithin the EUC. Thus, all pathways followed by the watersfeeding the EUC are subject to mixing. The detailed loca-tion, intensity, and processes yielding this mixing will bedetailed in a further work, as well as the temperature andsalinity modifications of the LLWBCs’ waters.[59] The Lagrangian software coupled to the OGCM is a
powerful tool, and provided important new results about theEUC sources pathways, properties and evolutions. However,the results are reliant on the model performance. TheOGCM, validated against observations, showed good skill insimulating the mean currents and densities, but also someweaknesses. The validity of our results is now discussed inthe light of the model drawbacks.[60] First, the model 1/4° zonal resolution is not sufficient
to resolve all the complex topography of the small islandsand straits in the southwestern tropical Pacific. For instance,the St. George’s Channel is closed in our model, whereasMelet et al. [2011] estimated its outflow to a significanttransport of 2.5 Sv in the thermocline. The evolution ofwater masses exiting the Solomon Sea through St. George’sChannel may be different from the evolution of those flow-ing through Solomon Strait, because the former may notundergo as strong turbulent mixing as the one diagnosedalong the New Ireland coast. Our 1/4° resolution model isnot fully eddy resolving and an analysis of horizontal reso-lution impacts is beyond the scope of this study. However,we compared our results with those given by a 1/8° resolu-tion ROMS simulation, where the St. George’s Channel isopen, and found similar transports, in average different by5%. Consequently, this comparison made us confident in therobustness of our results. Nevertheless, an interesting per-spective to this work is to investigate whether our conclu-sions change when using a model with higher resolutionand/or different numerical settings.[61] Both the modeled NGCU along PNG and the EUC at
147°E are shallower and stronger than observed. However,the depth of the EUC core at 156°E and downstream iscorrectly simulated. It is possible that, in reality, the NGCUwaters flowing at higher densities than modeled exit theEUC between 147°E and 156°E. The fraction of NICUwaters (flowing at lower densities than the NGCU waters)that directly retroflects and join the EUC between 147°E and156°E, without rejoining the NGCU along the PNG coast,may also be more important than the one found in the model.Thus, along the PNG coast, and west of 156°E, the realNGCU and EUC should be weaker and deeper than mod-eled, but the observed EUC should be similar to the modeledEUC east of 156°E. This is exactly what is shown inFigure 3. Thus, the exact pathways of the NICU branch aresubject to uncertainty. However, our conclusions about thetransports at 156°E and eastward should not be affected.Nevertheless, this study highlights temporal and spatialundersampling of this critical region. The transport vari-ability of the two branches downstream the NICU bifurca-tion, north of New Ireland, would especially be worthsampling.
[62] Another limitation of our model is the misrepresen-tation of the Subsurface Countercurrents (SCCs). Thesouthern SCC origin is located close to Solomon Strait andflows at densities close to 26.5 – 26.75 kg m�3 [Rowe et al.,2000]. Some of the waters of the NGCU and NICU flowingat these densities may feed this SCC instead of the EUC, andour model may overestimate the contribution of these sour-ces to the EUC. The same is true for the Mindanao Currentand the northern SCC.[63] Mackey et al. [2002], Lacan and Jeandel [2001], and
Slemons et al. [2010, also submitted manuscript, 2011]highlighted the western Pacific and the NGCU as being amajor source of iron for the EUC waters. Iron is consideredthe main limiting nutrient for phytoplankton growth in theeastern equatorial Pacific, which explains its HNLC nature[Martin et al., 1994]. Our results fully support the fact thatthe NGCU is a major route for EUC waters. In addition,Slemons et al. [2010] found maximum iron concentrations tobe located in the deepest part at 165°E, at �250 m (anddownstream) at densities of 26.4 kg m�3 while the samemaximum was found deepest in the NGCU (460 m, 26.9 kgm�3) [see Slemons et al., 2010, Figures 5 and 6]. Such depthdifference was a somewhat puzzling result as it was not clearhow to relate the two water masses. Our findings give arationale for Slemons et al.’s [2010] results where iron richwaters from the NGCU at such low densities can eventuallyfeed the lowest EUC part, lightening along their route to theEUC under the influence of mixing. However, our studydoes not provide information about the SCCs capacity toconvey enriched waters toward the eastern Pacific, becauseof their misrepresentation in the model. Whether or not thesepowerful eastward veins play an important role as micro-nutrient conveyers remains to be elucidated.[64] Finally, the Lagrangian calculations are made here
over 20 years and therefore simulate pathways integrated intime. However, the pathways vary depending on the seasonand on the El Niño–Southern Oscillation phase [Ryan et al.,2006; Gorgues et al., 2010]. Ridgway et al. [1993] andMeletet al. [2010b] demonstrated that the transports in Vitiaz andSolomon Straits increase during an El Niño event. What isthe fate of this excess water transport? Do these sourcesdifferently feed the EUC, which strongly weakens during anEl Niño event? This should be explored in future studies.
[65] Acknowledgments. Wewould like to thank Gregory C. Johnson,Iawo Ueki, and the TAO project office for making their data available to us(TAO data are available online at http://www.pmel.noaa.gov). We also wantto thank the DRAKKAR project for making the ORCA025-G70 simulationavailable. We acknowledge the use of the ARIANE Lagrangian tool (http://www.univ-brest.fr/lpo/ariane/). Support for this study has been provided bythe Centre National de Recherche Scientifique (CNRS/INSU, LEFE pro-gram), the Agence Nationale de la Recherche (ANR), and the Institut deRecherche pour le Développement (IRD). Finally, we would like to thankJames W. Murray and the anonymous reviewer for their valuable commentsand suggestions, which improved the quality of this paper.
ReferencesArakawa, A. (1972), Design of the UCLA general circulation model:Numerical simulation of weather and climate, Tech. Rep. 7, 116 pp.,Dep. of Meteorol., Univ. of Calif., Los Angeles.
Barnier, B., et al. (2006), Impact of partial steps and momentum advectionschemes in a global ocean circulation model at eddy-permitting resolu-tion, Ocean Dyn., 56, 543–567, doi:10.1007/s10236-006-0082-1.
Blanke, B., and P. Delecluse (1993), Variability of the tropical AtlanticOcean simulated by a general circulation model with two different
GRENIER ET AL.: PACIFIC MODELED PATHWAYS AND WATER MASS EVOLUTIONS C12044C12044
14 of 16

mixed-layer physics, J. Phys. Oceanogr., 23, 1363–1388, doi:10.1175/1520-0485(1993)023<1363:VOTTAO>2.0.CO;2.
Blanke, B., and S. Raynaud (1997), Kinematics of the Pacific EquatorialUndercurrent: An Eulerian and Lagrangian approach from GCM results,J. Phys. Oceanogr., 27, 1038–1053, doi:10.1175/1520-0485(1997)027<1038:KOTPEU>2.0.CO;2.
Blanke, B., M. Arhan, G. Madec, and S. Roche (1999), Warm water paths inthe equatorial Atlantic as diagnosed with a general circulation model,J. Phys. Oceanogr., 29, 2753–2768, doi:10.1175/1520-0485(1999)029<2753:WWPITE>2.0.CO;2.
Butt, J., and E. Lindstrom (1994), Currents off the east coast of NewIreland, Papua New Guinea, and their relevance to regional undercur-rents in the western equatorial Pacific Ocean, J. Geophys. Res., 99,12,503–12,514, doi:10.1029/94JC00399.
Chavez, F. P., and R. T. Barber (1987), An estimate of new productionin the equatorial Pacific, Deep Sea Res., Part A, 34, 1229–1243,doi:10.1016/0198-0149(87)90073-2.
Chavez, F. P., and J. R. Toggweiler (1995), Physical estimates of globalnew production: The upwelling contribution, in Upwelling in the Ocean:Modern Processes and Ancient Records, edited by C. P. Summerhayes,pp. 313–320, John Wiley, New York.
Cravatte, S., A. Ganachaud, Q.-P. Duong, W. S. Kessler, G. Eldin, andP. Dutrieux (2011), Observed circulation in the Solomon Sea fromSADCP data, Prog. Oceanogr., 88, 116–130, doi:10.1016/j.pocean.2010.12.015.
Dutrieux, P., et al. (2008), Thermocline and subthermocline currents fromthe central to western equatorial Pacific: A snapshot view from theEUC-Fe campaign, paper presented at the 2008 Ocean Sciences Meeting,Am. Soc. of Limnol. and Oceanogr., Orlando, Fla., 2–7 March.
Fine, R. A., R. Lukas, F. Bingham, M. J. Warnar, and R. H. Gammon(1994), The western equatorial Pacific: A water mass crossroads,J. Geophys. Res., 99, 25,063–25,080, doi:10.1029/94JC02277.
Fukumori, I., T. Lee, B. Cheng, and D. Menemenlis (2004), The origin,pathway, and destination of Niño-3 water estimated by a simulated passivetracer and its adjoint, J. Phys. Oceanogr., 34, 582–604, doi:10.1175/2515.1.
Goodman, P. J., W. Hazeleger, P. de Vries, and M. Cane (2005), Pathwaysinto the Pacific Equatorial Undercurrent: A trajectory analysis, J. Phys.Oceanogr., 35, 2134–2151, doi:10.1175/JPO2825.1.
Gordon, A. L., and R. A. Fine (1996), Pathways of water betweenthe Pacific and Indian oceans in the Indonesian seas, Nature, 379,146–149, doi:10.1038/379146a0.
Gordon, R. M., K. H. Coale, and K. S. Johnson (1997), Iron distributionsin the equatorial Pacific: Implications for new production, Limnol.Oceanogr., 42, 419–431, doi:10.4319/lo.1997.42.3.0419.
Gorgues, T., C. Menkes, Y. Dandonneau, S. Alvain, C. Moulin, L. Slemons,and M.-H. Radenac (2010), Revisiting the La Niña 1998 phytoplanktonblooms in the equatorial Pacific, Deep Sea Res., Part I, 57, 567–576,doi:10.1016/j.dsr.2009.12.008.
Gouriou, Y., and J. Toole (1993), Mean circulation of the upper layers of thewestern equatorial Pacific ocean, J. Geophys. Res., 98, 22,495–22,520,doi:10.1029/93JC02513.
Hautala, S. L., J. S. Reid, and N. Bray (1996), The distribution and mixingof Pacific water masses in the Indonesian Seas, J. Geophys. Res., 101,12,353–12,373, doi:10.1029/96JC00037.
Hayes, S. P., L. J. Mangum, J. Picaut, A. Sumi, and K. Takeuchi (1991),TOGATAO: A moored array for real-time measurements in the tropicalPacific Ocean, Bull. Am. Meteorol. Soc., 72, 339–347, doi:10.1175/1520-0477(1991)072<0339:TTAMAF>2.0.CO;2.
Izumo, T., J. Picaut, and B. Blanke (2002), Tropical pathways, equatorialundercurrent variability and the 1998 La Niña, Geophys. Res. Lett.,29(22), 2080, doi:10.1029/2002GL015073.
Johnson, G. C., and M. J. McPhaden (1999), Interior pycnocline flow fromthe subtropical to the equatorial Pacific Ocean, J. Phys. Oceanogr., 29,3073–3089, doi:10.1175/1520-0485(1999)029<3073:IPFFTS>2.0.CO;2.
Johnson, G. C., B. M. Sloyan, W. S. Kessler, and K. E. McTaggart (2002),Direct measurements of upper ocean currents and water properties acrossthe tropical Pacific during the 1990s, Prog. Oceanogr., 52, 31–61,doi:10.1016/S0079-6611(02)00021-6.
Kashino, Y., M. Aoyama, T. Kawano, N. Hendiarti, Syaefudin, Y. Ananta-sena, K. Muneyama, and H. Watanabe (1996), The water masses betweenMindanao and New Guinea, J. Geophys. Res., 101, 12,391–12,400,doi:10.1029/95JC03797.
Kashino, Y., I. Ueki, Y. Kuroda, and A. Purwandani (2007), Ocean vari-ability north of New Guinea derived from TRITON buoy data, J. Ocea-nogr., 63, 545–559, doi:10.1007/s10872-007-0049-y.
Lacan, F., and C. Jeandel (2001), Tracing Papua New Guinea imprint on thecentral equatorial Pacific Ocean using neodymium isotopic compositions
and Rare Earth Element patterns, Earth Planet. Sci. Lett., 186, 497–512,doi:10.1016/S0012-821X(01)00263-1.
Landry, M. R., et al. (1997), Iron and grazing constraints on primary pro-duction in the central equatorial Pacific: An EqPac synthesis, Limnol.Oceanogr., 42, 405–418, doi:10.4319/lo.1997.42.3.0405.
Large, W., and S. Yeager (2004), Diurnal to decadal global forcing forocean and sea-ice models: The datasets and flux climatologies, Tech.Note NCAR/TN-460+STR, Natl. Cent. for Atmos. Res., Boulder, Colo.
Levitus, S., et al. (1998),World Ocean Database 1998, vol. 1, Introduction,NOAA Atlas NESDIS 18, 346 pp., U.S. Dep. of Commer., Washington,D.C.
Lindstrom, E., R. Lukas, R. Fine, E. Firing, S. Godgrey, G. Meyers, andM. Tsuchiya (1987), The western equatorial ocean circulation study,Nature, 330, 533–537, doi:10.1038/330533a0.
Liu, Z., S. G. H. Philander, and R. C. Pacanowski (1994), A GCM studyof tropical-subtropical upper-ocean water exchange, J. Phys. Oceanogr.,24, 2606–2623, doi:10.1175/1520-0485(1994)024<2606:AGSOTU>2.0.CO;2.
Lu, P., and J. P. McCreary (1995), Influence of the ITCZ on the flow ofthermocline water from the subtropical to the equatorial PacificOcean, J. Phys. Oceanogr., 25, 3076–3088, doi:10.1175/1520-0485(1995)025<3076:IOTIOT>2.0.CO;2.
Lukas, R., T. Yamagata, and J. P. McCreary (1996), Pacific low-latitudewestern boundary currents and the Indonesian throughflow, J. Geophys.Res., 101, 12,209–12,216, doi:10.1029/96JC01204.
Mackey, D. J., J. E. O’Sullivan, and R. J. Watson (2002), Iron in the west-ern Pacific: A riverine or hydrothermal source for iron in the EquatorialUndercurrent, Deep Sea Res., Part I, 49, 877–893, doi:10.1016/S0967-0637(01)00075-9.
Marin, F., B. L. Hua, and S. Wacongne (2000), The equatorial ther-mostad and subsurface countercurrents in the light of atmosphericHadley cells mechanism, J. Mar. Res., 58, 405–437, doi:10.1357/002224000321511098.
Marin, F., E. Kestenare, T. Delcroix, F. Durand, S. Cravatte, G. Eldin,and R. Bourdallé-Badie (2010), Annual reversal of the EquatorialIntermediate Current in the Pacific: Observations and model diagnos-tics, J. Phys. Oceanogr., 40, 915–933, doi:10.1175/2009JPO4318.1.
Martin, J. H., et al. (1994), Testing the iron hypothesis in ecosystems ofequatorial Pacific Ocean, Nature, 371, 123–129, doi:10.1038/371123a0.
McPhaden, M. J. (1988), PMEL current mooring program in the tropicalPacific, in Proceedings of the U.S. Global Ocean Flux Study PacificPlanning Report, JGOFS Plann. Rep. 9, pp. 91–94, Woods HoleOceanogr. Inst., Woods Hole, Mass.
Melet, A., L. Gourdeau, W. S. Kessler, J. Verron, and J.-M. Molines(2010a), Thermocline circulation in the Solomon Sea: A modeling study,J. Phys. Oceanogr., 40, 1302–1319, doi:10.1175/2009JPO4264.1.
Melet, A., L. Gourdeau, and J. Verron (2010b), Variability in SolomonSea circulation derived from altimeter sea level data, Ocean Dyn., 60,883–900, doi:10.1007/s10236-010-0302-6.
Melet, A., J. Verron, L. Gourdeau, and A. Koch-Larrouy (2011), Equator-ward pathways of Solomon Sea water masses and their modifications,J. Phys. Oceanogr., 41, 810–826, doi:10.1175/2010JPO4559.1.
Molines, J.-M., B. Barnier, T. Penduff, L. Brodeau, A.-M. Treguier,S. Theetten, and G. Madec (2006), Definition of the interannual experi-ment ORCA025–G70, 1958–2004, Rep. LEGI-DRA-2–11–2006i, Lab.des Ecoulements Geophys. et Ind., Grenoble, France.
Murray, J. W., R. T. Barber, M. R. Roman, M. P. Bacon, and R. A. Feely(1994), Physical and biological controls on carbon cycling in the equato-rial Pacific, Science, 266, 58–65, doi:10.1126/science.266.5182.58.
Qu, T., and E. J. Lindstrom (2004), Northward intrusion of Antarctic Inter-mediate Water in the western Pacific, J. Phys. Oceanogr., 34, 2104–2118,doi:10.1175/1520-0485(2004)034<2104:NIOAIW>2.0.CO;2.
Ridgway, K. R., J. S. Godfrey, G. Meyers, and R. Bailey (1993), Sea levelresponse to the 1986–1987 El-Nino Southern Oscillation event in thewestern Pacific in the vicinity of Papua New Guinea, J. Geophys. Res.,98, 16,387–16,395, doi:10.1029/93JC00766.
Rodgers, K. B., B. Blanke, G. Madec, O. Aumont, P. Ciais, and J.-C. Dutay(2003), Extratropical sources of equatorial Pacific upwelling in anOGCM, Geophys. Res. Lett., 30(2), 1084, doi:10.1029/2002GL016003.
Rowe, G. D., E. Firing, and G. C. Johnson (2000), Pacific equatorialsubsurface countercurrent velocity, transport, and potential vorticity,J. Phys. Oceanogr., 30, 1172–1187, doi:10.1175/1520-0485(2000)030<1172:PESCVT>2.0.CO;2.
Ryan, J. P., I. Ueki, Y. Chao, H. Hang, P. S. Polito, and F. P. Chavez(2006), Western Pacific modulation of large phytoplankton blooms inthe central and eastern equatorial Pacific, J. Geophys. Res., 111,G02013, doi:10.1029/2005JG000084.
Schiller, A., P. R. Oke, G. B. Brassington, M. Entel, R. Fiedler, D. A.Griffin, and J. V. Mansbridge (2008), Eddy-resolving ocean circulation
GRENIER ET AL.: PACIFIC MODELED PATHWAYS AND WATER MASS EVOLUTIONS C12044C12044
15 of 16
in the Asian-Australian region inferred from an ocean reanalysis effort,Prog. Oceanogr., 76, 334–365, doi:10.1016/j.pocean.2008.01.003.
Schneider, N. (2004), The response of tropical climate to the equatorialemergence of spiciness anomalies, J. Clim., 17, 1083–1095, doi:10.1175/1520-0442(2004)017<1083:TROTCT>2.0.CO;2.
Schott, F. A., J. P. McCreary, and G. C. Johnson (2004), Shallow overturn-ing circulations of the tropical-subtropical oceans, in Earth Climate: TheOcean-Atmosphere Interaction, Geophys. Monogr. Ser., vol. 147, editedby C. Wang et al., pp. 261–304, AGU, Washington, D. C.
Slemons, L. O., J. W. Murray, T. Gorgues, O. Aumont, and C. Menkes(2009), Biogeochemical impact of a model western iron source in thePacific Equatorial Undercurrent, Deep Sea Res., Part I, 56, 2115–2128,doi:10.1016/j.dsr.2009.08.005.
Slemons, L. O., J. W. Murray, B. Paul, and P. Dutrieux (2010), WesternPacific coastal sources of iron, manganese and aluminum to the EquatorialUndercurrent, Global Biogeochem. Cycles, 24, GB3024, doi:10.1029/2009GB003693.
Stockdale, T., A. Busalacchi, D. E. Harrison, and R. Seager (1998), Oceanmodeling for ENSO, J. Geophys. Res., 103, 14,325–14,355, doi:10.1029/97JC02440.
Tsuchiya, M., R. Lukas, R. Fine, E. Firing, and E. Lindstrom (1989),Source waters of the Pacific Equatorial Undercurrent, Prog. Oceanogr.,23, 101–147, doi:10.1016/0079-6611(89)90012-8.
Ueki, I., Y. Kashino, and Y. Kuroda (2003), Observation of current varia-tions off the New Guinea coast including the 1997–1998 El Niño period
and their relationship with Sverdrup transport, J. Geophys. Res., 108(C7),3243, doi:10.1029/2002JC001611.
Uppala, S. M., et al. (2005), The ERA-40 re-analysis, Q. J. R. Meteorol.Soc., 131, 2961–3012, doi:10.1256/qj.04.176.
Wijffels, S., E. Firing, and J. Toole (1995), The mean structure and var-iability of the Mindanao Current at 8°N, J. Geophys. Res., 100,18,421–18,435, doi:10.1029/95JC01347.
Zenk, W., G. Siedler, A. Ishida, J. Holfort, Y. Kashino, Y. Kuroda,T. Miyama, and T. J. Müller (2005), Pathways and variability of the Ant-arctic Intermediate Water in the western equatorial Pacific Ocean, Prog.Oceanogr., 67, 245–281, doi:10.1016/j.pocean.2005.05.003.
B. Blanke, Laboratoire de Physique des Océans, UMR 6523, CNRS/IFREMER/IRD/UBO, Université de Bretagne Occidentale, UFR Sciences,6 avenue Le Gorgeu, F-29238 Brest CEDEX, France.S. Cravatte, F. Durand, M. Grenier, C. Jeandel, and A. Koch-Larrouy,
LEGOS, 14 Avenue Edouard Belin, F-31400 Toulouse CEDEX, France.([email protected])A. Melet, LEGI, UMR 5519, CNRS, Université de Grenoble, BP 53,
F-38041 Grenoble CEDEX 9, France.C. Menkes, LOCEAN, UPMC/IRD/CNRS/MNHN, Université Pierre et
Marie Curie, Case 100, 4 place Jussieu, F-75252 Paris CEDEX 05, France.
GRENIER ET AL.: PACIFIC MODELED PATHWAYS AND WATER MASS EVOLUTIONS C12044C12044
16 of 16