from the sun's energy source to the formation of the solar ... · and other sites. the...
TRANSCRIPT

From the sun's energy source to the formation of the solar system
Dan Bar-Zohar Copyright © 2010 Dan Bar-Zohar All rights reserved. This book, or parts thereof, may not be reproduced in any form or by any means, electronic or mechanical, including photocopying, recording or any information storage and retrieval system now known or to be invented, without written permission from the Publisher.

Forward This book contains several articles that were published online in philica.com and other sites. The articles suggest that the sun and stars energy source is not from fusion, but instead from magnetic fields spreads in the galaxy by the supermassive black hole at the center of every galaxy. This idea changes every aspect of astronomy and cosmology. The big bang is no longer necessary to explain the source of the mass in the universe and the expansion of the universe. According to this theory the matter in the universe is created in the cores of stars by conversion of energy to mass. The expansion of the universe is induced by the rapid formation of new galaxies. Stars grow slowly and gradually over tens of billion of years by conversion of energy to mass. The gradual growth of stars and the planet search programs that found hundreds of nearby planets indicate that stars are born from planets. This invalidates the solar nebula hypothesis as the source of the stars and the solar system. Stars fluctuate from a main sequence state to a red giant state. They stay in the main sequence when they receive strong magnetic fields and they turn into a red giant when the magnetic fields are weakened. The sun also fluctuated from a main sequence to a red giant. When the sun was a red giant it had strong solar wind that supplied the material to created the planets. The solar system contains hard evidence that the sun was a red giant, those are short lived isotopes and chondrules. The fact that there is hard evidenced to a red giant sun confirm this theory. Highlights of this theory include the following:
1. The sun energy source is from magnetic fields from the galactic center.
2. The heat induced by the magnetic fields leads to high energy collision between particle in the sun core that creates new particle and increase the sun mass.
3. All the stars in the galaxy create new mass so the total mass and the size of the galaxy is increasing.
4. The stars in the galaxy eject dust that freefall to the galactic center supermassive black hole. Thorough the dynamo effect the gravitational potential energy of the debris and dust is converted to magnetic fields.
5. As the galaxy mass and size increase, globular clusters are detached form the main galaxy to create new galaxies.
6. Galaxies spawn new galaxies and the total number of galaxies in the universe increase.
7. The universe expands and accelerates from the increase in the number of the galaxies.
8. The Big Bang cosmological model is replaced by a new cosmological model that resembles the steady state theory.
9. Stars grow gradually from conversion of energy to mass. 10. Stars are born from planets, they first grow by accretion and then by
conversion of energy to mass. 11. Stars fluctuate from main sequence to a red giant. When the magnetic
fields are strong the star is in the main sequence, when the magnetic fields are weakened the star turn to a red giant.
12. The sun was a red giant 4.6 billions years ago. 13. The planets were created from the strong solar wind of the red giant
sun.

TABLE OF CONTENT 1. The sun's energy source is not nuclear fusion, but magnetic fields from the center of the Galaxy. The sun converts energy to mass and not mass to energy. 1.1. Introduction 1 1.2. Rotation curve 3 1.3. Superconductor and magnet model of the stars 5 1.4. Similarity to an electric induction motor 12 1.5. Magnetic eddy circuitry 15 1.6. Effect on Earth and the solar planets 15 1.7. Solar Cycle 16 1.8. The sun energy balance 19 1.9. Neutrino emission from the sun 21 1.10. Tokamak converts energy to mass and not mass to energy 21 1.11. The galaxy energy cycle 21 1.12. Spawning of a small galaxy by a larger galaxy 26 1.13. Acceleration of the universe 30 1.14. Stellar evolution 33 1.15. Globular clusters and the Hertzsprung - Russell diagram 33 1.16. Elliptical galaxies 35 1.17. Probing magnetic fields in the solar system 36 1.18. Conclusion 37 2. The sun was a red giant 4.6 billion years ago - the planets were born from the solar wind of the red giant sun. 2.1. Introduction 40 2.2. There is a mix up between young stars and old stars 42 2.3. Stars originate from planets 44 2.4. The high metallicity of stars with planets 55 2.5. The sun was a red giant 63 2.6. The planets were born from the solar wind of the red giant Sun 75 2.7. Conclusions 89

3. The sun produces muon neutrinos flux without neutrino oscillations 3.1. Short history 92 3.2. The beta decay 93 3.3. The first solar neutrino experiment at Homestake 95 3.4. The Super-Kamiokande experiment 96 3.5. The SNO experiment and the solar muon neutrino flux 102 3.6. The particle interactions inside the sun 105 3.7. Conclusion 108 4. The sun can absorb large amount of energy from weak magnetic fields due to its low resistivity 4.1. The sun can absorb large amount of energy from weak magnetic fields due to its low resistivity. 110 4.2. Estimating the sun age from its mass growth rate 115 4.3. Conclusion 116 5. Stellar rotation is driven by magnetic fields in the galactic disc 5.1. Introduction 117 5.2. Relation between the star temperature and its stellar cycle period 119 5.3. Jupiter has a unique stellar cycle with long period 124 5.4. The jets streams on Jupiter are driven by Jupiter stellar cycle 131 5.5. Great red spot is an electric storm driven by the charged jet streams139 5.6. Sunspots are electric vortexes between two charged plasma belts 142 5.7. Stellar rotation is driven by the plasma belts and the stellar cycle 146 5.8. The uniformity of rotation in the solar system is caused by the solar wind 149 5.9. Rotation of the galaxy 152 5.10. Spawning of new galaxies is based on globular clusters 155 5.11. Conclusion 157

The sun's energy source is not nuclear fusion, but magnetic fields from the center of the Galaxy. The sun converts energy to mass and not mass to energy. Abstract The sun energy source is thought to be a nuclear fusion reactor inside the sun core. The sun is not heated by fusion reaction but by magnetic fields coming from the galactic center. The nuclear fusion is a by product of the magnetic fields heating. The changing magnetic fields from the galactic center induce electric currents inside the sun that heat the sun. The heat and the high kinetic energy of particles in the sun core, trigger high energy collisions that create the main constituents of matter, electron, proton and neutron. The collisions also fuse or nucleosynthesis heavier elements like deuterium, tritium, helium and lithium. This leads to the fact that the stars and galaxies constantly produce mass and energy. The article will explain the clockworks behinds the galaxies energy production. The galaxy energy and mass production cancel out the Big Bang theory and leads to a steady state cosmological model with large amount of new mass created that expand and accelerate the universe. Introduction The latest development in cosmology especially the finding that the universe is not only expanding but also accelerating brings back Einstein cosmological constant. To explain the accelerating universe dark energy is assumed to repel the galaxies and cause the acceleration of the universe. The dark energy is based on developments in quantum mechanics that find huge quantities of energy in vacuum. The dark energy and dark matter that explains the rotation curves of galaxies is found to be 96% of the universe while the regular baryonic matter that the stars and plants are build of is only 4%. However there is no experiment done on earth or conclusive evidence that proves such dark matter or dark energy truly exists. This lack of prove is also true for the Big Bang Theory. There is no experiment to show that vacuum can spontaneously explode creating high energy and mass. The source of such unintuitive theories, to explain cosmological observation, emerges from our misunderstanding of an every day process that is taken for granted and is never questioned. This is our understanding or rather misunderstanding of the energy source of the sun and other stars. There is a historical theory that tries to explain the sun heat based on gravitational energy. According to this theory the sun was created from solar nebula. When all the atoms free fall to the center of the nebula their speed was converted into heat. Similar theory was proposed in the nineteen century by Lord Kelvin and said that the sun heat is from gravitational energy especially by meteorites falling into the sun.
1

The current day nuclear theory says that the sun is a nuclear fusion reactor and the heat emerges from fusion of hydrogen atoms to helium. The fused helium is lighter then the hydrogen so the sun converts the mass surplus into energy. Still there are some difficulties in this model. In every galaxy there are constantly new born stars. Some of them the blue super giants are 50 times more massive then the sun and they burn hydrogen much faster then the sun. This limits their life expectancy to only about ten million years. If such massive stars are born constantly, and they burn hydrogen so fast, the hydrogen is burning very fast, so where all the hydrogen is coming from. The interstellar medium does not contain so much hydrogen. The interstellar hydrogen is coming from stars inside the galaxy in stellar wind, and in supernovae. The source of the universe mass and energy was a mystery and lead to the creation of the Big Bang theory. The Big Bang theory try to explain that by stating that all the matter of the universe including the hydrogen fuel was created at the time of the Big Bang. This paper will show that the true mass and energy source of the universe is the galaxy. Many facts that will be presented here show that the source of the sun heat is changing magnetic fields or induction. The magnetic fields are coming from the galactic center; they propagate through the galactic disk and heat all the stars in the disk. The changing magnetic fields create by induction electric currents in the sun plasma. The electric currents heat the sun plasma and make the sun shine. Fusion of hydrogen in the sun is a by product of the heat created by the magnetic fields. At the sun core the immense heat created by the induction currents increase the particle speed and kinetic energy. As the particles collide their high kinetic energy is converted to mass by creating new particles according to Einstein equation E=MC2. The sun is not converting mass into energy but converting energy into mass. Many of the observed phenomena on the sun are magnetic so it is reasonable to think that the sun is heated by magnetic induction. This stars mass creation can explain where all the mass in the universe came from and why the universe is expanding and accelerating. It also can explain how the heavy elements are created in the universe. It is believed that many heavy elements are created in supernovae; this is because the fusion of heavy elements consumes energy and not produces energy as hydrogen does. Since the energy of the stars is coming from magnetic fields and not from fusion then the nucleosynthesis of heavy elements occur in red giants. If the stars produce mass and energy then we can say that the galaxies produce mass and energy. The galaxies are the universe machines to create mass and energy. If the sun is heated from magnetic fields from the center of the galaxy, where the energy of the galaxy is coming from? The magnetic fields create mass in the stars, and when this mass is ejected into space as solar wind, it starts to free fall to the center of the galaxy. The gravitational potential energy of the free falling dust and gas is collected by accretion disks of black holes at the galactic center. This gravitational potential energy is much higher then the energy used to create the mass. The accretion disks combined with the dynamo effect create the magnetic fields at the galactic center that produce more mass at the stars, and so forth. If a galaxy is getting bigger and heavier all the time at some point it will spawn a new galaxy. The continuous addition of mass to the galaxy increases the mass of the spiral arms of the galaxy, and increase the arm length and its distance from the galactic center.
2

The stellar wind ejected by the stars at the remote arm begin to collect locally at the arm itself until the arm is so heavy it detach from the main galaxy and became a satellite galaxy. Many of the pictures taken of colliding galaxies or interacting galaxies are actually instances of one galaxy spawning another. The spawning of new galaxies, lead to the expansion and acceleration of the universe. Rotation curve The rotation speed of stars in the galactic disk around the galactic center should obey Kepler third law. The expected stars speed should be proportional to the inverse of the radius squared as shown in Figure 6-(B). However observation of various galaxies yields a rotation curve that is almost flat Figure 6-(A). The usual explanation for the flat curve is based on the existence of dark matter that has no luminosity and cannot be seen. The dark matter is filing the galactic disk far beyond the stars to increases the gravitation in the galaxy. It is possible to explain the flat rotation curve based on magnetic fields in the galaxy. I will start first by depicting a well known experiment. The magnet levitation over a superconductor Figure 1 or the Meissner effect causes a magnet to float in the air when placed over a superconductor. The magnetic field of the magnet induces electro-motive force and currents in the superconductor according to Faraday’s law. Those currents according to Lenz’s law create magnetic fields in the superconductor that oppose the magnet magnetic fields and therefore repel it to make it float and oppose gravity. If I take a string and tie it to the superconductor I can drag the superconductor slice along the table Figure 2. If the magnet is floating on the superconductor and you drag the superconductor the magnet will not fall to the table but will follow the superconductor and stay floating on top of it wherever we drag it. This is also an outcome of Lenz’s law. The induced currents and magnetic fields of the superconductor will oppose any movement of the magnet above relative to the superconductor. The hot plasma in the sun and other stars has very low electric resistance. The resistance of the plasma is much lower then that of a metal and is very close to that of a superconductor. However its resistant is not zero and electric current inside the plasma will produce heat. The sun interior is not completely homogonous and there are sections of plasma that have different electric conductivity. In additional to the property of a superconductor the sun has the property of a magnet. The sun magnetic filed has similarities to the earth magnetic field. The sun has a dipole magnetic field, and it is similar to that of a bar magnet. One unique property of Superconductors is that the magnetic fields inside them are very close to zero. However the star plasma has higher then zero conductivity and magnetic fields pass through the plasma to produce heat. Not only that the star high magnetic permeability concentrate the magnetic fields from space to absorb more energy.
3

Figure 1: Magnetic Levitation of a magnet over super conductor. The conductivity of the plasma that the stars are built of is very high and near that of a super conductor. The stars could be imagined as pairs of superconductor and a magnet. This explains how slip in the galactic disk and movement of the stars relative to each other, induces electric currents in the stars plasma that is turned into heat that make the stars shine. This also explains the repulsion between stars and between galaxies.
Figure 2: If you take a superconductor and place a magnet on it, the magnet will hover above the superconductor. Suppose when the magnet is hovering you connect a string to the superconductor and drag the superconductor on the table. The magnet will stay hovering above the superconductor and will follow the superconductor. This demonstrates that the stars resist slip of the galactic disk and that resistance creates induction currents in the stars and heats them.
4

Superconductor and magnet model of the stars Knowing that a star is composed of plasma with low resistance and has a magnetic field of a magnetic dipole, suggest a model of the sun and stars. The star according to this model has the combined properties of a superconductor and a magnet Figure 3. The stars will therefore behave similarly to the magnet and superconductor in the Meissner effect. A star will oppose the movement of nearby star. When, for instance a first star move toward a second star, the first star magnetic field will induce currents in the second star. According to Lenz’s law those currents will produce magnetic fields in the second star that will oppose the magnetic fields and movement of the first star. The resistant to movement will occur whenever a star move relative to another.
Figure 3: A star could be depicted as a combination of a superconductor and a magnet. The superconductor is a result of the high conductivity of the plasma and the magnet is a result of the star magnetic field. The star magnetic field is a combination of the magnetic fields from the galaxy that magnetize the star and internal magnetic fields created by the induced currents in the sun. The combination of superconductor and a magnet repel the stars from each other and eliminate collision between them. Since galaxies include many stars they also can be depicted as a combination of magnet and a superconductor. The repulsion and resistance to movement can explain why there are no collisions between main sequence stars like the sun. Though, there are hundred billion stars in the galaxy the main sequence stars never collide. Other stars like neutron stars and white dwarf can collide because they are not composed of plasma and do not have the property of superconductor. The neutron stars could be imagined only as a magnet. Therefore neutron star will repel main sequence stars like the sun. However when two neutron stars come close together they cannot repel each other because there is no superconductor involve. Not only their gravity pulls them together but their magnetic fields align and add
5

pulling force. The north pole of one neutron star come close and attracts the south pole of the second neutron star. Observations of sudden gamma ray bursts in the universe are known to occur from neutron stars massive collisions. Also white dwarfs are prone to collide. Whit dwarfs are lacking both plasma and magnetic fields. Some of the supernovae explosions are connected with white dwarfs. Since neutron stars and white dwarfs can easily approach a star, many binary stars (for instance Sirius) include white dwarfs or neutron star. One way to look at it is to divide the stars into two categories. One is like the white dwarfs and is affected only by gravitational fields and general relativity. The Second is effected by both the magnetic fields and the gravitational fields. The galaxies similar to the stars inside them could be depicted also as a combination of magnet and superconductor. Seeing the galaxy as magnet and superconductor combination can easily explain the repulsion between galaxies, leading to the expansion and acceleration of the universe. This model can also imply that collisions between galaxies are rare. The rarity of collision between main sequence stars is a clear indication to the rarity of collision between galaxies. Most of the interacting galaxies observed are actually a creation of one galaxy from another or in other worlds spawning of a smaller satellite galaxy from a larger galaxy. In the experiment of Figure 2 it was shown that superconductor will not only repel a magnet but will also resist any movement of the magnet relative to the super conductor. As shown in Figure 3 the stars could be depicted as a combination of superconductor and magnet. This lead to a model of the galactic disk, shown in Figure 4, that includes rings or layers of superconductor material and magnets. The superconductor in such a model will resist any movement of magnets in relation to them. When magnets will move in relation to the superconductor induction currents will flow in the superconductor that according to Lenz’s law will create magnetic fields that will oppose and repel the magnetic fields of the magnets. This implies a rigid model of the galactic disk where any movement of stars will be resisted. If we draw a rotation curve of the galactic disk according to the model of Figure 4 we will get a straight line as shown in Figure 5 where all stars have the same angular velocity. However the observed rotation curve as shown in Figure 6 implies that the angular velocity of stars far from the galactic center is smaller then stars near the galactic center. This means that there is movement of the magnets relative to the superconductors and induction currents are created. Since the stars plasma is not a perfect superconductor the currents create heat.
6

Figure 4: A star could be imagined as a pair of superconductor and a magnet. When one star moves toward a second star according to Lenz’s law the second star will repel the first star and oppose the movement. The magnetic fields of the first star induce electro-motive forces and currents, according to Faraday’s law, in the second star, and those currents create magnetic fields that repel the first star. This means that the stars will resist relative movement in the galactic disk. This leads to the rigid model of the galactic disk shown in this figure and a rotation curve shown in Figure 5. The actual flat rotation curve of the galaxies implies that the stars move in relation to each other. This creates induction currents and heat that fuel the stars.
7

Figure 5: According to the superconductor and magnet model of the stars shown in Figure 4. The stars will resist slip in the galactic disk. Therefore the relation between the star distance from the galactic center and rotational speed should be a straight line as shown in this graph. The deviation of the observed rotation curve of the galaxies from this linear relation shows that a considerable slip happens. The slip indicates that large amount of heat is produced in the stars.
8

Figure 6: Rotation curve of a galaxy. The speed of stars at the galactic disk should obey Kepler law and have a velocity that is inverse to the square of the distance to the galactic center. Actual measurements find that the rotation curve is almost flat. As shown in Figure 7 this could be explained by rotating magnetic fields that increase the velocity of the galactic disk. It could be also explained by the superconductor combined with magnet model of the stars that resist slip at the galactic disk. The fact, that there is movement and slip in the galactic disk leads to a second model of the galaxy Figure 7. According to this model the galactic disk is comprised of several concentric rings capable of rotation on the same axis with air gap between the rings. Each ring includes an inner iron layer and an outer layer comprised of magnets. The galactic center in the model is also comprised of magnets. The rotation of the galactic center rotates the magnets at the galactic center and creates rotating magnetic fields. Those rotating magnetic fields induce current through the air gap in the iron layer of the first ring. The induced currents according to Lenz’s law will create magnetic fields that oppose the magnetic fields of the galactic center and will apply force to rotate the first ring. The first ring magnets layer will induce currents in the second ring iron layer and will rotate the second ring and so on. This way all the rings will rotate in the same direction but with different angular velocities. The inner ring will have the higher angular velocity and the most outer will have the smaller angular velocity. The velocity difference or slip means that the magnetic fields of the magnets cross the iron layers and create heat.
9

Figure 7: The galactic disk could be imagined as rings of iron and magnets layers. The galactic center in the model is comprised of rotating magnets, creating rotating magnetic fields. Those magnetic fields rotate the iron layer of the second ring according to Lenz’s law. The outer magnets of the second ring rotate the third ring and so forth. If the relation of a ring distance from the center to ring speed should be similar to the graph in Figure 5, then each ring angular velocity should be the same as its inner ring. If a ring is not with the same angular velocity but its angular velocity is slower then the inner ring (as in a galaxy rotation curve) a slip is created and the magnets of the inner ring heat the iron of the outer ring. In an exercise magnetic bike an iron wheel is spinning near magnets that break its rotation. After a workout you can feel the heat coming from the iron wheel. According to the models of Figure 4, 7 the observed flat rotation curve and its deviation from the expected rotation curve of the galaxy could be explained. The forces that the rotating magnetic fields in the galactic center and in the galactic disk exert on the stars increase their angular velocity.
10

In Figure 10 there is an alternative model of the magnetic fields emanating from the galactic center. In Figure 7 the galactic center is depicted as a cylinder that stripes of north and south magnet poles are placed parallel to the cylinder axis. This placement will enable the rotating galactic center to heat the galactic disk by induction and to increase the angular velocity of the stars as observed by the flat rotation curve. However as in Figure 10 the galactic center could be depicted as several magnetic dipoles. This could be created if there is more the one black hole in the galactic center or there is a combination of black holes and neutron stars. The accretion disks of black holes and neutron stars will create magnetic dipoles that will align in opposite directions to each other as shown in Figure 10. With this arrangement the induction heating and the increased rotation speed of the galactic disk will be feasible.
Figure 10: The magnetic fields created by the galactic center can be understood from this model. The galactic center contains several magnetic dipoles created by black hole and neutron star accretion disks. Those magnetic dipoles rotate with the galactic center, and send changing magnetic fields to the galactic disk, that heat the stars and increase their rotational speed. The induction that transfers energy from the galactic center to the galactic disk does not require magnetic field in the galactic disk. The induction can be done by what is called
11

“induced electric fields”. For demonstration we can take a long solenoid and put it inside a larger copper ring that its diameter is three times then that of the solenoid. If we pass changing current in the solenoid it will create changing magnetic flux. The flux will induce in the ring current. However the ring is not in a magnetic field therefore, we cannot say that the current in the ring is from influence of magnetic field on charged particles inside the ring. So it is explained by saying that “induced electric field” in the ring is caused by the changing magnetic flux in the solenoid. The induced electric field can be stated with a modification of Faraday’s law.
dE dldtφ
= −∫ i
Whereφ is the magnetic flux through the solenoid, E is the induced electric field in the ring and l is the circumference of the ring. Similarly we can say that even if the galactic disk is not in a magnetic field induction is possible. Changing magnetic flux at the galactic center perpendicular to the galactic disk can induce currents in the stars by induced electric fields. Similarity to an electric induction motor The model of Figure 7 resembles in operation to an induction electric motor. The galactic center of Figure 7 resembles the stator of such induction electric motor and the galactic disk resembles the rotor. The stator of an induction motor produces a rotating magnetic field. The rotating magnetic field cross the rotor and induce currents in the rotor. The currents create magnetic fields that attract the stator magnetic fields and rotate the rotor. The currents in the rotor are analogous to the currents that heat the stars in the galactic disk. Figure 8 shows a graph of the rotor currents as a function of the rotor speed. The rotor speed in the graph on the X axis is the difference in percent of the rotor angular velocity and the stator magnetic fields angular velocity. The graph shows that when the rotor speed is identical to the stator speed no currents are induced in rotor. This situation is analogous to a rotation curve of the galaxy similar to that of Figure 5, with such rotation curve no currents are expected to flow inside the stars. When the rotor speed in Figure 8 decrease and the slip between the stator and the rotor increase more magnetic field lines cross the rotor and more current is induced. This is analogous to the observed rotation curve in Figure 6 where there is a slip in the galactic disk as demonstrated in the model of Figure 7. The currents in the rotor produce torque that through the rotor shaft can transmit mechanical work. This torque can explain the deviation of the rotation curve of the galaxies from the expected rotation curve. The galactic center applies this torque on the galactic disk to increase the speed of the stars. If you take an induction motor like a fan motor and block the fan, the motor will heat very quickly because the rotor currents are very high. This can demonstrate the heat produced in the stars from the galactic disk slip. In summary, the slip at the galactic disk make stars cross magnetic fields from other stars, this apply torque that increase the speed of the stars and create heat.
12

Figure 8: Rotor current as a function of rotor speed of an electric induction motor. As the rotor get slower the rotating magnetic field of the stator cross the rotor faster and the rotor currents increase. The galactic center is analogous to the stator and the galactic disk is analogous to the rotor. The flat rotation curve of the galaxy in Figure 6 imply that slip occur in the galactic disk leading to induction currents in the stars. There are two constituents producing the changing magnetic fields in the galactic disk. One is the rotating magnetic fields from the galactic center. The second is the slip in the galactic disk. The magnetic fields from the galactic center supply the energy to the galactic disk and apply torque to increase the speed of the galactic disk. The galactic disk slip conveys the torque and energy from the galactic center to the outer sections of the galactic disk. The production of energy and changing magnetic fields is at the galactic center where black hole accretion disk converts mass to energy. The slip supports the rigid behavior of the galactic disk Figure 4 and affects the star speed at the inner and outer sections of the galactic disk. The torque on the stars in the galactic disk near galactic center is forward, from the galactic center and backward, from the slip. Why the slip is pulling backward could be shown in the model of Figure 7 by the torque backward that an outer ring exerts on an inner ring. The torque on the stars at the outer sections of the galactic disk is forward by the slip.
13

Figure 9: The changing magnetic fields from the galactic center create magnetic fields eddies in the galactic disk. Each of those eddies is a magnetic circuitry that encompass million of start. In the figure part of a magnetic circuitry is shown passing magnetic flux in nearby stars. Those changing magnetic fields create the sun solar cycle and change the sun magnetic polarity from one solar cycle to the next. Those changing magnetic fields heat the stars. Some of the energy they supply is converted into mass and some is converted into electromagnetic radiation or luminosity.
14

Magnetic eddy circuitry The galactic center creates changing magnetic fields that are sent to the galactic disk to induce current and heat in the stars. When changing magnetic fields pass through a large lump of iron or copper eddy currents are created and heat the metal. Those eddies are usually chaotic in nature. When we speak of the galactic disk we cannot speak of eddy currents because the space between the stars is not conducting. However the magnetic fields in the galactic disk could create eddies of magnetic fields and magnetic circuitry. Keeping in mind that the stars are different in size and type and the distance between them is not constant we can imagine that the magnetic fields are dispersed in very complex patterns. We can therefore predict that the galactic center transmits energy to the far sections of the galactic disk not by far reaching magnetic fields but through magnetic eddies. Such magnetic eddy circuitry can encompass millions of stars. In Figure 9 part of a magnetic circuitry is shown. The magnetic field lines are concentrated and pass through the stars due to the high magnetic permeability of the plasma. Those magnetic fields create the dipole pattern of the sun magnetic field. In Figure 9 the concentration of the magnetic fields by the stars decrease the magnetic field in the nearby left and right of the stars. This magnetic shading reduces the magnetic fields in the solar planets and in earth. The Ulysses probe was send above the sun poles and find strong magnetic fields at high altitude over the poles. The high altitude and strength of those magnetic fields is indication that the sun is part of large magnetic circuitry that cross the sun and encompass many stars. Effect on Earth and the solar planets The solar planets have heat or energy surplus. They are hotter then what they suppose to be from the sun radiation. The heat surplus of the solar planets and earth could be explained by changing magnetic fields from the galactic center. The earth heat surplus is explained by the heat emitted by nuclear fission of heavy elements in earth. However the amount of heavy elements at the earth interior is unknown. It could be that nuclear heating can only produce few percent of the heat of the earth interior and the rest is from heat produced by magnetic fields from the galactic center. The high permeability of the iron at the earth interior helps to concentrate the magnetic fields and produce more heat. Strong evidence to the heating of earth by magnetic fields is the movement of the tectonic plates. The movement of the tectonic plates cannot be explained clearly by the convection model. The earth tectonic plates movement is a Magneto Hydrodynamics phenomena (MHD) caused by magnetic fields from the galactic center. The strong winds at the outer solar planets are also Magneto Hydrodynamics phenomena caused by magnetic fields from the galactic center. Magnetic fields will change an elliptical trajectory of a star, planet or moon to a circular trajectory. When for instance a moon with elliptical trajectory that its core is electrically conductive and it circles a planet that has significant magnetic field, there will be induced currents and electro-motive force that according to Lenz’s law will resist any change of
15

the distance between the moon and the planet. If the moon will increase its distance from the planets according to Lenz’s law it will be attracted more strongly to the planet, if it will get closer to the planet it will be repelled by the planet. This way the magnetic forces will change its elliptical trajectory to a circular trajectory and in the process will convert part of the kinetic energy of the moon to heat. Solar Cycle The solar cycle’s activity is monitored from about the year 1750 by counting the number of sunspots. The solar cycle repeat every 11 years during which the sunspots number reaches a maximum. The occurrence of sunspots is accompanied with strong magnetic fields at the sun surface. The sun is a magnetic dipole just like earth but the sun dipole polarity is changing with the solar cycle and has different magnetic polarity every 11 years. According to the current solar model it is believed mistakably that the solar cycle and the changing of the magnetic polarity is induced internally by the sun itself. However this is incorrect. The source of the sun solar cycle and the changing of the magnetic polarity are induced by magnetic fields originated at the galactic center. The mechanism by which the galactic center delivers power and energy to the sun and other stars is based on changing magnetic fields. The solar cycle and the changing magnetic polarity in the sun is manifestation of the galactic center magnetic fields power transmission. The galactic center apply changing magnetic field to the sun that are strong enough to change the sun polarity every 11 years. Those magnetic fields induce electric currents in the sun plasma that heat the sun. Figure 11 shows the interaction between the galactic center magnetic fields and the sun magnetic fields. In this Figure the galactic magnetic fields are represented by magnets. However as shown in Figure 9 those magnetic fields are coming far below and above the sun. Also as shown in the model of Figure 7 those magnetic fields rotate in the direction of the galactic disk rotation but faster. When the peak of the galactic center magnetic field is approaching the sun as in Figure 11(a) . The sun is resisting according to Lenz’s law the increase of the magnetic field and produce internal magnetic field that oppose the galactic center magnetic field. When the galactic center magnetic field peak is receding from the sun as in Figure 11(b) the sun resist the decrease in the magnetic field and flip the magnetic polarity so as to attract the galactic center magnetic field. This behavior illustrates a phase difference between the galactic center magnetic field and the sun magnetic field. The sun magnetic field is created by the galactic center magnetic field but its phase is in front of the galactic disk magnetic field.
16

Figure 11: The solar cycle is created from the galactic center magnetic fields. The sun here shown in yellow circle is stationary and the galactic magnetic fields represented as magnets are crossing the sun by moving to the left. The magnetic fields depicted here as magnets are actually coming far below and above the sun. (a) The magnetic peak is approaching the sun. The sun according to Lenz’s law will create opposing magnetic field with the same polarity as the approaching field. (b) The magnetic peak is past the sun and the sun flips its magnetic field polarity to create according to Lenz’s law magnetic field that opposes the decrease of the galactic magnetic field. It is clear that the galactic center magnetic field induce in the sun magnetic field and that the galactic center magnetic field and the sun magnetic field are out of phase. The solar system is inclined 60 degrease to the galactic disk so this figure is simplified. This movement of the galactic center magnetic fields as shown in Figure 11 will enable the rotating galactic center to heat the galactic disk by induction and at the same time to increase the angular velocity of the stars as observed by the flat rotation curve. The interaction between the galactic center and the sun could be compared to alternating current transformer. In such a comparison the galactic center would be the primary winding the sun would be the secondary winding and the changing magnetic field of the solar cycle is the magnetic flux in the transformer core. Notice that the solar cycle magnetic field as monitored since 1750 has sinusoidal amplitude that is similar to the sinusoidal magnetic flux in a transformer core. From the models of Figs. 4, 7 it is clear why the observed rotation curve and angular speed of the star at the galactic disk is above the expected angular speed as shown in
17

Figure 6. However, when the angular speed of the stars increase, it is not clear why they are not receding from the galactic center by the centrifugal force. The explanation for this is that the magnetic fields at the galactic disk magnetize the stars and cause them to magnetically attract each other. To demonstrate that magnetize objects attracts each other we can use a simple experiment as shown in Figure 12. Two iron spheres connected to two levers are hanging on two hinges. The hinges allow the balls only to move toward each other but not toward the magnet. When the magnet is close to the balls it passes a magnetic field through the balls. The magnetic field magnetizes the balls turning them temporarily into magnets and causing them to attract each other. A common device that uses these phenomena is reed switch as shown in Figure 13. The reed switch closes its contacts when you bring a magnet near it, or bring it in magnetic fields from solenoid. There are two ferromagnetic contacts or reads at the switch center. When they are magnetized they pull each other until electric currents can flow between the contacts. The direction or polarity of the externally applied magnetic fields is not important and in every direction the contacts will be magnetized and closed. The reed switch is usually used as a proximity detector and in alarm systems; for instance if you put a magnet in a window and the window is opened a reed switch on the frame will open a circuit and turn on the alarm.
Figure 12: A simple experiment to demonstrate a magnetic pull of objects under magnetic fields. The figure shows two iron balls hanging on two levers. On the other side of the levers there are hinges that enable the ball to get near each other but not to move toward of the magnet. When the magnet is close to the balls it passes a magnetic field through the balls. The magnetic field magnetizes the balls turning them temporarily into magnets and causing them to pull each other.
18

Figure 13: Reed switch is an example that when you place a magnetic field near two ferromagnetic materials they became magnetize and pull each other. The contacts of the switch are at the center. When you bring a magnet near the contacts they pull each other and close a circuit. This demonstrate that the magnetic fields in the galactic disk cause the stars to attract each other and help to sustain the high speed of the stars in the galaxy rotation curve. Another simple experiment can be conducted by placing two bolts or screws on a thin plastic board keeping a small distance between them. When you position a bar magnet beneath the board, near the screws, they will get magnetize and attract each other. Still another experiment is the known experiment where an iron dust is place on a board and a bar magnet is placed beneath. If you will watch closely you will see that the dust grain actually attracts each other until they form small dense veins of iron, in the direction of the magnetic field. The veins are created by the attraction of the dust particle to each other. The sun energy balance As show in Figure 11 the sun is heated by changing magnetic fields from the galactic center. The sun high magnetic permeability helps to concentrate the magnetic flux from the galactic center and maximize the absorption of energy from the galactic center magnetic fields. The changing magnetic fields induce electro-motive force and electric currents in the sun. Those currents pass through the sun plasma and heat it according to I2R. The heat energy increases the particles kinetic energy and velocity at the sun core. The high velocity of the particle leads to high impact collision that creates new particle and new mass. This is a conversion of energy into mass according to E=MC2. The kinetic energy of the particle at the sun core is converted to mass when the kinetic energy in the relative velocities of the colliding particles is higher then the rest mass of the newly created particles. Since the heat energy at the sun core is converted to mass the heat energy is decreasing and there is a cooling effect that limits the temperature in the sun core below a certain level.
19

Figure 14: The sun energy balance. Energy is received by the sun from magnetic fields created by the galactic center. The magnetic fields create electric currents inside the sun. The currents create heat, and at the sun core the heat is converted to mass by high energy collision of particle. When some of the hydrogen created by the sun is fused to helium the mass surplus of the fusion is converted back to energy. The fusion energy is absorbed by the sun and is used to heat the sun and create more mass. Some of the sun energy is lost by electromagnetic radiation. The conversion of energy to mass at the sun core produces the building blocks of matter - electrons, protons and neutrons. The sun and other stars cores produce the light elements in the universe for instance Hydrogen, deuterium, tritium, helium and lithium and are the main source of light elements in the universe. The sun core fuses the building blocks of matter electron, proton and neutron into elements like helium in nuclear fusion. The sun is 21% helium so considerable amount of hydrogen is fused. The fusion reaction utilizes the presence of hydrogen and extreme heat to create helium or alpha particles. Since the mass of the fused helium is lighter then the mass of the four neutrons and protons there is a conversion of mass to energy. In other words part of the mass created by the magnetic fields induction heating is converted back by the fusion to energy. The energy produced by the fusion is lower then the original energy from the galactic center magnetic fields. Also the mass that the fusion reaction converts to energy is smaller then the original mass created from the magnetic fields. The energy that is produced by the fusion is absorbed by the sun and is used again to create new particle and mass. The fusion reaction is limited by the sun core temperature that is control by the cooling effect applied from creation of new particles and mass.
20

Neutrino emission from the sun For three decades there was a neutrino paradox related to the sun. The sun emitted only third of the neutrinos that where expected from the standard solar model based on the sun fusion. However the paradox was solved lately by experiments done at SNO neutrino detector. The neutrinos once believed to be massless like photons but know are known that the neutrinos have mass. The existence of mass of the neutrino is based on the fact that when neutrinos pass in space there are oscillations between the three flavors of the neutrinos. The SNO neutrino detector confirmed that and settled the long neutrino paradox. Assuming that the SNO findings are correct and there is no contamination that influenced the data, there is seemingly a conflict between the theory presented here and the SNO findings. If the sun is heated by the galactic center magnetic fields and the fusion is only a by product and limited in scope, then the neutrino emission supposes to be much smaller then in the full scale fusion of the standard solar model. The solution to this conflict is that the nucleosynthesis of the building blocks of matter electron, proton and neutron emits neutrinos. For instance you can see the emission of neutrino in the collision of electron and positron that creates a quark: e+e- W+W- q qbar µ v The collision creates quark pair, muon and neutrino. The emission of neutrinos from the sun is the sum of the neutrinos from the small scale fusion reaction, and mainly from creation of new particles and mass. Tokamak converts energy to mass and not mass to energy It is well know that the half century of fusion research, especially in Tokamak fusion reactors, did not yield the desired unlimited energy source, that was hoped for. It is likely that similar to the sun the high energy collisions of the particles in the fusion reactor create new particles and new mass in the plasma, instead of increasing the temperature of the plasma. This is evident from the fact that the heating energy required to heat the plasma is enormous and the Tokamaks are constantly upgraded with new heating modules. The evidence that the heating energy of the fusion reactor go to production of new mass is in the presence of positrons in the heated plasma. When the reactor plasma is heated the high velocity collisions create electron positron pairs. Like the sun the Tokamak convert energy to mass and not mass to energy. The galaxy energy cycle The sun and other stars receive energy from the galactic center in the form of changing magnetic fields. Those magnetic fields heat the stars and enable them to shine and
21

convert energy to mass. The question of course is where the galaxy is getting this immense energy from? The answer is that the mass created in the stars have gravitational potential energy relative to the galactic center. The dust and gas is free falling to the galactic center and in the galactic center it falls into black holes and neutron stars to create accretion disks. The free fall and the accretion disks multiply the mass and energy of the gas and dust. The stars mass is constantly increasing from the galactic center magnetic fields. This mass is released by the stars to the interstellar space in several ways:
1. Solar wind that is ejected constantly from the sun and the stars. 2. Coronal mass ejections which are abrupt and massive form of the solar wind. 3. Red Giants decomposition. The red giants outer layers are far and loosely
connected to the red giants core. The outer layers can eject large amount of mass up to 0.2 Earth mass per second.
4. Planetary Nebula. Planetary Nebulas are born from red giants and also eject large amount of mass. During the Planetary Nebula life cycle its mass can drop from about 8 Sun mass at its birth to about 1.1 Sun mass.
5. Supernova and Nova also eject large amount of mass to the interstellar space. The mass ejected from the stars fills the interstellar space with large amount of dust and gas. It is impossible to see the center of the Milky Way galaxy from earth because the interstellar dust and gas is blocking the view. It is also impossible to see the outer edge of the Milky Way Galaxy because of the dust and gas. The interstellar dust and gas falling to the galactic center is the fuel of the galaxy. The dust and gas after released by the stars will start to free fall to the galactic center. The free fall of the dust particles can be divided to the following stages according to the distance from the galactic center:
1. When the dust particle is far from the galactic center the galaxy can be divided to two sections. One includes the galactic center and the other the outer part of the galaxy. The gravity force on the dust particle is the difference between the galactic center gravity forces and the galaxy outer parts gravity forces.
2. When the dust particle is near the galactic center. The gravity of the galactic disk is near zero. The gravity of the black holes at the galactic center keeps pulling the dust particle.
3. At the galactic center the dust particle is part of an accretion disk of a supermassive black hole and is gradually attracted to the accretion disk center.
At the galactic center the falling dust and gas in the black hole accretion disk is producing a lot of energy, evident by the high luminosity of galactic centers. The dust and gas at the accretion disk became plasma moving at relativistic speeds that creates strong magnetic fields by the dynamo effect. The kinetic energy of the plasma motion is converted to changing magnetic fields that propagate in the galactic disk to provide energy to the stars in the galactic disk. The particles in the supermassive black hole accretion disk reach relativistic speeds that multiply the particle mass and energy. In some galaxies the galactic center is exceptionally luminous and called Active Galactic Nuclei or AGN.
22

Figure 15 shows the energy cycle of the galaxy. It is shown that the galactic center magnetic fields create mass at the stars far from the galactic center. This mass has a significant gravitational potential energy, with respect to the galactic center. But, the magnetic fields do not lose energy in creating this potential energy; the magnetic fields only lose energy equal to the rest mass of the new particles created in the stars. The yellow arrow shows the energy of the magnetic fields absorbed by the stars. The red arrow shows the much larger amount of energy received by the galaxy from the free fall of the particle.
Figure 15: The galaxy energy cycle. The cycle starts when changing magnetic fields from the galactic center heat the star using induction. The heat or kinetic energy of particles at the star core is transformed there to mass (shown as the yellow arrow). A mass M0 created in the star core reach the star surface and ejected into space as solar wind. The particles start a relativistic free fall to the galactic center (shown as red arrow). The mass and energy of the particle after passing in the supermassive black hole accretion disk could be 1000 times the original energy M0 invested by the galaxy.
23

Figure 16 shows the energy cycle of the galaxy. The energy cycle is divided here to its components at the galactic center and at the star. At the galactic center the free falling dust and gas reach back holes accretion disk (4). The black hole accretion disk converts the dust and gas into plasma and according to the dynamo effect strong magnetic fields are generated and heat the stars at the galactic disk (1). At the stars the galactic center magnetic fields heat the star. The energy is converted into mass by high energy collisions of particles at the sun core(2). New mass and matter is created and when it reach the star surface it is ejected by solar wind into the interstellar space (3)and start to fall to the galactic center.
Figure 16: The galaxy energy cycle divided to galactic center section and star section. At the galactic center the falling dust and gas produce magnetic fields that disperse in the galactic disk and heat the stars. In the star the magnetic fields from the galactic center heat the star and the heat energy is converted into mass by high energy particle collisions. When the new mass and matter reach the star surface it is ejected as solar wind and start to fall to the galactic center. Figure 17 shows a graph of the energy cycle of a unit mass M0. The Y axis depicts the energy added to the galaxy. The X axis depicts the distance of the unit mass from the galactic center. The origin of the X axis is the full length of the distance from the star to the galactic center. As the distance to the galactic center decrease the X axis increase. The energy cycle begin at the origin of the X axis where the unit mass is created in a star by the magnetic fields. When the galaxy is creating the unit mass it losses energy equal to the rest mass of the particle. Therefore its energy balance at the X axis origin is negative. The unit mass is then ejected from the star and start free falling to the center of the galaxy. As the unit mass fall its speed and energy increase. At the galactic center the
24

speed and energy of the unit mass multiply by the accretion disk of the supermassive black hole.
Figure 17: The galaxy energy cycle in terms of unit mass. The cycle starts when changing magnetic fields from the galactic center heat the star using induction. The heat or kinetic energy of the particles is transformed in the star core to mass. A mass M0 created in the star core reach the star surface and ejected into space as solar wind. The particles start a relativistic free fall to the galactic center. The origin of the X axis is the distance of the star from the galactic center, as X increase the distance decrease until the falling mass reach the galactic center and the distance is zero. The mass and energy of the particle when reaching the galactic core could be 1000 times the original energy M0 invested by the galaxy.
25

The attraction of the dust and gas to the galactic center require several conditions that make the galaxy energy cycle more efficient. Black holes at the galactic center will make the energy production of the galaxy more efficient. On the other hand Black holes at the galactic disk will prevent free fall of nearby particles to the galactic center and disturb the energy production of the galaxy. Part of the dust and gas ejected by the stars is lost by the galaxy and do not reach the galactic center. This dust and gas is scattered in the space between the galaxies and create the intergalactic medium. The intergalactic medium is rich with heavy elements produced by the stars. Some of the dust can escape the gravitation of the galaxy by high velocities. The origin of the high velocities could be supernova or high energy collisions between stars. If a galaxy is losing large amount of mass in this way it will hinder the galaxy energy and mass production. The distance between the stars is far enough to enables the dust and gas particle to be attracted by the galactic center gravity and not by stars gravity. The gravity of the stars accumulate some of the nearby free falling dust and gas. This accumulation of free falling dust and debris over billion of years is a dominant force in the creation of the planets around the sun and other stars. The two complimentary parts of the galaxy energy cycle, the mass created in stars by magnetic fields and energy from free fall in accretion disk is within reason. However, combining them create a paradox that a galaxy is producing mass and energy from nothing and does not obey the energy conservation law. New developments in quantum mechanics find that vacuum contain large amount of energy. Therefore we can assume that vacuum is the true source of the mass and energy produced by the galaxies. We are used to think of the gravitational potential energy as conservative but is it really? Let’s take for instance a simple example. An asteroid is passing slowly near earth. Now we didn’t put the asteroid there and we didn’t invest any energy. Still under the influence of gravity the asteroid will gain speed and heat as it fall to earth. Where the energy came from? It must be vacuum. The mass of the galactic center create strong gravity that pulls the dust and gas. The gravitational potential energy of the dust and gas multiply the gas and dust mass and energy. Therefore we can say the following sentence: mass create gravity and gravity creates mass. Spawning of a small galaxy by a larger galaxy The galaxies produce constantly new mass and energy. Since the galaxy mass increase more dust and gas is falling to the galactic center and the magnetic fields get stronger to deliver more energy to the stars. As the magnetic fields in the stars are getting stronger the mass of the stars increase. Because the magnetic fields in the galactic disk are getting stronger extra energy is available and new stars are born. During the NASA Apollo missions, samples of the moon rock where analyzed, to find that the sun temperature
26
increased by 10% during the last billion years. This means that the sun mass increased by 10%. This increase is enormous. The sun mass increase indicates that many stars in the galaxy have mass increase and therefore the galaxy has mass increase. The constant mass increase leads to spawning of new galaxies. As a galaxy is getting more massive and heavy the arm of the galaxy are also getting heavier. The stars in the arm are getting more massive and new stars are born. As the arm is getting heavier it is also getting more distant from the galactic center. At some point the dust and gas produced by the arm is not pulled by the far galactic center but by the closer galactic arm. The falling dust and gas to the galactic arm create a massive center that start to produce changing magnetic fields. This process spawns a new satellite galaxy that has its own energy cycle. As the satellite galaxy is getting bigger its magnetic fields are getting stronger and repel the main galaxy. The spawning of new galaxies is observed everywhere in the universe. Most of the observed colliding or interacting galaxies are actually spawning of new galaxy. In Figure 20 there is a picture of galaxy M51 that depict spawning of new galaxy in the left side of the picture. The arm of the galaxy is very elongated and far from the galactic center. The dust and gas at the newly created galaxy is falling locally to the satellite galaxy and not to the main galaxy. There are three factors that influence the spawning of new galaxy:
1. The distance of the local arm from galactic center. The more distance the arm is, the easier it is for the new galaxy to be spawned.
2. The mass of the local galactic arm. The more massive the arm is, the easier it is for the new galaxy to be spawned.
3. The mass and gravity attraction of the main galaxy galactic center. The more massive the main galactic center is, the harder it is for the new galaxy to be spawned.
The spawning of new galaxies creates new black holes at the main galaxy galactic arm. The new black hole is the center of the new galaxy and operates its energy cycle. Elliptical galaxies could also spawn a new galaxy. The mechanism is different from that of the spiral galaxies. Before spawning the elliptical galaxy will get elongated and then gradually will have appearance similar to that of eyeglasses or the number 8. Everywhere in the universe there are examples of massive galaxies with nearby smaller satellite galaxies. Those smaller galaxies were spawned from the massive galaxy and are offspring of the massive galaxy. The Milky Way is an example of a massive galaxy with nearby satellite galaxies. The satellite galaxies where spawned from the Milky Way. There are 14 satellites galaxies of the Milky Way like the Small Magellanic Clouds and The Large Magellanic Clouds. A look at the Local group also reveals that Andromeda includes many satellite galaxies. The M32 is a satellite galaxy of Andromeda M31 and was spawned by it. In the arms of Andromeda, there is still evidence of the M32 spawning.
27

Figure 20: Picture of M51 is an example of galaxy spawning. The mass and size of the galaxy is constantly increasing. When one of the galaxy arms is very heavy and far from the center of the galaxy, its gravitation is very strong. The dust that stars in that arm eject into space is attracted to the center of the arm and not to the center of the galaxy. The arm mass is increasing and it is starting to behave like a galaxy with its own energy source and mass production. The satellite galaxy starts to separate from the main galaxy when it’s magnetic fields increase and push out the main galaxy. The Milky Way satellite galaxies were spawned from the Milky Way. The sun luminosity could be influenced by other factors like its position in the galactic arm. The sun could be in the outskirts of the galactic arm and during the last billion years reached the galactic arm backbone or more central position in the galactic arm. The magnetic fields in the galactic arm backbone are stronger then the magnetic fields at the outskirts of the galactic arm. Therefore the luminosity of the sun could be influenced by its position in the galactic arm. The sun luminosity depends also on the spawning of new galaxies. After the spawning of new galaxy the amount of dust and gas falling to the galactic center is smaller because there are fewer stars in the galaxy. The smaller amount of dust produce weaker magnetic fields at the galactic center and this leads to decrease in the energy the stars at the galactic disk absorb. This will decrease the luminosity of the stars. We can estimate the time it takes to spawn a new satellite galaxy. This estimation is based on assumptions and not on precise data.
28

A small satellite galaxy contains about 5 billion stars. The number of stars in the Milky Way is about 200 billion star. We assume that the Milky Way galaxy is adding to its mass 0.5% in billion years (1/20 of the sun mass increase). We can find that every 5 billion years the Milky Way is spawning a new galaxy. For this calculation we also need to assume that the Milky Way is staying roughly in the same mass after many spawns. It is possible that the galaxy mass is not staying the same but increase after many spawns. If we observe many galaxies in the sky we can notice that there is no standard size for the galaxies. So part of the galaxy mass increase is permanently kept within the galaxy to constantly increase its size and the other part is lost to spawning of new galaxies. If for instance only 50% of the galaxy mass increase is going for spawning of new galaxies the period between spawning of galaxies is 10 billion years. A galaxy like the Milky Way will spawn a new galaxy every roughly about 10 billion years. In Figure 21 there is a graph of the galaxy mass, energy and luminosity during the spawning of new galaxies. Until a new galaxy is spawned the mass of the galaxy is increasing exponentially and new mass added to the galaxy increase the mass creation rate of the galaxy. After the new satellite galaxy is spawned the mass of the main galaxy is sharply reduced as the new galaxy mass is removed from the main galaxy. After the new galaxy is spawned the amount of dust and gas falling to the main galactic center is reduced. This will reduce the strength of the magnetic fields from the galactic center and provide less energy to the stars. The link between the sun luminosity and its position in the galactic arm could be understood from the rotation of the galactic arm. The galactic arm is spinning with constant angular velocity in all distances from the galactic center as in Figure 5 . If the angular velocity was not constant the galactic arms would scatter and lose their packed structure. The galactic arms keep their solid structure because of two reasons. First the stars in the galactic arms are magnetized and attract each other as shown in Figure 12 and 13 . Second galactic arms are the conveyer of the magnetic fields. The main sequence stars in the galactic arm convey the magnetic field energy better and therefore only stars near the galactic arm get large amount of energy from the galactic center magnetic fields. The fact that the galactic arm has constant angular velocity in all distances from the galactic center, and the stars has a flat rotation curve make the stars get in and out of the galactic arm. When the stars get in the galactic arm their luminosity increases by the strong magnetic fields in the galactic arm.
29

Figure 21: On very long time each galaxy will spawn new galaxy several times. The luminosity, mass and energy of the main galaxy is constantly increasing by the galactic center magnetic fields. When one of the galaxy arms is very massive and distant from the galactic center, it will collect the dust from the nearby stars. The arm section will gradually spawn into new satellite galaxy. All the stars in the satellite galaxy will stop sending dust to the main galaxy and the main galaxy will loose some of its mass and energy to the new satellite galaxy. Acceleration of the universe Analysis of red shifts and supernova explosion find that the universe is not only expanding but also accelerating. The galaxies constantly create new mass and energy and increase the total mass and energy in the universe. The galaxies also spawn new galaxies and increase the number of galaxies in the universe. The universe must expands and accelerate to accommodate the new matter. There are two forces or fields that can cross the enormous distances in the universe. They are the gravitational force and the magnetic force. The gravitational force drives to decrease the distance between the galaxies while the magnetic force repel the galaxies and cause the expansion and acceleration of the universe. As shown in Figure 3 the main sequence stars are depicted as a combination of a superconductor and a magnet. This model can explain the fact that main sequence stars do not collide. Galaxies which encompass billion of stars derive these properties of superconductor and magnet and therefore could also be depicted as combination of superconductor and magnet. The repulsion between the superconductor of one galaxy and the magnetic fields of a second galaxy is the source of the expanding and accelerating of the universe. As a galaxy constantly produce mass, its mass increase and it generate stronger magnetic fields. The increasing magnetic field cross the nearby galaxies and
30

interact with the superconductor property to create induction current that resist the magnetic field increase and cause repulsion between the galaxies. When new galaxies are spawned they start to gradually grow and their magnetic fields increase and repel nearby galaxies. A simple experiment in Figure 22 demonstrates the repulsion force between the galaxies and the expanding universe. If you pass current in an electromagnet it will hover over the superconductor with specific distance. When you increase the current the magnetic field of the electromagnet will get stronger and according to Lenz’s law the superconductor will repel it upward and increase its height. The increase of the electromagnet current and magnetic fields is similar to the increase of mass in the galaxies that increase their magnetic field. This experiment can lead to a quantitative understanding of the universe expansion based on the mass increase of the galaxies and the stars. That is to develop a model of the mass increase in the galaxy and to compare it to the observed acceleration of the universe Demonstrating repulsion of bodies by induction does not require superconductors. In Figure 23 a solenoid with long iron core is connected to a battery. An aluminum or copper ring can move freely on the iron core. When the switch is closed and current flows from the battery to the solenoid the copper ring jump upward. The magnetic fields from the solenoid induce current in the ring. According to Lenz’s law the magnetic field of the ring will oppose the magnetic field of the solenoid and ring will repel the solenoid and sprung upward. If you imagine that the solenoid is one galaxy and the copper ring is a second galaxy it is clear how they repel each other by magnetic induction. Since galaxies are spawned from existing galaxies, mass in the universe is mostly created where there are already large quantities of mass this can explain the filaments of galaxies in large scale maps of the sky. The Hubble telescope deep space photos reveal galaxies which are very similar to present day galaxies and there is no evidence in those photos to evolving universe.
Figure 22: The expansion of the universe can be explained by an electromagnet hovering over a superconductor. Every galaxy contains stars which have conductivity near that of a superconductor and every galaxy produce magnetic fields. When galaxies produce mass and energy their magnetic fields is increasing and that repel nearby galaxies according to Lenz’s law.
31

If you pass current in an electromagnet it will hover over a superconductor with specific distance. When you increase the current the magnetic field of the electromagnet is getting stronger and according to Lenz’s law the superconductor will repel it upward and increase its height.
Figure 23: This induction experiment can explain the repulsion forces between the galaxies. When the switch is closed current flow through the solenoid and its magnetic field intensity is suddenly increased. The magnetic fields pass through the copper ring and create in it induction currents. According to Lenz’s law the induction current in the ring magnetize the ring in a direction opposite to the solenoid magnetic field. They repel each other and the ring sprung upward. Such devices working on AC, but with the same principle, are sold to schools to demonstrate in physics class magnetic induction and Lenz’s law. If you imagine that the solenoid is one galaxy and the copper ring is a second galaxy it is clear how they repel each other by magnetic induction. Stellar evolution According to the standard stellar evolution a star leave the main sequence when its hydrogen is depleted and it start to burn its helium. The star main energy source is not hydrogen fusion, but galactic center magnetic fields. Therefore the star standard evolution is not valid. We can predict that the star evolution is much longer in time then previously thought because there is no depletion of the hydrogen fuel. The star evolution is controlled by the magnetic fields and not the fusion reaction. The star is born not from gravitational contraction but from strong magnetic fields in the presence of planetary
32

nebula or cloud of gas. Strong magnetic fields will supply energy and light red dwarfs at the right lower corner of the HR diagram and will turn them into a main sequence star. The star will stay in the main sequence until helium poisoning will dominate. The helium poisoning will limit the creation of electrons protons and neutrons. The cooling effect from converting energy to mass at the star core will be smaller and the core temperature will increase and will convert the star to red giant. At the red giant state the star will continue to absorb energy from the galactic center magnetic fields and that energy is used to fuse heavy elements above mass number of 56. The heavy elements above mass number 56 consume energy when they fuse and therefore regarded incorrectly as elements created only in supernovae. However if the energy source of the stars is galactic center magnetic fields, this energy can be supplied to fuse heavy elements. A main sequence star can be degraded back to red dwarf or lose some of its luminosity when the magnetic fields are getting weaker. This can happen when a star is moving from the center of a galactic arm to the outskirts of the galactic arm. Globular clusters and the Hertzsprung - Russell diagram The Hertzsprung – Russell (H-R) diagram depict the relation between the temperature and the luminosity of group of stars. The HR diagram is divided into regions that belong to stars of specific classification and behavior for instance main sequence stars like the sun or red giants stars. The HR diagram is used incorrectly to predict the age of a group of stars according to the turn off point where the main sequence and the red giant branch join. When the changing magnetic fields that heat a group of stars is getting more intense. The stars receive more energy. Any red dwarf that is located at the right lower part of the H-R diagram receive more energy and its temperature increase. The energy and temperature of the stars gradually increase the star mass and the star luminosity. This way the red dwarf star is getting into the main sequence of the H-R diagram. Other stars in the main sequence that receive more energy from the changing magnetic fields will also have over time higher temperature and stronger luminosity. If all the stars in the main sequence will have higher temperature and stronger luminosity the turn off point will go up. Therefore the turn off point indicates the strength of the changing magnetic fields and not the age of the stars. Figure 18 shows the H-R diagram of two globular clusters M67 and NGC188. The turn off point of the globular cluster M67 is higher then NGC188. Therefore, the magnetic fields that the stars at M67 absorb are stronger then the magnetic fields that the stars at NGC188 absorb. The globular clusters are collecting particles and mass from the galactic disk. The galactic disk is ejecting large quantities of dust and gas to the empty space at the two flat sides of the galactic disk. The globular cluster gravity keep this mass within the galaxy area and help to improve the efficiency of the mass and energy production of the galaxy. The globular cluster has neutron stars at their center. The neutron star accretion disk is transforming the mass collected into energy in the form of magnetic fields. The magnetic
33

fields heat the stars in the globular clusters. This mechanism yield weak magnetic fields that keep the turn off point off the globular cluster H-R diagram low. Blue Stragglers in the clusters have higher luminosity and bluer colors then the main sequence turnoff. The changing magnetic fields in Blue Stragglers are higher then in the main sequence stars and therefore they absorb more energy and get hotter. Blue Stragglers are conclusive evidence that the turnoff point reflect the strength of the magnetic fields in the cluster and not the cluster age.
Figure 18: The Hertzsprung - Russell diagram of globular clusters. Globular clusters are considered incorrectly the oldest stars in the galaxy. This is incorrectly derived from their H-R diagram in which the amount of the stars in the main sequence is very low. The amount of stars in the main sequence or the height of the turn off point is indicator to the changing magnetic fields strength in the globular cluster. Since the globular clusters are far from the galactic disk the magnetic fields are small and the amount of stars in the main sequence is low. The magnetic fields in the globular clusters are produce in neutron stars accretion disks by collecting dust from the galactic halo. This is also true for elliptical galaxies their H-R diagram indicate the low intensity of the changing magnetic fields. In the figure the magnetic fields for M67 are stronger then the magnetic fields for NCG188.
34

Elliptical galaxies The stars in Elliptical Galaxies are heated the same way as the spiral galaxies by magnetic fields from the galactic center. The shape of the elliptical galaxies suggests that the magnetic fields from the galactic core are generated in a complex geometry that supplies energy spherically in all direction. Observations find that elliptical galaxies have kinematically decoupled cores. Elliptical galaxies core can contain several disk rotating in different direction on the same axis. Those core configurations explain how elliptical galaxies transmit energy in all direction. The observation of the elliptical galaxies decoupled cores was mysterious and unexplained however, it is clear that transmission of magnetic energy in all direction require this core configuration to heat the stars. Without decoupled cores the elliptical galaxies could not deliver energy to all the stars and it wouldn’t survive with its spherical shape. The core of an elliptical galaxy is depicted in Figure 19. Two sets of magnetic fields sources are rotating in opposite direction on the same axis. The two sets are rotating on a second perpendicular axis. This configuration will supply changing magnetic fields to the stars in all directions. Elliptical galaxies rotation speed is slower then in a spiral galaxy. This stem from the opposite momentum that the two sets of rotating magnetic fields exerts on the elliptical sphere. Observations find small amount of dust in elliptical galaxies compared to spiral galaxies. This is an outcome of the slow rotation speed of the elliptical sphere that does not apply centrifugal force on the dust to make it sink faster to the galactic center. The fast sinking of the dust improve the efficiency of energy and mass production in the elliptical galaxy. The amount of changing magnetic fields that the stars in the elliptical galaxy receive is smaller then the amount the stars in a spiral galaxy receive. This is evident from the low turn off point of the elliptical galaxy H-R diagram.
35

Figure 19: The core of an elliptical galaxy is more complex then that of a spiral galaxy. The core contains two sets of rotating magnetic fields that rotate in opposite direction. This can explain the elliptical shape and the fact that elliptical galaxies rotate slowly. Since the galaxy rotation is slow the dust is sinking to the core quickly and the elliptical galaxies are found with almost no dust. Probing magnetic fields in the solar system The NASA probe Pioneer 10 is changing its course by the influence of changing magnetic fields in the solar system. When external magnetic fields are crossing the probe, a current is induced in its metallic parts to magnetizing the probe. The interaction between the magnetized probe and the external magnetic fields is creating force on the probe that changes its course in space. The magnetic fields in the solar system include the galactic center magnetic fields and also magnetic fields induced in the sun and planets. This in fact can lead to a method to determine the intensity and direction of the changing magnetic fields. As shown in Figure 24 we can take two satellites and lunch them with the same speed and direction. One of the satellites is a metallic sphere and the other a plastic sphere. The metallic sphere will be influenced by the changing magnetic fields. When external magnetic fields will cross him a current will be induced that will magnetize the sphere. The interaction between the magnetized sphere and the external magnetic field will create force on the sphere that will change its course in space. Therefore the metallic sphere can reveal the direction and intensity of the external magnetic fields. On the other hand the plastic sphere will not interact with the magnetic fields and it can be used as a reference point for the metallic sphere. One set could be launched toward the galactic center and another away from the galactic center, to study the influence of the magnetic fields from the galactic center.
36

Figure 24: To reveal the direction and strength of the magnetic fields in the solar system we can use two satellites lunched with the same speed and direction. The satellites will have structure of a hollow sphere with one meter diameter. One satellite will be metallic with 2 millimeter thick Aluminum layer on 2 Millimeter thick iron layer. The other satellite will have only a 1 centimeter thick plastic layer. The metallic satellite will change its course in space by the interstellar magnetic fields. The plastic satellite will stay on its course. The deviation of the metallic satellite course will show the direction and strength of the fields along its path. Conclusion In the 20th century two competing cosmological models where proposed - the Big Bang theory and the Steady State theory. The fact that the stars produce mass leads to a steady state universe. The universe has no beginning or end in time; it started infinitely long time ago and will continue to exist forever. The universe is also an open universe with infinite size and no boundaries. The density of the universe is constant and as new matter is created the universe expands. The galaxies are the source of matter in the universe. The galaxies also spawn new galaxies. The amount of matter created in the universe is much higher then that required by the original steady state theory and leads to the acceleration of the universe. There is no dark matter and dark energy in the universe. The repulsion of the galaxies and acceleration of the universe is caused by magnetic fields.
37

References: Beck, R. 2000, Magnetic fields in the Milky Way and Other Spiral Galaxies (astro-ph/0310287) Beck, R. 2002, The Role of Magnetic Fields in Spiral Galaxies. Astrophys.Space Sci. 289 (2004) 293-302 (astro-ph/0212288) J.L. Han. 2001,Magnetic fields in our Galaxy: How much do we know. Astrophys.Space Sci. 278 (2001) 181-184 (astro-ph/0010537) J.L. Han. 2001, Magnetic fields in our Galaxy: How much do we know? (II) Halo fields and the global field structure (astro-ph/0110319) J.L. Han. 2001, Magnetic fields in our Galaxy: How much do we know? III. Progress in the last decade (astro-ph/0603512) The SNO Collaboration. 18 June 2001, Measurement of charged current interactions produced by solar neutrinos at the Sudbury Neutrino Observatory. Phys.Rev.Lett. 87 (2001) 071301 (nucl-ex/0106015) A.G. Kosovichev and the MDI team. 1996. Internal structure and rotation of the sun: First results from the SOHO/MDI data. http://soi.stanford.edu/results/sspeed.html Katia M. Ferri`ere, The Interstellar Environment of our Galaxy (astro-ph/0106359) D. Alloin, et al, Physics of Active Galactic Nuclei at all Scales. Springer, 2006 H. Falcke, F. Wehl, The Galactic Black Hole - Lectures on general relativity and astrophysics. Institute of Physics publishing, 2003 A. Soward, et al, Fluid Dynamics and Dynamos in Astrophysics and Geophysics CRC, 2005 Monday, December 04, 2006
38

The sun was a red giant 4.6 billion years ago - the planets were born from the solar wind of the red giant sun. Abstract How the solar system formed, is a puzzle that challenged scientists for many centuries. The current accepted theory is the Solar Nebula Hypothesis originated by Kant and Laplace in the 18th century. In reference 1 it was suggested that the sun energy source is not fusion but magnetic fields from the center of the galaxy. The Solar nebula Hypothesis cannot coexist with a sun powered by magnetic fields. As shown on reference 4, those magnetic fields create mass that slowly increase the mass of the sun. The sun is growing not from dust from the interstellar space but from synthesis of new particles in the sun interior. The sun and the planets formed separately, the sun came first and then the planets follow. In the standard solar model stars are turned into red giants when the hydrogen in their core is depleted and the energy production stop. Stars do not work on fusion, but on magnetic fields, so they turn into a red giant when their energy supply from the magnetic field is stopped. Stars that have a very long Maunder minimum, for tens of million of years, in which their stellar cycle is weak, will turn into a red giant. The exoplanet search programs found that stars with planets have higher metallicity compared to stars without planets. The metallicity of a star depends on its mass. Massive stars have higher pressure and temperature in their core that increase the fusion rate of heavy elements. Stars with planet, that show higher metallicity, had higher mass in the past that created the high metallicity. They went through a significant mass loss that decreased their mass but did not change the high metallicity. Those stars significant mass loss occur when they turned into red giants. Red giants have strong stellar wind that disperses the star outer layers into interstellar space. This stellar wind creates comets that form planets around the star. The high metallicity of the sun indicates that it was a red giant. The solar planets where born from the solar wind of the red giant sun. The solar system shows many evidences in support of an ancient red giant sun. The energy calculation in reference 4 suggests that stars are slowly growing by converting the energy from the magnetic fields to mass. The gradual mass increase indicates that more massive stars are also older, so according to the standard solar model there is a mix up between older and younger stars. Older stars are not the smaller stars like red dwarfs but the heavier stars like blue giants. The idea that stars are slowly growing from small sizes, and the fact that the latest exoplanet search programs found large number of exoplanets, leads to the conclusion that stars originate from planets. The development steps leading to the creation of stars from planets include: growth of the planet by cold accretion of comets and asteroids; separation of the planet from the star; magnetic ignition of the planet when it reaches the size of a brown dwarf; and growth of the star by conversion of the energy from the magnetic fields to mass.
39

Introduction The sun energy source is magnetic fields that propagate in the galactic disk from the supermassive black hole at the center of the Milky Way galaxy. The hypotheses that the energy source of stars is fusion of hydrogen and other light elements caused the development of incorrect stellar evolution and planet formation. The evolution of stars according to the Standard Solar Model and the formation of planets according to the Solar Nebula Hypothesis will be described shortly together with the flaw and inconsistencies of those theories. The stars are believed to originate from the collapse of dust and gas clouds of the interstellar space, first into stellar nebula and then into a young star or protostar. The birth of new stars is taking place in areas of dense clouds of gas and dust like the Orion nebula that accommodate many O and B type stars. The evolution of stars depends on their mass. Low mass stars, with mass below 0.5 the sun mass, have low luminosity and will burn their fuel for hundreds of billion of years. When the star consume its fuel, it will collapse into a white dwarf directly if it is of very low mass, or will turn first to a red giant and then to white dwarf. Medium mass stars like the sun will burn their fuel for about 10 billion years. It first burns the hydrogen and fuses it into helium. The helium accumulates and sinks to the core, so the mass of the core increase by the heavier helium. The helium and hydrogen layers above the core compress and their temperature increase. The hydrogen fusion is then continuing in higher rate that increase the star luminosity. Further contraction causes the helium in the core to start fusion by the triple alpha process to create carbon atoms. When the helium is depleted the star turn into a red giant, it loses much of its mass to stellar winds and then turns into a white dwarf. Massive stars will burn their fuel very fast and will develop a layered structure where at each layer different elements will fuse. In the outermost layer hydrogen will fuse, then in the layer below it helium, then carbon, neon, oxygen, silicon and at the core iron will sink. Iron cannot fuse further to other elements because it is in the lowest energy state. At the end of its life the massive star will explode in supernova to create a neutron star or a black hole. This evolution also determine the stellar ages, low mass stars like red dwarfs are considered of old age since they consume their fuel very slowly and will take hundreds of billion of years to consume all their fuel. Blue giants are considered to have young age since they will deplete all their fuel in several million years. Areas in the galaxy where blue giants are found like in the Orion nebula are considered a place of young stars and birthplace for new stars. The planets orbit around the sun in the same direction and also the spin of the planets or their rotation around their axis is generally in the same direction. This uniformity in the orbit and rotation led to the development of the Solar Nebula Hypothesis in the 18th century by Immanuel Kant, and Pierre-Simon Laplace. This hypothesis suggests that a giant molecular cloud contracted and flattened by its rotation to form a protoplanetary disk. The fast contraction increased the temperature of the disk and formed a hot protostar at the center of the protoplanetary disk. The high temperature of the protostar started a fusion reaction, in which the hydrogen was fused into helium to supply energy to keep the star shining for billion of years. The formation of the planets is from the dust left after the formation of the sun. This dust stuck together by electrostatic forces to form
40

first small bodies and then comets that grew by accretion of further material, those merge together through collisions to from the planets. There are many problems and contradictions to the solar nebula hypothesis. First, there is the problem of the angular momentum; the planets hold 99% of the solar system angular momentum, so the sun holds only a small part of it. If the solar system collapsed from a dust cloud, then the sun should conserve this angular momentum and hold larger portion of the angular momentum. Also, observations of dust clouds like those in the Orion nebula show that the density of those clouds is too low to enable the cloud to collapse. In order for the cloud to collapse there are thresholds known as the Jeans radius and the Jeans mass that only if the cloud exceed them it will continue to collapse. There are no clouds of such high density, so they cannot collapse according to the solar nebula hypothesis. Another point that contradicts the solar nebula hypothesis is that there is no observational evidence of protoplanetary disks that form blue giants. Blue giants can be fifty time more massive then the sun so there protoplanetary discs should be a gigantic structures. Such structures are not observed anywhere despite an extensive search. The blue giants should have a short life so a large number of those protoplanetary disks should be observed. Observations of exoplanets also undermine the solar nebula hypothesis. There are observations of planets that circle neutron stars and there are many planets with high eccentricity. The latest observations of exoplanets revealed hundreds of planets orbiting other stars. The first exoplanet was observed in 1995 by Michel Mayor and Didier Queloz of the University of Geneva orbiting the star 51 Pegasi. Later, research groups were assembled like University of California Planet Search Project and The Geneva Exstrasolar planet Search Programs. Those groups found more then 400 planets. The detection methods of planets are limited and usually find only large planets with small radius orbits, so the planets found so far are only small fraction of the total number of planets. Overall, planets are common and found in large number in the Milky Way. The total number of planets in the Milky Way could be of the order of tens or hundreds of billions. In references 1, 2, 3, 4 it was shown that the energy source of the sun and other stars is not nuclear fusion. The stellar cycle originate from magnetic fields in the galactic disk. The stellar cycle is not generated in the star interior but is induced by the galactic disk. The galactic disk spread eddies of magnetic fields through the galactic disk and supply energy to the stars. The source of the magnetic fields eddies is the supermassive black hole at the center of the galaxy. Matter is constantly falling forcefully in relativistic speeds to the supermassive black hole where it produces magnetic fields by the dynamo effect. The source of the matter that fall to the supermassive black hole is the stars. The stars by their stellar winds, coronal mass ejection and supernova release matter to the galactic disk that later reach the supermassive black hole. In this way the stars feed the supermassive black hole with matter and the supermassive black hole feeds the stars with magnetic fields. This creates an energy cycle in the galaxy that produces new matter and energy. The number of stars in the galaxy increase and this leads to spawning of new galaxies through globular clusters. According to this theory the stars convert energy to mass as was shown in reference 4. Since the stars constantly produce mass they grow
41

larger. The stars are growing along the Hertzsprung-Russell diagram. The stars start as brown dwarfs and constantly grow along the main sequence. The fact that the exoplanet search programs showed the large number of planets and that many of them reach a considerable size of up to 12 Jupiter masses shows that the planets are the first stage in the development of stars. There is continuity in the mass of planets and stars, and objects of all masses are observed in the galaxy. Small objects like planets, brown dwarfs and red dwarfs are found in large numbers. This continuity in mass, support the idea of gradual growth by magnetic fields - from planet to brown dwarf to red dwarf and to a high mass star. Above the size of a brown dwarfs the star is growing by converting energy from the magnetic fields to mass, below the size of a brown dwarf the planet is growing from cold accretion by absorbing falling dust, micrometeorites, meteorites, comets and asteroids. The fact that stars grow by converting the energy from the magnetic fields to mass, invalidate the solar nebula hypothesis. The stars are not born to a fixed mass but grow slowly. This is similar to living things on earth that grow slowly by collecting energy in the form of food. The stars are doing the same thing; they grow slowly by collecting energy in the form of magnetic fields. There is a mix up between young stars and old stars According to the standard solar model the source of the sun energy is fusion of hydrogen to helium. According to this model the sun and other stars carry internally within them their fuel, and slowly consume it to produce their heat and luminosity. In this view stars are like candles; when they burn, they slowly consume the wax and get shorter. Knowing the size of the star can give estimate to the amount of fuel or energy the star carry. Also, the luminosity of the star indicates the amount of energy the star consumes. Combining those two factors, the fuel it carries and the consumption rate, it is possible to estimate the maximum age of the star. It turn out that small stars like red dwarfs that their luminosity is week can have much longer lives then blue giants of spectral type O and B. The blue giant luminosity is so high that they suppose to finish their fuel in tens of millions of years. The red dwarf on the other hand can live for hundreds of billion of years. Therefore, whenever a group of blue giant stars is observed, it is believed that the stars are of young age simply because they die young and never reach an old age. For red dwarfs it is always believed that they are old. The metallicity of stars is also believed to effect the age of the stars. The metallicity of the universe is believed to increase from supernovae that disperse heavy elements to the interstellar space, so as time passes the metallicity of the galaxies and universe is increasing. According to this idea, the higher metallicity of young O and B stars compared to older and smaller stars is the result of the age difference. Red dwarf that usually come with low metallicity are regarded old, reflecting the low metallicity of the universe long ago at their birth. Hertzsprung-Russell diagram shows the luminosity of the stars versus their spectral class or color. Plotting many stars on this diagrams, for instance, stars from the Hipparcos catalog shows that most stars are found along a curve called the main sequence that elongate from a low luminosity and red spectra to high luminosity and blue spectra.
42

According to the solar nebula hypothesis the stars are created by large clouds of gas and dust, that when contracted, reach very high temperature that enable fusion to start. Under the Solar Nebula Hypothesis the stars fall to the main sequence in a predetermined mass, their mass is staying roughly the same during their life. The stars also occupy the same point on the Hertzsprung-Russell diagram until they turn into a red giant. However, the Standard Solar Model is incorrect and the Solar Nebula Hypothesis that relies on the standard solar model is also deficient. The stars energy source is not fusion but magnetic fields from the center of the galaxy. Stars gain their mass by converting energy to mass, so more massive stars require more energy and more time to collect this energy, therefore more massive stars are more likely to have older age. This is similar to biological life on earth; a small puppy is younger then a fully grown dog. In both stellar evolution and biological life, larger size means older age. In reference 4, it was shown that the energy supplied the sun can be calculated from the magnetic fields of the solar cycle as measured by the probe Ulysses. The energy that stars receive from magnetic fields can be calculated with the following formula derived in reference 4.
3 3/ 2 21.89 10 ( )BstarP T
t− ∆
= ⋅ ⋅ ⋅ ⋅ 5R∆
(1)
Where: P - Is the energy per time or power that the star absorbs from the magnetic fields. T - Is the star temperature at 0.7 of its radius. Bstar - Is the magnetic field of the stellar cycle. R - Is the star radius. Most energy that the star absorbs is converted to mass according to Einstein formula:
2E MC= It is found that the sun is producing about 10^11 Kilogram per second of new mass. This means that stars are slowly growing by producing new mass. The stars are climbing along the Hertzsprung Russell diagram, they start with low mass as a brown dwarf and slowly gain mass. As they grow, their luminosity is increasing and their spectral class is changing to be of shorter wavelength. The more massive the star is, the older its age, as it took longer time to produce its mass from the magnetic fields. Dividing the mass of the star by the rate it produces new mass can give a rough estimate of the star age. Doing this calculation for the sun gives an age of 550 billion years (Reference 4). As long as the magnetic fields keep supplying energy to the star it will keep on shining. Most stars will live for a very long life and die when the magnetic fields stop supplying energy for a long period. The star will then turn into a red giant and then to a white dwarf or a neutron star. It requires extreme conditions of no energy supply to cause a star to die, so stars will rarely die. The fact that stars rarely die drives the
43
expansion of the universe. Stars are constantly added to the universe and only small fraction of them ever dies. This leads to creation of new galaxies and the rapid expansion of the universe. The age of the stars depends on their surroundings. In the Milky Way galactic bulge there are stronger magnetic fields than in the Milky Way galactic disk. Therefore, a star in the galactic bulge will grow faster then a star in the galactic disk. The stars in the galactic bulge will on average reach a larger mass then a star in the galactic disk, since the stronger magnetic fields will enable them to sustain a larger mass. If you take two stars of equal mass one from the galactic bulge and one from the galactic disk, the chances are that the star from the galactic bulge will be younger since it grew faster. The turnoff point in the Hertzsprung-Russell diagram of globular clusters is not determined by the age of the cluster. Every globular cluster has a heavy object in its center like an intermediate sized black hole or a group of neutron stars that produces energy for the globular cluster. The stars in the globular cluster emit gas and dust by their stellar wind that is collected by the black hole. The fall off material to the black hole create magnetic fields that spread to the stars in the globular cluster. The globular cluster is also receiving both gas and magnetic fields from the nearby galaxy. The turnoff point of the H-R diagram of the globular cluster is determined by the amount of energy in the form of magnetic fields that is available to the globular cluster. Globular clusters that get strong magnetic field and a lot of energy form their black holes will shine forcefully and will have higher turnoff point. Globular clusters with weak energy source will produce red dwarfs and its larger stars will turn into red giants. Few of the globular cluster - and only those with strong energy source - will evolve slowly into dwarf galaxies. The globular cluster with strong energy source will produce more stars and grow bigger to the point that they will be repelled from the main galaxy and form a new dwarf galaxy. The repulsion force is created by magnetic fields and it is similar to the repulsion between a superconductor and a magnet. Stars originate from planets There are observations of opaque disks circling many stars that seem to validate the idea of protoplanetary disks and formation of the solar system by the solar nebula hypothesis. The Infrared Astronomical Satellite IRAS and the Hubble space telescope were used to observe many of those disks. There are photos of those disks, for instance, in the Orion nebula and of star HR 4796A that show clearly a disk circling a star. However, according to the solar nebula hypothesis dust and gas should fall to the central star and extensive quantities of inflowing matter should be detected. Those inflows, if existed, could be easily detected with a spectrometer. In the stars with the opaque disk, however, inflows are rarely observed and the dust and gas show outflows instead. Even in T-Tauri stars there are no inflows of matter but only outflows. The fact that matter is not falling to the star but instead is flowing away from the star suggests that those disks are not protoplanetary disks but debris disk. Those debris disks are from matter ejected by the central star or captured from a neighboring stars. Some of the disks could be the result of
44

a collision between planets, or between large asteroids or comets in the stellar system that disperse dust and small rocks, similar to what is found in the solar system asteroid belt. The disk around the star Vega is an example of a debris disk. The stars eject matter by their stellar wind and in some stars, like blue giants and red giants, the stellar wind is much stronger then the sun solar wind and this strong stellar wind eject matter that is condensing around the star. The Orion nebula has many blue giants that eject large quantities of dust and gas that reach the smaller stars in the Orion nebula. The blue giants in the Orion nebula eject fast and massive stellar winds that collide with the stellar wind of smaller stars. This creates bow shocks around the smaller stars from collision of the opposite stellar winds. Therefore, many of the images of the Orion nebula protoplanetary disks are bow shocks created by stellar winds. In references 1 and 4 it was shown that the sun energy source is not fusion. Instead, it was suggested that the supermassive black hole at the center of the galaxy propagate magnetic eddies to the galactic disk that heat the stars. The sun receives this energy in the form of the solar cycle. The magnetic field polarity of the sun is changing every 11 years and this change induces electric current that by ohmic heating supply energy and heat to the sun. The magnetic fields of the sun are found to be open. They do not emanate from one pole and loop to the other pole; instead they stretch far into the Galaxy. The heat produced by the magnetic fields increase the speed of particles inside the sun. This leads to high speed collision between particles and like in a particle accelerator the collisions create new particles. This way, new particles are added to the sun and the mass of the sun increase. In reference 4 the amount of energy the sun absorb form the magnetic fields was calculated, and conversion of this energy to mass gives the growth rate of the sun to be about 10^11 kilogram per second. This calculation reveals the source of the stars mass, and the fact that they slowly grow by themselves from the energy they absorb from the magnetic fields. The solar nebula hypothesis is therefore rejected as the source of the star mass and star birth, so it can be replaced with a theory that rely on gradual growth from energy supplied by the magnetic fields. In stellar system like the solar system the creation of the star must be separated from the creation of the planets to give a dualistic origin. The star is created first and grows gradually from the magnetic fields to reach a considerable mass. Then the planets, under the influence of the star gravity, are slowly growing from accretion of nearby objects and matter. The material that is used to build planets is coming from the stellar wind ejected by the same central star and by nearby stars. The idea that stars are born from planets is based on the latest observations of exoplanets conducted by the exoplanet search programs. There are 400 exoplanets found so far. The leading observation techniques, the use of spectroscopic wobbling and flyby shedding, limit the finding only to massive planets. Definitely there are many planetary systems with less massive planets that will be discovered with improved probes like the Kepler telescope. The amount of planets in the galaxy is therefore very large and is comparable to the number of stars. Some of the exoplanets found are very big of the size of 10 or higher Jupiter mass as shown in figure 4. Planets of 10 Jupiter mass, or higher, are just below the minimum mass of a Brown Dwarf of 13 Jupiter mass. Those 10 Jupiter mass planets therefore represent the evolutionary link between planets and stars or brown
45

dwarfs. (The term "10 Jupiter mass planet" will henceforth represent the largest planets that are an evolutionary link between planets and a brown dwarf.) There are also observations of brown dwarfs that are also found in large numbers. In the galaxy there are planets in large number, 10 Jupiter mass planets in large numbers, brown dwarfs in large numbers and the red dwarfs are the most abundant stars. There is a continuum of objects in all the masses from planets to stars and in large numbers. This continuum leads to the idea that all the objects from planets to stars gradually grow, and that stars are born from planets (Figure 1). Dust will first clump in space due to electrostatic forces. The dust wanders around freely, so there is collisions and friction between the dust particles that stick them together by electrostatic attraction. This was shown with experiments on the space shuttle done by NASA, especially the Cosmic Dust Aggregation Experiment – CODAG. Collision, and particularly of icy objects will also contribute to the growth of larger bodies. When small gravels containing ice collide, the ice will melt from the impact and then freeze again to hold the two objects together. This tendency of dust and gravel to stick together leads to formation of larger objects like comets. With the Deep Impact mission, a large impactor was slammed into comet Tempel 1, to find that the comet contains debris of various composition loosely held together. Another process that enables growth of small objects is cementation. Mixture of water, ice, dust and gravel can be hardened by chemical reaction between the dust and the water. The loosely packed object will then turn into a solid rock that will stand impacts in space. As objects grow in size their gravity increase and they collect more material and comets from their vicinity that will create object of considerable size. Large objects in the Kuiper belt like Pluto and Eris, are collection of rocks, ices and debris from the Kuiper belt. Those dwarf planets were cold accreted during along time. The large cold accreted objects are then captured by planets and the central star to create moons and new planets. There are many examples of captured moons in the solar system, for instance Neptune moon Triton. Large objects or asteroids captured by the star will form planets and will start to collect matter from asteroids and comets, meteors, and micrometeorites. The planet will gradually cold accrete material and will grow in size. Planets collect much more material due to their orbit around the star. The planet moves around the star, so it sweeps material from larger area. It also collects material from asteroids and comets falling to the central star. The amount of material the planet accretes is therefore proportional to the mass of the central star the mass of the planet and the orbit perimeter. Higher Orbital velocity will decrease the accretion rate since objects moving at high speed are less likely to be influenced by the gravitational force. The outer planets in the solar system have higher accretion rate then the inner planet since their Orbital velocity is slower and they sweep larger area due to the large radius of their orbit. Therefore, the outer planets grow faster then the inner planets. Planets are growing much faster when they rotate around a central star and not free floating in space. The growth of object to a considerable size is possible without a central star but it will take much longer. Such free floating planets are observed in the Galaxy, for instance in the Orion nebula. Those free floating planets will be much likely to collide with other objects or be captured by nearby star. In the stellar system while orbiting a
46

central star the planet will grow very fast until it will reach the size of 10 Jupiter mass planet. There are even observations of objects in the size of brown dwarf circling a main star. One of these observations is the Object GI229B which shows a brown dwarf orbiting a star of type M. Not all planet will grow continually, some will be destroyed by collision with other planets, and some might fall to the central star. In summary, for a planet to evolve into a star it first must be part of a stellar system and orbit a central star; free floating planets are less likely to evolve into a star and will take much longer to do so. Some areas in the galaxy are known as stellar nurseries. Those areas like the Orion nebula contain both massive stars like O and B type blue giants and huge clouds of dust and gas. It turn out that the stellar nurseries according to the Solar Nebula Hypothesis are also the stellar nurseries according to this theory. The massive stars in the stellar nurseries are the catalyst that creates new stars. This is for the following reasons: First, the massive stars eject powerful stellar wind; this stellar wind is then cold accreted to create the mass of the planets and help them grow quickly. Second, the massive stars with their strong gravity can pull and tug on nearby stellar systems. This will disintegrate the stellar systems and release the planets or 10 Jupiter mass planets from their central star and eject it into space. Third, the area of the massive stars is saturated with strong magnetic fields. Those strong magnetic fields can supply energy to the brown dwarfs and help them grow by converting energy to mass. The dust and gas in the stellar nurseries is not what created the massive stars. It is the opposite; the massive stars by their powerful stellar winds create the dust and gas clouds. Over billions of years those gas and dust clouds grow to a huge size that dwarfs the stars that created them. The Milky Way galactic bulge and the galactic arms are areas of rapid star birth. Those areas have strong changing magnetic fields that increase the luminosity of the stars in those areas. The strong changing magnetic fields increase the mass ejected by the stars through their stellar wind and by that help to create new planets that grow quickly to stars. The planets around stars can grow to a considerable size in the stellar systems and as observation shows reach the size of 10 Jupiter mass planets (Figure 4). In order for the planet to grow into a separated star it need to be ejected from the stellar system. The main way the planet is released from the central star is a gravitational pull from a nearby star. The area of the stellar nurseries is very crowded and contains stars in close proximity. This help to release the planets as one star can get close to a nearby stellar system and cause a disturbance that will cause a planet from the stellar system to be ejected into outer space (Figure 3). The area of stellar nurseries like the Orion nebula contains many free-floating planets and brown dwarf that show that ejection of a planet from a stellar system is common in those areas. A large 10 Jupiter mass planet can develop a large magnetosphere; this magnetosphere will interact with the stellar wind in a way that a repulsion force will be created between the star and the planet that will help to separate the planet from the star. Not all planets will get separated from their central stars and this will create a binary star. In a binary the distance between the star and the planet will increase from the interaction of the stellar wind and the magnetosphere but they will maintain their original configuration and circle each other. Binaries are very common in
47

the galaxy and this support the idea that planets are growing into stars. A stellar system composed of a central star and a planet can easily turn into a binary if the planet grows to a star. In order for a planet to grow into a star, mass must be added to the planet at all stages of its evolution. At all points of its growth, from a planet to a 10 Jupiter mass planet to a brown dwarf to a red dwarf and then to a full star, mass is added to the planet that cause it to continually grow (Figure 1). At the beginning of its life the planet is growing from accreting material from its surroundings. This material comes in the form of comets, meteorites, asteroids and micrometeorites that are attracted by gravity to the planet. There is the example of comet shoemaker-levy 9 that fell to Jupiter in 1989 that demonstrates the growth of a planet from accreting material. As will be shown in next sections, the material that falls to the planets and increases their mass is coming mainly from the central star that the planet encircles. The central star stellar wind ejects material to the far regions of the stellar system. Those regions are like the Kuiper belt and Oort cloud of the solar system. The stellar wind is condensed at those regions and create comets and asteroids that later fall to the planets. The comets and asteroids fall to the planets mainly through the ecliptic plane so the outer planets receive most of the material while the inner planets receive smaller portion. At the last stage of its evolution, when the star is fully grown, it gains mass by converting the energy of its stellar cycle magnetic fields into energy as was shown in reference 4. At some point of its evolution, as the planet grows, the source of its mass is changed from accretion to conversion of energy to mass. Brown dwarfs are the point where the star growth switches from accretion to conversion of energy to mass. At sizes below that of a brown dwarf the growth of the planets rely on accretion and at sizes above that of a brown dwarf the star convert energy to mass. The red dwarfs are the most common star in the galaxy and about 80 percent of all stars are red dwarf. The red dwarfs constitute a large portion of the galaxy mass. Certainly all the hefty mass of the red dwarfs cannot be from accretion. Therefore, the point where stars begin to produce their own mass must be below the red dwarf size and around the brown dwarf size. Brown dwarfs are also producing their own light or luminosity so they must have an energy source that produce heat - the magnetic fields of their stellar cycle. The point where the planet starts to produce its mass by converting energy to mass depends on the region of the planet. Near blue giant at stellar nurseries there are powerful changing magnetic fields that will heat even a planet like a 10 Jupiter mass planet. The point where the planet will start to produce its own mass at those areas will be when the planet is in the size of a 10 Jupiter mass planet and not a brown dwarf. Stronger magnetic fields will ignite a lower mass planet.
48

49

Figure 1 – The growth of a star from a planet. The star starts its life as a small planet around a star. (a) The planet is born from cold accretion of material like large comets and asteroids. (b) In its trajectory around a star the planet accrete more material. This material is mainly from the stellar wind ejected by the central star or nearby stars. The stellar wind is condensed far from the star to form comets. The comets, then, under the influence of the star, return to the stellar system and are captured by the planet gravity. As the planet is growing it can reach a size ten times the mass of Jupiter. (c) The planet is released from its central star by the pull of a nearby star mainly in areas of high density of stars like the Trapezium cluster in the Orion nebula. (d) When the planet reaches the size of a brown dwarf it grows from conversion of energy to mass and climb slowly along the main sequence. The electrical resistance of a conductor depends on its cross section. Thicker conductor will have a smaller resistance. This is also true for the stars. The changing magnetic fields induce currents inside stars. The amount of energy the star absorbs depends on the resistance of its internal plasma layers. For a small planet the cross section that conducts electricity is small so the resistance is high and the energy it absorbs is small. As the planet grows to the size of a brown dwarf the cross section of its internal layer is larger so the resistance is low and the energy absorbed is high. This way as the star grows it will absorb more energy and some of this energy will be converted to mass. As the star produces mass its size grow and it absorb more energy from the changing magnetic fields. Both the luminosity of the star and its spectral type evolve. Its color is shifting from red to orange to yellow to blue and its luminosity is increasing substantially. Plotting the absolute magnitude of a star against its spectral type as it evolve and gain mass will give a graph identical to the main sequence of the Hertzsprung-Russell diagram. During its life the star will follow the main sequence along the H-R diagram, it will start on the lower right corner as a brown dwarf and red dwarf and will proceed to the upper left side as its mass increase. Plotting thousands of stars in the H-R Diagram gives the graph of the evolution of a single star, because the many stars population contain stars at all masses at all stages of the star evolution. In figure 2 there is a graph of the absolute magnitude against spectral class of a single star as it grows and evolves. The shape is similar to an H-R Diagram. The star evolution starts at the lower right corner when the star is a planet. At this point the spectrum of the planet is infrared with long wavelength so the spectral type is extending sharply to the right corner. The infrared luminosity of the planet is very low so the absolute magnitude is near zero. As the star reach the size of a brown dwarf, it starts to receive energy from the magnetic fields and convert energy to mass, so its absolute magnitude is rising and it starts to emit light in the visible spectrum. The star evolution is then continuing along the main sequence as its mass increase and its spectral class and absolute magnitude evolve accordingly.
50

Figure 2 - The Hertzsprung-Russell diagram not only describes the distribution of the stars population, but it also shows the evolution of a single star as it mass and luminosity increases by conversion of energy from magnetic fields to mass. This is a schematic view of the growth of a single star in the coordinates of its spectral type and absolute magnitude. The star starts its life as a small planet at the lower right corner of the diagram. It slowly grows from cold accretion of comets and asteroids. When the planet is near the size of a brown dwarf it is ejected from the stellar system by a gravitational pull from a nearby star. At the size of a brown dwarf the star develop a stellar cycle and it is heated from the magnetic fields of the stellar cycle. Some of the energy absorbed from the magnetic fields is converted to mass, so the brown dwarf star is slowly getting bigger. The star will continue to grow by conversion of energy to mass and it will climb along the Main Sequence of the H-R diagram until it will be a full size star like the sun. The star will then fluctuate between a red giant star and the main sequence throughout its eternal life. The star will turn into a red giant after an extended Maunder minimum that will stop the energy supplied to the star. The sun was also a red giant. In the red giant state the sun ejected strong stellar wind that caused the sun to lose mass. The solar system planets were created when the sun was a red giant and its strong solar wind ejected material that later coalesced into the planets.
51

While the star keep absorbing changing magnetic fields and converting the energy to mass, the star will continue to grow. Different regions of the galaxy propagate changing magnetic fields of different strength. The Milky Way galactic bulge will have stronger magnetic fields then the Milky Way galactic disk and the Milky Way galactic disk will have stronger magnetic fields then the Milky Way galactic halo. Each of these regions will enable the star to reach a certain size depending on the strength of the magnetic fields. Stronger magnetic fields will enable the stars to grow larger so the stars in the galactic bulge will be on average larger then the stars in the galactic disk and the stars in the galactic disk will be larger then the stars in the galactic halo. The star will stop growing when the changing magnetic fields will weaken and will supply energy only to cover the stars energy consumption on luminosity and stellar wind without supplying further energy to cover conversion of energy to mass. The star energy supply decline when the stellar cycle and the associated magnetic fields will be weaker and of lower amplitude and the star will have disruption in the stellar cycle similar to the Maunder minimum the sun had in the seventeenth century. Figure 12 shows the growth of a star mass as a function of time in two areas of the galaxy. The blue line represents a star growing at the Milky Way galactic bulge and the yellow line show the growth of a star at the Milky Way galactic disk. The star starts growing from the lower left corner and as time pass it evolve and proceed to the right. The star growth is at first exponential since it depend on the fifth power of the star radius as shown by Equation 1. The galactic bulge is closer to the supermassive black hole at the center of the Galaxy then the galactic disk. Therefore, the galactic bulge has stronger magnetic fields. The stronger magnetic fields supply more energy to the galactic bulge stars so they can grow faster than stars at the galactic disk. The stars at the galactic bulge can reach higher mass than stars on the galactic disk. The stars stop growing when the energy received from the magnetic fields is smaller then the energy lost to the star luminosity and to the stellar wind. Massive stars in an area of weak magnetic fields will receive stellar cycle of low amplitude and there will be interruption in the stellar cycle like the Maunder minimum. Extended Maunder minimum of tens of million of years will cause the star to transform into a red giant. In the state of a red giant the star has a strong stellar wind that will cause the star to lose portion of its mass. In an extended Maunder minimum the stellar cycle will not stop completely for a long time, instead, it will have smaller amplitude and frequent short interruption. At an equilibrium point, when the magnetic fields in the region cannot support further growth, the star will transform back and forth from a main sequence star to a red giant. The star mass will fluctuate but will not show a clear growth trend. In figure 12 the blue line represents a star in the galactic bulge. This star on average will reach a higher mass then a star in the galactic disk represented by the yellow line. The magnetic fields can supply a limited amount of energy. When this limit is exceeded some stars will receive less energy and stop growing. This scenario can be compared to a city connected to a single power station. If the city consume more energy then what the power station can supply then some neighborhoods in the city will be temporarily cut from the electricity. Those neighborhoods can be reconnected to the electricity only if other neighborhoods are disconnected. Similarly, when there is not enough energy to all
52
the stars in a specific region some stars will suffer from Maunder minimum and will turn into red giants. In figure 2, the star climb along the main sequence until the region of the star cannot support further growth of the star. The star will then have weaker stellar cycle with frequent interruption. The energy supply to the star will be diminished and after tens of millions of years the star will cool down and will transform into a red giant with a spectral class of longer wavelength. The star will also expand and will have higher luminosity. In the H-R Diagram the star will enter the red giant branch. Longer interruption in the stellar cycle will cause the star to enter deeper into the red giant branch. This is shown in Figure 2 with two red giant transitions that one is deeper and longer then the other. The stellar cycle can return to produce higher energy and the star will return to the main sequence. The star can fluctuate back and forth between a main sequence state and a red giant state. These fluctuations will control the star mass. In a main sequence state the star will gain mass and in a red giant state the star will lose mass. When a star transform into a red giant, it loses mass to strong stellar winds. After the red giant transition, the star returns to the main sequence and emerge with lower mass, smaller radius and lower luminosity of longer wavelength. Those transitions to red giant will continue during the entire life span of the star. The stars keep moving in the galaxy and can migrate from one region to another. Star in the galactic disk when far from the plane of the galactic disk is more likely to turn into a red giant. A star that was in the galactic arm and then leaves the galactic arm is also likely to turn into a red giant. The star will continue to live if the magnetic fields will supply enough energy to keep it hot and luminous. The star will die when its stellar cycle will stop and the star will not receive energy for a very long time. The star will then turn into a red giant for a long time without returning back to the main sequence. The star will lose much of its mass in strong stellar wind, will create a circumstellar envelope and will collapse into a white dwarf. The death of a star is a rare event and the majority of the red giants will return back to the main sequence. The galaxy continues to produce energy and disperse it in magnetic fields in the galactic disk. So stars will die only if they get into a position where they cannot get this energy for a long time. Generally, stars will live forever and will never die. Therefore, there are much more newborn stars than dying stars, so the number of stars in the galaxy is always rising and the galaxy is always growing. The fact that stars are eternal and never die also controls the behavior of the universe. The number of stars in the universe is constantly rising. This leads to the birth of new galaxies and to the fast expansion of the universe.
53

Figure 3 – This is a picture of the Trapezium cluster in the Orion nebula. The stars density in the Trapezium cluster is very high so the stars are close to each other. For a planet to turn into a star it needs to be detached from its central star. In clusters like the Trapezium the high density of stars means that stars exerts strong gravitational forces on nearby stars. Those gravitational pulls and tugs between the stars cause the planets to be released from their central stars. There are observations of free floating planets in the Orion nebula that confirm that planets are released from their central stars. The exoplanet search programs find many exoplanets with high eccentricity and with orbits very close to the central stars. Some of the high eccentricity exoplanets were captured from free floating planets. Other explanation to the high eccentricity exoplanets is a gravitational pull from a nearby star.
54

Figure 4 – Exoplanets mass distribution shows that there are planets with large mass above 10 Jupiter masses. Stars are born from planets so there is a continuum in the size of objects from planets to stars. Objects of all stages of the star evolution are found in the galaxy. The exoplanet search programs revealed that planets are common in the galaxy. There are many observations of large planets above 10 Jupiter mass that provide the link between planets and brown dwarfs. There are also many observations of brown dwarfs, and red dwarfs are the most common star in the galaxy. So clearly there is a continuum, and objects of all sizes, between planets and stars, are easily found in the galaxy. (From the Exoplanets Encyclopedia http://exoplanet.eu/). The high metallicity of stars with planets Stars produce their own mass. The changing magnetic fields associated with the stellar cycle supply energy to the star. This energy is converted to mass and new particles are created. The stars creates baryons or nucleons like neutrons and protons in baryon-synthesis process to form hydrogen atoms. The stars also fuse hydrogen to produce helium and heavier elements like carbon and oxygen in nucleosynthesis process. Stars fuse elements heavier then iron. For elements lighter then iron the fusion supply energy to the star and for elements heavier then iron the fusion absorb energy from the star. Therefore, the fusion of elements lighter then iron heat the star, while the fusion of elements heavier then iron cool the star. The energy to fuse elements heavier then iron is coming from the magnetic fields of the stellar cycle. The stars are not born from clouds of gas and dust as predicted by the Solar Nebula Hypothesis, but grow gradually by converting energy to mass. Therefore, the abundance and metallicity of stars is determined by internal processes in the stars. The stars create
55

their own abundance and metallicity. At its birth the star is a planet and it is growing by accreting material. When it reaches the size of a brown dwarf it start to grow by converting energy to mass. So, only a small fraction of the star mass is coming from outside. The star mass can be divided into mass that was accreted at the star birth and to mass that was converted from energy and produced by the star itself. The accreted mass in each star is about the mass of a brown dwarf, while most of the mass is created internally. If the sun is about 1000 times heavier then Jupiter, and a brown dwarf is about 20 times heavier then Jupiter, then 2% of the Sun mass is accreted while the rest is from conversion of energy to mass. The accreted material has composition that roughly resembles that of Jupiter. The stars in the Milky Way are divided to population I stars found in the Galactic disk and in the Galactic bulge and population II stars found in the Galactic halo. The population I in the disk and bulge are metal rich while population II in the halo is metal poor. The Milky Way halo contains stars of low luminosity and low mass, mainly red dwarf. The Milky Way bulge and disk contain more luminous and massive stars like K, G and F stars. The more massive stars show higher metallicity (Figure 7). This is clear from O and B stars that show the highest metallicity of all stars. Previously it was suggested that more massive stars are older. So, the O and B stars are both massive and old. The metallicity of stars depends on their mass and also on their age, since older stars are also more massive. The stars create their own metallicity and more massive stars have higher metallicity. The reason that more massive stars have higher metallicity is because the temperature and the pressure at their core are higher than in smaller stars. The high pressure and temperature ease the fusion of metals, so they are created at faster rate. The fact that more massive stars have higher metallicity can also be demonstrated with star clusters (Figure 5). Cluster M5 has stars more massive then the stars of cluster M68. Cluster M5 also shows higher metallicity then cluster M68. The changing magnetic fields that supply energy to the stars are stronger in the Milky Way Galactic disk and Galactic bulge then the magnetic fields in the Milky Way Galactic halo. This is reflected in the mass and metallicity of the stars. Stronger changing magnetic fields will supply more energy and will enable the stars of population I to grow faster, larger and develop higher metallicity then those of population II. Stars could live for a very long time and are basically eternal (Reference 4). So, if metals are always fused, why there are no stars with extreme super-metallicity? The reason is that stars also split atoms. There is a balance between the fusion of atoms and splitting or decay of atoms. As the star metallicity rise to a high values, the rate of splitting atoms is equal to the rate of fusing atoms, so no new metal atoms are created and the metallicity stay unchanged (similar to a chemical equilibrium). It can be said that the rise in the metallicity stop when there is saturation or equilibrium of the metal elements. The exoplanet search programs revealed that stars with planets have higher metallicity than star of the same mass without planets (Figure 6). We also know, as shown in figure 7, that more massive stars have higher metallicity. If we take a star with planets that have high metallicity, we can find in figure 7 a star with similar metallicity but without
56

planets. The star without planets will have higher mass then the star with the planets. We can conclude that the star with planets was a larger star in its past and it went through a significant mass loss. The only way a star can lose a significant part of its mass is by turning into a red giant. In the red giant state the star has a strong stellar wind that disperses the star material to the interstellar space. After millions of years in the red giant state the star return to the main sequence with smaller mass but it keeps the high metallicity from the time before it turned into a red giant (Figure 8). So, stars with planets that show high metallicity were red giants in their past and returned to the main sequence with smaller mass. Some of the material ejected by the star stellar wind when it was a red giant, condensed and created comets that formed the planets. This way, the link between the high metallicity of the star and the formation of its planets stem from the temporary transition of the star to a red giant. This discussion of star metallicity unveils the formation of the solar system, stellar systems, planets and exoplanets. The formation of planets in the solar system and in many other stellar systems occurs when the star turn into red giant. The sun metallicity is 20% higher then stars of the same size and it has a large and complex planetary system. This leads to the conclusion that the sun was a red giant in the past. Stars can turn into red giant many times during their life. The star accumulates mass in the main sequence and then discards this mass in the red giant state. The intricate structure of the solar system is an outcome of not one but many transitions of the sun to a red giant state along tens of billions of years. The meteorites and chondrules in the solar system have the age of 4.6 billion years because the last sun red giant transition was at that time.
57

Figure 5 - Comparing M68 and M5 show evidence that old stars are more massive, more metal rich and more luminous then young stars. The stars of M68 are young and many of them are red dwarfs that show at the bottom of the main sequence. The stars of M5 are older so all the red dwarfs evolved into higher mass stars. Low mass stars like red dwarfs cannot turn into red giants so M68 show few red giants while the higher mass stars of M5 show higher fraction of red giants. The comparison between M68 and M5 also indicate that the metallicity of stars depends on their mass. Low mass stars like red dwarfs cannot synthesis heavy nucleus. Massive stars have high temperature and high pressure at their core to synthesis metals. Therefore, the metallicity of M5 (-1.1) is higher then the metallicity of M68 (-2).
58

Figure 6 - Stars with higher metallicity are more likely to have planets. Planets are formed when the star is turned into a red giant and its strong stellar wind supply material that is used as the building blocks of its planets. Star that was a red giant lost some of its mass, so before it was a red giant it was bigger and more massive. Stars with higher mass develop higher metallicity by the high pressure and temperatures in their cores. Therefore, after the star was a red giant it will keep its past high metallicity but will have a smaller mass and likely to be with planets. (From Fischer & Valenti 2005)
59

Figure 7 – There is a correlation between the mass of the stars and their metallicity. Stars with higher mass have higher metallicity. This correlation stem from the fact that stars with higher mass have higher pressures and higher temperatures at their cores. This increases the fusion rate of the metals in the core and raises the overall metallicity of the star. The metallicity of stars with planets shown by the dashed line is higher then the metallicity of stars without planets. Stars with planets like the Sun show higher metallicity because they were once bigger stars with higher mass. Those stars lost some of their mass but kept the high metallicity that was built under higher mass. The stars lost part of their mass when they turned into a red giant. Red giants have strong stellar winds that cause mass loss to the star and supply material to build planets. The higher metallicity of stars with planets indicates that they were once red giants. The sun was a red giant 4.6 billion years ago and the meteorite and chondrules condensed at that time. (From Fischer & Valenti 2005)
60

Figure 8 – This figure shows schematically the growth of the star mass and metallicity as it turns into a red giant and back to a main sequence star. The star grows from converting the energy of its stellar cycle magnetic fields to mass, so both the mass and the metallicity of the star increase. The metallicity of the star depends on its mass as is shown in figure 7. Stars with higher metallicity have higher pressures and higher temperatures in their cores, so as the star mass increase its metallicity also increase. At some point the star turn into a red giant. In this state the star have strong stellar winds that inflict mass loss. The mass of the star decrease, but its metallicity is not changed and the star keeps the same metallicity from the time it was with its maximum mass. When the star returns to the main sequence it has smaller mass and high metallicity for its mass. The star is also likely to have planets from the condensed stellar wind of the red giant. Some of the mass lost during the red giant state is the source of the planets mass. The star before a red giant transition have more mass than after the red giant transition. The mass loss can be caused by more than one red giant transition. In this case of a series or sequence of red giant transitions it is likely that the mass lose will be greater than mass lose from a single red giant transition. This mass lose affect the metallicity of the star; higher mass lose will give higher metallicity compared to stars of similar mass. With higher mass lose the star is more likely to have planets since there is more material available to form planets. This is evident from the correlation of star metallicity and planet formation shown in figure 6. Similarly, higher mass loss will provide more
61

material to form larger planets as is evident from figure 9. Higher mass lose will also reduce the angular speed of the star as its angular momentum is lost to the red giant stellar wind.
Figure 9 – The mass of the exoplanets is related to the metallicity of the centeral star. The plus sign indicates a system with single planet, while a circle represent a multiple planet system. The dashed overplotted line shows that stars with higher metallicy have more massive planets. The planets are created from the material ejected from the central star when it was a red giant, so the higher the mass ejected by the red giant star the higher is the planet mass. A mass loss from a red giant will decrease the star mass, but the matallicity of the star will stay high, similar to what it was when the star was more massive, before the red giant transition. Therefore, a higher red giant mass loss will supply more mass to create larger planets and will also increase the star metallicity. (From Fischer & Valenti 2005)
62

The sun was a red giant According to the standard solar model the stars evolve into red giant when the hydrogen fuel in their core is depleted and they start burning helium at higher temperatures. However, the stars are not getting their energy from hydrogen but from changing magnetic fields. So, the idea that a star turn into a red giant when its hydrogen fuel is depleted, is not valid. The question of why and how a star turn into a red giant when its energy come from magnetic fields, will be examined. This question of what process transforms a star into a red giant, must be answered, as red giant are a considerable part of the star population. The answer that follows leads to a new explanation to the formation of the solar system. In reference 1 it was suggested that a star turn into a red giant because its composition change and it accumulate helium and metals. This cause helium poisoning that changes the properties of the star and prevents it from getting heated by the magnetic fields. However, this explanation is incorrect. Giant stars of spectral type O and B are starting from a small size of brown dwarf and grow by converting energy to mass. This conversion takes a lot of time and the O and B are the oldest stars. Still, their helium and hydrogen abundance is similar to smaller size stars and they show no sign of helium poisoning. The sun has abundance that is similar to that of nearby red giants. For instance, the sun has similar abundance to Aldebaran. If red giants are created by helium poisoning then the sun would not show similar abundance to nearby red giants and the signs of poisoning would be evident in the spectra of the red giants (Reference 17). According to the standard solar model the stars will evolve into a red giant when the Hydrogen in their core is depleted and the star loses its energy source. Since stars are heated by magnetic field, any interruption in the magnetic fields will cause the star to lose temporarily its energy source and turn into a red giant. The sun solar cycle is irregular; there are interruptions and variation in the amplitude of the solar cycle and periods of very weak solar cycles. Between 1645 and 1715 the sun had very few sunspots that caused a low temperature and cold winters around the world called the little ice age. This period of low number of sunspot was named the Maunder Minimum in honor of the English solar astronomer Edward W. Maunder who dedicated much of his research to the study of sunspots. The solar cycle and its associated magnetic fields is not created internally by the sun, but is applied to the sun from the outside by the galactic disk. This is evident by the fact that the magnetic fields of the solar cycle are open and extend far into the galactic disk. The sunspots are created by the solar cycle magnetic fields as was shown in reference 3. If there is interruption in the sunspots, there are interruption in the magnetic fields of the solar cycle and the solar cycle stop supplying energy to the sun. The Maunder Minimum took about 60 years. If it was extending much longer to a period of tens of million of years the sun would not have an energy source and it will cool down. The solar cycle cannot stop completely for a period of tens of million of years. Instead, frequent short period of Maunder minimum and low amplitude of the solar cycle, will cause the same effect of reducing the energy supply to the sun and cooling the sun. Cooling the sun will turn it into a red giant.
63

The electric force is know to be much stronger than the gravitational force. When a star temperature is high there are many free ions inside the star. Those ions work to hold and pull the star together like a molecule is held together in an ionic bond. When the star is colder there are less ions and the star is not held together by the electric force. In reference 3 it was shown that the sun is circled by charged plasma belts. Those plasma belts are influenced by the pinch effect and acquire electric charge. There are possibly large number of much smaller plasma belts and streams that their charge works to pull and hold stars together. When the star is colder there are less such streams and ions that hold the star together and the star start to swell. It is getting bigger and its stellar wind is much stronger. When the star expands its surface area increases and the lower density of the star outer layers enable photons to escape, so the radiation or luminosity of the star also increases. The outer layers are pushed by radiation pressure to increase the mass lose by the stellar wind. After a decrease in the strength of the magnetic fields, the energy supplied to the star is lower and the star will get colder. The star core will also get colder and the core gas pressure will not be able to hold against the pull of gravity. The star core will collapse and form a large degenerate core by taking material from higher layers of the star. When a large degenerate core is created the gravity felt by the star outer layers is lower. This lower gravity releases the outer layers to expand and to eject the massive stellar wind. After the elongated Maunder minimum is finished the star will get hotter by the magnetic fields. The core will get hotter and some of the degenerate matter will return to be a regular matter in higher layers of the star. This will increase the gravity on the outer layers of the star and will cause them to contract to the original size. Stars with higher metallicity will form more easily degenerate core and are more likely to turn into white dwarfs. When there is interruption in the stellar cycle and the magnetic fields the star turn into a red giant, however, this is not permanent or final; the star can turn back to the main sequence if the magnetic fields supply enough energy to the star. In that case, the star will shrink back and will have weaker luminosity and higher temperature. When a star is turned to a red giant and then return back to the main sequence it loses small portion of its mass depending on how long and how deep the red giant state continued. The stellar wind of a red giant is much stronger then that of a main sequence star and the star lose some of its mass to the interstellar medium. In the red giant state the star has no surplus of energy and it is not converting energy to mass, so its mass does not increase. In figure 2 it is shown that the star is turning to a red giant at a certain point in the main sequence and return to the main sequence to a lower mass. There are shown two transitions to red giant where one is longer and reach deeper into the red giant branch. The red giant transition that go deeper, also inflict larger mass lose to the star and cause it to return to the main sequence with lower mass. In extreme cases of very long Maunder minimum the red giant will have an extensive mass loss that will develop to a circumstellar envelop. Further extension of the Maunder minimum will cause the star to die and to turn into a white dwarf with planetary nebula. However, star death is very rare,
64

it is more likely that the star will survive the red giant transition and return back to the main sequence. Spiral galaxies have galactic arms that rotate faster than the galaxy. We know that the galactic arms rotate faster than the galactic disk because the swirling of the galactic arms is limited. The center of the galactic disk have higher angular speed then the edge of the galactic disk, so if the galactic arms were stationary relative to the galactic disk they would keep on swirling and look thinner and longer then they actually do. The galactic arms rotate faster than the galactic disk especially near the edge of the galactic disk. The stars in the galactic arms look brighter than the stars outside the galactic arms. They are hotter with more luminosity and shorter wavelength and also have higher mass compared to stars outside the galactic disk. The galactic arms are not sweeping the stars with them since the galactic disk angular speed is lower then the galactic arms angular speed. The stars get in and out of the galactic arms. When the stars get in the galactic arms they are affected by them. The Galactic arms are regions with strong magnetic fields. When a star is in the galactic arms it get strong magnetic fields that supply more energy to it and make it hotter. The stars outside the galactic arms are redder then star inside the galactic arms. This indicates that some of the stars leave the main sequence and enter the red giant branch. There are more red giants outside the galactic arms then red giants inside the galactic arms. As the galactic arms sweep through the galaxy they heat the stars inside them and change some of the stars from red giants back to a main sequence stars. When the galactic arms enter a region of the galactic disk it changes the stars to main sequence stars and when the galactic arms leave this region some of the stars will turn into a red giant stars. The time the stars reside in the galactic arms can be calculated based on the rotation curve of the galaxy. This enable to find how much time it takes for the star to change from a main sequence to a red giant and back to a main sequence. The galactic arms are like power lines that carry electric energy from the supermassive black hole at the center of the galaxy to the outer regions of the galactic disk. The stars in the galactic arms show how the region of the star influence the star. In a region with strong magnetic fields the stars are more massive and luminous. Stars grow from planets, first by accretion and then by conversion of energy to mass. Both the star growth rate and its final mass are determined by the region and strength of the magnetic fields (Figure 12). In the Milky Way bulge the stars are more massive and luminous than the stars in the galactic disk. The changing magnetic fields are stronger in the Milky Way bulge, so the final size of the stars in this area will be larger than stars in the galactic disk where the changing magnetic fields are weaker. Stars in specific regions of the galaxy have a mass limit that depends on the strength of the magnetic fields in that region. If the mass of the star crosses this mass limit the changing magnetic fields will not be able to support its luminosity and energy consumption. The star will suffer from an extended Maunder minimum that will cool the star and convert it to a red giant. In the red giant state the star will have a strong stellar wind that will decrease the star mass. In this way, the red giant state of the star keeps its mass according to the mass limit allowed by the changing magnetic fields. After the star is losing considerable part of its mass to the stellar wind, its mass will return to be below the mass limit. The energy consumption of the star will be lower and it will return to the main sequence since the changing magnetic
65

fields will be able to supply this energy consumption. In the Milky Way bulge and disk there is diffusion and stars change their position and region, so the mass limit is changing, and not obvious. However, in globular cluster the turn off point indicate this mass limit. Each Globular Cluster has changing magnetic fields of specific strength that enable the stars to grow to a specific size. This size is the turn off point. If the stars in the globular cluster grow beyond the mass limit of the turn off point, the changing magnetic fields cannot support their energy consumption and they turn into red giants. As stars change their position in the galactic disk or bulge their mass is fitted to the mass limit of the region. If a star of spectral Class A will drift into a region that can support spectral class G it will get into a red giant state for a long time and lose most of its mass in a circumstellar envelop until it will have a mass typical of Spectral class G. The separation of the stars to population I and population II also depends on the strength of the magnetic fields. Population I stars are found on the galactic disk and absorb strong magnetic fields so the stars grow larger and have more luminosity and higher metallicity. Population II are found on the galactic halo where the changing magnetic fields are weaker so the stars are smaller and many of them are red dwarfs. Red giants can also be understood in the context of the galaxy energy production. The energy of the galaxy is supplied by a supermassive black hole at the center of the galaxy. Matter is continually falling to the supermassive black hole. This matter is produced by stars in the galaxy and much of it originated from stellar wind of red giants. The transition of stars to red giant is essential to maintain the energy production in the galaxy. The matter falling to the supermassive black hole create eddies of magnetic fields by the dynamo effect. The eddies of the magnetic fields disperse in the galaxy and heat the stars. If the amount of material that fall to the supermassive black hole decreases, the energy available to the stars in the galaxy also decreases; the galaxy will have weaker changing magnetic fields and many of the stars will turn into red giants. The red giants will eject large amount of matter by their stellar wind. After billion of years this matter will reach the supermassive black hole and increase the energy supplied to the galaxy. By this feedback mechanism between the matter ejected by the red giants and the matter falling to the supermassive black hole the galaxy maintain its energy balance. When a star is in the state of a red giant for a long time the material ejected from its stellar wind will accumulate and form a circumstellar envelope. Circumstellar envelops are found using infrared radiation. The infrared radiation from circumstellar envelope is intense and show that the source is much bigger than an ordinary star. The red giant is found inside the circumstellar envelop but it is covered with dust and gas, so the star itself is invisible at optical wavelength and only the gas and dust infrared radiation is observed. The dust and gas infrared radiation indicate a low temperature of a few hundreds Kelvin of the circumstellar enevelop. Many of the circumstellar envelops were detected and observed by Infrared telescopes like the Infrared Astronomy Satellite (IRAS), the ISO satellite, the Spitzer space telescope and Herschel Space Observatory. IRAS detected about 100000 circumstellar envelops to show that this is common phenomena in the galaxy. Circumstellar envelop indicate a significant mass loss of the star but it is not always signify the death of the star. The circumstellar envelop could disperse and leave a main
66

sequence star of smaller size and lower luminosity. The dust and gas of the circumstellar enevelop have the potential to form planets around the star after the star return to the main sequence. The large number of circumstellar envelops found by IRAS indicate that they are a main source for the creation of planets in the galaxy. Circumstellar envelops contain large number of different molecules that many of them are also found in the solar system (references 13 and 14). There are circumstellar envelop molecules and atoms that are found both in the outer planets and in the terrestrial planets. Molecules like iron and silicone are very abundant and iron is the second most abundant metal in circumstellar envelops. The iron and silicon are the main constituents of the terrestrial planets. Circumstellar envelops contain molecules like water, table salt NaCl, and organic molecules like methane that is found in the outer planets. There is also formation of dust in the circumstellar envelops as the stellar winds move far from the star it cools and some of the material condenses to form dust grains reminiscent of chondrules in the solar system meteorites. The Helix Nebula shows the formation of comets or knots (Figure 13). Those knots were formed when the gas and dust from the progenitor red giant star condensed and formed large bodies. Those knots are attracted by gravity to the planetary nebula nucleus at the center of the planetary nebula. The radiation from the planetary nebula nucleus puffs the knots so they have tail and enormous size of several AU. Those comets like objects, are also formed in other circumstellar envelops, but the opaque gas and dust hide them. The formation of comets and larger comet like objects in circumstellar envelops is parallel to the formation of objects in the Kuiper belt, so objects like Pluto and Eris were formed in a similar process. The formation of those objects is a major step in the development of the plants. The red giant stellar wind is first condensed into dust, then it clump into comets and larger comet like objects, and those create planet cores or fall to planets. The resemblance in the composition of the planets and material in red giants circumstellar envelops suggest that star with planets like the Sun were once red giants and that the ejected material from the stellar wind condensed and clumped to form the planets. The star CW Leonis IRC +10216 is a red giant star 650 light years from earth having mass between 1.5 – 4 times the Sun mass. The star was observed with NASA's submilimitter wave astronomy satellite (SWAS) which is a radio telescope in low orbit around earth. SWAS was built to study the chemical composition of interstellar clouds and to find emission from water, molecular oxygen, carbon and isotopic carbon monoxide using radio waves. At CW Leonis SWAS found large amount of water, concentrated on icy bodies and comets in the envelop around the star. Those comets are similar to the comets in the Kuiper belt in the solar system. The water and comets in CW Leonis were created from condensation of the stellar wind similar to what is observed in the Helix Nebula but on a smaller scale. CW Leonis is not necessarily a dying star. As its stellar cycle will supply more energy to the star, the star can return to the main sequence, and its comets condensed from the stellar wind could form planets that will orbit CW Leonis. The fact that the solar system contains large number of comets, indicate that the sun was a red giant. When the sun was a red giant the massive stellar wind condensed and formed the comets. Some of those comets are still orbiting the sun in the Kuiper belt and Oort cloud but large number of them fell to the outer planets and increased their mass.
67

In 1991 Dale Frail and Alex Wolszczan found a pulsar that is a neutron star, which has planets orbiting him. The pulsar PSR1257+12 have 3 planets in orbit around it. The planets orbits reside on the same plane similar to the ecliptic plane in the solar system. If the pulsar planets were captured it is unlikely that they all have orbits on the same plane. Those planets were created from the material ejected by the progenitor star when it exploded in a supernova. This shows that planets are created from the material ejected by their central star. The solar system planets were also created from material ejected by the sun and the only way this could happen is when the sun turned into a red giant. The Spitzer Space Telescope found, using its infrared detector, asteroids and silicate minerals around eight white dwarfs. Those asteroids are a remnant from the time the white dwarfs were red giants. The precursor red giants had strong stellar wind that contained silicate gas. This silicate gas condensed and form dust and larger bodies like asteroids. The asteroids of the solar system created similarly when the sun was a red giant, and silicate gas in the solar wind condensed to form chondrules, comets and asteroids. The Sun has similar abundance to adjacent red giant stars. This similar abundance indicates that red giants and main sequence stars are actually the same star in different states. The Sun was a red giant 4.6 billions years ago and had at that time a similar abundance to what is found today. When the sun returned to the main sequence its abundance did not change. The similarity of the abundance of the Sun to red giants could be found, for instance, when comparing the sun abundance to that of Aldebaran (Reference 17). The Sun metallicity is higher than similar stars of the same mass and spectral class by about 20%. The metallicity of stars depends mostly on their mass. Massive stars cores have high pressure and temperature that enables the fusion of metal nuclei. In massive star the fusion rate is higher and the star will generally show higher metallicity than a lower mass star. If a massive star is turned into a red giant it will lose some of its mass to the stellar wind. When it return to the main sequence it will have lower mass but will keep the high metallicity that it had before the red giant transition (Figure 8). Therefore, if a star has a higher metallicity than stars of similar mass, its means the star was once larger and went through a red giant transition that caused a mass loss. This situation is clear from the sun metallicity; since its metallicity is high, it means that the sun had higher mass long time ago that produced its high metallicity. Some of this mass was lost in a red giant transition. Most of the mass the Sun lost dispersed to the interstellar space but some of it supplied the building blocks to create the planets. Meteorites are everywhere in the solar system, they constantly fall to earth and their composition can tell us about the origin of the solar system. The age of meteorite can be determined by radioactive dating, for instance the Uranium Lead dating. It is found that the meteorites were formed around 4.6 billion years ago. This date must be linked to a major event in the history of the solar system. At this event not only the meteorite were formed, but also material was added to increase the mass of the planets. The Sun existed
68

4.6 billion years ago and had existed for hundreds of billion of years before that time (Reference 4). The Sun was created first, hundreds of billion of years ago and the planets were created later, so the solar system has a dualistic origin. The event that created the meteorite 4.6 billion years ago was a transition of the Sun to a red giant. At 4.6 billion years ago the magnetic fields associated with the solar cycle weakened and the Sun cooled from lack of energy. This turned the sun into a red giant. When the Sun was a red giant it ejected massive solar wind that condensed far from the Sun and formed chondrules, meteorites and comets. Some of the comets and meteorites fell to the planets and increased their mass. The planets also existed 4.6 billions years ago and are much older than the last sun red giant transition 4.6 billion years ago. If the sun is 550 billion years old, (reference 4) the planets could be easily tens of billions years old. The fall of comet Shoemaker-Levy 9 to Jupiter in 1989 demonstrates the mass increase of a planet from falling comets. The short lived isotopes or nuclides were created by the red giant sun and their trace is found in meteorites and chondrules. The short lived isotopes reveal how long the red giant state of the sun continued 4.6 billion years ago. The short lived isotopes show that the chondrules were formed in a period of 1.4 Million years and the meteorites were created in about 20 million years. The creation of the chondrules was probably an event at the peak of the red giant state of the Sun. The solar wind strength and the sun mass loss rate were at maximum at that time. However, before and after the creation of the chondrules there was a moderate period of the red giant Sun. Therefore, the period of the red giant sun continued more then 1.4 million years but lasted less then 20 million years. The meteorite formed well after the red giant peak and even after the end of the red giant state. Table 1 shows a list of short lived isotopes found in the solar system. The half life range from 0.1 million years for Calcium 41, to 103 million years for Samariun 146. The short lived isotopes were ejected by the solar wind of the red giant sun. Far from the sun the gases in the solar wind condensed and incorporated the short lived isotopes. The short distance between the red giant sun and the meteorites explain how the short live isotopes managed to appear in meteorite so quickly before they decayed. The half life of 0.1 million years for Calcium 41 is challenging to the solar nebula hypothesis. It requires the isotope to arrive to the solar nebula very fast and that the nebula will collapse and form the solar system in only about 1 million years. According to the solar nebula hypothesis the source of the Short lived isotope is either a supernova or a nearby red giant. The idea that a supernova triggered the creation of the solar system and at the same time supplied the short lived isotopes is prevalent. However, there are evidences against this idea. In 1979 NASA lunched the High Energy Astronomy Observatory 3 (HEAO 3). Its gamma ray spectroscopy experiment found a peak in the gamma ray spectrum for Magnesium. The Magnesium decayed from Aluminum 26. It was concluded that Aluminum 26 is spread around the galaxy in large quantities (Reference 5). Large quantities of Aluminum 26 where also found in the composition of the Allende meteorite and other meteorites. Since supernovas are rare events, it cannot be that those large quantities of Aluminum 26 are form supernovas. There are observations
69

of red giants that show a high abundance of Aluminum 26. The nearby red giant IRC+10216 show very high abundance of Aluminum 26 (Reference 6). This confirms that the Aluminum 26 found in the solar system came from the red giant sun and not from a nearby supernova. A further problem of the supernova as the origin of the short lived isotopes in the solar system is that some of the elements expected to be synthesized in a supernova explosion are missing. Tin(Sn) 126 with half life of 0.3 million years and Curium 247 with half life of 16 million years should have been present in the nebula and early solar system but their traces are not found. Those elements are r-process elements that should be created by a supernova in large amounts. The fact that they are missing indicates that the source of the short lived elements is a red giant and not a supernova (Reference 7). Supernovas are very energetic and could easily destroy the solar system. The supernova must be far enough so that the shock wave will not be too powerful. However, the present of Calcium 41 with its short half life limit the distance of the supernova from the nebula. If the supernova was too distant the calcium 41 would have been decayed before being incorporated in the solar nebula. Those conditions put further constraints that discredit the supernova as a possible source of the short lived isotopes (Reference 7). The initial ratios of the isotopes of the early solar system are presented in Table 1. Those ratios are similar to the ratio of those isotopes found in red giant stars. This shows that a red giant star is the origin of the short lived isotopes in the solar system (Reference 7).
Table 1 – The Short Lived Isotopes found in the solar system. A red giant sun 4.6 billion years ago is the only explanation for the source of those short lived isotopes. Other ideas like an external supernova or an external red giant are unlikely and have many flaws and contradicting evidences. If the planets were born from the stellar wind of a red giant, then why it must be the sun and not an external red giant? The planets of the solar system are arranged in a complex structure. Most of them orbit the sun, and spin in the same direction. All the orbits around the sun have low eccentricity. The planets were not created from a single dust cloud all at
70

the same time, instead the planet were created gradually in a long period where a new planet was added if the inner planets were in a stable, coplanar and circular orbits. If the solar planets were created by an external red giant then one travel near the red giant will not suffice. The sun has to travel near different red giants several times. To absorb material form a nearby red giant the solar system needs to be around 0.1 light years from the red giant. If the solar system is half built with for instance 6 planets a transit near a red giant 0.1 light years away will surely destabilize the planets orbits and destroy the solar system. Therefore, it is not possible for the planets to be formed by an external red giant. Many of the meteorites show signs of differentiation. The meteorite were part of large bodies that melted, and heavy elements like iron were deposited at the center of the body, while lighter elements like silicone deposited at the outer layers of the body. To melt large bodies like asteroids require a considerable amount of heat. This heat came from short lived isotopes like Aluminium-26 that was supplied by the red giant sun. This also invalidates an external red giant source. It is unlikely that the an external red giant will supply the large amount of short lived isotopes, and that the sun will pass near this external red giant at the right time to pick the short lived isotopes before they decay. Further evidence in support of the red giant sun is the strong similarity between the abundance of the sun, planets, meteorites and chondrules. This similarity indicates that the material for those objects came from a single common source. If the planets were created from an external red giant, the sun and planets would show dissimilar abundance. Chondrules are small spheres found in chondrite meteorites with an average size between 0.2 to 1.5 millimeter and made of silicate material like olivine and pyroxene (Figure 10). Chondrite meteorites are the most common meteorite and about 80% of all meteorites found on earth are chondrite. Chondrules are a major constituent of chondrite meteorites and more than 50% of the mass of the chondrite meteorite is chondrules. This make the chondrules a widely spread ingredient of the solar system and only a process on a massive scale was able to produce them. Condensations from the solar wind of the red giant sun can certainly produce chondrules at such an extensive scale. The composition of chondrules is very similar to the composition or abundance of the sun. The chondrules are therefore condensation of the sun gas (Reference 11). The chondrules are striking evidence that the sun was a red giant, as they formed when silicate vapor from the red giant sun cooled and condensed. It is very hard to explain the creation of chondrules with the solar nebula hypothesis and extreme conditions are used like shock waves in the nebula or lightning. The chondrules carry a mix of materials like olivine Mg2SiO4 that when melted is broken to 2MgO or magnesium oxide and SiO4 or silicon dioxide also called silica. If the chondrules were cooling slowly, as would be expected by the solar nebula hypothesis, those minerals will find their most stable state and will be equilibrated. However, what is found in the chondrules are minerals in unequilibarated form, an evidence that the chondrules cooled very quickly in an hour or few hours. As the silicate vapor was carried by the fast solar wind of the red giant sun, it cooled very fast. The temperature of the vapor decreased as the distance from the hot sun increased and the volume of the gas increased. The chondrules condensed at temperatures between 1200 to
71

2000 K. Those temperatures are comparable to the temperature observed in the photosphere of red giant stars. Therefore, the red giant sun could supply the right environment and conditions for the condensation of the chondrules. Chondrules show evidence of reheating and then cooling again. The reheating could be the result of turbulence in the red giant solar wind or fluctuation in the solar wind strength. The present of volatile material in the chondrules reflect the high concentration of volatile material in the solar wind of the red giant sun. Observation of circumstellar envelops also support the idea that chondrules condensed form the solar wind of the red giant sun. There are observations that indicate the formation of dust grains in circumstellar envelops around red giants (Reference 13). Some circumstellar envelops also contains olivine and pyroxene that are the building blocks of chondrules.
Figure 10 - Chondrules are small spherules 0.2 to 1.5 millimeter in size found in chondrite meteorites. Chondrules have abundance similar to that of the sun. The chondrules are condensation from the solar wind when the sun was a red giant 4.6 billion years ago. The chondrules show evidence that they cooled very fast as the high speed solar wind carried the silicate gas quickly to the outer and cooler region of the solar system. Analysis of dust from comet Wild 2, collected by NASA's Stardust mission, revealed dust grain with features of high temperature similar to chondrules. The oxygen isotopes ratio found on these grains was similar to what is found on both asteroids and the sun. The origin of Wild 2 comet is from the outer reaches of the solar system or the Kuiper belt. Those chondrule like dust grain, to reach the Kuiper belt, needed to travel all the way
72

from the inner parts of the solar system to the Kuiper belt. This migration can easily be understood if those grains were condensed in the red giant solar wind and then drifted by the dense solar wind to the Kuiper belt. According to the solar nebula hypothesis the dust grains that show feature of high temperature were created near the sun. It is hard to imagine how they got so far from the sun to be found on comet Wild 2. When the sun was a red giant, 4.6 billion years ago, its radius was about 4 times its present radius. The sun did not swell to a size that reach planet Mercury. The terrestrial planets existed before the sun red giant transition 4.6 billion years ago and they emerged from the sun red giant transition unharmed. The spin or rotation of Mercury and Venus is unusual. The solar day of Mercury is 176 earth days and Venus have a retrograde spin, so it spins in opposite direction to the spin of the other planets. The origin of this unusual spin could be linked to swelling of the sun 4.6 billion years ago. The tidal forces from the red giant sun acted to impede the spin of Mercury and reverse the spin of Venus (Reference 3). Spectroscopy of the sun reveals that the elements Lithium, Beryllium and Boron are scarce in the sun. The high temperature of the sun destroys those elements. On earth those elements can be found in large quantities. If the planets were created from condensation of gas from the sun, those elements should not be present on earth. However, the planets were formed from condensation of the sun gas from the time it was a red giant. In the red giant state the sun was cooler then it is today. There are observations of red giant stars with high abundance of lithium (Reference 16).The light element are replenished inside the cooler red giant sun and released with the strong solar wind of the red giant sun. Therefore, the present of those light elements on earth support the formation of the planets from the solar wind of the red giant sun. The exoplanet search programs found many red giants with planets (Figure 11). This indicates that planets can survive the transition of the central star to a red giant. So, a planetary stellar systems like the solar system can grow gradually by many red giant transitions and at each transition material and mass is added to the planets. In figure 11 the stars with planets are concentrated near the turn off point of the Hertzsprung Russell diagram. This confirms that planets are created by fluctuation of the star between a red giant and a main sequence star. At the turn off point the stars are most likely to fluctuate between a red giant and a main sequence star.
73

Figure 11 – This Hertzsprung Russell diagram shows the luminosity and temperature of the stars in the exoplanet search programs. The stars that have planets are shown with circles. The diagram shows many observations of red giants with planets. This indicates that red giants and their planets can coexist and that the planets can grow from the strong stellar winds of the red giant. The planets can withstand the transition of the star to a red giant state without being destroyed. Therefore, the planets survive and collect mass from repeating red giant transitions. The planets are created gradually not by one but by many transitions of the star to a red giant. Form this diagram it is also clear that the majority of the stars with planets are concentrated near the turnoff point of the H-R diagram or where the red giant branch is diverging from the main sequence. Stars at the turnoff point are most likely to fluctuate from main sequence to red giant. Stars at the turnoff point are close both to the main sequence branch and to the red giant branch. This shows the link between red giant stars and the formation of planets. (From Fischer & Valenti 2005)
74

Figure 12 – The stars starts their life as planets. They first grow from accretion and then from conversion of energy to mass. The final size of a star is determined by the strength of the magnetic fields in its region. In the Milky Way bulge the stars will absorb strong magnetic fields so they can grow faster and get to larger size than stars in the Milky Way disk. Each region in the galaxy can support stars of certain size; if the star is crossing this size limit, the magnetic fields will not be able to support its energy consumption. The star will get into an extended Maunder minimum that will turn it into a red giant. In the red giant state the star will lose some of its mass to strong stellar wind. The star will get smaller until it will return to the size limit supported by the specific region in the galaxy. The stars can gain mass and also can lose mass so in the long run their mass is determined by the strength of the magnetic fields. This is clear in the globular clusters where the turnoff point is determined by the strength of the magnetic fields. The planets were born from the solar wind of the red giant Sun Stars have very long lives. In reference 3 it was shown that the sun could be several hundred billion years old. In such a long time, it could be argued that planets could accumulate their mass from interstellar material. One source of the planets mass could be interstellar material that enters the solar system and a second source could be from condensation of the solar wind of the main sequence sun. The planets could accumulate their mass from slow accretion and there is no need for the sun to turn into a red giant in order to explain the mass of the planets. However, such slow accretion scenario cannot explain the fact that the meteorite and chondrules are 4.6 billion years old. Slow accretion scenario also cannot explain the source of the short lived isotopes.
75

The fact that meteorite are 4.6 billion years old and have the same composition of the sun and distributed all over the solar system, indicate that large quantities of material was ejected from the sun 4.6 billion years ago. If the meteorites were from a planetary collision 4.6 billion years ago, than the meteorites would not have the exact composition of the sun and their distribution in the solar system would be more localized. The sun was a red giant and as a red giant it dispersed large amount of mass and matter by its solar wind. To get to the planets the solar wind went trough a long and complex process until it was accreted and captured by the planets. To reveal this process we can use observation of the solar system like its comets and the Kuiper belt, observation of nearby red giants stars , circumstellar envelops and planetary nebulas, and we can use some of the ideas of the solar nebula hypothesis especially those that describe the formation of large object from gas and dust. Stars that turn into a red giant eject large amount of matter. A red giant typically have a mass lose of 10^-7 solar masses per year. After a long time in the red giant state this matter will accumulate and form large gas and dust shell around the star called Circumstellar Enevelop. Circumstellar envelops hide the red giant star at their center and can be observed in Infrared. There are observations of tens of thousands of circumstellar envelops in the Milky Way. The composition of the Circumstellar enevelops reveals diverse materials like silicates, iron, water, and organic compounds. Those materials are also found in the solar system. Circumstellar envelops can turn into Planetary Nebula in which most of the material of the star is dispersed to form large gas and dust nebula. An example of a Planetary Nebula is the Helix nebula (Figure 13). In this image it is shown that the gas and dust cloud is clumped into knots or comet like objects. Those comets like objects reveal how the gas and cloud ejected by the star is turned into large bodies. Those knots and comets are the building blocks of planets and are a developmental stage that link between the gas and dust of the stellar wind and the formation of planets. In circumstellar envelops and red giants there is similar growth of comet like objects, but on a smaller scale, since the mass of the gas and dust of a circumstellar enevelop is smaller then the mass of the planetary nebula. The comets of the solar system were created by the red giant sun 4.6 billion years ago as is evident from radioactive dating of meteorites. Meteorites and asteroids are actually comets that their ices were evaporated. Comets are icy object found in the outer regions of the solar system. When comets get near the sun the ices are evaporated and the comets appear with long tail of gas and dust. The comets form two tails one is of dust and gas that follow the comets orbit and one is made of ions that is always pointed directly away from the sun and is induced by the solar wind of the sun. There are comets with short period like Halley's Comet that are originated from the Kuiper belt and there are comets with long period like comet Hale Bopp that are originated from the Oort cloud. The comets contain ices like water ice, carbon monoxide, carbon dioxide, methane and ammonia. The nucleus of comets is rocky and has composition similar to asteroids. The materials found in comets are also found in circumstellar enevelops. The comets are
76

therefore condensation of the solar wind 4.6 billion years ago when the sun was a red giant. The red giant sun had massive solar wind; this solar wind condensed at the outer regions of the solar system and formed the Kuiper belt and the Oort cloud (Figure 15). The comets that formed at the Kuiper belt grew from impact, collisions and cementation of dust aggregates. As the comets collided, the energy form the collision melted some of the ices and when the ices froze again the colliding bodied where connected. Those impacts created large comets of tens of kilometers in radius. Those large comets later aggregated by gravity to form very large objects like Pluto and Eris. Those objects were pulled by the sun gravity, by gravitational pulls of other large comets or existing planets and drifted to the inner parts of the solar system. Those objects as they approached the sun were captured by the sun to from cores or nucleuses of new planets. After the new planet orbited the sun it accreted comets and asteroids and its mass increased. Subsequent transitions of the sun to a red giant supplied additional material that formed new comets, and again, some of them were captured by the new planets to increase the planets mass. This way, in a gradual process over many transitions of the sun to a red giant, new planets were added to the solar system and the mass of existing planets increased (Figure 17). The orbits of some comets are at high angle to the ecliptic plane of the solar system. For instance, comet Hale Bopp have almost perpendicular angle to the ecliptic. This support the idea, that the comets are originated from the solar wind of the red giant sun. The solar wind spread material in all directions and some of it will reach to regions that reside at high angles to the ecliptic plane. Therefore, some comets will be formed at high angle to the ecliptic plane. However, most of the comets will have orbits with small angle to the ecliptic plane. The Kuiper belt is found beyond the orbit of Neptune between 30 to 55 AU. The Kuiper belt contains tens of thousands of objects larger then 100 kilometer. Spectroscopy of Pluto and other large Kuiper belt objects shows that they contain water ice and methane, this confirms the idea that the large Kuiper belt objects grew by accreting comets. The Kuiper belt, right after the time of the last red giant transition, was much denser and contained many more objects. Some of those objects shifted their orbits by the gravitational pull of the outer planets of the solar system or other large comets and fell to the inner parts of the solar system. Some of those objects were accreted by the planets and increased their mass. The depletion of the Kuiper belt continues until this day as is evident by observations of comets that are falling to planets. Jupiter is the most massive planet in the solar system and by its large gravity it captures many of the comets and Kuiper belt objects. A striking example of this is the comet Shoemaker-Levy 9 that fell to Jupiter in 1994. As it fell to Jupiter it broke apart and showed that is was an aggregate of smaller object that were clumped together. This demonstrates how the planets grew from falling comets. Those days the fall of comets to the planets is rare, but short after the red giant transition 4.6 billion years ago this happened frequently and large comets fell daily to the planets. While comet Shoemaker-Levy 9 demonstrate how the mass of the planets grew from accreting Kuiper belt objects, Neptune moon Triton demonstrate the formation of new
77

planets and moons from large Kuiper belt objects. Neptune moon Triton has a highly inclined and retrograde orbit around Neptune, indicating that it was captured. It is also from the Kuiper belt, since its composition is the same as the Kuiper belt objects. Triton resembles Pluto in its composition and brightness and this suggest that they form at the same region. Triton is an example of a new moon but in different circumstances when the outer planets were missing it could easily get into orbit around the sun and form the nucleus or core of a new planet. The solar system grew gradually and at earlier times there were fewer planets in the solar system (Figure 17). At those earlier times large Kuiper belt objects like Pluto were released from the Kuiper belt by gravitational pull of planets, nearby star or other Kuiper belt object and fell to the inner parts of the solar system to form new planets. Not all Kuiper belt objects that fell in this way created new planets, most of them fell to the sun or collided with existing planets. The Kuiper belt objects could form both the outer gas giant planets and the terrestrial rocky planets. Pluto has a rock to ice ratio of 70/30 so even if its ices evaporate by the sun heat, still much material will be left to form the nucleus of a new terrestrial planet. Figure 13 shows how the solar wind of a red giant forms comets. This figure shows many knots and comets that formed by the dust cloud of the Helix planetary nebula. Those knots are similar to the Kuiper belt objects and indicated that the Kuiper belt objects formed from the solar wind of the red giant sun. In circumstellar envelops around red giants there is a similar process of clumping comets from the dust and gas clouds. Those comets are the building blocks of the solar planets. Many of the exoplanets were also formed by this process from comets created by a red giant stellar wind. The high metallicity of stars with planets confirms that the star went through a mass loss when it was a red giant. The process by which the dust and gas cloud is clumped to from larger and larger comet like objects can be understood from studies of the solar nebula hypothesis that describe the formation of large bodies or planetesimals. The dust and gas ejected by the red giant sun is not very different from the dust and gas cloud described by the solar nebula hypothesis.
78

Figure 13 – This is a photo of the Helix planetary nebula. Planetary nebulae are developed after a star turn into a red giant and eject strong stellar wind for a long time. Most of the star mass is ejected outward and form a gas and dust cloud around the star. This figure shows the formation of knots or comet like objects that are reminiscent of Kuiper Belt objects in the solar system. It demonstrates the formation of comets and larger objects that are the building blocks of planets. In a similar process the stellar wind of a red giant form a circumstellar enevelops that condense to form comets. Those comets are then falling toward the star under its gravitational pull and form new planets or are been accreted by existing planets. The comparison to the solar system comets is limited since the large Helix nebula Knots have the size of several AU. At the lowest level, the dust particles, condensed from the solar wind, are colliding together. The collisions chemically bond the particle and friction between the dust particles electrically charge the particles, so they stick together by electrostatic forces. A NASA Space Shuttle experiment called Cosmic Dust Aggregation Experiment - CODAG - showed how dust particles stick together in microgravity conditions and grow rapidly to fractal dust aggregates (Reference 18). The electrostatic forces create small fluffy objects; those fluffy objects are colliding with each other and can grow to size of one meter. When the fluffy objects collide, their kinetic energy compact the objects and absorb the energy of the impact. This way the objects do not bounce from each other but stick together. The bodies will also condense gas to form layers of frost and ices around the bodies. Those ices will melt upon impact and stick the objects together when frozen again. Additional process that forms small objects is surface tension that creates the chondrules to have sizes of few millimeters. Aggregates of dust can also be combined by cementation in the presence of water or ice.
79
The growth by impacts dominates the growth of larger bodies. Collisions of larger bodies can fragment and scatter the objects. So, to avoid fragmentation the growth continues by collisions between large objects and small objects. When the small objects are hitting the larger object the larger body will not fragment and it will absorb the smaller body. When the objects reach sizes of several kilometers they attract other objects by gravity. Large objects sweep all the smaller objects in their vicinity. The larger the object, the larger its gravitational pull on nearby objects and the faster it grows. This growth by gravity creates objects the size of Pluto and Eris. Those objects can be captured by the sun or planets to form the nucleus or core of a new planet or moon. The large objects, of few kilometers in diameter or larger, affect other bodies in their vicinity by their gravity. The gravity disrupts the orbits of nearby objects and enables some of them to leave the Kuiper belt and enter to the solar system. When those comets enter the solar system they are captured by planets and increase their mass. Extremely massive bodies like Pluto can create the nucleus or core of new planet or moon. The Kuiper belt objects are concentrated near the ecliptic plane. Their distribution reminds more a donut shape than a disk shape. The solar wind is spreading in all direction, so many comets and the Kuiper belt objects should be found at high angle to the ecliptic. The fact that the Kuiper belt is concentrated near the ecliptic suggests that there is a process that drifts the dust from the solar wind toward the ecliptic. The solar wind is pushed outward form the sun but it also rotates with the sun. The solar wind drifts the dust in the solar system with it. The dust is hit by particles in the solar wind and it also affected by the magnetic fields of the solar wind that by the Lorenz force carry the dust particles. So, the dust rotates with the solar wind around the sun. This rotation applies a centrifugal force on the dust particles that tend to pull them away from the sun (Figure 14). The gravitational force that the sun exerts on the dust particles has a horizontal component and a vertical component. The centrifugal force is in opposite direction to the horizontal component of the sun gravitational force. This decreases or cancels the horizontal component of the gravitational force. The vertical component is not affected and pulls the dust particle toward the ecliptic plane. This drift toward the ecliptic plane is evident from the distribution of the Kuiper belt objects and also by the zodiacal light. The zodiacal light can be seen in dark nights and far from the city and its light pollution. It is a reflection of sunlight by interplanetary dust that resides near the ecliptic plane. The zodiacal light and the interplanetary dust form a lens shape near the ecliptic plane centered around the sun. The zodiacal light shows that the dust in the solar system is pulled to the ecliptic plane. The dust was also pulled to the ecliptic plane when the sun was a red giant and the material ejected from the red giant sun accumulated near the ecliptic plane. The dust particles had a curved trajectory similar to what is seen in figure 15. The dust particles will be pushed outward by the solar wind and at the same time move toward the ecliptic plane. At the outer regions of the solar system and near the ecliptic plane the gas and dust will condense to form comets. After a red giant transition many large comets develop and circle the sun. The dense distribution of the comets will induce collisions and gravitational pulls that will cause them to fall toward the sun and the inner planets. As seen in figure 15 the material that was ejected by the sun follows a cycle denoted by 1, 2, and 3. At 1 material is ejected by the solar wind, at 2 the gas and dust condense to from comets near the ecliptic plane and far from the sun near the Kuiper
80

belt, at 3 the comets fall to the planets on the ecliptic plane. The fact that the comets fall to the planets near the ecliptic plane causes the outermost planets to grow faster as they collect most of the comets (Figure 17). Only few comets reach the inner planets so their growth is slower then that of the outer planets.
Figure 14 – The solar wind from the red giant sun formed the comets in the Kuiper belt. The solar wind is spreading in all directions but the Kuiper belt objects are concentrated near the ecliptic plane. So, there is a flattening process that pulled the dust to the ecliptic plane. The dust is drifted to the ecliptic plane by the vertical component of the sun gravitational force. The solar wind blows outward and it also rotates with the sun. Dust particles will rotate with the solar wind and will be pushed outward by the centrifugal force. The centrifugal force is perpendicular to the sun rotation axis and parallel to the ecliptic plane. The centrifugal force will cancel the horizontal component of the sun gravitational force. The sun vertical component of the gravitational force is unaffected and will exert force that will pull the dust to the ecliptic plane. The drift of dust to the ecliptic plane is evident from the zodiacal light that is created by interplanetary dust.
Figure 15 – The transfer of mass from the red giant sun to the planets was indirect, despite the fact that the solar wind was blowing close to the planets. The solar wind was in a hot plasma state near the planets and it could not sink to the planets. The solar wind
81

blew to the outer regions of the solar system where the temperatures are colder. The plasma of the solar wind first recombined to form atoms, then the atoms formed molecules and those molecules condensed to form dust. The dust clumped by electrostatic attraction and by impacts and formed comets and larger objects around the ecliptic plane and near the Kuiper belt. The comets under the gravitational pull of the sun, planets and other comets fell from the outer regions of the solar system to its inner parts and then captured by the planets. The track of mass from the sun to the planets is denoted by the numbers 1, 2, and 3. The material that builds the planets is entering the solar system from the outside and from the ecliptic plane. The injection of material in this form gives the solar planetary system its disc like shape. If one takes a bucket of sand and slowly pour it to the floor the sand will form a small pile with a peak directed toward the bucket from where the sand was poured. Similarly, the flow of material from the Kuiper belt to the ecliptic plane formed the planets on the ecliptic plane with a layered structure that grow outward and got closer and closer to the Kuiper belt from where the material arrived (Figure 17). The solar wind of the red giant sun rotated with the sun, so the comets condensed from the solar wind also rotate in the same direction as the sun and the solar wind. Those comets when they create the nucleus or cores of new planets or increase the mass of existing planets will give the planets orbits that are in the same direction as the sun rotation. Therefore, the orbits of the solar system planets are in the same direction and correspond to the sun rotation. The flattening process of the dust in the solar system created the comets and the Kuiper belt on the ecliptic plane. As the Kuiper belt supplied the mass for the planets and this mass arrived on the ecliptic plane, the comets created a coplanar planets on the ecliptic plane. Therefore, all the planets orbits reside approximately on the same ecliptic plane. As comets from the Kuiper belt are falling to the planets they hit the planets on their outer hemisphere facing toward the Kuiper belt, but not on the hemisphere facing the sun. The speed of the comets is also higher then the speed of the planets since the comets gain speed by falling to the solar system. Therefore, when the comets hit the planets they exert a torque on the planets that spin them in the same direction of the sun rotation. Therefore, most of planets spin in the same direction and this direction correspond to the sun rotation. Another factor in the planets spin is that dust and micrometeorites fall to the planets on their outer hemisphere facing the Kuiper belt. The dust and micrometeorite are carried by the solar wind and have greater speed then the planets. Therefore, when hitting the planets they apply torque that spins the planets in the same direction as the sun rotation. The solar wind as it rotates with the sun prevents the formation of planets with retrograde orbits. Large Kuiper belt object or planet nucleus that is capture by the sun with retrograde orbit will travel against the solar wind. This will form drag that will slow the
82
planet and decrease its speed. The planet will spiral slowly toward the sun and then will hit the sun and vanish. Large Kuiper belt object or planet nucleus that are captured by the sun to have an orbit in the same direction as the sun rotation will not be slowed by the solar wind and will keep orbiting the sun. The sun slow rotation can be explained from the fact that it was a red giant in the past. The sun was a red giant and it ejected strong solar wind. When the outer layers of the sun expanded, the combined moments of inertia of the sun and the outer layers increased. To conserve the angular momentum the angular speed of the sun had to decrease. This is similar to an ice skater that spread his arms during rotation. While his angular momentum is conserved, his rotation speed decrease. Most of the solar wind of the red giant sun was lost to the interstellar space and some of the angular momentum of the sun lost with it. However, some of the solar wind condensed to from comets that formed the planet. This way some of the sun angular momentum, that was lost to the solar wind, transferred to the planets. In reference 3 it was shown that stellar rotation is driven by the changing magnetic fields of the stellar cycle. According to the standard solar model the magnetic fields of the stellar cycle are created by the rotation of the star. However, in reference 3 it was shown that the opposite is correct, the magnetic fields of the stellar cycle drive the stellar rotation. In summary, during the main sequence the rotation speed of the star increase, while in the red giant state the rotation speed of the star decrease. The changing magnetic fields not only determine the rotation speed of the star but also the direction of the rotation axis. The star will try to align itself to the changing magnetic fields so that the energy it collects is maximized. If there is a small angle between the changing magnetic fields and the star rotation, the plasma belts that circle the star will not be perfectly perpendicular to the rotation axis, but will be at some angle (Reference 3). The star rotation axis will try to conform to be perpendicular to the plasma belt and by that will change slightly. This change of the rotation axis explains the 7 degrees angle between the sun equator and the ecliptic plane. The solar planetary system is too complex to be created by one red giant transition of the sun. If there was only one red giant transition that extended over long period, the solar system would have one or two planets. The rest of the mass from one red giant transition that was condensed to form comets, would be lost by chaotic collision between the comets and larger bodies. The comets would fell to the sun or flung outward from the solar system. The concentric orbits of the planets are like the layers or strata in old rocks where the different layers created in different events or epochs. The solar system was built gradually by many red giant transitions. Each red giant transition added material to the planets. The amount of material that each red giant transition supplied was small enough that it did not shatter the delicate structure of the solar planetary system. It is hard to estimate the number of red giants transitions the sun went trough to create the planets. We can use a simple calculation to roughly estimate this number. We can set the mass loss of the red giant sun to be 10^-9 solar mass per year. We also know that the total mass of the planets is 2.7*10^27 kg. The chondrite meteorites were created in a period of about 20 million years so 4.6 billion years ago the sun was a red giant for the same period
83

of 20 million years. The total mass ejected by the red giant sun during this period is the multiplication of the length of time and the mass loss rate. 6 9 30 2820 10 10 1.98 10 3.96 10 kg−⋅ ⋅ ⋅ ⋅ = ⋅ We know that most of this mass loss is lost into the interstellar space or falling back to the sun after condensation, so we can assume that only 0.5% of this mass loss is captured by the planets. In figure 17 it is shown that at earlier times the planets configuration was different and only the inner planets were present. At those earlier times when, for instance, just mercury, venus and earth were present, the planets captured much smaller part of the condensed solar wind. At the present time the massive Jupiter and outer planets attract the comets and asteroids so larger portion of the condensed solar wind can be captured. The earlier configuration of low mass inner planets indicates that only small fraction of the red giant mass loss is captured by the planets. If we divide the mass of the planets by the captured mass loss of the last red giant transition we can get an estimate of the overall number of red giant transitions that formed the solar planets:
27
282.7 10 = 13.6
3.96 10 0.005⋅
⋅ ⋅
So the sun went through about 13 times a red giant transition. In reference 4 it was shown that the sun is roughly 550 billion years old, so it is possible that the sun was a red giant many times more then what is suggested by this calculation. It is also possible that the solar planetary system we find today is not the first planetary system of the sun. The sun could have one or more earlier planetary system, and after it was destroyed by collisions between planets or gravitational tides from nearby stars, a new planetary system was started from scratch. Figure 16 shows the history of the sun. In the beginning the sun was a planet and it grew by converting energy to mass. Along its history the sun went through many red giant transitions; in each red giant transition the sun lost some of its mass by strong solar winds. Some of this mass arrived to the planets so at each red giant transition the total mass of the planets increased slightly. The sun is very old and in reference 4 it was suggested that the sun is about 550 billion years old. It is only possible to speculate on how many red giant transitions the sun went through in such a long time. The last red giant transition was 4.6 billion years ago as is evident from radioactive dating of meteorites. The process that turns the sun to a red giant is chaotic in nature, so the period of 4.6 billion years does not indicate the average time interval between successive red giant transitions. The high metallicity of the sun indicate that it went through a considerable mass loss in the past so it can be speculated that before 4.6 billion years ago the time gap between successive red giant transition was shorter then 4.6 billion years.
84

Figure 16 – In its past the sun was a planet and grew to its current size by conversion of energy from its solar cycle to mass. The sun transformed many times in its past to a red giant. In the red giant state, the sun ejected large amount of mass that formed the planets. The elaborate structure of the solar system is due to gradual growth from many red giant transitions. Each transition contributed a small a mount of mass that made exiting planets grow and formed new planets. The last Sun red giant transition was 4.6 billion years ago. The mass ejected at that time formed the meteorites and chondrules so their radioactive dating gives their age to be 4.6 billion years. The growth of the solar system was gradual. The planets did not form all at the same time. First, the innermost planets Mercury and Venus formed. Then, gradually, more planets joined the solar system. Mercury and Venus are the oldest planets of the solar system while Uranus and Neptune are the youngest. The age of earth could be few tens of billion of years as it is one of oldest planet of the solar system. Uranus high axial tilt of 98 degrees can be linked to the fact that it is a young planet. The time interval between the formation of the innermost planets and the outermost planets could be few tens of billion of years. During this period the sun went through many red giant transitions that each contributed mass to the planets growth. During a red giant transition the sun ejects material that accumulates at the outer regions of the solar system near or beyond the position of the Kuiper belt. This material was condensed and clumped together to form comets of various sizes. The comets were concentrated near the ecliptic plane. There are collisions and gravitational pulls between comets. Those collisions and pulls between comets can reduce their speed below the orbital velocity. For instance, there could be a gravitational attraction between two large comets. One comet will speed up and will climb into higher orbit while the second will slow down to a speed below the orbital velocity. At a speed below the orbital velocity, the comet will not be able to hold its orbit and it will fall inward toward the sun and planets. There is a considerable time between the red giant transition and the time comets start to shower toward the sun and planets. The formation of large comets can take millions of years, so there could be a delay of millions of years between the peak of the red giant transition and the peak in the fall rate of the comets to the solar system. The planets were created one at a time and long time separated the formation of each planet. First a large comet fell toward the sun and was captured at the orbit of Mercury. This created the nucleus or core of the new planet. This nucleus grew from attracting other falling comets by gravitation or by collisions. After Mercury reached a considerable size, it dominated its region so new comets that fell into nearby orbit were swept up by Mercury gravitation. Therefore, new planets could not
85
form very near the orbit of Mercury but only farther out from Mercury. This way, the orbit of Venus could only be formed far enough from Mercury. Again it was created by a new large comet that arrived from the outer regions of the solar system. The new comet formed a new nucleus of the planet that attracted other smaller comets. This way, all the planets grew one by one from the inner planets to the outer planets (Figure 17). The comets are formed near the ecliptic plane, so matter fall to the planets through the ecliptic plane from the outside. Therefore, the outer planets grew faster since they collect the matter that is falling to the ecliptic plane from the outside. The outer planets have slower orbital velocity and this also increases their growth rate. The inner planets are not collecting much mass since most of the comets are collected by the outer planets and comets are unable to cross the orbits of the outer planets. The higher mass of the outer planets will cause higher portion of the comets to be captured by the outer planets. This situation where the outer planets are capturing most of the comets, while the inner planets rarely do, is observed at the present time in the solar system. Jupiter is collecting much of the comets and asteroids that enter the solar system, while the earth and inner planets are not. Tens of billions of years ago when Jupiter was smaller or nonexistent the earth was capturing much of the comets that entered the solar system. In order for a comet to form a planet nucleus, it must obey several conditions. It must have the correct speed that will fit the Orbital velocity of the new orbit. It must enter an orbit near the ecliptic plane. It must have low eccentricity. The orbit must be in the same direction as the sun rotation. A retrograde orbit will not form a new planet; the solar wind will slow it until it will fall to the sun or collide with a planet. It must be heavy enough so that it can grow by sweeping nearby smaller objects and comets. It also needs to find an orbit that is far enough from existing planets. If those conditions are met, the comet will hold its orbit around the sun for a long time and will be able to grow during this time to a planet by capturing other comets and asteroids. The sun turned into a red giant many times to create the solar system. After each red giant transition, a shower of comets fell to the planets and increased their mass. The time intervals between successive red giant transitions are also an essential factor in the formation of the solar system. Between the red giant transitions the orbits of the newly formed planets lost their eccentricity and got circular. Their orbits also flattened out to have a smaller inclination relative to the ecliptic plane of the solar system. The orbits of the planets got circular by tidal interaction with the sun. In an eccentric orbit the planet is approaching and receding from the sun continually. Each time it approach and recede from the sun it lose some energy of its eccentric orbit until its orbit turn circular. Gravitational interaction with other planets will also decrease the eccentricity and will pull the orbit to the ecliptic. This way between the red giant transitions the solar system is organized and stabilized. When the next red giant transition come, the solar system is stable and can withstand gravitational pulls by large comets and it is steady enough to capture and form a new planet. The outer planets grow faster by accreting most of the comets, however, the inner planet are almost not growing at all. The mass accreted to each planet is limited by planets that
86

are found farther in outer orbits. The larger the mass and number of those outer planets, the smaller the accretion rate. This can be described with the following relation:
n
r
r
dM Mdt r M
∝⋅∑
(2)
M - is the planet mass. r, n - is the range of planets in outer orbits. For instance, for Jupiter the outer planets will be Saturn, Uranus and Neptune so r will be 1 and n will be 3. Mr - is the mass of the outer planets. For Jupiter the accretion rate will look like this:
1 2 3
Jupiter Jupiter
Saturn Uranus Neptune
dM Mdt M M M
∝⋅ + ⋅ + ⋅
(3)
The accretion rate of the planet will increase if the planet is more massive and will decrease if there are many massive planets in outer orbits. This relation demonstrates that the growth of inner planet is almost nonexistent, but the growth of the outer planets is rapid since they capture most of the comets that arrive through the ecliptic plane.
87
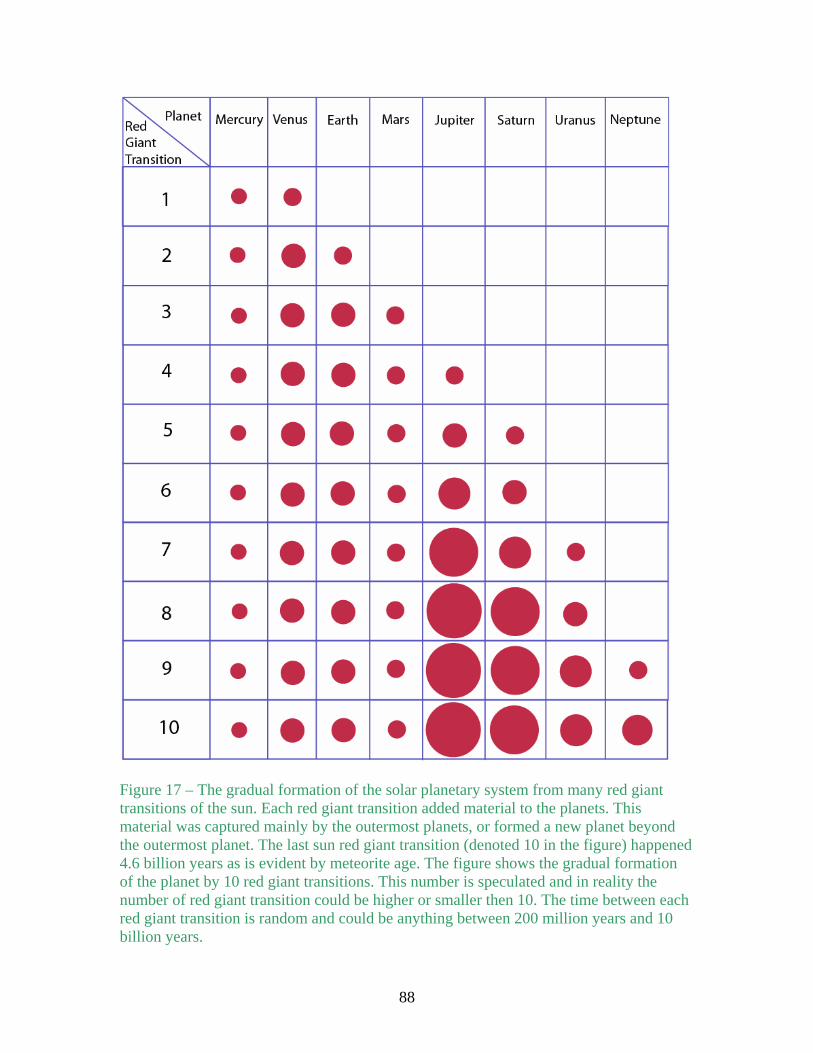
Figure 17 – The gradual formation of the solar planetary system from many red giant transitions of the sun. Each red giant transition added material to the planets. This material was captured mainly by the outermost planets, or formed a new planet beyond the outermost planet. The last sun red giant transition (denoted 10 in the figure) happened 4.6 billion years as is evident by meteorite age. The figure shows the gradual formation of the planet by 10 red giant transitions. This number is speculated and in reality the number of red giant transition could be higher or smaller then 10. The time between each red giant transition is random and could be anything between 200 million years and 10 billion years.
88

There are few red giants in the Orion nebula. The changing magnetic fields in the Orion nebula are very strong, so they can support the high luminosity and strong stellar wind of the many O and B type stars of the Orion Nebula. Since red giants stars are created by drop in the strength of the changing magnetic fields, they are rare in the Orion Nebula. Betelgeuse a massive red giant found in the Orion nebula is an exception. The strong changing magnetic fields in the Orion nebula supply a lot of energy to the stars. This enables the stars to grow rapidly by conversion of energy to mass. There are evidences of free floating planets in the Orion Nebula that indicate that planets are created there but there are no red giants that can produce planets. So in stellar nurseries like the Orion nebula there must be a different process by which planets form. In the Orion Nebula the stars are massive and produce strong stellar wind. Planets cannot be created near an O or B type stars because the stellar wind is too strong and will abrade any object near the star. Therefore, the stellar wind of the O and B star will condense around smaller stars that are found in the region of the O and B stars. The presence of the O and B star create favorable conditions for the formation of stars as was mentioned earlier in the chapter Stars Originate from Planets. Planets in the Orion nebula can also form in the many bow shocks observed in the nebula. There are collisions between the stellar winds of nearby stars that create bow shocks. If there is such a stellar wind collision of a giant star and a smaller star, gas and dust will condense near the smaller star and will create comet like object that can build planets around the smaller star. The stellar systems created in stellar nurseries like the Orion nebula will have typically one gaseous planet that will grow rapidly and will be released from its star when it reaches the size of a brown dwarf. In summary, there are two processes that form planets; one is from the stellar wind of a red giant where the planets form around the red giant itself. The second is from the stellar wind of blue giants, where their stellar winds condense and form planets on nearby smaller stars. Conclusions The planets are born and grow by accreting material like comets and asteroids. When the planets mass is close to the mass of a brown dwarf they are released from the central star by gravitational pull of a nearby star. When the planet reaches the mass of a brown dwarf, it absorbs energy from its stellar cycle magnetic fields. The star grows gradually by converting energy from the stellar cycle magnetic fields to mass. As the star grows it climbs along the main sequence, its luminosity increases and its spectral class evolves to that of more massive stars of shorter wavelength. The matallicity of stars depend on their mass. Stars with higher mass have higher matallicity. The high metallicity of stars with planets suggest that they had higher mass in the past. Stars with planets that show high metallicity went through a significant mass
89

loss. Those stars lost part of their mass when they turned into a red giant and ejected massive stellar wind to the interstellar space. This decreased the mass of the stars but did not change the matallicity of the star. The sun has high metallicity compared to similar stars of the same size. This suggests that the sun was a red giant and went through a significant mass loss. There are many evidences that the sun was a red giant, especially the present of short lived radioactive isotopes and the condensation of chondrules in meteorites. The solar system planets formed by the stellar wind of the red giant sun. The strong stellar wind condensed and formed comets in the Kuiper belt. Those comets fell back to the inner solar system and formed new planets or increased the mass of existing planets. The sun went through many transitions to a red giant. Each transition added more matter to the planets and gradually increased the number and the mass of the planets. The idea that the sun was a red giant can only be derived from the hypothesis that the sun energy is from the solar cycle magnetic fields. There is hard evidence found in support of the red giant sun, especially the short lived radioactive isotopes located in meteorites. The fact that there is hard evidence in support of the red giant sun disprove the standard solar model and the solar nebula hypothesis and verify that the sun energy is from magnetic fields. Carl Sagan once said "We are made of star stuff". Now we can be more specific and say that this stuff or dust came from the sun. We are made of sun stuff - the atoms in our body were synthesized in the sun core. The energy to create this stuff in the sun core came from much farther from the supermassive black hole at the center of the Milky Way Galaxy. References
1. Bar-Zohar, D. (2006). The sun energy source is not nuclear fusion, but magnetic fields from the center of the Galaxy. The sun converts energy to mass and not mass to energy. PHILICA.COM Article number 65. http://www.philica.com/display_article.php?article_id=65
2. Bar-Zohar, D. (2008). The sun produces muon neutrinos flux without neutrino oscillations. PHILICA.COM Article number 126. http://www.philica.com/display_article.php?article_id=126
3. Bar-Zohar, D. (2009). Stellar rotation is driven by magnetic fields in the galactic disc. PHILICA.COM Article number 149. http://www.philica.com/display_article.php?article_id=149
4. Bar-Zohar, D. (2010). The sun can absorb large amount of energy from weak magnetic fields due to its low resistivity. PHILICA.COM Article number 208. http://www.philica.com/display_article.php?article_id=208
90

5. HEAO 3 Discovery of 26Al in the interstellar Medium, W. A. Mahoney, J. C. Ling, Wm. A. Wheaton, A. S. Jacobson. The Astrophysical Journal, 286:578-585, 1984 November 15.
6. Exploring the Gamma-Ray Universe, 2001,ISBN 92-9092-677-5 Aluminum 26 Production by AGB Stars, Nami Mowlavi, Bibliographic Code 2001ESASP.459..51M.
7. Encyclopedia of the Solar System 2nd edition L. McFadden et al., AP, 2007. 8. The Origin and Evolution of the Solar System M. M. Woolfson, Institute of
Physics Publishing 2000. 9. Treatise on Geochemistry, H. Holland, K. Turekian, Elsevier 2003 Volume 1 10. Treatise on Geophysics, Gerald Schubert, Elsevier 2007 Volumes 9,10 11. Chondrules and their origin, edited by Albert A. King, The lunar and planetary
institute. Condensation of Chondrules, Milton Blander. 12. Science 19 September 2008: Vol. 321. no. 5896, pp. 1664-1667, DOI:
10.1126/science, 1160995, Condrulelike Objects in short-Period Comet 81P/Wild 2, Tomoki Nakamura et. al.
13. C. B. de Loore, Late stages of stellar evolution Computational methods in astrophysical hydrodynamics, Springer 1991. Circumstellar Envelopes of late type stars, Alain Omont.
14. Lucy M. Ziurys, The chemistry in circumstellar envelop of evolved stars: Following the origin of the elements to the origin of life. PNAS August 15, 2006 vol. 103 no. 33 12274-12279.
15. Debra A. Fischer, Jeff Valenti, The Planet-Metallicity Correlation, The Astrophysical Journal, 622:1102-1117, 2005.
16. Chemical abundances and mixing in stars in the Milky Way and its satellites, Springer 2006, ISBN: 978-3-540-34136-9, Chapter: Lithium rich Red Giant Branch stars, R. de la Reza.
17. Abundance of heavy elements in the atmosphere of Aldebaran, V. F. Gopka and N. S. Komarov, Astron. Zh. 67, 1211-1218 (November-December 1990)
18. Growth and form of planetary seedlings: Results from a microgravity aggregation experiment. J. Blum et al (2000), Physical Review Letters Volume 85, Number 12.
Friday, November 5, 2010
91

The sun produces muon neutrinos flux without neutrino oscillations Abstract The sun energy source is from magnetic fields in the galactic disk distributed by the supermassive black hole(reference 1). This article we will discuss the effect of the sun new energy source on the neutrino particle experiments and research. The sun new energy source revokes the solar neutrino problem and its immediate solution by neutrino oscillations. A historical review of the solar neutrino experiments will clarify that the solar neutrino flux describes a solar activity entirely different from that predicted by the standard solar model. The solar neutrino experiments are more useful as an internal probe of the sun activity then to verifying the standard solar model. The new sun energy source is an astrophysical explanation to the solar neutrino problem that invalidates the neutrino oscillation solution. Without neutrino oscillations, the SNO detector results show that the sun produce a muon neutrinos flux, created by heavy particle interactions of the second family of the standard particle model. Abbreviations SSM – The Standard Solar Model where the sun energy source is fusion. When the SSM is mentioned it is usually related to common knowledge. MST – Magnetic Sun Theory – According to this new theory (reference 1) the sun energy source is from magnetic fields distributed by the suppermassive black hole at the center of the galaxy. Those magnetic fields propagate chaotically through the galactic disk and reach the sun. Locally the solar cycle reverses its magnetic field polarity every 11 years to heat the sun. The MST is usually mentioned with new and original topics. SK – The Super-Kamiokande neutrino observatory in Japn. SNO – The Sudbury Neutrino Observatory in Canada. Short history The neutrino was presented by Wolfgang Pauli in 1930 to set the beta decay process in agreement with the laws of energy and momentum conservations. In June 1956 the neutrino particle was detected by the first time by Frederick Reines and Clyde Cowan, when observing the fission beta decay from the Savannah River nuclear reactor. The muon
92

neutrino was detected at Brookhaven National Laboratory in 1962 and soon after two families of quark and leptons integrated in the particle model. The third charged lepton the Tau was detected in 1975 at the Stanford Linear accelerator, followed by the discovery of the third family, to set the three families of the standard particle model. The Tau neutrino of the third family was discovered in 2000 at Fermi-lab. The beta decay Fermi suggested in his classical paper on beta decay to measure the neutrino mass using beta decay. The electron energy is measured at the end point part of the electron energy spectrum. The experiment is done with tritium decay where a neutron in the tritium nucleus is decayed by the process:
3 3H He + + ee υ−→ The outcome is a proton plus electron and anti-neutrino as shown in Figure 1.
Figure 1 – In the tritium beta decay one neutron of the tritium nucleus is decayed into a proton plus electron and anti-neutrino. Precise measurement of the end point part of the beta spectrum enables to determine the neutrino mass. This experiment shows no indication of massive neutrinos. The spectrum of the electron energy is shown in figure 2a; the end point is enlarged in 2b. If the neutrino has zero mass, then the kinetic energy of the electron at the end point must equal the energy released by the beta decay. If the kinetic energy of the electron is a little smaller then the beta decay energy, the neutrino must have mass. This experiment was conducted many times with increasing accuracy. However, no indication of massive neutrino was found. Based on this experiment, neutrinos where considered as a massless particle for decades, and placed with zero mass in the standard model.
93

Figure 2 – The entire spectrum of the electron kinetic energy in the tritium beta decay is shown in 2a. The end point is shown enlarged in 2b. For neutrino to have mass the kinetic energy of the electron should be slightly smaller then the energy released by the beta decay as shown by the red line. Actual result from measuring the electron kinetic energy shows no indication of massive neutrinos. (Image by the Katrin collaboration) The latest and most advanced experiment in the tritium beta decay is the Katrin experiment (Figure 3). It is the most accurate – in using complex spectrometer it can find masses of electron neutrinos with sensitivity of 0.2 eV. The process starts when gaseous tritium is pumped to a tube in the left side. At the transport section the tritium is removed and the electrons from the beta decay are guided to the spectrometer. At the pre-spectrometer a static electric field is applied to remove most of the electrons with the smaller energies. At the main spectrometer two superconducting magnet are used to produce a broad beam of electrons that get filtered by a static electric field. Only the electrons with the highest energy reach the detector at the right side. This experiment, similar to the older beta decay experiments, will find that the electron neutrino mass is zero and refute the neutrino oscillation theory.
Figure 3 - The latest and most advanced experiment in the tritium beta decay is the Katrin experiment. It is the most accurate – in using complex spectrometer it can find masses of electron neutrinos with sensitivity of 0.2 eV. This experiment, similar to the older beta decay experiments, will find that the electron neutrino mass is zero and refute the neutrino oscillation theory.(Image by the Katrin collaboration)
94

The first solar neutrino experiment at Homestake In 1967 Dr. Raymond Davis started the Homestake experiment to check the neutrino flux from the sun and to verify the Standard Solar Model (SSM). According to the SSM, Hydrogen is fused to Helium in the p-p chain while converting the mass difference between the helium nucleus and the hydrogen nucleus to energy. The fusion rate of the hydrogen according to the SSM was needed to create the sun heat and to generate the energy lost by the sun luminosity. Dr. John N. Bahcall used the SSM to predict the fusion rate and the electron neutrino flux according to the energy emitted by the sun luminosity. The Homestake experiment goal was to confirm the predicted neutrino flux and to substantiate the SSM with firm evidence. The experiment was built 1500 meters below ground in the abandoned Homestake gold mine to shield the experiment from cosmic rays interference (Figure 4). They filled a tank with 615 tons of dry-cleaning fluid perchloroethylene (C2Cl4) . The Chlorine 37, when interacted with solar electron neutrino, becomes Aragon 37.
37 37 + Cl + Are eυ −→ Aragon 37 is radioactive with a half-life of 35 days and its quantity can be measured precisely to reflect the number of neutrino interactions. The P-P Chain, by which the hydrogen is fused into helium in the sun according to the SSM, is divided into three reactions identified by their specific neutrino energies. The first is the P-P beta decay with energy below 0.42 MeV that produces 90% of the neutrino flux. The second is electron capture on Beryllium 7 with energy below 0.86 MeV that produce about 10% of the neutrino flux. The third is the beta decay of Baron 8 with the relative high energy below 15 MeV and flux of 0.01% of the total flux. The Homestake experiment could detect neutrinos from the Beryllium 7 and the Baron 8 interactions but not from the P-P beta decay. The results of the Homestake experiment did not confirm the expected neutrino flux according to the SSM, despite running for 30 years with many modifications. It found only third of the expected neutrino flux and created the solar neutrino problem.
95

Figure 4 – The Homestake solar neutrino experiment is a tank filled with 615 tons of dry-cleaning fluid. It measured for a bout 30 years the neutrino flux from the sun to be third of the expected neutrino flux according to the Standard Solar Model. This result is not evidence for neutrino oscillations but of a new solar model. In 1991 the Gallex experiment was built in Italy based on the interactions of neutrino with Gallium according to :
71 71 + Ga + Gee eυ −→ A tank of 30.3 tons of gallium–chloride solution was installed inside the Gran Sasso mountain to be shielded from the cosmic ray interference. A similar experiment Sage in Russia used a target of 57 tons of metallic Gallium. The Gallium experiments could detect neutrinos from the Beryllium 7, the Baron 8 and the P-P beta decay reactions of the SSM. Both the Gallex and the Sage experiments found flux that was about half of the flux expected by the SSM and confirmed the solar neutrino problem. The Super-Kamiokande experiment In 1996 the Super-Kamiokande neutrino observatory (Figure 5) started operation in Mozumi Mine in Hida city in Japan. It is located 1000 Meter underground and contain 50,000 tons of ultra purified water. The detector is using 11,146 photomultiplier tubes (Figure 6) to find Cherenkov radiation from collisions inside the tank. The Cherenkov light is emitted when a recoiled electron is passing inside the water filled detector in a speed higher then the speed of light in water. The particle creates in the water a
96

shockwave similar to the one created by supersonic airplane in the air. The particle speed is still smaller then the speed of light in vacuum as required by special relativity. The photomultiplier tubes are shown in Figure 6 they consist of a spherical glass tube, 50 cm in diameter, that the air inside them is removed. When a single photon from the Cherenkov radiation hit the Photo-Cathode inside the tube, an electron is emitted from the cathode. The electron is accelerated and hit layers of dynodes to emit additional electrons and eject a small current pulse. For the atmospheric neutrino, SK can detect both high energy electron neutrinos and muon neutrinos and can reveal the direction from which they hit the detector. For the solar neutrinos, SK found, by the electron scattering interactions, that the Boron 8 neutrino flux is a bout half as that expected by the SSM. Therefore, like to the previous neutrino experiments, SK confirmed the solar neutrino problem. However, SK was also designed to measure the neutrino flux from cosmic rays hitting the air molecules of the upper atmosphere. Usually a high speed proton is hitting an air molecule at the upper atmosphere to produce a pion (Figure 7) the pion is then decaying to an electron by producing two muon neutrinos and one electron neutrino. This set the ratio between the flux of the muon neutrinos and the electron neutrinos to be 2. After measuring the neutrino flux for 4 years SK presented two results that suggested neutrino oscillations. First, the ratio between the muon neutrino and the electron neutrino was about 1.3 suggesting that some of the muon neutrino where missing. Second, the upward flux of muon neutrino was smaller then the downward flux suggesting that the upward neutrino due to the longer pass oscillated to other flavor. However, the interpretation of those results with neutrino oscillation is incorrect. The solar neutrino problem is solved with the MST so the atmospheric results stand alone to support neutrino oscillations. The SK results stem from partial understanding of cosmic rays, or from some error in the experiment, or due to contamination that affect the data.
97

Figure 5 - The SK detector is using 50,000 tons of ultra-purified water with 11,146 photomultiplier tubes. Using Cherenkov radiation both electron neutrino and muon neutrino can be detected. The detector found anomaly in the neutrino emitted by the cosmic rays. The cosmic rays, by the decay of the pion should emit two muon neutrinos for each electron neutrino. The detector found 1.3 muon neutrinos for each electron neutrino. Also, the upward flux of the muon neutrino was much lower then the downward flux. This result opposes the MST and cannot be attributed to neutrino oscillation. The CERN to Gran Sasso experiment will prove that the muon neutrino to tau neutrino oscillation is impossible.
98

Figure 6 - The photomultiplier tubes inside the SK are glass spheres of about 50 cm in diameter with the air removed. They turn a photon from the Cherenkov radiation into small current pulse that can be detected and analyzed.
Figure 7 – Cosmic rays in the form of protons and Helium nucleus are hitting the upper atmosphere to produce pions. The pions decay first to a muon by producing a muon neutrino. The muon is then decaying to electron producing muon neutrino and an electron neutrino. This process sets the expected ratio of the flux of the muon neutrino to electron neutrino to be 2.
99

Not all atmospheric neutrino experiments suggest a deficit in the muon neutrino (Figure 8). There are two experiments Frejus and Nusex that found the ratio of the measured and expected ratios of the muon and electron neutrino to be 1 and not 0.6 as in the SK experiment. However, those experiments were smaller in size and older then the SK experiments.
Figure 8 – The ratio of the measured and expected ratios of the muon and electron neutrino of the atmospheric neutrino experiments. Frejus and Nusex experiments found the ratio equal to 1 and not 0.6 as in the SK experiment. However, those experiments were smaller in size and older then the SK experiments. (Adopted from a lecture by Ed Kearns at Fermi labs) The deficit in the muon neutrino in SK and other atmospheric experiments is explained by the conversion of the muon neutrino into tau neutrino by the neutrino oscillation theory. To test this hypothesis a long base experiment is constructed - the CERN neutrino beam to Gran Sasso (Figure 9). At one end of the experiment the proton accelerator at cern will produce a beam of muon neutrinos. The neutrino beam will pass underground 732 km to the other end of the experiment at Gran Sasso, where a tua neutrino detector will try to detect appearance of tau neutrinos from oscillations of muon neutrinos. According to the MST no tau neutrino will appear at Gran Sasso. This will prove that neutrino oscillation are impossible and the SK claim that muon neutrino are transformed to tau neutrino are incorrect. Both the atmospheric neutrino problem and the solar neutrino problem cannot be solved by neutrino oscillation. The solar neutrino problem can be solved by presenting new solar model where the sun energy is not from fusion but from magnetic fields originated at the supper massive black hole in the center of the Galaxy.
100

Figure 9 – CERN project for a neutrino beam to Gran Sasso. CERN proton accelerator will produce a muon neutrino beam that will pass 732 km underground to a detector at Gran Sasso. The detector at Gran Sasso will try to detect appearance of tau neutrinos. The tau neutrinos will appear only if muon neutrinos transformed by neutrino oscillation. The experiment is conducted to find if the muon to tau neutrino oscillation claimed by the SK is correct. This experiment will show according to the MST that no tau neutrino appears at Gran Sasso and neutrino oscillation are not possible. Therefore, the SK results cannot be explained by neutrino oscillations.(Image by the CNGS collaboration) The long base experiments are constructed from an accelerator that produces a beam of neutrino at one end, and a neutrino detector at the other end. The neutrino beam pass underground along a path of few hundred kilometers. The long base experiments are divided into two categories - appearance and disappearance. Disappearance experiments identify neutrino oscillations when part of the original neutrinos is missing at the detector due to flavor change. This is considered as a weak prove of neutrino oscillations. Appearance experiments identify oscillation by finding other flavor of neutrino in the beam. The CNGS experiment, for instance, try to find tau neutrinos in the muon neutrino beam. There is no appearance experiment that gave positive result because neutrino oscillations are not possible. The LSND was an appearance experiment that claims the appearance of electron neutrinos from muon neutrinos beam. A later experiment MiniBooNE tried to verify this result, but it refuted the LSND findings. It gave negative result and no electron neutrino where found. The neutrino speed could also determine if neutrino has mass. If the neutrino has zero mass it must always travel at the speed of light. Firm evidence, that neutrino travel at the speed of light, is revealed in the explosion of supernova. SN1987A. SN1987A is 168,000 light years away so even a small speed below the speed of light of the neutrinos should produce a long delay in the arrival time relative to the photons. A neutrino burst from the supernova was detected a bout 3 hours before the photon from the supernova were visible. Though the neutrinos escape the supernova before the photons,
101

the close arrival times suggest the neutrino travel at the speed of light or very close to the speed of light. Also the neutrino arrived all at once in a 15 second period. If neutrino have mass they would have different speeds and their arrival time would spread along wider interval. The SNO experiment and the solar muon neutrino flux The Sudbury Neutrino Observatory (SNO) operated between 1999 and 2006. It is located underground in a mine in Sundbary, Ontario, Canda at about 2 km below ground (Figure 10). Unlike SK that hold light water the SNO detector holds heavy water and detects interactions with deuterons. The deuterium has larger cross section for neutrino so only a much smaller amount of deuterium is needed compared to water. SNO uses 1000 tons of heavy water, contained in a 6 meter radius acrylic vessel and encircled with 9600 photomultiplier tubes. The neutrinos are detected by the Cherenkov radiation emitted by the relativistic electrons recoiled from the collisions. There are three reactions detectable in SNO. Each of the reactions has different sensitivity to the neutrino types. In the Charged Current interactions the neutrino converts a neutron in the deuteron to a proton and an electron.
+ + + e d e pυ −→ p
p
This reaction can detect only electron neutrinos. In the Neutral Current Interactions the neutrino break the Deuteron into its components neutron and proton.
+ + + d nυ υ→ The three types of neutrino are equally participating in this interaction to give the total number of neutrinos. In the Electron Scattering interaction the neutrino hits electrons that recoil at high speed.
+ + e eυ υ→ This interaction is more sensitive to electron neutrinos then to muon and tau neutrinos. Figure 11 shows the direction of the solar neutrinos events relative to the sun. The number of elastic scattering events and their direction relative to the sun indicate the production of muon and tau neutrinos by the sun. The neutrino flux of the three interactions is shown in Figure 12. The Natural Current interactions give the total flux from the three types of neutrinos. This flux is very near the flux of the electron neutrinos predicted by the SSM. The Natural Current flux is 6.42 x 106 cm-2s-1 while the SSM prediction is 5.05 x 106 cm-2s-1. This gives a difference of 27% between the two, so the agreement is only achieved by using the large uncertainties. In
102

the light of the MST this agreement is only a coincidence since the sun energy is not from fusion and the SSM is not correct. The electron neutrinos flux was found to be 1.76 x 106 cm-2s-1 and the muon and tau neutrinos flux was found to be 3.41 x 106 cm-2s-1 . The ratio of the number of the electron neutrinos to the sum of the three types of neutrinos is about 1/3. Therefore, this ratio and the agreement of the total flux with the SSM are considered incorrectly as a strong case in favour of neutrino oscillation. The electron neutrino from the sun seemed to oscillate into muon and tau neutrino, so even though the sun produces only electron neutrinos, they transform into muon and tau neutrino during their pass from the sun to the earth.
Figure 10 – The Sudbury Neutrino Observatory contain 1000 tons of heavy water in an acrylic vessel encircled with 9600 photomultiplier tubes. The neutrinos are detected by the Cherenkov radiation of high speed electron emitted by the reactions with the neutrinos. The detector could distinguish between the
103

electron neutrinos and the muon and tau neutrinos and could determine their ratio. The SNO detector found that the sun emits strong flux of moun and tau neutrino and the number of them is about two thirds of the number of the electron neutrinos. The total number of the neutrinos was found to be near the prediction by the SSM. The SNO experiment is considered therefore the ultimate proof for neutrino oscillations. However, according to the MST, the sun energy is not from fusion and the moun flux is not from oscillating electron neutrino, but from internal nuclear interactions. The muon neutrino flux indicates the complex nuclear reactions and the diversity of particles inside the sun. The agreement between the total number of neutrinos from the sun and the SSM is only a coincidence.
Figure 11 – Distributions of selected events according to the cosine between the Cherenkov radiation direction and the sun direction. The elastic scattering and the charged currents interactions has the maximum events pointing toward the sun. This indicates the production of muon and tau neutrinos by the sun. (Image by the SNO Collaboration)
104

Figure 12 – The flux of muon and tau neutrinos versus the flux of the electron neutrinos of the three reactions detectable by SNO. Each of the reactions has different sensitivity to the neutrino types. In the Charged Current interactions the neutrino converts a neutron to a proton and an electron. This reaction can detect only electron neutrinos. In the Neutral Current Interactions the neutrino break the Deuteron into its components neutron and proton. The three types of neutrino are equally participating in this interaction to give the total number of neutrinos. The total number of neutrinos agrees with the electron neutrino flux according to the SSM, but it is only a coincidence, since neutrino oscillations are not possible. In the Electron Scattering interaction the neutrino hits electrons that recoil at high speed. This interaction is dominated by electron neutrino but include muon and tau neutrinos. (Image by the SNO Collaboration) The particle interactions inside the sun The flux of electron neutrinos from the various neutrino experiments finds that for specific energies or spectrum of the neutrinos, there is a different ratio between the measured number of neutrinos to the SSM predictions. This cannot be settled by the SSM and imply an entirely different solar model then the SSM. A further argument against neutrino oscillation is the conservation of the lepton numbers the electron number and muon number. The violation of the lepton number was never observed in accelerators. Giving a neutrino mass means violations of the lepton number, for instance, an electron can be converted to electron neutrino this electron neutrino can oscillate into muon neutrino and this muon neutrino can produce a muon. The oscillation theory was developed to explain the deficit in electron neutrinos. According to the SSM the sun must emit certain amount of neutrinos to explain the heat and luminosity of the sun. A deficit in the electron neutrino means, according to the SSM, that the fusion reaction is much lower then expected, hence, the sun cannot be hot and
105
luminous as observed. To save the SSM and get an agreement between the SSM predictions and the actual measurement, the neutrino oscillations were proposed. However, the sun energy is not from fusion and the SSM is not correct. The sun energy source is from magnetic fields in the galactic disk that propagate by the dynamo effect of the falling material in the accretion disk of the suppermassive black hole at the center of the galaxy. If the sun energy is not fusion then there is no need to a threshold amount of electron neutrino to explain the sun heat and luminosity, thus the flux of electron neutrino can be as directly measured by the neutrino experiments like Homestake, Gallex, Sage, SK and SNO. The smaller flux of electron neutrino relative to the SSM suggest that the fusion reaction in the MST is a much limited process that is only partially and indirectly producing the sun heat and luminosity. The fusion rate in the MST is required only to explain the helium abundance in the sun. If there is no mandatory flux of electron neutrinos and the oscillations theory is not required to explain the deficit, then it is obvious that the nuon and tau neutrinos measured by SNO and SK are produced internally in the sun out of particles interactions. This means that the conversion of the magnetic fields energy to mass in the sun encompass interactions that produces both electron and muon neutrino. The production of muon neutrinos in the sun indicates strong activity of particles from the second family of the standard model of particles. This requires very complicated and diverse particles interactions inside the sun that encompass hundreds of distinct interactions involving a broad range of participating particles. The overall neutrino flux should explain the baryogenesis in the sun of hydrogen and the nucleosynthesis of heavier elements and isotopes like helium, deuterium, lithium and carbon. The production of deuterium in the sun is clear from the fact that the solar wind contains He3. Since SNO cannot distinguish between muon and tau neutrino, it is unclear how many tau neutrinos are produced. However, the particles required to produce the tau neutrino are both extremely heavy and unstable so the tau neutrino flux should be much lower then the muon neutrino flux. According to the MST the sun evolution is entirely different. The sun is believed incorrectly to be born out of a large cloud of gas and dust that gravitationally collapsed. The gas and dust was heated up by the collapse to ignite fusion inside the new star. According to this model much of the matter of the star is supplied from outside by the cloud. The cloud therefore predetermines the Elemental abundance of atoms in the new star. According to the MST the evolution of the star is much different. The star starts as a red dwarf or even a smaller object of several Jupiter masses. This red dwarf is heated up by magnetic fields in the galactic disk (mainly in nebulae or in the galactic arms). The magnetic fields heat the star and its particles kinetic energy increase. The particles participate in high speed collisions to create new particles and increase the star mass. By this process the star mass and heat are increasing and the red dwarf is turned into a main sequence star. In this process the star baryogenesis and nucleosynthesis is determined mainly by internal interactions and particles high speed collision. The star elemental abundance is therefore determined internally with small outside contribution of matter from the initial red dwarf and meteorites and asteroids that fall to the star. The hydrogen in the star is created internally in the star from high speed collisions and does not arrive
106

from the outside. The neutrino flux from the star must reflect the baryogenesis of large quantities of hydrogen and the nucleosynthesis of smaller quantities of helium and other heavier elements. The particle interactions in the sun are much more complex in the MST then the SSM and encompass hundreds of distinct interactions. To reveal the dominating particle interactions and the internal working of the sun, we can use a new model according to the following guidelines.
1. The sun energy source is the changing magnetic fields of the solar cycle. 2. There is loose connection between the neutrino flux and the sun luminosity
because the sun energy is not from fusion. 3. The energy from the solar cycle changing magnetic fields creates new matter
inside the sun. 4. The creation of new matter the baryogenesis and the nucleosynthesis create the
neutrino flux. 5. The elemental abundance in the sun is mainly from the internal baryogenesis and
nucleosynthesis. 6. The flux of neutrinos from the sun can be measured in the neutrino detectors to
match the theoretical neutrino flux from the internal baryogenesis and nucleosynthesis. On the other hand the baryogenesis and nucleosynthesis can be developed and researched based on the neutrino flux from the detectors measurements.
7. The sun has internal particle reactions that eliminate the antimatter in the sun in favor of ordinary matter. This requires the breaking of the charge and parity symmetries or the CP-Violation.
8. The production of muon neutrinos in the sun indicates strong activity of particles from the second family of the standard model of particles.
9. The energy absorbed by the sun from the magnetic fields must be efficiently converted to new matter inside the sun. Wasteful interactions that waste energy by emitting high energy neutrinos are less likely then interactions that produce low energy neutrinos.
A starting point in finding the sun particles interactions is to collect all the possible interactions according to the first and second families of the standard model. Then to apply a filter that determines the probability of each interaction. Each specific interaction can be filtered by the following questions: Does it explain the elemental abundance of the sun? Does it fit the neutrino flux as measured by the neutrino detectors? Does it avoid high energy neutrinos? Specific interactions should be assembled into chains that accomplish specific task. For instance, the following chains can be used: creation of Hydrogen chain, creation of Deuterium chain, creation of Helium chain, eliminating antimatter chain, fusing heavy elements chain, electron neutrinos chain and muon neutrino chain.
107

The creation of new matter inside stars according to the MST requires the CP-violation. CP violation is observed particularly for the kaon particle. Hence, interactions involving the kaon particles are required in order to for the sun to remove the antimatter in favor of ordinary matter. The koan is a meson that contains pair of quark and anti-quark. The negatively charged kaon contains strange quark and up anti-quark. Interactions of kaon inside the sun confirm that there are interactions of particles of the second family of the standard model. They also prove that the sun produces muon neutrinos since many kaon interactions involve muon neutrinos. The presence of mesons also indicates existence of antimatter inside the sun. The sun energy source is the changing magnetic field from the solar cycle so a small change in the neutrino flux should be observed between solar maximum and solar minimum with a period of 11 years. The Homestake experiments is the only one that run long enough to reveal this periodicity but it does not show any definite correlation of the neutrino flux with the solar cycle. The reason is that the energy supplied to the sun by one solar cycle is very small compared to the overall heat capacity of the sun. Hence, one solar cycle can increase the temperature of the sun only slightly, with no effect on the neutrino flux. Conclusion The SNO results interpreted literally without neutrino oscillation show that the sun produces large flux of muon neutrinos. The sun has strong activity of particles from the second family of the standard particle model. The solar neutrino problem is incorrectly solved with neutrino oscillations. Neutrino oscillations are impossible and the solution to the neutrino problem is a new solar model based on the sun new energy source from magnetic fields. The SK results without neutrino oscillations reopen the atmospheric neutrino problem. Upcoming neutrino experiments will show that neutrinos cannot oscillate, for instance, the Katrin experiment will find zero mass for the neutrino and the CERN neutrino to Gran Sasso will not find any tau neutrino in the muon neutrino beam. References
1. Bar-Zohar, D. (2006). The sun energy source is not nuclear fusion, but magnetic fields from the center of the Galaxy. The sun converts energy to mass and not mass to energy.. PHILICA.COM Article number 65. http://www.philica.com/display_article.php?article_id=65
2. SNO Collaboration 2002. Direct Evidence for Neutrino Flavor Transformation from Neutral-Current Interactions in the Sudbury Neutrino Observatory. arXiv:nucl-ex/0204008v2
3. M. B. Smy and the Super Kamiokande collaboration 2001. Solar Neutrino Results from Super-Kamiokande. arXiv:hep-ex/0106064v2
108

4. The MiniBooNE Collaboration 2007. A Search for Electron Neutrino Appearance at the Delta m**2 ~ 1 eV**2 Scale arXiv:0704.1500v3 [hep-ex]
5. G. Giacomelli 2007. The CNGS Neutrino Beam arXiv:physics/0703247v1 [physics.ins-det]
6. R.G. Hamish Robertson 2007. KATRIN: an experiment to determine the neutrino mass. arXiv:0712.3893v1 [nucl-ex]
7. D.O. Caldwell and P.A. Sturrock 2005. Evidence for Solar Neutrino Flux Variability and its Implications. arXiv:hep-ph/0309191v6
Thursday, April 10, 2008
109

The sun can absorb large amount of energy from weak magnetic fields due to its low resistivity Abstract In reference 1 it was shown that the sun energy source is from magnetic eddies that propagate in the galactic disk from the super massive black hole at the galactic center. The solar cycle and stellar cycles of all the stars are driven by those magnetic eddies in the galaxy. There are two difficulties that this theory has to overcome. One is that the neutrino flux from the sun fits the fusion standard solar model, and the second is that the magnetic fields in the galactic disk are too weak to cause any considerable heat in the sun. The first difficulty was the subject of Reference 2, suggesting that the muon neutrinos from the sun are not due to neutrino oscillations, but are created by nuclear reactions in the sun that produce mass and new particles. This article will be centered on the second difficulty and will show that the changing magnetic field of the solar cycle is strong enough to produce not only the sun luminosity but also a substantial amount of mass. The measurement of the magnetic field of the sun, taken by probe Ulysses, will be used to calculate the energy absorbed by the sun and the mass the sun creates. The energy calculation suggests that stars are slowly growing by converting the energy from the magnetic fields to mass. The mass growth rate is used to estimate the age of the sun. The sun can absorb large amount of energy from weak magnetic fields due to its low resistivity. The solar cycle is the method by which the galactic center transfers energy to the sun by magnetic fields. The solar cycle across 22 years change the magnetic field polarity through the sun. From Ulysses probe data, shown graphically in Figure 1, the magnetic field at the peak of the solar cycle in year 2001 is about 4nT. This magnetic field is measured at a height of 1.4 AU from the sun surface. The distance 1.4AU in Meters is
11 11
1.4 1.49 10 2.1 10 MUlyssesR = ⋅ ⋅ = ⋅
From Biot-Savart Law the magnetic field strength is inversely proportional to the distance squared so we can use it to find the strength of the magnetic field at the sun surface.
2
2
Ulysses Sun
Sun Ulysses
R BR B
=
110

Rsun - The sun radius 6.96*10^8 M. Bsun - The magnetic field at the sun surface. Rulysses - The distance of the Ulysses probe from the sun when measuring the magnetic field. Bulysse - The Magnetic fields measured by the Ulysses probe, 4nT from Figure 1. So the magnetic field at the sun surface is:
2
2
11 2 94
8 2
(2.1 10 ) 4 10 3.64 10 T(6.96 10 )
Ulysses UlyssesSun
Sun
R BBR
−−⋅ ⋅ ⋅ ⋅
= = =⋅
⋅
The magnetic field near an iron magnet is about 100 mT, three hundred times than the above calculated value of the sun surface magnetic field. In sunspots the magnetic fields can reach 1 T. So the above calculated value is reasonable.
Figure 1: The magnetic field measured by the Ulysses probe near the sun. During 2001, when the sun was at solar maximum and the probe was relatively close to the sun, the magnetic field measured was extremely high.(Image by the Ulysses team)
111

Figure 2: Century of solar cycles. During 2001 the number of sunspots indicates that the sun was at a solar maximum. The sun was at solar maximum during the year 2001, as shown in Figure 2. In 11 years the sun magnetic field will transform from the maximum in one polarity to the maximum in the reverse polarity. The maximum in one polarity is the calculated value above, therefore to get the change of the magnetic field during 11 years we need to multiple this value by two. To get the change of the magnetic field in one year we need to further divide by 11. From yearly value we can get the change of the magnetic field per second.
412 -12 3.64 10 2 2.09 10 T S
11 31536000 11 31536000Sun
SunBB
−−⋅ ⋅ ⋅
∆ = = = ⋅ ⋅⋅ ⋅
The magnetic field crosses the sun interior so we can use Faraday's Law to calculate the Electromotive Force (EMF). To get the magnetic flux that cross the sun we can multiply the magnetic field calculated above with the area of the sun. First we get the area of the sun.
2 8 2 18 2(6.96 10 ) 1.52 10 MSun SunA R π π= ⋅ = ⋅ ⋅ = ⋅
The electromotive force from Faraday's Law is:
12
18 62.09 10 1.52 10 3.17 10 V1
SunSun
BE At tφ −
=∆ ∆ ⋅
= = ⋅ ⋅ ⋅ = ⋅∆ ∆
The electromotive force is applied on the circumference of the sun. If we know the resistance of the sun we can calculate the energy or power dissipated by the electric currents inside the sun. To find the resistance we can imagine a donut shaped ring inside the sun enclosed by the sun circumference. This ring will have a circular cross section
112

with radius that is, for instance, 0.3 of the sun radius. We can find the resistance of the donut shaped ring from its cross section area and from its circumference. The circumference of the ring is a circumference of a circle that its radius is 0.7 that of the sun radius.
8 92 2 (0.7 ) 2 0.7 6.96 10 3.06 10 MSunl R Rπ π π= = ⋅ ⋅ = ⋅ ⋅ ⋅ = ⋅
The cross section area of the donut shaped ring.
2 2 8 2(0.3 ) (0.3 6.96 10 ) 1.36 10 MRing SunA R Rπ π π= = ⋅ ⋅ = ⋅ ⋅ ⋅ = ⋅ 17 2
To find the conductivity of the sun we can use the formula: 3/ 20.003 Tσ = ⋅ This formula is found in: “The Sun: An Introduction” by Michael Stix. 1989 page 308. Setting a temperature of 4000000 K that is found in the Sun upper radiative zone gives: 3/ 2 3/ 2 7 -10.003 0.003 4000000 2.4 10 S mTσ = ⋅ = ⋅ = ⋅ ⋅ And the resistivity is:
8
7
1 1 4.17 10 m2.4 10
ρσ
−= = = ⋅ Ω⋅
⋅
Now we can find the resistance of the donut shaped ring.
9
8 117
3.06 104.17 10 9.38 101.36 10
RingRing
Ring
lRA
ρ − −⋅= ⋅ = ⋅ ⋅ = ⋅ Ω
⋅6
This small resistance shows that stars are comparable to a superconductor. The power collected by the sun from the magnetic fields can be found by the electromotive force and the resistance. (1.1)
2 6 228
16
(3.17 10 ) 1.07 10 W9.38 10
VPR −
⋅= = = ⋅
⋅
The radiation emitted or luminosity of the sun is 3.86*10^26 W. The mass lose rate from the solar wind is 10^9 KG/S. The energy equivalent of this mass is:
113

. 2 9 8 2 2510 (3 10 ) 9 10 WE MC= = ⋅ ⋅ = ⋅
The energy supplied to the sun by the magnetic fields associated with the solar cycle is higher then the radiation emitted by the sun and the energy equivalent of the mass loss of the sun. The above calculation can be summarized with the following formula which states that the power absorbed by the star depend on the fifth power of the star radius. (1.2)
3 3/ 2 21.89 10 ( )BstarP T
t− 5R∆
= ⋅ ⋅ ⋅ ⋅∆
P - Is the power that the star absorbs from the magnetic fields. T - Is the star temperature at 0.7 of its radius. Bstar - Is the magnetic field of the stellar cycle. R - Is the star radius. The fifth power on the star radius can explain the observations of large stars like blue giants. The short wavelength color of blue giants and their high luminosity imply higher temperature and stronger energy source. The blue giants are also producing strong solar winds that disperse some of the mass created by the star. It is also possible to show that the strength of the magnetic field, needed to sustain the energy consumed by the sun, is smaller then the magnetic field measured by the Ulysses probe. If we do not take into account the energy required to produce new mass in the sun, then the energy consumed by the sun is equal to the sum of the radiation emitted and the solar wind mass loss.
26 25 263.86 10 9 10 4.76 10 WTotalE = ⋅ + ⋅ = ⋅ Form this energy consumption and the resistance of the sun, we can find the electromotive force.
26 16 54.76 10 9.38 10 6.68 10 VV P R −= ⋅ = ⋅ ⋅ ⋅ = ⋅ From Faraday's law we can find the magnetic field at the sun surface.
513 -1
18
6.68 10 1 4.39 10 T S1.52 10
SunSun
E tBA
−⋅∆ ⋅ ⋅∆ = = = ⋅ ⋅
⋅
114
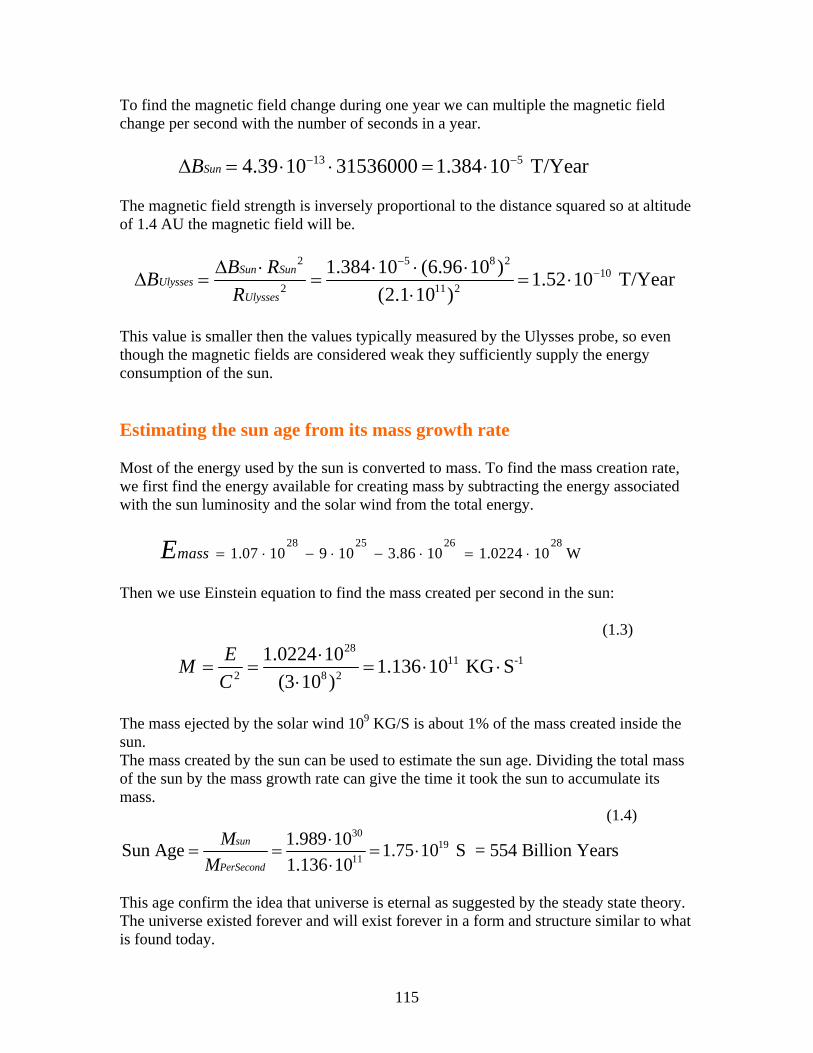
To find the magnetic field change during one year we can multiple the magnetic field change per second with the number of seconds in a year.
13 54.39 10 31536000 1.384 10 T/YearSunB − −∆ = ⋅ ⋅ = ⋅ The magnetic field strength is inversely proportional to the distance squared so at altitude of 1.4 AU the magnetic field will be.
2 5 8 2
102 11 2
1.384 10 (6.96 10 ) 1.52 10 T/Year(2.1 10 )
Sun SunUlysses
Ulysses
B RBR
−−∆ ⋅ ⋅ ⋅ ⋅
∆ = = = ⋅⋅
This value is smaller then the values typically measured by the Ulysses probe, so even though the magnetic fields are considered weak they sufficiently supply the energy consumption of the sun. Estimating the sun age from its mass growth rate Most of the energy used by the sun is converted to mass. To find the mass creation rate, we first find the energy available for creating mass by subtracting the energy associated with the sun luminosity and the solar wind from the total energy.
28 25 26 28
1.07 10 9 10 3.86 10 1.0224 10 WmassE = ⋅ − ⋅ − ⋅ = ⋅ Then we use Einstein equation to find the mass created per second in the sun: (1.3)
28
11 -12 8 2
1.0224 10 1.136 10 KG S(3 10 )
EMC
⋅= = = ⋅ ⋅
⋅
The mass ejected by the solar wind 109 KG/S is about 1% of the mass created inside the sun. The mass created by the sun can be used to estimate the sun age. Dividing the total mass of the sun by the mass growth rate can give the time it took the sun to accumulate its mass. (1.4)
3019
11
1.989 10Sun Age 1.75 10 S = 554 Billion Years1.136 10
sun
PerSecond
MM
⋅= = = ⋅
⋅
This age confirm the idea that universe is eternal as suggested by the steady state theory. The universe existed forever and will exist forever in a form and structure similar to what is found today.
115

This age is only an approximation. The sun size was gradually increasing, so when the sun was a red dwarf the mass growth rate was smaller. On the other hand, the sun could have passed near an area with strong magnetic fields like near blue giants, in the middle of a galactic arm or near the galactic center. In those areas the mass growth rate would be higher. The stellar cycle is variable and can stop for several hundred years like the recorded sun Maunder minimum. Those interruptions in the stellar cycle can decrease the mass growth rate of stars. Conclusion The magnetic fields of the solar cycle as measured by the probe Ulysses are strong enough to supply the energy for the sun luminosity and solar wind. The difference, between the energy received from the magnetic fields and the energy consumed by the sun luminosity, is producing new particles by converting energy to mass and increase slowly the sun mass. About 4% of the energy received is consumed by the sun luminosity and solar wind and the rest is converted into new mass. Dividing the sun mass by the growth rate enables to roughly estimate the sun age to be about 550 billion years. This old age indicates an everlasting universe, with no beginning or end, that is homogeneous and isotropic in space and time as was suggested by the steady state theory. The gradual growth of the sun and its old age invalidate the solar nebula hypothesis as the origin of the solar system, and suggest that the planets age is much older than the 4.6 billion years as is determined by the solar nebula hypothesis. Reference
19. Bar-Zohar, D. (2006). The sun energy source is not nuclear fusion, but magnetic fields from the center of the Galaxy. The sun converts energy to mass and not mass to energy. PHILICA.COM Article number 65. http://www.philica.com/display_article.php?article_id=65
20. Bar-Zohar, D. (2008). The sun produces muon neutrinos flux without neutrino oscillations. PHILICA.COM Article number 126. http://www.philica.com/display_article.php?article_id=126
21. Bar-Zohar, D. (2009). Stellar rotation is driven by magnetic fields in the galactic disc. PHILICA.COM Article number 149. http://www.philica.com/display_article.php?article_id=149
22. The Ulysses Mission Http://ulysses.jpl.nasa.gov/ 23. "The Sun: An Introduction” by Michael Stix. 1989 page 308.
Thursday, March 01, 2007
116

Stellar rotation is driven by magnetic fields in the galactic disc Abstract Stellar rotation is believed to be the result of the collapse of a stellar nebula when the star is born. This article will refute this idea and will show that stellar rotation is driven by changing magnetic fields in the galactic disc. It will show that Jupiter has a stellar cycle that drives its jet streams around the planet. Those jet streams are electrically charged by Jupiter stellar cycle to create the forward and backward flowing jets. The electric potential between adjacent jets drives spots like the great red spot. Similarly, it will be shown that the plasma belts in the sun are created by the solar cycle and that electric potential between adjacent belts drive the sunspots. The result of the flow of the plasma belts around the sun is the solar rotation and its associated differential rotation. Abbreviations SMBH – The supermassive black hole that reside at the center of every galaxy. GRS – Jupiter Great Red Spot. Stellar cycle, Solar cycle – In the context of this article, the stellar cycle is not created in the interior of stars by the dynamo effect, but is applied to the star from the outside by the galactic disc. Changing Magnetic Fields – The same as the stellar cycle above, applied on the stars from the outside by the galactic disc to heat the stars. Introduction The first measurement of stellar rotation was done by Galileo when he observed that sunspot on the sun surface circle around. Later, Scheiner discovered the differential rotation by measuring different speeds of sunspot for different latitudes. Otto Struve used spectroscopy to measure stellar rotation of far away stars by analysis of line breath in spectra of stars. The rotating star has a receding side with red shift and approaching sides
117

with blue shift, those shifts broaden the lines of the spectra. The rotation speed of stars along the main sequence is related to their mass. Generally, more massive stars rotates faster. There is a typical rotation speed to each star type in the standard classification (Figure 1). There is also a link between the magnetic activity of the star and its rotation speed. A Stronger magnetic activity is also indicating a faster stellar rotation. It will be shown that the magnetic activity or the stellar cycle is driving the stellar rotation. The magnetic activity is a short term phenomena, while the stellar rotation is a long term phenomena that is created by millions of years of stellar activity.
Figure 1 - The relation between the star rotation speed and the star color. The color of the star depend on its temperature, hotter stars have smaller B-V. B-V equal to 0.5 is a star of mass 1.2 sun mass and type F7, while B-V equal to 1.0 is a star of mass 0.7 sun mass and type K7. The graph shows that the hotter and more massive the star is, the faster it rotates. The changing magnetic fields in the galactic disc simultaneously heat and rotate the stars; hence the link between the color and rotation. The standard theory that explains the stellar rotation is linked to the evolution of the stars. It is incorrectly believed that stars are born from stellar nebulas that collapse and their angular momentum is then turned into the stellar rotation. After the birth of the star, its angular momentum always decreases from the influence of the magnetized solar wind. As the solar wind expands, it magnetically brake the sun similar to an ice skater that rotate and spread his hands outward. According to this model, the new born stars are rotating fast and as the time pass the rotation speed is gradually decreasing. This gives a link between the star age and its rotation speed. If the star is old it rotates slowly, if the
118

star is young it rotate quickly. However, this theory is incorrect because stars are not born from stellar nebula. In reference 1 it is shown that the energy source of the sun and other stars is from the solar cycle and magnetic fields in the galactic disc. The magnetic fields that cross the sun from the solar cycle induce currents in the sun according to Faraday’s law. Those very strong electric currents are the source of energy that heats the sun and not the fusion reaction. According to this model the stars does not carry internally the fuel for their operation but receive the energy from the outside by magnetic fields. Therefore, the age of the star is not limited by the amount of fuel that it carries but it is much longer. In other words, the stars do not resemble a candle that is getting shorter from the burning and has a correlation between its remaining length and the burning time. The stars receive their energy from the changing magnetic fields of the stellar cycle and convert part of this energy to mass that increases their size and promote them along the main sequence. The Hertzsprung-Russell diagram represents not only the relation of luminosity and temperature of many stars but also the development of a single star as it grows from red dwarf by the changing magnetic fields. In contrast to the common belief, stars with heavier mass like blue giants are older then smaller stars like red dwarfs. As the changing magnetic fields promote the star along the main sequence, they also increase its stellar rotation speed or angular speed. Older stars of class O, B, A absorb more energy from the changing magnetic fields, and therefore, are more massive and rotate faster than younger stars of class F, G, K, M. The creation of new mass in the stars increases the mass of the galaxy and causes spawning of new galaxies and the expanding universe. This theory therefore cancels the Big Bang theory and removes the age limit provided by the Big Bang theory. The universe according to this theory is Infinite and everlasting. The stars age, without the time limits mentioned above, could be several tens of billion years. With such a long life and knowing that the drag from the solar wind is always present, stellar rotation require a constant source of power and torque. This power is the solar cycle and the changing magnetic fields in the galactic disc. The magnetic fields in the galactic disc influence the stars in many ways; they heat the stars; they drive the stellar rotation; they increase the star mass; and they increase the speed of the star around the galactic center to provide the flat rotation curve of the galaxy. Relation between the star temperature and its stellar cycle period The energy cycle presented in reference 1 show that the stars energy source is the magnetic fields spread by the SMBH at the center of the galaxy. Many stars are very far from the galactic center so it is not possible that the magnetic fields are arriving directly from the SMBH. Instead, between the stars that absorb the energy from the magnetic fields and the SMBH there is numerous magnetic eddies and magnetic circuitry. Those circuitries operate like electric currents in a copper block under changing magnetic fields. The current eddies in the copper block heat the block in the same way as the magnetic eddies heat the galactic disc. Figure 2 shows that the magnetic fields absorbed by the
119

stars are not directly from the galactic disc but are propagating in eddies along the galactic disc. The magnetic eddies are not symmetric as shown in the drawing but are chaotic in nature. In addition, the size of those magnetic fields eddies are much smaller then what is shown in the figure. The amount and strength of the changing magnetic fields of the magnetic eddies determine the structure of the galaxy. At the galactic center there are many strong eddies that supply energy to many stars to create the galactic bulge, at the galactic edge there are less magnetic eddies and the galactic disc is thinner. The amount of stars in specific galactic distance from the SMBH reflects the strength of the magnetic eddies at that location. The structure of the spiral galaxy is determined by two main factors the availability of magnetic energy to the stars and the rotation of the galaxy. The most recent research on SMBH found connection between the mass of the SMBH and properties of the galaxy that surround it (Ref. 13). It was found that the mass of SMBH is connected to the blue luminosity of the bulge of spiral galaxies or to the blue luminosity of the entire elliptical galaxies. This connection stems from the influence of the changing magnetic fields dispersed by the SMBH. The larger the SMBH the stronger the changing magnetic fields around it are, and as they heat the nearby stars, the stars are getting hotter and their blue luminosity increase. There is also connection between the SMBH mass and the rotation curve of the galaxies. This relation can be understood by comparing the spiral galaxy to an electric induction motor, where the changing magnetic field increase the rotation speed of the galactic disc as shown in Figure 7 in Ref. 1. The SMBH mass is also linked to the mass of the bulge in spiral galaxies as the changing magnetic fields produce new mass in the interior of nearby stars.
Figure 2 - The galactic center spread magnetic fields in the galactic disc using magnetic eddies. The eddies are magnetic circuitry that encompass thousands of stars. The magnetic fields from the galactic center are too weak to reach directly stars like the sun, located in the middle of the galactic disc far from the SMBH. The picture shows is an edge on view of a galaxy with red circles representing the interconnected eddies. In contrast to what is shown in the picture, the eddies has no ordered structure, but a chaotic and dynamic structure, similar to current eddies in a copper block placed under changing magnetic fields. The transmission of power and energy from the SMBH to the stars at the galactic disc is conveyed through series of magnetic circuitry. The transfer of energy from the circuitry to the stars and from one circuitry to another can be compared to a series of electric transformer connected to one another (Figure 3). The secondary winding of one transformer is connected to the primary winding of the next transformer. Using many magnetic circuitry that act like transformers the energy is delivered from the SMBH to the stars at the galactic disc. The magnetic fields of the stars magnetic circuitry are like the core of the transformer where changing magnetic flux is flowing, the induced electric current inside stars is like the current in the transformers windings. The interstellar
120

medium cannot conduct electric current so the magnetic circuitries induce current only inside the stars. The magnetic fields from the vicinity of the SMBH are like the first transformer in the transformer chain. They induce currents in nearby stars. This induced current creates magnetic fields and a new magnetic circuitry, which again create electric current in further stars. From the first transformer the power pass through numerous intermediate transformers until it reaches the stars at the galactic edge. The stars that carry the electric current are not necessarily the same stars that pass the magnetic flux, large scale magnetic fields that encompass many stars can induce current in nearby stars. There is no distinction between the stars that sit at the middle of the transformer chain and convey power and stars that sit at the end of the transformer chain and only receive the energy. All stars in the galaxy both convey the power, transmit it to other stars and at the same time heated by the currents of the transmission process. Therefore, the stars cannot be grouped into stars that convey the electric energy and stars that only consume it; each star is performing those two tasks.
Figure 3 - The propagation of magnetic fields in the galactic disc is based on numerous eddies or magnetic circuitries. The interconnected eddies are similar in operation to a series of interconnected transformers. The core of the transformers represents the magnetic circuitries that carry magnetic fields in a group of star in the form of stellar cycle. The coil of the transformers represents the electric current passing in the interior of stars in response to their stellar cycle. The process starts in the galactic center at the left transformer in the image. The galactic center spread magnetic fields, which induce electric current in nearby stars. These induced currents create a further magnetic circuitry represented by the middle transformer. The last transformer at the right, supply magnetic fields to heat the star. Planets like stars are also heated by magnetic fields in the galactic disc and are also having a stellar cycle as will be shown in next sections of this article. Planets like Jupiter are composed mainly from gas or partly ionized gas in contrast to stars that composed of hot plasma. The ionized gas has much higher resistance then the hot plasma of the stars. Therefore, while the planets receive energy from the magnetic fields they absorb most of it by ohmic heating and not transmitting any power to nearby planets. Therefore, planets sit only at the end of the transformer chain. The planets magnetic energy is transmitted by red dwarfs that are found in large number in the galactic disc and comprise about 75% of all stars. Baliunas et al. 1995, showed a record of 25 years of stellar chromospheric activity of 111 stars on or near the main sequence. From this data, the stellar cycle period was calculated for many stars. The data reveal that stars have large variety in their stellar cycle period. Ranging from about 7 years for F5 stars to 14 years for K4 stars. Stars that are more massive generally show shorter stellar cycle period. Other facts that reveal the behavior
121

of magnetic fields in the galactic disc is that the rotation axis of stars in the galactic disc is random, and does not show uniformity similar to that of the planets in the solar system. It is easy to find binary stars that each one of the pair has a rotation axis that is pointing to a different direction. Also, nearby stars does not show stellar cycle that are synchronized or having the same period. The behavior of the changing magnetic fields in the galactic disc is Perplexing; why stellar cycle or magnetic field of one star does not affect other stars? Why high frequency stellar cycle of larger stars is not affecting nearby smaller stars? The answer is that stars have electric resonance similar to an Alternating current L-C electric circuit. The L-C circuit has resonance to specific frequency depending on the values of the capacitor and the inductor. The resonance of a star depends on its size, its temperature and its composition. For instance, stars that are more massive will have higher resonance frequency because their large size lowers the internal resistance of the star. Hotter stars will also have higher resonance frequency because hotter plasma has lower resistance. The galactic disc carries changing magnetic fields in all frequencies and the stars are using the frequency that is close to their internal resonance frequency (Figure 4). However, the magnetic fields are chaotic in nature so the observed stellar cycle for a specific star could diverge from the stellar cycle expected according to the star mass and temperature. The stellar cycle of a star is also affected by the size of nearby stars. A sun like star among blue giants will show shorter stellar cycle than a sun like star among red dwarfs. Blue giant has the shorter stellar cycle since their hot temperature and large size give lower internal resonance. For smaller stars like the sun and red dwarfs, the stellar cycle period is getting longer as their internal resonance frequency is smaller. The planets are also getting heated by magnetic fields as evident by the surplus of heat from Jupiter and Saturn. The stellar cycle of the planets is very long and takes hundreds of years.
122

Figure 4 - The galactic disc conveys changing magnetic fields in a range of frequencies and supply energy to stars and planets. The stellar cycle is created by those changing magnetic fields and not by stellar dynamos. The frequency that a specific star uses is determined by its internal resonance frequency, affected by the size and temperature of the star. The stellar cycle frequency will diverge from the star resonance frequency because of the chaotic nature of the magnetic fields. The period of the stellar cycle is inversely correlated to the stellar mass; it is longer for smaller stars. Planets like Jupiter have very long stellar cycle period that span hundreds of years, while Blue Giants have stellar cycle of a few years. The magnetic fields in the galactic disc and the stars are comparable to radio transmitters and receivers. The transmitters broadcast in a range of frequencies that all propagate through space while the receivers due to their internal resonance circuitry are tuned to specific frequency. In Fourier analysis, a general function is described as the sum of sinusoidal or trigonometric functions. Similarly, the magnetic fields in the galactic disc can be represented as a sum of trigonometric functions. Each of those trigonometric functions represents stellar cycle of specific star class. The magnetic fields in the galactic disc are like transmitters of radio wave and the stars are similar to receivers of radio waves. Radio transmitters transmit in many frequencies and the air is saturated with all frequencies. The receivers by their resonance circuitry can tune to the specific frequency. This is similar to the star that their internal resonance effect their stellar cycle.
123

Stars between types F to M are the majority among the stars in the galactic disc and therefore are the backbone that spread the magnetic energy in the galactic disc. Those stars will show more regular magnetic activity, while planets and giant stars will show random and chaotic magnetic activity. It is possible that different frequencies of the changing magnetic field are spreading to specific angles. In that case, adjacent stars of the same size and class will have near parallel rotation axis and their solar cycle will have the same period. According to this idea, in a group of stars there will be statistical preference of stars of the same type and class to rotate in the same direction. Blue giants and massive stars in general require strong magnetic fields to support their high luminosity. Blue giants are attracted by magnetic forces to regions in the galaxy that have strong magnetic fields like the galactic arms. At the same time, the presence of blue giants enables the propagation of strong magnetic fields, as the blue giants decrease the magnetic permeability in the region. This can explain the high concentration of blue giants in the galactic arms and the higher brightness of the galactic arms caused by their higher permeability and their ability to easily propagate the changing magnetic fields. Jupiter has a unique stellar cycle with long period In reference 1, it was indicated that star get their energy from changing magnetic fields in the galactic disc. The magnetic fields associated with solar cycle are not induced internally by a dynamo in the sun but is applied from the outside by the galactic disc. The solar cycle change its magnetic polarity every 11 years and its magnetic fields traverse through the sun parallel to the rotation axis. These magnetic fields create electric currents according to Faraday’s law and heat the sun by ohmic heating. As was mentioned in the previous sections there are evidence that the planets are also heated by changing magnetic fields. The first evidence is that many planets has heat surplus. They produce more heat than what they absorb from the sun. Further evidence is that many planets have jet streams that encircle the planets. Jupiter has prominent jet streams, which are being accentuated by the different colors. The earth on the other hand has a weaker and less prominent jet stream. Jets streams or plasma belts are also found in the sun by helioseismology as show by Figure 19. If both the planets and the sun are showing the same jet streams, it means that there is a common source and physical explanation for them. Jupiter jet streams are not created by convection. Jupiter is too far from the sun to absorb enough heat to drive its massive jet streams by convection. The common source for the jet streams in planets and stars is therefore the changing magnetic fields in the galactic disc. The planets, similar to stars, should have a stellar cycle that is heating the planets and drive their jet streams. The sun and Jupiter does not show correlation or synchronization in activity or phenomenology that happens in both of them at the same time. Therefore, the sun and Jupiter has different stellar cycles with different periods. To understand why the sun stellar cycle does not affect Jupiter, and why the stellar cycle of Jupiter does not affect the sun, the resonance of the star can be applied. The stars have
124

internal resonance frequency depending on their size and temperature. This resonance determines the star stellar cycle frequency. Since Jupiter is much colder and smaller than the sun, its stellar cycle period is longer than that of the sun. The data from Table 2 in Baliunas et al. 1995 can be used to show the relation between the star stellar cycle and its temperature and by that to estimate Jupiter stellar cycle period. The points with poor FAP grade where removed and also four stray points for stars 157856, 114710, 201091, 201092 where removed. This data shown in table 1 in this article and is ordered according to the B-V color of the star. In Figure 5, the stellar cycle period versus the B-V color from table 1 is plotted. There is clearly a tendency of the stellar cycle period of the star to get longer as the B-V color is higher and the star is colder. Applying regression on the data gives the line: P = -1.22 + 14.14 (B-V) Where P is the stellar cycle Period and B-V is the color index. This line is shown on Figure 5 that estimates the rise of the stellar cycle according to the star B-V color. This line is used in Table 2 to reveal the stellar cycle for very cold objects like red dwarfs and planets. The following formula is used to convert the star B-V color to the star temperature (T): B-V = -3.684 log (T) + 14.551 The stellar cycle period versus temperature from Table 2 is plotted in Figure 6. This graph can be used to estimate the stellar cycle periods for cold objects like red dwarfs and planets. For Planets like Jupiter, we can use a temperature around 286 Kelvin to get a stellar cycle of 76 years. Plotting planets and stars on the same graph is inaccurate. Planets like Jupiter are made of gas that a small fraction of it is ionized while stars are made of hot plasma. The resistance of the hot plasma is very low near that of a superconductor, while the resistance of ionized gas is much higher. The stellar cycle period for planets should be higher than that shown in Figure 6 because the high resistance of the planets will give them resonance for lower frequencies.
Star HD Number
B-V Color Index
Stellar Cycle Period (Years)
18256 0.43 6.8 111456 0.46 7 187691 0.55 5.4 100180 0.57 3.56 154417 0.57 7.4 176051 0.59 10 78366 0.6 12.2 190406 0.61 2.6 81809 0.64 8.17
125

161239 0.65 5.7 Sun 0.66 10 1835 0.66 9.1 76151 0.67 2.52 20630 0.68 5.6 26913 0.7 7.8 103095 0.75 7.3 152391 0.76 10.9 82885 0.77 7.9 185144 0.8 7
219834A 0.8 21 26965 0.82 10.1 149661 0.82 17.4 10476 0.84 9.6 3651 0.85 13.8
165341A 0.86 5.1 166620 0.87 15.8 4628 0.88 8.37
219834B 0.91 10 115404 0.93 12.4 160346 0.96 7 16160 0.98 13.2 32147 1.06 11.1 156026 1.16 21 190007 1.17 13.7
Table 1 - The stellar cycle period in years and the B-V color index of the stars from Baliunas et al. 1995. This data was collected during 25 years on F2 to M2 stars. Identifying longer stellar cycle require longer observations and data collection. The data shows clearly that for a colder star (Higher B-V) the stellar cycle period is longer. There is also evidence that confirm a very long stellar cycle of 60 years (Ref. 12). This evidence supports the idea that Jupiter has a very long stellar cycle of 200 years that drives the great red spot. The data is taken from Baliunas et al. 1995 where the measurements denoted as poor where omitted.
126

Figure 5 - The graph plot the stellar cycle period versus color from table 1, It shows clearly that for a colder star (Higher B-V) the stellar cycle is longer. Applying a linear regression on the points gives the line P = -1.22 + 14.14 (B-V) that is shown in the graph. This linear relation could be used to estimate the stellar cycles of objects like red dwarfs and planets based on their temperature. Few stray points where omitted to emphasize the linear relation.
B-V Color Index
Temperature (K)
Stellar cycle Period (Years)
0.4 6937.535 4.436 0.45 6724.082 5.143 0.5 6517.196 5.85
0.55 6316.676 6.557 0.6 6122.325 7.264
0.65 5933.954 7.971 0.7 5751.379 8.678
0.75 5574.421 9.385 0.8 5402.908 10.092
0.85 5236.672 10.799 0.9 5075.551 11.506
0.95 4919.387 12.213 1 4768.028 12.92
1.05 4621.325 13.627 1.1 4479.137 14.334
127

1.15 4341.324 15.041 1.2 4207.75 15.748
1.25 4078.287 16.455 1.3 3952.806 17.162
1.35 3831.187 17.869 1.4 3713.309 18.576
1.45 3599.059 19.283 1.5 3488.323 19.99
1.55 3380.995 20.697 1.6 3276.969 21.404
1.65 3176.143 22.111 1.7 3078.42 22.818
1.75 2983.704 23.525 1.8 2891.901 24.232
1.85 2802.924 24.939 1.9 2716.684 25.646
1.95 2633.097 26.353 2 2552.082 27.06
2.5 1867.122 34.13 3 1366 41.2
3.5 999.3752 48.27 4 731.1501 55.34
4.5 534.9146 62.41 5 391.3474 69.48
5.5 286.3126 76.55 Table 2 - This table is based on the linear regression P = -1.22 + 14.14 (B-V) shown in Figure 5. The B-V color index is converted to temperature using the formula B-V = -3.684 log (T) + 14.551. The table shows several points calculated by this relation including cold temperature that represent red dwarfs and planets. As the temperature of the stars is decreasing, the stellar cycle period is increasing. To show that planets like Jupiter has a very long stellar cycle period the low temperatures of the planets where used to give the long stellar cycles. For a Planet with temperature 286 K the stellar cycle period would be very long around 76 years.
128

Figure 6 - The stellar cycle period versus the star temperature is plotted according to the data of table 2. Colder star has longer stellar cycle period so continuing this graph to very low temperature shows that planets like Jupiter have very long cycle. This relation is only estimation; Planets are not composed of hot plasma like stars so their electric resistance is much higher, therefore, planets stellar cycle is longer than that shown in the graph. Jupiter great red spot is driven by Jupiter stellar cycle and it is blowing for about 200 years; this is much higher than 76 years shown in the graph. Jupiter stellar cycle is driving the massive jet streams and the great red spot. The jet streams in their present pattern and the great red spot are going on within one stellar cycle of Jupiter. If the stellar cycle of Jupiter will flip, the direction of the changing magnetic fields will flip and it will affect the jet streams. If now Jupiter middle jet stream EZ is moving to the right relative to the narrow jet streams on top and bottom of it, than when the direction of the changing magnetic fields will flip, the middle jet will flow to the left relative to the top and bottom jets. The middle jet stream EZ will change its flowing direction and will flow slower then the planet rotation. The great red spot will vanish when the changing magnetic field will flip, as will be explained in the next sections. Historical record of the great red spot and the jet stream can be used to evaluate the period of Jupiter stellar cycle. The great red spot was first shown in a drawing from 1831. Cassini and other astronomers observed a spot from 1665 to 1713 (Rogers 1995). However, the Cassini spot is not necessarily the great red spot. The Cassini spot was a temporarily spot that appeared when the changing magnetic fields where flipped. There is no observation of a great red spot prior to Cassini. The telescopes at that time could discern the great red spot and early astronomer would certainly mention this peculiar
129

storm if they saw it. Therefore, the great red spot did not exist before 1831 and the Cassini spot was another storm. The conclusion is that Jupiter current stellar cycle started from around the 1831 drawing and continues to the present days. The long stellar cycle of Jupiter made the atmospheric winds on Jupiter look permanent and by that, they hide the existence of the stellar cycle. However, during the 21 century the changing magnetic fields of Jupiter will flip their direction to start a new stellar cycle and will affect the winds on Jupiter. The jet streams will reverse their relative direction; the forward winds will blow backward and the backward winds will blow forward. The great red spot will vanish as will be explained in the next sections. The magnetic field of earth keeps its direction for hundred of thousands of years and it reverses the polarity of its magnetic field in average about 250000 years. If the planets and earth have stellar cycle of a few hundred years then it is unclear why the earth doesn’t reverse its magnetic field with the stellar cycle as observed on the sun. The earth and the planets has two components of the electric field one is static that keeps its value constant and a second component of alternating magnetic field that changes periodically (Figure 7). The alternating magnetic fields supply energy to the planets, they cause the planets heat surplus and create the jet streams. The reason that the planets have static component and the stars haven’t is that the planets resistance is higher so they can keep their electric charge longer in the rotating planet as will be explained in the next sections. The stars, on the other hand, have very low resistance that quickly dissipates the electric charges. Jupiter magnetosphere should reflect the alternating component of the magnetic field. Jupiter magnetosphere will change its size according to Jupiter stellar cycle and increase in size when the total magnetic field is getting stronger.
Figure 7 - Jupiter magnetic field is composed of two components. One is a static component that changes very little with respect to time. This static magnetic field is induced by the planet itself. The second component is the stellar cycle of Jupiter that is induced by the changing magnetic fields in the galactic disc. The stellar cycle magnetic field alternates and changes its polarity like the sun solar cycle. The stellar cycle magnetic field heats the planet and causes the jet streams, which are electric in nature. The magnetosphere
130

of Jupiter will change its size according to the combined strength of the static and alternating magnetic fields. The jets streams on Jupiter are driven by Jupiter stellar cycle The jet streams are the most dominant features in Jupiter atmosphere. Jupiter jet streams are very fast and their latitude is stable compared to earth jet stream. The jet streams are visible from telescopes on earth, especially during outbreaks of spots. Many space craft like Pioneer, Voyager, and Galileo return spectacular images of Jupiter that revealed the complex atmosphere. Scientist where always puzzled by the jet streams and the forces that drive them. The usual explanation is that Jupiter jet streams are driven by convection. One heat source that was suggested to drive the convection is the sun radiation, but the distance of Jupiter from the sun is too far to supply the energy required by the jets. Another heat source could be emanating from Jupiter’s hot interior. Still, it is hard to explain the complex structure of the jet streams from those heat sources. Figure 8 shows the jet streams velocity as a function of latitude for the outer planets. Jet streams are also found on the sun and on earth. The common energy source that drives those jet streams is the changing magnetic fields from the galactic disc. Jupiter has a magnetic stellar cycle similar to the sun solar cycle. Jupiter stellar cycle apply changing magnetic field that cross Jupiter along the rotation axis. The source of the changing magnetic field is the galactic disc and it provides energy to the planet. This energy is evident in the heat surplus of Jupiter and in the atmospheric phenomenon like the jet streams. As the changing magnetic fields cross Jupiter, it induces electromotive force or EMF according to Faraday’s law:
ddt
ε Φ= − .
The EMF (ε ) create electric current that circle Jupiter (Both the EMF and the Electric Potential denote energy per unit charge and have the same unit of Volts, therefore, for simplification the term Electric Potential will be used instead of EMF in this text). Figure 9 demonstrate Faraday’s law and its application to understand the jet streams. The atmosphere of Jupiter is composed of slightly conducting ionized gas. This gas is ionized by the many lightning that surround Jupiter atmosphere and by impacts with cosmic rays, solar wind and dust. The electric current that flow in the ionized gas, sweep the gas with the charged particles to create Jupiter Jet streams. The ionized gas is composed of positive and negative charges, negative charges are free electrons and positive charges are atoms that lost electrons. The electric field accelerates those charges and as they bump into nearby neutral atoms or molecules, they sweep the whole gas volume with them.
131

Figure 8 - The jet streams velocity as a function of latitude for the outer planets. In Jupiter, the jets with positive velocities are charged with positive electric charge, whereas the negative velocities denote negative electric charge. The velocities of the jets are proportional to the charge of the jet so a faster blowing jet has also higher electric charge density. The great red spot is driven by the electric potential between the positively charged middle jet EZ and the negatively charged jet right below it. Between those two jet streams, there is the highest speed difference and the highest electric potential. Jet streams in the other
132

planets are indicating that those planets also absorb changing magnetic fields. (Image from Porco et al. 2003, Science 299, 1541–1547)
Figure 9 - The changing magnetic fields in Jupiter create electric potential according to Faraday’s law that creates electric current in the ionized gas around Jupiter. Faraday’s law can be demonstrated by a moving magnet and a copper loop. The changing magnetic field of the stellar cycle is like the moving magnet. In Jupiter, this induced current is split to positive and negative electric charges by the pinch effect that creates the jet streams. The changing magnetic field also makes the jet streams flow in opposite directions according to the jet streams electric charge. This image also explains the heating of stars by changing magnetic fields from the galactic disc. The induced currents heat the stars by ohmic heating. The direction of the changing magnetic field is almost parallel relative to the star rotation axis. The creation of jet streams from electric potential can be demonstrate by an experiment in which slightly conducting oil is placed in a strong electric potential (Figure 10). The tank is filled with oil and has two electrodes at the right and left of the tank. The slanted upper electrode is connected to the right electrode. When the power supply is connected to the electrodes, the negative ions in the oil are attracted to the upper electrode and as they pulled to the right by the upper electrode, they create a stream in the oil. The charges in the oil are accelerated by the electric field and as they move, they drag a layer of the oil with them. Despite the scale difference between this experiment and Jupiter, there is a striking similarity between the appearance of the oil stream and Jupiter jet streams. The video that show the experiment can be downloaded from: http://ocw.mit.edu/ans7870/resources/zahn/video/demo-7-5-1_300k.mp4Or http://www.pixelphase.com/sun/demo-7-5-1_300k.mp4
133

Figure 10 - This experiment shows the development of a stream by applying electric potential. The tank contains slightly conducting oil with two electrodes placed at the two sides of the tanks. Between the electrodes, there is electrical potential of 10,000 to 20,000 Volts. The upper electrode is slanted and connected to the right positive electrodes. When electric potential is applied, the upper electrode attracts negative charges in the oil. The slanted upper electrode also attracts the oil negative charges to the right as those charges aspire to be as closely as possible to the upper electrodes. The stream is created in the fluid by the movement of the charges in the oil. This experiment explains how the jet streams of Jupiter are driven by the changing magnetic fields and the electric potential they induce by Faraday’s law.(From MIT OCW http://ocw.mit.edu/ans7870/resources/zahn/video/demo-7-5-1_300k.mp4 ) The jets streams are divided to those flowing forward and those flowing backward. The electric current that circle Jupiter is not sweeping the entire outer layer in one stream; instead, it is divided into forward and backward streams. The source of this separation is the electric charges. The ionized gas of Jupiter atmosphere consists of both positive and negative charges. When the changing magnetic fields apply electric potential on the gas, the negative charges will accelerate in one direction and the positive charges will accelerate in the opposite direction. Even though the charges are moving in opposite direction the electric current is moving in a single direction, identical to the direction of the positive charges. If we imagine a thought experiment and isolate Jupiter from the changing magnetic fields for a while. Then when the changing magnetic fields are reapplied the positive and negative charges moves in opposite direction in the same volume of gas and bump into each other. After some time the charges are separated into opposite flowing streams, the positive charges move in jets that flow forward while the negative charges move in jets that flow backward.
134

This separation to forward and backward jet streams is the result of two factors. One is that the system is reducing viscous drag to a minimum and the second is the pinch effect. Here is a detailed description of the two: Reducing viscous drag to a minimum: When the gas is composed of forward and backward moving particles, the particles that move in the same direction will tend to stick together or attract each other. This can be explained by the kinetic theory. Particles that move in the same direction will collide less then particles that move in opposite direction. Let’s take for instance a particle that is moving to the left. Above this particle, there is a stream of particles that moves to the left. Below this particle, there is a stream that moves to the right. The particle will collide more with particles of the stream below. It will experience pressure from below that will push it up into the upper stream; the stream that moves in the same direction as he is. The experiment shown in Figure 14 can demonstrate the creation of streams to reduce viscous drag to a minimum. Pinch effect: The pinch effect is usually an internal effect in hot plasma. Electric currents inside the plasma create strong magnetic fields that attract and squeeze the moving charged particles together. The pinch effect was first discovered in induction electric furnaces. Those devices where basically an Alternating Current transformer, that its secondary winding was a tunnel of molten metal. In the molten metal passed a current of about 100000 Amperes. This current applied strong pinch effect on the liquid metal that squeeze the liquid metal to a point that the electric current was cut in the liquid metal and the furnace failed. In 1907, it was investigated by C. Hering, which gave it the name pinch effect. Lightning bolts are also demonstrating the pinch effect. The strong current of the lightning bolt concentrate the charges and give the lightning its slim appearance. In Figure 11, there is a piece of copper tube that was part of a lightning rod that collapsed inward when struck by a lightning. The strong current of the lightning created strong magnetic fields that pulled the electrons inward to bend the tube. Another example that can demonstrate the behavior of the pinch effect and Jupiter jets is attraction between parallel conductors. Two conductors that carry electric current in the same direction will attract each other as the magnetic field of one conductor will attract the moving charges of the other conductor by magnetic force. Jupiter Jet streams develop their pattern of opposite flowing jets from a process similar to the pinch effect. The electric current that is flowing inside the jets is creating magnetic field around the jets. This magnetic field has a donut like shape with the jet stream passing inside. This magnetic field is attracting electric charges of the same sign, and repelling charges of the opposite sign. For instance, the EZ jet that has a positive charge will create a magnetic field around it that will attract additional positive charges and increase the charge density of the jet. This is true for the other jets, the positively charged jets will attract positive charges and the negatively charged jets will attract negative charges. In this way, the current from Jupiter stellar cycle is turned into positively charged and negatively charged jet streams (Figure 12). The electric current that is produced by Jupiter changing magnetic fields is flowing in the same direction in all the jets. Both the Positively charged forward jets and the negatively
135

charged backward jets have the same direction of electric current. By convention, the flow of electric current is opposite to the flow of the negatively charged electron. However, though the electrons are flowing backward by the electric current their drift speed by the electric current is slower then their speed by the rotation of the planet. Therefore, the rotation of the planet is what creates the magnetic fields around the jets that help to separate the charges by the pinch effect.
Figure 11 - The pinch effect is usually an internal effect in hot plasma. Electric currents inside the plasma create strong magnetic fields that attract and squeeze the particle together. The pinch effect can be found in other systems beside hot plasma, like on this lightning rod that the electric current from a lightning collapsed it inward. The strong currents created magnetic fields that effected the movement of the electric charges to collapse the rod. The thin appearance of lightning in the sky is also caused by the pinch effect; the lightning charged particles are squeezed together by the pinch effect. In Jupiter, the pinch effect contributes to the creation of the jet stream by increasing the density of the electric charges inside the jets. The changing magnetic field of Jupiter creates electric currents. When those currents are flowing, the magnetic fields they produce activate the pinch effect to charge the jet streams.
136

Figure 12 - Jupiter jet streams are driven by changing magnetic fields. The changing magnetic fields are
almost parallel to the rotation axis; their direction is denoted by ddtΦ
in the image. According to Faraday’s
law the changing magnetic field generate electric potential that pass electric current around Jupiter. The ionized gas of Jupiter includes positive and negative charges that the pitch effect separate into forward and backward jets. While the opposite charges flow in opposite direction, the electric current is flowing forward in all the jets and has the same direction of the positive charges. Jets like the EZ jet that flow forward and faster then the planet rotation speed, carry positive charges, while the opposite jets carry negative charges. Pioneer 11 passing near Jupiter revealed magnetic field rich in multiple harmonics relative to the amount of harmonics found on earth. This suggests that Jupiter dynamo source region is closer to the surface of the planet. The jets streams are electrically charged and rotate fast with the planet, so they generate Jupiter magnetic field and its magnetosphere. The EZ middle jet of Jupiter is the biggest jet in Jupiter and its electric charge drive large part of Jupiter magnetic field. By knowing the direction of Jupiter magnetic field and the planet rotation direction, it is possible to find the charge of the EZ middle jet by Ampere’s law (Figure 13). Knowing the charge polarity of this belt, reveal the charge polarity of all other belts. All forward jets have the same positive charge as the EZ main jet and the backward jets have negative charge.
137

Figure 13 - Jupiter magnetic field can be used to find out the polarity of the charge of each jet according to Ampere’s law. Jupiter EZ jet is the dominant jet on Jupiter and therefore, it must produce most of Jupiter magnetic field. The magnetic field of Jupiter is opposite to that of earth. In Jupiter, the planet north poll is the magnetic north. To produce this magnetic field the EZ ring must be positively charged and pass current in the same direction as the rotation direction. This is similar to a copper ring that passes current and produce magnetic field as shown in the image. The creation of the opposite jet streams decreases the electric resistant of the outer layers and enables a stronger electric current to flow. The lower resistance increases the energy per time or power the planet absorbs from the changing magnetic fields. The reduced electric resistance can be explained with cars on a highway where the forward headed cars are positive charges and the backward headed cars are negative charges. If forward and backward headed cars where driving on the same lanes, they would bump into each other and their average speed would be slower as they stop from the collisions. If the lanes are divided into forward and backward lanes, the cars can drive in their lane faster without bumping into other cars. The sun solar cycle flips its direction every 11 years, similarly, the changing magnetic fields in Jupiter will also flip their direction. When that happens, the overall magnetic
138
field of Jupiter will maintain the same polarity, but will change its magnitude as shown in Figure 7. When the magnetic flip happens, the Jet streams will be arranged differently. The main EZ belt will keep its positive charge but will flow backward relative to the planet rotation and the negatively charged jets below and above it will flow forward relative to the EZ belt and the planet rotation. In this configuration, anticyclonic spots below the EZ belt will rotate in opposite direction to that of the great red spot. Historical evidence shows that the great red spot appeared in 1831, before that the changing magnetic fields where reversed and did not produce a dominant spot like the great red spot but smaller temporary spots. Therefore, at the next reversal of the changing magnetic fields, probably in the 21st century, the great red spot will disappear and temporary spots will replace it. The electric charges that develop in the jet streams are driving the lightning bolts activity in Jupiter. This activity revealed by space crafts voyager, Galileo and Cassini. Galileo found that the lightning are concentrated in just a few zones of latitude influenced by anti cyclonic sheer. Galileo probe also heard 5000 lightning flashes during the 57.6 minutes of its descent to Jupiter. The average lightning on Jupiter are 10 times stronger then those on earth. Both Galileo and Cassini probes observed unusual strong lightning in the GRS wake this support the idea that the GRS is an electric phenomenon driven by the electric potential between two opposite jet streams. The great red spot is an electric storm driven by the charged jet streams The GRS is an anti-cyclonic high pressure spot that has been a permanent feature of Jupiter since 1831. The GRS is very different from hurricane on earth. While Hurricanes are powered by solar heating that evaporate water, the energy source of the GRS is the electric charge that develop in the jet stream. This electric charge provide electric potential that just like a battery can be a source of power and energy. Like the acceleration of electrons under an electric field in a cathode ray tube, the electric field between the jets can accelerate electric charges or ions in the gas that drift the gas volume to create vortex like the GRS. Coulomb’s law depicts the attraction and repulsion forces between charges. Coulomb’s law has resemblance to Newton’s law of universal gravitation and both gives the magnitude of force. Newton’s law gives the gravitational force and Coulomb’s law gives the electrical force. Those two forces also create potential energy so while the GRS gain energy from electric potential hurricane gain energy from gravitation potential. In Figure 14, there is an experiment that shows the creation of vortexes from electric field. This experiment can be used to explain both the GRS and sunspots. In the experiment, corn oil that is slightly conducting is placed in a tank. At the bottom of the tank, two electrodes are placed. When a high voltage power supply is connected to the two electrodes and electric field is applied between them, the corn oil form spontaneous vortexes. Those vortexes are driven by the electric field. There are free electric charges inside the corn oil that get attracted by one electrode and repelled by the other electrode.
139

Those vortexes pass electric current between the electrodes. Without the oil vortexes the electric current between the electrodes will be smaller and the resistance of the oil higher. In addition, those vortexes form when the oil streams seek to reduce their viscous drag to a minimum. The video that show the experiment can be downloaded from: http://ocw.mit.edu/ans7870/resources/zahn/video/ demo-7-5-2_300k.mp4Or http://www.pixelphase.com/sun/demo-7-5-2_300k.mp4 The formation of GRS and sunspots is similar to the formation of the oil vortexes in the experiment. The electrodes of the experiment correspond to the jet steams and the slightly conducting corn oil is similar to the ionized gas in Jupiter atmosphere. The jet streams develop electric charge that applies electric field to drive the GRS. In Figure 15 there is a descriptions of the jets a round the GRS. The two dominant jets that drive the GRS are the EZ and the SEB jets. The EZ has positive charge and the SEB jet has negative charge. The source of power of the GRS is the electric field and electric potential between those two jets. Charged particles inside the GRS are accelerated by attraction force between opposite electric charges as stated by Coulomb’s law. The negative ions from the SEB jet are attracted and accelerated toward the EZ positive charge and by that, push the GRS anticlockwise. The STropZ jet has a weaker part in driving the GRS and it is merely confining and directing the lower part of the GRS. Though the GRS is located at latitude 22 it is driven by the EZ and SEB jets that are found higher. The propulsion of the GRS is done by the SEB jet at the top part of the GRS or its north east part. The SEB jet is protruding into the EZ jet, and this decreases the distance between charges of the two jets. The decrease in distance converts the electrical potential energy between opposite charges and increases the kinetic energy of the charges to drive the GRS. Electric current is flowing in the GRS from the EZ jet to the SEB jet. This current slightly discharges the electric charges in those jets. This current multiplied by the electric potential between the EZ and the SEB jets gives the power that the GRS use. In Figure 8 it is shown that the difference in the velocities of the EZ and SEB jets is the highest in the planet. This means that the electric potential between those two jets is the highest in the planet and can easily support and supply energy to an electric storm like the GRS.
140

Figure 14 - In this experiment there are two electrodes submerged in corn oil inside a container. When high voltage is applied between the electrodes, free charges inside the slightly conducting oil start to flow between the electrodes to create electric currents. The left image (a) is a schematic of the experiment showing the electric polarity of the electrodes and the space between them while (b) on the right shows the actual experiment. Those electric currents drift the oil to create rotating cells or vortexes. The power consumed by the rotating cells is equal to electric potential between the electrodes multiplied by the electric current they consume. Jupiter Great Red Spot works on the same principle. Jupiter Middle jet and the jet below it create between them strong electric potential that drive the great red spot. The ionized gas in the Great Red Spot is accelerated by the electric potential to create the circular flow. The resistance of the oil with the vortices or cells is lower then the resistance of the oil without the cells; therefore, with the cells the electric current between the electrodes is higher. This process also drives the sunspots. (From MIT OCW http://ocw.mit.edu/ans7870/resources/zahn/video/demo-7-5-2_300k.mp4 )
Figure 15 - Jupiter Great Red Spot is driven by the electric charges and electric potential between the jet streams EZ and SEB, in a process similar to the experiment depicted in Figure 14. The EZ jet has a positive charge and the SEB jet has a negative charge. The source of power of the GRS is attraction force between opposite electric charges as stated by Coulomb’s law. Negative charges from the SEB jet are attracted and accelerated toward the EZ positive charges. Movement of the electric charges sweeps the gas around them and creates the vortex. The electric potential between the EZ and SEB jets create electric current that flow primarily through the GRS. The GRS just like the jet streams is formed by reducing viscous drag to a minimum.
141
Sunspots are electric vortexes created between two charged plasma belts The sunspots existence was know before the invention of the telescope and there is evidence of this knowledge from the fourth century B.C. Sunspots come in a range of sizes up to a diameter of 20,000 km. The sunspots usually have a dark and cold umbra at the center and penumbra that surround it and consist of dark and light filaments (Figure 16). The umbra has an almost vertical magnetic field that can reach up to 0.3 Tesla. Usually sunspots appear in pairs that with respect to the sun rotation can be divided into a leading sunspot and a following sunspot. The two sunspots have usually an opposite magnetic polarity and the magnetic field is bipolar. There are also cases of single sunspot with unipolar magnetic field. The leading spot in a pair of spots show the same polarity throughout the solar cycle. In the opposite hemisphere, the leading sunspot has the opposite polarity. The leading sunspots change their polarity every 11 years according to the solar cycle ( Hale’s Polarity Law ) and reveal the changing magnetic fields that heat the sun. The sunspots have a short life compared with Jupiter spots and can last up to 100 days. The sunspot appearance and disappearance remind the behavior of Jupiter spots and in the nineteenth century researcher tried to find a common explanation to sunspots and Jupiter spots (Ref .10). The probe MDI-SOHO found using helioseismology analysis that there are plasma belts around the sun. Those plasma belts are very much like Jupiter jets stream and suggest that the solar cycle drive those plasma belts by inducing current around the sun. Despite the high conductivity of the sun, and that this conductivity tends to shield electric fields by the Debye Shielding, the plasma belts are charged by pinch effect. The changing magnetic fields of the solar cycle supply energy and create electric currents that prevent the electric charges and electric fields of the belts from decaying. The probe MDI-SOHO also showed that the sunspots appear on the boundaries of the plasma belts. This indicate that just like Jupiter spots which are driven by the electric potential of the jet streams the sunspots are driven by the electric potential of the plasma belts. The experiment shown in Figure 14 can be applied to both Jupiter spots and the sunspots. Deep below the sunspots, there is an electric vortex that rotates in the boundary between plasma belts (Figure 17). This rotating vortex carries electric charges and create electric current that work like a solenoid to produce the magnetic field that characterize sunspots. There is helioseismology analysis of sunspots; however, this analysis can only show the surface behavior of the sunspots and not the deeper vortexes that drive the sunspots. It is known that the magnetic field of the sunspots can go to depth of 10,000 km. Usually, sunspots come in pairs of a leading and following sunspots. Such pair requires two vortexes that rotate in opposite directions similar to nearby vortexes in the experiment of Figure 14. Observation shows that the leading sunspot appears first and then after a day or two the following sunspot appears. This suggests that the second vortex was created by the magnetic field of the first vortex to close a magnetic circuit. The electric vortexes below the sunspot can explain the diverse angle or tilt between the leading and following sunspots. The sunspots vortexes move around similarly to the
142

observed movement of Jupiter spots. This movement creates the diverse tilt between the leading and following sunspots.
Figure 16 - Since the nineteenth century researchers suspected that there is a relation between Jupiter spots and the sunspots. The helioseismology research by probe MDI-SOHO revealed the existence of plasma belts and that sunspots form on the boundaries of those plasma belts. This suggests that the sunspots formation is similar to Jupiter spots formation and that the plasma belts develop electric charge that creates vortexes as shown in the experiment in Figure 14. In those vortexes, electric charges are circulating and creating a strong magnetic field that appears on the sun surface as sunspot.
143

Figure 17 - Sunspots are only found on the boundaries of plasma belts, which suggest that they are electric vortexes similar to Jupiter GRS. The plasma belts are electrically charged by the solar cycle and this charge create an electric potential between adjacent belts that provide energy for the electric vortexes. As the electric vortex rotates, the electric charges inside it rotate with it and produce a magnetic field. This is similar to the magnetic field created by electric current flowing in the windings of a solenoid. The magnetic field from the electric vortex extends to the surface and creates the familiar look of the sunspot. The butterfly diagram (Figure 18) shows the latitude of sunspots against their emergence time. Each solar cycle in the diagram looks like a butterfly. At the beginning of the solar cycle the sunspots appear at high latitudes around 30 degrees, and as the solar cycle evolve the sunspots appear lower near the equator. This behavior can be explained by the plasma belts. The plasma belts at higher altitude are smaller, they have a smaller diameter and they are narrower. As the changing magnetic fields of the solar cycle start to induce currents, the higher plasma belts due to their small size evolve faster. They gain rotational speed around the sun faster and they absorb electric charge by the pinch effect faster. The electric charge of the higher plasma belts increase faster and the sunspots that depend on the electric potential emerge faster. The lower belts are heavier, they have larger diameter and they are wider. It takes more time to charge the lower belts so the sunspots at the lower latitudes appear later on. At the end of the solar cycle the lower latitude belts gain higher speed around the sun and their electric charge increase; this enable them to conduct stronger currents that absorb all the energy from the changing magnetic fields
144

and decrease the energy absorbed by the higher latitude belts. In other words, the development of the lower belts decreases the energy available to the higher belts. As the higher belts are weakened, the sunspots will appear only in the lower latitude near the equator. It is possible to depict the belt development shown in the butterfly diagram by giving the belts capacitance. The high latitude belts have smaller capacitance then the lower latitude belts. Therefore, it takes shorter time for the high latitude belts to charge and develop high electric potential to produce sunspots. Sunspots do not appear directly on the equator because the equator is occupied by a middle belt just like Jupiter EZ jet stream. This belt is considerably wide and the sunspots can only rise in the boundaries of this belt. This middle belt dominates the solar rotation and creates the differential rotation as it pushes forward the equatorial area of the sun. It is usually believed that the differential rotation is created by convection, but after a long and systematic search for massive convection plums that drive the sun differential rotation, there is no definite proof that they exist.
Figure 18 - The butterfly diagram of the sunspots shows that the sunspots appear in higher latitudes at the beginning of the solar cycle and then drift toward the equator as the solar cycle end. This behavior can be explained by the plasma belts. The plasma belts at the higher latitude has smaller diameter around the sun and smaller width. As the changing magnetic fields pass through the sun, the higher latitude belts are quickly charged by the pinch effect to produce the sunspots first. The heavier belts near the equator require longer time to charge and produce sunspots later on. As the belts near the equator are fully charged they absorb all the energy from the magnetic fields and starve the higher latitude belts, so at the end of the solar cycle there are sunspots only near the equator. Sunspot have rotation rate that depends on their latitude (Ref. 11). At high latitudes, the sunspots have high angular speed and as the solar cycle evolves, the sunspot appears at lower latitudes with small angular speed. This behavior can be explained with the size and depth of the plasma belts. At high latitudes the plasma belt are narrower and closer to the sun surface. This enables the electric vortex at the base of the sunspot to be closer to the sunspot at the sun surface. This way some of the rotation of the vortex is coupled to the sunspot. At lower latitudes, the plasma belts are bigger and the electric vortex is deeper so it is harder for it to influence the rotation of the sunspot. The changing magnetic fields are nearly sinusoidal in shape, as shown by the stellar cycle and the sunspots number recorded during the last 300 years. According to Faraday’s law,
145

there is a phase shift of 90 degrees between the changing magnetic fields and the induced electric potential. The electric potential lags 90 degrees behind the magnetic field. The electric potential is at its pick when the variation in magnetic field is the highest. At this point, the magnetic field is near zero and changes its polarity. This is also observed in the sun, as in the point of solar maximum, when the magnetic activity and the sunspot number is the highest, the sun reverses the polarity of its magnetic dipole. Stellar rotation is driven by the plasma belts and the stellar cycle Analyzing the jet streams of Jupiter, reveal the connection between the changing magnetic fields or stellar cycle and stellar rotation. Jupiter has large mass 318 times the mass of Earth, and despite its enormous size, it rotates very fast and completes a rotation in about 10 hours. There are forces that operate to slow the rotation of Jupiter for instance, tidal effects with the sun and Jupiter moons and drag from the solar wind. Jupiter exists for billions of years, so there must be a process that drives Jupiter rotation and prevents it from slowing despite the resistance. The changing magnetic fields of Jupiter rotate the jet streams around the planet and their flow drag the rest of the planet with them. The changing magnetic fields of Jupiter supply the energy from the galactic disc that drives the rotation of the planet. Jupiter also exhibit differential rotation mainly from the fast rotation of the EZ middle jet. The stellar rotation is similar to Jupiter rotation. The internal structure of the sun was analyzed by helioseismolgy and revealed Plasma belts that resemble the jet streams of Jupiter (Figure 19). Those plasma belts are created by the solar cycle. As the changing magnetic fields cross the sun parallel to the rotation axis, they induce electric current according to Faraday’s law that flow parallel to the equator. Those electric currents create the plasma belts similar to the creation of the jet streams on Jupiter. When electric current flow in a conductor the flowing electric charges has very low speed of the order of ten millimeters per second. This is called the drift speed of electric charges. It is clear that this drift speed is much slower then the speed given to charges at the EZ middle jet by the rotation of the planet. The rotation speed of the planet increases the pinch effect of the jets because, the jets are electrically charged and moving charges create magnetic fields. In this way, the magnetic field and magnetosphere of Jupiter is produce by the fast rotation of the charged jet. Jupiter rotation can be understood by analyzing the EZ middle jet that its mass and size has the largest effect on the planet rotation. The changing magnetic field has a sinusoidal wave form; it is repeatedly increasing and decreasing in strength. When the magnetic field is increasing, the EZ middle jet rotates faster then the rotation speed of the planet. When the magnetic field is decreasing, the EZ middle jet rotates slower then the planet. When the EZ middle jet is flowing faster, the pinch effect of the EZ middle jet is stronger. The stronger pinch effect attracts additional positive charges and repels negative charges. This increases the overall charge of the EZ jet. When current is flowing in this
146

highly charged EZ jet, it is using mainly the positive charges flowing forward and there are few negative charges flowing backward. The gas of the EZ jet will accelerate forward by the flow of only positive charges forward and lack of negative charges that flow backward. When the planet stellar cycle flip, the changing magnetic field is decreasing, the EZ middle jet rotate slower to slow the rotation of the planet, but the pinch effect is weaker due to the slower rotation and there are more negative charges that resist the flow of the gas. Therefore, the forward push of the EZ middle jet when the magnetic field is increasing is stronger then its backward push when the magnetic field is decreasing. The similarity between Jupiter jet streams and the sun plasma belts suggest that stellar rotation is based on a similar process. The equatorial or middle plasma belt in stars, change the polarity of its electric charge, when the changing magnetic fields change their direction. In stars, both the increasing and the decreasing parts of the changing magnetic fields push the rotation forward. When the changing magnetic fields are increasing, the positively charged belts increase their charge by the pinch effect and the negatively charged belt loses some of their charge. The more concentrated positive jets are therefore pushing forward stronger then the negatively charge jets are pushing backward. When the changing magnetic fields are decreasing, the negatively charged belts increase their charge by the pinch effect and the positively charged belt loses some of their charge. The more concentrated negative jets are therefore pushing forward stronger then the positively charged jets are pushing backward. The differential rotation of the star is caused when the middle plasma belt near the equator is pushing forward while the rest of the star is pulling back by its inertia. Some stars exhibits anti-solar differential rotation where the equatorial region rotate slower then the Polar Regions. This reverse differential rotation can be explained by analyzing Jupiter rotation. When the changing magnetic fields of Jupiter are increasing, the differential rotation is regular and the equatorial region is faster. When the changing magnetic fields are decreasing, the differential rotation is reversed and the equatorial region is slower. This could be happening in stars when the main belt is not changing its electric charge polarity as the changing magnetic fields change direction. This way the main belt is pushed backward by the changing magnetic fields.
147

Figure 19 - The Sun has plasma belts that resemble Jupiter jet streams. The solar cycle and the changing magnetic fields that flow through the sun, drive electric current around the sun. This electric current produces the plasma belts that like Jupiter jet streams develop electric charges by the pinch effect. The rotation of the sun and other stars is driven by the flow of the plasma belts. The main plasma belts near the equator rotate faster then the rotation of the sun so they increase the rotation speed of the star. The electric current that drive the main belt is driving the rotation of the sun and at the same time create the differential rotation. Stars are born from red dwarfs. As the red dwarf is heated by the changing magnetic fields, it converts energy to mass. This new mass is increasing the mass of the star, and promoting it along the main sequence. If the mass of the star is increasing, the gravity pull of the star is increasing and the density of the core is also increasing. To increase the core density mass is flowing from the outer layers of the star to the core. This is like the rotating ice skater that pulls her arms inward and her angular speed is increasing. The mass that flow to the core of the star increase its angular speed. The contribution of the mass falling inward to the stellar rotation is smaller then the contribution of the changing magnetic fields and stellar cycle. The mass that is created in the star is also increasing its angular momentum. The axis of rotation of the star will incline toward the direction of the changing magnetic fields of the stellar cycle that create its stellar rotation. This inclination is created as the electric current and the middle ring flow will tend to be perpendicular to the magnetic fields. This can explain the diversity in the rotation axis of the solar system planets.
148

Arguing that the stellar rotation is caused by magnetic fields seems at first glance to contradict the conservation of angular momentum. The star floating in space seems to rotate by itself without any force acting on it. However, the source of the rotation is electrical in nature. This is similar to an electron placed in an electric field. The electron seems to accelerate by itself as no other object is pushing it. However, it is the electric force that pushes it. Similarly, the changing magnetic fields create electric field that circle the star and accelerate charges around to create the stellar rotation. The uniformity of rotation in the solar system is caused by the solar wind The solar system was born according to the common belief from a contracting solar nebula; however, this idea is incorrect. There are many difficulties in explaining how a dust cloud is contracting and turn into a solar system. According to the concept of this article, the origin of the solar system is different. The stars energy is from magnetic fields in the galactic disc and they convert energy to mass. The star mass is increasing and small stars are turn in billions of years to heavier stars. The sun and similar stars were born from red dwarfs, and in billions of years of converting energy to mass, their size grew and it reaches the size of a massive star like the sun. As the star is getting older, its mass is increasing and it is promoted along the main sequence. The Hertzsprung-Russell diagram represents not only the relation of luminosity and temperature of many stars but also the development of a single star as it grows from a red dwarf by the changing magnetic fields. Blue giants are therefore much older than red dwarfs. The sun and the planets rotate in the same direction and all the planets orbit the sun in the same direction. This is attributed incorrectly to the creation by the solar nebula. Since the solar nebula rotated as one body in the same direction, it gave the sun and planet the same rotation direction. If there was no solar nebula, then why is the uniformity in the rotation direction of the planets? The solar wind is the cause of the uniformity in rotation direction of the planets (Figure 20). The sun by its strong gravity attracts large amount of cosmic dust that falls to the planets; there is about 40 tons of dust that fall to the earth each day. This dust as it is headed toward the sun is falling on the planets mainly on the side that is opposite to the sun direction. The dust is also drifted by the magnetic field of the solar wind and by impacts between the solar wind particles and the dust. Combining the fact that the dust is falling on the planets only on the side opposite to the sun with the fact that the dust rotate in the same direction as the sun, apply a torque on the planets. This torque exerted along billions of years gives the planets the same rotation direction. There is also drag between the planets and the solar wind that push forward the planets in their orbit around the sun and at the same time brake the rotation of the sun. The interaction between the solar wind and the cosmic dust is also the source of the uniformity of the orbits of the moons around their planets. When the moon is opposite to the sun, the cosmic dust hits it and pushes it forward. When the moon is between the
149
planet and the sun, the planet attracts all the cosmic dust and the moon is not pushed. This way there is a torque that rotates the moons in the same direction. During the development of the solar system object that were captured from outside the solar system and by chance got into a reverse orbit where lost. Large asteroids that were captured by the sun in orbit opposite to the rotation of the solar wind got their rotation speed around the sun to gradually decrease until they fell to the sun. Similarly, asteroids that were captured by planets and rotated in the wrong direction fell to the planets. Objects that fit the rotation of the solar wind continued to exist as their rotation speed was sustained by the solar wind. It is well known that the retrograde rotation of Venus is due to the tidal effect between the nearby sun and Venus atmosphere. Retrograde rotation in general can also be induced by magnetic influence (Figure 21). The magnetic influence on rotation can affect other bodies like binary stars that include a main sequence star and a neutron star. Tidal effects can also influence the orbits of planets and moons; earth rotation affects the orbit of the moon and increases the distance between the earth and the moon by 3 cm each year. The rotation of earth is slowing down while the moon is speeding up.
150

Figure 20 - The solar system was not created by a solar nebula. The match between the sun rotation direction (denoted 1 in the image) and the planets rotation direction (2) is caused by the solar wind (denoted in the image by the curved lines emanating from the sun). The solar wind rotates in the same direction as the sun and all cosmic dust particles that are falling to the sun are drifted by the movement of the solar wind to have an angular speed around the sun. The dust is falling on the planets only from the side that is opposite to the sun (3). Therefore, the dust that is falling on the planets applies a small torque that over billions of years creates the uniformity in the rotation direction.
151

Figure 21 - There are three ways that a heavier body like a star can cause a retrograde rotation on a smaller object like a planet. (a) Tidal effect – The star is squeezing the planet and its atmosphere to apply a torque on it. (b) The star is a conductor while the planet produce magnetic filed that diverges from its rotation axis. (c) The star has a magnetic field that diverges from its rotation axis and the planet is conducting. Rotation of the galaxy Galaxies are born by other galaxies. Some of the globular clusters detach from the galaxy they are bound to and turn into separate galaxies. The energy cycle of the galaxy produce mass and energy that increase the mass and energy of the galaxy. The globular clusters absorb some of the mass and energy to get bigger and then to detach from the main galaxy. New galaxies are born from those globular clusters. Those new galaxies start with small mass and slowly during billions of years increase in size and mass. The angular momentum of the spiral galaxies is also increasing. The new born galaxies have small angular momentum while the older and more massive galaxies have larger angular momentum. Usually when an object angular momentum is increasing there should be a torque exerted on it from the outside. Such outside torque is not found for galaxies, there is no outside object that applies torque to increase the angular momentum of the spiral galaxies. As in the case of stellar rotation, the rotation of the galaxy is not given to it when it is born but is the result of forces during the life of the galaxy. The angular momentum of the galaxy is increasing from internal forces in contrast to the conservation of angular momentum. The galaxy does not conserve mass and energy - the mass and energy in the galaxy are increasing. The mass increase of the galaxy also increases its angular momentum. Two factors increase the angular momentum of the galaxy. The first is the mass increase of the stars. As the stars absorb energy from magnetic fields and convert this energy to mass, the mass of the star increase. The angular momentum of the galaxy depends on the mass of the stars as in:
152

2Galaxy i i i
iL m r ω= ∑
Where L is the angular momentum of the galaxy, mi is the Mass of a star in the galaxy,
ri is the distance of the star form the galactic center and iω is the angular speed of the star around the galaxy.
If many of the stars masses are increasing, the angular momentum of the galaxy is also increasing. Some of the mass created by the stars is ejected as solar wind to the galactic disc and turn into gas and dust. The solar wind mass has on average the same angular speed as the star that created it around the galactic center. Some of the solar wind mass starts to drift towards the SMBH and in a long process falls to the SMBH. The solar wind mass has certain angular momentum and as it falls to the SMBH it conserve its angular momentum by increasing its angular speed. The increase in the angular speed of the gas and dust is absorbed in the galactic disc to apply torque on the galactic disc and to increase its angular speed. This is similar to the ice skater that spins on the ice and pulls his arms toward his body to spin faster. The arms are comparable to the solar wind and dust and the skater body is analogous to the galactic disc. The falling dust transfers its angular momentum to the galactic disc. While the dust angular momentum decrease the galactic angular momentum increase. The falling dust, as the ice skater arms, does not change the angular momentum of the galaxy but tend to increase the angular speed by decreasing the moment of inertia. The second factor that increases the angular momentum of the galaxy is the accretion disc of the SMBH. As matter spiral into the black hole and approach the event horizon, the particles reach relativistic speeds. The mass of the particles increase and their angular momentum is also increasing. The increase of the angular momentum of the inner part of the accretion disc is transmitted to the outer parts of the accretion disc and to the galactic disc by magnetic fields. If the spiral galaxies angular momentum is always increasing and there is nothing to stop them, their rotational speed would rise to a level that they would break up. The following factors limit the rotational speed of the galaxy to keep their integrity:
1. As the galaxy rotates faster, more dust is thrown to the intergalactic medium instead of falling to the SMBH. This lowers the energy production of the galaxy and thereby its rotation speed.
2. As the galaxy rotate faster, the stars get more distant from the SMBH and the galactic disc is getting thinner. As the galactic disc is getting thinner, the stars get less magnetic fields and eject less dust.
3. Nearby galaxies brake the rotation of the galaxy as magnetic fields from the rotating galaxy are crossing the nearby galaxies. The rotating galaxy induces currents in the nearby galaxies that according to Lenz’s Law oppose the rotation of the magnetic fields and brake the galaxy.
153

The fact that nearby galaxies brake the rotation of the spiral galaxy also means according to Newton second law, that that the spiral galaxy apply force in the opposite direction that pushes away the nearby galaxies. This repulsion between the galaxies, which emanate from the rotation of spiral galaxies, drives the expanding universe. Therefore, we can enumerate four reasons that lead to the expanding universe:
1. The number of galaxies is rising as new galaxies are born. 2. The size, mass, and magnetic fields of existing galaxies are increasing. 3. The rotation of spiral galaxy repel nearby galaxies by magnetic drag. 4. Matter is easily created in the universe mainly in stars interior. However, there is
no process that can easily destroy matter. Even in black holes, the falling matter is not destroyed and its mass is added to the mass of the black hole. In the rare occasions that particles like protons and neutrons are destroyed (for instance in particle accelerators), the process is so energetic that the total mass is increasing.
Spiral galaxies without nearby galaxies to brake them will rotate faster and will show thin and elongated galactic disc from edge on view. If there are too many galaxies around a spiral galaxy its rotation will slow down and its diameter will shrink. Lenticular galaxies are found only in cluster of galaxies; they are spiral galaxies that nearby galaxies brake their rotation and cause their edge on shape to be less elongated. Spiral galaxies need more space then elliptical galaxies and they also push away other galaxies. This can explain the fact that galaxy clusters show more elliptical galaxies than spiral galaxies. The elliptical galaxies do not push away other galaxies and by that, they keep the integrity of the galaxy cluster. The fast rotation of the galactic disc tends to push outward material like gas and dust in the galactic disc, so this gas and dust must bypass the galactic disc in order to reach and fall to the SMBH. To bypass the galactic disc the gas must flow above and below the galactic disc. NASA Far Ultraviolet Spectroscopic Explorer (FUSE) satellite found that the galaxy has a hot gas circulating below and above the galactic disc, this idea known as the “Galactic Fountain” was first presented nearly 45 years ago by the astronomer Lyman Spitzer. The Galactic Fountain is the mechanism by which gas and dust from the galactic disc flow toward the SMBH and later fall to it to supply energy to the galaxy. The Tully Fisher relation indicates a link between the galaxy luminosity and its rotation speed. It is incorrectly believed that the basis for this relation is the mass of the galaxy. In heavier galaxies there are more stars that produce more light and the rotation of the galaxy depends on the mass of the black matter in the galaxy halo. This is incorrect since there is no black matter, and the flat rotation curve is created by the changing magnetic fields in the galactic disc. The black matter associated with galaxy clusters is also due to magnetic forces between galaxies. Both the luminosity and rotation of the galaxy depends on the strength of the changing magnetic fields. Strong magnetic fields heat the stars to increase the luminosity in the galaxy and also rotate the galaxy faster as shown in Fig. 7 in Ref. 1. Galaxies that have stronger luminosity and faster rotation are growing faster; the stars mass is increasing and new stars are born. This leads to the spawning of new galaxies.
154

Spawning of new galaxies is based on globular clusters In reference 1, it was shown that galaxies spawn new galaxies using the arms of spiral galaxies. The magnetic fields in the galactic disc supply energy to stars, which get heated, and in their interior, they convert part of the energy to mass. The energy from the magnetic fields also triggers the birth of new stars especially in the galactic arms. It was suggested that the far edges of the galactic arms are getting heavier from the mass increase of the stars. Those arm edges then detach from the inner part of the arm to create new galaxy. However, this spawning mechanism is incorrect. The spawning of new galaxies is not based on the detachment of the galactic arm; if this process is at all possible, it is extremely rare. The spawning of new galaxies is accomplished by globular clusters. Globular clusters are found in large numbers in every galaxy. Spiral galaxies show globular clusters especially in the galactic halo. Elliptical galaxies show globular clusters in there outer edge. Figure 22 shows the giant elliptical galaxy M87 at the heart of the Virgo cluster. The picture shows many globular clusters at the outer edge of the galaxy. Some of those globular clusters will turn into dwarf galaxies and will depart from the main galaxy. The dwarf galaxies will increase in size and mass and will produce stronger magnetic fields that will repel the dwarf galaxy from the main galaxy M87. Of course, not all globular cluster will turn into galaxies, only those with preferred position and energy production will turn into galaxies. The giant galaxy M87 that lay at the heart of the Virgo cluster could be the ancestor of many of the galaxies in the Virgo cluster. The Milky Way that resides at the edge of the Virgo cluster and is considered to be part of it could also be a descendant of M87. There are much evidence of star groups that their size and position cannot clearly classify them as globular cluster or dwarf galaxies instead, they lay on the boundary between globular clusters and dwarf galaxies. Those star groups are an evolutionary link between globular galaxies and dwarf galaxies. They confirm that globular clusters are evolved first into dwarf galaxy and later into fully grown galaxies. Willman et al (2005) report on such star group found in the Milky Way that its properties place it between globular clusters and dwarf galaxies. The globular clusters include a black hole at their center. At the early age of the globular cluster it has low mass and it is relatively close to the main galaxy. At this early stage, the globular cluster cannot supply its own energy consumption and it using the main galaxy to supply its energy. Dust and gas from the main galaxy is captured by the globular cluster black hole and by the dynamo effect is converted in the accretion disc to changing magnetic fields that heat the stars in the globular cluster. When the globular cluster is getting bigger, it can internally supply its energy demand. At this stage, there are a large number of stars that produce gas and dust that fall into the black hole where they are converted to magnetic fields. At the same time, the magnetic field of the globular cluster is getting stronger and this repels the globular cluster from the main galaxy. Globular clusters have intermediate mass black holes. Hubble telescope images show those black holes in the center of globular clusters M15 and G1. The evolution of Globular clusters to elliptical galaxies is a natural process since both of them have the same shape, but to evolve into full size spiral galaxies globular clusters must first transform to dwarf
155

irregular galaxies. Gravitational pull from nearby galaxy may distort the structure of the dwarf galaxy turn it into irregular galaxy and then to spiral galaxy. The Magellanic Clouds are irregular dwarf galaxies that may turn into spiral galaxies. There are about 200 dwarf galaxies in the Local Group most of them born from galaxies in the Virgo cluster. The mass of black hole at the center of galaxies and globular cluster indicate the age of the galaxy or the globular cluster. The black hole accretes material during the life of the galaxy. Longer living galaxies capture more material by the black hole to increase its mass. The birth of new galaxies is not happening one galaxy at a time but many globular clusters are supported at the same time to spawn new galaxies. The number of globular clusters in a galaxy depends on the mass of the galaxy; heavier galaxies have more globular clusters. For instance, the Milky Way has about 150 globular clusters, the Andromeda galaxy has 500 and M87 about 10,000. This suggests that the mass and size of the galaxy determine the rate at which it creates new galaxies. Giant galaxies spawn new galaxies faster.
Figure 22 - This is an image of M87 a giant elliptical galaxy in the Virgo Cluster. Many of the point sources around the galaxy are globular clusters. Some of those globular clusters will evolve into new galaxies and will distance from the main galaxy M87 by magnetic repulsion. Many of the Virgo Cluster galaxies are descendent of M87. It is very likely that the Milky Way galaxy, a member of the Virgo cluster, is also a descendent of M87.
156

Conclusion Changing magnetic fields are spread by the SMBH in the galactic disc. Those magnetic fields affect many aspects of the galaxy including its shape and development. The magnetic fields supply energy to the stars and influence the stars in many ways: they heat the stars, they drive the stellar rotation, they increase the star mass; and they increase the speed of the star around the galactic center to give the flat rotation curve of the galaxy. The stars start their life as a red dwarfs with low mass and low angular speed, as the stars get older they evolve along the main sequence and gain mass and angular speed from the changing magnetic fields. Both high mass and fast stellar rotation are attributes of older stars. The changing magnetic fields that drive the solar cycle are not limited only to stars but interact also with planets. Jupiter has a stellar cycle that drives its jet streams and its spots, which are electrical in nature. The solar cycle drive plasma belts around the sun. Those plasma belts are electrically charged, and they create electric vortexes in the form of sunspots. The plasma belts create the solar rotation as the middle plasma belt is pushed forward by the solar cycle. The middle plasma belt also creates the differential rotation as it pushes forward the equatorial region of the sun. References
24. Bar-Zohar, D. (2006). The sun energy source is not nuclear fusion, but magnetic fields from the center of the Galaxy. The sun converts energy to mass and not mass to energy. PHILICA.COM Article number 65. http://www.philica.com/display_article.php?article_id=65
25. Bar-Zohar, D. (2008). The sun produces muon neutrinos flux without neutrino oscillations. PHILICA.COM Article number 126. http://www.philica.com/display_article.php?article_id=126
26. S. L. Baliunas et al Chromospheric variations in main-sequence stars II, 1995, ApJ, 438, 269B,.
27. The Giant Planet Jupiter, J. H. Rogers, Cambridge University Press 1995. 28. Donahue, R. A. and Baliunas, S. L. 1992a, Sol. Phys., 141, 181. 29. Hartmann, L., Bopp, B. W., Dussault, M., Noah, P. V., & Klimke, A. 1981, ApJ,
249, 662. 30. Stellar Rotation, J. Tassoul, Cambridge Univerity Press 2000. 31. Solar and Stellar Magnetic Activity, C. J. Schrijver C. Zwaan, Cambridge
Univerity Press 2000. 32. Jupiter and How to Observe It, John W. McAnally, Springer 2008. 33. The Story of the Solar System, G. Chambers, McCluer 1895. Page 118. 34. Godoli G., Mazzucconi F., Piergianni I., Sunspot rotation rates along the butterfly
diagram, Solar physics, 1993, vol. 148, n2, pp. 195-200.
157

35. Hartmann, L., Dussault, M., Noah, P. V., Klimke, A., & Bopp, B. W., Evidence for a starspot cycle on BD +26 deg 730, Astrophysical Journal, Part 1, vol. 249, Oct. 15, 1981, p. 662-665.
36. Joint Evolution of Black Holes and Galaxies (Chapter 1.7), M. Colpi, et al., Taylor and Francis, 2006.
37. Willman B. et al 2005 http://arxiv.org/abs/astro-ph/0410416v2 . Wednesday, January 7, 2009
158