from stability to permeability of adhesive emulsion bilayers · from stability to permeability of...
TRANSCRIPT

From Stability to Permeability of Adhesive Emulsion BilayersAbdou R. Thiam,* Nicolas Bremond, and Jero me BibetteUPMC Universite Paris 06, CNRS UMR 7195, ESPCI ParisTech, 10 rue Vauquelin, 75231 Paris, France
ABSTRACT: Water drops dispersed in chloroform and stabilized withphospholipids become adhesive if a bad solvent for lipids, such as siliconeoil, is added to the continuous phase. In this way, two sticking drops areseparated by a bilayer of phospholipids. By using microfluidictechnologies, we probe the stability and properties of such membraneslikewise encountered in foams or vesicles. We first establish the stabilitydiagram of adhering drop pairs as a function of the continuous phasecomposition. We found two regimes of destabilization of the bilayer. Thefirst one concerns a competition between the dynamics of adhesion andthe transport of surfactants toward the interfaces that leads to a dilutesurfactant coverage. The second one corresponds to a dense surfacecoverage where the lifetime distribution of the bilayer exponentiallydecreases as a signature of a nucleation process. In the stable regime, weobserve the propagation of adhesion among a concentrated collection of drops. This is another remarkable illustration of thesuction consequence when two close deformable objects are pulled apart. Moreover, the present experimental strategy offers anovel way to study the phase diagrams of bilayers from a single phospholipid to a mixture of phospholipids. Indeed, we detectphase transitions at a liquid−liquid interface that are ruled by the amount of bad solvent. Finally, we probe the transport of watermolecules through the bilayer and show that its permeability is linked to the adhesion energy that reflects its fluidity.
■ INTRODUCTIONThe interaction between close interfaces is a widespreadphenomenon1,2 whose understanding is, for example, crucial forcontrolling the stability of colloidal solutions or thin liquidfilms. For emulsions or foams, a common way to stabilize suchsystems is to add surface active agents that delay thecoalescence of neighboring drops or bubbles. Inverse emulsionsare known to easily become adhesive3 and therefore lead to theformation of a surfactant bilayer between drops. The stabilityand properties of such bilayers are of great interest becausemodel membrane bilayers have been intensively prospectedsince many years now, most of the time for the sake ofreconstituting biological membranes that are composed by amatrix of phospholipids.4 Using inverse emulsion droplets toform such bilayers has already been achieved.5,6 For mimickingpurpose, the main parameter to control is the fluidity state ofthe bilayer that monitors many of the membrane properties7,8
such as its permeability to molecules. For example, watermolecules, which exhibit a high permeability to liposomemembranes in the fluid phase state, are much less permeable tothem in the gel phase. Likewise, ions or big polar molecules areweakly permeable to them9,10 in both cases. One of theadvantages to working with adhesive emulsions is the possibilityof modifying the bilayer fluidity by tuning the adhesion energyvia the continuous phase composition.11
In this paper, the stability and properties of phospholipidbilayers are probed by combining the use of adhesive emulsionsand microfluidic technologies. When water drops are dispersedin an organic solvent and stabilized with surfactants, theybecome adhesive once a bad solvent for the surfactants is added
to the continuous phase. Such adhesive inverse emulsions havebeen achieved by using a mixture of ether, a good solvent of thephospholipids, and silicone oil, the bad solvent.5 Thisformulation favors the formation of surfactant bilayers at theexpense of monolayers. There are other ways to form adhesiveemulsion,6,12,13 but the former one is a versatile and easyformulation. Moreover, the generated membrane has thetargeted bilayer configuration leading to an interaction of thehydrophobic tails. As a matter of fact, bulk experiments usuallylead to average measures, and the interaction between twoobjects is difficult to monitor. A dual micropipet setup can beemployed to probe the interaction between two emulsion dropsthat may adhere or not.14,15 As previously demonstrated, theuse of microfluidic technology offers efficient means toquantitatively probe the stability of an emulsion at the levelof a drop pair16,17 or a collection of drops.18,19 Thisexperimental approach allows one to produce calibratedemulsion drops20 and more importantly to uncouple theformation and the destruction steps of the emulsion. Here, wefollow the same strategy in order to create isolated adhesivedrop pairs11 and then to characterize the bilayer properties.Along that way, we first investigate the stability of the
emulsion as a function of the phospholipid concentration andthe mass fraction of bad solvent. Two regimes of destabilizationof the bilayer are found. These regimes are linked to thesurfactant coverage that is either dilute or dense. For high
Received: January 22, 2012Revised: March 15, 2012Published: March 22, 2012
Article
pubs.acs.org/Langmuir
© 2012 American Chemical Society 6291 dx.doi.org/10.1021/la3003349 | Langmuir 2012, 28, 6291−6298
concentrations of bad solvent, the phospholipids becomeinsoluble in the oil mixture, and the emulsion spontaneouslydestabilizes precluding any adhesion. Then, we study the phasediagrams of bilayers that are composed of a single phospholipidand a mixture of phospholipids. We observe phase transitions ata liquid−liquid interface that are ruled by the amount of badsolvent. Finally, we probe the transport of water moleculesthrough the bilayer as a function of the adhesion energy thatreflects its fluidity.
■ MATERIALS AND METHODS
Adhesive inverse emulsions are formed following the footstepsof the work of Poulin et al.5 Here, the organic phase iscomposed by a mixture of silicone oil, having a viscosity of 50mPa.s and a density of 0.965, and chloroform for dispersing thephospholipids. We use three kind of phospholipids (AvantiPolar Lipids): 1,2-dihexadecanoyl-sn-glycero-3-phosphocholine(DPPC), 1,2-dipalmitoleoyl-sn-glycero-3-phosphocholine((Δ9-Cis)PC) and 1-palmitoyl-2-(12-[(7-nitro-2-1,3-benzoxa-diazol-4-yl)amino]dodecanoyl)-sn-glycero-3-phosphocholine(NBD-PC). Contrary to the previous formulation,5 chloroformis preferred to diethyl ether to play the role of the good solventbecause it is less volatile and swells less poly(dimethylsiloxane)(PDMS) microfluidic devices. Chloroform also has a high vaporpressure, and therefore working in hermetic circuits is anecessary condition to control the continuous phasecomposition. Moreover, even though the continuous phasecontains enough surfactants to ensure a fast and full covering ofthe water droplets, above the critical micellar concentration, theadhesive emulsion is still highly unstable and breaks downwithin a few seconds. The presence of 150 mM of MgSO4 (ordown to 4 mM) in water droplets tremendously increases theirlifetime5,21 to more than a day.Emulsion droplets are first formed in glass capillaries using
the flow focusing technique22 as presented in Figure 1a. Tworound glass capillaries of 1 mm outer diameter are stretchedand then cut with a microforge. The left capillary in Figure 1a is
used for the aqueous phase injection and has a 80 μm aperturediameter, the right one sets for the main flowing channel and is200 μm in diameter. The two round capillaries are embedded ina square glass capillary of 1 mm internal edge and separated bya distance of 100 μm (all capillaries are purchased fromVitrocom). The organic phase flows through the corners of thesquare capillary. To prevent any leakage, a high solvent resistantglue (Loctite glue, Manutan) is used for assembling the glasscapillaries and tubes for liquid injection. In addition, to preventany the wetting of water on glass walls, the capillaries aresilanized with an octachloro(trimethyl)silane (Sigma) after aplasma cleaning. Thus, as soon as the different flows meet at themouthpiece, water drops are regularly formed as shown inFigure 1a. Furthermore, we use PDMS devices because it is alow cost way to easily design drop traps used for observationsof long duration. Moreover, since chloroform can evaporatethrough the PDMS matrix, the oil composition can be modifiedon-chip. We finally note that all experiments are performed atroom temperature.
■ RESULTS AND DISCUSSION
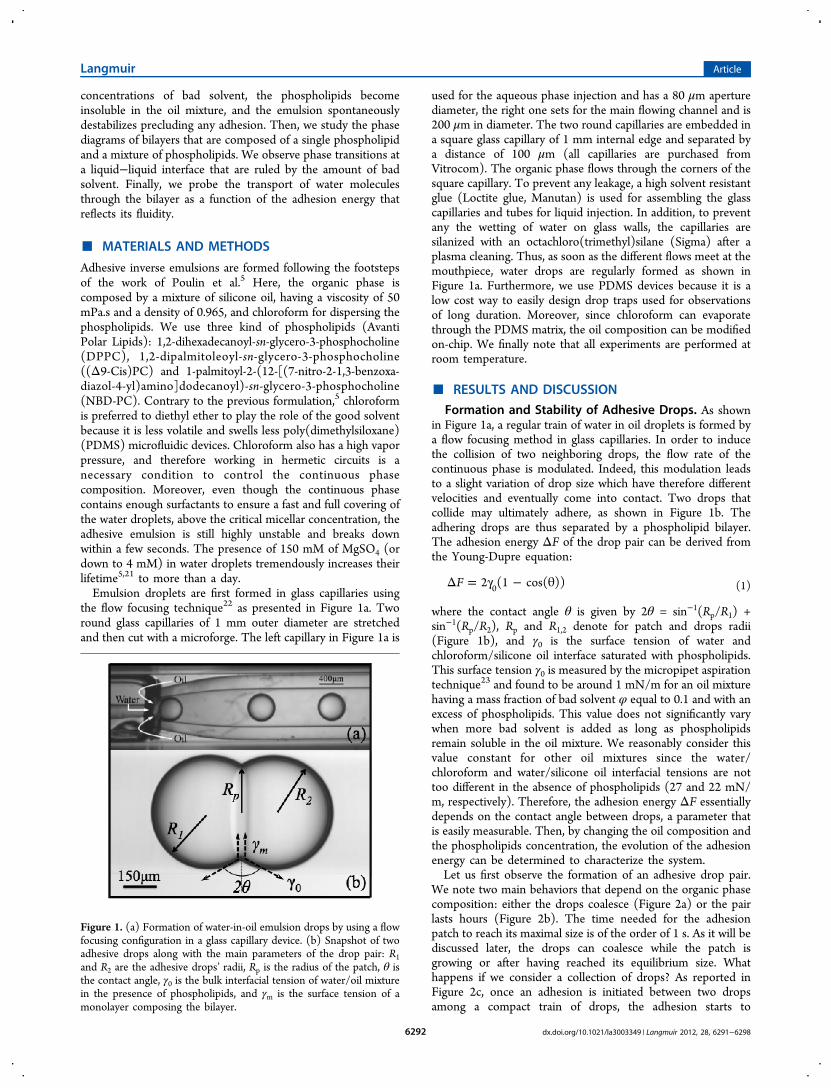
Formation and Stability of Adhesive Drops. As shownin Figure 1a, a regular train of water in oil droplets is formed bya flow focusing method in glass capillaries. In order to inducethe collision of two neighboring drops, the flow rate of thecontinuous phase is modulated. Indeed, this modulation leadsto a slight variation of drop size which have therefore differentvelocities and eventually come into contact. Two drops thatcollide may ultimately adhere, as shown in Figure 1b. Theadhering drops are thus separated by a phospholipid bilayer.The adhesion energy ΔF of the drop pair can be derived fromthe Young-Dupre equation:
Δ = γ − θF 2 (1 cos( ))0 (1)
where the contact angle θ is given by 2θ = sin−1(Rp/R1) +sin−1(Rp/R2), Rp and R1,2 denote for patch and drops radii(Figure 1b), and γ0 is the surface tension of water andchloroform/silicone oil interface saturated with phospholipids.This surface tension γ0 is measured by the micropipet aspirationtechnique23 and found to be around 1 mN/m for an oil mixturehaving a mass fraction of bad solvent φ equal to 0.1 and with anexcess of phospholipids. This value does not significantly varywhen more bad solvent is added as long as phospholipidsremain soluble in the oil mixture. We reasonably consider thisvalue constant for other oil mixtures since the water/chloroform and water/silicone oil interfacial tensions are nottoo different in the absence of phospholipids (27 and 22 mN/m, respectively). Therefore, the adhesion energy ΔF essentiallydepends on the contact angle between drops, a parameter thatis easily measurable. Then, by changing the oil composition andthe phospholipids concentration, the evolution of the adhesionenergy can be determined to characterize the system.Let us first observe the formation of an adhesive drop pair.
We note two main behaviors that depend on the organic phasecomposition: either the drops coalesce (Figure 2a) or the pairlasts hours (Figure 2b). The time needed for the adhesionpatch to reach its maximal size is of the order of 1 s. As it will bediscussed later, the drops can coalesce while the patch isgrowing or after having reached its equilibrium size. Whathappens if we consider a collection of drops? As reported inFigure 2c, once an adhesion is initiated between two dropsamong a compact train of drops, the adhesion starts to
Figure 1. (a) Formation of water-in-oil emulsion drops by using a flowfocusing configuration in a glass capillary device. (b) Snapshot of twoadhesive drops along with the main parameters of the drop pair: R1and R2 are the adhesive drops’ radii, Rp is the radius of the patch, θ isthe contact angle, γ0 is the bulk interfacial tension of water/oil mixturein the presence of phospholipids, and γm is the surface tension of amonolayer composing the bilayer.
Langmuir Article
dx.doi.org/10.1021/la3003349 | Langmuir 2012, 28, 6291−62986292

propagate along the whole train. This cascade of adhesionreminds us of the propagation of coalescence arising in aconcentrated emulsion.16,19 We have demonstrated that theseparation of two neighboring emulsion drops favors theircoalescence. Indeed, the separation leads to a pressurereduction in the interstitial film between the two drops thatinduces a bulging out of the interfaces.24−26 Therefore, the twointerfaces get locally closer, allowing coalescence or adhesion tobe nucleated. For a concentrated emulsion, the shape relaxationbetween the first drops that coalesce or adhere spontaneouslyresults in a separation with their neighboring drops, a situationthat potentially triggers further coalescence or adhesion. Thecascade of adhesion reported in Figure 2c is thus anotherremarkable illustration of the suction phenomenon, and itsconsequences, arising when two deformable neighboringobjects are pulled apart.As observed in Figure 2, the bilayer lifetime depends on the
phospholipids concentration and the organic phase mixture.We now focus on the stability of adhesive emulsion bilayers as afunction of the formulation. In practice, for each condition,adhesive drops are formed in glass capillaries and, their stabilityagainst coalescence is followed over 5 min. If a drop pair lastlonger, then the bilayer is considered as stable, and very often itstays stable over a full day. The stability diagram for DPPC isreported in Figure 3. First, the stability of the bilayers requiresan increase of the phospholipid concentration concomitantwith the amount of bad solvent φ. Second, when the emulsionis directly formed beyond a critical bad solvent composition, φ*= 0.58, it immediately coalesces, whatever the DPPCconcentration. This critical mass fraction of silicon oilcorresponds to the solubility limit of the phospholipids in theorganic phase mixture. Indeed, the mixture whitens for φ > φ*,indicating a precipitation of the phospholipids. This observa-tion implies that there is no direct way to form an adhesiveemulsion for high bad solvent content. Third, this emulsionquenching always occurs at a bad solvent concentration forwhich a maximum contact angle of 90° is reached,independently of the phospholipid type.It is nevertheless possible to form a stable bilayer while the
concentration of bad solvent is beyond φ*. Indeed, when theadhesive emulsion is formed using a PDMS microfluidic device,the chloroform can diffuse out, and the oil composition canthus be modified on-chip. Starting for φ < φ*, the contact angle
increases whenever the flow of the continuous phase is loweredor stopped. During the evaporation of the chloroform, which isillustrated by the first image row in Figure 4, the adhesion patchis expanding until the two droplets form a spherical object. Thecontact angle θ never exceeds 90° during the evaporationprocess, which is then the maximum reachable angle. Thebilayer is then revealed by epifluorescence imaging when 1 wt% of NBD-lipids is added, as shown in the second image row inFigure 4. We also note that a further evaporation of chloroformleads to the formation of fluorescence spots on the surface ofthe drops that may indicate a coprecipitation of thephospholipids. Finally, as reported in the last image row inFigure 4, the two adhering drops having a lower contact angleare recovered when the chloroform is renewed by increasing orrestarting the continuous phase flow. In addition, one may alsonote the diminution of droplet size that indicates a water escapeduring this experiment that lasts a few minutes. Thecomposition of bad solvent in the oil phase went effectivelyover φ*. Here, this strategy based on solvent evaporation is theonly way to form stable bilayers approaching a zero surface
Figure 2. (a) Formation and destabilization of an adhering drop pair where φ = 0.15 and CDPPC = 10−3 wt %. (b) Formation of a stable adhesive pairwhere φ = 0.25 and CDPPC = 5 × 10⁻³ wt %. (c) Propagation of the adhesion in a compact train of drops. The diameter of the drops is 220 μm, andthe time for each image sequence is indicated in seconds.
Figure 3. Stability diagram of a DPPC bilayer formed between twoadhesive drops represented in the bad solvent mass fraction (φ)−phospholipids concentration (CDPPC) plane. The dashed linedelineates the frontier between the two states, i.e., (▲) stable and(∇) unstable. The critical mass fraction of silicone oil φ* beyondwhich DPPC is no more soluble is equal to 0.58, as indicated by thearrow. Above that limit, instability precludes any observation ofadhesion.
Langmuir Article
dx.doi.org/10.1021/la3003349 | Langmuir 2012, 28, 6291−62986293

tension such as vesicle membranes. Indeed, for θ = 90° andaccording to eq 1, the adhesion energy ΔF is equal to 2γ0,meaning that the surface tension γm of the monolayercomposing the bilayer is γm = γ0 − ΔF/2 = 0.What happens if the amount of surfactant is reduced? As
reported in the stability diagram in Figure 3, for a given oilcomposition, there is a critical phospholipids concentrationbelow which drops start to coalesce. In that condition, weobserve that either the drops coalesce while the adhesive patchis being formed, or they fuse after the equilibrium angle hasbeen reached. The times at which bilayers break down as afunction of the bad solvent mass fraction φ and for a fixedamount of DPPC equal to 10−3 wt % are reported in Figure 5.
For φ larger than 0.35, the drops coalesce essentially before theadhesive patch attains its maximum size. For lower φ, thelifetime of the pairs starts to span from 0.2 to 10 s. Moreinterestingly, for φ = 0.15, the lifetime of the adhering drop pairis also distributed, but it always lasts longer than the period ofbilayer formation that is on the order of 1 s.When two drops adhere, they create an additional surface
since the volume is conserved. Therefore, phospholipids mustdiffuse fast enough to the surface in order to stabilize theadhering patch during its growth. Considering a bulk diffusioncoefficient27 D = 8.10−10 m2/s and a surface concentration Γ0 =
2.10−6 mol/m2 of phospholipids in pure chloroform, anestimation of the characteristic bulk diffusion time is given by(Γ0/CDPPC)
2/D. This characteristic time is about 10 s at CDPPC= 10−3 wt % and is larger than the characteristic time of a patchformation that is below 1 s for high concentrations of badsolvent. Moreover, we expect that the characteristic diffusiontime should rise for mixtures of chloroform and silicone oilsince the viscosity increases. Therefore, the competitionbetween patch growth and transport of phospholipidspresumably explains fast destabilization of adhering drop pairsthat can occur for φ larger than 0.15 and always happen for φlarger than 0.35 (Figure 5).The second regime of fusion takes place for a low amount of
bad solvent. In that case, the bilayer has time to attain itsmaximum lateral size, but then its metastability nature manifestsitself as it starts to rupture. As shown in Figure 6a, the
distribution Nc of the coalescence time at φ = 0.15 is adecreasing function of time t. The corresponding probability tocoalesce Pc after a period of time t, i.e., Pc = ∫ 0
tNcdt, is reportedin Figure 6b. This probability is close to the probability toobserve a bilayer at a time t if the formation period, on theorder of 1 s, is neglected. The evolution of Pc is well describedby an exponential function, i.e., Pc = 1− exp(−t/τc), where τc,on the order of 13 s, can be assimilated to the mean lifetime ofthe bilayer. This exponential feature is reminiscent of anucleation process that has been observed in foam bilayers28
for low surfactant concentrations. The lifetime τc is linked tothe activation energy barrier to overcome for nucleating anunstable pore into the membrane,21 i.e., the pore expands andtherefore leads to the rupture of the bilayer. Since the activationenergy is intrinsically correlated to the surfactant layerproperties,21 the mean lifetime τc is expected to be a functionof the phospholipids concentration as well as the mixturecomposition that tunes the bilayer state as discussed in the nextsection.
Adhesion Energy Landscape. We now establish theevolution of the adhesion energy as a function of the badsolvent for two phospholipids, DPPC and (Δ9-Cis)PC, at aconcentration of 0.05 wt % and 0.1 wt %, respectively. Theseconcentrations ensure the stability of the emulsions regardless
Figure 4. Time sequence showing an adhesive pair confined in aPDMS trap when chloroform is evaporated (first two rows) and thenreintroduced (third row). The phenomenon is first observed in abright field mode and then via epifluorescence microscopy by adding 1wt % of NBD-PC. Time lapse goes from left to right with a time stepof 1 min for the first two rows and 10 s for the third one. The scale baris 50 μm.
Figure 5. Distribution of the coalescence time tc as a function of theamount of bad solvent φ for CDPPC = 10−3 wt %. We note that, at thissurfactant concentration, the emulsion is stable for φ ≤ 0.1 (Figure 3).
Figure 6. (a) Distribution Nc of the coalescence time of an adheringdrop pair once the adhesion has been nucleated. (b) Probability Pc thatan adhering drop pair coalesces at a time t, i.e., Pc = ∫ 0
t Ncdt. Thecontinuous line represents an exponential function, which is asignature of a nucleation process. Experiments are done for φ =0.15, CDPPC = 10−3 wt %, and with drops having a diameter of 250 μm.
Langmuir Article
dx.doi.org/10.1021/la3003349 | Langmuir 2012, 28, 6291−62986294

to the amount of silicone oil as long as it is beneath theirprecipitation limit. The difference between these twosurfactants is the number of double links between carbonatoms on their tails: DPPC is saturated, while (Δ9-Cis)PC hastwo insaturations, one on each tail in a cis configuration. Foreach adhesive emulsion generated using these phospholipids,we measure the equilibrium contact angle for variouscompositions of bad solvent and deduce the adhesion energyΔF from eq 1.The evolution of the energy against the mass fraction φ of
silicone oil is reported in Figure 7 for both phospholipids. The
adhesion energy increases with the amount of bad solvent asexpected,5 but one can notice two different behaviors. Eventhough the two curves display a region of lower rates of changein the range 0−0.3 of bad solvent, which we assimilate to aplateau, DPPC exhibits an additional plateau between 0.35 and0.5. These plateaus correspond to a contact angle θ of 27° and70°, respectively. One may also notice the difference betweenthe precipitation limits φ*: 0.58 for DPPC and 0.67 for (Δ9-Cis)PC. As previously noticed, these values correspond to theconcentration of bad solvent for which the adhesive emulsionreaches a maximum contact angle of 90°. The surface tensionγm of a monolayer forming a bilayer is determined by themechanical equilibrium at the Plateau border (Figure 1b),namely from the Young−Dupre equation,29 γm = γ0 cos(θ).
The surface tension of the bilayer is then twice the surfacetension of the monolayer.30 Note in addition that, for θ = 90°,the surface tension of the monolayers and the bilayer are nulllike for vesicle membranes. Using eq 1, the surface pressure Π =γ0 − γm acting on the monolayer is thus half the adhesionenergy, i.e., Π = ΔF/2. The surface pressure reflects the surfacetension decrease from γ0 to γm induced by adhesion and, as forthe pressure acting on a Langmuir film, it describes theisotherm of adsorption of phospholipids from the oil reservoirtoward the interfaces around adhering drops. Thus, theexperimental plot of ΔF(φ) must also reflect the two-dimensional bilayer equation of state31 Π(Γ(φ)), where Γ isthe phospholipid surface concentration which is naturallycontrolled in our experiment by the solvent composition. Byanalogy, the piston of a Langmuir balance used to compress amonolayer is here reproduced by changing the amount of badsolvent. In other words, DPPC surface density within theadhesive monolayer is governed by its bulk chemical potential,which is directly linked to the solvent composition. We thushypothesize that the plateaus of ΔF displayed in Figure 7 reflectthe existence phase transitions undergone by adsorbedphospholipids. The first plateau that corresponds to anadhesion energy ΔF of the order of 0.1 mN/m should be agas−liquid transition for the two kinds of phospholipids, whilethe second one occurring at ΔF ∼ 1.5 mN/m should be aliquid−gel transition for DPPC.32 We note that at roomtemperature dense DPPC monolayers are in gel phase, whereas(Δ9-Cis)PC monolayers are in liquid phase.To bring further evidence for these transitions, we make
stoichiometric mixtures of the two phospholipids and followthe evolution of the adhesion energy as reported in Figure 8.The mass proportions of DPPC and (Δ9-Cis)PC that composethe mixture are 15/85, 50/50, 85/15, respectively. We observea shift of the isotherm toward the one of the more abundantphospholipid as well as the presence of a second plateaurevealing a liquid−gel transition. This is a well-known behaviorfor binary mixtures of miscible phospholipids. For instance, thetransition temperatures in such mixtures are intermediatebetween the pure phospholipids transition temperatures andare closer to the more abundant one.33 The presentexperimental strategy therefore offers a novel way to studythe phase diagrams of bilayers, from a single phospholipid to amixture of phospholipids, that are, as far as we know, difficult toobtain.
Figure 7. Evolution of the adhesion energy ΔF as a function of themass fraction of silicone oil φ with an excess of phospholipds: (●)DPPC and (▲) (Δ9-Cis)PC.
Figure 8. Evolution of the adhesion energy ΔF as a function of the oil composition φ for three phospholipid mixtures (■). The mass proportion ofDPPC and (Δ9-Cis)PC are (a) 15/85, (b) 50/50, and (c) 85/15, respectively. The two adhesion energy curves for pure phospholipids are alsoreported: (○) DPPC and (Δ) (Δ9-Cis)PC.
Langmuir Article
dx.doi.org/10.1021/la3003349 | Langmuir 2012, 28, 6291−62986295

Permeability to Water. We end this investigation byprobing the semipermeability feature of the bilayer as a functionof the solvent composition, and therefore as a function of thebilayer state. Here, only the flux of water through DPPCbilayers is studied. For that purpose, we set a chemical potentialmismatch within an adhering drop pair. Experimentally, weproduce two population of emulsion drops in a microfluidicdevice: one is made from pure water, and the other one is madefrom a solution containing 150 mM of MgSO4. Forconvenience, the binary adhering drop pairs are stored intraps,11 as shown in Figure 9. In order to distinguish the two
populations of drops, methylene blue dye is added to the purewater drops. From the time sequence reported in Figure 9, wecan observe a deflation of the pure water drop and a swelling ofits neighbor that becomes slightly colored. We can concludethat water flows through the bilayer quicker than the methyleneblue dye and of course much faster than the electrolytes,namely Mg2+ and SO4
2−. During that period of time, thetransport of water throughout the continuous phase and thePDMS matrix is negligible compared to the permeation time ofwater molecules through the membrane. We therefore assumemass conservation during that process. As previouslydemonstrated, the solubility-diffusion mechanism34 accountswell for the water permeability of a lipid bilayers.10,35 Thehydrophobic membrane acts as a barrier for water moleculestransport since the partition coefficient K is low and thediffusion coefficient Dm in the bilayer drops down. Indeed,according to this model, the permeability coefficient P of thebilayer is P = KDm/δ, where δ is the membrane thickness. Fordilute solutions, where the osmotic activity is proportional tothe solute concentration, Fick’s law leads to the followingequation for the rate of change of the drop volume V:35
= − ΔV tt
S t v C tPd ( )
d( ) ( )m (2)
where vm = 18 mL/mol is the water molar volume, S is thesurface area of the bilayer, and ΔC(t) is the concentrationdifference of MgSO4 between the two drops. We note that thepermeability coefficient P is expressed in centimeters persecond (cm/s). Since one drop does not contain any
electrolytes, the concentration contrast of solutes is simplyΔC(t) = C0 × V0/V(t), where V0 is the initial drop volume andC0 is the initial solute concentration set here to 150 mM. Asobserved in Figure 9, there exists a phase where the adheringpatch size is almost constant. Within this period of time, whenS = Cte, the time evolution of the swelling drop is obtained fromthe integration of eq 2
= +⎛⎝⎜
⎞⎠⎟V t V
Sv CV
tP
( ) 1 2202 m 0
0 (3)
The permeability coefficient P can then be deduced from themeasurement of V(t). The height of the microfluidic channelsused for trapping the drops is 67 μm. In order to keep theswelling drops spherical as long as possible, we form smallsalted drops with a diameter that spans from 22 to 40 μm. Thevolume of a swelled drop of radius R is given by V = πh2(3R −h)/3, which corresponds to the volume of a truncated spherewhere h = R + (R2 − Rp
2)1/2 and Rp is the radius of the patch. Anexample is reported in Figure 10 (a) where (V(t)/V0)
2 is
plotted against t and exhibits a linear evolution. Using eq 3, P isdeduced from the slope of (V(t)/V0)
2. The permeability is thenassessed for various solvent compositions. The permeabilitycoefficient is reported in Figure 10b as a function of theadhesion energy ΔF. For a low quantity of bad solvent, andthus for a weak adhesion energy, the permeability stronglydepends on ΔF. Indeed, P falls by more than 1 order ofmagnitude when ΔF is changed from 0.1 to 0.3 mN/m. Then,for ΔF larger than 0.5 mN/m, P is nearly constant until 1.5mN/m. For a large amount of silicone oil, the experiments aredifficult to carry on in PDMS devices since drops start to wetthe wall. As previously discussed, the solvent composition tunesthe packing state of the bilayer, namely, the surface area of thephospholipid molecules. The sharp decrease of P is correlatedto the first phase transition, from gas to liquid, observed in the[φ,ΔF] plane and reported in Figure 7. This confirms previousobservations on vesicle permeability to water that is correlatedto the membrane fluidity.36 More precisely, the lower thefluidity, the lower the permeability. What about the geltransition at ΔF = 1.5 mN/m? According to previousinvestigations,37,38 the permeability of DPPC liposomes at
Figure 9. Time sequence showing the transport of water between twoadhering drops having different compositions, pure water (labeled withmethylene blue dye) and MgSO4 solution at 150 mM. The time stepbetween two frames is 3 s, and the scale bar is 50 μm.
Figure 10. (a) Swelling kinetics of the salted drop from which thepermeability coefficient P is deduced (eq 3). (b) Permeabilitycoefficient to water of a DPPC bilayer as a function of the adhesionenergy ΔF that tunes its fluidity. The arrow indicates the permeabilityof liposome membrane at room temperature that corresponds to θ =90°.
Langmuir Article
dx.doi.org/10.1021/la3003349 | Langmuir 2012, 28, 6291−62986296

room temperature is about 4.10−3 cm/s. In our case, thissituation corresponds to a contact angle between the adheringdrops of 90°. The lowest permeability coefficient reported inFigure 10 is on the order of 2.10−2 cm/s. Therefore, anothersharp decrease of P is expected for ΔF > 1.5 mN/m in order toreach the liposome permeability. We conclude that thepermeability must drop down when the DPPC bilayer is inthe gel phase (Figure 7).Furthermore, one can permeabilize bilayers to enable the
transport of large molecules or electrolytes. A common way isto apply an electric field, which is known to induce theformation of transient pores into the membrane, is aphenomenon named electroporation.39,40 In a recent publica-tion,11 we probed the response of adhesive emulsion bilayersunder an electric field by using the same experimental strategybased on microfluidic technologies. We were able to map thebehaviors of drop pairs within the adhesion energy-electric fieldintensity plane. We observe three distinct states: the pair can beeither stable, though slightly deformed, or unzip and separate,or coalesce. We experimentally demonstrate that the forcerequired to completely unzip a single bilayer matches thetheoretical threshold predicted for the detachment of adhesivevesicles.41,42 After unzipping, the drops repel each other underfield. Then, they can attract each other when the electric field isturned off, meaning that each drop has now a net electricalcharge. This is a demonstration of the occurrence of transientpores that allow charge transport across the membrane duringthe unzipping step. This charge exchange between the dropstherefore leads to oppositely charged drops, which thennaturally separate under field and attract one another in theabsence of field. Besides, in the fluid and gel phases, we showthat the transition between transient electroporation andcoalescence is perfectly accounted for by the existence of anunique critical pore size above which the hole becomes unstableand expands. Therefore, when adhesion is increased, corre-sponding to a decrease of the membrane tension, coalescencewill occur at a larger field such that the net surface energygained by opening a constant hole size remains the same. Thisenergy is assumed to be on the order of the thermal energy.21
Finally, unzipping does not occur in the gas phase where thebilayer is poor in phospholipids. Indeed, the electric field easilyleads to the appearance of unstable pores in the membrane thatentail drop coalescence. This process probably occurs first,before drops are able to detach. Therefore, like for thepermeability, the fluidity of the bilayer rules its behavior underan electric field.
■ CONCLUSIONThis article reports a quantitative study on bilayer properties byusing microfluidic technologies. The main novel aspecthighlighted here is the way we are able to tune the surfacetension of phospholipid bilayers formed between adhesivedroplets and then to probe the consequences on their stabilityand permeability. Additionally, the present experimentalstrategy offers the possibility to investigate phase transitionsoccurring in bilayers, an investigation that is usually difficult toconduct. Indeed, the fluidity of the bilayer is here modified bysimply changing the composition of the continuous phase thatis an oil mixture. We also corroborate the fact that thepermeability of the bilayer is linked to its fluidity. One openquestion to be addressed would be to determine therelationship between the continuous phase composition andthe surface concentration of phospholipids. A natural follow-up
is to investigate the properties of more complex bilayers byincorporating cholesterol and proteins to mimic cell mem-brane7 as it has been recently demonstrated.43,44
■ AUTHOR INFORMATION
Corresponding Author*E-mail: [email protected].
NotesThe authors declare no competing financial interest.
■ ACKNOWLEDGMENTSWe are pleased to thank Enric Santanach, Jean-Daniel Emerard,and Jerome Delacotte for experimental set ups and surfacetension measurements, and finally Jean Baudry, BernardCabane, and Philippe Poulin for fruitful discussions.
■ REFERENCES(1) Israelachvili, J. N. Intermolecular and Surface Forces; AcademicPress Inc.: New York, 1991.(2) Leckband, D.; Israelachvili, J. Intermolecular forces in biology. Q.Rev. Biophys. 2001, 34, 105−267.(3) Leal-Calderon, F.; Schmitt, V.; Bibette, J. Emulsion Science - BasicPrinciples; Springer: New York, 2007.(4) Lipowsky, R. The conformation of membranes. Nature 1991,349, 475−481.(5) Poulin, P.; Bibette, J. Adhesion of water droplets in organicsolvent. Langmuir 1998, 14, 6341−6343.(6) Funakoshi, K.; Suzuki, H.; Takeuchi, S. Lipid bilayer formation bycontacting monolayers in a microfluidic device for membrane proteinanalysis. Anal. Chem. 2006, 78, 8169−8174.(7) Lipowsky, R., Sackmann, E., Eds. Structure and Dynamics ofMembranes, Handbook of Biological Physics; Elsevier: New York, 1995;Vol. 1.(8) Sackmann, E. Supported membranes: Scientific and practicalapplications. Science 1996, 271, 43−48.(9) Neumann, E.; Sowers, E. A.; Jordan, C. A. Electroporation andElectrofusion in Cell Biology; Plenum Press, New York, 1989.(10) Paula, S.; Volkov, A. G.; VanHoek, A. N.; Haines, T. H.;Deamer, D. W. Permeation of protons, potassium ions, and small polarmolecules through phospholipid bilayers as a function of membranethickness. Biophys. J. 1996, 70, 339−348.(11) Thiam, A. R.; Bremond, N.; Bibette, J. Adhesive emulsionbilayers under an electric field: From unzipping to fusion. Phys. Rev.Lett. 2011, 107, 068301.(12) Aronson, M. P.; Princen, H. M. Contact angles associated withthin liquid-films in emulsions. Nature 1980, 286, 370−372.(13) Dixit, S. S.; Kim, H.; Vasilyev, A.; Eid, A.; Faris, G. W. Light-driven formation and rupture of droplet bilayers. Langmuir 2010, 26,6193−6200.(14) Yeung, A.; Dabros, T.; Masliyah, J.; Czarnecki, J. Micropipette:A new technique in emulsion research. Colloids Surf., A 2000, 174,169−181.(15) Jorgensen, L.; Kim, D. H.; Vermehren, C.; Bjerregaard, S.;Frokjaer, S. Micropipette manipulation: A technique to evaluate thestability of water-in-oil emulsions containing proteins. J. Pharm. Sci.2004, 93, 2994−3003.(16) Bremond, N.; Thiam, A. R.; Bibette, J. Decompressing emulsiondroplets favors coalescence. Phys. Rev. Lett. 2008, 100, 024501.(17) Thiam, A. R.; Bremond, N.; Bibette, J. Breaking of an emulsionunder an ac electric field. Phys. Rev. Lett. 2009, 102, 188304.(18) Baret, J. C.; Kleinschmidt, F.; El Harrak, A.; Griffiths, A. D.Kinetic aspects of emulsion stabilization by surfactants: A microfluidicanalysis. Langmuir 2009, 25, 6088−6093.(19) Bremond, N.; Domejean, H.; Bibette, J. Propagation of dropcoalescence in a two-dimensional emulsion: A route towards phaseinversion. Phys. Rev. Lett. 2011, 106, 214502.
Langmuir Article
dx.doi.org/10.1021/la3003349 | Langmuir 2012, 28, 6291−62986297

(20) Anna, S. L.; Bontoux, N.; Stone, H. A. Formation of dispersionsusing “flow focusing” in microchannels. Appl. Phys. Lett. 2003, 82,364−366.(21) Kabalnov, A.; Wennerstrom, H. Macroemulsion stability: Theoriented wedge theory revisited. Langmuir 1996, 12, 276−292.(22) Utada, A. S.; Lorenceau, E.; Link, D. R.; Kaplan, P. D.; Stone, H.A.; Weitz, D. A. Monodisperse double emulsions generated from amicrocapillary device. Science 2005, 308, 537−541.(23) Evans, E.; Needham, D. Physical-properties of surfactant bilayer-membranes - Thermal transitions, elasticity, rigidity, cohesion, andcolloidal interactions. J. Phys. Chem. 1987, 91, 4219−4228.(24) Leal, L. G. Flow induced coalescence of drops in a viscous fluid.Phys. Fluids 2004, 16, 1833−1851.(25) Lai, A.; Bremond, N.; Stone, H. A. Separation-drivencoalescence of droplets: An analytical criterion for the approach tocontact. J. Fluid Mech. 2009, 632, 97−107.(26) Chan, D. Y. C.; Klaseboer, E.; Manica, R. Dynamic deformationsand forces in soft matter. Soft Matter 2009, 5, 2858−2861.(27) Li, J. B.; Fainerman, V. B.; Miller, R. Adsorption kinetics ofphospholipids at the chloroform/water interface studied by dropvolume and pendant drop techniques. Langmuir 1996, 12, 5138−5142.(28) Exerowa, D.; Kashchiev, D.; Platikanov, D. Stability andpermeability of amphiphile bilayers. Adv. Colloid Interface Sci. 1992, 40,201−256.(29) de Gennes, P.; Brochard-Wyart, F.; Quere, D. Gouttes, Bulles,Perles et Ondes; Belin: Paris, 2002.(30) Toshev, B. V. Thermodynamic theory of thin liquid filmsincluding line tension effects. Curr. Opin. Colloid Interface Sci. 2008, 13,100−106.(31) MacDonald, R. C.; Simon, S. A. Lipid monolayer states and theirrelationships to bilayers. Proc. Natl. Acad. Sci. U.S.A. 1987, 84, 4089−4093.(32) Kaganer, V. M.; Mohwald, H.; Dutta, P. Structure and phasetransitions in Langmuir monolayers. Rev. Mod. Phys. 1999, 71, 779−819.(33) Garidel, P.; Blume, A. Miscibility of phospholipids with identicalheadgroups and acyl chain lengths differing by two methylene units:Effects of headgroup structure and headgroup charge. Biochim. Biophys.Acta, Biomembr. 1998, 1371, 83−95.(34) Zwolinski, B. J.; Eyring, H.; Reese, C. E. Diffusion andmembrane permeability. J. Phys. Colloid Chem. 1949, 53, 1426−1453.(35) Olbrich, K.; Rawicz, W.; Needham, D.; Evans, E. Waterpermeability and mechanical strength of polyunsaturated lipid bilayers.Biophys. J. 2000, 79, 321−327.(36) Lande, M. B.; Donovan, J. M.; Zeidel, M. L. The relationshipbetween membrane fluidity and permeabilities to water, solutes,ammonia, and protons. J. Gen. Physiol. 1995, 106, 67−84.(37) Graziani, Y.; Livne, A. Water permeability of bilayer lipidmembranes: Sterol-lipid interaction. J. Membr. Biol. 1972, 7, 275−284.(38) Marrink, S.-J.; Berendsen, H. J. C. Simulation of water transportthrough a lipid membrane. J. Phys. Chem. 1994, 98, 4155−4168.(39) Weaver, J. C.; Chizmadzhev, Y. Theory of electroporation: Areview. Bioelectroch. Bioenerg. 1996, 41, 135−160.(40) Dimova, R.; Bezlyepkina, N.; Jordo, M. D.; Knorr, R. L.; Riske,K. A.; Staykova, M.; Vlahovska, P. M.; Yamamoto, T.; Yang, P.;Lipowsky, R. Vesicles in electric fields: Some novel aspects ofmembrane behavior. Soft Matter 2009, 5, 3201−3212.(41) Brochard-Wyart, F.; de Gennes, P. G. Unbinding of adhesivevesicles. C. R. Phys. 2003, 4, 281−287.(42) Pierrat, S.; Brochard-Wyart, F.; Nassoy, P. Enforced detachmentof red blood cells adhering to surfaces: Statics and dynamics. Biophys. J.2004, 87, 2855−2869.(43) Thutupalli, S.; Herminghaus, S.; Seemann, R. Bilayermembranes in micro-fluidics: From gel emulsions to soft functionaldevices. Soft Matter 2011, 7, 1312−1320.(44) Villar, G.; Heron, A. J.; Bayley, H. Formation of dropletnetworks that function in aqueous environments. Nat. Nano 2011, 6,803−808.
Langmuir Article
dx.doi.org/10.1021/la3003349 | Langmuir 2012, 28, 6291−62986298