from perceptive fields to gestalt -
TRANSCRIPT

CHA
Martinez-Conde, Macknik, Martinez, Alonso & Tse (Eds.)
Progress in Brain Research, Vol. 155
ISSN 0079-6123
Copyright r 2006 Elsevier B.V. All rights reserved
PTER 5
From perceptive fields to Gestalt
Lothar Spillmann�
Dept. of Neurology, Neurozentrum, University Hospital, Breisacher Strasse 64, 79106 Freiburg, Germany
Abstract: Studies on visual psychophysics and perception conducted in the Freiburg psychophysics lab-oratory during the last 35 years are reviewed. Many of these were inspired by single-cell neurophysiology incat and monkey. The aim was to correlate perceptual phenomena and their effects to possible neuronalmechanisms from retina to visual cortex and beyond. Topics discussed include perceptive field organi-zation, figure-ground segregation and grouping, fading and filling-in, and long-range color interaction.While some of these studies succeeded in linking perception to neuronal response patterns, others requirefurther investigation. The task of probing the human brain with perceptual phenomena continues to be achallenge for the future.
Keywords: perceptive fields; gestalt; neurophysiological correlates of perception; visual illusions; figure-ground segregation and grouping; fading and filling-in; long-range color interaction
When I was a student, Gestalt factors were hardlymore than a set of phenomenological rules to de-scribe figure-ground segregation and grouping.Nowadays, Gestalt factors have entered the fieldsof neurophysiology and neurocomputation (Spill-mann and Ehrenstein, 1996, 2004; Ehrenstein et al.,2003). Rudiger von der Heydt is studying them,Steve Grossberg incorporates them into his models,and Wolf Singer refers to them within the contextof synchronization of oscillations. The commongoal is to promote an understanding of Gestaltfactors in terms of specified single-neuron activitiesand to find the neuronal correlates of perceptualorganization.
In his 1923 classical paper, the founder of Ge-stalt psychology, Max Wertheimer, had proposedthat what we see is the simplest, most balanced,and regular organization possible under the cir-cumstances. He called this the Pragnanz principleand attributed it to the tendency of the brain
�Corresponding author. Tel.: +49-761-270-5042;
E-mail: [email protected]
DOI: 10.1016/S0079-6123(06)55005-8 67
towards equilibrium. Gestalten are distinguishedby two main criteria:
(i)
Supra-additivity, meaning that the whole isdifferent from the sum of its parts. MichaelKubovy would call this a preservative emer-gent property, because the elements survive,while something new emerges.
(ii)
Transposition, implying that a Gestalt main-tains its perceptual properties regardless offigural transformations (e.g., distance, ori-entation, slant). This constancy is nowadayscalled viewpoint invariance.The Gestalt approach challenged the view thatvision can be understood from an analysis of stim-ulus elements. Instead, it proposed Gestalt factorsaccording to which stimulus patterns are segre-gated into figure and ground and individual partsgrouped into a whole. Gestalt factors includeproximity, similarity, symmetry, smooth continua-
tion, closure, and common fate and are describedwithin the framework of ‘‘good Gestalt’’ orPragnanz. Little was known at the time aboutthe neuronal mechanisms underlying these factors.
68
Recent psychophysical and neurophysiologicalstudies have shed light on some of the processesthat may be responsible for figure-ground segre-gation and grouping (Valberg and Lee, 1991;Spillmann, 1999). The filling-in of gaps by illusorycontours, the formation of boundaries by texturecontrast, and the binding by coherent motion areamong the better understood of these processes.
Part A. Atmosphere
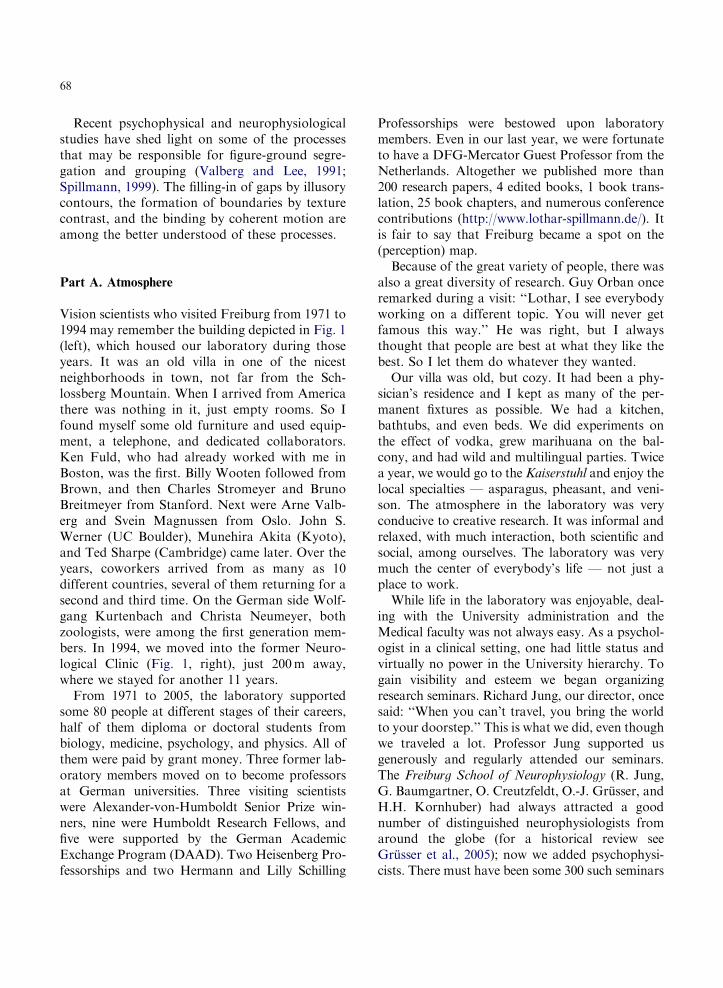
Vision scientists who visited Freiburg from 1971 to1994 may remember the building depicted in Fig. 1(left), which housed our laboratory during thoseyears. It was an old villa in one of the nicestneighborhoods in town, not far from the Sch-lossberg Mountain. When I arrived from Americathere was nothing in it, just empty rooms. So Ifound myself some old furniture and used equip-ment, a telephone, and dedicated collaborators.Ken Fuld, who had already worked with me inBoston, was the first. Billy Wooten followed fromBrown, and then Charles Stromeyer and BrunoBreitmeyer from Stanford. Next were Arne Valb-erg and Svein Magnussen from Oslo. John S.Werner (UC Boulder), Munehira Akita (Kyoto),and Ted Sharpe (Cambridge) came later. Over theyears, coworkers arrived from as many as 10different countries, several of them returning for asecond and third time. On the German side Wolf-gang Kurtenbach and Christa Neumeyer, bothzoologists, were among the first generation mem-bers. In 1994, we moved into the former Neuro-logical Clinic (Fig. 1, right), just 200m away,where we stayed for another 11 years.
From 1971 to 2005, the laboratory supportedsome 80 people at different stages of their careers,half of them diploma or doctoral students frombiology, medicine, psychology, and physics. All ofthem were paid by grant money. Three former lab-oratory members moved on to become professorsat German universities. Three visiting scientistswere Alexander-von-Humboldt Senior Prize win-ners, nine were Humboldt Research Fellows, andfive were supported by the German AcademicExchange Program (DAAD). Two Heisenberg Pro-fessorships and two Hermann and Lilly Schilling
Professorships were bestowed upon laboratorymembers. Even in our last year, we were fortunateto have a DFG-Mercator Guest Professor from theNetherlands. Altogether we published more than200 research papers, 4 edited books, 1 book trans-lation, 25 book chapters, and numerous conferencecontributions (http://www.lothar-spillmann.de/). Itis fair to say that Freiburg became a spot on the(perception) map.
Because of the great variety of people, there wasalso a great diversity of research. Guy Orban onceremarked during a visit: ‘‘Lothar, I see everybodyworking on a different topic. You will never getfamous this way.’’ He was right, but I alwaysthought that people are best at what they like thebest. So I let them do whatever they wanted.
Our villa was old, but cozy. It had been a phy-sician’s residence and I kept as many of the per-manent fixtures as possible. We had a kitchen,bathtubs, and even beds. We did experiments onthe effect of vodka, grew marihuana on the bal-cony, and had wild and multilingual parties. Twicea year, we would go to the Kaiserstuhl and enjoy thelocal specialties — asparagus, pheasant, and veni-son. The atmosphere in the laboratory was veryconducive to creative research. It was informal andrelaxed, with much interaction, both scientific andsocial, among ourselves. The laboratory was verymuch the center of everybody’s life — not just aplace to work.
While life in the laboratory was enjoyable, deal-ing with the University administration and theMedical faculty was not always easy. As a psychol-ogist in a clinical setting, one had little status andvirtually no power in the University hierarchy. Togain visibility and esteem we began organizingresearch seminars. Richard Jung, our director, oncesaid: ‘‘When you can’t travel, you bring the worldto your doorstep.’’ This is what we did, even thoughwe traveled a lot. Professor Jung supported usgenerously and regularly attended our seminars.The Freiburg School of Neurophysiology (R. Jung,G. Baumgartner, O. Creutzfeldt, O.-J. Grusser, andH.H. Kornhuber) had always attracted a goodnumber of distinguished neurophysiologists fromaround the globe (for a historical review seeGrusser et al., 2005); now we added psychophysi-cists. There must have been some 300 such seminars

Fig. 1. This building on Stadtstr. 11 (left) was home to the visual psychophysics laboratory from 1971 to 1994. (Photo: Clemens Fach)
Thereafter, the laboratory moved into the former Neurological Clinic on Hansastr. 9a (right). (Photo: Ralf Teichmann) It was closed
on June 30, 2005 in its 34th year.
Fig. 2. Professor Maarten Bouman, president and organizer
with Hans Vos of the 1979 European Conference on Visual
Perception in Noordwijkerhout (The Netherlands).
69
over the years; many co-organized with MichaelBach from the local Eye Clinic. Much of what Iknow came from listening to those invited speakers.
Freiburg is a beautiful town surrounded by theBlack Forest, the gastronomy is among the bestin Germany, and there is plenty of good wine.Sometimes wine proved mightier than words. Thefirst European Conference on Visual Perception inMarburg in 1978 (which then was called Workshop
on Sensory and Perceptual Processes) also owes itssuccess to this kind of currency. The last eveningsession was supposed to end at 10 p.m. The janitorwanted us out, but three bottles of Endinger En-
gelsberg sent him to his bed and we stayed on untillong after midnight. This was the evening when theDutch delegation under the leadership of MaartenBouman (Fig. 2) and Dirk van Norren decidedthat the next meeting should be held in the Neth-erlands, and a tradition was born.
The Neurologische Klinik mit Abteilung fur
klinische Neurophysiologie in Freiburg (Fig. 1, right)was unique in Germany as it combined excellentclinical studies with first-rate basic research inhuman and animal subjects. The clinic was housed
in a former sanatorium surrounded by a beautifulpark. Every spare corner of the building was usedfor research and bustled with activity. Neurophysio-logical experiments on the visual, vestibular,somatosensory, and nociceptive sense modalities— and their multimodal interactions — were done

70
next to oculomotor, EEG, and sleep recordings. Awell-stocked library, two workshops for instrumentdevelopment, and generous funding provided idealconditions for productive research, resulting inmany hundreds of publications.1
To honor Richard Jung on the occasion of his75th birthday, Jack Werner and I planned an in-ternational conference in Badenweiler. Progress wasslow and in the summer of 1986, Professor Jung —while on a visit to Belgium — suffered a stroke anddied. So we organized our conference in his mem-ory and that of his friends and co-editors of theHandbook of Sensory Physiology — Donald M.MacKay (1922�1987) and Hans-Lukas Teuber(1916�1977). We were lucky: the German ResearchCouncil, the Airforce Office of Scientific Research,the Alexander von Humboldt-Foundation, andHeinz Wassle from the Max Planck Institute forBrain Research in Frankfurt supported us. In 1987,we took the participants to that wonderful oldhotel, the Romerbad, where at the turn of the 19thcentury Friedrich Nietzsche, Richard Wagner, andAnton Chekhov had lodged, and had a great time.Conference participants first interacted in smallgroups and then presented a given topic for plenarydiscussion, with no chair assigned to a session. Toour surprise it worked.
The book on Visual Perception — The Neuro-
physiological Foundations (Eds. Spillmann andWerner, 1990) came out of the Badenweiler con-ference. The individual chapters were written bysome of the finest scientists in the field, all writingin their own style. This prompted Brian Wandellto say in his review in Contemporary Psychology,‘‘The book jumped into my lap like an excitedpuppy.’’ To judge from the number of sold copies(6500), the book appears to have served the visioncommunity well. It is also one of the few thataimed primarily at correlating perceptual pheno-mena to their underlying neuronal mechanisms.
Phenomenology as a guide to brain research hadalways had a great tradition in Freiburg. Jung(1961, 1973) firmly believed that all percepts had
1Schriftenverzeichnis Richard Jung und Mitarbeiter, Frei-
burg im Breisgau, 1939�1971. Herausgegeben anlaXlich des 60.
Geburtstages von Richard Jung. Springer-Verlag Berlin-Hei-
delberg-New York 1971.
physiological correlates. He had proposed B- andD-neurons for brightness and darkness perceptioneven before they were called on- and off-neurons.He had read the writings of Purkinje, Mach, andHering on subjective sensory physiology, and whenI first arrived as a student in the spring of 1962,Hans Kornhuber asked me whether I wanted to doa doctoral thesis on the Hermann Grid illusion. Theconference report on the Neurophysiology and Psy-
chophysics of the Visual System (Eds. Jung andKornhuber, 1961) had just appeared with a chapterby Baumgartner on the responses of neurons in thecentral visual system of the cat. In this chapter hepresented his receptive, field model of the Hermanngrid illusion (p. 309). To a young psychologist, theprospect of looking into the human brain withoutactually sticking an electrode into it was fascinating.This fascination has never left me throughout myentire life. In the following, I will describe some ofthe perceptual phenomena studied in our labora-tory in conjunction with their possible neuro-physiological correlates.
Part B. Science
Perceptive fields
Hermann grid illusion
The Hermann grid is characterized by the presenceof dark illusory spots at the intersections of whitebars. A physiological explanation of this illusioninvolves concentric center-surround receptivefields. A receptive field is the area on the retinafrom which the response of a ganglion cell orhigher-level neuron can be modulated by light en-tering the eye. Take two on-center receptive fields,one superimposed on the intersection and one onthe bar. While central excitation is the same forboth, the receptive field on the intersection receivesmore lateral inhibition than the receptive field onthe bar (Fig. 3A). As a result the intersection looksdarker. On a black grid, the intersections looklighter due to less lateral activation in off-centerfields.
To test his hypothesis, Baumgartner and col-laborators (Schepelmann et al., 1967) recordedfrom neurons in the cat visual cortex and found

Fig. 3. Hermann grid illusion. (A) Dark illusory spots are attributed to more lateral inhibition of neurons whose receptive fields are
stimulated by an intersection as compared to a bar. (B) Single-cell recording from first-order B-neuron in the cortex of the cat with one
or two bars stimulating the receptive field. The firing rate is reduced when both bars are presented simultaneously, consistent with a
darkening at the intersection. (Modified from Baumgartner, 1990, with kind permission from Springer.)
Fig. 4. Perceptive field center size derived from the bar width
that elicited the maximum illusory effect in the Hermann grid
illusion, plotted as a function of retinal eccentricity. Center size
in the fovea is only 4�5min of arc, which is the reason why the
dark illusory spots are normally not seen in foveal vision.
(Modified from Jung and Spillmann (1970), with kind permis-
sion from the National Academy of Sciences of the United
States of America.)
71
that each bar presented by itself on the receptivefield of the neuron produced a strong response(Fig. 3B). However, when both bars were pre-sented together as in the intersection of the grid,the neuronal response was greatly reduced.Baumgartner postulated that the illusion shouldbe strongest when the width of the bar matched thereceptive field center (Tom Troscianko would latersay that a factor of 1.4 was more appropriate).
Here then was a psychophysical tool to studythe receptive field organization in humans withoutinvading the brain. All one needed to do was tofind the grid that produced the strongest illusion.So I pasted a number of Hermann grids withdifferent bar width on cardboard and presentedthem at various distances from the fixation point.The task of the subject was to select the grid thatyielded the darkest illusory spots.
Foveal field centers turned out to be quite small,only 4�5minarc (Spillmann, 1971). However, withincreasing eccentricity, center size increased up to31 in the outer periphery (Fig. 4). The small centersize in the fovea is the reason why the Hermanngrid illusion is typically not seen with direct fixa-tion. The bars are just too wide (Baumgartner,1960, 1961).
Jung called these centers perceptive field centers
because they are revealed through our perception
(Jung and Spillmann, 1970). You may argue that aperceptive field reflects the activity of many neu-rons, not just one. This is undoubtedly true.Moreover, we do not know where these neuronsreside in the visual pathway. So, it is difficult to

72
assign a given percept to the retina, lateral gen-iculate body, or visual cortex.
However, there are ways to narrow down thepossible brain loci. For example, if the Hermanngrid illusion cannot be seen with dichoptic pres-entation, we would say that it is most likely ofsubcortical origin. On the other hand, if it exhibitsa strong oblique effect, we would assume that it iscortical. Finally, if the illusion can be seen withisoluminant colors, it is likely mediated by theparvocellular pathway. All three statements applyto the Hermann grid illusion. We therefore tend tothink that it is primarily a retinal effect with acortical contribution (for a review see Spillmann,1994).
As did Colin Blakemore, we call these and othertechniques the psychologist’s microelectrode (a termvariously attributed to Bela Julesz, John Mollon,and John Frisby) because of the insights they canprovide into the mechanisms of visual perceptionand their location in the visual pathway. PeterSchiller’s (Schiller and Carvey, 2005) recent paperin Perception proposes a new kind of cortical neu-ron to explain the Hermann grid illusion. Yet hisproposal is still awaiting neurophysiological confir-mation in the trained monkey.
When I went to America in 1964, I thought Iwould continue my Freiburg work studying visualillusions. Hans-Lukas Teuber (at MIT) was sup-portive, but David Hubel on the other side of theRiver was reluctant and recommended that I dostraightforward neurophysiology. Torsten Wieselwas more sympathetic. It took Margaret Living-stone (Livingstone and Hubel, 1987; Livingstone,2002) to bridge the gap between neurophysiologyand perception at Harvard Medical School. Percep-tual labels were boldly attached to visual structuresand functions, and even illusions became fashiona-ble among former hardcore neuroscientists.
Fig. 5. Perceptive fields for apparent motion derived from the
largest distance between two successively flashed stimuli across
which phi-motion could still be seen, plotted as a function of
retinal eccentricity. Regression lines refer to ascending and de-
scending thresholds. Results obtained with the Hermann grid
illusion are shown for comparison. (Modified from Jung and
Spillmann, 1970), with kind permission from the National
Academy of Sciences of the United States of America.)
Phi-motion
After measuring perceptive fields and field centersin the Hermann grid, we wondered whether wecould also measure perceptive field centers for mo-tion. The obvious choice was the phi-phenomenon.In 1912, Max Wertheimer (1912) had publishedhis landmark study on apparent motion, which he
attributed to some kind of intracortical short circuit(Querfunktionen). Our idea was simple: when twosuccessively presented stimuli fell within the sameperceptive field, there should be apparent motion;when they fell into different fields, there should beno interaction and — consequently — no motion.
So I measured the largest spatial distance overwhich phi-motion could be seen. The results areagain plotted against retinal eccentricity; perceptivefields for motion were about 20 times larger thanthe perceptive field centers inferred from the Her-mann grid illusion (Fig. 5). From this discrepancywe concluded that there were different kinds ofperceptive field organization depending on the res-ponse criterium. This finding anticipated neuro-physiological measurements that show receptivefields of area MT-neurons much larger than those

73
of retinal ganglion cells or V1 neurons (Britten,2004).
Fig. 6. Westheimer paradigm. (A) Stimulus configuration as
seen by the subject (left) and corresponding luminance profile
(right). A small test spot is flashed onto the center of a back-
ground of variable diameter that is presented on a diffusely
illuminated ambient field. (Reprinted from Oehler, 1985, with
kind permission from Springer Science and Business Media).
(B) Increment threshold plotted as a function of background
diameter (schematic). The first arrow marks the background
diameter that corresponds to the size of the perceptive
field center; the second marks the diameter corresponding to
the entire perceptive field (center plus surround). (Modified
from Ransom-Hogg and Spillmann, 1980, with kind permission
from Elsevier.)
Westheimer paradigm
The 1960s and 1970s were the time of perceptualphenomena in search of neural mechanisms andneural mechanisms in search of perceptual phe-nomena. It was like a revelation; psychologistseverywhere went wild. Colin Blakemore wasthe youthful leader of this group. Looking back,Baumgartner (1990) would later ask, ‘‘Where do
visual signals become a perception?’’ The benefitwas mutual; neurophysiologists looked for mech-anisms that could not have been predicted fromthe physical stimulus alone. Vice versa, psycholo-gists looked for percepts that may otherwise nothave been discovered.
Naturally, we were not alone in our quest forpsychophysical correlates of neuronal mecha-nisms. In 1965 and 1967, Gerald Westheimer(1965, 1967) published two influential papers inthe Journal of Physiology on spatial interactions inthe human retina (see also Westheimer, 2004).Westheimer used a small test spot centered on avariable background that in turn was superim-posed on a large ambient field (Fig. 6A). With thiskind of luminance hierarchy, he obtained theincrement�threshold curve known as Westheimerfunction (Fig. 6B).
Threshold was plotted as a function of back-ground diameter. When the background becamelarger, the threshold for the test spot first increasedto a peak, then decreased, and finally leveled off.Westheimer attributed the initial increase to spa-tial summation within the perceptive field center(first arrow) and the subsequent decrease to lateralinhibition within the perceptive field surround(second arrow). In this way he derived the dia-meters of the center and the entire field.
I very much liked Westheimer’s paradigm. So Iasked Anne Ransom-Hogg (Ransom-Hogg andSpillmann, 1980), now Anne Kurtenbach, in mylaboratory to measure perceptive fields and fieldcenters in the light- and dark-adapted eye. To do so,we used an elaborate three-channel Maxwellian-view system, beautifully crafted by our mastermechanics and wired up by our top electronics
technician. It had a swivel support (adopted fromBilly Wooten’s laboratory), enabling us to do meas-urements out to 701 eccentricity without realigningthe pupil. (We also had a four-channel Michelsoninterferometer, to which later were added two moreMaxwellian-view systems, making our laboratoryone of the best-equipped vision laboratories inGermany.)
With increasing retinal eccentricity, the positionwhere the Westheimer curve peaked was displacedto the right, and so was the position of the pointwhere the curve asymptoted. Therefore, when weplotted perceptive field center size as a function ofeccentricity, both curves (for photopic and scotopicvision) increased from the fovea towards the peri-phery, just as for the Hermann grid illusion.

Fig. 7. Comparison of perceptive field centers for photopic and
scotopic vision, plotted as a function of retinal eccentricity.
Data are from two observers. (Modified from Ransom-Hogg
and Spillmann, 1980, with kind permission from Elsevier.)
Fig. 8. Experimental setup (seen from above) for testing rhesus
monkeys with the Westheimer paradigm. M ¼ first surface
mirror, P ¼ pellicle. The same setup was used for testing human
observers under identical conditions. (Reprinted from Oehler,
1985, with kind permission from Springer Science and Business
Media.)
74
However, field centers were larger by approxi-mately one fourth for scotopic than for photopicvision (Fig. 7). We attributed this difference to thepeak shift caused by the decrease of lateral inhibi-tion with dark adaptation and the resulting flatten-ing of the curve. This finding agreed with HoraceBarlow et al.’s (1957) discovery in the cat that atlow-light levels the area for spatial summation in-creases when lateral inhibition gradually diminishesand disappears.
The study by Ransom-Hogg permitted a furtherconclusion. When we plotted perceptive field cen-ter size against the inverse of the cortical magni-fication factor (Drasdo, 1977), we obtained astraight line with a slope of 0.88. This finding sug-gested an almost constant size of the cortical rep-resentation of perceptive field centers; it alsocompared well with the slope of 0.81 found forcortical receptive field centers in the rhesus mon-key (Hubel and Wiesel, 1974).
So far, we had tacitly assumed that the percep-tive field organization in the human was similar tothe receptive field organization in the monkey. Butwe had no evidence. Therefore, in a follow-up ex-periment, Regina Oehler (1985) in our laboratoryused the Westheimer paradigm to measure per-ceptive fields and field centers in human and rhesusmonkey. Fig. 8 shows her experimental setup.
The monkey and human curves were similar inshape and stacking order, but they differed inheight (Fig. 9). However, when one derived thecritical background diameters at which the curvespeaked and leveled off, the resulting values werealmost the same (Fig. 10). In fact, the match forperceptive field centers could not have been better.In comparison, perceptive field sizes were some-what larger for the human observers, suggestingmore extensive lateral inhibition.
After demonstrating that the perceptive fieldorganization was equivalent in macaque monkeysand humans, the question remained: how do mac-aque perceptive field centers compare to macaquereceptive field centers obtained neurophysiologi-cally?
To answer this question we plotted the diametersof macaque perceptive field centers (obtained withthe Westheimer paradigm) and receptive field cen-ters of retinal ganglion cells (from DeMonasterioand Gouras, 1975) against eccentricity. Again, theagreement between the two kinds of measurementswas excellent (Fig. 11).
Now we had evidence that perceptive field cen-ters and receptive field centers in the monkey wereequivalent. And what holds for the monkey shouldalso apply to the human observer. So whenever wemeasure perceptive fields and field centers in manusing the Hermann grid illusion, the Westheimerparadigm, or another procedure, we can safely saythat we are tapping the underlying receptive field

Fig. 9. Increment�threshold curves for a rhesus monkey (left) and a human observer (right). Curves refer to five retinal eccentricities
in the nasal retina ranging from 51 to 401. (Reprinted from Oehler, 1985, with kind permission from Springer Science and Business
Media.)
Fig. 10. Size of perceptive fields and field centers, plotted as a
function of eccentricity on the horizontal meridian of the nasal
retina. Continuous lines refer to monkey data and dashed lines
to human data. Averages are from two monkeys and two hu-
mans. (Modified from Oehler, 1985, with kind permission from
Springer Science and Business Media.)
75
organization (of ganglion cells) without using amicroelectrode (Spillmann et al., 1987).
Beyond the classical receptive field
So far I have described center-surround organiza-tion in classical receptive fields. This sectionaddresses neurons whose response is modulatedby stimulus properties from beyond the classically
defined receptive field. Following the finding byMcIlwayn (1964) that retinal ganglion cells respondto stimuli in the far periphery, Bruno Breitmeyerand Arne Valberg in our laboratory embarked on aseries of studies to identify related psychophysicalresponses. They found that the increment thresholdfor a foveal stimulus increased in the presence of agrating shift as far as 41 away — the Jerk Effect
(Breitmeyer and Valberg, 1979).The neurophysiological breakthrough for long-
range interactions came from the Zurich group ofGunter Baumgartner (Baumgartner et al., 1984).Rudiger von der Heydt and Esther Peterhansshowed that the response rate of neurons could beaffected by stimuli that were clearly outside theclassical receptive field (von der Heydt et al., 1984;von der Heydt, 1987; von der Heydt and Peterhans,1989). They called this the response field. This

Fig. 11. Comparison of perceptive field centers measured with
the Westheimer paradigm (crosses) and receptive field centers
obtained with single-cell recording (dots), both in the rhesus
monkey. Behavioral data are averages from the nasal and tem-
poral hemiretinae of two monkeys. Neurophysiological data
refer to broadband cells and are from DeMonasterio and
Gouras (1975). (Reprinted from Oehler, 1985, with kind per-
mission from Springer Science and Business Media.)
76
discovery opened up the study of perceptual com-pletion across gaps and scotomata, surface filling-in, large-scale color effects, and context-dependentboundary formation. Our review paper on thistopic, 12 years later, was requested as often as 400times (Spillmann and Werner, 1996).
In the stimulus pattern shown in Fig. 12 (left),one can perceive a bright vertical bar delineated byillusory contours. Von der Heydt and Peterhansstudied this illusion neurophysiologically in visualarea V2 (Fig. 12, right). They first presented a solidbar moving back and forth across the receptivefield. The response was vigorous in each direction(A). Then they presented the same bar, but with alarge gap in the middle, to spare the classical re-ceptive field. Under these conditions, one wouldpredict the neuron to fall silent, as there is nothingto drive the cell. However, this was not the case.Instead, the neuron continued to respond, albeitless strongly (B). This can only be explained byassuming that it received input from the two short
bars at the top and bottom. Finally, when the barswere closed off with thin lines, the response wasessentially absent (C). In this condition, the per-ception of the illusory contour also breaks down.
This finding had enormous consequences. Itmeant that we can perceptually recover an objectthat is only partially given by virtue of filling-in.It also opened the possibility of explaining anumber of illusions that are characterized by per-ceptual occlusion, such as the Kanizsa triangle andthe Ehrenstein illusion.
Kanizsa triangle
The Kanizsa (1979) triangle exhibits a triangularsurface that is brighter than the surround and de-lineated by illusory contours (Fig. 13). Althoughthe illusion is typically elicited by black solid cues(a), it will also arise from concentric rings (b), andeven small dots at the apices (c). Illusory contoursmay be straight or curved depending on the shapeof the missing sectors (d). Supporting lines juttingin from the side enhance the illusion.
Von der Heydt and Peterhans (1989) suggestedthat neurons responding to discontinuous barsalso mediate the perception of the Kanizsa triangleillusion. According to their model (Fig. 14), end-stopped neurons in area V1, whose receptive fieldsare activated by the corners at the edges of themissing sectors, feed their signals into a gatingmechanism in V2 neurons. Signals from twoaligned sectors will be multiplied (� ) and thensent to a higher order neuron, where they will besummed with the input from the straight edges ofthe missing sectors (
P). The result is an illusory
line delineating the bright triangle across the in-terspace.
This model is consistent with the observationthat the Kanizsa triangle only emerges when thethree cut-out sectors (pacmen) are properlyaligned. When they are rotated just by a smallamount, the illusion weakens and disappears. Thisneed for collinearity is an example of the Gestaltfactor of good continuation. Meanwhile, it has beenshown that mammals, birds, and even insects be-have as though they perceive the Kanizsa triangle(Nieder, 2002). This clearly speaks for a bottom-up mechanism.

Fig. 12. Perceptual completion of an incomplete bar showing brightness enhancement and illusory contours (left) and macaque responses
to variants of this stimulus (right). (A) A solid bar moved across the receptive field of a V2 neuron produces a vigorous response. (B) The
same bar with its center section missing continues to produce a response, although the classical receptive field is no longer stimulated by
this pattern. (C) When the top and bottom sections are closed off by thin orthogonal lines, they are no longer effective. Under these
conditions, the illusion on the left is also abolished. (D) Two phase-shifted gratings opposing each other elicit a response as strong as
stimulus B. (E) Control. (Reprinted from Peterhans and von der Heydt, 1991, with kind permission from Elsevier.)
77
Ehrenstein illusion
In the Ehrenstein (1954) brightness illusion, oneperceives a bright disk in the center between theradial lines, delineated by an illusory ring that isorthogonal to the inducers (Fig. 15, left). This isknown as line-end contrast. Ehrenstein pointedout that brightness enhancement disappears whena physical ring is superimposed onto the illusorycontour. This observation suggests that one needsopen gaps in order to have brightness enhance-ment. When the radial lines are laterally displacedor rotated out of alignment, the illusion becomesweaker and ultimately breaks down (for a reviewsee Spillmann and Dresp, 1995). This again is evi-dence for the role of collinearity and the Gestaltfactor of good continuation.
There is a fascinating property of the Ehrensteinillusion: the neon color effect (van Tuijl, 1975; for areview see Bressan et al., 1997). When a coloredcross is used to connect the radial lines across thecentral gap, this region appears to be tinted withthe color of the cross (Fig. 15, right). ChristophRedies (Redies and Spillmann, 1981; Redies, 1989)studied this effect in my laboratory and tentativelylinked it to line-gap enhancement and end-stoppedcells. Grossberg (‘‘I like neon’’) proposed a com-putational model that interprets neon color interms of diffusion (Grossberg and Mingolla, 1985;Pinna and Grossberg, 2005). Another well-knownillusion that shows how illusory contours areformed at right angles to the inducing line endsis the abutting grating illusion.

Fig. 13. Kanizsa triangle. The illusory triangle appears brighter than its surround and is delineated by an illusory edge. It also appears
to lie slightly above the background. Various kinds of corner cues (a�d) elicit the same illusory percept. (Modified from Kanizsa, 1974,
with kind permission from Il Mulino.)
Fig. 14. Kanizsa triangle with receptive fields (gray patches) of end-stopped cells superimposed onto the corners of the pacmen (left).
The model (right) distinguishes between two neuronal paths: an edge-detecting path (black arrows) that receives its input from the
aligned edges of the cut-out sectors; and a grouping path (gray arrows) that receives its input from the end-stopped neurons. The latter
signals are fed into a V2 neuron where they are multiplied (� ) and then sent to a higher order neuron, where they are summed with the
input from the edge-detecting path (S). In this way, an illusory contour emerges at right angles to the inducing cues for which there is
no physical equivalent. Receptive fields for the two paths are assumed to overlap on the same patch of retina. (Modified from
Peterhans and von der Heydt, 1991, with kind permission from Elsevier.)
78
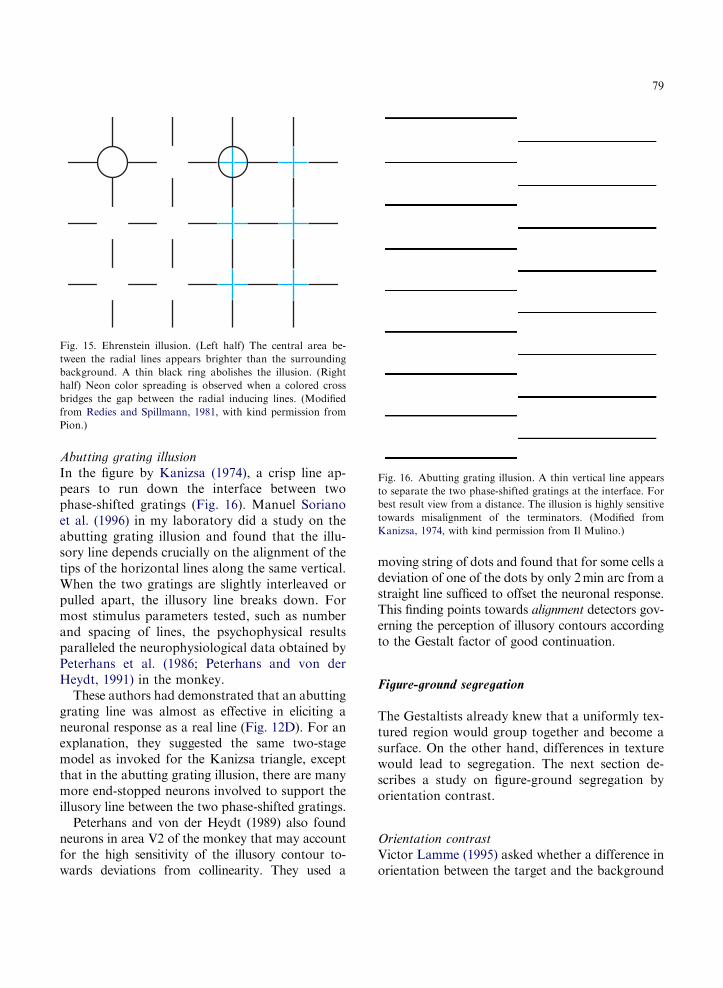
Fig. 15. Ehrenstein illusion. (Left half) The central area be-
tween the radial lines appears brighter than the surrounding
background. A thin black ring abolishes the illusion. (Right
half) Neon color spreading is observed when a colored cross
bridges the gap between the radial inducing lines. (Modified
from Redies and Spillmann, 1981, with kind permission from
Pion.)
Fig. 16. Abutting grating illusion. A thin vertical line appears
to separate the two phase-shifted gratings at the interface. For
best result view from a distance. The illusion is highly sensitive
towards misalignment of the terminators. (Modified from
Kanizsa, 1974, with kind permission from Il Mulino.)
79
Abutting grating illusion
In the figure by Kanizsa (1974), a crisp line ap-pears to run down the interface between twophase-shifted gratings (Fig. 16). Manuel Sorianoet al. (1996) in my laboratory did a study on theabutting grating illusion and found that the illu-sory line depends crucially on the alignment of thetips of the horizontal lines along the same vertical.When the two gratings are slightly interleaved orpulled apart, the illusory line breaks down. Formost stimulus parameters tested, such as numberand spacing of lines, the psychophysical resultsparalleled the neurophysiological data obtained byPeterhans et al. (1986; Peterhans and von derHeydt, 1991) in the monkey.
These authors had demonstrated that an abuttinggrating line was almost as effective in eliciting aneuronal response as a real line (Fig. 12D). For anexplanation, they suggested the same two-stagemodel as invoked for the Kanizsa triangle, exceptthat in the abutting grating illusion, there are manymore end-stopped neurons involved to support theillusory line between the two phase-shifted gratings.
Peterhans and von der Heydt (1989) also foundneurons in area V2 of the monkey that may accountfor the high sensitivity of the illusory contour to-wards deviations from collinearity. They used a
moving string of dots and found that for some cells adeviation of one of the dots by only 2min arc from astraight line sufficed to offset the neuronal response.This finding points towards alignment detectors gov-erning the perception of illusory contours accordingto the Gestalt factor of good continuation.
Figure-ground segregation
The Gestaltists already knew that a uniformly tex-tured region would group together and become asurface. On the other hand, differences in texturewould lead to segregation. The next section de-scribes a study on figure-ground segregation byorientation contrast.
Orientation contrast
Victor Lamme (1995) asked whether a difference inorientation between the target and the background

Fig. 17. Texture contrast by orientation (left). Neuron response in area V1 of the monkey (right). Boxes (a�d) illustrate schematically
the stimulus relative to the background. The neuronal response is enhanced when the orientation of the target is orthogonal to that of
the background. Note that the receptive field of the neuron (black rectangle) is entirely enclosed within the target (boundary not shown
in the experiment). The difference in response must therefore be due to long-range interaction. (Modified from Lamme, 1995, with kind
permission from the Society for Neuroscience.)
Fig. 18. Contour integration. (a) Aligned Gabor patches on a background of randomly oriented Gabor patches pop out perceptually
when arranged as a semicircular curve, (b) but even more so when forming a complete circle. The number and overall distribution of
Gabor patches is the same in both patterns, but the response of the brain is not. These percepts may be attributed to the Gestalt factors
of good continuation and closure. (From Kovacs and Julesz, 1993, with kind permission from the National Academy of Sciences of the
United States of America.)
80
81
would affect the neuronal response, even if the re-ceptive field of the neuron, onto which the targetwas superimposed, did not receive direct input fromthe surrounding background (Fig. 17). He foundthat when the orientation of the target was or-thogonal to that of the background, the neuronalresponse was large (a) and (c). However, when theorientation of the target was the same as that of thebackground, the response was small (b) and (d).The difference in response between the two condi-tions suggested that the background had an effecton the target response through long-range interac-tions. This experiment shows that figure-groundsegregation by orientation contrast can occur asearly as area V1 (see also Lamme et al., 1992). Inthe cat, responses to motion contrast have also beenfound in striate cortex (Kastner et al., 1999).
Contour integration
While alignment plays a role in illusory contourformation, it is also essential for perceptual group-ing. I had first seen chains of aligned Gaborpatches in Robert Hess’ laboratory in Montreal(Field et al., 1993), but at the time did not appre-ciate their importance for contour integration. Fig.18 is from the work of Kovacs and Julesz (1993). Itshows an assembly of Gabor patches with differentorientations. Within this pattern, there are sixpatches that line up to form a curvilinear contour(a). This is an example of the Gestalt factor of good
continuation. However, the curved contour popsout much more easily when the ring is complete(b). This is an example of the Gestalt factor of
closure. Obviously, the neuronal mechanism un-derlying this kind of contour integration must beeffective over a rather large distance; otherwise,there would be no grouping (Spillmann andWerner, 1996).
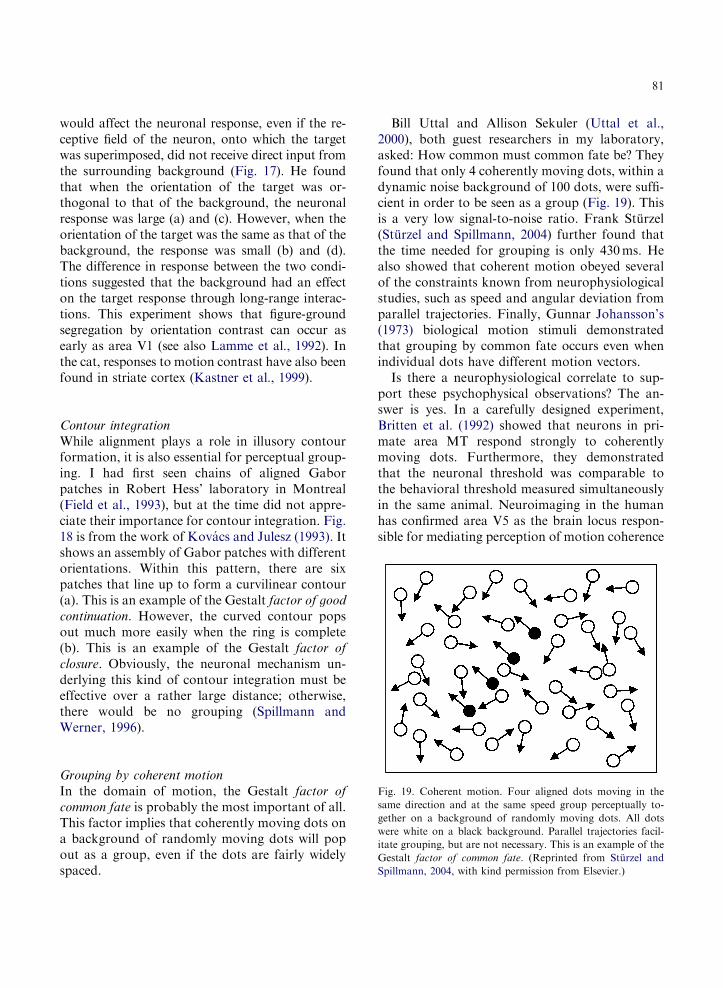
Fig. 19. Coherent motion. Four aligned dots moving in the
same direction and at the same speed group perceptually to-
gether on a background of randomly moving dots. All dots
were white on a black background. Parallel trajectories facil-
itate grouping, but are not necessary. This is an example of the
Gestalt factor of common fate. (Reprinted from Sturzel and
Spillmann, 2004, with kind permission from Elsevier.)
Grouping by coherent motion
In the domain of motion, the Gestalt factor of
common fate is probably the most important of all.This factor implies that coherently moving dots ona background of randomly moving dots will popout as a group, even if the dots are fairly widelyspaced.
Bill Uttal and Allison Sekuler (Uttal et al.,2000), both guest researchers in my laboratory,asked: How common must common fate be? Theyfound that only 4 coherently moving dots, within adynamic noise background of 100 dots, were suffi-cient in order to be seen as a group (Fig. 19). Thisis a very low signal-to-noise ratio. Frank Sturzel(Sturzel and Spillmann, 2004) further found thatthe time needed for grouping is only 430ms. Healso showed that coherent motion obeyed severalof the constraints known from neurophysiologicalstudies, such as speed and angular deviation fromparallel trajectories. Finally, Gunnar Johansson’s(1973) biological motion stimuli demonstratedthat grouping by common fate occurs even whenindividual dots have different motion vectors.
Is there a neurophysiological correlate to sup-port these psychophysical observations? The an-swer is yes. In a carefully designed experiment,Britten et al. (1992) showed that neurons in pri-mate area MT respond strongly to coherentlymoving dots. Furthermore, they demonstratedthat the neuronal threshold was comparable tothe behavioral threshold measured simultaneouslyin the same animal. Neuroimaging in the humanhas confirmed area V5 as the brain locus respon-sible for mediating perception of motion coherence

82
(Braddick et al., 2000). Evidence from a recentstudy by Peterhans et al. (2005) further showsstrong responses to rows of coherently movingdots already in macaque areas V2 and V3. Theseresults demonstrate that the Gestalt factor of com-mon fate is a basic mechanism of our neuronalinventory.
Many of the Gestalt factors mentioned can befound in the animal kingdom in the interest ofcamouflage. In his book, Laws of Seeing, WolfgangMetzger (1936) showed that it is not just mam-mals that break figure-ground segmentation to hidefrom predators, but also insects, fishes and birds.The purpose is to blend in with the ground.Ramachandran et al. (1996) demonstrated that aflounder displays on its skin the texture of a check-erboard on which it is placed. This is amazing as itoccurs within minutes. Hiding through camouflageis particularly effective when an animal ‘‘freezes,’’although in a moving environment the absence ofmotion will likely reveal an animal.
Metzger argued that if predators get fooled bycamouflage much in the same way as we do, theirvisual systems must be processing information in away similar to ours. He therefore considered theGestalt factors to be both innate and bottom-up.However, the early Gestaltists already knew thatthere were also top-down effects such as attention,set, motivation, and memory. Neurophysiolo-gists, especially Mountcastle (1998) and Schiller(1998), have actively investigated the feedbackloops, including guided eye movements, requiredfor top-down modulation. It is now clear that vis-ual perception uses both bottom-up and top-downprocesses.
Fading and filling-in
Troxler effect
The previous sections emphasized the spatial aspectsof the perceptive field organization and grouping.This section will address the temporal aspects. Herewe asked how a surface is sustained over time. StuartAnstis’ chapter in this volume mentions some of ourearlier studies on the Troxler effect using static, rota-ting, and flickering targets. Christa Neumeyer in ourlaboratory was the first to study fading of large,
centrally fixated disks (Neumeyer and Spillmann,1977). She used various figure-ground contrasts andfound that figures typically fade into the ground, notvice versa. Furthermore, when an oscillating gratingsurrounded the target, fading time was shorter. Thisobservation is consistent with a later finding that akinetic contour facilitates fading, rather than delay-ing it (Spillmann and Kurtenbach, 1992).
Research into fading picked up with the beau-tiful effects on color and texture filling-in demon-strated by Ramachandran and Gregory (1991).These findings involved grating patterns and pageprint, suggesting a postretinal origin. A few yearslater, Peter DeWeerd et al. (1995) showed neuro-physiologically that texture fading occurred inarea V3 of the visual cortex.
DeWeerd used a pattern with a white square ona dynamic background of vertical slashes (Fig. 20,top). The white target is called an artificial scotoma
in analogy to a real scotoma. To make this targetdisappear, fixate at the small disk in the upper leftcorner for about 15 s. While fixating, you will seethat the white target area becomes less distinct andeventually fades into the background. This is anexample of texture spreading or filling-in. DeWeerddistinguished between two processes: a slow proc-ess for breaking down the border (cancellation)and a fast process for filling-in properties from thesurround (substitution).
In Fig. 20 (bottom), the response rate of a V3neuron in the monkey is plotted as a functionof time. The continuous curve (hole) shows theresponse when the white target was present overthe receptive field and the dotted curve the responsewhen there was no hole in the background. Thecontinuous curve first decreases, then gradually in-creases, and finally approaches the upper controlcurve. The interesting aspect here is that the firingrate for the ‘‘hole’’ condition recovers over time, al-though there is no change in the stimulus.
DeWeerd interpreted this ‘‘climbing activity’’ asthe neuronal correlate of fading. When the twocurves merged, the neuron could no longer distin-guish between the two types of stimuli. He thenasked human observers to look at the same patternwith steady fixation and report when the whitetarget had faded into the background. The timeneeded for perceptual completion was quite similar

Fig. 20. Fading and filling-in. (Top) With fixation at FP, the white square on the dynamic noise field will quickly fade and become
embedded in the background. (Bottom) Neuron response in area V3 of the monkey during fixation of the stimulus with the white
square (‘‘hole’’) and to a control stimulus presented without the white square (no hole). The receptive field of the neuron was located
well within the square. The two curves converge at about the same time when human observers report (shaded area) that the white
square has faded into the background. (Reprinted from De Weerd et al., 1995, with kind permission from Nature Publishing Group.)
83
to the time required for neuronal completion(shaded area). When a red square was used for atarget, fading time increased. This suggests aneffect of stimulus salience.
Texture fading
Ralf Teichmann in our laboratory studied theeffect of salience on fading time, systematically(Teichmann and Spillmann, 1997). He presented a
striped target disk within a grating backgroundand varied the difference in angle between the tar-get and the background (Fig. 21). Fading time waslongest when target and background were orientedapproximately orthogonally to each other, i.e.,when the target was most salient.
Catherine Hindi Attar has recently taken this ap-proach one step further. She used two patterns byGiovanni Vicario (1998), a randomly oriented centerwithin a uniformly oriented surround (Fig. 22, left)

84
and its converse, a uniformly oriented center withina randomly oriented surround (Fig. 22, right). Al-though the two patterns are made up from the sametextures, they do not have the same perceptual sa-lience. The center with the randomly oriented barsstands out much more clearly than its converse, andit takes several seconds longer to fade. This may bebecause this type of texture activates many orienta-tion channels, thereby producing a stronger neuronalresponse than a uniform texture. (For a review seeSpillmann and DeWeerd, 2003.)
Filling-in of the blind spot
While filling-in of an artificial scotoma requires atrained observer and good fixation, filling-in over
Fig. 21. Fading time plotted as a function of orientation con-
trast between target and background. The striped target disk
was 21 in diameter and was centered at 151 from fixation. The
spatial frequency of the target and background was 0.8 cpd.
Results are averages for one presentation each in nine observ-
ers. (Reprinted from Teichmann and Spillmann, 1997, with
kind permission from Thieme.)
Fig. 22. ‘‘Order versus chaos.’’ The left and right patterns are compos
exchanged. The target on the left looks more salient than the one on th
in the middle. (Reprinted from Vicario, 1998, with kind permission f
the area of the blind spot is effortless and imme-diate (Ramachandran and Gregory, 1991). This isbecause in the first case, the hole is in the physicalstimulus and must first be adapted to before it isfilled-in with the color and pattern of the surround.In the case of the blind spot, however, the hole is onthe retina and it has been there since birth. It istherefore not surprising that nature has provided uswith a mechanism that replaces the hole with thestimulus properties of the surround without ourdoing. There are no photoreceptors in the retinalarea corresponding to the blind spot and thereforeno signals from there reach the brain. Nevertheless,we do not normally notice the blind spot. Even ifwe close one eye, we do not see it, although it isquite large (61� 91). We asked, how much infor-mation at the edge is needed to fill-in the blind spot?
We started by plotting the blind spot of my lefteye. Once the blind spot had been charted, wepresented a large red blob, somewhat larger thanthe blind spot (Fig. 23, top). It looked uniform —as it should. Then we cut out the center (Fig. 23,bottom). It still looked uniformly red. Finally, wereduced the width of the frame, making it nar-rower and narrower until it no longer becamefilled-in. In this way we arrived at a critical framewidth of 6 arcmin for the minimum informationnecessary to fill-in the blind spot.
The same procedure was used for a texturedbackground (stripes, dots). Here the critical width ofthe surrounding frame was about three times greaterthan for color, implying that more informationwas needed. However, uniform filling-in often wasshort-lived due to unstable fixation. Slight deviationsof the eye from the fixation point resulted in partial
ed of the same two textures, however, with target and surround
e right and also takes longer to fade. Fixation is on the black dot
rom Springer Science and Business Media.)

Fig. 23. Filling-in of the blind spot. (Top) A large red patch overlapping with the blind spot appeared uniformly colored, although
there are no photoreceptors in the central area to signal its color to the brain. (Bottom) A narrow annulus at the edge of the blind spot
had the same perceptual effect, suggesting that little information is required for filling-in. With strict fixation and under controlled
stimulus conditions, a frame of only a few arcmin was found to suffice for uniform and complete filling-in. (Photo: Tobias Otte.)
85
filling-in, indicating that the frame was no longerspatially contiguous and in register to the border ofthe blind spot. To explain filling-in of the blind spot,we suggest a neuronal mechanism that detects thecolor at the edge and actively propagates it fromthere into the area of the blind spot (Spillmann et al.,2006).
Retinal scotomata
Next we asked whether acquired scotomata, such asthose caused by a retinal lesion, also fill in. The
answer is yes. Fig. 24 schematically presents amechanism to account for filling-in. Neurons re-spond when light falls onto their receptive fields(left). However, when a patch of retina is destroyedby photocoagulation, the deafferented neuron fallssilent and, as a consequence, there will be a scotomain the visual field. Surprisingly, the silence lasts onlyfor a short while. Charles Gilbert (1992) has shownthat only a few minutes after deafferentation aneuron in area V1 will begin to fire again when lightfalls onto the area surrounding the lesion (see alsoSpillmann and Werner, 1996).
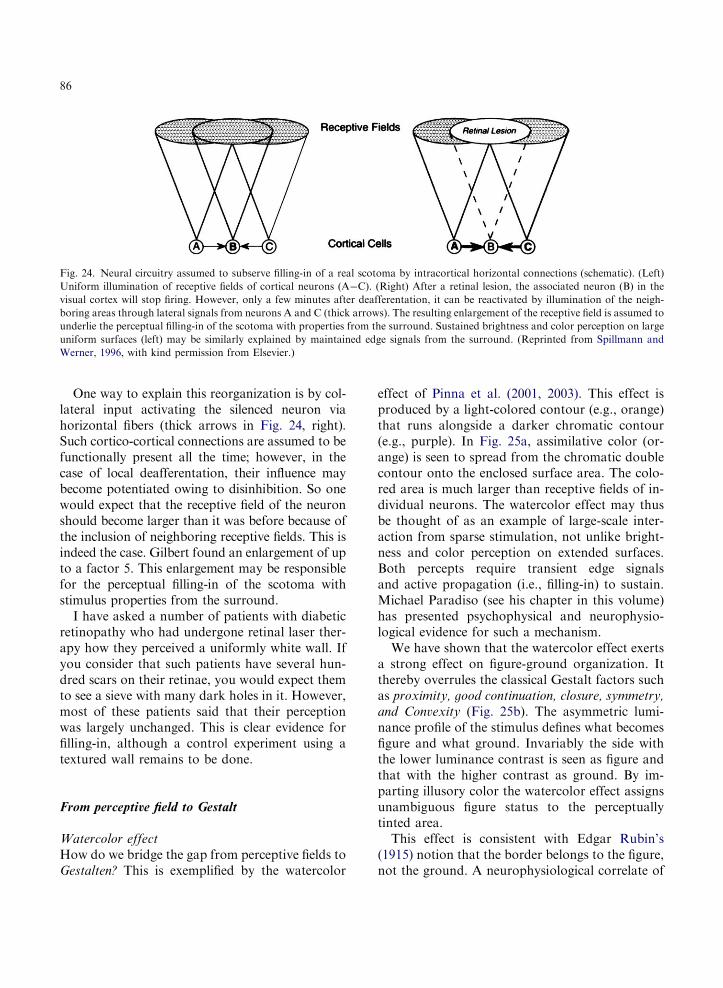
Fig. 24. Neural circuitry assumed to subserve filling-in of a real scotoma by intracortical horizontal connections (schematic). (Left)
Uniform illumination of receptive fields of cortical neurons (A�C). (Right) After a retinal lesion, the associated neuron (B) in the
visual cortex will stop firing. However, only a few minutes after deafferentation, it can be reactivated by illumination of the neigh-
boring areas through lateral signals from neurons A and C (thick arrows). The resulting enlargement of the receptive field is assumed to
underlie the perceptual filling-in of the scotoma with properties from the surround. Sustained brightness and color perception on large
uniform surfaces (left) may be similarly explained by maintained edge signals from the surround. (Reprinted from Spillmann and
Werner, 1996, with kind permission from Elsevier.)
86
One way to explain this reorganization is by col-lateral input activating the silenced neuron viahorizontal fibers (thick arrows in Fig. 24, right).Such cortico-cortical connections are assumed to befunctionally present all the time; however, in thecase of local deafferentation, their influence maybecome potentiated owing to disinhibition. So onewould expect that the receptive field of the neuronshould become larger than it was before because ofthe inclusion of neighboring receptive fields. This isindeed the case. Gilbert found an enlargement of upto a factor 5. This enlargement may be responsiblefor the perceptual filling-in of the scotoma withstimulus properties from the surround.
I have asked a number of patients with diabeticretinopathy who had undergone retinal laser ther-apy how they perceived a uniformly white wall. Ifyou consider that such patients have several hun-dred scars on their retinae, you would expect themto see a sieve with many dark holes in it. However,most of these patients said that their perceptionwas largely unchanged. This is clear evidence forfilling-in, although a control experiment using atextured wall remains to be done.
From perceptive field to Gestalt
Watercolor effect
How do we bridge the gap from perceptive fields toGestalten? This is exemplified by the watercolor
effect of Pinna et al. (2001, 2003). This effect isproduced by a light-colored contour (e.g., orange)that runs alongside a darker chromatic contour(e.g., purple). In Fig. 25a, assimilative color (or-ange) is seen to spread from the chromatic doublecontour onto the enclosed surface area. The colo-red area is much larger than receptive fields of in-dividual neurons. The watercolor effect may thusbe thought of as an example of large-scale inter-action from sparse stimulation, not unlike bright-ness and color perception on extended surfaces.Both percepts require transient edge signalsand active propagation (i.e., filling-in) to sustain.Michael Paradiso (see his chapter in this volume)has presented psychophysical and neurophysio-logical evidence for such a mechanism.
We have shown that the watercolor effect exertsa strong effect on figure-ground organization. Itthereby overrules the classical Gestalt factors suchas proximity, good continuation, closure, symmetry,
and Convexity (Fig. 25b). The asymmetric lumi-nance profile of the stimulus defines what becomesfigure and what ground. Invariably the side withthe lower luminance contrast is seen as figure andthat with the higher contrast as ground. By im-parting illusory color the watercolor effect assignsunambiguous figure status to the perceptuallytinted area.
This effect is consistent with Edgar Rubin’s(1915) notion that the border belongs to the figure,not the ground. A neurophysiological correlate of

Fig. 25. Watercolor effect. Pinna’s watercolor effect is an example of large-scale color assimilation arising from thin color boundaries.
(a) A wiggly purple contour flanked by a lighter orange fringe elicits the perception of uniform orange coloration on the enclosed white
surface area. The illusory surface appears to be slightly elevated relative to its surround. (Reprinted from Pinna, Brelstaff and
Spillmann, 2001, with kind permission from Elsevier). (b) The watercolor effect overrules the classical Gestalt factors. In Rubin’s
(1915) Maltese cross (top) the narrow sectors are normally seen as figure. However, if pitted against the watercolor effect, the wider
sectors are seen as figure, regardless of the factor of proximity. Similarly in the example of an undulating line superimposed onto a
crenellated line or Greek fret (bottom), the factor of good continuation is overruled in favor of seeing closed cells. (Modified from Pinna
et al., 2003, with kind permission from Elsevier.)
87
border ownership may be sought in area V2 neu-rons that respond to an edge — such as black andwhite — in one direction, but not in the other(Zhou et al., 2000; Qiu and von der Heydt, 2005).Neurocomputational models of form perceptionassume that the outflow of color depends on aweakening of the boundary between differentiallyactivated edge neurons through lateral inhibition.The resultant assimilative color spreads throughthe enclosed surface area until it is stopped byboundary contours on the other side (Pinna andGrossberg, 2005).
Fig. 26. Knut Nordby (1942–2005). (Photo from K.N.’s web-
site on the Internet.)
Part C. Reminiscences and outlook
The studies mentioned so far cover only a fractionof what we did in Freiburg. Of the numerous otherexperiments, I will only mention the research onrod-monochromacy. We were fortunate to haveKnut Nordby from Oslo, a former student andcolleague of Svein Magnussen’s (Fig. 26). Knuthad no cones in his retinae, a very rare condition,making him an ideal subject for the study of rodvision.
Mark Greenlee and Svein Magnussen (Greenleeet al., 1988) looked at Knut’s spatial contrast sen-sitivity and orientation tuning and found thatKnut had very low spatial frequency channels.They suggested that these had evolved by adaptingto the lack of cones in his retinae. Arne Valbergsays that he also had a much better contrast sen-sitivity, possibly due to reduced lateral inhibition.

88
For an account of his childhood and youth, see hisautobiographic book chapter (Nordby, 1990).
Thereafter, Ted Sharpe (Sharpe and Nordby,1990) in a series of sophisticated experimentslooked at Knut’s vision from every angle. Someof the very best threshold curves in the literaturecame from this research, although Knut could notfixate. This testifies to his patience and dedication.Invitations from Cambridge and other prestigiouslaboratories followed. In the end he was theworld’s best-researched rod monochromat. In2004, we learned that Knut was very ill. Sadly,he died on April 25, of the following year.
There are a large number of experiments that Ican only list by name: studies on Stiles’ p-mecha-nisms by Charles Stromeyer and Charles Sternheim;studies on the nature of brown by Ken Fuld, JackWerner, and Billy Wooten; masking and metacon-trast studies by Bruno Breitmeyer; studies on the tilteffect and tilt aftereffect by Svein Magnussen andWolfgang Kurtenbach; and studies on the Abneyeffect by Wolfgang Kurtenbach; experiments on theso-called Ouchi illusion by myself (Spillmann et al.,1986) and the motion aftereffect by Nick Wade; astudy by Holger Knau on the Ganzfeld; and studieson the persistence of moving arcs by AdamGeremek; a beautiful collaboration with BarbaraHeider and Esther Peterhans from Zurich on stereo-scopic illusory contours in man and monkey. Studieson S-cones by Keizo Shinomori and on the fovealblue scotoma by Svein Magnussen and FrankSturzel were done in collaboration with Jack Werner
Fig. 27. Wolfgang Metzger (1899�1979), Richard Jung (1911�1986
in Sacramento. On a different topic, Mark Greenleeand Svein Magnussen together with Jim Thomasand Rolf Muller conducted a whole series of experi-ments on grating adaptation and short-term mem-ory. There were clinically oriented studies by WalterEhrenstein on interocular time thresholds in MS-pa-tients, and by myself and Dieter Schmidt on partialrecovery in prosopagnosia (patient WL). Lately wehave also become interested in functional magneticresonance imaging of the Pinna�Brelstaff illusion incollaboration with the Freiburg Department of Ra-diology. I think we have gone a long way.
Looking back, I guess I was lucky. I had excellentteachers: Wolfgang Metzger in Munster, RichardJung in Freiburg, and Hans-Lukas Teuber in Cam-bridge, MA (Fig. 27). From them I learned muchabout Gestalt psychology, neurophysiology, andneuropsychology. In 1966, I entered Ernst Wolf’slaboratory in Boston, a German expatriate and ut-terly decent man, who introduced me to visual psy-chophysics, clinical testing of eye patients, andelectrophysiology. I inherited from him my love foroptical and mechanical apparatus and precise meas-urement. Ernst told me about Selig Hecht’s labo-ratory at Columbia and his early years at theHarvard laboratories of Comparative Zoology.Nobody knew his age, but he was as active, enthu-siastic, and untiring as anyone. All these peopletaught me a lot, but — most importantly — theymade me aware that we stand on the shoulders ofothers that paved the way. Sadly, most of our he-roes and heroines from that time are no longer with
), and Hans-Lukas Teuber (1916�1976). (Sources unknown.)

89
us. But our admiration, respect, and affection forthem continue.
It is the same with equipment. Who still remem-bers the cherished apparatus we used? Stimulusgenerators, oscilloscopes, Tektronix 602 displays,tachistoscopes, Maxwellian view systems? High-quality optics were necessary, precisely alignedcomponents, stable light sources, IR and UV fil-ters, prisms, collimators, achromatic lenses, firstsurface mirrors, narrow-band monochromators,electromagnetic shutters, neutral-density wedges,step filters, adjustable apertures, prisms, pellicles,and beamsplitters. All observations were donewith subjects supporting themselves on a dentist-fitted, adjustable bite bar, so that the exit aperturewas centered in the pupil. Highly sensitive radio-photometers were required for precise calibration.You had to be good with the soldering iron, too.
This is a bygone time. But I do remember howimpressed I was when I visited Richard Gregory’slaboratory in Cambridge in the late 1960s. Itlooked more like a mechanics workshop than avision lab: Helen Ross was sitting in a swing test-ing for size constancy. In Freiburg, individualspikes were counted from a filmstrip (sometimesusing an abacus), Jerry Lettvin listened to neu-ronal spike activity simply by ear, and Hubel andWiesel used a stick and a screen to find orienta-tion-specific neurons in the cat. Baumgartner mayhave missed his chance because it took too long tobuild an apparatus for precise stimulus presenta-tion (Jung, 1975). There should be a museum tokeep these memories alive. A whole generation ofexpertise in building instrumentation for the lifesciences seems to have gone lost. Nowadays, com-puters are much faster, more convenient, andpowerful. Sometimes, I feel like a man from theStone Age. But not everything can be done using amonitor.
Epilogue
May I end by saying: It was wonderful. We had allthe freedom in the world to do what we wanted,where, when, and with whom. We have preciousmemories of the many guests and visitors who cameto Freiburg. It is great to see the international
vision community growing. National borders nolonger play a role. The East has opened up, so thatwe see more and more representatives of thosecountries. In fact, the 2006 European Conference on
Visual Perception will take place in St. Petersburg.Scientists are so much better than politicians atstriking friendly relationships.
It is also rewarding to see that in Germany thereare many more psychophysics laboratories nowthan there were in 1971, when we started. For 25years I sent out information on jobs and positionsto several hundred addresses via D-CVnet, to keepthe German vision community together. Vision re-search is now actively pursued in Mainz, Frankfurt,Dusseldorf, Dortmund, Munster, Bremen, Kiel,Potsdam, Giessen, Tubingen, Ulm, Regensburg,and Munich, among other places. The Freiburglaboratory, regrettably, was discontinued, althoughit was one of the few that enabled young Germanstudents to collaborate with established vision re-searchers from other countries. Wolfgang Kurten-bach and Frank Sturzel had as many as six paperseach, jointly published with senior faculty from theUS, Canada, and Scandinavia before receiving theirdoctorate.
Finally, I will always be grateful to my collab-orators for their loyalty and help. None of the re-search that came out of our laboratory could havebeen done without them. Numerous publicationsowe their existence to the long-standing scientificexchange with the laboratories in Boulder, Sa-cramento, Oslo, Trondheim, Dortmund, Sassari,Padua, and New York. The social side of sciencealways meant a great deal to me. Looking over thepast 35 years, I will not forget the unfailing helpreceived from my friends in the vision communitiesin Boston, Cambridge, MA, and Berkeley. I thankthe University of Freiburg, the German ResearchCouncil, the Alexander von Humboldt-Founda-tion, the German Academic Exchange Program,and the other funding agencies for their most gen-erous support. And I thank my family.
Summary
I have attempted to show how the study of simpleperceptual phenomena enables us to learn more

90
about the neuronal processing of visual stimuli inthe human brain. Examples include the Hermanngrid illusion, illusory contours, figure-ground seg-regation, coherent motion, fading and filling-in,and large-scale color assimilation.
The term perceptive field is heuristically valuableas it provides the bridge from the phenomenon tothe underlying receptive field organization. The cor-relation between the two is not just qualitative; italso enables quantitative comparisons. Gestalt phe-nomena that were observed 80 years ago have notlost any of their meaning; to the contrary, they evenhave gained in importance. With today’s know-ledge of neuronal mechanisms, they serve as non-invasive tools to gain insight into the processes ofhow the visual system organizes the seemingly be-wildering wealth of information from the outsideworld.
In his seminal article on visual perception andneurophysiology, Richard Jung (1973) published atable of neurophysiological correlates summariz-ing much of the Freiburg work. Given the speed oftoday’s progress and the enthusiasm of researchersin the field of vision (Chalupa and Werner, 2004),we have good reasons to hope that in the next 30years the neuronal mechanisms and processes un-derlying visual perception will be largely unveiled.
Acknowledgements
I thank S.C. Benzt for transcribing my talk atECVP 2005 in A Coruna (Spain). The additionalhelp by W.H. Ehrenstein, E. Peterhans, B. Heider,J.S. Werner, A. Kurtenbach, C. Stromeyer, and B.Breitmeyer is greatly appreciated. Tobias Ottekindly modified and assembled the figures.
References
Barlow, H.B., Fitzhugh, R. and Kuffler, W.S. (1957) Change of
organisation in the receptive fields of the cat’s retina during
dark adaptation. J. Physiol. (Lond.), 137: 338–354.
Baumgartner, G. (1960) Indirekte Grossenbestimmung der re-
ceptiven Felder der Retina beim Menschen mittels der Her-
mannschen Gittertauschung. Pflugers Arch., 272: 21–22.
Baumgartner, G. (1961) Die Reaktionen der Neurone des
zentralen visuellen Systems der Katze im simultanen Hell-
igkeitskontrast. In: Jung, R. and Kornhuber, H.-H. (Eds.),
Neurophysiologie und Psychophysik des visuellen Systems.
Springer, Berlin, pp. 296–313.
Baumgartner, G. (1990) Where do visual signals become a per-
ception? In: Eccles J. and Creutzfeldt O. (Eds.), The Princi-
ples of Design and Operation of the Brain, Vol. 78.
Pontificiae Academiae Scientiarum Scripta Varia, Vatican
City, pp. 99�114.
Baumgartner, G., von der Heydt, R. and Peterhans, E. (1984)
Anomalous contours: a tool in studying the neurophysiology
of vision. Exp. Brain Res., (Suppl.), 9: 413–419.
Braddick, O.J., O’Brien, J.M.D., Wattam-Bell, J., Atkinson, J.
and Turner, R. (2000) Form and motion coherence activate
independent, but not dorsal/ventral segregated, networks in
the human brain. Curr. Biol., 10: 731–734.
Breitmeyer, B. and Valberg, A. (1979) Local foveal inhibitory
effects of global peripheral excitation. Science, 203: 463–464.
Bressan, P., Mingolla, E., Spillmann, L. and Watanabe, T.
(1997) Neon color spreading. Perception, 26: 1353–1366.
Britten, K.H. (2004) The middle temporal area: motion process-
ing and the link to perception. In: Chalupa, L.M. and
Werner, J.S. (Eds.), The Visual Neurosciences. The MIT
Press, Cambridge, MA, pp. 1203–1216.
Britten, K.H., Shadlen, M.N., Newsome, W.T. and Movshon,
J.A. (1992) The analysis of visual motion: a comparison of
neuronal and psychophysical performance. J. Neurosci., 12:
4745–4765.
Chalupa, L. and Werner, J.S. (Eds.). (2004) The Visual Neu-
rosciences. The MIT Press, Cambridge, MA.
DeMonasterio, F.M. and Gouras, P. (1975) Functional prop-
erties of ganglion cells of the rhesus monkey retina. J.
Physiol. (Lond.), 251: 167–195.
DeWeerd, P., Gattas, R., Desimone, R. and Ungerleider, L.G.
(1995) Responses of cells in monkey visual cortex during
perceptiual filling-in of an artifical scotoma. Nature, 377:
731–734.
Drasdo, N. (1977) The neural representation of visual space.
Nature, 266: 554–556.
Ehrenstein, W.H. (1954) Probleme der ganzheitspsychologisc-
hen Wahrnehmungslehre (3rd edn). Barth, Leipzig.
Ehrenstein, W.H., Spillmann, L. and Sarris, V. (2003) Gestalt
issues in modern neuroscience. Axiomathes, 13: 433–458.
Field, D.J., Hayes, A. and Hess, R.F. (1993) Contour integra-
tion by the human visual system — evidence for a local as-
sociation field. Vision Res., 33: 173–193.
Gilbert, C.D. (1992) Horizontal integration and cortical dy-
namics. Neuron, 9: 1–13.
Greenlee, M.W., Magnussen, S. and Nordby, K. (1988) Spatial
vision of the achromat: spatial frequency and orientation-
specific adaptation. J. Physiol. (Lond.), 395: 661–678.
Grossberg, S. and Mingolla, E. (1985) Neural dynamics of form
perception: boundary completion, illusory figures, and neon
color spreading. Psychol. Rev., 92: 173–211.
Grusser, O.-J., Kapp, H. and Grusser-Cornehls, U. (2005) Mi-
croelectrode investigations of the visual system at the De-
partment of Clinical Neurophysiology, Freiburg i.Br.: a
historical account of the first 10 years, 1951–1960. J. Hist.
Neurosci., 14: 257–280.

91
Hubel, D.H. and Wiesel, T.N. (1974) Uniformity of monkey
striate cortex: a parallel relationship between field size,
scatter and magnification factor. J. Comp. Neurol., 158:
295–306.
Johansson, G. (1973) Visual perception of biological motion and
a model of its analysis. Percept. Psychophys., 14: 201–211.
Jung, R. (1961) Korrelation von Neuronentatigkeit und Sehen.
In: Jung, R. and Kornhuber, H.-H. (Eds.), Neurophysiologie
und Psychophysik des visuellen Systems. Springer, Berlin, pp.
410–435.
Jung, R. (1973) Visual perception and neurophysiology. In: Jung,
R. (Ed.) Handbook of Sensory Physiology, Vol VII/3A, Cen-
tral Processing of Visual Information. Springer, Berlin, N Y,
pp. 1–152.
Jung, R. (1975) Some European scientists: a personal tribute.
In: Worden, F.G., Swazey, J.P. and Adelman, G. (Eds.), The
Neurosciences: Paths of Discovery. The MIT Press, Cam-
bridge, MA, pp. 447–511.
Jung, R. and Kornhuber, H.-H. (Eds.). (1961) Neurophysiologie
und Psychophysik des visuellen Systems. Springer, Berlin.
Jung, R., Spillmann, L. (1970) Receptive-field estimation and
perceptual integration in human vision. In: Young, F.A. and
Lindsley, D.B. (Eds.), Early Experience and Visual Informa-
tion Processing in Perceptual and Reading Disorders. Proc.
Natl. Acad. Sci., Washington DC, pp. 181�197.
Kanizsa, G. (1974) Contours without gradients or cognitive
contours? Italian J. Psychol., 1: 93–112.
Kanizsa, G. (1979) Organization in Vision. Essays on Gestalt
Perception. Praeger, New York.
Kastner, S., Nothdurft, H.-C. and Pigarev, I.N. (1999) Neu-
ronal responses to orientation and motion contrast in cat
striate cortex. Visual Neurosci., 15: 587–600.
Kovacs, I. and Julesz, B. (1993) A closed curve is much more
than an incomplete one: effect of closure in figure-ground
segmentation. Proc. Natl. Acad. Sci. USA, 90: 7495–7497.
Lamme, V.A. (1995) The neurophysiology of figure-ground
segregation in primary visual cortex. J. Neurosci., 15:
1605–1615 1995.
Lamme, V.A., van Dijk, B.W. and Spekreijse, H. (1992) Or-
ganization of contour from motion processing in primate
visual cortex. Vision Res., 34: 721–735.
Livingstone, M.S. (2002) Vision and Art. The Biology of See-
ing. Harry N. Abrams, New York.
Livingstone, M.S. and Hubel, D.H. (1987) Psychophysical
evidence for separate channels for the perception of form,
color, movement, and depth. J. Neurosci., 7: 3416–3468.
McIlwayn, J.T. (1964) Receptive fields of optic tract axons
and lateral geniculate cells: peripheral extent and barbiturate
sensitivity. J. Neurophysiol., 27: 1154–1174.
Metzger, W. (1936) Gesetze des Sehens (1st edn.). Kramer,
Frankfurt/M. Engl. Transl. (2006) Laws of Seeing. MIT
Press, Cambridge, MA.
Mountcastle, V.B. (1998) Perceptual Neuroscience: The Cere-
bral Cortex. Harvard University Press, Cambridge, MA.
Neumeyer, C. and Spillmann, L. (1977) Fading of steadily fix-
ated large test field in extrafoveal vision. Pflugers Arch., 368:
R40 (Abstract).
Nieder, A. (2002) Seeing more than meets the eye: processing of
illusory contours in animals. J. Comp. Physiol. A, 188:
249–260.
Nordby, K. (1990) Vision in a complete achromat: a personal
account. In: Hess, R.F., Sharpe, L.T. and Nordby, K. (Eds.),
Night Vision: Basic, Clinical and Applied Aspects. Cam-
bridge University Press, Cambridge, pp. 290–315 (Chapter 8).
Oehler, R. (1985) Spatial interactions in the rhesus monkey
retina: a behavioural study using the Westheimer paradigm.
Exp. Brain Res., 59: 217–225.
Peterhans, E., Heider, B. and Baumann, R. (2005) Neurons in
monkey visual cortex detect lines defined by coherent motion
of dots. Euro. J. Neurosci., 21: 1091–1100.
Peterhans, E. and von der Heydt, R. (1991) Subjective contours
— bridging the gaps between psychophysics and physiology.
Trends Neurosci., 14: 112–119.
Peterhans, E., von der Heydt, R. and Baumgartner, G. (1986)
Neuronal responses of illusory contour stimuli reveal stages
of visual cortical processing. In: Pettigrew, J.D., Sanderson,
K.J. and Levick, W.R. (Eds.), Visual Neuroscience. Cam-
bridge University Press, Cambridge, pp. 343–351.
Pinna, B., Brelstaff, G. and Spillmann, L. (2001) Surface color
from boundaries: a new ‘watercolor’ illusion. Vision Res., 41:
2669–2676.
Pinna, P. and Grossberg, S. (2005) The watercolor illusion and
neon color spreading: a unified analysis of new cases and
neural mechanisms. J. Opt. Soc. Am. A, 22: 2207–2221.
Pinna, B., Werner, J.S. and Spillmann, L. (2003) The water-
color effect: a new principle of grouping and figure-ground
organization. Vision Res., 42: 43–52.
Qiu, F.T. and von der Heydt, R. (2005) Figure and ground in
the visual cortex: V2 combines stereoscopic cues with Gestalt
rules. Neuron, 47: 155–166.
Ramachandran, V.S. and Gregory, R.L. (1991) Perceptual fill-
ing in of artificially induced scotomas in human vision. Na-
ture, 350: 699–702.
Ramachandran, V.S., Tyler, C.W., Gregory, R.L., Rogers-
Ramachandran, D., Duensing, S., Pillsbury, C. and Rama-
chandran, C. (1996) Rapid adaptive camouflage in tropical
flounders. Nature, 379: 815–818.
Ransom-Hogg, A. and Spillmann, L. (1980) Perceptive field size
in fovea and periphery of the light- and dark-adapted retina.
Vision Res., 20: 221–228.
Redies, C. (1989) Discontinuities along lines. Psychophysics
and neurophysiology. Neurosci. Biobehav. Rev., 13: 17–22.
Redies, C. and Spillmann, L. (1981) The neon color effect in the
Ehrenstein illusion. Perception, 10: 667–681.
Rubin, E. (1915) Synsoplevede Figurer. Kopenhavn, Glyden-
dalske.
Schepelmann, F., Aschayeri, H. and Baumgartner, G. (1967)
Die Reaktionen der simple field — Neurone in Area 17 der
Katze beim Hermann-Gitter-Kontrast. Pflugers Arch., 294:
R57 (abstract).
Schiller, P.H. (1998) The neural control of visually guided eye
movements. In: Richards, J.E. (Ed.), Cognitive Neuroscience
of Attention: A Developmental Perspective. Erlbaum Assoc.,
Mahwah, NJ, pp. 3–50 (Chapter 1).

92
Schiller, P.H. and Carvey, C.E. (2005) The Hermann grid il-
lusion revisited. Perception, 34: 1375–1397.
Sharpe, L.T. and Nordby, K. (1990) Total colour blindness: an
introduction. In: Hess, R.F., Sharpe, L.T. and Nordby, K.
(Eds.), Night Vision: Basic, Clinical and Applied Aspects.
Cambridge University Press, London, pp. 253–289.
Soriano, M., Spillmann, L. and Bach, M. (1996) The abutting
grating illusion. Vision Res., 36: 109–116.
Spillmann, L. (1971) Foveal perceptive fields in the human vis-
ual system measured with simultaneous contrast in grids and
bars. Pflugers Arch. ges. Physiol., 326: 281–299.
Spillmann, L. (1994) The Hermann grid illusion: a tool for
studying human perceptive field organization. Perception, 23:
691–708.
Spillmann, L. (1999) From elements to perception: local and
global processing in visual neurons. Perception, 28: 1461–1492.
Spillmann, L. and DeWeerd, P. (2003) Mechanisms of surface
completion: perceptual filling-in of texture. In: Pessoa, L. and
DeWeerd, P. (Eds.), Filling-in: From Perceptual Completion
to Cortical Reorganization. Oxford University Press, Oxford,
pp. 81–105.
Spillmann, L. and Dresp, B. (1995) Can we bridge the gap
between levels of explanation. Perception, 24: 1333–1364.
Spillmann, L. and Ehrenstein, W.H. (1996) From neuron to
Gestalt: mechanisms of visual perception. In: Greger, R. and
Windhorst, U. (Eds.) Comprehensive Human Physiology,
Vol. 1. Springer, Berlin, pp. 861–893.
Spillmann, L. and Ehrenstein, W.H. (2004) Gestalt factors in
the visual neurosciences. In: Chalupa, L. and Werner, J.S.
(Eds.), The Visual Neurosciences. The MIT Press, Cam-
bridge, MA, pp. 1573–1589.
Spillmann, L., Heitger, F. and Schuller, S. (1986) Apparent
displacement and phase unlocking in checkerboard patterns.
9. Europ. Conf. Vis. Perception, Bad Nauheim (Poster).
Spillmann, L. and Kurtenbach, A. (1992) Dynamic noise back-
grounds facilitate target fading. Vision Res., 32: 1941–1946.
Spillmann, L., Otte, T., Hamburger, K. and Magnussen, S.
(2006) Perceptual filling-in from the edge of the blind spot.
Vision Res. (Under revision).
Spillmann, L., Ransom-Hogg, A. and Oehler, R. (1987) A
comparison of perceptive and receptive fields in man and
monkey. Hum. Neurobiol., 6: 51–62.
Spillmann, L. and Werner, J.S. (Eds.). (1990) Visual Perception:
The Neurophysiological Foundations. Academic Press, NY.
Spillmann, L. and Werner, J.S. (1996) Long-range interaction
in visual perception. Trends Neurosci., 19: 428–434.
Sturzel, F. and Spillmann, L. (2004) Perceptual limits of com-
mon fate. Vision Res., 44: 1565–1573.
Teichmann, R. and Spillmann, L. (1997) Fading of textured
targets on textured backgrounds. In: Elsner, N. and Wassle,
H. (Eds.) Gottingen Neurobiology Report 1997, vol. II.
Thieme, Stuttgart, p. 569 (Abstract).
Uttal, W.R., Spillmann, L., Sturzel, F. and Sekuler, A.B. (2000)
Motion and shape in common fate. Vision Res., 40: 301–310.
Valberg, A. and Lee, B.B. (Eds.). (1991) From Pigments to
Perception. Advances in Understanding Visual Processes.
NATO ASI Series, Plenum Press, London.
Van Tuijl, H.F.J.M.van. (1975) A new visual illusion: neonlike
color spreading and complementary color induction between
subjective contours. Acta Psychol., 39: 441–445.
Vicario, G.B. (1998) On Wertheimer’s principles of organiza-
tion. In: Stemberg, G. (Ed.) Gestalt Theory, Vol. 20.
Krammer, Vienna, pp. 256–270.
von der Heydt, R. (1987) Approaches to visual cortical func-
tion. Rev. Physiol. Biochem. Pharmacol., 108: 69–151.
von der Heydt, R. and Peterhans, E. (1989) Mechanisms of
contour perception in monkey visual cortex. I. Lines of pat-
tern discontinuity. J. Neurosci., 9: 1731–1748.
von der Heydt, R., Peterhans, E. and Baumgartner, G. (1984)
Illusory contours and cortical neuron responses. Science, 224:
1260–1262.
Wertheimer, M. (1912) Experimentelle Studien uber das Sehen
von Bewegung. Z. Psychol., 61: 161–265.
Wertheimer, M. (1923) Untersuchungen zur Lehre von der Ges-
talt II. Psychol. Forsch., 4: 301.
Westheimer, G. (1965) Spatial interaction in the human retina
during scotopic vision. J. Physiol. (Lond.), 181: 881–894.
Westheimer, G. (1967) Spatial interaction in human cone vi-
sion. J. Physiol (Lond.), 190: 139–154.
Westheimer, G. (2004) Center-surround antagonism in spatial
vision: retinal or cortical locus? Vision Res., 44: 2457–2465.
Zhou, H., Friedman, H.S. and von der Heydt, R. (2000) Coding
of border ownership in monkey visual cortex. J. Neurosci.,
20: 6594–6611.