from molecules to processes: molecular simulations applied
TRANSCRIPT
For Peer Review
From Molecules to Processes: Molecular Simulations Applied to the Design of Simulated Moving Bed for Ethane/Ethylene
Separation
Journal: The Canadian Journal of Chemical Engineering
Manuscript ID: CJCE-12-0551.R1
Wiley - Manuscript type: Article
Date Submitted by the Author: n/a
Complete List of Authors: Granato, Miguel; Faculdade de Engenharia da Universidade do Porto, LSRE - Laboratory of Separation and Reaction Engineering – Associate Laboratory LSRE/LCM Martins, Vanessa; Faculdade de Engenharia da Universidade do Porto, LSRE - Laboratory of Separation and Reaction Engineering – Associate Laboratory LSRE/LCM Santos, João; Faculdade de Engenharia da Universidade do Porto, LSRE - Laboratory of Separation and Reaction Engineering – Associate Laboratory LSRE/LCM Jorge, Miguel; Faculdade de Engenharia da Universidade do Porto, LSRE - Laboratory of Separation and Reaction Engineering – Associate Laboratory LSRE/LCM Rodrigues, Alírio; Faculdade de Engenharia da Universidade do Porto, LSRE - Laboratory of Separation and Reaction Engineering – Associate Laboratory LSRE/LCM
Keywords: Zeolite 13X, Ethane/Ethylene, Simulated Moving Bed, Molecular Simulation, Monte Carlo
John Wiley & Sons
2t-S-1Ed-D-P
For Peer Review
From Molecules to Processes: Molecular Simulations Applied
to the Design of Simulated Moving Bed for Ethane/Ethylene
Separation
Miguel Angelo Granato§*
, Vanessa Duarte Martins§,
João Carlos Santos§
Miguel Jorge§, and Alírio Egídio Rodrigues
§
§ LSRE - Laboratory of Separation and Reaction Engineering – Associate Laboratory
LSRE/LCM, Faculdade de Engenharia, Universidade do Porto, Rua Dr. Roberto Frias.
4200-465 - Porto, Portugal
* To whom correspondence should be addressed: Phone +351 22 508 1578; Fax: +351
22 508 1674. E-mail: [email protected]
Abstract
This paper presents results of a modelling study on the separation of ethane/ethylene
mixture by selective adsorption on zeolite 13X in a Simulated Moving Bed (SMB) unit.
Propane and n-butane are evaluated as desorbent candidates. The study encompasses
molecular simulation calculations for determination of adsorption parameters, whose
results will then be used in a mathematical model for evaluating the performance of an
SMB unit. This work is entirely done in silico, by using available force field parameters
for the molecular simulations part, and reliable mathematical models for the SMB part.
Experimental data are solely used for comparison with the molecular simulation results,
which are subsequently expanded to calculate adsorption properties for separating the
mixtures, without further experimental work. The separation regions of an SMB unit
operating with zeolite 13X for ethane/ethylene separation, using propane and n-butane
Page 1 of 45
John Wiley & Sons
2t-S-1Ed-D-P
123456789101112131415161718192021222324252627282930313233343536373839404142434445464748495051525354555657585960
For Peer Review
as desorbents, were obtained by simulation at 110 kPa and at four different
temperatures: 298, 323, 348 and 373 K. For each desorbent, an operating point was
selected and the size of the required unit was presented for the complete separation of
the two components of the mixture.
Keywords
Zeolite 13X; Ethane; Ethylene; Simulated Moving Bed; Molecular Simulation; Monte
Carlo
1. Introduction
Ethylene (ethene) is the major worldwide industrial feedstock, one of the most
important raw materials for the chemical industry with an annual production of more
than 25 million tons in the United States (Kirk-Othmer, 1991). Separation of
paraffin/olefin mixtures, in particular ethane/ethylene and propane/propylene, requires
huge distillation columns operated at a very high reflux ratio, one of the most energy
consuming processes in the chemical industry (Rege et al., 1998). Alternative
technologies are Simulated Moving Bed (SMB) and Vacuum Swing Adsorption (VSA).
The Simulated Moving Bed (SMB) technology comes from the early 1960's, with its
first important industrial implementation of the Sorbex process by UOP. Since then, it
has been successfully applied, first to various large petrochemical separations, including
p-xylene separation from its C8 isomers, olefin/paraffin separation, and more recently in
the pharmaceutical and fine chemical industries (Sá Gomes et al., 2008). The Sorbex
process operates mostly in the liquid phase by employing two separating agents: the
eluent (or desorbent) and the adsorbent. The eluent can either be a gas or a liquid. The
extract and the raffinate (products) are diluted with the eluent and additional separation
steps, by flash or fractional distillation, are required to yield the pure products.
Page 2 of 45
John Wiley & Sons
2t-S-1Ed-D-P
123456789101112131415161718192021222324252627282930313233343536373839404142434445464748495051525354555657585960
For Peer Review
However, the Sorbex process can also be used for gas phase separations where a vapour
or a supercritical fluid, typically CO2, is used as eluent. Mazzotti and co-workers
developed a six-port vapour phase SMB pilot plant for the separation of an
n-pentane/iso-pentane mixture using n-heptane as desorbent and 5A-Zeolite as
adsorbent. They reported a higher separation efficiency in a vapour-phase SMB unit
compared to the liquid phase separation (Mazzotti et al., 1995). Relevant references to
the SMB application in the separation of propylene/propane mixtures are found in the
literature (Rao et al., 2005; Cheng and Wilson, 2001). Rao and collaborators reported
results for this separation using silica gel as adsorbent in a moving-port system which,
when embedded into a fixed bed, facilitates the continuous movement of the port along
the bed for the injection and withdrawal of a fluid. The parametric study indicates that
high purity products and a higher productivity by an order of magnitude can be
achieved with simulated moving-beds compared to the fixed beds (Rao et al., 2005).
In considering the ethane/ethylene separation by SMB, a suitable desorbent is a
fundamental issue. The choice of an adequate desorbent for the separation of
ethane/ethylene by gas phase SMB should consider the subsequent distillation step in
order to concentrate the extract/raffinate, and to recover the desorbent. The difference
between the boiling point of the desorbent and that of the raffinate (or the extract), and
the presence or not of azeotropes are of key importance for the efficiency of the
distillation. Propane and n-butane are proposed as candidate desorbents for separation of
the ethane/ethylene mixture, and this is tested using predictive simulations with little
input from experiment. At 101.3 kPa (1 atm), ethane has a boiling point of -89 °C, and
ethylene has one of −103.7 °C. The boiling point of n-butane is -0.5 °C and that of
propane is -42.1 °C, and thus both desorbents would be adequate for further separation
by distillation.
Page 3 of 45
John Wiley & Sons
2t-S-1Ed-D-P
123456789101112131415161718192021222324252627282930313233343536373839404142434445464748495051525354555657585960
For Peer Review
Normally the choice of desorbent is made by trial-and-error, requiring expensive and
time-consuming experimental measurements of adsorption equilibrium. A much more
efficient alternative would be to choose the desorbent based on computational
simulations of the SMB process, minimizing the need for experiments. However, this
requires a simulation approach that can accurately predict multi-component adsorption
equilibrium in the adsorbent material, and then feed this data into a large-scale
simulation of the process – in other words, a simulation approach that goes from
molecules to processes.
In this study, we attempt to achieve this goal by combining molecular simulation of
adsorption with process simulations. Single component adsorption isotherms of all the
four species herein studied, as well as binary mixtures of ethane/ethylene,
ethane/propane, ethylene/propane, ethane/n-butane, and ethylene/n-butane in zeolite
13X were calculated by the configurational-bias Monte Carlo (CBMC) technique.
Molecular simulations are the first prediction tool to be used here, aiming to replace
expensive, time consuming and, in some cases, dangerous experiments. We adopted
force fields that have been widely used to predict adsorption of hydrocarbons in zeolites
(Calero et al., 2004, Lamia et al., 2009, Granato et al., 2010), and use them to reproduce
experimental data on single component adsorption of ethane and ethylene in 13X
zeolite, as well as their binary mixtures with propane and n-butane. Subsequently, a
four-section Simulated Moving Bed (SMB) unit is analyzed through simulation, in
order to describe the behaviour of the unit by means of a mathematical model. This
model makes use of the equilibrium adsorption data, predicted by molecular simulation,
in a wide range of operating conditions. We demonstrate that this integrated approach is
a powerful tool for computational design of adsorptive separation processes.
Page 4 of 45
John Wiley & Sons
2t-S-1Ed-D-P
123456789101112131415161718192021222324252627282930313233343536373839404142434445464748495051525354555657585960
For Peer Review
2. Computational Details
2.1 – Molecular Simulation Methods
The configurational-bias Monte Carlo (CBMC) technique in the grand-canonical
(µVT) ensemble has been extensively applied for calculation of adsorption properties,
such as isotherms and heats of sorption. This technique allows for accurate calculations
of the adsorbed amount, since it allows the total number of molecules to vary by way of
creation and deletion Monte Carlo trials. A detailed explanation of this simulation
technique can be found elsewhere (Vlugt et al., 1999; Smit and Krishna, 2001; Frenkel
and Smit, 2002). For simple hydrocarbons, such as alkanes or alkenes, a number of 2 ×
106 cycles is enough to reach equilibrium. The United Atom (UA) force field was
chosen to model the adsorbates due to a good compromise between accuracy and
computational effort, when compared to the All Atom (AA) or the Anisotropic United
Atom (AUA) force fields. These models are widely described in the literature (Martin
and Siepmann, 1998; Ungerer et al., 2000). For calculations of adsorption properties,
such as isotherms and heats of sorption, the UA model is advantageous because of its
reduced set of parameters to represent the inter- and intra-molecular interactions
between the pseudo-atoms.
The 13X zeolite framework model is the sodium form of the Faujasite (FAU) type
zeolite, obtained by randomly replacing silicon by aluminium, satisfying the
Löwenstein rule. This substitution generates a negatively charged framework which is
compensated by inserting 88 sodium cations, yielding a composition of
Na88Al88Si104O384 per unit cell. The cations are allowed to move inside the zeolite.
Periodic boundary conditions were applied in all directions. A rigid structure was
Page 5 of 45
John Wiley & Sons
2t-S-1Ed-D-P
123456789101112131415161718192021222324252627282930313233343536373839404142434445464748495051525354555657585960
For Peer Review
considered for the zeolite, since framework flexibility has little influence on adsorption
properties in zeolites (Vlugt and Schenk, 2002).
Non-bonded interactions are described by Lennard-Jones potentials, as shown in
Equation 1. A truncated and shifted potential is applied (rcut = 12 Å), and tail corrections
are not used (Dubbeldam et al., 2004). Electrostatic interactions are calculated by the
Ewald summation which is largely described elsewhere (Frenkel and Smit, 2002;
Martin and Siepmann, 1998).
12 6
4( )
0
ij ij
ij ij cut
ij ijij
ij cut
r rr rU r
r r
σ σε
− ≤ =
>
(1)
Equation 2 describes the Lorentz-Berthelot mixing rules, used to calculate the cross
interactions between different united atoms, except for the interactions with the non-
framework cations, which requires specific parameters (Vlugt, 2000).
( )1,
2ij ii jj ij ii jjσ σ σ ε ε ε= + = (2)
All adsorbate molecules were considered to be flexible, with intramolecular
parameters taken from the TraPPE force-field (Martin and Siepmann, 1998). Parameters
for the interactions between adsorbates and the framework were taken from our
previous modelling work of propane/propylene adsorption on zeolite 13X (Granato et
al., 2007), which consisted of a modification of the original model by Calero et al.
(2004). All molecular interaction parameters are given in Tables S1 and S2 of the
Supporting Information File.
Page 6 of 45
John Wiley & Sons
2t-S-1Ed-D-P
123456789101112131415161718192021222324252627282930313233343536373839404142434445464748495051525354555657585960
For Peer Review
2.2 – SMB Process Simulations
Detailed descriptions of the gas phase SMB operation, the mathematical models, and
required parameters can be found in the literature (Cheng and Wilson, 2001; Minceva et
al., 2003; Leão and Rodrigues, 2004; Sá Gomes et al., 2008, 2009; Lamia et al., 2009).
In this study, a “classical” SMB mode of operation, making use of a desorbent species,
as patented by Rodrigues et al. (2006), was chosen for the separation of a mixture of
ethane–ethylene over 13X zeolite. In the mathematical model of the four-section SMB
unit, a multicomponent extension of the Toth isotherm and a linear driving force (LDF)
for the intra-particle mass transfer are assumed. The mathematical model further
assumes plug flow with axial dispersion, no radial gradients inside the column, bed void
fraction, radius and porosity of the particles are constant along the axial coordinate,
negligible thermal effects, negligible pressure drop and fast rate of adsorption. The
isothermal assumption for gas-phase SMB was tested by Sá Gomes et al. (2009) in the
study of propane/propylene separation, and a temperature gradient of 4K was observed
along the entire unit. More details can be found elsewhere (Cruz et al., 2005; Minceva
et al., 2003; Leão and Rodrigues, 2004). The simulation of an SMB unit may be
performed by two methods: the True Moving Bed (TMB), and the SMB approach. Both
TMB and SMB model predictions of steady-state performance of the SMB unit are very
close. So, the TMB model was selected to study the feasibility of this separation at
different temperatures, and using the proposed desorbents – propane and n-butane. The
Separation Volume methodology (Azevedo and Rodrigues, 1999) was used to find the
operating conditions of the SMB unit.
Page 7 of 45
John Wiley & Sons
2t-S-1Ed-D-P
123456789101112131415161718192021222324252627282930313233343536373839404142434445464748495051525354555657585960
For Peer Review
3. Results and Discussion
3.1. Ethane, Ethylene, Propane and n-Butane Single Component
Adsorption in Zeolite 13X
Single component isotherms of ethane and ethylene adsorption in zeolite 13X were
simulated at temperatures of 305, 393 and 423 K, and pressure ranges from 1 to 200
kPa. There are many experimental studies on adsorption of ethane and ethylene over
Na-Faujasites in the literature (Danner and Choi, 1978; Kaul, 1987; Dunne et al. 1996;
Valezuela and Myers, 1989). Danner and Choi (1978) evaluated prediction models of
adsorption equilibria of binary mixtures of ethane/ethylene on 13X pellets containing
20% by weight of inert clay binder and 80% percent synthetic zeolite; Dunne and co-
workers made simultaneous measurements of isosteric heats of adsorption and
adsorption isotherms of a series of gases, including C2H6, on adsorbents of varying pore
structure and ion type (NaX, H-ZSM-5, Na-ZSM-5).
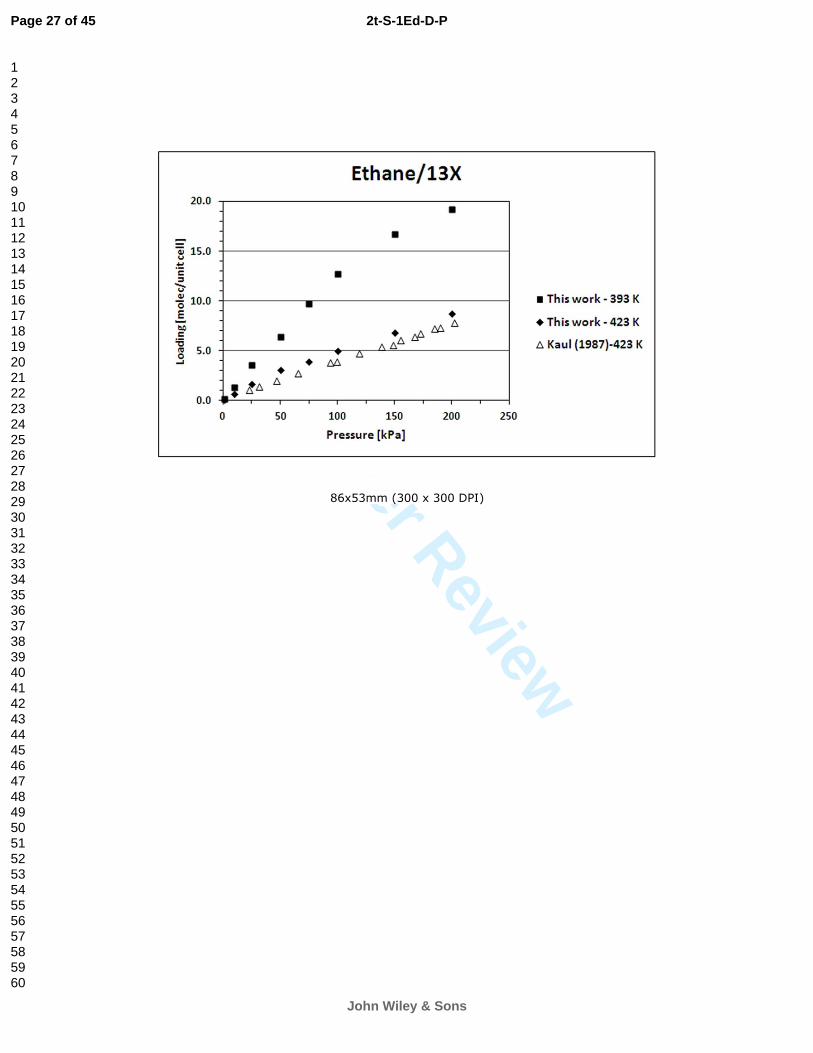
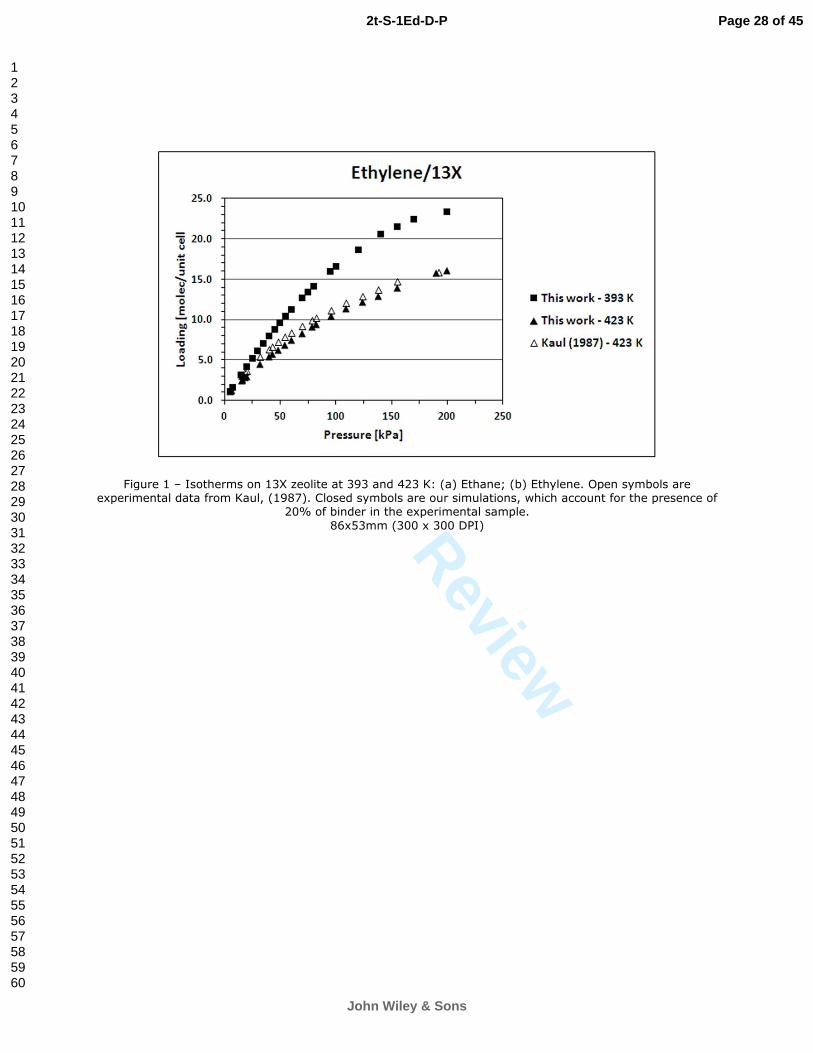
Figures 1 (a) and (b) show equilibrium adsorption isotherms of ethane and ethylene
over zeolite 13X compared with experimental results. The shape of the isotherms is well
reproduced, and there is good agreement between simulation results and the
experimental data for pure gases. The slight differences between our simulations and
experiments from Kaul (1987) are probably due to the use in experiments of pelletized
zeolite that can present structural imperfections, pore blocking, surface adsorption, and
inactivation of part of the zeolite. On the contrary, the simulations assume a perfect
zeolite crystal, which can cause some differences between simulation results and
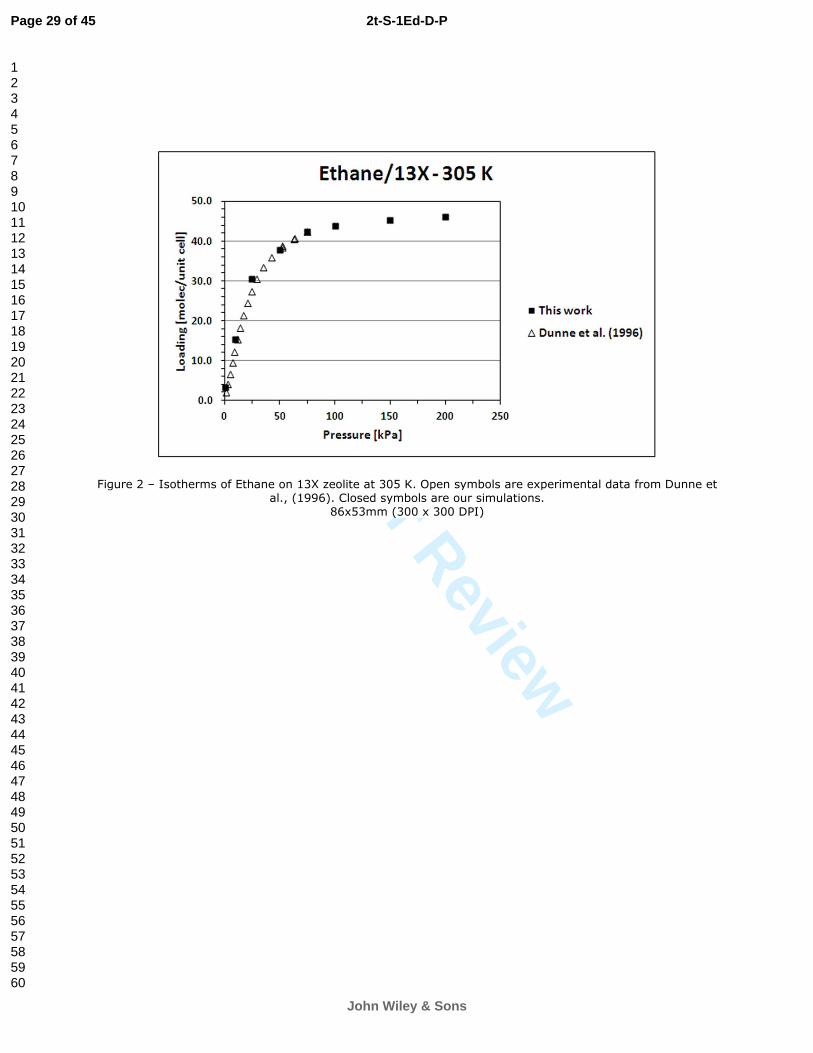
experimental data. So, we also performed simulations of ethane at 305 K for
comparison with experiments carried out with a commercial sample of NaX powder
Page 8 of 45
John Wiley & Sons
2t-S-1Ed-D-P
123456789101112131415161718192021222324252627282930313233343536373839404142434445464748495051525354555657585960
For Peer Review
(Dunne et al. 1996). Figure 2 shows an excellent agreement between simulations and
experiments.
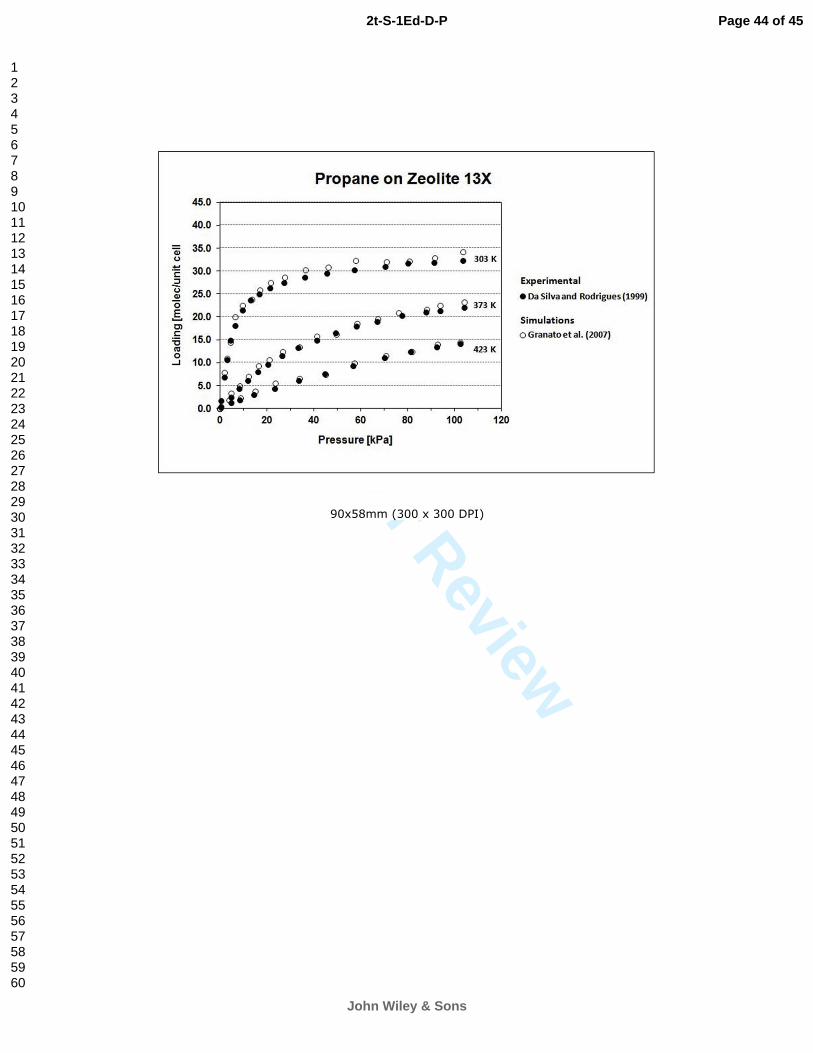
Equilibrium adsorption isotherms of propane and n-butane in zeolite 13X are equally
well reproduced by our model, as shown in previous work (Granato et al., 2007, 2010).
For completeness, the comparison between experiment and simulation for propane and
n-butane are given in the Supporting Information. It should be noted that the
ethane/ethylene data were verified with experimental measurements up to 200 kPa,
while n-butane/propane has been validated with experimental data measured up to ~110
kPa.
3.2. Adsorption of Binary Mixtures in Zeolite 13X
The good agreement obtained for pure-component adsorption gives us confidence to
use our simulations for multi-component adsorption predictions. Nevertheless, we
further validate our models by simulating binary adsorption equilibrium and comparing
to results estimated from experimental single-component data using the multicomponent
extended Toth model (Valezuela and Myers, 1989). The experimental single component
adsorption equilibrium data for ethane and ethylene on 13X presented by Danner and
Choi (1978) at 298K and 323K were fit with the Toth equation, described by equation
3:
( ), 1
1ii
i ii s i
tt
i i
b Pq q
b P
=
+
(3)
where qi represents the concentration of component i in the adsorbed phase, qs is the
saturation capacity, Pi is the partial pressure of component i, ti is a parameter of the
model that characterizes the system heterogeneity and b is the affinity constant that
depends on the temperature, T, as follows:
Page 9 of 45
John Wiley & Sons
2t-S-1Ed-D-P
123456789101112131415161718192021222324252627282930313233343536373839404142434445464748495051525354555657585960
For Peer Review
0, ,iH
RTi ib b e
−∆
= (4)
where b0 is the affinity constant at infinite temperature, ∆H is the isosteric heat of
adsorption at zero loading and R is the universal gas constant. The parameters of the fit
obtained are presented in Table 1. This table also presents the parameters of the Toth
equation for propane taken from Da Silva and Rodrigues (1999), and the parameters for
n-butane obtained from a fit to the experimental data presented by Tarek et al. (1995).
Da Silva and Rodrigues (1999) determined the adsorption isotherm data of propane
from 303 to 473 K and up to 110 kPa. Tarek et al. (1995) determined the adsorption
isotherm data of n-butane from 300 to 360K and up to 150 Torr (~20 kPa). The
temperatures used in the SMB simulations are within the range studied by these authors.
The maximum pressure used in the adsorption measurements for n-butane was high
enough to obtain the saturation capacity. Da Silva and Rodrigues used pellets of 13X
while Tarek et al. (1995) used powder. In a real unit, a shaped 13X would have to be
used to avoid large pressure drops. Therefore the saturation capacity presented by Tarek
et al. (1995) was reduced by 20% to represent the mass fraction of binder and to level
with the data presented by Da Silva and Rodrigues (1999) and by Danner and Choi
(1978) for ethane and ethylene.
The multicomponent extension of the Toth equation is described by:
( ), 1
11
ii
i ii s i
ttnc
j jj
b Pq q
b P=
=
+ ∑ (5)
The prediction of the multicomponent adsorption equilibrium obtained with this fit
was compared with the binary data obtained by CBMC simulations. Excellent
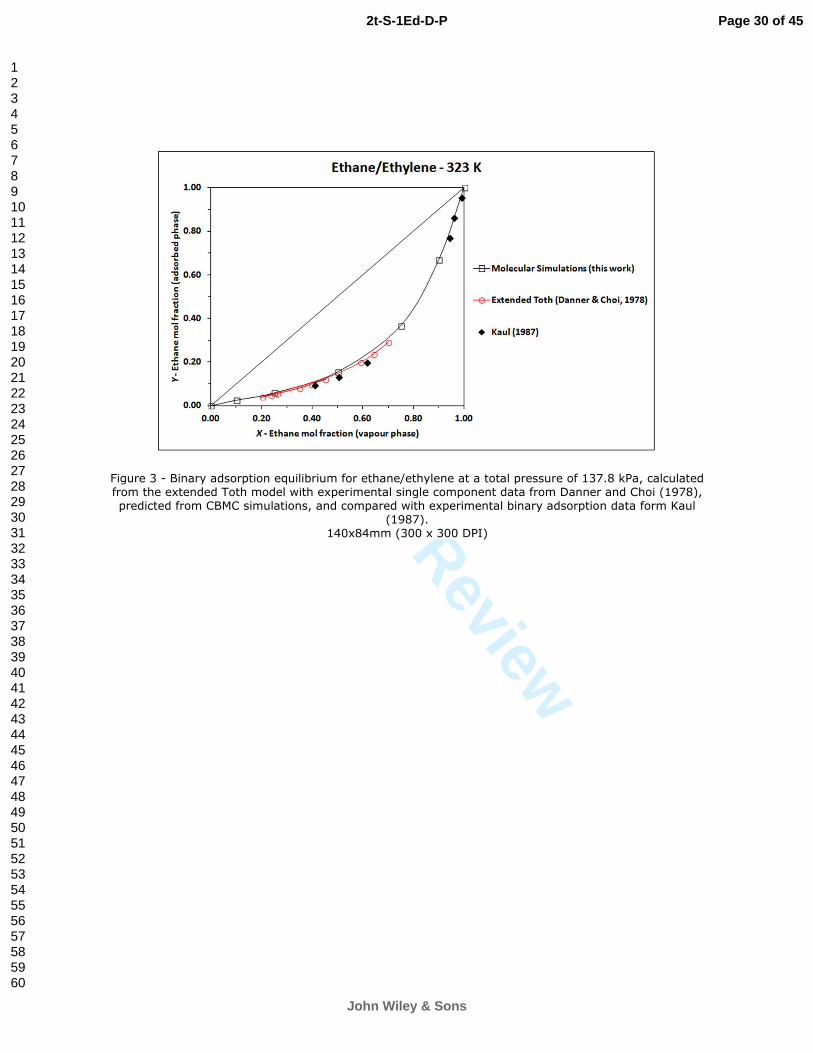
agreement was observed for all conditions tested. As an example, the comparison for
ethane/ethylene binary adsorption equilibrium data at 323K and a total pressure of 137.8
Page 10 of 45
John Wiley & Sons
2t-S-1Ed-D-P
123456789101112131415161718192021222324252627282930313233343536373839404142434445464748495051525354555657585960
For Peer Review
kPa is presented in Figure 3. Results from binary adsorption experiments reported by
Kaul (1987) are also included in this figure, and remarkable agreement between
simulation and experiment is observed.
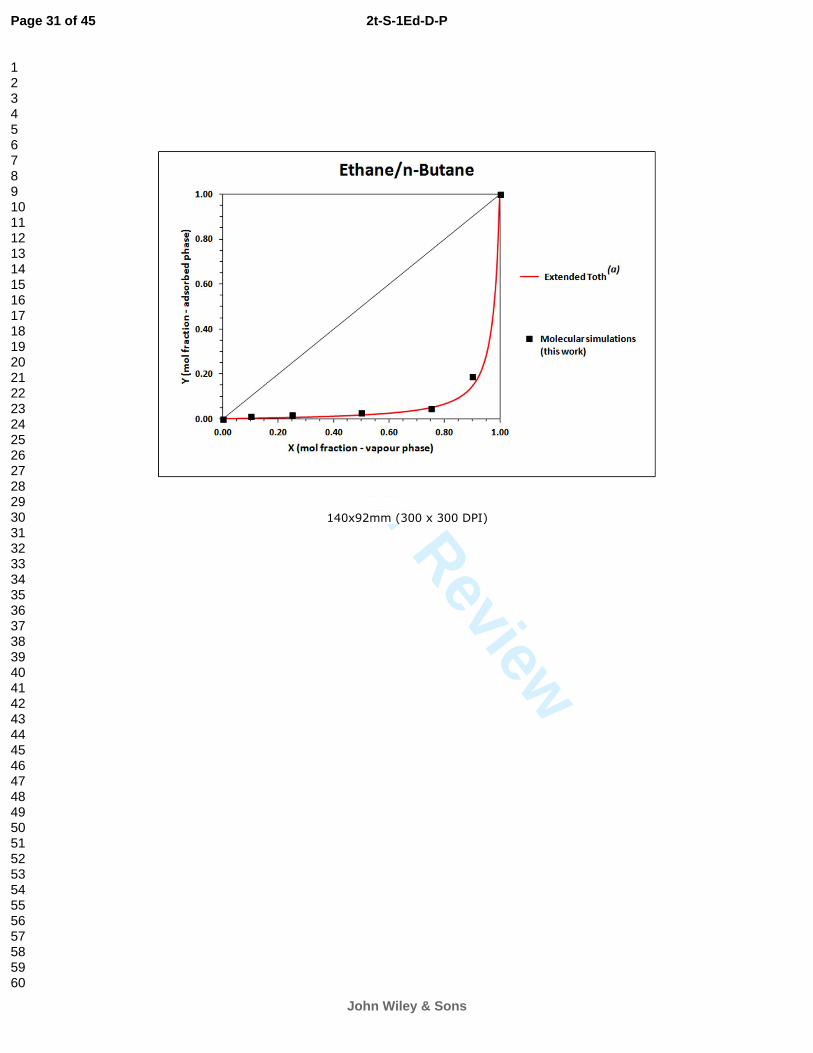
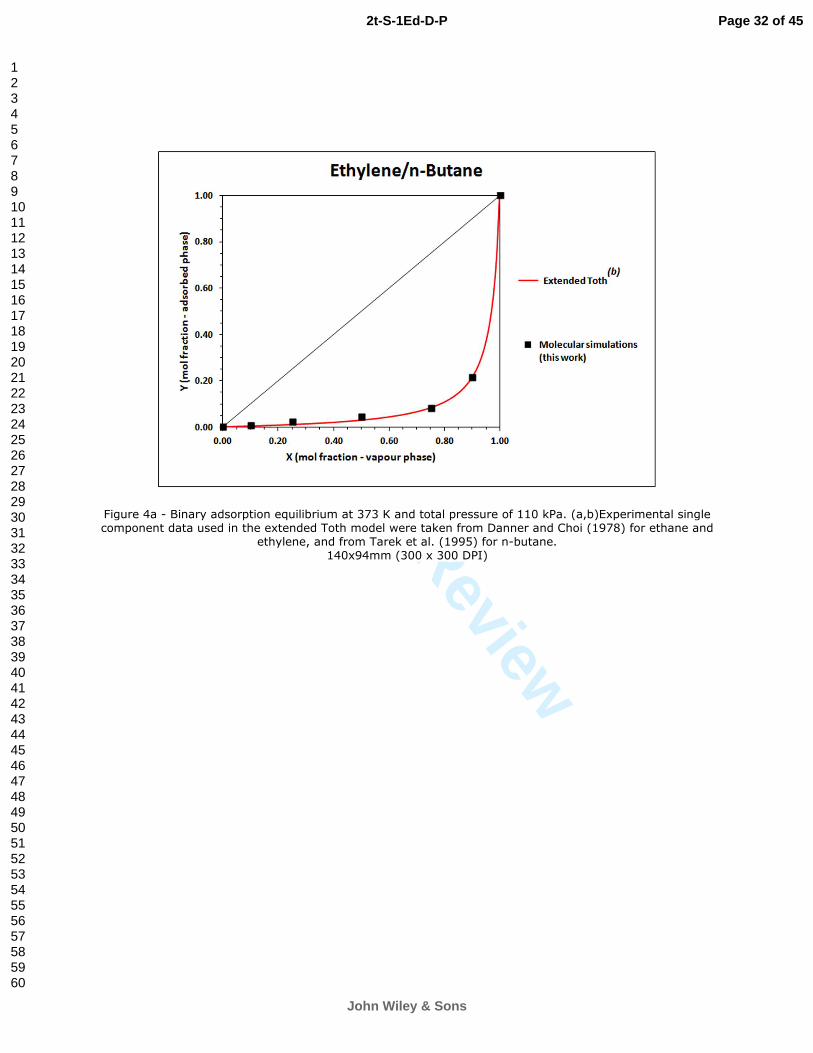
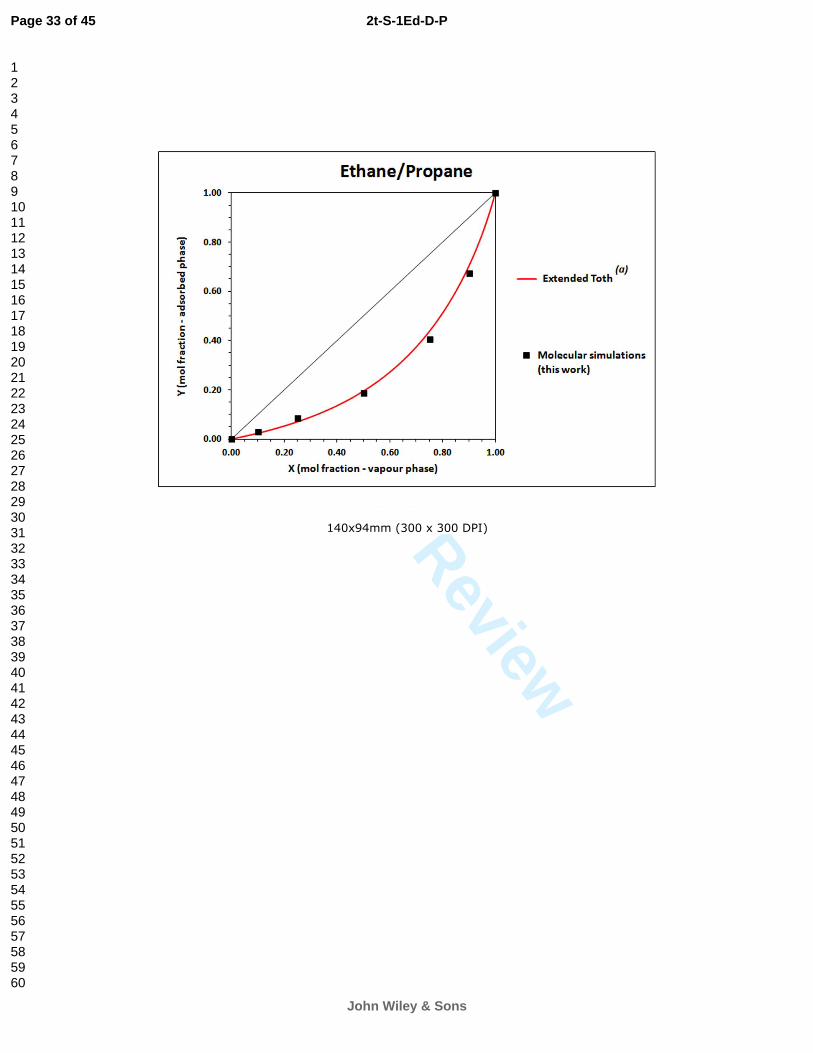
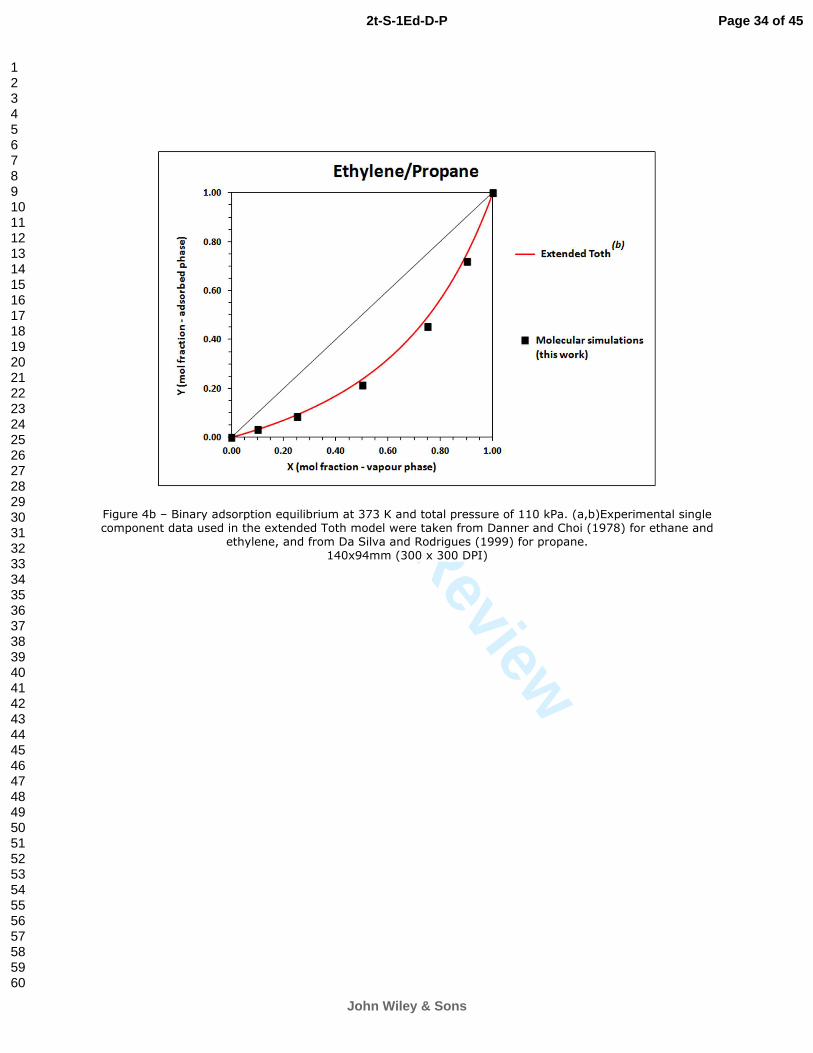
Additional CBMC simulations for the binary adsorption equilibria of propane and
n-butane with ethane and ethylene, respectively, have been carried out at 373 K and
several molar fractions. The simulation results are compared with data provided by the
extended Toth model (Valezuela and Myers, 1989) for propane/ethane,
propane/ethylene, n-butane/ethane, and n-butane/ethylene systems, using the data from
pure component adsorption isotherms. The resulting x-y diagrams are shown in Figures
4a and 4b. The set of force field parameters successfully reproduce the equilibrium
adsorption properties of the binary mixtures propane and n-butane with ethylene and
ethane.
3.3 - Simulated Moving Bed Simulations
The next step in our multiscale modelling strategy is to use molecular simulation data,
presented in the previous sections, directly as input into the SMB model. The separation
regions of the gas phase simulating moving bed (SMB) were obtained by simulation and
are presented in Figures 5 and 6. The gammas represent the ratio between the fluid
velocity, jν , in the respective section and the solid velocity, su , as described by
j
j
su
νγ = (5)
where j is the SMB section (I, II, III, IV).
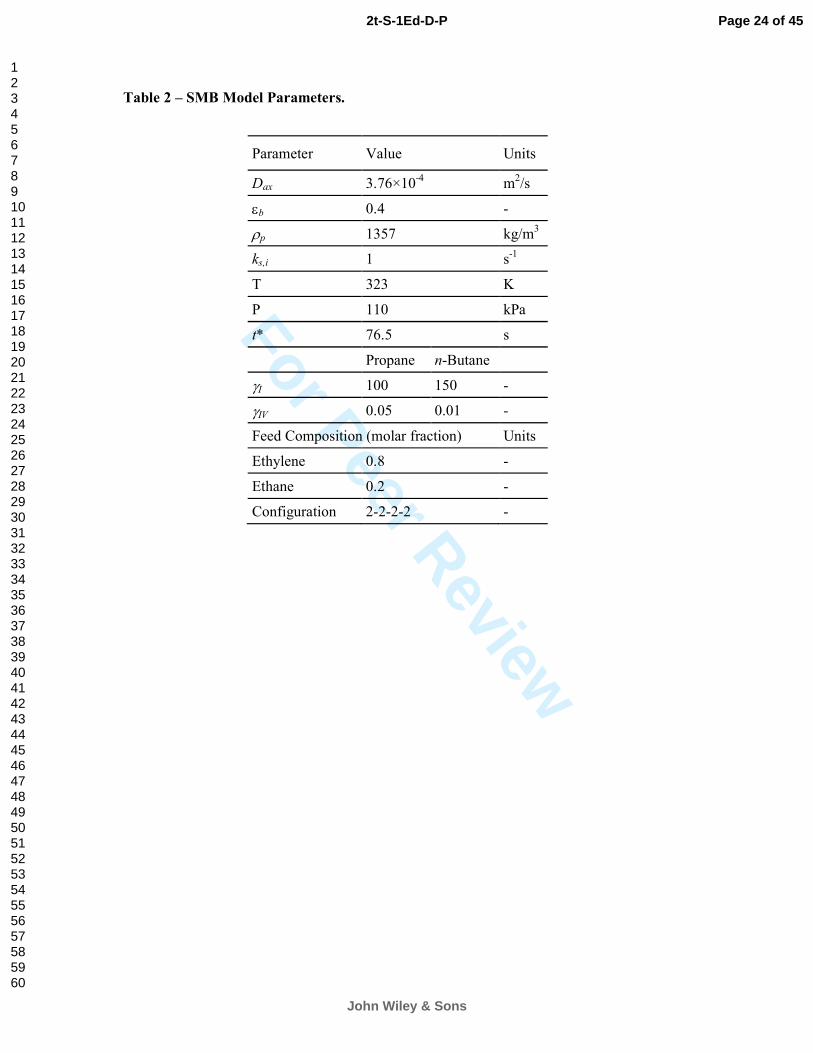
Table 2 presents the model parameters chosen to obtain the separation region. The
properties of the adsorbent were taken from Da Silva and Rodrigues (1999). It should be
noted that the separation region does not depend on the values of gamma 1 and gamma
4 as long as they are large enough and small enough, respectively, to ensure that
Page 11 of 45
John Wiley & Sons
2t-S-1Ed-D-P
123456789101112131415161718192021222324252627282930313233343536373839404142434445464748495051525354555657585960
For Peer Review
sections I and IV are cleaned. Furthermore, the advantage of representing the separation
region in terms of the dimensionless variables gamma 2 and gamma 3 is that these
results do not depend on the size of the columns (unless there is a strong mass transfer
resistance, which is not the case here). This means that a point can be chosen from the
separation region and we can either obtain the size of a unit for a given feed flow rate or
obtain the feed flow rate for a given size.
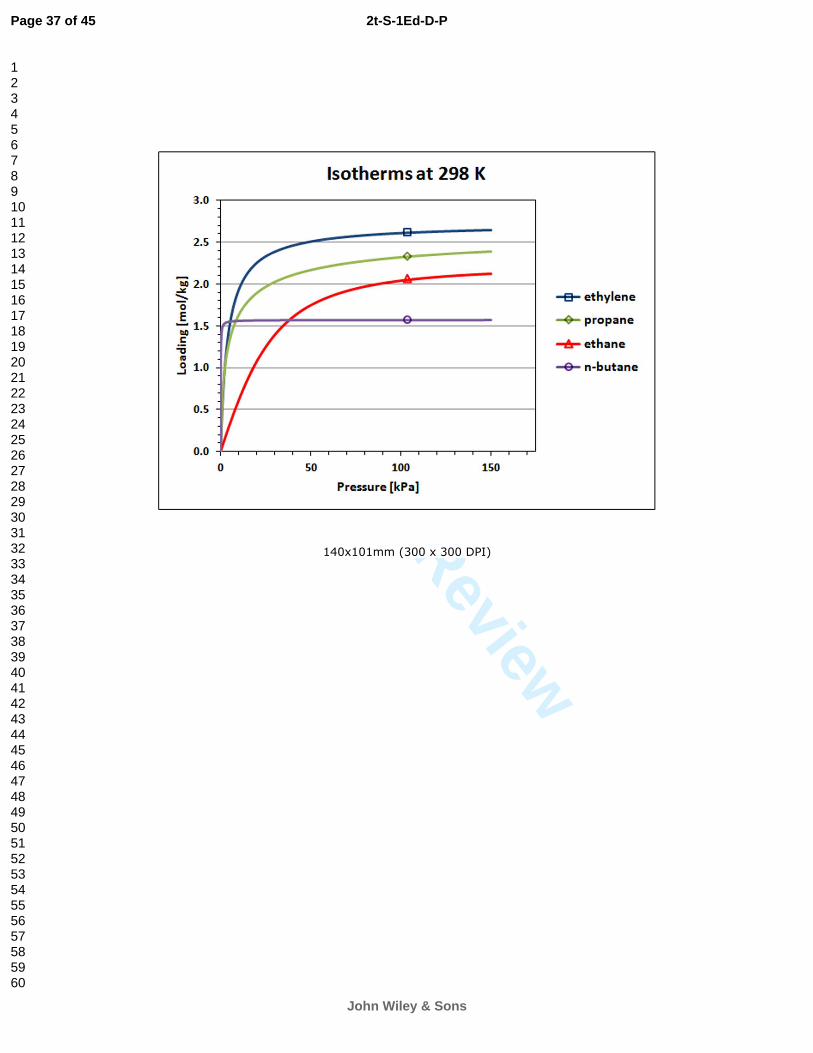
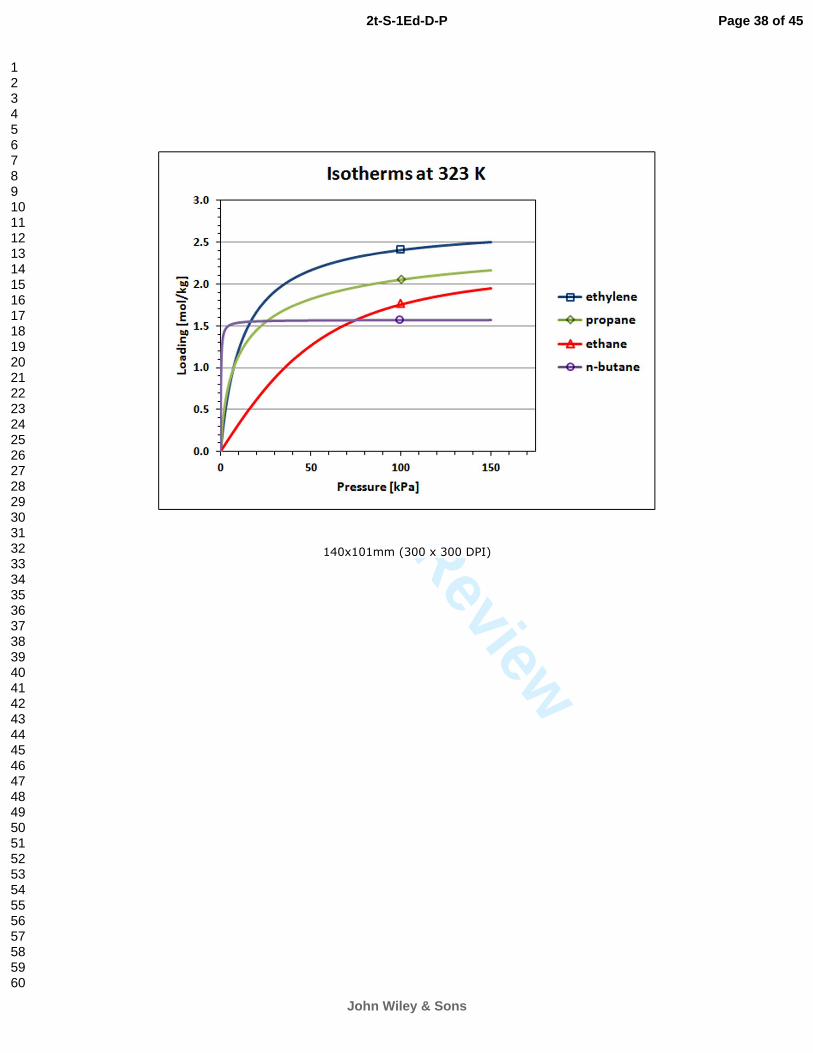
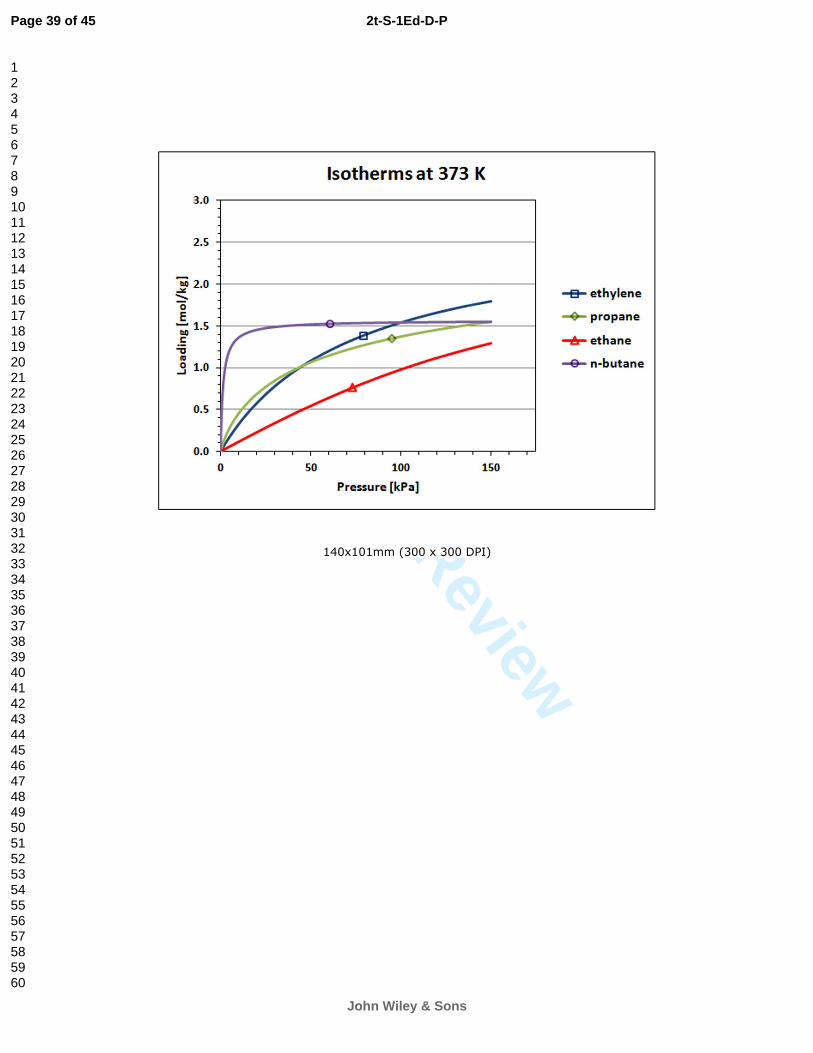
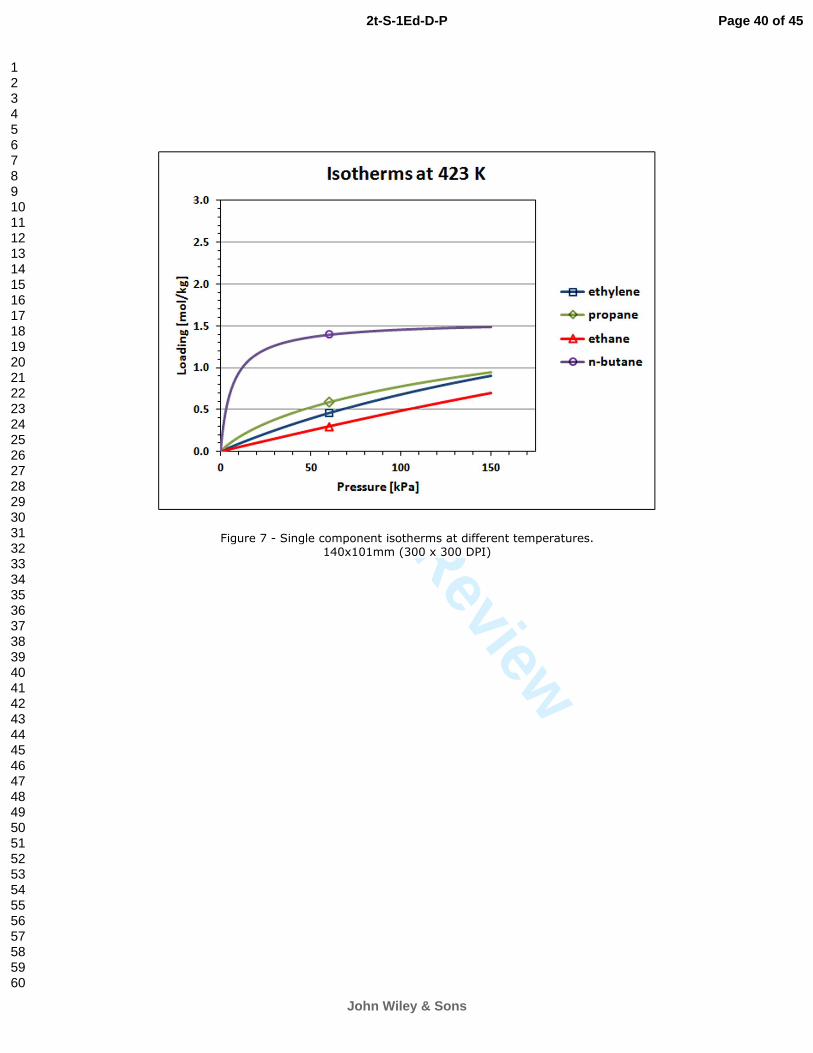
Figure 7 shows the adsorption capacity of the four species at 298, 323, 373 and 423
K, obtained from the parameters presented in Table 1. Propane has an intermediate
adsorption capacity, which is a desired property for a desorbent in a simulated moving
bed process. Ethylene is the species with the highest adsorption capacity; therefore, a
mixture of ethylene and propane will be obtained in the extract of the SMB. Ethane, as
the least adsorbed species, will be obtained in the raffinate together with propane.
However, n-butane has a strong interaction with the adsorbent, which means that it will
hardly be displaced by the other species. It has a lower saturation capacity (crosses the
other isotherms at a pressure bellow 100 kPa) which, depending on the temperature and
feed composition, may not be able to displace the other two adsorbates.
It is worth mentioning that at 323 K the equilibrium adsorption isotherm of propane is
between the ones of ethane and ethylene while at 373 K, the propane isotherm crosses
the ethylene adsorption isotherm at around 40 kPa.
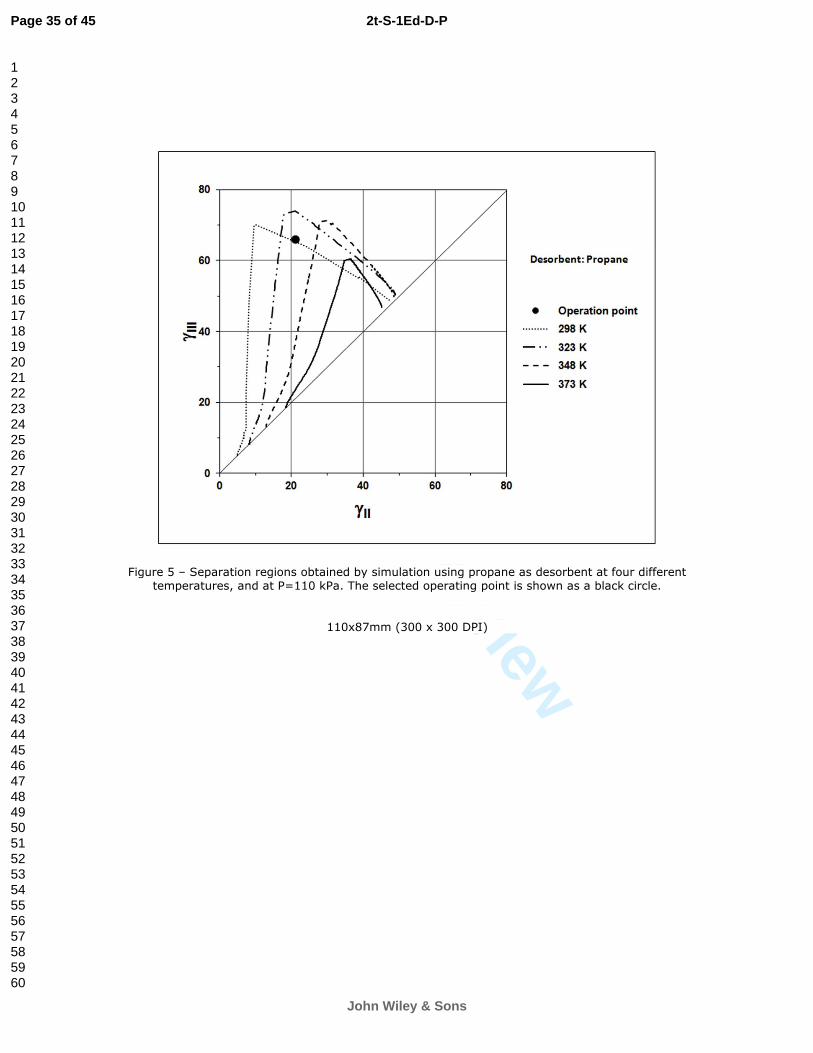
The separation region for a feed of 80% ethylene and 20% ethane at 110 kPa and 298,
323, 348 and 373 K, using 13X as adsorbent and propane as desorbent, and a switching
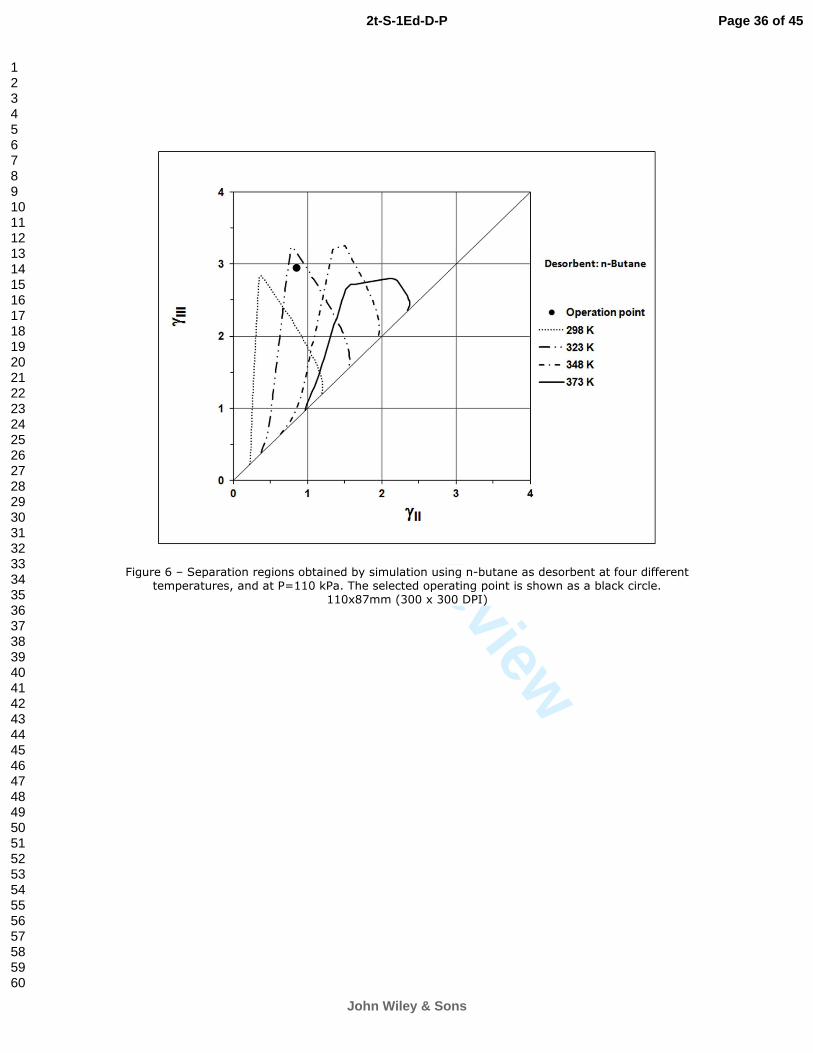
time of 76.5s is presented in Figure 5. The separation region for the case where n-butane
is used as desorbent is presented in Figure 6. These regions represent the production of
both ethane and ethylene with purities above 99.5%. As mentioned by Gleich (US
Patent 3921411 - 1975), the composition of the feed of a C2-splitter can widely change
Page 12 of 45
John Wiley & Sons
2t-S-1Ed-D-P
123456789101112131415161718192021222324252627282930313233343536373839404142434445464748495051525354555657585960
For Peer Review
upon the choice of the feedstock and of the sequence selected upstream the splitter.
Typical feed compositions have an ethane/ethylene ratio from about 1:3 to 3:1. The feed
composition chosen in this work is similar to the one presented in Example II of that
patent.
As it can be seen from the simulation results, the separation is feasible. When propane
is used as desorbent it can be clearly observed that the separation region increases with
the decrease of the temperature. This is due to the increase of the adsorption capacity (as
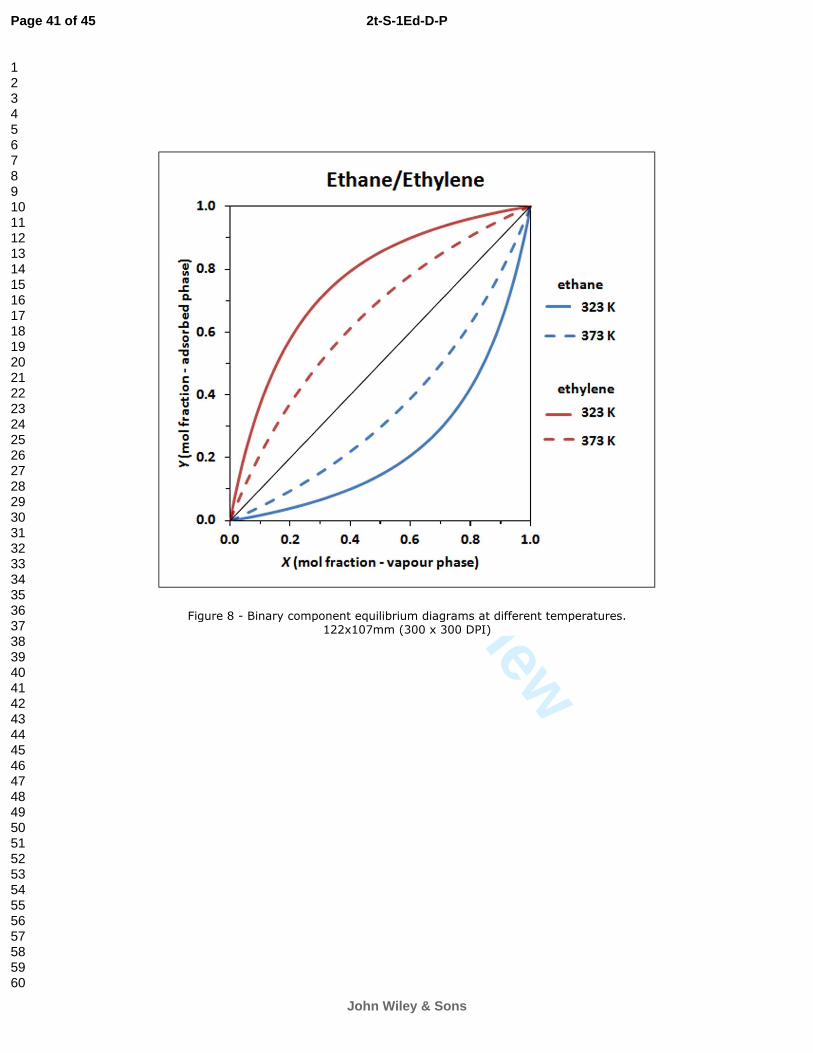
shown in Figure 7), and to the increase of the selectivity. Figure 8 presents the
adsorption capacity of different mixtures of ethane/ethylene at a total pressure of 110
kPa and at 323 and 373 K obtained from the parameters presented in Table 1 and with
Equation 5. As it can be seen, the increase of the temperature decreases the selectivity
of the adsorbent towards each species. As mentioned before, this decrease of the
selectivity decreases the separation region. When n-butane is used at desorbent this
effect of the selectivity in the separation region is not so clear. This is due to the strong
interaction of n-butane with the adsorbent, which makes it hard to be displaced by
ethane and by ethylene.
Additionally, the heights of the “triangle” that represents the separation region are
much smaller when n-butane is used. This indicates a smaller productivity when using
this desorbent. The dimensionless velocity in zone IV, however, is much smaller when
n-butane is used. For the same time switch this is translated in a lower flow rate of the
recycle pump and thus, in a smaller energy consumption of the SMB unit. However, the
overall energy consumption, i.e., the energy consumption of the SMB and the energy
consumption of the units to separate ethane and ethylene from the desorbent, rather than
the energy consumption of the SMB unit alone, is the one that must be taken into
account.
Page 13 of 45
John Wiley & Sons
2t-S-1Ed-D-P
123456789101112131415161718192021222324252627282930313233343536373839404142434445464748495051525354555657585960
For Peer Review
Although the separation region at 298 K when using propane as desorbent is the
largest, from an industrial point of view, the operation at 323 K is more favourable.
Additionally, economical aspects should be taken into consideration for selecting the
best operating temperature. At 298 K the adsorption isotherms of ethane and ethylene
are very steep (see Figure 7). As a consequence, the desorbent consumption will be
equally large.
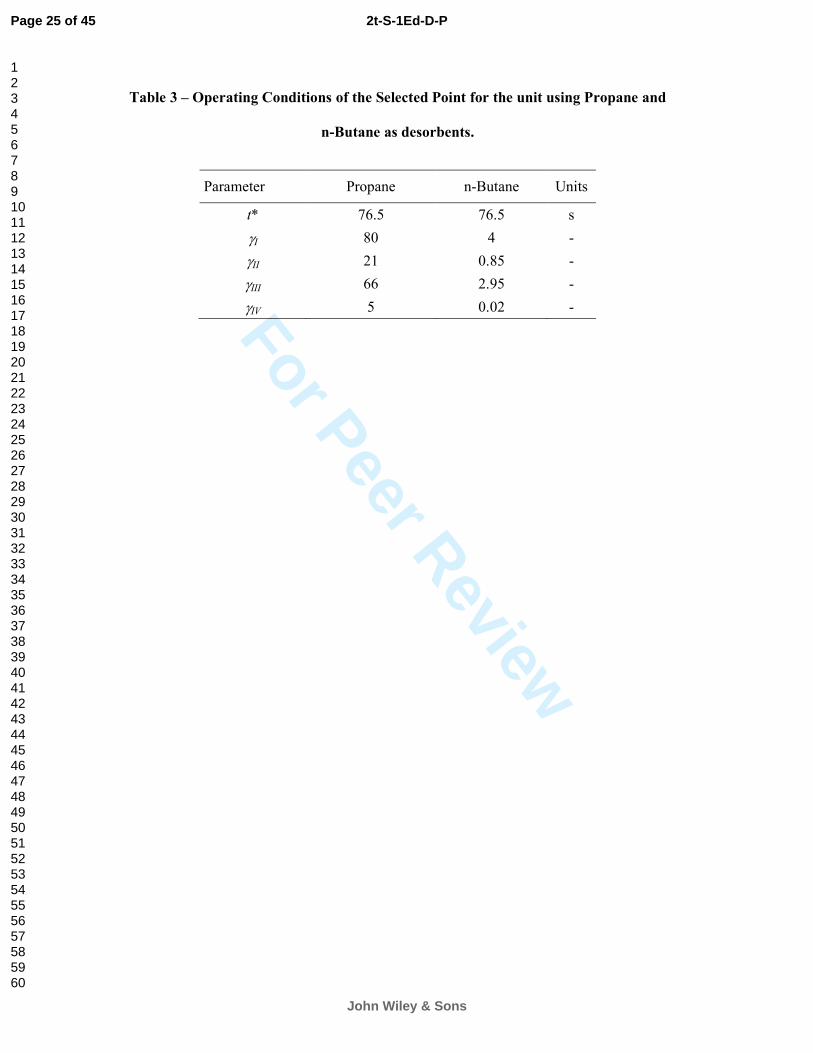
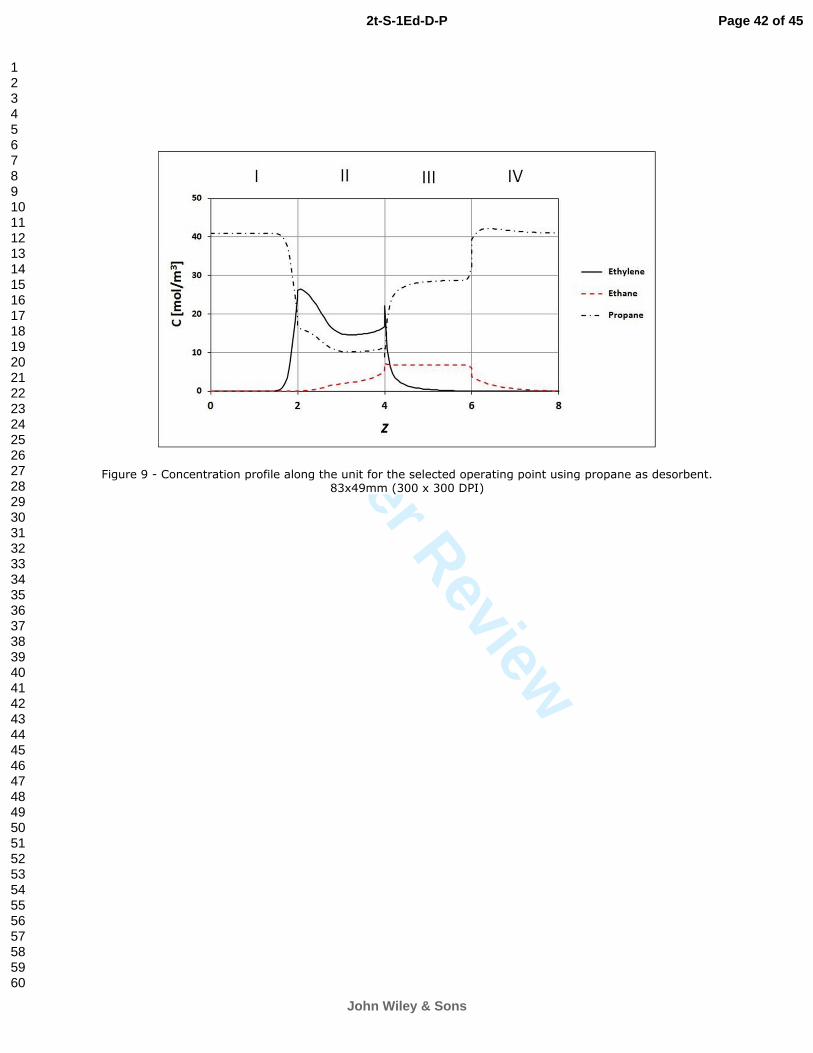
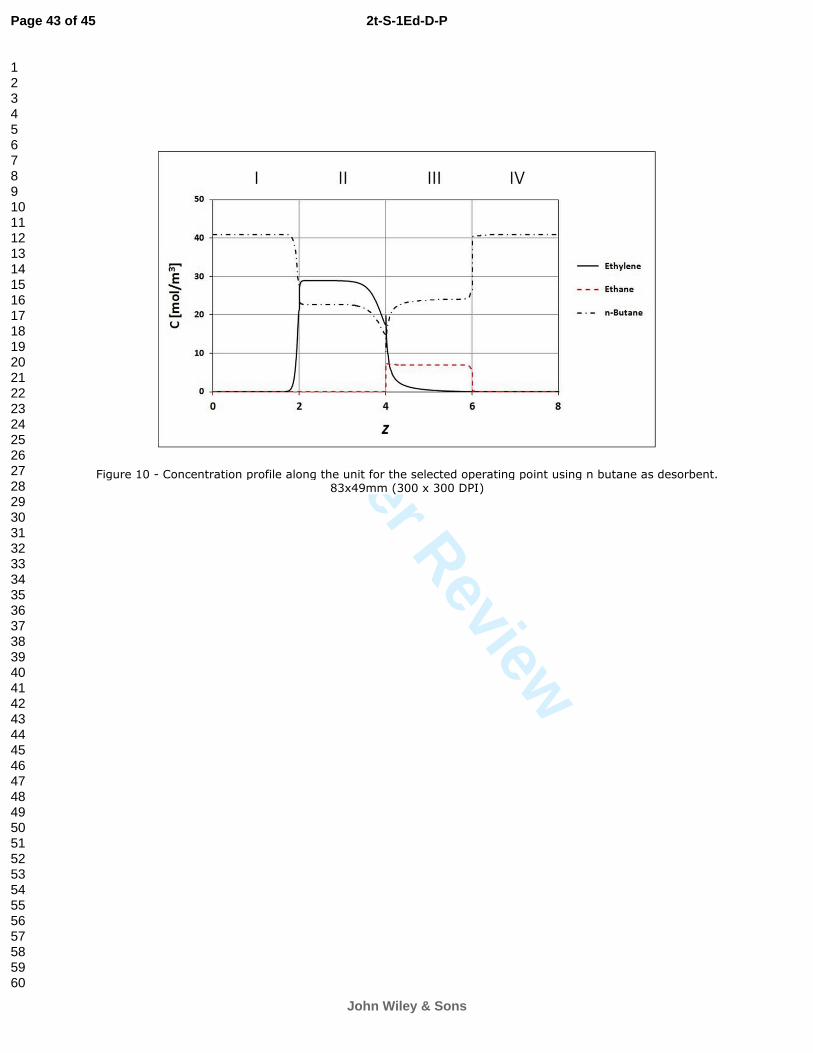
An operation point was selected in the separation region (black dot in Figures 5 and
6), at 323 K. The operating conditions of these points are presented in Table 3. The
concentration profiles along the unit for the chosen operation point are presented in
Figure 9, for propane as desorbent and in Figure 10, for n-butane as desorbent. The
performance parameters of the unit, i.e., purity (Pur) of the streams, and recovery (Rec),
are all 100%. The desorbent consumption (DC) is 0,803 m3 of propane / kg of ethylene
in the extract, and 0,798 m3 of n-butane / kg of ethylene in the extract. Productivity
(Prod) of ethylene is 3.64 mol.kg(-1).h(-1), using propane as desorbent. On the other hand,
when n-butane is used as desorbent, the calculated productivity of ethylene is 0.20
mol.kg(-1).h(-1). As it can be seen, at these operating conditions, a large productivity may
potentially be obtained for ethane/ethylene separation by SMB using 13X as adsorbent
and propane as desorbent. As expected from the separation regions, the productivity
when n-butane is used as desorbent is much lower.
For these operating points, if we consider a feed flow rate of 1.35 m3/s, we need
columns with 7.71 m3, when using propane as desorbent, and columns with 140.30 m3,
when using n-butane as desorbent. For propane as desorbent the extract flow rate would
be 1.77 m3/s, the raffinate flow rate 1.83 m3/s, and the desorbent flow rate 2.25 m3/s.
For n-butane as desorbent the extract flow rate would be 2.03 m3/s, the raffinate flow
rate 1.88 m3/s, and the desorbent flow rate 2.56 m3/s.
Page 14 of 45
John Wiley & Sons
2t-S-1Ed-D-P
123456789101112131415161718192021222324252627282930313233343536373839404142434445464748495051525354555657585960
For Peer Review
4. Conclusions
In this paper we present a multiscale in silico strategy to design an SMB separation
unit that combines molecular simulation with process modelling, and applied it to the
challenging separation of ethane and ethylene using zeolite 13X. The molecular model
was validated first by comparing simulated single-component adsorption isotherms for
ethane and ethylene on 13X with experimental data from several literature sources, and
subsequently by comparing binary Monte Carlo simulations to estimates from the
extended Toth model based on experimental single-component data. In all cases studied,
there was very good agreement between simulation and experiment, giving us
confidence to use our model as an adsorption prediction tool.
The results from molecular simulation were then directly used as input to the process
simulation of an SMB unit to accomplish the separation of ethane and ethylene. Two
candidate desorbents were evaluated, namely propane and n-butane. Overall, propane
was found to be the most advantageous of the two candidates for this particular
separation. Our results thus show that the complete separation of an ethane/ethylene
mixture is feasible by SMB with a large productivity, using 13X as adsorbent and
propane as desorbent. At this stage, we have not attempted to optimize the SMB unit,
but it is likely that doing so will lead to even better separation performance.
The strategy presented here gives a good understanding on how molecular simulations
can be coupled with a model for industrial applications. The results obtained from well
established techniques provide a solid tool for an integrated approach from the
molecular scale to process design. The choice of a good system sorbent/desorbent can
be made more efficient by applying simulation techniques, provided there is an
adequate combination of knowledge of these two scientific fields: molecules and
processes.
Page 15 of 45
John Wiley & Sons
2t-S-1Ed-D-P
123456789101112131415161718192021222324252627282930313233343536373839404142434445464748495051525354555657585960
For Peer Review
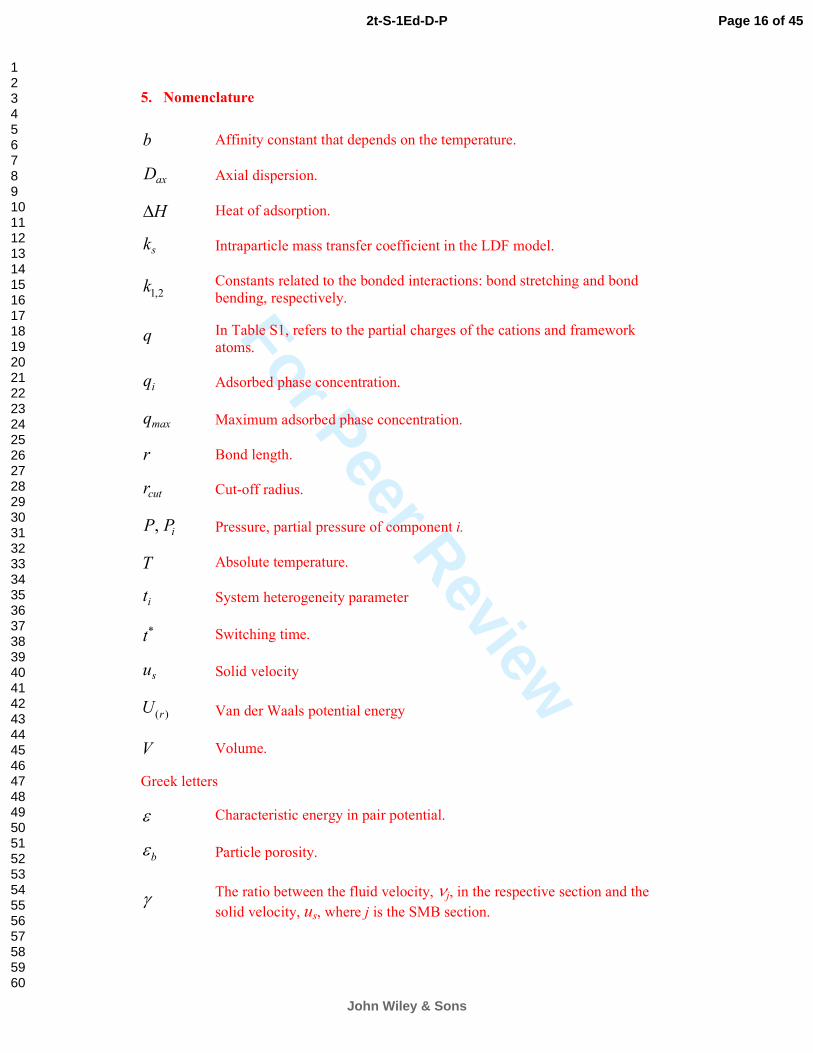
5. Nomenclature
b Affinity constant that depends on the temperature.
axD Axial dispersion.
H∆ Heat of adsorption.
sk Intraparticle mass transfer coefficient in the LDF model.
1,2k Constants related to the bonded interactions: bond stretching and bond bending, respectively.
q
In Table S1, refers to the partial charges of the cations and framework atoms.
iq Adsorbed phase concentration.
maxq Maximum adsorbed phase concentration.
r Bond length.
cutr Cut-off radius.
, iP P Pressure, partial pressure of component i.
T Absolute temperature.
it System heterogeneity parameter
*t Switching time.
su Solid velocity
( )rU Van der Waals potential energy
V Volume.
Greek letters
ε Characteristic energy in pair potential.
bε Particle porosity.
γ The ratio between the fluid velocity, νj, in the respective section and the
solid velocity, us, where j is the SMB section.
Page 16 of 45
John Wiley & Sons
2t-S-1Ed-D-P
123456789101112131415161718192021222324252627282930313233343536373839404142434445464748495051525354555657585960
For Peer Review
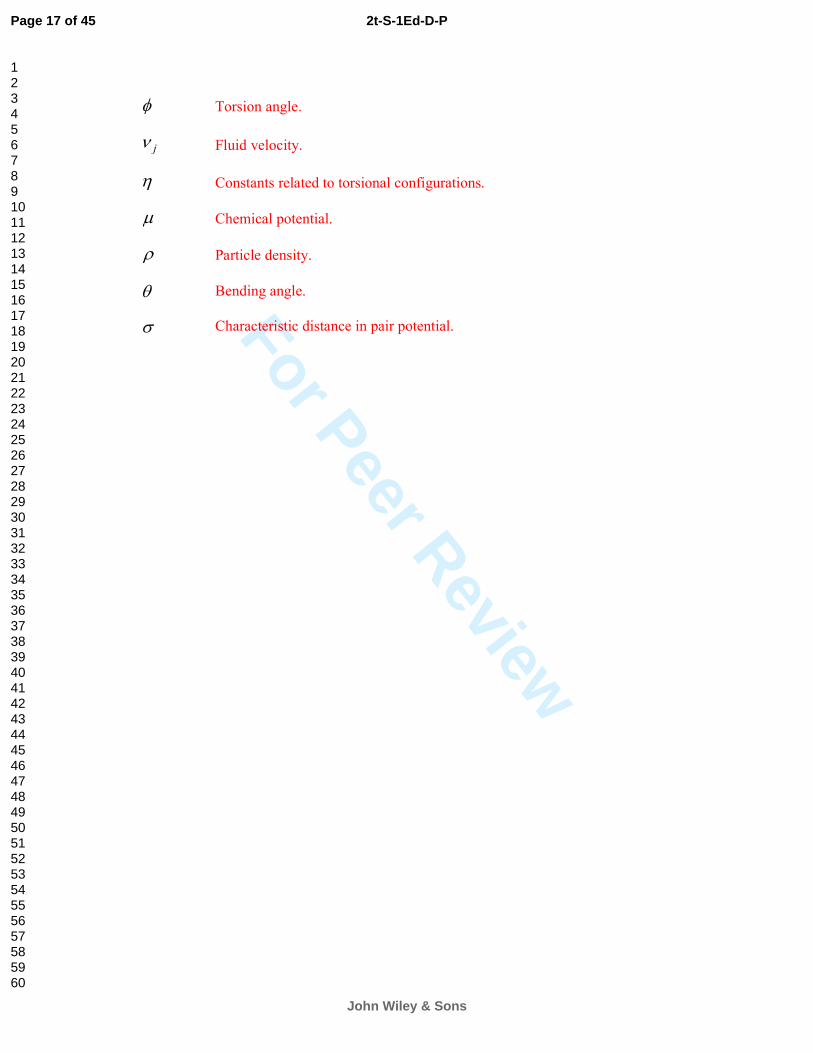
φ Torsion angle.
jν Fluid velocity.
η Constants related to torsional configurations.
µ Chemical potential.
ρ Particle density.
θ Bending angle.
σ Characteristic distance in pair potential.
Page 17 of 45
John Wiley & Sons
2t-S-1Ed-D-P
123456789101112131415161718192021222324252627282930313233343536373839404142434445464748495051525354555657585960
For Peer Review
Acknowledgements
MAG thanks financial support from Fundação para a Ciência e a Tecnologia (FCT)
under the post-doctoral grant SFRH-BPD-47432-2008. VMS acknowledges a
scholarship from project PTDC-EQU-ERQ-104413-2008. This work is partially
supported by projects PTDC-EQU-ERQ-104413-2008 and PEst-C/EQB/LA0020/2011,
financed by FEDER through COMPETE - Programa Operacional Factores de
Competitividade and by FCT - Fundação para a Ciência e a Tecnologia.
Literature Cited
Azevedo, D. C. S.; Rodrigues, A. E. “Design of a Simulated Moving Bed in the
Presence of Mass Transfer Resistance,” AIChE Journal. 45, 956-966, (1999).
Calero, S.; Dubbeldam, D.; Krishna, R.; Smit, B.; Vlugt, T. J. H.; Denayer, J.
F. M.; Martens, J. A.; Maesen, T. L. M. “Understanding the Role of Sodium
During Adsorption: A Force Field for Alkanes in sodium-Exchanged Faujasites,” J.
Am. Chem. Soc., 126, 11377-11386 (2004).
Cheng, L. S. and S. T. Wilson, "Process for separating propylene from propane,"
US Patent 6,293,999 (2001).
Cruz, P.; Santos, J. C.; Magalhães, F. D.; Mendes, A. “Simulation of Separation
Processes Using Finite Volume Method,” Computers & Chemical Engineering, 30,
83-98, (2005).
Da Silva, F.A.; Rodrigues, A. E. “Adsorption Equilibria and Kinetics for
Propylene and Propane Over 13X and 4A Zeolite Pellets,” Ind. Eng. Chem. Res., 38,
2434-2438 (1999).
Page 18 of 45
John Wiley & Sons
2t-S-1Ed-D-P
123456789101112131415161718192021222324252627282930313233343536373839404142434445464748495051525354555657585960
For Peer Review
Danner, R. P.; Choi, E. C. F. “Mixture Adsorption Equilibria of Ethane and
Ethylene on 13X Molecular Sieves,” Ind. Eng. Chem. Fundam. 17, 248-253 (1978).
Dubbeldam, D.; Calero, S.; Vlugt, T. J. H.; Krishna, R.; Maesen, T. L. M.;
Smit, B. “United Atom Force Field for Alkanes in Nanoporous Materials,” J. Phys.
Chem. B. 108, 12301–12313, (2004).
Dunne, J. A.; Rao, M.; Sircar, S.; Gorte, R. J.; Myers, A. L. “Calorimetric Heats
of Adsorption and Adsorption Isotherms. 2. O2, N2, Ar, CO2, CH4, C2H6, and SF6
on NaX, H-ZSM-5, and Na-ZSM-5 Zeolites,” Langmuir, 12, 5896-5904 (1996).
Frenkel, D.; Smit, B. “Understanding Molecular Simulations: From Algorithms to
Applications,” 2nd ed.; Academic Press: San Diego, (2002).
Gleich, W. A. “C2-Splitter Operation with Side Draw Removal of Water to Prevent
Hydrate Formation”. US Patent no. 3921411 (1975).
Granato, M. A.; Lamia, N.; Vlugt, T. J. H.; Rodrigues, A. E. “Adsorption
Equilibrium of Isobutane and 1-Butene in Zeolite 13X by Molecular Simulation,”
Ind. Eng. Chem. Res. 47, 6166-6174, (2008).
Granato, M. A.; Vlugt, T. J. H.; Rodrigues, A. E. “Molecular Simulation of
Propane-Propylene Binary Adsorption Equilibrium in Zeolite 13X,” Ind. Eng.
Chem. Res. 46, 7239-7245, (2007).
Granato, Miguel A., Vlugt, Thijs J. H., Rodrigues, Alírio E. “Potential
Desorbents for Propane/Propylene Separation by Gas Phase Simulated Moving Bed:
A Molecular Simulation Study,” Ind. Eng. Chem. Res., 49, 5826-5833 (2010).
Page 19 of 45
John Wiley & Sons
2t-S-1Ed-D-P
123456789101112131415161718192021222324252627282930313233343536373839404142434445464748495051525354555657585960
For Peer Review
Kaul, B. K. “A modern version of volumetric apparatus for measuring gas-solid
equilibrium data”. Ind. Eng. Chem. Res. 26, 928-983 (1987).
Kirk-Othmer, “Encyclopedia of Chemical Technology” Wiley: New York, U.S.A.
1991.
Lamia, N.; Granato, M. A.; Sá Gomes. P.; Grande, C. A.; Wolff, L.; Leflaive.
P.; Leinekugel-Le-Cocq, D.; Rodrigues, A. E. “Propane/Propylene Separation by
Simulated Moving Bed II. Measurement and Prediction of Binary Adsorption
Equilibria of Propane, Propylene, Isobutane, and 1-Butene on 13X Zeolite,”
Separation Science and Technology, 44, 1485-1509 (2009).
Leão, C. P.; Rodrigues, A. E. “Transient and Steady-State Models for Simulated
Moving Bed Processes: Numerical Solutions,” Computers & Chemical
Engineering, 28 (9), 1725-1741 (2004).
Martin, M. G.; Siepmann, J. I. “Transferable Potentials for Phase Equilibria – 1:
United-Atom Description of n-Alkanes,” J. Phys. Chem. B, 102, 2569–2577, (1998).
Mazzotti, M.; Baciocchi, R.; Storti, G.; Morbidelli, M. “Vapor-Phase SMB
Adsorptive Separation of Linear/Nonlinear Paraffins,” Ind. Eng. Chem. Res., 35,
2313-2321 (1996).
Minceva, M.; Pais, L. S.; Rodrigues, A. E. “Cyclic Steady State of Simulated
Moving Bed Processes for Enantiomers Separation,” Chemical Engineering and
Processing, 42, 93-104 (2003).
Rao, D. P.; Sivakumar, S. V.; Mandal, S.; Kota, S.; Ramaprasad, B.S.G. “Novel
simulated moving-bed adsorber for the fractionation of gas mixtures,” J.
Chromatogr. A., 1069, 141–151, (2005).
Page 20 of 45
John Wiley & Sons
2t-S-1Ed-D-P
123456789101112131415161718192021222324252627282930313233343536373839404142434445464748495051525354555657585960
For Peer Review
Rege, S. U.; Padin, J.; Yang, R. T. “Olefin/Paraffin Separations by Adsorption: π-
Complexation vs. Kinetic Separation,” AIChE Journal, 44, 799-809 (1998).
Rodrigues, A. E.; Lamia, N.; Grande, C.; Wolff, L.; Leflaive, P.; Leinekugel-le-
Cocq, D. “Procédé de Séparation du Propylène en Mélange avec du Propane par
Adsorption en Lit Mobile Simulé en Phase Gaz ou Liquide Utilisant une Zéolithe de
type Faujasite 13X comme Solide Adsorbant”. FR. Patent no. 2903981A1 and INT.
Patent WO/2008/012410A1. (2006). Also: US. Patent no. 20100069696. (2010).
Sá Gomes, P.; Minceva, M.; Rodrigues, A. E. “Operation of an Industrial SMB
Unit for p-xylene Separation Accounting for Adsorbent Ageing Problems,”
Separation Science and Technology, 43, 1974-2002 (2008).
Sá Gomes, P.; Lamia, N.; Rodrigues, A. E. “Design of a gas-phase simulated
moving bed for propane/propylene separation” Chemical Engineering Science, 64,
1336-1357 (2009).
Smit, B.; Krishna, R. “Monte Carlo Simulations in Zeolites,” Curr. Opin. Solid
State Mater. Sci., 5, 455-461, (2001).
Tarek, M.; Kahn, R.; de Lara, E. C. “Modelization of Experimental Isotherms of
n-Alkanes in NaX Zeolite,” Zeolites, 15, 67-72, (1995).
Ungerer, P.; Beauvais, C.; Delhommelle, J.; Boutin, A.; Rousseau, B.; Fuchs. A.
H. “Optimization of the Anisotropic United Atoms Intermolecular Potential for n-
Alkanes,” J. Chem. Phys., 112, 5499-5510, (2000).
Valenzuela, D. P.; Myers, A. L. “Adsorption Equilibrium Data Handbook, p. 89-
90. Prentice-Hall, Engelwood Cliffs, N.J. (1989).
Page 21 of 45
John Wiley & Sons
2t-S-1Ed-D-P
123456789101112131415161718192021222324252627282930313233343536373839404142434445464748495051525354555657585960
For Peer Review
Vlugt, T. J. H.; Krishna R.; Smit, B. Molecular Simulations of Adsorption
Isotherms for Linear and Branched Alkanes and Their Mixtures in Silicalite. J.
Phys. Chem. B. 103, 1102-1118, (1999).
Vlugt, T. J. H.; Schenk M: Influence of Framework Flexibility on the Adsorption
Properties of Hydrocarbons in the Zeolite Silicalite. J. Phys. Chem. B., 106, 12757-
12763, (2002).
Page 22 of 45
John Wiley & Sons
2t-S-1Ed-D-P
123456789101112131415161718192021222324252627282930313233343536373839404142434445464748495051525354555657585960

For Peer Review
Table 1 - Parameters of the Toth Equation.
Parameter Ethane Ethylene Propane a n-Butane
b
qs[mol/kg] 2.21 2.72 2.68 1.57
b0[kPa-1l] 5.22×10
-6 1.13×10
-7 3.50×10
-7 1.37×10
-6
-∆H [kJ/mol) 21.4 36.3 35.8 41.2
t[-] 1.75 0.97 0.58 0.94 a Data from da Silva (1999)25.
b Data from Tarek et al (1995)26.
Page 23 of 45
John Wiley & Sons
2t-S-1Ed-D-P
123456789101112131415161718192021222324252627282930313233343536373839404142434445464748495051525354555657585960
For Peer Review
Table 2 – SMB Model Parameters.
Parameter Value Units
Dax 3.76×10⁻⁴ m
2/s
εb 0.4 -
ρp 1357 kg/m3
ks,i 1 s-1
T 323 K
P 110 kPa
t* 76.5 s
Propane n-Butane
γI 100 150 -
γIV 0.05 0.01 -
Feed Composition (molar fraction) Units
Ethylene 0.8 -
Ethane 0.2 -
Configuration 2-2-2-2 -
Page 24 of 45
John Wiley & Sons
2t-S-1Ed-D-P
123456789101112131415161718192021222324252627282930313233343536373839404142434445464748495051525354555657585960
For Peer Review
Table 3 – Operating Conditions of the Selected Point for the unit using Propane and
n-Butane as desorbents.
Parameter Propane n-Butane Units
t* 76.5 76.5 s
γI 80 4 -
γII 21 0.85 -
γIII 66 2.95 -
γIV 5 0.02 -
Page 25 of 45
John Wiley & Sons
2t-S-1Ed-D-P
123456789101112131415161718192021222324252627282930313233343536373839404142434445464748495051525354555657585960
For Peer Review
List of Figures
Figure 1 – Isotherms on 13X zeolite at 393 and 423 K: (a) Ethane; (b) Ethylene. Open
symbols are experimental data from Kaul, (1987). Closed symbols are our simulations,
which account for the presence of 20% of binder in the experimental sample.
Figure 2 – Isotherms of Ethane on 13X zeolite at 305 K. Open symbols are experimental
data from Dunne et al., (1996). Closed symbols are our simulations.
Figure 3 – Binary adsorption equilibrium for ethane/ethylene at a total pressure of 137.8
kPa, calculated from the extended Toth model with experimental single component data
from Danner and Choi (1978), predicted from CBMC simulations, and compared with
experimental binary adsorption data form Kaul (1987).
Figure 4a – Binary adsorption equilibrium at 373 K and total pressure of 110 kPa. (a,b)Experimental single component data used in the extended Toth model were taken from
Danner and Choi (1978) for ethane and ethylene, and from Tarek et al. (1995) for n-butane.
Figure 4b – Binary adsorption equilibrium at 373 K and total pressure of 110 kPa. (a,b)Experimental single component data used in the extended Toth model were taken from
Danner and Choi (1978) for ethane and ethylene, and from Da Silva and Rodrigues (1999)
for propane.
Figure 5 – Separation regions obtained by simulation using propane as desorbent at four
different temperatures, and at P=110 kPa. The selected operating point is shown as a black
circle.
Figure 6 – Separation regions obtained by simulation using n-butane as desorbent at four
different temperatures, and at P=110 kPa. The selected operating point is shown as a black
circle.
Figure 7 - Single component isotherms at different temperatures.
Figure 8 - Binary component equilibrium diagrams at different temperatures.
Figure 9 - Concentration profile along the unit for the selected operating point using
propane as desorbent.
Figure 10 - Concentration profile along the unit for the selected operating point using
n-butane as desorbent.
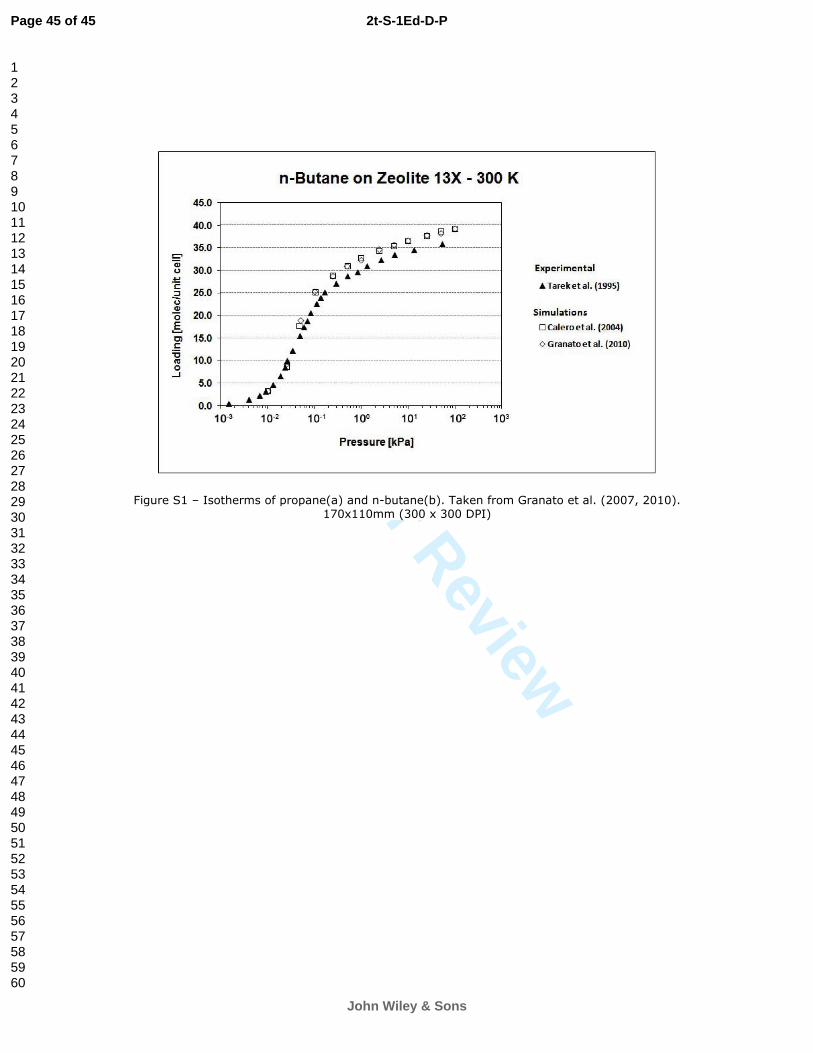
Figure S1 – Isotherms of propane and n-butane. Taken from Granato et al. (2007, 2010).
Page 26 of 45
John Wiley & Sons
2t-S-1Ed-D-P
123456789101112131415161718192021222324252627282930313233343536373839404142434445464748495051525354555657585960
For Peer Review
86x53mm (300 x 300 DPI)
Page 27 of 45
John Wiley & Sons
2t-S-1Ed-D-P
123456789101112131415161718192021222324252627282930313233343536373839404142434445464748495051525354555657585960
For Peer Review
Figure 1 – Isotherms on 13X zeolite at 393 and 423 K: (a) Ethane; (b) Ethylene. Open symbols are experimental data from Kaul, (1987). Closed symbols are our simulations, which account for the presence of
20% of binder in the experimental sample.
86x53mm (300 x 300 DPI)
Page 28 of 45
John Wiley & Sons
2t-S-1Ed-D-P
123456789101112131415161718192021222324252627282930313233343536373839404142434445464748495051525354555657585960
For Peer Review
Figure 2 – Isotherms of Ethane on 13X zeolite at 305 K. Open symbols are experimental data from Dunne et al., (1996). Closed symbols are our simulations.
86x53mm (300 x 300 DPI)
Page 29 of 45
John Wiley & Sons
2t-S-1Ed-D-P
123456789101112131415161718192021222324252627282930313233343536373839404142434445464748495051525354555657585960
For Peer Review
Figure 3 - Binary adsorption equilibrium for ethane/ethylene at a total pressure of 137.8 kPa, calculated from the extended Toth model with experimental single component data from Danner and Choi (1978), predicted from CBMC simulations, and compared with experimental binary adsorption data form Kaul
(1987). 140x84mm (300 x 300 DPI)
Page 30 of 45
John Wiley & Sons
2t-S-1Ed-D-P
123456789101112131415161718192021222324252627282930313233343536373839404142434445464748495051525354555657585960
For Peer Review
140x92mm (300 x 300 DPI)
Page 31 of 45
John Wiley & Sons
2t-S-1Ed-D-P
123456789101112131415161718192021222324252627282930313233343536373839404142434445464748495051525354555657585960
For Peer Review
Figure 4a - Binary adsorption equilibrium at 373 K and total pressure of 110 kPa. (a,b)Experimental single component data used in the extended Toth model were taken from Danner and Choi (1978) for ethane and
ethylene, and from Tarek et al. (1995) for n-butane. 140x94mm (300 x 300 DPI)
Page 32 of 45
John Wiley & Sons
2t-S-1Ed-D-P
123456789101112131415161718192021222324252627282930313233343536373839404142434445464748495051525354555657585960
For Peer Review
140x94mm (300 x 300 DPI)
Page 33 of 45
John Wiley & Sons
2t-S-1Ed-D-P
123456789101112131415161718192021222324252627282930313233343536373839404142434445464748495051525354555657585960
For Peer Review
Figure 4b – Binary adsorption equilibrium at 373 K and total pressure of 110 kPa. (a,b)Experimental single component data used in the extended Toth model were taken from Danner and Choi (1978) for ethane and
ethylene, and from Da Silva and Rodrigues (1999) for propane. 140x94mm (300 x 300 DPI)
Page 34 of 45
John Wiley & Sons
2t-S-1Ed-D-P
123456789101112131415161718192021222324252627282930313233343536373839404142434445464748495051525354555657585960
For Peer Review
Figure 5 – Separation regions obtained by simulation using propane as desorbent at four different temperatures, and at P=110 kPa. The selected operating point is shown as a black circle.
110x87mm (300 x 300 DPI)
Page 35 of 45
John Wiley & Sons
2t-S-1Ed-D-P
123456789101112131415161718192021222324252627282930313233343536373839404142434445464748495051525354555657585960
For Peer Review
Figure 6 – Separation regions obtained by simulation using n-butane as desorbent at four different temperatures, and at P=110 kPa. The selected operating point is shown as a black circle.
110x87mm (300 x 300 DPI)
Page 36 of 45
John Wiley & Sons
2t-S-1Ed-D-P
123456789101112131415161718192021222324252627282930313233343536373839404142434445464748495051525354555657585960
For Peer Review
140x101mm (300 x 300 DPI)
Page 37 of 45
John Wiley & Sons
2t-S-1Ed-D-P
123456789101112131415161718192021222324252627282930313233343536373839404142434445464748495051525354555657585960
For Peer Review
140x101mm (300 x 300 DPI)
Page 38 of 45
John Wiley & Sons
2t-S-1Ed-D-P
123456789101112131415161718192021222324252627282930313233343536373839404142434445464748495051525354555657585960
For Peer Review
140x101mm (300 x 300 DPI)
Page 39 of 45
John Wiley & Sons
2t-S-1Ed-D-P
123456789101112131415161718192021222324252627282930313233343536373839404142434445464748495051525354555657585960
For Peer Review
Figure 7 - Single component isotherms at different temperatures. 140x101mm (300 x 300 DPI)
Page 40 of 45
John Wiley & Sons
2t-S-1Ed-D-P
123456789101112131415161718192021222324252627282930313233343536373839404142434445464748495051525354555657585960
For Peer Review
Figure 8 - Binary component equilibrium diagrams at different temperatures. 122x107mm (300 x 300 DPI)
Page 41 of 45
John Wiley & Sons
2t-S-1Ed-D-P
123456789101112131415161718192021222324252627282930313233343536373839404142434445464748495051525354555657585960
For Peer Review
Figure 9 - Concentration profile along the unit for the selected operating point using propane as desorbent. 83x49mm (300 x 300 DPI)
Page 42 of 45
John Wiley & Sons
2t-S-1Ed-D-P
123456789101112131415161718192021222324252627282930313233343536373839404142434445464748495051525354555657585960
For Peer Review
Figure 10 - Concentration profile along the unit for the selected operating point using n butane as desorbent. 83x49mm (300 x 300 DPI)
Page 43 of 45
John Wiley & Sons
2t-S-1Ed-D-P
123456789101112131415161718192021222324252627282930313233343536373839404142434445464748495051525354555657585960
For Peer Review
90x58mm (300 x 300 DPI)
Page 44 of 45
John Wiley & Sons
2t-S-1Ed-D-P
123456789101112131415161718192021222324252627282930313233343536373839404142434445464748495051525354555657585960
For Peer Review
Figure S1 – Isotherms of propane(a) and n-butane(b). Taken from Granato et al. (2007, 2010). 170x110mm (300 x 300 DPI)
Page 45 of 45
John Wiley & Sons
2t-S-1Ed-D-P
123456789101112131415161718192021222324252627282930313233343536373839404142434445464748495051525354555657585960