from hydrophobic to hydrophilic: the structure and density ... · infrared (ir) and raman spectrum...
TRANSCRIPT

From Hydrophobic to Hydrophilic: The Structure and Density of theHexadecane Droplet/Alkanol/Water InterfaceYixing Chen,† Kailash C. Jena,†,‡ and Sylvie Roke*,†
†Laboratory for fundamental BioPhotonics (LBP), Institute of Bioengineering (IBI), School of Engineering (STI), EcolePolytechnique Federale de Lausanne (EPFL), CH-1015, Lausanne, Switzerland‡Department of Physics, Indian Institute of Technology Ropar, Rupnagar, 140001, India
*S Supporting Information
ABSTRACT: The molecular structure of the hexadecane droplet/alkanol/water interfacehas been investigated using vibrational sum frequency scattering and second harmonicscattering. This combination of methods allows us to investigate the interfacial alkyl chainconformation of the oil and several alkanols, ranging from 1-pentanol to 1-dodecanol, theorientational distribution of the methyl groups, the surface density of the alkanols, as wellas the orientational alignment of water. For the hexadecane/1-dodecanol/water interface,dodecanol alkyl chains form a fluid layer with a wide distribution of tilt angles of theterminal CH3 groups. Indistinguishable spectra are recorded for the alkanol alkyl chains of1-pentanol, 1-hexanol, 1-octanol, and 1-dodecanol, and alkanols with chain length longerthan 6 C atoms all form films with similar densities. In contrast, the alkyl chains of the oilphase are relatively more distorted with respect to the pure oil/water interface for alkanolswith shorter chain lengths. The projected surface area of a saturated film of hexanol is 29± 5 Å2, which requires a free energy of adsorption of ΔG = −26.3 ± 0.7 kJ/mol. Inaddition, with increasing alkanol density the interfacial water structure loses its initialorientational alignment, which matches with the added number of interfacial 1-hexanol molecules. The found structures differsignificantly from those reported on the alkanol/water and alkanol/air interface and charged surfactant/oil/water interface.
■ INTRODUCTION
The structural elements that form the building blocks of life arecomposed of aqueous regions that are in contact withhydrophobic domains or cores, such as the structures foundin membranes, peptides, and proteins. The transition from ahydrophilic to a hydrophobic environment is therefore essentialfor understanding fundamental aspects of living systems. Thequantitative study of this type of structures and the relatedinteractions started over a century ago, when interfacial tensionstudies were performed on insoluble monolayers.1−3 It wassuggested that molecules are surface active when they lower theenergy of the interface. This lowering of the interfacial energywas explained in terms of solubility: When a molecule has partsthat dissolve better in a polar/nonpolar solvent it will orientitself in a configuration of lowest energy, that is, partiallydissolved in oil and partially dissolved in water. Alkanols areuncharged amphiphilic molecules with a hydrophobic part thatdissolves well in an oil phase and a hydrophilic part thatdissolves well in a water phase and they form essential buildingblocks that provide a transition between hydrophobic andhydrophilic environments. Depending on the chain length, thepartitioning between water and oil changes, as well as the freeenergy of transfer from the oil to the water phase. Figure 1shows the partitioning coefficient derived from the Ostwaldsolubility (A) and the free energy of transfer (B) for several 1-alkanols in the hexadecane/water system, which is exemplary ofa true hydrophobic liquid in contact with water (used, for
example, to estimate the activity of pharmaceuticals4). It can beseen that 1-propanol, 1-butanol, and 1-pentanol are moresoluble in water than in oil, while for 1-hexanol, 1-heptanol, 1-octanol, and 1-decanol the reverse applies. The free energy oftransfer from water to hexadecane shows a similar trend, buthere only 1-propanol has a positive free energy of transfer tothe oil phase. How the transition from oil to water occurs on
Received: May 22, 2015Revised: July 1, 2015Published: July 7, 2015
Figure 1. Thermodynamic data of solute transfer. (A) Partitioningcoefficient of several 1-alkanols with chain lengths from C3−C10,derived by dividing the Ostwald solubilities of the respective 1-alkanolin hexadecane by that of water. (B) Free energies of transfer fromwater to hexadecane. The data was adapted from ref 4.
Article
pubs.acs.org/JPCC
© 2015 American Chemical Society 17725 DOI: 10.1021/acs.jpcc.5b04904J. Phys. Chem. C 2015, 119, 17725−17734

the molecular level, whether this transition requires a particularstructure of the alkanol, the water or the oil, and whether itdepends critically on chain length is not conveyed by the datain Figure 1.Molecular level information about the electronic order
present in the interfacial layer can be obtained from X-rayreflection measurements in combination with appropriatemodeling of ordered monolayers of alkanols on water (see,for example, refs 5 and 6). Molecular level insight combinedwith intrinsic interfacial sensitivity can also be obtained bymeans of sum frequency generation (SFG), a vibrationalcoherent interface spectroscopy that measures the combinedinfrared (IR) and Raman spectrum of molecules in non-centrosymmetric environments such as interfaces.7−9 Themajority of the vibrational SFG studies have been performedon the air/alkanol interface with a focus on the alkyl chainconformation,10,11 the water/alkanol/air interface,12−16 with afocus on both the alkyl chain conformation and the effects ofhydration.15,16 The choice for these systems is likelydetermined by the experimental geometry, which permitsunhindered access to the interface. Studies of the liquid/liquidoil/water interface are more challenging for several reasons: theoptical beams need to pass through one of the often absorptivephases,17 the formation of a planar oil/water interface isnontrivial, and it often consists of a heterogeneous structure18
made up of nano- and microscopic islands, which are criticallyinfluenced by the tiniest amount of intrinsic impurities thatmight be present.19 Therefore, the focus is often on one aspect,namely the water structure20−23 or the alkyl chain conforma-tion.17 The latter can be probed by measuring SFG spectra inthe C−H stretch region. The amplitude ratio (referred to as d+/r+ ratio) of the symmetric methylene (d+ at ∼2850 cm−1) andthe symmetric methyl (r+ at ∼2876 cm−1) stretch vibrationalmodes is a common empirical indicator for the conformation ofalkyl chains.24−26 A value of d+/r+ ≪ 1 is associated with astretched all-trans chain conformation, whereas a value of d+/r+
> 1 indicates that gauche defects dominate the measured SFGspectrum. Using selective deuteration it is possible toindependently probe the surfactant and the oil molecules,since C−D and C−H modes vibrate at different frequencies.26
In order to obtain full molecular level insight into themolecular structural aspects of the transition from a hydro-phobic to an aqueous phase without being hindered by theabove restrictions, we use a dispersion of ∼100 nm (radius)hexadecane droplets in water that also contains 1-pentanol, 1-hexanol, 1-octanol, or 1-dodecanol. We study the transitionfrom the hydrophobic to aqueous phase and the role played byhydrophobic interactions by determining the alkyl chainconformation of the alkanols and the oil, the surface densityof the alkanols, and the structural changes imposed on thewater using a combination of second harmonic27−29 (SH) andsum frequency scattering29,30 (SFS). Second harmonic31
scattering27,32−34 (SHS) is a process that occurs only innoncentrosymmetric materials. The SHS signal can be used as aprobe for the interfacial water around nanoscopic droplets andreports on the difference in dynamic orientational directionalityof the water molecules in the interfacial region compared to theorientational directionality in the bulk solution.31,35−37 On theother hand, the SFS signal can be used to probe the chemicalcomposition, alkyl chain conformation, and density of thedroplet/water interface.29,38,39 Using selective deuteration andprobing the C−H stretch mode region we have measured theconformation of the alkyl chains present on the 1-pentanol, 1-hexanol, 1-octanol, and 1-dodecanol/d34-hexadecane interfaceand the d11-1-pentanol, d13-1-hexanol, d17-1-octanol, and d25-1-dodecanol/hexadecane interface. Starting with the hexadecane/1-dodecanol/water interface, we find that the relative chainconformation represents that of a fluid layer with a widedistribution of tilt angles of the terminal CH3 groups. Changingthe chain lengths of the alkanol, the alkanol alkyl chains adopt aconformation that generates indistinguishable SF spectra.Comparing the amplitude of the spectra it appears that thealkanols with chain lengths longer than 6 C atoms all form filmswith comparable chain densities. In contrast, the alkyl chains ofthe oil phase are relatively more distorted with respect to thepure oil/water interface for shorter alkanol alkyl chains. For 1-hexanol, we measured the surface density more accurately bymeans of an SFS isotherm, finding a projected surface densityof 29 ± 5 Å2 and a free energy of adsorption of ΔG = −26.3 ±0.7 kJ/mol. SHS measurements on the same system show thatwith increasing 1-hexanol density the interfacial water structure
Figure 2. The surface structure of 1-dodecanol and hexadecane at the hexadecane nanodroplet/water interface. (A,B) SFS spectra of the C−H-stretch modes of the 1-dodecanol/d34-hexadecane droplet interface (A) and the d25-1-dodecanol/hexadecane droplet interface (B) in D2O. Thespectra are recorded in three different polarization combinations, PPP (red), SSP (green), and SPS (blue). The black lines are fits to the spectra. (C)Calculated r+/r− amplitude ratio as a function of the average tilt angle ϕ of the end methyl group of the alkyl chain with respect to the surfacenormal. The distribution of tilt angles is represented by both a δ-function and a Gaussian function (assuming an angular full width at half-maximumof 70°). For the hyperpolarizability ratio βaac/βccc, we have used the value 3.4.40 The average radius R of the nanodroplets is 115 nm (1 vol %). Forthe opening (β) and scattering (θ) angle, we used β = 5° and θ = 35° (which represent the values inside the cuvette), and appropriate refractiveindex values are given in Supporting Information Table S2.
The Journal of Physical Chemistry C Article
DOI: 10.1021/acs.jpcc.5b04904J. Phys. Chem. C 2015, 119, 17725−17734
17726
loses its initial orientational alignment in a way that matcheswith the added number of interfacial 1-hexanol molecules. Thefound conformations differ significantly from that reported atthe alkanol/water and alkanol/air interface.In what follows we will first present and analyze SFS spectra
of the 1-dodecanol/hexadecane/water interface. Then we willchange the chain length and investigate the isotherm of 1-hexanol. Finally we will turn to the water structure and discussour findings in a broader scope.
■ RESULTS AND DISCUSSION
The Surface Structure of 1-Dodecanol. Figure 2 showsSFS spectra of the C−H stretch modes of the 1-dodecanol/d34-hexadecane droplet interface (A) and the d25-1-dodecanol/hexadecane droplet interface (B) in D2O. The spectra arerecorded in three different polarization combinations: SSP,PPP, and SPS. Here the three letter code represents thepolarization of each beam from high frequency to lowfrequency, with P(S) referring to light polarized parallel(perpendicular) to the scattering plane. The spectra are fittedaccording to the procedure described in the SupportingInformation. Figure 2C shows a calculation of the amplituderatio of the symmetric methyl (r+, at ∼2876 cm−1) and theantisymmetric methyl (r−, at ∼2965 cm−1) stretch modes. Thisratio is used to derive the average tilt angle ⟨ϕ⟩ of the methylgroup of the alkyl chains of the 1-dodecanol and hexadecanewith respect to the surface normal.Starting with the SSP spectrum of 1-dodecanol and
hexadecane (green lines in Figure 2A,B), it can be seen thatthe following peaks are present:11 the symmetric (s) CH2stretch mode (∼2850 cm−1, d+), the s-CH3 stretch mode(∼2876 cm−1, r+), the antisymmetric (as) CH3 stretch mode(∼2965 cm−1, r −), the s-CH2−Fermi resonance (∼2905 cm−1,d+FR), the s-CH3-Fermi resonance (∼2933 cm−1, r+FR), and theas-CH2 stretch mode (∼2920 cm−1, d−). The latter threemodes are broad and overlap.16,41 Fitted values can be found inSupporting Information Table S1. The obtained d+/r+
amplitude ratio for 1-dodecanol is 0.7 ± 0.2, while that forhexadecane is 1.1 ± 0.2. This shows that there are fewer visiblegauche defects in the spectra of the alkyl chains of the 1-dodecanol than in the alkyl chains of the hexadecane.Comparing the three polarization combinations, we observe
that the spectra are different. Specifically, it can be seen that theSSP spectra in Figure 2A,B show less antisymmetric character
and have a smaller relative d+/r+ ratio than the PPP spectra.The relative phase of the r− mode is also different for the SSPand PPP polarization combinations. On the other hand, theSPS spectra display only the d− and r− mode. These differencesare not a consequence of a different relative tilt angle of thealkyl chains with respect to the surface normal as it would befor SFG in the reflection geometry,42 but are a consequence ofthe nonlinear light scattering geometry. Nonlinear lightscattering theory predicts that for SF scattering each polar-ization combination has a different number of surfacesusceptibility elements that contribute to the scattered SFspectra with different weights (represented by form factorfunctions that are determined by scattering angle and dropletsize38). As a result, the PPP spectra are often the most intenseones, because this polarization combination reports on alltensor elements of the surface susceptibility, which also appearwith a larger magnitude.38,43 They are also subject to someweakly dispersive interaction from D2O, as we observedbefore.44 In contrast, here only the antisymmetric modes arevisible in the SPS spectra, which is expected because SPS is theonly polarization combination for which the β(2)aca elements ofthe hyperpolarizability tensor are dominant. A molecular tiltangle ϕ away from the surface normal does reduce the overallintensity, because SFS is only reporting on molecular groupsthat have some kind of preferential alignment along the surfacenormal of an isotropic surface (see Supporting Information eqS5, just like in reflection mode SFG). We found previously38
that the r− mode is sensitive to the tilt angle of the methylgroup, while the r+ mode is less sensitive, and the d+ modes arenot sensitive at all to the tilt angle. Thus, by calculating thedifferent amplitude ratios38 we can determine the average tiltangle ϕ of the terminal CH3 group with respect to the dropletsurface normal. Compared to other possible peak ratios, the r+/r− amplitude ratio of the SSP spectrum shows the highestsensitivity to the change of the tilt angle of the CH3 group (seeSupporting Information Figure S2).Figure 2C shows a computation of the r+/r− amplitude ratio
as a function of ϕ assuming a hyperpolarizability ratio40 of 3.4and a δ-distribution of tilt angles (blue line), as well as a broadGaussian distribution (assuming an angular full width at half-maximum of 70°) of tilt angles (red line). Both functions forthe orientational distribution thus represent two extremes of asurface structure: one highly ordered one and one highlydisordered in terms of tilt angle. The experimental values found
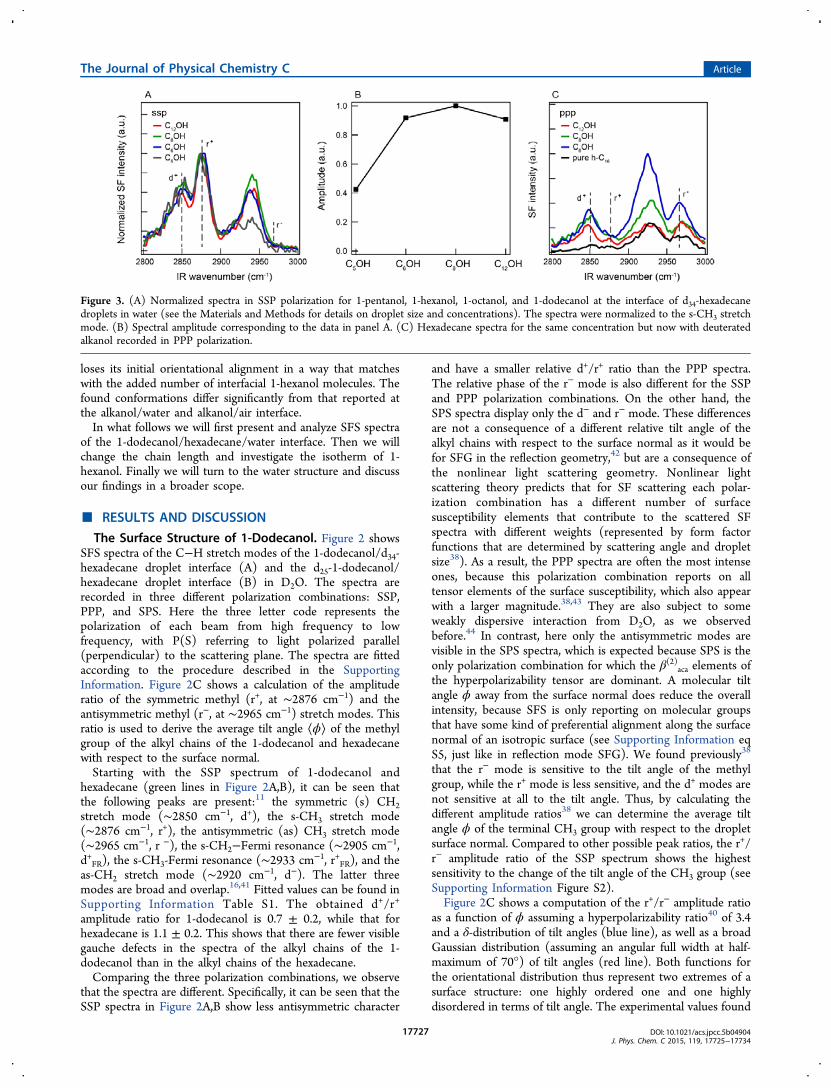
Figure 3. (A) Normalized spectra in SSP polarization for 1-pentanol, 1-hexanol, 1-octanol, and 1-dodecanol at the interface of d34-hexadecanedroplets in water (see the Materials and Methods for details on droplet size and concentrations). The spectra were normalized to the s-CH3 stretchmode. (B) Spectral amplitude corresponding to the data in panel A. (C) Hexadecane spectra for the same concentration but now with deuteratedalkanol recorded in PPP polarization.
The Journal of Physical Chemistry C Article
DOI: 10.1021/acs.jpcc.5b04904J. Phys. Chem. C 2015, 119, 17725−17734
17727

for the r+/r− amplitude ratio from the fits in Figure 2A,B are 2.8for 1-dodecanol and 3.0 for hexadecane. Comparing thesevalues to the calculated lines, we find (assuming a δ-function)that ϕC12OH = 33 ± 5° and ϕC16 = 38 ± 5°. These values areboth not far away from the value reported for a randomdistribution of tilt angles and do not necessarily report on anactual narrow tilt angle distribution.45 For the broad Gaussiandistribution, we find ϕC12OH = 49 ± 17° and ϕC16 = 66 ± 17°.Because both tilt angle scenarios can describe the spectral data,it is likely that there is a broad distribution of tilt angles, aswould be the case in a liquid phase. This agrees with the shapeof spectra of Figure 2, which are clearly not representative of acrystalline-like film (which would have a negligible amount ofd+ signal, as found for the 1-dodecanol/water interface14). Thed+/r+ ratios and the tilt angle analysis thus both indicate a broaddistribution, which is in agreement with the interfacial layerbeing liquid-like. To further investigate the interaction of oiland alkanols, we vary the chain length of the alkanols andcompare their alkyl structures as well as the oil chain structureusing selective deuteration and make a comparison to the pureoil droplet/water interface.Chain Length Dependence. Figure 3A shows SFS spectra
of the C−H-stretch modes of different alkanols that are presentat the interfaces of d34-hexadecane droplets dispersed in D2Owith 1-dodecanol, 1-octanol, 1-hexanol, or 1-pentanol added toit. The spectra were recorded in the SSP polarizationcombination and normalized to the symmetric methyl stretchmode. Figure 3B shows the corresponding SF amplitudes,which were obtained by taking the square root of the integratedC−H spectra. The corresponding spectral changes for thehexadecane are shown in Figure 3C. These spectra wereobtained by using deuterated alkanols and recorded in the PPPpolarization combination. It can be seen that both the spectralshape and the intensity change with respect to pure n-hexadecane droplets in pure water (black line).Figure 3 shows that the spectral shape (A) and amplitude
(B) for 1-hexanol, 1-octanol, and 1-dodecanol are not changingmuch. Both results combined suggest that the interfacial densityof the three longest chain alkanols is constant and adding CH2pairs to the backbone of the alkyl chain does not contribute tothe SFS signal. The spectrum of 1-pentanol has a reducedamplitude but an identical shape, which indicates a reducedsurface coverage. In theory, it could also indicate an identicalsurface density but with a molecular orientation that is moreparallel to the interface. This explanation of the loweramplitude does not agree with the fact that 1-pentanol is themost hydrophilic of the alkanols studied here (see Figure 1).We have also tried to measure the 1-butanol spectrum but wewere not able to detect any SF signal in the C−H stretchregion. This agrees with earlier studies37,46 that have shown thatat least four carbon atoms are needed to render a moleculehydrophobic and SFS visible.Figure 3C shows that in contrast to the alkanols, the
hexadecane does have a different SF spectrum for each differentinterface. The spectrum of pure oil droplets in pure D2Ocontains spectral features that match with alkane chains that arepredominantly oriented along the interfacial plane and not withalkane chains that are perpendicularly oriented.43,44 Moleculardynamics simulations point to a similar conclusion.47 We seefrom Figure 3C that the shorter alkanols lead to a bigger changein the oil structure: The overall intensity increases, the d+/r+
ratio becomes bigger and more antisymmetric stretch modecharacter is observed in the spectra (which is why we chose to
plot the PPP polarization combination). Thus, it is likely thatfor a bigger mismatch in chain length more defects appear inthe alkane chains, which results in a larger overall number ofchain segments that are tilted toward the surface normal. Thatthe 1-dodecanol covered hexadecane droplets differ less fromthe pure oil spectra than the 1-hexanol covered dropletsindicates that the oil phase is shielded better by longer chainalkanols than by shorter chain alkanols as expected. Thisimplies that some part of the longer alkanol chains will have tofollow the more parallel structure of the oil chains.Having thus determined that the alkanols seem to form a
liquid-like layer on the surface of the oil droplets and that theyinduce structural changes in the oil phase, we now turn toestimating the surface density in a more precise way. To thisend, we use 1-hexanol, which is soluble in both water andhexadecane.
Concentration Dependence: Isotherm and WaterStructure. In order to determine the interfacial density of 1-hexanol, we collected SFS spectra of d34-hexadecane droplets inwater that were all prepared in the same emulsificationprocedure, and to which different amounts of aqueous 1-hexanol solution were added (following the proceduredescribed in ref 39). Using this procedure, the dropletconcentration and average radius remains constant.Figure 4 shows the amplitude of the total C−H stretch mode
signal of 1-hexanol that is adsorbed on the surface of d34-
hexadecane droplets (black squares) in water. The spectra fromwhich these points are derived were recorded in PPPpolarization (as the relative error is the smallest) and theydid not change much in spectral shape. Because of this, the SFamplitude can be considered proportional to the surface densityof adsorbed molecules (N), which can be described using theLangmuir adsorption equation, and Eisenthal’s modifiedLangmuir equation.48 Taking the maximum achievable surfacedensity as Nmax, we can then describe the amplitude as beingproportional to the ratio N/Nmax. If the maximum surface site
Figure 4. Isotherm of hexanol. (A) Amplitude of the C−H stretchmodes of 1-hexanol that is adsorbed on the surface of d34-hexadecanedroplets (R = 163 ± 24 nm). The SFS spectra were recorded in thePPP polarization combination and with a scattering angle of θ = 57°(measured in air). Two different fits are shown: a fit to the Langmuirequation (red) and a fit to the modified Langmuir equation (blue).48
The fit parameters are ΔG = −24.7 kJ/mol (Langmuir model, red)and ΔG = −26.3 kJ/mol; R = 139 nm; As = 30 Å2 (modified Langmuirmodel, blue). (B) contour plot of the squares of the differencebetween the modified Langmuir fit and the experiment data for R =139 nm. The white plus sign indicates the parameters of the blue curvein (A). The dashed line indicates the limiting surface area based on theincrease in SFS amplitude.
The Journal of Physical Chemistry C Article
DOI: 10.1021/acs.jpcc.5b04904J. Phys. Chem. C 2015, 119, 17725−17734
17728

concentration is much smaller than the total concentration of 1-hexanol (c) we can write
=+
=⊖−ΔN
NKc
c KcK e
( )with G R T
max
/ g
(1)
It should be noted that the unit of N and Nmax is mol/L, whichis to be interpreted as the number of molecules adsorbed onthe surface expressed per volume unit. K is the equilibriumconstant, Rg is the gas constant (Rg = 8.31 J/mol·K with asubscript g to distinguish it from the radius of the droplet R), Tis the temperature in K, ΔG is the free energy of surfaceadsorption in kJ/mol, and c⊖ is the molar concentration ofwater (55.5 mol/L). In this case, ΔG is the only fittingparameter. For the case that a significant number of 1-hexanolmolecules are depleted from the solution, we can useEisenthal’s modified Langmuir model. This model is expectedto be closer to reality since a 1 vol % solution of 163 nm radiusdroplets can accommodate ∼1.5 mM of 1-hexanol on itssurface, using a projected surface area per molecule of 20 Å2,which is close to the projected area of an alkanol molecule in apacked alkanol layer (18.7−21 Å2 49). We then use
= + + − + + −⊖ ⊖⎧
⎨⎪⎩⎪
⎛⎝⎜
⎞⎠⎟
⎫⎬⎪⎭⎪
NN N
c N cK
c N cK
cN12
4max max
max max
2
max
(2)
which uses the same parameters as eq 1. For this case, Nmax andΔG are both fitting parameters. Nmax can further be expressedas Nmax = (3ϕVtot10
−3)/(RNavAs) where ϕ is the volumefraction of oil droplets, Vtot is the total volume of the emulsion,and R is the average (hydrodynamic) droplet radius. We use R= 163 ± 24 nm, which is the range of values obtained fromDLS measurements. In the fitting procedure, we let R free tovary between 139 and 187 nm. Nav is Avogadro’s number (6.02× 10²³ mol−1) and As is the projected minimum surface area per1-hexanol molecule. Note that for both models, it is assumedthat the probability for adsorption or adsorption energy isindependent of the surface occupation or structure, that is, it isassumed to be an ideal gas. Figure 4A shows the obtained fitsfor both models. The fit values are ΔG = −24.7 kJ/mol(Langmuir model, red curve) and R = 139 nm, ΔG = −26.3 kJ/mol, and As = 30 Å2 (modified Langmuir model, blue curve).Figure 4B shows a contour plot of the square of the differencebetween the modified Langmuir fit (using R = 139 nm) and thedata points. The white plus sign indicates the parameters of theblue curve. It can be seen that there is a greater relativesensitivity to ΔG than to As. Nevertheless, the data does showthat it is reasonable to expect that the projected area per 1-hexanol molecule is in the range of 20−34 Å2, with ΔG valuesin the range of −25.6 > ΔG > −27.0 kJ/mol. In addition, therange of As can be narrowed down by noting that the SFSamplitude (and hence the surface density) cannot exceed themaximum amount that could be present on the surface for thelowest concentration (i.e., all hexanol molecules present in thesystem) multiplied by the relative amplitude increase (13.6) ingoing from the lowest (100 μM) to the highest concentration(20 mM). For the experimental average of R = 163 nm, wearrive at a lower limit of 24 Å2 for As, such that As = 29 ± 5 Å2.The projected areas agree qualitatively with the SFS spectrumof the alkyl chains of 1-hexanol, which shows a fairly orderedalkyl chain (d+/r+ = 0.7) that is also close to what is found withSFG studies on the planar interface of 1-hexanol liquid incontact with air,11,16 and temperature-dependent surface
tension measurements on the 1-hexanol/hexadecane/waterinterface50 that reported areas of 28−70 Å2 per moleculewith a ΔG value of −23.3 kJ/mol. In addition, the value foundfor ΔG is much larger than that found for the transfer of 1-hexanol from water to hexadecane which is −9.08 kJ/mol4.Also, based on Figure 3A,B, because the SF spectra for thealkanols are very similar in both shape and intensity, we canexpect that the surface densities of 1-octanol and 1-dodecanolare comparable.We thus see that the alkanols form liquid-like films on the
hexadecane droplet interface that influence the oil structure.Shorter alkanol chains lead to bigger changes in the oilstructure. Next, we determine if the water structure is alsoinfluenced by the alkanols. To investigate this, we use again 1-hexanol and probe the water structure with second harmonicscattering.51
Interfacial Water Alignment. The interfacial water aroundour nanoscopic droplets can be measured with secondharmonic31 scattering,27,32−34 a process that occurs only innoncentrosymmetric materials. As shown by Eisenthal and co-workers,31 the SH signal reports on the difference in dynamicorientational directionality of the water molecules in theinterfacial region compared to the orientational directionality inthe bulk solution.31,35−37 The reason for that is that for anonresonant process the signal depends quadratically on thenumber density of each component that is both dipolar andpresent in the noncentrosymmetric interfacial region. Becausewater has the largest hyperpolarizability (which also contributesquadratically) and because it greatly outnumbers the otherspecies, the SHS signal reports primarily on the waterorientation. Here, the change in directionality is induced onlyby interactions between the water and the 1-hexanol molecules.Charge effects can be excluded because all compounds areneutral. Indeed, the zeta potential of the droplets is verified tobe constant (ζ = −60 ± 6 mV). For a discussion about theorigin of the large electrokinetic mobility and our explanationas originating from charge transfer effects in water, we refer toref 52. Figure 5A displays the SHS intensity obtained at ascattering angle (θ) of 35° using the PPP polarizationcombination (i.e., all beams are polarized in the horizontalscattering plane), and around the angle of maximum intensity53
for emulsions containing different concentrations of 1-hexanol.The above derived projected average surface area for eachhexanol molecule is plotted on the top axis. The measuredintensity was corrected for hyper-Rayleigh scattering from thesame solution without droplets and then divided by the hyper-Rayleigh scattering intensity in PPP polarization of pure waterfor normalization purposes (following ref 54).It can be seen that the interfacial SHS intensity of
hexadecane droplets in water is approximately three times thevalue of the SHS signal of pure water. That means that inabsence of 1-hexanol orientational directionality of water isincreased by the presence of oil droplets. This oriented waterhas a small majority of H atoms pointing toward thesurface.23,55 Upon adding 1-hexanol to the emulsion, areduction of the directionality of water along the surfacenormal is observed. This reduction can be explained byadditional H-bonding interaction that occurs between thehydroxyl group of the added hexanol molecule and the water.The −CH2OH group is sticking into the water phase and onlyH-bonds with a water molecule that has its O atom pointingtoward the interfacial plane (see Figure 5B; note that thisillustration purely serves to highlight the changing directionality
The Journal of Physical Chemistry C Article
DOI: 10.1021/acs.jpcc.5b04904J. Phys. Chem. C 2015, 119, 17725−17734
17729

of H-bonding). When the concentration is increased and more1-hexanol molecules are present at the interface, a largernumber of water molecules will be reoriented, which meansthat the net orientational directionality of water molecules willbe reduced, thereby decreasing the SHS signal. Because one 1-hexanol molecule forms only one H-bond, there should be alinear relationship between the number of 1-hexanol moleculesthat are present at the interface and the reduction in thenumber of water molecules that contribute to the SHS signal. Ifthis is the case, we can use the outcome of the modifiedLangmuir model fitting of the SFS data in Figure 4A to fit thedata in Figure 5. N/Nmax should also represent the number ofwater molecules that have been reoriented by H-bonding. TheSHS intensity should then be described by a function of theform [A − B(N/Nmax)]
2 which, as can be seen from Figure 5A,is indeed the case. The parameters A and B have no physicalmeaning other than to represent the geometry of theexperiment. Thus, the SHS measurement of water and theSFS measurement of 1-hexanol are in good agreement witheach other.The Interfacial Structure. Here we will first discuss the
interfacial structure of the water/alkanol/hexadecane interfaceand then make a comparison to the alkanol/air and the water/alkanol/air interface.The alkanols studied in the oil droplet/water system form a
transition layer between a relatively ordered structure on thewater side of the interface, which is determined by the H-bonding network of water that allows only certain config-urations of the −OH groups to a relatively ordered structure ofmostly parallel oriented oil molecules, as present at the purehexadecane/water interface.43,44,47 The longer chain 1-dodec-anol forms liquid-like films with a fairly high degree of chainorder that is visible in the SFS spectra (d+/r+ < 1). Shorteningthe alkyl chain length, we observe that the SFS spectra for C6−C12 are identical in shape and amplitude. Thus, the surface
density for C6−C12 is comparable. In contrast, 1-pentanol ismuch less surface active and 1-butanol was not detected in theSFS experiments. We also see that the hexadecane alkyl chainsare strongly influenced by the alkanol monolayer. The oil alkylchains appear to intercalate with the alkanol alkyl chains, astheir SF spectra change when alkanols are added to theinterfacial region and they become more distorted in theirconformation by shorter alkanols than by the longer ones. SFSmeasurements and subsequent fitting with the modifiedLangmuir model on a concentration series of 1-hexanol showthat 1-hexanol films with a projected molecular area of 29 ± 5Å2 are formed. The corresponding free energy of adsorption isin the range of −25.7 > ΔG > −27.0 kJ/mol. SHSmeasurements that report on the directionality of interfacialwater show that the interfacial water restructures as well,whereby it is seen that the orientational directionality of theinterfacial water is reduced. The reduction of SHS signal isproportional to the formation of one H-bond per 1-hexanolmolecule.Starting at the water side, the H-bonding network and the
high chain density result in a large degree of order between theCnOH groups. Moving toward the oil phase the chance offorming a gauche defect increases.16 For 1-dodecanol, we seethat the distribution of orientational angles of the terminal CH3group with respect to the interfacial normal is broad and closeto a random distribution. For 1-dodecanol, the oil is alsominimally perturbed compared to the other shorter chainalkanols. This behavior can be explained by a structure thatconsists of alkyl chains of 1-dodecanol molecules that bendfrom a nearly perpendicular orientation (imposed by the water)into one that is more parallel (imposed by the oil), followingthe structure of the oil surface. The shorter alkyl chains will dothe same thing on the water side but are not long enough tomake a smooth transition to the more parallel oriented alkylchain orientation of the oil phase. Aided by thermalfluctuations, they will perturb the oil phase more (as seen inFigure 3). If the chains would not bend toward the interface butform structures of more perpendicular oriented chains, wewould not expect the result of Figure 3A,C. Namely unbentalkanols would distort the oil molecules independent of chainlength and would also have different d+/r+ ratios.25 Figure 6shows an illustration of possible structures that agree with theabove considerations. To arrive at this particular illustration, wehave taken into consideration that the end methyl groups aremost likely SF visible as they are thermally free to adopt any
Figure 5. Water alignment. (A) SHS intensities for hexadecanedroplets in water prepared with different amounts of 1-hexanol. ThePPP intensity was measured at the maximum scattering angle (θ =35°), corrected for hyper-Rayleigh scattering and normalized by thePPP signal of pure water. It can be seen that relative to a pure oildroplet/water interface the orientational directionality of water isreduced when more 1-hexanol is present at the interface. The blue linerepresents the function (A − B(N/Nmax))
2 with A = 1.79 and B = 0.83.The values used for (N/Nmax) originate from the fit of the data inFigure 4A. (B) Illustration of the effect of the hexanol headgroup onthe interfacial water structure. The zeta potential of all droplets is thesame, −60 ± 6 mV.
Figure 6. Illustration of possible surface structures of 1-hexanol (A)and 1-dodecanol (B) at the hexadecane droplet/water interface.
The Journal of Physical Chemistry C Article
DOI: 10.1021/acs.jpcc.5b04904J. Phys. Chem. C 2015, 119, 17725−17734
17730

conformations (which is clear from the analysis in Figure 2C).For the methylene groups, we consider that only the CH2groups that are neither even in number and orientedperpendicular to the interface nor parallel oriented to theinterface are SF active.A Comparison to the Alkanol/Water and Alkanol/Air
Interface. The water/dodecanol/air interface10,12−15 is char-acterized by alkyl chains with very few gauche−trans defects(reporting a d+/r+ ratio for 1-dodecanol of <0.1 for the solidphase and 0.3 for the liquid phase) and an almost perpendicularchain orientation with respect to the interface. Here, the layerconsists of a relatively tightly packed structure of alkyl chainswith projected areas of 21.5 Å2 per molecule in the solid phase(below 38.5 °C) and 23.8 Å2 (ref 14, ellipsometry and SFG) or25 Å2 (XRD, ref 6) for the liquid phase. The difference with theoil/water interface is the absence of a hydrophobic condensedphase that participates in dispersive interactions. In absence of aliquid oil phase, the dispersive attraction between the alkylchains results in a more tightly packed layer.SFG measurements in reflection mode from the C1OH−
C8OH/air interface showed that the alkanol alkyl chains have aswell a preferential orientation toward the air11,16 but with a verybroad orientational distribution, and a larger amount of gauchetrans disorder that increases with the chain length. For 1-hexanol/air, the reported d+/r+ ratio is approximately ∼0.6 andfor 1-octanol it is approximately 0.9. In this case, the H-bondinginteraction is different (namely between the alkanols only),which likely results in a different packing and thus differentchain conformations.The planar oil/water interface of hexadecane/1-hexanol/
water was studied with temperature-dependent surface tensionmeasurements.50 Fits with various models reported on aprojected surface area of 28−70 Å2. Anomalies in thetemperature dependence of the surface tension and the relativeinsensitivity of Gibbs free energies on chain length wereattributed to hexanol induced structural rearrangement of thewater at the interface.Alkanols with longer chain lengths (C20−C30) were studied
with X-ray diffraction on the hexane/water interface. A typicalprojected surface area of 23 Å2 was retrieved for these liquid-like layers. It was also found that disorder increases from theheadgroup downward and that for every five alkanol chainsthere is one intercalating hexane molecule. In addition there isalso some water in the top of the surface layer.49
Comparing our data to the above studies, we see that there isqualitative agreement: the changes in the water structurecorroborate the anomalies in the temperature-dependentsurface tension measurements, the projected surface areas andfree energy of adsorption are in the same range as the reportedXRD and surface tension measurements, and the amount ofalkyl chain disorder (as empirically reported on by the d+/r+
ratio’s) is in between that of liquid alkanols and “solid” alkanolsat the air/water interface. These differences are probably causedby the presence/absence of oil and water that provideconstraints on the possible geometries that can be adoptedby the alkanols. Compared to hexadecane droplets dispersed inwater and covered with charged surfactants of dodecyltrime-thylammonium bromide (DTAB) and sodium dodecyl sulfate(SDS),51 we find that there are clear differences in surfacedensity (which is much higher in the case of the neutralalkanols) and surface oil and surface water structure. While allsurfactants studied change in the water structure, they do sodifferently. The same is true for the oil phase. Thus, by
spectroscopically measuring the oil, the surfactant, and thewater on these nanoscopic droplets we see that the specificchemical interactions are highly relevant to the interfacialproperties rather than just the concept of geometrical packing.
■ CONCLUSIONS
We have obtained molecular level insight into the molecularstructural aspects of the transition from a hydrophobic to anaqueous phase, using a dispersion of ∼100 nm hexadecanedroplets in water that also contains 1-pentanol, 1-hexanol, 1-octanol, or 1-dodecanol. We examined the alkyl chainconformation of the alkanols and the oil, the surface densityof the alkanols and the structural changes imposed on the waterusing a combination of second harmonic and sum frequencyscattering. The hexadecane/1-dodecanol/water interface has achain conformation that represents that of a fluid layer with awide distribution of tilt angles of the terminal CH3 groups.Changing the chain length of the alkanol, the alkanol alkylchains adopt a conformation that generates indistinguishable SFspectra for pentanol to dodecanol, whereby the alkanols withchain length longer than 6 C atoms all form films withcomparable chain densities. In contrast, the alkyl chains of theoil phase are relatively more distorted with respect to the pureoil/water interface as the alkyl chain length of the alkanoldecreases. The surface density was determined more accuratelyby means of an SFS isotherm of 1-hexanol, which generated aprojected surface density of 29 ± 5 Å2 and a free energy ofadsorption of ΔG = −26.3 ± 0.7 kJ/mol. With increasing 1-hexanol density the interfacial water structure loses its initialorientational alignment in a way that matches with the addednumber of interfacial 1-hexanol molecules. The foundconformations differ significantly from that reported on thealkanol/water and alkanol/air interface, which can be explainedby the balance between dispersive and H-bonding interactions.
■ MATERIALS AND METHODS
Hexadecane (C16H34, 99.8%, Sigma-Aldrich), d34-hexadecane(C16D34, 98% d, Cambridge Isotope), 1-pentanol(CH3(CH2) 4OH, 99% , Ac ro s ) , 1 - pen t an -d 1 1 - o l(CD3(CD2)4OH, 98% d, Sigma-Aldrich), 1-hexanol(CH3(CH2)5OH, 99.5%, Sigma-Aldrich), 1-hexan-d13-ol(CD3(CD2)5OH, 98% d, Sigma-Aldrich), 1-octanol(CH3(CH2)7OH, 99%, Sigma-Aldrich), 1-octan-d17-ol(CD3(CD2)7OH, 98% d, Sigma-Aldrich), 1-dodecanol(CH3(CH2)11OH, 98%, Sigma-Aldrich), and 1-dodecan-d25-ol(CD3(CD2)11OH, 98% d, Sigma-Aldrich) were used asreceived. All aqueous solutions were made with ultrapurewater (H2O, Milli-Q UF plus, Millipore, Inc., electricalresistance of 18.2 MΩ cm; D2O 99.8% Armar, > 2 MΩ cm).Glassware was cleaned with a 1:3 H2O2/H2SO4 solution afterwhich it was thoroughly rinsed with ultrapure water (H2O,Milli-Q UF plus, Millipore, Inc., electrical resistance of 18.2MΩ cm).Dispersions of oil nanodroplets in water were prepared with
1 vol % (Figures 2 and 3) or 2 vol % (Figure 4) of n-hexadecane or d34-hexadecane in D2O for SFS and in H2O forSHS. The solutions were mixed with 5 mM alkanols for 4 minwith a hand-held homogenizer (TH, OMNI International) andsubsequently placed in an ultrasonic bath (35 kHz, 400 W,Bandelin) for the same duration. The resultant emulsions ofalkanols except hexanol were directly used for SFS. Aconcentration of 5 mM is used in the study of the interfacial
The Journal of Physical Chemistry C Article
DOI: 10.1021/acs.jpcc.5b04904J. Phys. Chem. C 2015, 119, 17725−17734
17731

structures of alkanols and oil (Figures 2 and 3). The resultantstock emulsion of hexanol was diluted to 1 vol % of hexadecanewith a solution of alkanol in water to yield the desired alkanolconcentration for SFS (0.1 vol % for SHS). For 1-hexanol aconcentration series ranging from 0.1 to 20 mM was used forthe isotherm study (Figures 4 and 5). The size distribution andzeta-potential of the nanodroplets were measured with dynamiclight scattering and electrokinetic mobility measurements(Malvern ZS nanosizer). The nanodroplets were consistentlyfound to have a mean hydrodynamic diameter in the range of220−300 nm with a polydispersity index (PDI) of less than 0.3.All samples were stable for at least several weeks. Allmeasurements were performed at 24 °C.Second harmonic scattering measurements were performed,
as previously described in detail,34 using 190 fs laser pulses witha 200 kHz repetition rate. The input laser beams were centeredat 1028 nm and polarized by a Glan-Taylor polarizer (GT10-B,Thorlabs). A zero-order half wave plate (WPH05M-1030) wasused to control the polarization of the input pulses. The inputpulses were then filtered (FEL0750, Thorlabs) and focused intoa cylindrical glass sample cell (4.2 mm inner diameter, highprecision cylindrical glass cuvettes, LS instruments) with a waistdiameter of ∼35 μm and a Rayleigh length of ∼0.94 mm. Theinput pulse energy at the sample was set 0.25 μJ (incident laserpower P = 50 mW). The scattered SH light was filtered(ET525/50, Chroma), polarized (GT10-A, Thorlabs), col-lected, collimated with a plano-convex lens ( f = 5 cm), andfinally focused into a gated PMT (H7421−40, Hamamatsu).The detection angle was set at 35° with an acceptance angle of11.4°. Data points were acquired with 20 × 1 s acquisition timeand a gate width of 10 ns. The plotted data points represent theSHS signal corrected for the background hyper-Rayleighscattering and normalized by the PPP signal of neat water
θ θθ
= ° − = °= °
I I
I
( 35 ) ( 35 )
( 35 )SHS,droplets,PPP HRS,solutions,PPP
HRS,water,PPP
The reproducibility of the SHS measurements is in the rangeof 1−2%.Vibrational SFS spectra were measured using the same SFS
setup as previously described in refs 56 and 57. Briefly,broadband IR laser pulses centered at 2900 cm−1 (fwhm = 120cm−1) and visible (vis) pulses at 800 nm (fwhm = 12 cm−1) at arepetition rate of 1 kHz were used as the input beams. Theinput laser beams were focused and overlapped under an angleof 15° (as measured in air) in a sample cuvette with a pathlength of 200 μm. The scattered SF light was collimated using aplano-convex lens ( f = 15 mm, Thorlabs LA1540-B) at ascattering angle of 57° (as measured in air) and passed throughtwo short-pass filters (third Millenium, 3RD770SP). The SFlight was spectrally dispersed with a monochromator (Acton,SpectraPro 2300i) and detected with an intensified charge-coupled device camera (Princeton Instruments, PI-Max3) usinga gate width of 10 ns. The acquisition time for a singlespectrum was set 150 s. A Glan-Taylor prism (Thorlabs, GT15-B), a half-wave plate (EKSMA, 460-4215), and a polarizingbeam splitter cube (CVI, PBS-800-050), and two BaF2 wire gridpolarizers (Thorlabs, WP25H-B) were used to control thepolarization of the SF, vis, and IR beams, respectively. The SFGspectrum obtained in the reflection geometry from a z-cutquartz crystal was used to normalize all the SFS spectra oftested samples. Concentration series were measured against areference sample that was inserted between every other
measurement to detect and correct for possible fluctuationsduring the course of the experiment. The d+/r+ and r+/r−
amplitude ratios were obtained from a global fitting applied tothe SFS spectra in which the weak nonresonant backgroundwas taken into account by using a measured SFS signal from anall-deuterated sample. This was done because the nonresonantbackground varied per sample and polarization direction. Moredetails can be found in the Supporting Information and in ref44.
■ ASSOCIATED CONTENT*S Supporting InformationMore details about the spectral fitting (S1) and thedetermination of the orientation of terminal methyl groups(S2). The Supporting Information is available free of charge onthe ACS Publications website at DOI: 10.1021/acs.jpcc.5b04904.
■ AUTHOR INFORMATIONCorresponding Author*E-mail: [email protected] authors declare no competing financial interest.
■ ACKNOWLEDGMENTSThis work is supported by the Julia Jacobi Foundation, theSwiss National Science Foundation (Grant 200021_140472),the European Research Council (Grant 240556).
■ REFERENCES(1) Pockels, A. Surface Tension. Nature 1891, 43, 437.(2) Langmuir, I. The Constitution and Fundamental Properties ofSolids and Liquids. II. Liquids. J. Am. Chem. Soc. 1917, 39, 1848−1906.(3) Harkins, W. D.; Davies, E. C. H.; Clark, G. L. The Orientation ofMolecules in the Surfaces of Liquids, the Energy Relations at Surfaces,Solubility, Adsorption, Emulsification, Molecular Association, and theEffect of Acids and Bases on Interfacial Tension. J. Am. Chem. Soc.1917, 39, 354−364.(4) Abraham, M. H.; Whiting, G. S.; Fuchs, R.; Chambers, E. J.Thermodynamics of Solute Transfer from Water to Hexadecane. J.Chem. Soc., Perkin Trans. 2 1990, 291−300.(5) Als-Nielsen, J.; McMorrow, D. Elements of Modern X-Ray Physics;Wiley & Sons: Hoboken, NJ, 2001.(6) Berge, B.; Konovalov, O.; Lajzerowicz, J.; Renault, A.; Rieu, J. P.;Vallade, M.; Alsnielsen, J.; Grubel, G.; Legrand, J. F. Melting of Short1-Alcohol Monolayers on Water - Thermodynamics and X-Ray-Scattering Studies. Phys. Rev. Lett. 1994, 73, 1652−1655.(7) Bain, C. D. Sum-Frequency Vibrational Spectroscopy of theSolid/Liquid Interface. J. Chem. Soc., Faraday Trans. 1995, 91, 1281−1296.(8) Richmond, G. L. Structure and Bonding of Molecules at AqueousSurfaces. Annu. Rev. Phys. Chem. 2001, 52, 357−389.(9) Roke, S. Nonlinear Optical Spectroscopy of Soft MatterInterfaces. ChemPhysChem 2009, 10, 1380−1388.(10) Sefler, G. A.; Du, Q.; Miranda, P. B.; Shen, Y. R. SurfaceCrystallization of Liquid n-Alkanes and Alcohol Monolayers Studiedby Surface Vibrational Spectroscopy. Chem. Phys. Lett. 1995, 235,347−354.(11) Lu, R.; Gan, W.; Wu, B.; Zhang, Z.; Guo, Y.; Wang, H. C-HStretching Vibrations of Methyl, Methylene and Methine Groups atthe Vapor/Alcohol (N=1−8) Interfaces. J. Phys. Chem. B 2005, 109,14118−14129.(12) Bell, G. R.; Bain, C. D.; Ward, R. N. Sum-Frequency VibrationalSpectroscopy of Soluble Surfactants at the Air/Water Interface. J.Chem. Soc., Faraday Trans. 1996, 92, 515−523.
The Journal of Physical Chemistry C Article
DOI: 10.1021/acs.jpcc.5b04904J. Phys. Chem. C 2015, 119, 17725−17734
17732

(13) Braun, R.; Casson, B. D.; Bain, C. D. A Sum-Frequency Study ofthe 2-Dimensional Phase-Transition in a Monolayer of Undecanol onWater. Chem. Phys. Lett. 1995, 245, 326−334.(14) Casson, B. D.; Braun, R.; Bain, C. D. Phase Transitions inMonolayers of Medium-Chain Alcohols on Water Studied by Sum-Frequency Spectroscopy and Ellipsometry. Faraday Discuss. 1996, 104,209−229.(15) Tyrode, E.; Johnson, C. M.; Kumpulainen, A.; Rutland, M. W.;Claesson, P. M. Hydration State of Nonionic Surfactant Monolayers atthe Liquid/Vapor Interface: Structure Determination by VibrationalSum Frequency Spectroscopy. J. Am. Chem. Soc. 2005, 127, 16848−16859.(16) Stanners, C. D.; Du, Q.; Chin, R. P.; Cremer, P.; Somorjai, G.A.; Shen, Y. R. Polar Ordering at the Liquid-Vapor Interface of n-Alcohols (C1-C8). Chem. Phys. Lett. 1995, 232, 407−413.(17) Knock, M. M.; Bell, G. R.; Hill, E. K.; Turner, H. J.; Bain, C. D.Sum-Frequency Spectroscopy of Surfactant Monolayers at the Oil-Water Interface. J. Phys. Chem. B 2003, 107, 10801−10814.(18) Delcerro, C.; Jameson, G. J. The Behavior of Pentane, Hexane,and Heptane on Water. J. Colloid Interface Sci. 1980, 78, 362−375.(19) Goebel, A. K.; Lunkenheimer, K. Interfacial Tension of theWater/n-Alkane Interface. Langmuir 1997, 13, 369−372.(20) Gragson, D. E.; McCarty, B. M.; Richmond, G. L. Ordering ofInterfacial Water Molecules at the Charged Air/Water InterfaceObserved by Vibrational Sum Frequency Generation. J. Am. Chem. Soc.1997, 119, 6144−6152.(21) Scatena, L. F.; Brown, M. G.; Richmond, G. L. Water atHydrophobic Surfaces: Weak Hydrogen Bonding and StrongOrientation Effects. Science 2001, 292, 908−912.(22) Brown, M.; Walker, D.; Raymond, E.; Richmond, G. VibrationalSum-Frequency Spectroscopy of Alkane/Water Interfaces: Experimentand Theoretical Simulation. J. Phys. Chem. B 2003, 107, 237−244.(23) Strazdaite, S.; Versluis, J.; Backus, E. H. G.; Bakker, H. J.Enhanced Ordering of Water at Hydrophobic Surfaces. J. Chem. Phys.2014, 140, 054711.(24) Guyot-Sionnest, P.; Hunt, J. H.; Shen, Y. R. Sum-FrequencyVibrational Spectroscopy of a Langmuir Film: Study of MolecularOrientation of a Two-Dimensional System. Phys. Rev. Lett. 1987, 59,1597−1600.(25) Esenturk, O.; Walker, R. A. Surface Vibrational Structure atAlkane Liquid/Vapor Interfaces. J. Chem. Phys. 2006, 125, 174701−174712.(26) Tyrode, E.; Hedberg, J. A Comparative Study of the CD andCH Stretching Spectral Regions of Typical Surfactants Systems UsingVSFS: Orientation Analysis of the Terminal CH3 and CD3 Groups. J.Phys. Chem. C 2012, 116, 1080−1091.(27) Wang, H.; Yan, E. C. Y.; Borguet, E.; Eisenthal, K. B. SecondHarmonic Generation from the Surface of Centrosymmetric Particlesin Bulk Solution. Chem. Phys. Lett. 1996, 259, 15−20.(28) Eisenthal, K. B. Second Harmonic Spectroscopy of AqueousNano- and Microparticle Interfaces. Chem. Rev. 2006, 106, 1462−1477.(29) Roke, S.; Gonella, G. Nonlinear Light Scattering andSpectroscopy of Particles and Droplets in Liquids. Annu. Rev. Phys.Chem. 2012, 63, 353−378.(30) Roke, S.; Roeterdink, W. G.; Wijnhoven, J. E. G. J.; Petukhov, A.V.; Kleyn, A. W.; Bonn, M. Vibrational Sum Frequency Scatteringfrom a Sub-Micron Suspension. Phys. Rev. Lett. 2003, 91, 258302−258302.(31) Ong, S.; Zhao, X.; Eisenthal, K. B. Polarization of WaterMolecules at a Charged Interface: Second Harmonic Studies of theSilica/Water Interface. Chem. Phys. Lett. 1992, 191, 327−335.(32) Yan, E. C. Y.; Liu, Y.; Eisenthal, K. B. New Method forDetermination of Surface Potential of Microscopic Particles by SecondHarmonic Generation. J. Phys. Chem. B 1998, 102, 6331−6336.(33) Schurer, B.; Hoffmann, M.; Wunderlich, S.; Harnau, L.; Peschel,U.; Ballauff, M.; Peukert, W. Second Harmonic Light Scattering fromSpherical Polyelectrolyte Brushes. J. Phys. Chem. C 2011, 115, 18302−18309.
(34) Gomopoulos, N.; Lutgebaucks, C.; Sun, Q.; Macias-Romero, C.;Roke, S. Label-Free Second Harmonic and Hyper Rayleigh Scatteringwith High Efficiency. Opt. Express 2013, 21, 815−821.(35) Petersen, P. B.; Saykally, R. J. Probing the Interfacial Structureof Aqueous Electrolytes with Femtosecond Second HarmonicGeneration Spectroscopy. J. Phys. Chem. B 2006, 110, 14060−14073.(36) Jena, K. C.; Covert, P. A.; Hore, D. K. The Effect of Salt on theWater Structure at a Charged Solid Surface: Differentiating Second-and Third-order Nonlinear Contributions. J. Phys. Chem. Lett. 2011, 2,1056−1061.(37) Scheu, R.; Chen, Y.; Subinya, M.; Roke, S. Stern LayerFormation Induced by Hydrophobic Interactions: A Molecular LevelStudy. J. Am. Chem. Soc. 2013, 135, 19330−19335.(38) de Beer, A. G. F.; Roke, S. Obtaining Molecular Orientationfrom Second Harmonic and Sum Frequency Scattering Experiments:Angular Distribution and Polarization Dependence. J. Chem. Phys.2010, 132, 234702−234708.(39) de Aguiar, H. B.; de Beer, A. G. F.; Strader, M. L.; Roke, S. TheInterfacial Tension of Nanoscopic Oil Droplets in Water Is HardlyAffected by SDS Surfactant. J. Am. Chem. Soc. 2010, 132, 2122−2123.(40) Wang, H. F.; Gan, W.; Lu, R.; Rao, Y.; Wu, B. H. QuantitativeSpectral and Orientational Analysis in Surface Sum FrequencyGeneration Vibrational Spectroscopy (SFG-VS). Int. Rev. Phys.Chem. 2005, 24, 191−256.(41) Ward, R. N.; Duffy, D. C.; Davies, P. B.; Bain, C. D. Sum-Frequency Spectroscopy of Surfactants Adsorbed at a Flat Hydro-phobic Surface. J. Phys. Chem. 1994, 98, 8536−8542.(42) Lambert, A. G.; Davies, P. B.; Neivandt, D. J. Implementing theTheory of Sum Frequency Generation Vibrational Spectroscopy: ATutorial Review. Appl. Spectrosc. Rev. 2005, 40, 103−144.(43) Vacha, R.; Roke, S. Sodium Dodecyl Sulfate at Water-Hydrophobic Interfaces: A Simulation Study. J. Phys. Chem. B 2012,116, 11936−11942.(44) de Aguiar, H. B.; Strader, M. L.; de Beer, A. G. F.; Roke, S.Surface Structure of SDS Surfactant and Oil at the Oil-in-WaterDroplet Liquid/Liquid Interface: A Manifestation of a Non-Equilibrium Surface State. J. Phys. Chem. B 2011, 115, 2970−2978.(45) Simpson, G. J.; Rowlen, K. L. An SHG Magic Angle:Dependence of Second Harmonic Generation Orientation Measure-ments on the Width of the Orientation Distribution. J. Am. Chem. Soc.1999, 121, 2635−2636.(46) Davis, J. G.; Gierszal, K. P.; Wang, P.; Ben-Amotz, D. WaterStructural Transformation at Molecular Hydrophobic Interfaces.Nature 2012, 491, 582−585.(47) Rivera, J. L.; McCabe, C.; Cummings, P. T. MolecularSimulations of Liquid-Liquid Interfacial Properties: Water−n-Alkaneand Water-Methanol−n-Alkane Systems. Phys. Rev. E: Stat. Phys.,Plasmas, Fluids, Relat. Interdiscip. Top. 2003, 67, 011603.(48) Wang, H. F.; Yan, E. C. Y.; Liu, Y.; Eisenthal, K. B. Energeticsand Population of Molecules at Microscopic Liquid and Solid Surfaces.J. Phys. Chem. B 1998, 102, 4446−4450.(49) Schlossman, M. L.; Tikhonov, A. M. Molecular Ordering andPhase Behavior of Surfactants at Water-Oil Interfaces as Probed by X-Ray Surface Scattering. Annu. Rev. Phys. Chem. 2008, 59, 153−177.(50) Caminati, G.; Senatra, D.; Gabrielli, G. 1-Hexanol and 1-Tetradecanol Adsorption at the Water Oil Interface. Langmuir 1991, 7,1969−1974.(51) Scheu, R.; Chen, Y.; de Aguiar, H. B.; Rankin, B. M.; Ben-Amotz, D.; Roke, S. Specific Ion Effects in Amphiphile Hydration andInterface Stabilization. J. Am. Chem. Soc. 2014, 136, 2040−2047.(52) Samson, J. S.; Scheu, R.; Smolentsev, N.; Rick, S. W.; Roke, S.Sum Frequency Spectroscopy of the Hydrophobic Nanodroplet/Water Interface: Absence of Hydroxyl Ion and Dangling OH BondSignatures. Chem. Phys. Lett. 2014, 615, 124−131.(53) de Beer, A. G. F.; Campen, R. K.; Roke, S. Separating SurfaceStructure and Surface Charge with Second-Harmonic and Sum-Frequency Scattering. Phys. Rev. B: Condens. Matter Mater. Phys. 2010,82, 235431−235431.
The Journal of Physical Chemistry C Article
DOI: 10.1021/acs.jpcc.5b04904J. Phys. Chem. C 2015, 119, 17725−17734
17733

(54) Schurer, B.; Wunderlich, S.; Sauerbeck, C.; Peschel, U.; Peukert,W. Probing Colloidal Interfaces by Angle-Resolved Second HarmonicLight Scattering. Phys. Rev. B: Condens. Matter Mater. Phys. 2010, 82,241404−241404.(55) Vacha, R.; Rick, S. W.; Jungwirth, P.; de Beer, A. G. F.; deAguiar, H. B.; Samson, J. S.; Roke, S. The Orientation and Charge ofWater at the Hydrophobic Oil Droplet-Water Interface. J. Am. Chem.Soc. 2011, 133, 10204−10210.(56) de Aguiar, H. B.; Scheu, R.; Jena, K. C.; de Beer, A. G. F.; Roke,S. Comparison of Scattering and Reflection SFG: A Question ofPhase-Matching. Phys. Chem. Chem. Phys. 2012, 14, 6826−6832.(57) de Aguiar, H. B.; Samson, J. S.; Roke, S. Probing NanoscopicDroplet Interfaces in Aqueous Solution with Vibrational Sum-Frequency Scattering: A Study of the Effects of Path Length, DropletDensity and Pulse Energy. Chem. Phys. Lett. 2011, 512, 76−80.
The Journal of Physical Chemistry C Article
DOI: 10.1021/acs.jpcc.5b04904J. Phys. Chem. C 2015, 119, 17725−17734
17734