from diffusion to tracts - helda
TRANSCRIPT
FROM DIFFUSION TO TRACTS
Viljami Sairanen
Department of PhysicsFaculty of Science
University of Helsinki
HUS Medical Imaging CenterUniversity of Helsinki andHelsinki University Hospital
ACADEMIC DISSERTATION
To be presented, with the permission of
the Faculty of Science of the University of Helsinki,
for public examination in Auditorium A110 Chemicum,
A.I. Virtasen aukio 1, Helsinki,
on Friday April 13th, 2018, at 12 o’clock noon.
UNIVERSITY OF HELSINKIFINLAND

Supervisors
Professor Sauli Savolainen, Ph.D.Department of PhysicsFaculty of ScienceUniversity of HelsinkiHelsinki, Finland
Professor Sampsa Vanhatalo, Ph.D.Department of Clinical NeurophysiologyFaculty of MedicineUniversity of HelsinkiHelsinki, Finland
Preliminary examiners
Adjunct Professor Juha Nikkinen, Ph.D.Department of Oncology and RadiotherapyOulu University HospitalOulu, Finland
Research Scientist Kerstin Pannek, Ph.D.The Australian E-Health Research CentreCSIROBrisbane, Australia
Opponent
Cover art
Diffusion of dye particles in water forms a model of human brain white matter structures. Ascientific illustration by Pentti Sairanen, Mirador Studios.
ISBN 978-951-51-4130-9 (paperback)ISBN 978-951-51-4131-6 (PDF)http://ethesis.helsinki.fi
Unigrafia OyHelsinki 2018
Professor Miika Nieminen, Ph.D.Research Unit of Medical ImagingPhysics and TechnologyUniversity on OuluOulu, Finland

“The Guide is definite. Reality is frequently inaccurate.”
The Hitchhiker’s Guide to the Galaxy by Douglas Adams


V. Sairanen: From Diffusion to Tracts, University of Helsinki, 2018, 50 pages.
Abstract
Diffusion of water molecules within the brain tissue can be used to modulate the nuclearmagnetic resonance signal that is used to form magnetic resonance images (MRI). As thesignal itself can be noisy and its meaning challenging to interpret, mathematical models aregenerally fitted to these measurements to obtain the more accurate characterization of thebrain microstructure. This, of course, requires that the mathematical model itself is sound inrespect to the measurement setup. This dissertation focuses on the extensively used tensormodels as they have been shown to unravel details of the physical diffusion phenomena alongwith various applications in the basic neuroscience, the clinical research, and even in theneurosurgery.
One of the greatest challenges in the diffusion weighted MRI measurements is subject motionduring the image acquisition as that can cause a complete loss of the measurement which isespecially highlighted in ill or uncooperative patients studies. Due to the used acquisitiontechnique, this loss extends to multiple measurements simultaneously resulting in an enormousgap in the sampling. Such gaps can be problematic for any model fitting, even for the currentlyavailable robust means developed to exclude outlier measurements from affecting the estimate.Hence in this dissertation, a tool coined as SOLID was developed to detect these outliers and torobustly process them during the tensor based model estimation. SOLID was implemented as apart of the widely used ExploreDTI toolbox to allow the rapid international distribution of thetool.
Unfortunately, any reduction in the measurement sampling will lead to increasing error propa-gation during the model estimation. Mathematically this is detailed in terms of a conditionnumber for the matrix inversion in the linear least squares fitting. Previously, the conditionnumber has been used to optimize the diffusion weighted MRI acquisition gradient scheme butin this dissertation it was renovated into a novel quality control tool. The condition number ofthe matrix inversion that provides the model estimate can be calculated after the outliers areexcluded to assess spatially and directionally varying error propagation to obviate any bias insubject or population studies.
To motivate the importance of the robust methods and diffusion weighted MRI at large, neu-rocognitive studies with neonates’ visual abilities and bilinguals’ acquisition age of the secondlanguage were conducted as a part of this thesis. The findings in these studies indicatedthat premature birth affects the white matter structures across the brain whereas the age ofacquisition of the second language affects only the speech related brain structures.
Keywords: Magnetic resonance imaging, diffusion, tensor, subject motion, robust estimation,neurocognitive correlations.
i

Preface
The support from the doctoral school MATRENA of the University of Helsinki and the HUSMedical Imaging Center of the Helsinki University Hospital allowed me to accomplish thisdissertation during the years from 2014 to 2018. Additional financial support for the project hasbeen received from Sigrid Jusélius Foundation, the Academy of Finland, and Finnish CulturalFoundation.
I express my sincere gratitude to my supervisors. To Professor Sauli Savolainen for alwayssupporting my ambitions in research and in practical Medical Physicist training during thepast six years. To Professor Sampsa Vanhatalo for the equal support in research and arrangingthe financial support that allowed me to escape the previously mentioned practical training.The most influential of these flights was my three month visit to the University Medical CenterUtrecht in 2016 where Professor Alexander Leemans warmly welcomed me to his PROVIDILab. It has been a privilege not to just work for these fine scientists but with them.
I thank Adjunct Professor Juha Nikkinen and Ph.D. Kerstin Pannek for their valuable andheartening feedback during the preliminary examination of this thesis. I am grateful to ProfessorMiika Nieminen for accepting the invitation to be the opponent in the public defense of thisdissertation.
This thesis was not a one-man job. My enthusiasm towards diffusion weighted MRI was initiallysparked by a curious lab assignment in 2013 from a colleague, a friend, and a co-author M.Sc.Linda Kuusela. Her support during this dissertation has been invaluable. Adjunct ProfessorOuti Sipilä deserves thanks for being an inspiring co-author and introducing the MRI to me inthe first place. I would like to thank co-authors M.A. (Psych.) Susanna Stjerna and M.A. (Psych.)Sini Hämäläinen for the illuminating discussions on- and off-topic of this thesis. Finally, thekindest thanks go to a co-author, a mentor, and “the naive reviewer” Ph.D. Chantal Tax for hervaluable feedback and never-ending ideas.
To my colleagues, family, and friends - as I am immensely fond of you all - I find no betterwords to end this preface and to describe my thoughts than a quote from a dear childhoodhero: “I don’t know half of you half as well as I should like; and I like less than half of you half as
well as you deserve.”1
1Bilbo Baggins, The Fellowship of the Ring by J.R.R. Tolkien
ii

List of original articles
This thesis entails four original studies and their summary. Studies are referred with Romannumerals I-IV throughout the document. Studies II and IV are reprinted with the permissionfrom Elsevier and Study III under the CC-BY 4.0 license.
I Sairanen V, Leemans A, Tax C M W: Fast and accurate Slicewise OutLIer Detec-tion (SOLID) with informed model estimation framework for diffusion MRI data.Submitted.
II Sairanen V, Kuusela L, Sipilä O, Savolainen S, & Vanhatalo S (2017): A novel measureof reliability in Diffusion Tensor Imaging after data rejections due to subject motion.NeuroImage, 147, 57-65.
III Stjerna S, Sairanen V, Gröhn R, Andersson S, Metsäranta M, Lano A, & Vanhat-alo S (2015): Visual fixation in human newborns correlates with extensive whitematter networks and predicts long-term neurocognitive development. Journal ofNeuroscience, 35(12), 4824-4829.
IV Hämäläinen S, Sairanen V, LeminenA, & LehtonenM (2017): Bilingualismmodulatesthe white matter structure of language-related pathways. NeuroImage, 152, 249-257.
Author’s contribution
For Study I, the author surveyed the previously published algorithms, developed the methods,performed all simulations and experiments with subject data and drafted the manuscript.For Study II, the author designed the study, revised the theory, performed all simulationsand experiments with subject data and drafted the manuscript. For Study III, the author diddiffusion MRI data processing and developed the statistical methods used in the analysis ofthe diffusion MRI data and test results for newborns’ visual abilities, participated in writingthe manuscript and result visualization. For Study IV, the author designed the diffusion MRIacquisition scheme, processed the diffusion MRI data and participated in analyzing the resultsand writing the manuscript. The results of these studies have not been used in previous PhDstudies.
iii

Abbreviations
AD Axial Diffusivity
ADC Apparent Diffusion Coefficient
AUC Area Under Curve
CN Condition Number
CPU Central Processing Unit
DWI Diffusion Weighted Image
EK Excess Kurtosis
EP Electrical Potential
EPI Echo Planar Imaging
FA Fractional Anisotropy
FE The direction of the First Eigenvector of diffusion tensor
GB Gaze Behaviour
GIB Gradual Intensity Band
IFOF Inferior Fronto-Occipital Fasciculus
IQR Interquartile Range
IWLLS Iteratively Re-Weighted Linear Least Squares
KA Kurtosis Anisotropy
L2 Second Language
LLS Linear Least Squares
MAD Median Absolute Deviation
MD Mean Diffusivity
MK Mean Kurtosis
MRI Magnetic Resonance Imaging
NC Normalized Cross-correlation
PRC Precision-Recall Curve
RD Radial Diffusivity
ROC Receiver Operating Characteristic
ROI Region Of Interest
SNR Signal-to-Noise Ratio
TBSS Tract-Based Spatial Statistics
V1 See FE
VF Visual Fixation
iv
Contents
1 Introduction 1
2 Aim of the study 4
3 From Diffusion to Tracts 53.1 Slicewise OutLIer Detection (SOLID) . . . . . . . . . . . . . . . . . . . . . . . 53.2 Error propagation in the linear least squares estimation . . . . . . . . . . . . . 113.3 Neurocognitive correlations of tensor derived measures . . . . . . . . . . . . . 14
4 Results 184.1 SOLID . . . . . . . . . . . . . . . . . . . . . . . . . . . . . . . . . . . . . . . . 184.2 Error propagation in the least squares estimation . . . . . . . . . . . . . . . . 254.3 Neurocognitive correlations of tensor derived measures . . . . . . . . . . . . . 28
5 Discussion 305.1 SOLID . . . . . . . . . . . . . . . . . . . . . . . . . . . . . . . . . . . . . . . . 305.2 Error propagation in the least squares estimation . . . . . . . . . . . . . . . . 335.3 Neurocognitive correlations of tensor derived measures . . . . . . . . . . . . . 345.4 Future aspects . . . . . . . . . . . . . . . . . . . . . . . . . . . . . . . . . . . . 35
6 Conclusion 37
References 38
v


1 Introduction
Diffusion weighting augments magnetic resonance imaging (MRI) with sensitivity toward themotion of water molecules which has been shown to be advantageous for the microstructuralinvestigation of the living brain [1–5]. This fascinating ability to explore the molecular motionprovides information beyond any normal structural MRI and numerous studies since the initialpublication of the technique have utilized it to decipher the white matter connectivities [6–12], structural differences due to language learning [13–20] or premature birth [21–26] andaging of the brain [27–32]. In addition, diffusion weighted MRI has provided powerful clinicalapplications [33, 34] to detail brain injuries, diseases, and disorders [35–41]. However, to obtainsuch reliable and sound findings from diffusion weighted MRI data, several aspects of the MRIacquisition, physical diffusion phenomenon, and practical limitations must be first familiarized.
An image acquired using a MRI scanner consists of small three-dimensional volume elementscalled ’voxels’. The position relative to the scanned subject and the size of this voxel arecontrolled with spatial gradient fields. To obtain the sensitivity toward the motion of watermolecules, two additional carefully timed diffusion gradient fields are also required [42–45].The first diffusion gradient dephases the spins of the target nuclei e.g. protons within hydrogenatoms. After a specific diffusion time, a reverse diffusion gradient is applied to rephase thespins [46–50]. If atoms in water molecules have remained stationary relative to the voxelduring this process, only spin-to-spin relaxation effects are observed resulting in a small signaldecrease [51]. However, if a notable motion in the direction of these diffusion gradient fieldsoccurs, the signal will suffer much larger decay depending on the amplitude and duration ofthe gradient fields and diffusion time which can be summarized with a diffusion weight factorknown as the b-value [52]. Information about pathways that water can effortlessly move alongto or microstructures that restrict motion and thus the diffusion process can be studied in detailby applying these gradient fields in multiple directions [2–5, 53–59].
The diffusion itself is a random phenomenon occurring due to the thermal energy bound in themolecules [60, 61]. The expected displacements of molecules follow a Gaussian distributionin the case of free diffusion which is likely in the brain ventricles, for example. However, intightly packed brain structures such as white matter, the diffusion can be highly restrictedin many directions and the expected molecular displacements could become non-Gaussian[62, 63]. This explains why a more detailed characterization of the underlying diffusionphenomenon can be obtained by using multiple b-values; if the diffusion is highly restrictedin some direction the signal in that direction will not decay due to diffusion even after a longdiffusion time. It should be noted that also other effects such as perfusion or molecular motiondue to concentration differences can confound these measurements [64, 65]. Regardless howinteresting further theoretical underpinnings would be, they largely stand outside the mainscope of this dissertation and as such are omitted. For a more complete and detailed descriptionsof nuclear magnetic resonance, MRI, and diffusion weighting the reader is advised to study the
1
works of Callaghan, Liang, Slichter, Jones, or Hecke [51, 52, 66–68] and the work of Berg [69]for diffusion in biology. For the remainder of this thesis, it is enough to appreciate that therandom motion of water molecules results in a measurable signal decay in diffusion weightedimages (DWI). Thus, acquiring multiple DWIs with diffusion gradients in different orientationsand b-values it is possible to uncover the underlying tissue microstructure [2–5, 57–59].
The DWI intensity, however, is affected by various errors [70–72] arising from technical sourcessuch as noise [73–77], signal drift [78], bandwidth limitations [51, 79, 80], eddy current [81–84]and susceptibility distortions [85–88] and physiological sources e.g. subject motion [89–94]and cardiac pulsation [95]. Thus, unlike the commonly used T1 or T2 weighted images [51],deducting causalities directly fromDWIs would range from challenging to altogether impossibleand a prior knowledge of the tissue of interest is required to form a sound mathematical modelthat holds the explicable characteristics of the tissue such as the direction of the fiber population.The most used methods of modelling the brain microstructure are the voxelwise diffusionand kurtosis tensors [3, 62, 63, 96–106] but other models with a higher number of degreesof freedom have also been suggested in order to elucidate voxels affected by partial volumeeffects [107] such as crossing white matter fiber populations [108–117]. Modelling also addsyet another layer of uncertainty to the analysis, as noise or any other artefacts in the rawmeasurements will propagate to the model, depending on both the mathematical properties ofthe model and how the data was acquired [118, 119].
The two most undesirable errors that affect the diffusion MRI are scanner hardware relatedissues and the subject motion as they can potentially lead to geometrical or intensity errorsin the measured DWIs [70, 72, 120]. Even with the recent technological advancements, suchas the simultaneous acquisition of multiple slices [121–123], the total acquisition time of adiffusion MRI study can surpass ten minutes. For an unanaesthetised human, especially foruncooperative patients, this is a long time to stay completely still. Any drastic motion of thetarget nuclei can lead to the different spatial placement of measured signals between DWIs or,if occurring during the acquisition of a DWI, motion can affect the dephasing and rephasingcycle. The former means that the signal in the same voxel of two different DWIs might notoriginate from the same region or could be affected by a different degree of partial voluming[107] and thus the intensity of these voxels in different DWIs might not fully relate to eachother and impede the model estimation. The latter is the reason for outlier measurements.While geometrical image distortions and misalignments between subsequent DWIs can beamended using image registration algorithms [84, 89, 90, 93, 94, 124, 125], a more tediousproblem of inaccuracy in the signal intensity due to the imperfect spin manipulation with thediffusion gradients cannot be corrected and the outliers will remain in the data.
Erroneous diffusion MRI measurements will affect any model estimation and multiple attemptshave been made to improve simple least squares model estimators [3, 97, 126] with robust means[127–132] or with the ability to detect and exclude outliers based on the model residual values[133–136]. Maximum likelihood estimators that consider the true Rician noise distributionof DWIs have also been suggested [73, 75, 76, 137–141], however, the widespread usage ofmaximum likelihood methods has been restricted by the long computational times. As DWIsare typically acquired with a fast slicewise echo planar imaging (EPI) techniques [87, 142–146],subject motion related artefacts obfuscate all voxels within the slice simultaneously and this
2

could be utilized in the outlier detection as well [147–154]. Regardless of these previous studies,in this dissertation a need for an improvement in slicewise outlier detection and robust modelestimation was established, especially for neonatal studies as newborns tend to move moreduring the acquisition. The tool was coined as SOLID (Slicewise OutLIer Detection) and isdistributed as a part of ExploreDTI toolbox [155].
The subject motion could also affect the direction in which the diffusion was measured i.e.diffusion gradient vectors. Since the early days of diffusion MRI, an immense effort has beenput into optimizing the best acquisition directions i.e. the design matrix or b-matrix [156] fordifferent applications and models [118, 157–168]. However, the fact that subject motion canpotentially eradicate this optimization was largely neglected as it was assumed that it would beenough simply to apply the rotations from DWI corrections on the diffusion gradient vectors[93]. Such post-acquisition corrections, however, cannot solve the issue that if the originalgradient vectors were optimized by uniformly sampling points on a spherical surface, whena subject rotate their head the measurements are no longer sampled uniformly. Especially,if motion results in intensity artefacts which are excluded as outlier measurements and allinformation about diffusion in that direction is lost resulting in a gap in the sampling. Thiscould cause a serious bias between subjects in population studies or even spatial differenceswithin a single subject, hence a quality control tool for assessing these biases was developedduring this dissertation. The method is based on a mathematical property of the least squaresproblem design matrix called ’condition number’ (CN) which defines the upper boundary forthe error propagation during the model estimation. While the condition number was originallyused to optimize the gradient directions [118, 161], it had not been utilized previously to dataquality assessment after all corrections and robust estimation were made.
To highlight the enthusiasm towards the robust diffusion MRI data processing, an extensiveset of experiments has been conducted ranging from the theoretical aspects of acquisition[81, 118, 157, 159–163, 169], to processing [82, 83, 85, 87, 89, 90, 125, 147, 152, 153, 155, 170–174], analyzing and modelling [91, 175–190], visualizing the measurements [22, 24, 25, 57,101, 102, 191–195], and performing quality control [120, 147, 151, 152, 155, 196, 197] denotingthat diffusion MRI, as a technique, is far from complete and opening the possibility to re-investigate previous studies with the new methods or to conduct the entirely new sets ofpractical experiments.
This thesis presents novel additions to three parts of the complex diffusion MRI analysis: firstlyto slicewise outlier detection, secondly to the quality control of the final model estimate, andlastly to the statistical analysis. In Study I, SOLID framework was developed to disclose outliersoccurring due to subject motion or hardware issues as the uncertainty of measurements toguide a robust model estimation. To further evaluate the reliability of the processed diffusionMRI measurements, a quality control method was constructed around the rotational variantcondition number in Study II. Both methods were evaluated with comprehensive simulationsand validated with newborn and adult human data. Finally, two practical Studies III and IV onneurocognitive correlations between the white matter structures and the visual fixation (VF) ofthe newborns and the age of acquisition of the second language (L2) of adults motivate howthe methods from Studies I and II could practically push forward research in the wide field ofneuroscience.
3

2 Aim of the study
The aim of this dissertation was to deploy advanced diffusion MRI acquisition protocols andimprove their analyses methods including visualization in order to help clinical research atHelsinki University Hospital. However, during the work, the insufficient means or even a totalabsence of quality control tools for diffusion MRI data was noted and the aim of the thesiswas shifted towards the development of robust preprocessing methods including tools forevaluating the comparability and quality of the final results. Thus, the studies were designedto:
1. Develop a fast and accurate method for disclosing artefactual data and a framework tohandle outliers properly during model estimation;
2. Generate a quality control tool that can be used to investigate error propagation in avoxelwise manner in both individual and population experiments;
3. Apply the robust diffusion MRI analysis on newborn and adult human data along withthe statistical analysis and visualizations of the results.
4

3 From Diffusion to Tracts
The chapter is divided into three sections, the first two summarizing Studies I and II and thethird combining neurocognitive Studies III and IV. The sections begin with the theoreticalbackground of the problem and continue through the improvements and investigations con-ducted on the theory and end in descriptions of the methodological aspects in each study.Experiments involving patients or healthy volunteers (57 neonates and 34 adults in total) wereapproved by the relevant ethics committees detailed in Studies I-IV respectively.
3.1 Slicewise OutLIer Detection (SOLID)
As diffusion weighted MRI is typically acquired using EPI sequences [143, 145, 146], data isgathered in a slicewise manner. Consequently, any error occurring during the acquisition,whether due to a moving subject [89–94] or sub-optimal hardware functionality, will likelycorrupt a whole slice. Furthermore, any errors in the measured signal intensities will propagateinto errors in the estimated models [118] and they should be controlled to avoid unnecessarybias in the further analyses. However, this cannot be achieved by simply detecting outliersduring the voxelwise modelling [133, 134, 136, 148] as the intensity errors could becomeinterpolated with neighbouring data points during the subject motion correction which is usedto ensure the geometrical comparability of acquired images [84, 89, 90, 125]. For example, anaxially acquired slice with a signal intensity artefact that is rotated along anterior-posterior(nod) or left-right (tilt) will form a gradual intensity band (GIB) in the corrected image space, asshown in Study I, and the edge of GIB could be problematic for any voxelwise robust estimatoras only a part of the signal is corrupted.
3.1.1 Theoretical aspects of outlier detection and handling
Statistical outlier detection is usually based on some assumption on the distribution of theobservations or measurements [198]. If observations Y are drawn from a normal distributionN (μ, σ2) , where μ is the mean and σ is the standard deviation, an observation several σdistances to the mean could be considered an outlier. This was translated into a practicalslicewise outlier detection method for diffusion MRI in Study I by defining an observation asa slice k and DWI l specific intensity metric yk,l. For example, the variance of all brain voxelintensities in one slice of a DWI would give one observed yk,l value. By assuming that theslicewise intensity metric across DWIs follows a normal distribution, it is possible to calculatethe slicewise Z-score zk,l (eq. I.1) to determine if observation yk,l is an outlier. As this normalityassumption is likely violated due to outliers skewing the distribution and likely masking milderoutliers, the implementation of the modified Z-score [198] ζk,l (eq. 3.1) was chosen instead
5

of the normal Z-score. In the modified Z-score, the sample mean y and the sample standarddeviation s are replaced with the sample median y and the median absolute deviation (MAD)[130]:
ζk,l =yk,l − ykMADk
. (3.1)
While the simplest approach would be to reject observations with large ζk,l, this could leadrapidly to a missing data problem and thus interpreting ζk,l as an estimate for the measurementcertainty was chosen instead. A schematic overview of this is shown in Figure 3.1. Intensityvariance was chosen as the slicewise intensity metric yk,l for it is fast and easy to computeand provided a good capability to disclose outliers. As ζk,l are also slice and DWI specificmeasures, they can be used to fill a 3D volumes ξl (l = 1, ..., N where N is the number ofmeasured DWIs) so that all voxels x in each slice and DWI have the same value. After thesubject motion, eddy current and other geometrical misalignments and distortions are correctedfor [84, 89, 90, 93, 94, 125] and DWI volume specific transformations T l are obtained from theregistrations, they are onward applied on these volumes ξl to obtain the interpolated modifiedZ-scores in the corrected image space i.e. ξ
′l
(x
′)= ξl (T l (x)) . Voxelwise ξ
′l
(x
′)values can
now be linearly scaled to SOLID weights Sl
(x
′)between 0 (outlier) and 1 (normal data) using
lower and upper thresholds tL and tU (eq. 3.2)
Sl
(x
′)=
⎧⎪⎪⎨⎪⎪⎩0 , if ξ
′l
(x
′)> tU
ξ′l
(x′)−tU
tL−tU , if tL ≤ ξ′l
(x
′) ≤ tU
1 , if ξ′l
(x
′)< tL
. (3.2)
As DWIs are acquired in multiple orientations to capture the diffusion phenomenon within thetissue, it is presumable that intensity metric across DWIs with the same slice position variesaccordingly even in a hypothetical situation of infinite signal to noise ratio (SNR). A lowerthreshold tL = 3.5 can be used to account for this normal variation of the observations and anupper threshold of tU = 10 to prevent extreme outliers from saturating the downweightingframework. A clear benefit in such slicewise outlier detection is that it does not depend onthe estimated model as previously used M-estimators such as the Geman-McClure algorithms[129, 130, 173] do and potentially has more statistical power to disclose the outliers thanvoxelwise approaches [133, 134, 136]. The linear relation in eq. 3.2 could be replaced with asigmoid function for a more natural change between normal to outlier data but that would alsorequire adjusting the lower and upper thresholds differently.
3.1.2 Theory behind SOLID-informed tensor estimator
SOLID weights can inform a generally used estimation method that models the voxelwise diffu-sion weighted signal s
(x
′: b, g
):= s (b, g) based on the symmetric diffusion
6

Figure 3.1: Proposed framework for slicewise outlier detection and handling. A) Intensity
histograms show examples of typical DWI slices: normal (top), signal decrease (middle), and
signal increase (bottom). B) Slice k and DWI l specific metric yk,l is calculated from all voxels
x. C) The modified Z-score ζk,l is obtained with the help of the slicewise median yk and the
median absolute deviation MADk. Thresholding of the ζk,l shows immediately that most
of the slices are below normal variation threshold (3.5) whereas some are clearly outliers
with ζk,l > 10. D) The geometrical transformations T l of DWIs are obtained during the
correction of geometrical distortions. Due to the rotation of the artefactual DWI, the axial
slice with signal decrease is distributed over multiple axial slices forming a gradual intensity
band in the corrected image space. Slice orientation is indicated with the red dashed line for
reference. E1) T l are used to calculate the voxelwise interpolated modified Z-scores ξ′l
(x
′)
which are E2) linearly scaled to SOLID weights Sl
(x
′)and used as data certainty estimates
in E3) the tensor model estimation.
7

D = {Dij : i, j = 1, . . . 3} and kurtosis K = {Kijkl : i, j, k, l = 1, . . . , 3} tensors [3, 62,63, 96–106] as function of a q-space shell [66] i.e the gradient direction g = {gi : i = 1, . . . , 3}and its strength b:
s (b, g) = s (0,0) · exp(−b
3∑i,j=1
gigjDij + · · ·
. . .b2
6
(3∑
i=1
Dii
3
)2 3∑i,j,k,l=1
gigjgkglKijkl
⎞⎠+ ε (3.3)
where ε is the error term independent of the gradient direction or strength. The relation betweendiffusion weighted signal s (b, g) is thus represented with an approximately exponential decayof the non-diffusion weighted signal s (0,0) i.e. b0-image which has been shown to correlatewell with in vivo measured signal decay for b-values below 3000s/mm2 [68, p. 411]. This can beexpressed more conveniently as
s (b, g) = exp (Xβ) + ε (3.4)
withX being the N × 22 design or encoding matrix (eq. 3.5) [156, 162] whose rows Xl=1...N
describe the relations for each diffusion gradient direction and its strength for eachmeasurement
Xl :=(1, blg
2l1, 2blgl1gl2, 2blgl1gl3, blg
2l2, 2blgl2gl3, blg
2l3, · · ·
· · · 154b2l g
4l1,
154b2l g
4l2,
154b2l g
4l3,
454b2l g
3l1gl2,
454b2l g
3l1gl3,
454b2l g
3l2gl1, · · ·
· · · 454b2l g
3l2gl3,
454b2l g
3l3gl1,
454b2l g
3l3gl2,
654b2l g
2l1g
2l2,
654b2l g
2l1g
2l3, · · · (3.5)
· · · 654b2l g
2l2g
2l3,
1254b2l g
2l1gl2gl3,
1254b2l g
2l2gl1gl3,
1254b2l g
2l3gl1gl2
),
β is the unknown 22× 1 vector of the natural logarithm of noiseless non-diffusion weighteds (0,0) signal and tensor elements to be estimated:
β :=(ln (s (0,0)) , D11, D12, D13, D22, D23, D33, · · ·
· · · cW1111, cW2222, cW3333, cW1112, cW1113, cW2221, · · ·· · · cW2223, cW3331, cW3332, cW1122, cW1133, · · · (3.6)
· · · cW2233, cW1123, cW2213, cW3312
)T,
and c being the square of the trace of the diffusion tensor c = tr (D)2 =(∑3
i=1 Dii
)2. Thus,
a solution for the diffusion tensor from eq. 3.4 requires measuring at least six DWIs with
8
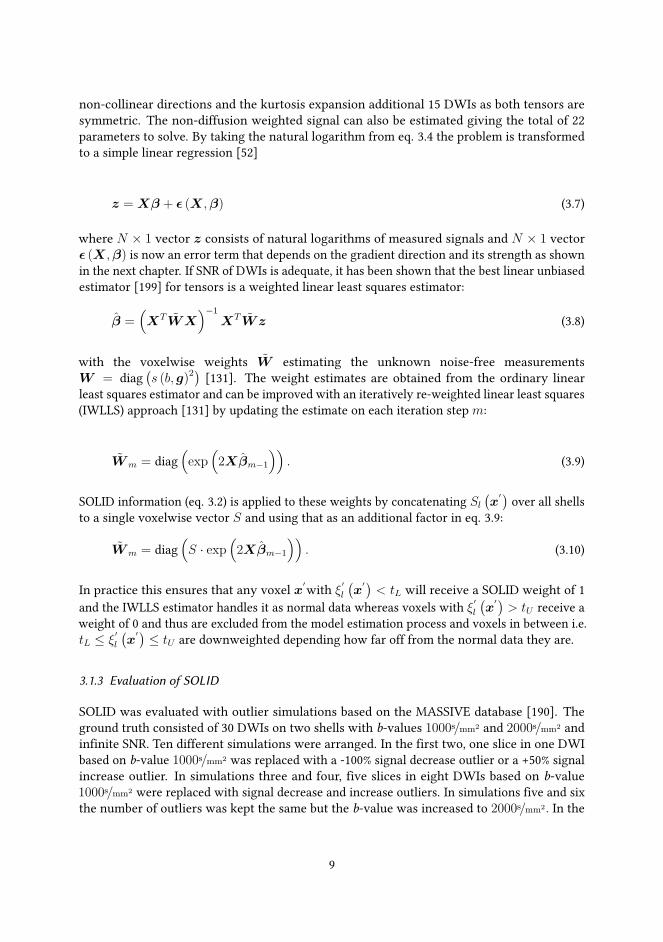
non-collinear directions and the kurtosis expansion additional 15 DWIs as both tensors aresymmetric. The non-diffusion weighted signal can also be estimated giving the total of 22parameters to solve. By taking the natural logarithm from eq. 3.4 the problem is transformedto a simple linear regression [52]
z = Xβ + ε (X,β) (3.7)
where N × 1 vector z consists of natural logarithms of measured signals and N × 1 vectorε (X,β) is now an error term that depends on the gradient direction and its strength as shownin the next chapter. If SNR of DWIs is adequate, it has been shown that the best linear unbiasedestimator [199] for tensors is a weighted linear least squares estimator:
β =(XTWX
)−1XTWz (3.8)
with the voxelwise weights W estimating the unknown noise-free measurementsW = diag
(s (b, g)2
)[131]. The weight estimates are obtained from the ordinary linear
least squares estimator and can be improved with an iteratively re-weighted linear least squares(IWLLS) approach [131] by updating the estimate on each iteration step m:
Wm = diag(exp
(2Xβm−1
)). (3.9)
SOLID information (eq. 3.2) is applied to these weights by concatenating Sl
(x
′)over all shells
to a single voxelwise vector S and using that as an additional factor in eq. 3.9:
Wm = diag(S · exp
(2Xβm−1
)). (3.10)
In practice this ensures that any voxel x′with ξ
′l
(x
′)< tL will receive a SOLID weight of 1
and the IWLLS estimator handles it as normal data whereas voxels with ξ′l
(x
′)> tU receive a
weight of 0 and thus are excluded from the model estimation process and voxels in between i.e.tL ≤ ξ
′l
(x
′) ≤ tU are downweighted depending how far off from the normal data they are.
3.1.3 Evaluation of SOLID
SOLID was evaluated with outlier simulations based on the MASSIVE database [190]. Theground truth consisted of 30 DWIs on two shells with b-values 1000s/mm2 and 2000s/mm2 andinfinite SNR. Ten different simulations were arranged. In the first two, one slice in one DWIbased on b-value 1000s/mm2 was replaced with a -100% signal decrease outlier or a +50% signalincrease outlier. In simulations three and four, five slices in eight DWIs based on b-value1000s/mm2 were replaced with signal decrease and increase outliers. In simulations five and sixthe number of outliers was kept the same but the b-value was increased to 2000s/mm2. In the
9
last four simulations b-value 1000s/mm2 shell was again used with multiple signal decrease andincrease outliers but now each artefactual DWI was either rotated by 5◦ degrees around theleft-right or anterior-posterior axes to simulate head nods and tilts.
These ten setups cover a range of typical clinical b-values, situations with a few outliers, andsituations with plenty of outliers. Rotations were used to simulate slight nods and tilts thatsubjects mightmake during the acquisition that could potentially hinder the SOLID performanceas anatomical regions between artefactual and normal DWIs would not be exactly the same.Random selection of artefactual DWIs and slice positions was repeated 1000 times for eacharrangement before introducing Rician noise with three different SNR levels: 8, 16, and 32.Finally, the sensitivity, specificity, and positive predictive value of SOLID were evaluated withreceiver operating characteristic (ROC) profiles and precision-recall curves (PRC) by applyinghypothetical thresholds from 0 to 10 to the modified Z-score ζk,l and recording the number oftrue and false positive or negative findings. The threshold is referred as hypothetical as withour downweighting framework it does not directly reject outliers.
3.1.4 Comparison to previously published tools
A slightly different simulation was designed to compare SOLID with previously published toolsDTIPrep [152] and DTI Studio [147]. DTIPrep and DTI Studio have a fundamentally differentapproach to outlier detection i.e. they search for outliers within DWIs whereas SOLID searchesfor them across DWIs. Thus, only a qualitative example was given with 30 DWIs based onb-value 1000s/mm2 of which one DWI had multiple signal decrease and increase outliers. For amore quantitative comparison with FSL EDDY [153], which also searches for outliers acrossDWIs, simulations of eight artefactual DWIs out of 30 based on b-value 1000s/mm2 each havingfive outlier slices with a combination of signal increase and decreases along with a 5◦ rotationaround the left-right axis were generated. SOLID performance was evaluated again with thehypothetical modified Z-score thresholds from 0 to 10 whereas FSL EDDY was evaluated by itsstandard deviation threshold from 0 to 10 to obtain ROC profiles and PRCs.
3.1.5 Evaluation of SOLID-informed tensor estimator
SOLID-informed model estimator (eq. 3.10) was investigated by selecting one voxel fromthe corpus callosum in the white matter and one voxel from the deep gray matter from theMASSIVE database [190]. The ground truth signals of these two voxels were used to estimatethe ground truth diffusion and kurtosis tensors, five non-diffusion weighted signals, anddiffusion weighted signals on two shells with 60 DWIs each based on b-values of 1000s/mm2 and2000s/mm2. Different regions of a GIB were simulated by replacing 0, 1, 2, 4, 8, or 16 signals onboth shells with outliers of varying magnitudes from a full signal decrease of -100% to a modest+50% signal increase before introducing Rician noise (SNR levels of 16, 32, and 64). Noiseiterations were repeated 1000 times, each time selecting new random signals to be replacedwith outliers, before fitting the diffusion kurtosis equation (eq. 3.3) [131, 155]. Finally, tosimulate the ameliorating effect of the SOLID-information, outlier intensities were graduallydecreased from one to zero with the additional SOLID weights S
(x
′).
10

3.1.6 SOLID validation with human data
The validation of SOLID was done against ’a gold standard’ i.e. manually detected outliers fromthe 54 neonatal subjects in Study III. In total, the gold standard consisted of 156 sets of 15 DWIseach, as the acquisition was repeated up to four times if the subject was co-operative. PRCsindicated that the initial SOLID quality control resulted in numerous false positive findingsthus a revised manual analysis of SOLID output was done and false or true positives wereupdated accordingly. One neonatal subject with severe motion artefacts was picked for furthervisualization purposes to motivate the adjusting of the lower threshold tL in eq. 3.2 along withone additional adult subject from Study IV with no visible motion artefacts to be used as as angood quality data reference.
3.2 Error propagation in the linear least squares estimation
Rejecting outliers or even downweighting them properly can potentially lead to a missingdata problem. As the optimal acquisition schemes for diffusion MRI are based on specificdiffusion gradient orientations [118, 157–168], rotating these vectors to correct for the subjectmotion [84, 89, 90, 93, 94, 125] and rejecting [133, 134, 136] or weighting [127–132] the outliermeasurements during the estimation can lead to a situation where the vectors are no longerdistributed optimally. It is unlikely that with modern acquisition schemes with a moderate oreven high angular resolution the inversion of the design matrixX would be fully ill-conditionedresulting in a non-finite linear least squares (LLS) estimate. However, an increased subjectwisevariation is plausible and should be considered especially when comparing healthy volunteersand patient groups who might move more during the acquisition.
3.2.1 Theoretical aspects of the error propagation in LLS estimation
A popular method to obtain the optimized gradient vectors for the acquisition can be explainedwith an analogy to the Thomson problem i.e. minimizing the electrical potential of a system ofpoint charges on the surface of a unit sphere [158, 200]. If one or more of these point chargeswould be removed, this hypothetical electrical potential would change and as proposed byChen et al. 2015 [186] this could be used as a quality assurance tool for diffusion MRI data afteroutlier rejections. The electrical potential, however, is rotationally invariant [118] meaningthat the unit sphere with charges fixed on its surface could be rotated to any orientationwithout affecting the potential. As mentioned in the previous chapter, the error term ε in eq.3.7 depends on both the gradient direction g and its strength b thus quality control with theelectric potential clearly disregards theoretical aspects of the LLS estimation. Rewriting eq. 3.4helps to understand why this directional dependent error occurs
s (b, g) = exp (Xβ) + ε
= exp (Xβ)
(1 +
ε
exp (Xβ)
)(3.11)
11

and when taking the natural logarithm from both sides with the Taylor series approximation
ln(1 + ε
exp(Xβ)
)≈ ε
exp(Xβ)= ε (X,β) the directional dependency of the error term is
confirmed:
ln (s (b, g)) ≈ Xβ + ε (X,β) . (3.12)
In general, it would be preferred to have a uniform error propagation in all directions to avoiddirectionally biased tensor estimates. To achieve this the design matrixX should be optimized
so that its condition number κ (X) :=
√λmax(XTX)λmin(XTX)
that controls the relative boundaries of
the error propagation in the LLS system [118]:
relative error in β (= X\z)relative error in measurements z
≤ κ (X) (3.13)
remains as uniform as possible in all directions. In theory, the best value for the conditionnumber is one as that wouldmean that error does not propagate during themodel estimation andno estimator can decrease the measurement error. In practice, however, this is not possible andachieving a rotationally invariant condition number should be desirable instead as all directionswould have equal error propagation and the model would not become biased. Unfortunately,such optimized gradient schemes are not possible either as the subjects always move duringthe acquisition and this must be corrected using image registration algorithms on DWIs[84, 89, 90, 93, 94, 125] and the design matrix X [93] to model the diffusion process correctly,thus likely rendering the scheme rotationally variant.
Intensity outliers makes the situation even more challenging. When such outliers are excluded,also the respective row in the design matrix Xl has to be removed causing potentially largedeviations in the condition number. Whether the outliers are detected in slicewise [147, 152, 153]or voxelwise [130, 133, 134, 136] manner, this causes spatial differences in the error propagationwithin subject and could result in severe bias in studies where comparisons are done betweenhealthy volunteers thus likely still subjects and patients that due to pain or discomfort tend tomove more. Hence, investigating the condition number after the geometrical transformationsare done and outliers rejected or downweighted should be preferred over the verification ofthe electrical potential.
3.2.2 Simulation experiments
Study II aimed to investigate changes in the condition number and, more interestingly thechanges in the tensor derived measures fractional anisotropy (FA) [4] and direction of thefirst eigenvector (FE) [4] as a function of the incremental data rejections. The ground truthcylindrically symmetric diffusion tensors were simulated based on FA values from 0.05 to 0.95with a step size of 0.10 and assuming mean diffusivity of 2.1 · 10−3mm2/s. As the white matter
12
bundles can travel in any direction within the brain, tensors were rotated to 100 differentorientations providing in total 1000 unique diffusion tensors. The initial diffusion gradientscheme based on 30 nearly uniformly distributed directions [158] and a b-value of 1000s/mm2
were used to simulate DWIs from these tensors with 1000 Rician noise iterations with SNRs of18 and 36.
Outlier rejections were simulated by calculating all possible sub-schemes of the initial 30direction gradient scheme. The diffusion tensor has six degrees of freedom i.e. at least six DWIsare needed for an unambiguous estimation. As the sum of possible hi=6...30 combinations from
30 DWIs is∑30
i=6
(30i
)= 1073 567 387, it would not been feasible to use them all to estimate
the tensors to calculate FA and FE values due to the immense computational time required.Instead, the electric potential (EP) was calculated and sub-schemes were rotated to 100 differentorientations (Figure 3.2A) to evaluate the minimum and the maximum condition numbers(CN). Four groups of sub-schemes were created based on these minima and maxima values:the best CN and the best EP with the smallest maximum CN and the smallest EP values andthe worst CN and the worst EP with the largest maximum CN and the largest EP values. Eventhese simple metrics required a computational time of approximately 5 ms for each sub-schemeresulting in a total computing time of two months with one CPU. Parallelization of the problemwas achieved by enumerating the sub-schemes in the lexicographical order [201] followed byunranking [202] them into a blocks of 105 sub-schemes for each CPU. Finally, these four groupsof sub-schemes were used to select parts from the ground truth DWIs to be used in the LLSdiffusion tensor estimations [155]. Derived 1000 FA and FE values were reported as differencesfrom the ground truth FA (mean ± standard deviation) and FE (median ± interquartile range)for each ground truth FA and FE value separately.
3.2.3 Human data experiments
Six neonatal subjects (three from Study III) and three adult subject experiments were carriedout to visualize these effects on real diffusion MRI data derived FA and FE values along with astreamline tractography [57, 155, 203] of the corticospinal tract [204]. Subject data was visuallyinspected to contain no slicewise outliers as they would have hindered this experiment. Thepreprocessing was done with FSL topup and EDDY [173] or eddy correct [87, 205] dependingon the data acquisition detailed in the manuscript II. The adult subjects were scanned with thesame 30 direction scheme used in the ground truth simulation part. As the data was corrected forsubject motion, the sub-schemes had to be recalculated for each of them separately, highlightingthe need for parallelization of the h-combinations problem.
Neonatal data consisted of two groups with three different subjects in both of them. GroupA) was scanned with 32 non-collinear directions which were vendor specific [161] but notoptimized for rotational variance [118]. The first two vectors along with x and y-axes wereremoved from the set to form a set of 30 DWIs with almost uniform angular sampling andgroup B) subjects from the previous Study IIIwith vendor specific 15 direction scheme that wasrepeated at least twice to form a set of 30 DWIs. Group B also provided an option to investigatehow the condition number would change in the case of repeated acquisitions and was further
13

Figure 3.2: Illustration of the spiral sampling on the spherical surface. A) Nearly uniformly
sampled 100 points on a unit sphere showing the rotational variance of the condition number
(CN) without any outlier rejections. B) An interpolated 2D map is used to visualize the whole
spherical surface. C) Differences between the deterioration rates of electric potential (EP)
and condition number as function of incremental data rejections. (Reprinted from II with
permission of Elsevier).
divided into two sub-group for which B1) rejections were applied consecutively to both sets of15 DWIs and B2) rejections were applied on the full 30 DWI set. Studying repeated acquisitionswith the ground truth set of 30+30 DWIs was not possible due to enormous number (1.15 ·1018)of possible combinations which would correspond to a computational time of 182 megayears.
In summary, every subject experiment had an original dataset of one non-diffusion weightedimage and 30 DWIs which were used as the baseline in comparisons with the sub-schemes.
3.3 Neurocognitive correlations of tensor derived measures
After the model has been successfully estimated it can be used to derive voxelwise eigenvaluesor combinations of them to characterize the brain microstructure in a meaningful way and beused in statistical analyses.
3.3.1 Diffusion measures
The amount of diffusion can be described with the apparent diffusion coefficient (ADC) whichis usually referred as the mean diffusivity (MD) defined in eq. 3.14 if it is calculated fromthe diffusion tensor elements D = {Dii : i = 1, . . . 3} instead from the average of three
14
orthogonally acquired DWIs [4]:
MD =D11 +D22 +D33
3. (3.14)
In some applications, such as tractography [57], it is beneficial also to know the orientation ofthe diffusion in addition to its magnitude. This can be achieved through the eigendecompositionof the diffusion tensor that gives the eigenvectors e = {ei : i = 1, . . . , 3} and correspondingeigenvalues λi : i = 1, . . . , 3 [52]:
D =
⎛⎝ D11 D12 D13
D12 D22 D23
D13 D23 D33
⎞⎠ = EΛE−1
=
⎛⎝ e11 e21 e31
e12 e22 e32e13 e23 e33
⎞⎠
⎛⎝ λ1 0 0
0 λ2 00 0 λ3
⎞⎠
⎛⎝ e11 e12 e13
e21 e22 e23e31 e32 e33
⎞⎠ . (3.15)
Simple measures, such as the axial diffusivity (AD) or λ1 and the radial diffusivity (RD) i.e.λ2+λ3
2
that describe the magnitude of the diffusion along the first eigenvector e1 or perpendicularto it are complemented usually with the dimensionless FA (eq. 3.16) that characterizes theanisotropy of the diffusion profile:
FA =
√3
2
√(λ1 −MD)2 + (λ2 −MD)2 + (λ3 −MD)2√
λ21 + λ2
2 + λ23
. (3.16)
FA is scaled between 0 and 1 meaning that areas with isotropic diffusion such as cerebrospinalfluid should have zero FA and high MD whereas white matter bundles should have FA closerto one and lower MD [4]. However, due to noise and partial volume effects, FA values below0.2 are usually considered unreliable. While the noise in the images could be isotropic, thepropagation of the error is not and this will amplify deviations in FA values as well.
Similar presentation for the mean kurtosis (MK, eq. 3.17) based on the kurtosis tensor [62, 104]is more complex to define as it does not have a similar physical analogy as MD or ADC:
MK =1
4π
ˆ ˆ
S2
EK (g) dS2g (3.17)
with EK being the excess kurtosis in the direction defined on the surface of a unit sphere i.e.g ∈ S
2:
EK (g) =
(∑3i=1
Dii
3
)2 ∑3i,j,k,l=1 gigjgkglKijkl(∑3
i,j=1 gigjDij
)2 . (3.18)
15
Poot et al. [104] also defined the kurtosis anisotropy (KA) as a metric that describes thevariability of kurtosis without normalization from 0 to 1 which was used for the FA:
KA =
√√√√ 1
4π
ˆ ˆ
S2
(EK (g)−MK)2 dS2g. (3.19)
3.3.2 Region of interest based analysis
Descriptive voxelwise values e.g. FA can be extracted from a region of interests (ROI) sothey can be compared to other measurements such as cognitive or physiological test results.ROI can be defined with various methods such as a hand drawn shape or an atlas based areawithin an FA image or as a volume specified by a white matter fiber bundle modelled with thetractography. However, in studies such as III and IV with multiple subjects, drawing ROIsby hand is both time-consuming and is highly dependent on the drawer. One of the mostcommonly used automatic voxel-based analysis tools is Tract-Based Spatial Statistics (TBSS)[180, 185] implemented in FSL [205] was designed to help exactly with this kind of problem.
3.3.3 Voxel based analysis
TBSS registers FA images of all subjects to the same space using a nonlinear registration toolFNIRT [206, 207], it calculates an average for them and thresholds this to a mean FA skeletonthat should contain the largest white matter structures common for the whole group. RegisteredFA images are projected onto the mean skeleton to form the subjectwise FA skeletons. Therationale behind skeletonization is to reduce multiple comparisons thus increasing the powerof statistical tests. Projections should ensure that the comparisons are done on the same whitematter structures. Finally, the subjectwise FA skeletons can be used in voxelwise permutationtests [182, 208, 209] to locate the differences between groups or correlations between FA valuesin specific brain structures and some other measurements such as cognitive test results. Themean FA skeleton could also be used for a projection target for other tensor derived values suchas MD or RD. However, TBSS has been questioned as the nonlinear registrations rarely succeedwell with the same settings for a large number of varying brains, especially if the subjectsare young or brains are abnormal. In such case, the skeletonization could fail as wrong whitematter structures could be projected onto the skeleton resulting in utterly false comparisons[185].
3.3.4 Tractography based analysis
A more arduous but accurate approach is to form actual white matter bundle models withthe tractography for each of the subjects and calculate descriptive statistics from them. Trac-tography can be implemented in various ways with the most common being a deterministicstreamline tractography [57] that is based on voxelwise tensors with each having the firsteigenvector indicating the orientation of the fiber bundle. This also means that this simple
16

diffusion tensor based tractography is unable to distinguish crossing fiber populations as thereis only one principal orientation per voxel [25, 110, 194, 203, 210, 211]. Tractogram is formed byfollowing these tensor orientations starting from a manually selected seed ROI and continuingfrom voxel to voxel until predefined boundaries such as low FA, the angle between two tensorsis too large to be physically plausible, or a manually defined exclusion ROI is reached.
3.3.5 Visual abilities of neonatal subjects
Study III investigated if white matter structure characteristics of neonatal subjects wouldcorrelate with their performance in visuomotor or visual reasoning tasks [212, 213]. DiffusionMRI data from sixty infants was visually inspected for slicewise outliers and six subjects wererejected due to lack of the non-corrupted data. From the remaining subjects, 45 had also testresults for visual fixation (VF) and gaze behaviour (GB). A full diffusion MRI data analysisfrom corrections of geometric distortions with FSL’s eddycorrect algorithm [84, 89, 90, 93,94, 125, 205] to the voxelwise robust tensor estimation with non-linear RESTORE algorithmimplemented in Camino [133, 214] was performed to obtain FA images. The standard TBSSpipeline was used to study the relation between FA and the other metric (here VF or GB) andpossible covariates such as gestational age as a linear relation [209]. As there was no reason toassume such a simplistic relation, the Pearson correlation test used in the standard permutationtest was replaced with the Spearman rank test [215]. In practice this should increase the powerof the statistical test with any non-linear but monotonic relation with a small cost in power fora truly linear correlations [216].
3.3.6 White matter changes in bilingual adults
In Study IV, two groups of fourteen healthy volunteers were imaged to investigate if anystructural differences due to the age of acquisition of the second language (L2) could be detectedwith diffusion weighted MRI [18, 217]. The first group had learned the second language earlyin life whereas the second group consisted of late bilinguals. A similar full diffusion MRI dataanalysis as used in Study III was conducted to obtain FA, MD, and RD images to be usedin TBSS [180, 185] with the updated FSL EDDY algorithm to correct for the off-resonanceeffects and subject motion [173] and tensor estimates were calculated using ExploreDTI [155].Additionally, subjectwise tractograms of two speech related tracts: the arcuate fasciculus andthe inferior fronto-occipital fasciculus (IFOF) [41, 204, 218] were segmented to extract tractwisemean FA, MD, and RD values as well as to aid TBSS by restraining the full FA skeleton withthe tractwise masks.
17
4 Results
4.1 SOLID
Simulations in Study I were based on full brain DWIs from the MASSIVE database [190]by setting hypothetical modified Z-score ξ
′l
(x
′)thresholds from 0 to 10 each time counting
number of true and false positive or negative findings to form ROC curves and PRC profiles.The optimal threshold was calculated from each curve as the smallest Euclidean distance tothe left top point with full sensitivity and specificity for comparison with the suggested lowerthreshold tL = 3.5. Area-Under-Curve (AUC) values of ROC curves and PRCs summarized theoverall effectiveness of SOLID.
4.1.1 Evaluation of SOLID
Six outlier setups were simulated to evaluate the SOLID performance. Figure 4.1 A-B) representa typical clinical acquisition scheme with 30 DWIs based on a b-value of 1000s/mm2 with oneartefactual DWI having one signal decrease or increase outlier. SOLID performed well for sucha simple setup having an ROC AUC value of 0.98 even with the lowest SNR of 8. While theoptimal modified Z-score threshold deviates from the recommended 3.5 in most of the cases,the visual inspection of ROC curves show that the recommended threshold is actually quitenear the optimal region. In C-D) the number of artefactual DWIs and slicewise artefacts areincreased to eight and five respectively with 30 DWIs based on the same b-value of 1000s/mm2
to simulate a typical acquisition of uncooperative subjects such as neonates with severe motionartefacts. The increase in the number of outliers reduced the smallest ROC AUC value to0.97 and slightly increased the difference between the recommended threshold and optimalthreshold. In E-F) the number of outliers was kept high but the b-value was increased to2000s/mm2. The lowest SNR simulation had the ROC AUC value of 0.95 still indicating goodperformance even for such low SNR case with a small number of available DWIs. However,the differences between the optimal and the recommended thresholds become more apparentsuggesting that for higher b-value experiments the lower threshold could be smaller.
Figure 4.2 shows the results for the last four simulations that included subject motion in the formof 5-degree rotations around the left-right (nod) or the anterior-posterior axis (tilt). SimulatedDWIs were based on a b-value of 1000s/mm2 with eight of them having five signal decrease(left column) or increase (right column) outlier slices. Differences in ROC curves betweensimulations shown in Figure 4.1 C-D) are apparent only with the signal increase outliers thatproduced the lowest AUC value of 0.95 with SNR 8.
Further investigation of PRC profiles (Supplementary Figs. I.1 and I.4) confirmed that SOLIDdid not make excess false positive findings as the positive predictive value remained overall
18
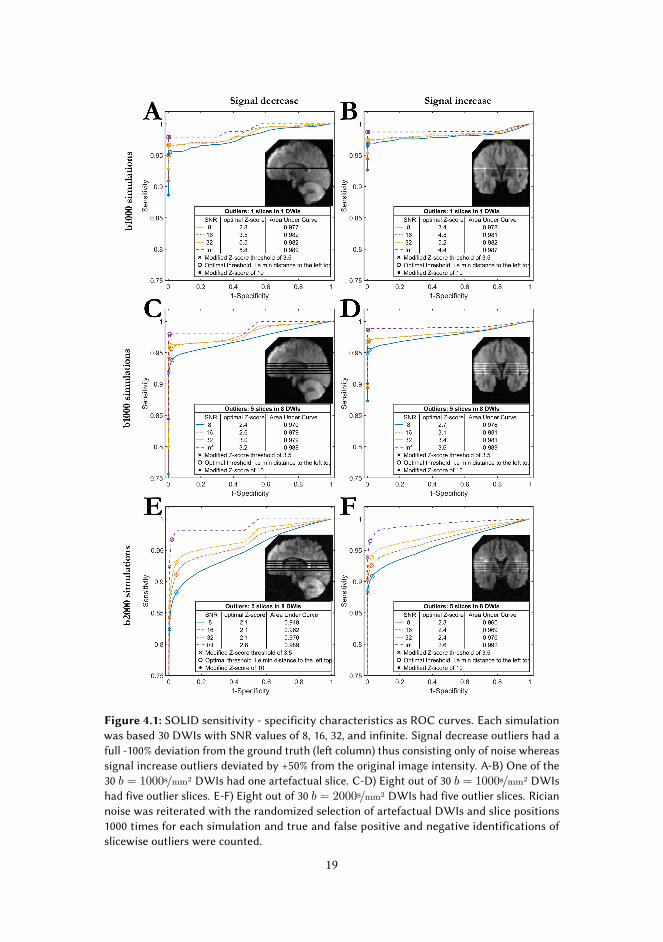
Figure 4.1: SOLID sensitivity - specificity characteristics as ROC curves. Each simulation
was based 30 DWIs with SNR values of 8, 16, 32, and infinite. Signal decrease outliers had a
full -100% deviation from the ground truth (left column) thus consisting only of noise whereas
signal increase outliers deviated by +50% from the original image intensity. A-B) One of the
30 b = 1000s/mm2 DWIs had one artefactual slice. C-D) Eight out of 30 b = 1000s/mm2 DWIs
had five outlier slices. E-F) Eight out of 30 b = 2000s/mm2 DWIs had five outlier slices. Rician
noise was reiterated with the randomized selection of artefactual DWIs and slice positions
1000 times for each simulation and true and false positive and negative identifications of
slicewise outliers were counted.
19

high with the smallest PRC AUC for the simulation experiments being 0.8. Detection of lowerintensity deviations with -10% and -50% decreases were explored in Supplementary Fig. I.2. The-50% decrease outliers were identified with nearly similar effectivity as the full -100% decreaseoutliers whereas the -10% deviation was too close to normal intensity variation between DWIsfor SOLID to detect them reliably.
4.1.2 Comparison to previously published tools
Figure 4.3 A-D) illustrates the qualitative differences between SOLID and the previously pub-lished tools: DTIPrep [152] and DTI Studio [147]. In A) a set of 30 DWIs based on b-value1000s/mm2 with one artefactual volume containing multiple signal increase and decrease outlierslices was used to highlight the problems in the algorithms used in DTIPrep and DTI Studio. B)The DTIPrep algorithm identifies outliers within DWI based on normalized cross-correlation(NC) [197] between two adjacent slices. This resulted in multiple false positives as normal slicesadjacent to outliers were also flagged as outliers. C) SOLID identified correctly all simulatedoutliers and gave them a modified Z-score value of at least 10. While SOLID did find falsepositives, they were located in the inferior part of the DWI volume with only a few brain voxelsthus having relatively small impact on any further analysis. D) The DTI Studio algorithm isbased on the morphological closing of the DWI volumes in a perpendicular direction to theslice acquisition plane. This approach failed to detect multiple adjacent i) signal increases or ii)decreases and iii) positioned interleaved signal increase outliers incorrectly.
Figure 4.3 E) summarizes a quantitative comparison with FSL EDDY [153]. Sensitivity - speci-ficity characteristics of SOLID and FSL EDDY were compared with 1000 sets of 30 DWIs basedon a b-value of 1000s/mm2. Eight DWIs were replaced with artefactual volumes with a 5◦ rota-tion around the left-right axis. Each DWI had five outlier slices having randomly either -100%decrease or +50% increase in the signal and Rician noise with SNR 16. SOLID ROC curve wascalculated using the hypothetical modified Z-scores thresholds between 0 and 10 whereas EDDYROC curve was based on the standard deviation thresholds between 0 and 10. By default, EDDYuses a threshold of 4 standard deviations. SOLID had overall higher sensitivity than EDDYwith 9% higher ROC AUC value. Due to the proposed SOLID downweighting framework, theactual differences in the model estimation could be even higher as EDDY either merely rejectsthe outlier or replaces them with the prediction from the Gaussian process model [116, 153].
4.1.3 Evaluation of SOLID-informed tensor estimator
Investigation of SOLID-informed IWLLS estimator based on the ground truth voxel from thecorpus callosum (Fig. I.5) confirmed that the full downweighting of measurements that areonly partially affected by outlier data, i.e. the edge regions of GIB artefact, is not needed toobtain correct tensor estimates. The deviation from the ground truth estimate increased as afunction of outlier signal intensity and the number of outlier signal per shell. Even in the caseof 16 outlier signals on both shells of 1000s/mm2and 2000s/mm2 SOLID-information was ableto ameliorate the iterative estimation process to produce nearly correct results. Interestingly,SOLID-information also kept the numerical problem well-conditioned. For example, in the case
20
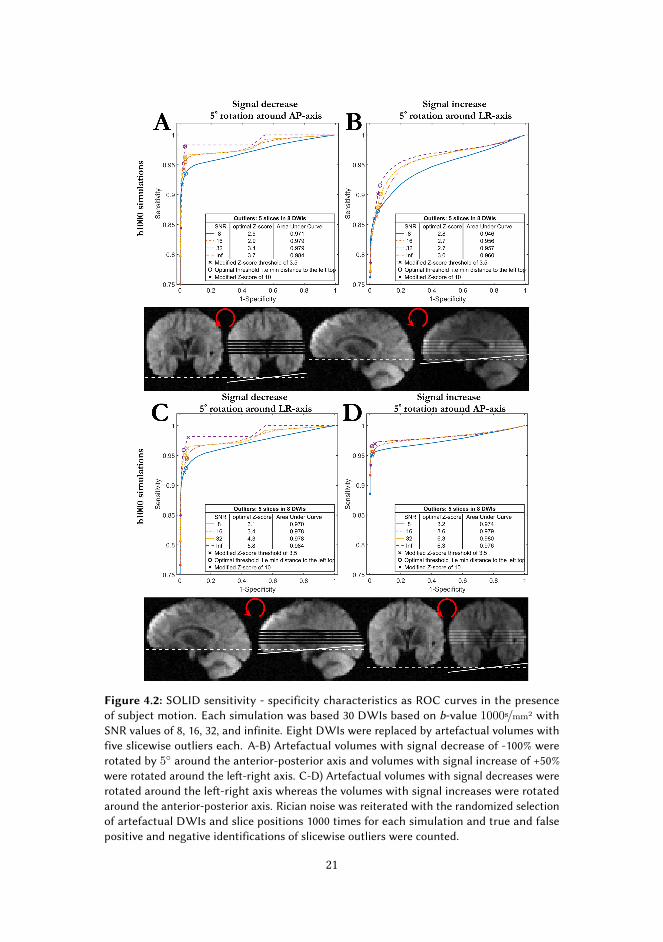
Figure 4.2: SOLID sensitivity - specificity characteristics as ROC curves in the presence
of subject motion. Each simulation was based 30 DWIs based on b-value 1000s/mm2 with
SNR values of 8, 16, 32, and infinite. Eight DWIs were replaced by artefactual volumes with
five slicewise outliers each. A-B) Artefactual volumes with signal decrease of -100% were
rotated by 5◦ around the anterior-posterior axis and volumes with signal increase of +50%
were rotated around the left-right axis. C-D) Artefactual volumes with signal decreases were
rotated around the left-right axis whereas the volumes with signal increases were rotated
around the anterior-posterior axis. Rician noise was reiterated with the randomized selection
of artefactual DWIs and slice positions 1000 times for each simulation and true and false
positive and negative identifications of slicewise outliers were counted.
21
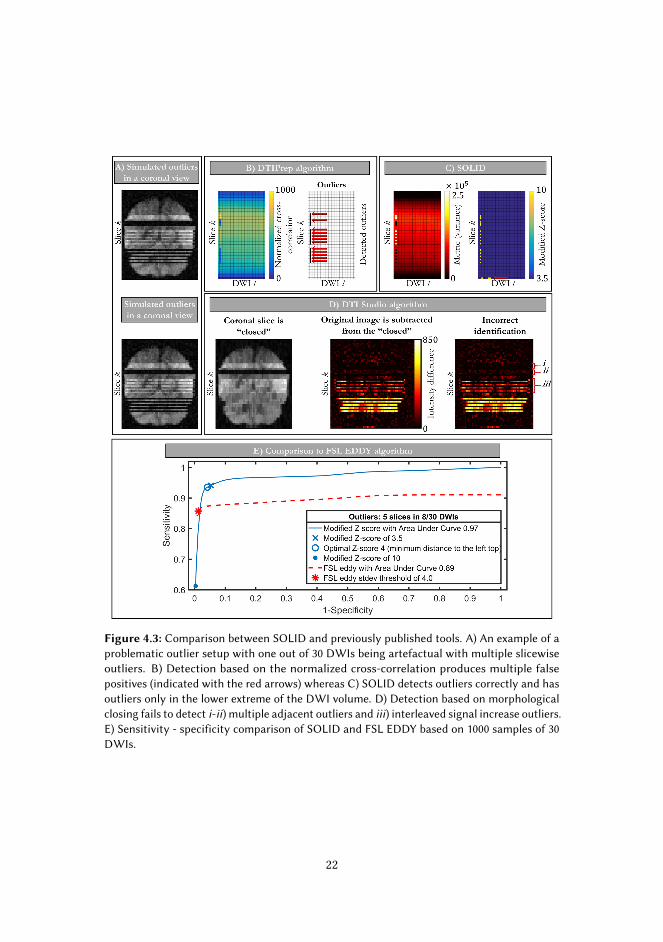
Figure 4.3: Comparison between SOLID and previously published tools. A) An example of a
problematic outlier setup with one out of 30 DWIs being artefactual with multiple slicewise
outliers. B) Detection based on the normalized cross-correlation produces multiple false
positives (indicated with the red arrows) whereas C) SOLID detects outliers correctly and has
outliers only in the lower extreme of the DWI volume. D) Detection based on morphological
closing fails to detect i-ii) multiple adjacent outliers and iii) interleaved signal increase outliers.
E) Sensitivity - specificity comparison of SOLID and FSL EDDY based on 1000 samples of 30
DWIs.
22

of 16 outliers per shell, even though the condition number [118, 161] of the weighted designmatrix (eq. 3.8) was in the normal range, the noise started to propagate rigorously on eachiteration step leading finally to the fully ill-conditioned problem with a non-finite solution andto failed tensor estimates. While applying SOLID weights will likely increase the conditionnumber, downweighting the outlier intensity reduced the overall noise so the iterative processcould be finished and produce a finite solution. Further comparison between SOLID-informedIWLLS and LLS, standard IWLLS, and voxelwise robust tensor model estimators (Fig. I.6)showed that while both the robust estimator and SOLID-informed IWLLS were able to reducethe bias due to outliers to nearly identical results, the voxelwise approach missed severaloutliers in the GIB edge.
4.1.4 SOLID validation with human data
The data / certainty principle is further visualized in Figure 4.4 with two subject datasets,showing SOLID validation results, and highlighting a situation were SOLID was able to detectoutliers that the technician had missed. A1-2) A sagittal slice of a DWI before and after motioncorrection is shown for an adult with no visible intensity artefacts and a neonate with severeintensity artefacts. B) Final weights of a standard IWLLS (eq. 3.9) indicate that the modelestimated from the neonatal data is affected by the outliers as their weight is not zero. C) SOLID-informed IWLLS (eq. 3.10) with lower threshold of tL = 0 correctly removes outlier weightsfrom neonate but now the good quality adult data gets partially downweighted incorrectly. D)Increasing the lower threshold to the suggested tL = 3.5 corrects the problem with incorrectgood quality data downweighting on the adult subject yet preserving the correct outlier removalon the neonatal subject. E) Manually labeled slicewise outliers from 54 neonatal subjects wereused to calculate true and false positive and negative findings by SOLID with the modifiedZ-score threshold from 0 to 10. An ROC AUC value of 0.92 indicates a good agreement withboth methods, however, F) a closer inspection of outliers detected by SOLID revealed that insome cases the technician had missed outliers that SOLID was able to detect. In this case, theoutlier was due to sub-optimal hardware behaviour and while the clear signal deviations arelocal such hardware problems likely affect the whole slice due to the slicewise acquisitiontechnique and should be excluded or downweighted accordingly.
23
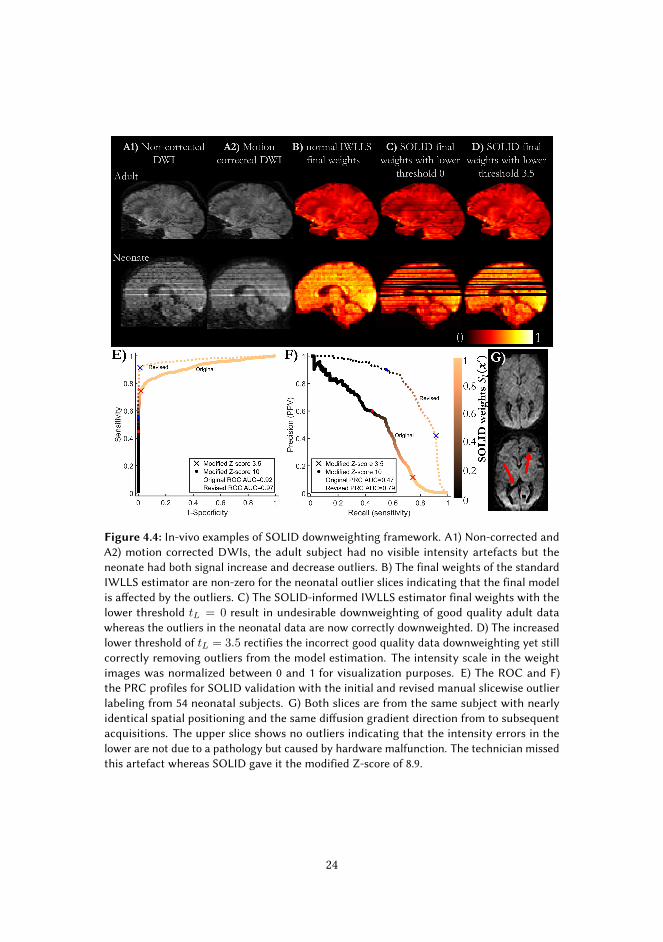
Figure 4.4: In-vivo examples of SOLID downweighting framework. A1) Non-corrected and
A2) motion corrected DWIs, the adult subject had no visible intensity artefacts but the
neonate had both signal increase and decrease outliers. B) The final weights of the standard
IWLLS estimator are non-zero for the neonatal outlier slices indicating that the final model
is affected by the outliers. C) The SOLID-informed IWLLS estimator final weights with the
lower threshold tL = 0 result in undesirable downweighting of good quality adult data
whereas the outliers in the neonatal data are now correctly downweighted. D) The increased
lower threshold of tL = 3.5 rectifies the incorrect good quality data downweighting yet still
correctly removing outliers from the model estimation. The intensity scale in the weight
images was normalized between 0 and 1 for visualization purposes. E) The ROC and F)
the PRC profiles for SOLID validation with the initial and revised manual slicewise outlier
labeling from 54 neonatal subjects. G) Both slices are from the same subject with nearly
identical spatial positioning and the same diffusion gradient direction from to subsequent
acquisitions. The upper slice shows no outliers indicating that the intensity errors in the
lower are not due to a pathology but caused by hardware malfunction. The technician missed
this artefact whereas SOLID gave it the modified Z-score of 8.9.
24

4.2 Error propagation in the least squares estimation
Study II emulated white matter bundles travelling in various directions with the set of cylin-drically symmetric diffusion tensors to investigate data rejections and changes in diffusiongradient scheme EP and CN values on tensor derived FA and FE measures. As hypothesized,the EP metric was not as effective in disclosing error prone sub-schemes as the CN metric (Fig.II.3). While a general correlation between CN value and tensor derived metrics is difficult todefine, we recommend investigating CN values across the compared subjects or within subjectin longitudinal studies as that could reveal direction-wise biases in the data.
4.2.1 Simulation experiments
Figure 4.5 shows examples angular maps of A) FA and B) FE errors for selected three sub-schemes (rows of subfigures) with 30, 18 and 6 gradient directions and three ground truth FAvalues (columns of subfigures) 0.85 (high FA simulation), 0.55 (medium FA simulation), and0.25 (low FA simulation). The results shown here were based on the worst CN as it was shownto produce the largest errors (Fig. II.3). The results for all cylindrically symmetric tensorsbased on the 10 different FA values after rejections using the best and the worst CN and EPsub-schemes are available as supplements to Study II1. While in most of the cases the worst EPand CN sub-scheme were actually the same, there were multiple situations when the worst CNsub-scheme was notably more error prone resulting in larger deviations from the ground truthtensors.
The comparison of such complex angular maps (Figure 4.5) between all schemes is challenging,thus FA error maps were averaged with one standard deviation error bars and the median of FEerror maps with an interquartile range (IQR) as error bars were used to form 2D scatter plots(Figure 4.6D and E and Fig. II.3C and D and Supplementary Figs. II.3-5). As the number ofrejections increased, the simulation experiment and all subject experiments showed that theworst CN metric was more effective in identifying problematic sub-schemes.
4.2.2 Human data experiments
The full set of 30 DWIs in Figure 4.5 visualized a reference when no data rejections were appliedand only the Rician noise with SNR 36 affects the FA and FE estimates. While both FA andFE show directional variances, their magnitudes for each tensor type remains relatively low.With the incremental data rejections, these directional variances become more distinct with alltensors for the both FA and FE estimates. In practice this means that fiber populations travelingin varying directions within the brain could have widely different errors. Especially, if theoutliers are rejected in a voxelwise manner, as these changes would vary from voxel to voxelleading to both spatially and directionally shifting errors.
Interestingly, in the neonatal experiment B i.e. two acquisitions of 15 DWIs did not agreefully with the simulation or other subject experiment results. Visualizations for both rejection
1Available online at http://dx.doi.org/10.1016/j.neuroimage.2016.11.061
25

schemes with rejections applied B1) consecutively on the two sets of DWIs e.g. the first setwould have to be rejected completely before the first volume of the second set would be rejectedand B2) on both DWI sets simultaneously thus maximizing the decline in angular sampling.
Figure 4.6 A) shows colour coded FA maps for the both neonatal rejection schemes with no,four, and eight rejections. B) FA errors and C) FE i.e. V1 errors were calculated as differencesfrom the original data set without applied rejections as it was assumed to provide the mostaccurate estimates. B2 group with DWIs rejected from both sets was clearly more error proneas both FA and FE errors were higher. Finally, to demonstrate the higher sensitivity of the CNmetric, D) and E) show FA (mean ± standard deviation) and FE (median ± IQR) results: Whilethe EP criteria did show a gradual decline in both FA and FE, it did miss the large deviationsseen in the worst CN sub-schemes.
Figure 4.5: Directional dependence of the tensor derived parameters FA and FE increases
as function of DWI rejections. The colour scale is normalized according to minimum and
maximum values for each row of subfigures and represents A) the mean FA deviation B) the
median FE deviation from the ground truth values. (Modified from II with permission of
Elsevier).
26

Figure 4.6: Spatially varying FA and FE errors for one of the neonatal subjects in group B in
which two acquisitions of 15 DWIs acquired consecutively. A) Colour coded FA map with
no, four, and eight rejections applied for both rejection schemes with the worst CN criteria.
B) FA error and C) FE error maps visualize that white matter regions with overall higher FA
value can tolerate a larger number of rejections as their deviations from the original dataset
were lower. D) Mean FA error ± standard deviation and E) Median FE error ± interquartile
range when rejections were applied on both sets of 15 DWIs simultaneously. (Reprinted from
II with permission of Elsevier).
27

4.3 Neurocognitive correlations of tensor derived measures
Two studies were conducted to investigate the correlations between the tensor model charac-teristics and the visuomotor and visual reasoning task performance of neonatal subjects (III)or the age of L2 acquisition of adult subjects (IV).
4.3.1 Visual abilities of neonatal subjects
Study III presents the correlations in the white matter FA values and visual ability test forthe infants. Nearly half of the white matter voxels, even after the correction for multiplecomparisons [216], showed significant correlations between the FA and VF scores in the TBSSbased voxelwise comparison tests (Figure 4.7). The differences were spread uniformly acrossthe whole FA skeleton, indicating that the infants with a low VF score had overall lower whitematter FA values. A ROI based analysis (Figure 4.7B) was in agreement with the TBSS results:the changes in FA values were global with no asymmetries over the hemispheres or otherspatial preferences.
FA correlations with GB score were notably more localized (Figure 4.7A) as TBSS locatedsignificantly correlating voxels only near to the region that could include the optic radiation.Even with a higher significance threshold of p < 0.10, findings remained near the white matterpathways trailing from the visual cortex to the deep brain structures.
4.3.2 White matter changes in bilingual adults
The TBSS results for Study IV, however, were not as prominent as no differences betweenlate and early bilingual groups were disclosed with FA, RD, or MD values. As the power ofthe statistical test could be low due to a large number of voxels [216], the TBSS skeleton wasfurther restricted with tractwise masks. These masks were based on manually traced threesegments of the arcuate fasciculus and the IFOF (Figure 4.8A). This post-hoc test restricted thenumber of multiple comparisons and was able to disclose significant differences in the MDvalues in the frontal parts of the IFOF. Average FA, RD, and MD values of the tractograms of thethree arcuate fasciculus segments and the IFOF were used further in a mixed model analysis.The mean FA of the left long segment of the arcuate fasciculus was significantly higher for theearly bilinguals, the mean MD was significantly higher in the right posterior segment of thearcuate fasciculus for the late bilinguals (Figure 4.8).
28
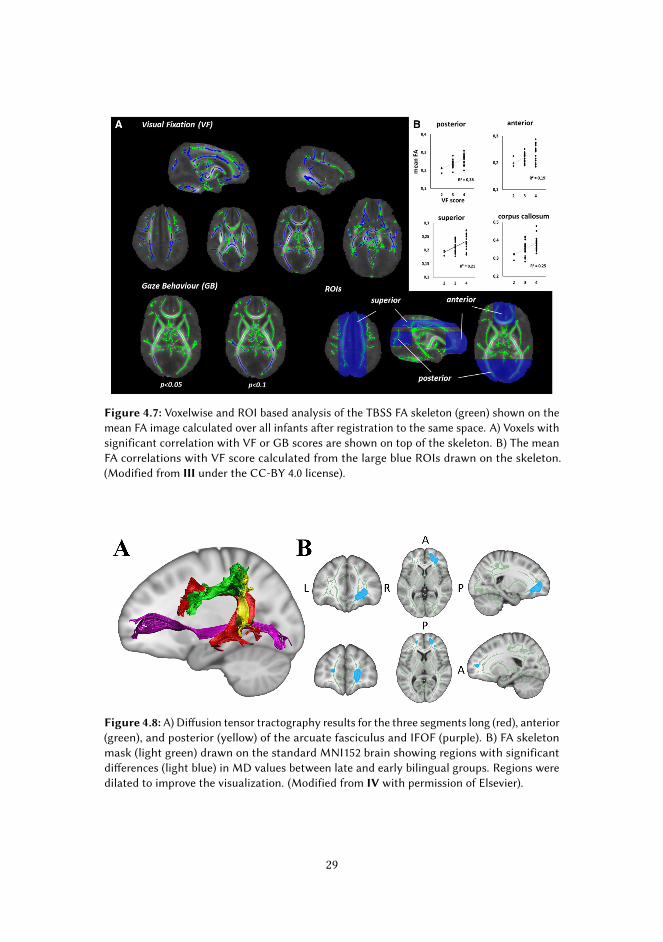
Figure 4.7: Voxelwise and ROI based analysis of the TBSS FA skeleton (green) shown on the
mean FA image calculated over all infants after registration to the same space. A) Voxels with
significant correlation with VF or GB scores are shown on top of the skeleton. B) The mean
FA correlations with VF score calculated from the large blue ROIs drawn on the skeleton.
(Modified from III under the CC-BY 4.0 license).
Figure 4.8: A) Diffusion tensor tractography results for the three segments long (red), anterior
(green), and posterior (yellow) of the arcuate fasciculus and IFOF (purple). B) FA skeleton
mask (light green) drawn on the standard MNI152 brain showing regions with significant
differences (light blue) in MD values between late and early bilingual groups. Regions were
dilated to improve the visualization. (Modified from IV with permission of Elsevier).
29

5 Discussion
5.1 SOLID
The unambiguous characterization of the true physical diffusion [60, 61] of water moleculeswithin the brain can be hindered by the slicewise artefacts arising from subject motion [89–94]or hardware issues during the MRI acquisition. As it is necessary to correct the geometricalalignments of the DWIs before model estimation [84, 89, 90, 93, 94, 125], these slicewise outlierswill likely be distributed into neighbouring slices forming GIB artefacts and obscuring the partialvolume effects [107] even further. The manual labelling of slicewise outliers is challenging,error prone, and time consuming as the amount of data with modern acquisition schemesis calculated in thousands of DWI slices per subject. Previously published tools [147, 151–153, 197, 219] have addressed this issue but their methods have been either too conservativeexcluding whole DWIs at a time if they contained slicewise outliers [152, 197], are limited tocertain types of outliers such as interleaved signal decreases [147], or require time consumingmodelling and prediction of the DWIs which also sets tight restrictions on the acquisitionprotocols [151, 153]. To lift such restrictions, a versatile and fast algorithm, coined SOLID,was developed with a framework to interpret the detected outliers as increased uncertainty inthe measurements so they could be downweighted accordingly during the model estimation[131] (eq. 3.10). SOLID was evaluated with comprehensive simulations with a range of clinicalb-values and acquisition protocols, compared to the previously published tools, and validatedwith a unique set of 54 neonatal subjects.
As SOLID is not dependent on any model, it sets no restrictions on the acquisition protocolincluding b-values, gradient directions or measurement repetitions. Practically, of course, ifover the half of the measurements within the same spatial location are artefactual, SOLIDreaches its breakpoint and cannot identify what is normal and abnormal. The situation couldbe even more difficult with extremely high b-values, as the intensity in such images is nearthe noise floor [74] and the signal decrease artefacts could be challenging to identify reliably.The SOLID framework was implemented as a part of ExploreDTI toolbox [155] to allow a rapiddistribution of the algorithm.
5.1.1 Evaluation of SOLID
To identify abnormal slices, SOLID assumes that the slicewise metrics follow a normal distri-bution. While this assumption could be avoided with non-parametric approaches [216], theirspeed would not be nearly sufficient for practical use as the amount of data in large populationstudies can be enormous. Non-parametric approaches could also have less power if the actual
30

distribution is normal [216]. And as our simulations revealed (Figs. I.2, I.3, and I.4), outlierdetection was not hindered even if such a normality assumption was violated.
A more likely shortcoming of SOLID is related to eddy current and susceptibility artefacts [81–88] or subject motion artefacts [89–95] as all of these could cause a situationwhere the comparedslices in different DWIs have either different geometrical distortions or the anatomical regionsare different due to head rotations or translations. The simulated subject motion decreased theperformance of SOLID (Figs I.2 and I.3) but not drastically. It should be noted that mild falsepositives, e.g. a modified Z-score of 5, that could be a result of these ill-posed comparisonswould not be fully excluded due to the informed model estimation framework. Furthermore,slices with a full signal decrease or large increase would likely still produce a modified Z-scoreabove 10 as such slices would surely be different than slices with any anatomical informationresulting in a full and correct exclusion of the measurement.
In addition to the simple slicewise statistics with mean, variance, median, and MAD (Fig.I.8), a non-parametric Kolmogorov-Smirnov [216] and mutual information [124] based SOLIDframeworks were tested. As these more complex methods did not provide increased efficiencyin the preliminary tests but resulted in notably longer computing times, the simple variancebased detection was chosen as the recommended slicewise metric.
5.1.2 Comparison to previously published tools
Three of most similar algorithms from previously published tools [147, 149, 151–154] wereselected to conduct more thorough comparison: DTIPrep [152, 197], DTI Studio [219], and FSLEDDY [153]. Algorithms in DTIPrep and DTI Studio searched for outliers within DWI whereasFSL EDDY and SOLID searched for outliers across DWIs. While the within DWI approachwould avoid the problem of geometrical misalignments between different DWIs due to subjectmotion during the acquisition, both algorithms produced multiple false positive findings (Figure4.3B and D). DTIPrep rejects the whole DWI volume if a predefined number of outlier slicesis found, thus these false positives could lead to a large scale unnecessary exclusion of goodquality data.
The most similar detection algorithm, used in FSL EDDY, is based on the modelling of thediffusion signal as a Gaussian process [116] which is used to predict error-free DWIs. If ameasurement deviates over four standard deviations from the corresponding prediction, itis deemed to be an outlier. However, the Gaussian process modelling sets tight restrictionson the data acquisition and especially on the used gradient scheme. This highly limits theusage of EDDY on older diffusion MRI datasets that were not acquired within these limits oreven new studies with uncooperative subjects as high end protocols require longer acquisitiontimes. EDDY provides an option to replace outliers with their predicted counterparts to avoidGIB artefacts but it has not been investigated how tensor estimates are affected in such caseswhen they are based on partially original DWIs and partially predictions from the Gaussianprocess. SOLID avoids such difficulties, as the output can be used in any model estimatoras an additional weight to avoid excess noise propagation due to multiple successive modelestimations.
31

5.1.3 Evaluation of SOLID-informed tensor estimator
To investigate the SOLID downweighting i.e. the data uncertainty framework would work, GIBartefacts were simulated using the ground truth tensors selected from the deep gray matter andcorpus callosum. Artefacts were simulated by deviating randomly selected diffusion weightedsignals from the ground truth by -100% to +50% before introducing Rician noise. Next, tosimulate data uncertainty, the weight of these altered signals was decreased gradually from 1to 0 (Fig. I.5 and Supplementary Figs. I.6-10). For both GM and CC tensors, the results werequite similar and expected: the increase in the outlier deviation from the ground truth and thenumber of outlier signals resulted in increasing deviations for all of the studied tensor derivedmetrics FA, MD, KA, and the model residual. As hypothesized, applying the data uncertaintyprinciple as SOLID weights during the IWLLS model estimation (eq. 3.10) led to clearly smallerdeviations from the ground truth values.
Interestingly, Study I linked directly to Study II at this point. Even though, the conditionnumber of the original acquisition scheme was close to one, outliers with large intensitydeviations led to rapid and cumulative noise propagation in the iterative estimation process.As the weights of each step were based on the estimated diffusion signals of the previous stepthis prevented the IWLLS estimator from converging to a finite solution and the algorithmwould return the initial LLS estimate instead. By applying SOLID weights to the design matrixa slight increase in the condition number [118, 161] is likely but the decrease in noise was moreprominent and the IWLLS estimation problem became well-conditioned again. An example ofthis is visualized in Fig. I.5 FA deviations with 16 outliers per shell as the outlier with -100%signal decrease had lower deviation from the ground truth than the outlier with -90% signaldecrease.
Figure I.6 compares the SOLID-informed IWLLS algorithm to a simple LLS, IWLLS [131],and a voxelwise robust REKINDLE [136] algorithm. While REKINDLE and SOLID-informedIWLLS produced quite similar improvements when compared to the non-robust estimators,as hypothesized, the edge regions of GIB were problematic for the voxelwise approach andmultiple voxels were not detected correctly as outliers. The REKINDLE outlier detectionparameter κ could be tuned to improve the detection but it could require multiple iterations foreach subject to find the proper value and thus would be impractical in large population studies.As an optimal solution, REKINDLE could use voxels with zero SOLID weight as the initialoutlier map to avoid this issue and potentially even decrease the computing time of REKINDLE.
5.1.4 SOLID validation with human data
Finally, SOLID was validated with real subject experiments (Fig. I.7) based on manually labeledoutlier slices and there was a high agreement between the two methods as the AUC value of theROC curve was 0.92. A more specific investigation of false positives found with SOLID showedthat the technician had missed some of the milder outliers and local intensity changes due totechnical problems during the acquisition. This means that SOLID did not only agree with themanually labelled outliers but was able to uncover artefacts that a human observer was not.A qualitative visualization of the IWLLS weights (eq. 3.10) with different lower thresholds tL
32
was done to motivate the selection of tL = 3.5 in eq. 3.2. It was shown that a standard IWLLSmodel estimate would be highly affected, especially by signal increase outliers. Furthermore,if no lower threshold was used i.e. tL = 0, good quality adult data would be unnecessarydownweighted as the normal variation in the data would be seen as increased uncertainty.
5.2 Error propagation in the least squares estimation
Study II investigated the expected loss in the accuracy and the precision of the diffusion tensor[3, 96–100, 102, 103] derived parameters FA and FE [4] due to incremental DWI rejections toextend the previous study by Chen et al. 2015 [186]. Chen et al. suggested that investigatingthe EP [158] of the gradient scheme after outlier rejections could be used as a quality controltool. Our hypothesis was that the EP, as it is a rotationally invariant measure, cannot discloseproblematic sub-schemes in such detail as the rotationally variant CN could. Previously, CNhad been used only to optimize the initial diffusion gradient scheme [118, 161] but here weshowed that it could also serve as a post-estimation quality control tool for investigating voxelto voxel varying and angularly dependent error propagation within subject and ensure thatpopulation studies would not become biased due to the same reason.
5.2.1 Simulation experiments
While the worst CN and the worst EP criteria could produce identical sub-schemes, the worstCNmetric revealed notably larger deviations in FA and FE for the non-identical schemes (Figure3.2C). This leads to the conclusion that there is no reason to use EP based metrics for qualitycontrol purposes, at least based on the studied gradient scheme. As these results are gradientscheme specific, a general guideline for how many rejections can be safely made withoutcompromising the final result cannot be made. Especially, as the subject motion correctiongenerates a totally unique set of diffusion gradient vectors for each acquisition. Fortunately,CN can be rapidly assessed easily after any least squares estimation allowing different MRIsites to build their own knowledge of their acquisition schemes and typical patient populations.
The CN metric considered in this study is exact only for the LLS estimation of the diffusiontensor. Models based on multi-shell acquisitions or estimated with other algorithms couldpotentially have different error propagation. This limitation, however, is minor when comparedto the limitations of the previously proposed EP metric [186] that can be seen in Figure 3.2C:for the studied gradient scheme EP values did not decrease monotonically with the incrementalnumber of rejections. This means that if the EP value were used as a quality control tool,after rejecting exactly the half of the directions it would always be better to reject one moreto achieve a lower EP value. Since rejecting good quality data hardly makes sense in analready missing data problem, the usage of EP is not advised. This non-monotonic behaviourof the EP was not observed with the vendor specific 30-direction gradient scheme [158] whichsuggests that different gradient schemes could indeed have highly varying tolerances to theerror propagation.
33

5.2.2 Human data experiments
FA errors (Fig. II.4D) for the adult data were in a good agreement with the simulation ex-periments (Fig. II.3C) i.e. they started to deviate from the best possible estimate slowly asincremental data rejections were applied. FE errors (Fig. II.4E), however, deteriorated at a morerapid pace than their simulation counterparts (Fig. II.3D). This can be explained by the factthat the human white matter structures were modelled with a single tensor characterization[3] which is not sufficient to disclose crossing fibers [211, 220] or other partial volume effects[72, 107] in detail. Thus, even a few rejections could result in a widely different estimate thanthe best possible estimate i.e. situation with no rejections applied whereas the simulations werebased on a known cylindrically symmetric tensor which simply models a single orientationfiber population. The rapid deterioration of FE also explains the swift decline of the streamlinetractography [57, 203] results shown in Fig. II.5 with even a small number of rejections.
A clinically relevant question is, if a repeated acquisition tolerates the incremental data rejec-tions better than a single acquisition with twice as many non-collinear diffusion gradients? Asboth would require the same acquisition time, but the latter could perhaps allow the usage of amore sophisticated models [110, 117, 211, 221] in addition to the simple tensor. However, inclinical settings where scanning times are a limited supply, it is also necessary to consider howlikely the experiment is to succeed at the first attempt as many different MRI sequences aregenerally acquired sequentially and repeating the whole examination might not be feasible.This was investigated with the neonatal group B with two acquisitions of the same vendorspecific 15 diffusion gradient directions. These results were, of course, affected by the subjectmotion corrections [89–94] resulting in small changes between the diffusion gradient vectors[93]. In the first test B1, rejections were applied to the two sets of 15 DWIs successively,meaning that the first set was fully rejected before the first volume of the second was excluded.In the second test B2, rejections were allowed on both acquisitions at the same time. Intuitively,as long as the other set was intact, the estimates stayed relatively stable whereas the secondtest produced progressively much worse results (Supplementary Fig II.2). Notably, this wasnot seen with the worst EP based sub-schemes, further motivating the usage of the CN metric.
5.3 Neurocognitive correlations of tensor derived measures
5.3.1 Visual abilities of neonatal subjects
An investigation into the visual abilities of the infants and their white matter characteristicsfound a significant correlation between FA values and the VF score. Previous studies havesuggested that the infants’ visual functions would correlate with the white matter structuresassociated with the optic radiation [24, 26]. The findings presented in Study III, however,encompassed the whole white matter volume of the infant brain thus suggesting that theoverall maturity of the brain could be lower with infants who had lower scores in visuomotoricor visual reasoning tasks [212, 213]. Although the used method, TBSS [180], has been criticised[185] due to its pitfalls in correctly projecting white matter structures onto the FA skeletonand affine multi-subject image registration problems [84, 207, 222], these findings were also
34

confirmed using ROI regions within the original subject image spaces. The previous studies[24, 26] also agreed well with the GB test. Ae significant correlation between white matterstructures and GB score was recorded in a brain region which is likely to contain the opticradiation (Figure 4.7).
5.3.2 White matter changes in bilingual adults
As for the early and late bilingual adult experiments of Study IV i.e. investigation if the age ofL2 acquisition [18, 217] results in significant differences within the white matter, the standardTBSS [180, 185] inspection did not find any differences between the groups. The tractwiserestricted TBSS, however, was able to disclose differences in the anterior part of the IFOFand when the tractwise mean FA, MD, and RD values were compared in the mixed modelanalysis showing the mean FA was significantly higher in the left long segment of the arcuatefasciculus whereas the mean MD was significantly lower in the right posterior segment for theearly bilinguals [41, 204, 218]. While all prudent measures were undertaken to exclude falsediscoveries, these findings need to be confirmed in independent datasets to better understandtheir neurobiological meaning [15, 17, 19, 20, 217].
5.4 Future aspects
SOLID in Study I could be improved by introducing the within-DWI information along withangular neighbourhood matching [174]. As these potentially could decrease the current errorproneness toward subject motion between DWIs and allow the use of SOLID with extremelyhigh b-value research studies as well [12]. The data / certainty principle driven framework forthe robust tensor model estimations presented here could also be extended for other diffusionMRI models [109, 110, 211, 223] utilizing other model fitting algorithms [116, 138, 139, 141]including quality control with the condition number [118, 161].
The designed CN metric for post-estimation quality control of diffusion MRI estimates in StudyII remains to be refined into a readily usable tool and, as discussed previously, the presentedcondition number is exact only for the LLS estimator. In Study I, preliminary tests were madewith the IWLLS [131] condition number but the theoretical aspects were not investigated indetail. As similar error propagation measures can likely be defined for non-linear [133, 134]and maximum likelihood estimators [138, 141] as well, investigating the error propagation insuch data processing pipelines will be one of the topics of future studies.
The neonatal study III could be re-iterated with these updated tools, not only to confirm FAfindings but to compliment them with MD, RD, and other such as Westin measures [192]. Thelatter could also be applied in the bilingual experiments as they can reveal details from thedifferent symmetries of the diffusion tensor. While the neonatal experiment was based onsparsely sampled data, building tractograms [21, 24, 57] might be feasible at least with thesubjects with multiple successful acquisitions to get tractwise statistics instead of error proneTBSS analysis [180, 185].
35

The tractogram analyses used in the bilingual study could also be improved with a moreaccurate diffusion model, such as spherical deconvolution [110, 117, 211, 221, 224] that coulddistinguish crossing fibers and instead of calculating the average metrics of these white mattermodels, an along tract analysis [79] could be performed. As both, the bilingual experiment andthe neonatal, are currently rebooting in a form of new data acquisition with multiple b-valuesthat allow the usage of the kurtosis tensor model [40, 62, 63, 104–106, 220, 225] re-iteratingthis same dataset might not be necessary as these new measurements will likely clarify themodelling issues faced in Studies III and IV.
Finally, the measurement error could be estimated using bootstrapping [179, 203, 216, 226]approaches to provide distributions for the estimated tensor derived values such as FA. Whilethe mean FA of two different groups might be the same the underlying distribution couldreveal that the variance of FAs for one of the groups might be significantly different. Asthese estimate errors are not commonly reported in diffusion weighted MRI studies, it couldbe that their theoretical readiness has not been sufficient and further investigations on howrobustly estimated models should be bootstrapped are needed before they can be applied inmore practical studies such as III or IV.
36
6 Conclusion
In this thesis, a fast and accurate method for disclosing artefactual diffusion MRI data, coinedSOLID, was developed along with a framework to use the found outliers as estimates for datauncertainty during model estimation (I). This was further accompanied with a quality controlmethod (II) that could reveal rotational variant errors in the diffusion tensor model emergingfrom the information loss due to necessary data augmentations to exclude subject motionfrom the measurements. Methods were investigated in theory, evaluated with simulations andvalidated with newborn and adult human data.
The SOLID-informed model estimation supports the convergence of the iterative estimators asit does not completely exclude individual measurements but downweights them according totheir degree of uncertainty. Comprehensive simulations covering a range of clinically plausiblesituations showed that the sensitivity and the specificity of SOLID were comparable or better topreviously published tools but with less complexity and evading the need for time-consumingmodel estimation and signal prediction. SOLID was validated with manually labelled outliersfrom a unique set of 54 neonatal subjects which also demonstrated its versatility in largepopulation studies.
The problem with the data rejection or downweighting is that the original LLS problem couldbecome ill-posed due to the increased condition number of the design matrix inversion (II).This, as well, was first investigated in theory with simulations and then applied to human MRImeasurements. This does not mean that outliers should not be excluded or the subject motioncorrected but that after they have been done, the condition number should be evaluated toensure comparability within a subject and across all of the subjects in population studies.
Finally, to motivate the necessity of such tools, the power of robust diffusion MRI analysis wasshown in two clinical studies that found novel correlations between the brain white matterstructures and newborn’s visual abilities (III) or adults’ language skills (IV).
37
References
[1] P. Basser, J. Mattiello, R. Turner, D. Le Bihan, Diffusion tensor echo-planar imaging ofhuman brain, in: Proceedings of the SMRM, Vol. 584, 1993.
[2] P. J. Basser, J. Mattiello, D. LeBihan, MR diffusion tensor spectroscopy and imaging,Biophys J 66 (1994) 259–267.
[3] P. J. Basser, J. Mattiello, D. LeBihan, Estimation of the effective self-diffusion tensor fromthe NMR spin echo, J Magn Reson, Series B 103 (1994) 247–254.
[4] P. J. Basser, C. Pierpaoli, Microstructural and physiological features of tissues elucidatedby quantitative-diffusion-tensor MRI, J Magn Reson 111 (1996) 209–219.
[5] P. J. Basser, D. K. Jones, Diffusion-tensor MRI: theory, experimental design and dataanalysis–a technical review, NMR Biomed 15 (2002) 456–467.
[6] M. A. Koch, D. G. Norris, M. Hund-Georgiadis, An investigation of functional andanatomical connectivity using magnetic resonance imaging, NeuroImage 16 (2002) 241–250.
[7] B. Horwitz, The elusive concept of brain connectivity, NeuroImage 19 (2003) 466–470.[8] A. T. Toosy, O. Ciccarelli, G. J. Parker, C. A. Wheeler-Kingshott, D. H. Miller, A. J.
Thompson, Characterizing function–structure relationships in the human visual systemwith functional MRI and diffusion tensor imaging, NeuroImage 21 (2004) 1452–1463.
[9] M. F. Glasser, J. K. Rilling, DTI tractography of the human brain’s language pathways,Cerebral Cortex 18 (2008) 2471–2482.
[10] G. Gong, Y. He, L. Concha, C. Lebel, D. W. Gross, A. C. Evans, C. Beaulieu, Mappinganatomical connectivity patterns of human cerebral cortex using in vivo diffusion tensorimaging tractography, Cerebral Cortex 19 (2008) 524–536.
[11] D. K. Jones, Studying connections in the living human brain with diffusion MRI, Cortex44 (2008) 936–952.
[12] Q. Fan, et al., MGH–USC Human Connectome Project datasets with ultra-high b-valuediffusion MRI, NeuroImage 124 (2016) 1108–1114.
[13] A. Mechelli, J. T. Crinion, U. Noppeney, J. O’doherty, J. Ashburner, R. S. Frackowiak, C. J.Price, Neurolinguistics: structural plasticity in the bilingual brain, Nature 431 (2004)757–757.
[14] D. Leclercq, H. Duffau, C. Delmaire, L. Capelle, P. Gatignol, M. Ducros, J. Chiras,S. Lehéricy, Comparison of diffusion tensor imaging tractography of language tracts andintraoperative subcortical stimulations, J Neurosurg 112 (2010) 503–511.
[15] S. G. Mohades, E. Struys, P. Van Schuerbeek, K. Mondt, P. Van De Craen, R. Luypaert, DTIreveals structural differences in white matter tracts between bilingual and monolingualchildren, Brain Research 1435 (2012) 72–80.
[16] A. A. Schlegel, J. J. Rudelson, U. T. Peter, White matter structure changes as adults learna second language, J Cogn Neurosci 24 (2012) 1664–1670.
38
[17] D. López-Barroso, M. Catani, P. Ripollés, F. Dell’Acqua, A. Rodríguez-Fornells, R. de Diego-Balaguer, Word learning is mediated by the left arcuate fasciculus, Proc Natl Acad Sci110 (2013) 13168–13173.
[18] P. Li, J. Legault, K. A. Litcofsky, Neuroplasticity as a function of second language learning:anatomical changes in the human brain, Cortex 58 (2014) 301–324.
[19] S. G. Mohades, P. Van Schuerbeek, Y. Rosseel, P. Van De Craen, R. Luypaert, C. Baeken,White-matter development is different in bilingual and monolingual children: a longitu-dinal DTI study, PloS one 10 (2015) e0117968.
[20] C. Pliatsikas, E. Moschopoulou, J. D. Saddy, The effects of bilingualism on the whitematter structure of the brain, Proc Natl Acad Sci 112 (2015) 1334–1337.
[21] S. C. Partridge, et al., Diffusion tensor imaging: serial quantitation of white matter tractmaturity in premature newborns, NeuroImage 22 (2004) 1302–1314.
[22] J. I. Berman, P. Mukherjee, S. C. Partridge, S. P. Miller, D. M. Ferriero, A. J. Barkovich,D. B. Vigneron, R. G. Henry, Quantitative diffusion tensor MRI fiber tractography ofsensorimotor white matter development in premature infants, NeuroImage 27 (2005)862–871.
[23] V. J. Schmithorst, M. Wilke, B. J. Dardzinski, S. K. Holland, Cognitive functions correlatewith white matter architecture in a normal pediatric population: a diffusion tensor MRIstudy, Hum Brain Mapp 26 (2005) 139–147.
[24] L. Bassi, et al., Probabilistic diffusion tractography of the optic radiations and visualfunction in preterm infants at term equivalent age, Brain 131 (2008) 573–582.
[25] K. Pannek, S. M. Scheck, P. B. Colditz, R. N. Boyd, S. E. Rose, Magnetic resonance diffusiontractography of the preterm infant brain: a systematic review, Dev Med Child Neurol 56(2014) 113–124.
[26] M. Groppo, et al., Development of the optic radiations and visual function after prematurebirth, Cortex 56 (2014) 30–37.
[27] H. Sakuma, Y. Nomura, K. Takeda, T. Tagami, T. Nakagawa, Y. Tamagawa, Y. Ishii,T. Tsukamoto, Adult and neonatal human brain: diffusional anisotropy and myelinationwith diffusion-weighted MR imaging., Radiology 180 (1991) 229–233.
[28] V. J. Schmithorst, M. Wilke, B. J. Dardzinski, S. K. Holland, Correlation of white matterdiffusivity and anisotropy with age during childhood and adolescence: a cross-sectionaldiffusion-tensor MR imaging study, Radiology 222 (2002) 212–218.
[29] O. Abe, S. Aoki, N. Hayashi, H. Yamada, A. Kunimatsu, H. Mori, T. Yoshikawa, T. Okubo,K. Ohtomo, Normal aging in the central nervous system: quantitativeMR diffusion-tensoranalysis, Neurobiol Aging 23 (2002) 433–441.
[30] M. Moseley, Diffusion tensor imaging and aging–a review, NMR Biomed 15 (2002) 553–560.
[31] E. V. Sullivan, A. Pfefferbaum, Diffusion tensor imaging in normal aging and neuropsy-chiatric disorders, Eur J Radiol 45 (2003) 244–255.
[32] J. A. Helpern, V. Adisetiyo, M. F. Falangola, C. Hu, A. Di Martino, K. Williams, F. X. Castel-lanos, J. H. Jensen, Preliminary evidence of altered gray and white matter microstructuraldevelopment in the frontal lobe of adolescents with attention-deficit hyperactivity disor-der: a diffusional kurtosis imaging study, J Magn Reson Imaging 33 (2011) 17–23.
39

[33] Q. Dong, R. C. Welsh, T. L. Chenevert, R. C. Carlos, P. Maly-Sundgren, D. M. Gomez-Hassan, S. K. Mukherji, Clinical applications of diffusion tensor imaging, J Magn ResonImaging 19 (2004) 6–18.
[34] P. Sundgren, Q. Dong, D. Gomez-Hassan, S. Mukherji, P. Maly, R. Welsh, Diffusion tensorimaging of the brain: review of clinical applications, Neuroradiology 46 (2004) 339–350.
[35] M. Moseley, J. Kucharczyk, J. Mintorovitch, Y. Cohen, J. Kurhanewicz, N. Derugin,H. Asgari, D. Norman, Diffusion-weighted MR imaging of acute stroke: correlation withT2-weighted and magnetic susceptibility-enhanced MR imaging in cats., AJNR Am JNeuroradiol 11 (1990) 423–429.
[36] P. van Gelderen, M. H. de Vleeschouwer, D. DesPres, J. Pekar, P. van Zijl, C. T. Moonen,Water diffusion and acute stroke, Magn Reson Med 31 (1994) 154–163.
[37] I. Agartz, J. L. Andersson, S. Skare, Abnormal brain white matter in schizophrenia: adiffusion tensor imaging study, Neuroreport 12 (2001) 2251–2254.
[38] C. H. Sotak, The role of diffusion tensor imaging in the evaluation of ischemic braininjury–a review, NMR Biomed 15 (2002) 561–569.
[39] J. Neil, J. Miller, P. Mukherjee, P. S. Hüppi, Diffusion tensor imaging of normal andinjured developing human brain-a technical review, NMR Biomed 15 (2002) 543–552.
[40] Y. Gao, Y. Zhang, C.-S. Wong, P.-M. Wu, Z. Zhang, J. Gao, D. Qiu, B. Huang, Diffusionabnormalities in temporal lobes of children with temporal lobe epilepsy: a preliminarydiffusional kurtosis imaging study and comparison with diffusion tensor imaging, NMRBiomed 25 (2012) 1369–1377.
[41] S. J. Forkel, M. Thiebaut de Schotten, F. Dell’Acqua, L. Kalra, D. G. Murphy, S. C. Williams,M. Catani, Anatomical predictors of aphasia recovery: a tractography study of bilateralperisylvian language networks, Brain 137 (2014) 2027–2039.
[42] H. Y. Carr, E. M. Purcell, Effects of diffusion on free precession in nuclear magneticresonance experiments, Physical Review 94 (1954) 630.
[43] H. C. Torrey, Bloch equations with diffusion terms, Physical Review 104 (1956) 563.[44] E. O. Stejskal, J. E. Tanner, Spin diffusion measurements: spin echoes in the presence of
a time-dependent field gradient, J Chem Phys 42 (1965) 288–292.[45] J. E. Tanner, E. O. Stejskal, Restricted self-diffusion of protons in colloidal systems by the
pulsed-gradient, spin-echo method, J Chem Phys 49 (1968) 1768–1777.[46] D. Le Bihan, P. J. Basser, Molecular diffusion and nuclear magnetic resonance, Diffusion
and perfusion magnetic resonance imaging (1995) 5–17.[47] P. J. Basser, Inferring microstructural features and the physiological state of tissues from
diffusion-weighted images, NMR Biomed 8 (1995) 333–344.[48] M. Cercignani, M. A. Horsfield, The physical basis of diffusion-weighted MRI, J Neurol
Sci 186 (2001) S11–S14.[49] C. Beaulieu, The basis of anisotropic water diffusion in the nervous system–a technical
review, NMR Biomed 15 (2002) 435–455.[50] R. Bammer, Basic principles of diffusion-weighted imaging, Eur J Radiol 45 (2003) 169–
184.[51] Z.-P. Liang, P. C. Lauterbur, Principles of magnetic resonance imaging: a signal processing
perspective, SPIE Optical Engineering Press, 2000.[52] D. K. Jones, Diffusion mri, Oxford University Press, 2010.
40

[53] G. Cleveland, D. Chang, C. Hazlewood, H. Rorschach, Nuclear magnetic resonance mea-surement of skeletal muscle: anisotrophy of the diffusion coefficient of the intracellularwater, Biophys J 16 (1976) 1043–1053.
[54] M. E. Moseley, Y. Cohen, J. Kucharczyk, J. Mintorovitch, H. Asgari, M. Wendland, J. Tsu-ruda, D. Norman, Diffusion-weighted MR imaging of anisotropic water diffusion in catcentral nervous system., Radiology 176 (1990) 439–445.
[55] T. L. Chenevert, J. A. Brunberg, J. G. Pipe, Anisotropic diffusion in human white matter:demonstration with MR techniques in vivo., Radiology 177 (1990) 401–405.
[56] M. E. Moseley, J. Kucharczyk, H. S. Asgari, D. Norman, Anisotropy in diffusion-weightedMRI, Magn Reson Med 19 (1991) 321–326.
[57] P. J. Basser, S. Pajevic, C. Pierpaoli, J. Duda, A. Aldroubi, In vivo fiber tractography usingDT-MRI data, Magn Reson Med 44 (2000) 625–632.
[58] M. A. Horsfield, D. K. Jones, Applications of diffusion-weighted and diffusion tensorMRI to white matter diseases–a review, NMR Biomed 15 (2002) 570–577.
[59] J. Hiltunen, T. Suortti, S. Arvela, M. Seppä, R. Joensuu, R. Hari, Diffusion tensor imagingand tractography of distal peripheral nerves at 3 T, Clin Neurophysiol 116 (2005) 2315–2323.
[60] R. Brown, XXVII. A brief account of microscopical observations made in the months ofJune, July and August 1827, on the particles contained in the pollen of plants; and onthe general existence of active molecules in organic and inorganic bodies, PhilosophicalMagazine Series 2 4 (1828) 161–173.
[61] A. Einstein, Investigations on the Theory of the Brownian Movement, Courier Corpora-tion, 1905.
[62] J. H. Jensen, J. A. Helpern, A. Ramani, H. Lu, K. Kaczynski, Diffusional kurtosis imaging:The quantification of non-gaussian water diffusion by means of magnetic resonanceimaging, Magn Reson Med 53 (2005) 1432–1440.
[63] J. H. Jensen, J. A. Helpern, MRI quantification of non-Gaussian water diffusion by kurtosisanalysis, NMR Biomed 23 (2010) 698–710.
[64] D. L. Thomas, M. F. Lythgoe, G. S. Pell, F. Calamante, R. J. Ordidge, The measurement ofdiffusion and perfusion in biological systems using magnetic resonance imaging, PhysMed Biol 45 (2000) R97.
[65] R. Luypaert, S. Boujraf, S. Sourbron, M. Osteaux, Diffusion and perfusion MRI: basicphysics, Eur J Radiol 38 (2001) 19–27.
[66] C. P. T., Principles of nuclear magnetic resonance microscopy, Oxford University Presson Demand, 1993.
[67] C. P. Slichter, Principles of magnetic resonance, Vol. 1, Springer Science & BusinessMedia, 2013.
[68] W. Van Hecke, L. Emsell, S. Sunaert, Diffusion Tensor Imaging: A Practical Handbook,Springer, 2015.
[69] H. C. Berg, Random walks in biology, Princeton University Press, 1993.[70] D. Le Bihan, C. Poupon, A. Amadon, F. Lethimonnier, Artifacts and pitfalls in diffusion
MRI, J Magn Reson Imaging 24 (2006) 478–488.[71] C. Pierpaoli, Artifacts in diffusion MRI, Diffusion MRI: Theory, methods, and applications
(2010) 303–317.
41

[72] D. K. Jones, M. Cercignani, Twenty-five pitfalls in the analysis of diffusion MRI data,NMR Biomed 23 (2010) 803–820.
[73] H. Gudbjartsson, S. Patz, The Rician distribution of noisy MRI data, Magn Reson Med 34(1995) 910–914.
[74] D. K. Jones, P. J. Basser, "Squashing peanuts and smashing pumpkins": How noise distortsdiffusion-weighted MR data, Magn Reson Med 52 (2004) 979–993.
[75] S. Aja-Fernández, C. Alberola-López, C.-F. Westin, Noise and signal estimation in magni-tude MRI and Rician distributed images: a LMMSE approach, IEEE Trans Image Process17 (2008) 1383–1398.
[76] P. Coupé, J. V. Manjón, E. Gedamu, D. Arnold, M. Robles, D. L. Collins, Robust Riciannoise estimation for MR images, Med Image Anal 14 (2010) 483–493.
[77] I. I. Maximov, E. Farrher, F. Grinberg, N. J. Shah, Spatially variable Rician noise inmagnetic resonance imaging, Med Image Anal 16 (2012) 536–548.
[78] S. B. Vos, C. M. Tax, P. R. Luijten, S. Ourselin, A. Leemans, M. Froeling, The importanceof correcting for signal drift in diffusion MRI, Magn Reson Med 77 (2017) 285–299.
[79] D. Perrone, J. Aelterman, A. Pižurica, B. Jeurissen, W. Philips, A. Leemans, The effect ofGibbs ringing artifacts on measures derived from diffusion MRI, NeuroImage 120 (2015)441–455.
[80] J. Veraart, E. Fieremans, I. O. Jelescu, F. Knoll, D. S. Novikov, Gibbs ringing in diffusionMRI, Magn Reson Med 76 (2016) 301–314.
[81] A. L. Alexander, J. S. Tsuruda, D. L. Parker, Elimination of eddy current artifacts indiffusion-weighted echo-planar images: the use of bipolar gradients, Magn Reson Med38 (1997) 1016–1021.
[82] P. Jezzard, A. S. Barnett, C. Pierpaoli, Characterization of and correction for eddy currentartifacts in echo planar diffusion imaging, Magn Reson Med 39 (1998) 801–812.
[83] M. E. Bastin, Correction of eddy current-induced artefacts in diffusion tensor imagingusing iterative cross-correlation, Magn Reson Imaging 17 (1999) 1011–1024.
[84] S. Mohammadi, H. E. Möller, H. Kugel, D. K. Müller, M. Deppe, Correcting eddy currentand motion effects by affine whole-brain registrations: Evaluation of three-dimensionaldistortions and comparison with slicewise correction, Magn Reson Med 64 (2010) 1047–1056.
[85] J. L. Andersson, S. Skare, A model-based method for retrospective correction of geometricdistortions in diffusion-weighted EPI, NeuroImage 16 (2002) 177–199.
[86] Y. P. Du, X. Joe Zhou, M. A. Bernstein, Correction of concomitant magnetic field-inducedimage artifacts in nonaxial echo-planar imaging, Magn Reson Med 48 (2002) 509–515.
[87] J. L. Andersson, S. Skare, J. Ashburner, How to correct susceptibility distortions in spin-echo echo-planar images: application to diffusion tensor imaging, NeuroImage 20 (2003)870–888.
[88] D. Holland, J. M. Kuperman, A. M. Dale, Efficient correction of inhomogeneous staticmagnetic field-induced distortion in Echo Planar Imaging, NeuroImage 50 (2010) 175–183.
[89] A. W. Anderson, J. C. Gore, Analysis and correction of motion artifacts in diffusionweighted imaging, Magn Reson Med 32 (1994) 379–387.
[90] G. Rohde, A. Barnett, P. Basser, S. Marenco, C. Pierpaoli, Comprehensive approach for
42

correction of motion and distortion in diffusion-weighted MRI, Magn Reson Med 51(2004) 103–114.
[91] J. Hiltunen, R. Hari, V. Jousmäki, K. Müller, R. Sepponen, R. Joensuu, Quantificationof mechanical vibration during diffusion tensor imaging at 3 T, NeuroImage 32 (2006)93–103.
[92] S. Jiang, H. Xue, S. Counsell, M. Anjari, J. Allsop, M. Rutherford, D. Rueckert, J. V. Hajnal,Diffusion tensor imaging (DTI) of the brain in moving subjects: application to in-uterofetal and ex-utero studies, Magn Reson Med 62 (2009) 645–655.
[93] A. Leemans, D. K. Jones, The B-matrix must be rotated when correcting for subjectmotion in DTI data, Magn Reson Med 61 (2009) 1336–1349.
[94] S. Ben-Amitay, D. K. Jones, Y. Assaf, Motion correction and registration of high b-valuediffusion weighted images, Magn Reson Med 67 (2012) 1694–1702.
[95] J. Habib, D. P. Auer, P. S. Morgan, A quantitative analysis of the benefits of cardiac gatingin practical diffusion tensor imaging of the brain, Magn Reson Med 63 (2010) 1098–1103.
[96] C. Pierpaoli, P. J. Basser, Toward a quantitative assessment of diffusion anisotropy, MagnReson Med 36 (1996) 893–906.
[97] C. Pierpaoli, P. Jezzard, P. J. Basser, A. Barnett, G. Di Chiro, Diffusion tensor MR imagingof the human brain., Radiology 201 (1996) 637–648.
[98] S. Pajevic, et al., Color schemes to represent the orientation of anisotropic tissues fromdiffusion tensor data: application to white matter fiber tract mapping in the human brain,Magn Reson Med 42 (1999) 526–540.
[99] K. M. Hasan, P. J. Basser, D. L. Parker, A. L. Alexander, Analytical computation of theeigenvalues and eigenvectors in DT-MRI, J Magn Reson 152 (2001) 41–47.
[100] D. Le Bihan, P. Van Zijl, From the diffusion coefficient to the diffusion tensor, NMRBiomed 15 (2002) 431–434.
[101] Y. Masutani, S. Aoki, O. Abe, N. Hayashi, K. Otomo, MR diffusion tensor imaging: recentadvance and new techniques for diffusion tensor visualization, Eur J Radiol 46 (2003)53–66.
[102] D. K. Jones, Determining and visualizing uncertainty in estimates of fiber orientationfrom diffusion tensor MRI, Magn Reson Med 49 (2003) 7–12.
[103] P. B. Kingsley, Introduction to diffusion tensor imaging mathematics: Part III. Tensorcalculation, noise, simulations, and optimization, Concepts in Magnetic Resonance PartA 28 (2006) 155–179.
[104] D. H. Poot, J. Arnold, E. Achten, M. Verhoye, J. Sijbers, Optimal experimental design fordiffusion kurtosis imaging, IEEE Trans Med Imag 29 (2010) 819–829.
[105] A. Tabesh, J. H. Jensen, B. A. Ardekani, J. A. Helpern, Estimation of tensors and tensor-derived measures in diffusional kurtosis imaging, Magn Reson Med 65 (2011) 823–836.
[106] E. Fieremans, J. H. Jensen, J. A. Helpern, White matter characterization with diffusionalkurtosis imaging, NeuroImage 58 (2011) 177–188.
[107] A. L. Alexander, K. M. Hasan, M. Lazar, J. S. Tsuruda, D. L. Parker, Analysis of partialvolume effects in diffusion-tensor MRI, Magn Reson Med 45 (2001) 770–780.
[108] D. S. Tuch, M. Wiegell, T. Reese, J. Belliveau, V. Wedeen, Measuring cortico-corticalconnectivity matrices with diffusion spectrum imaging, in: Proceedings of InternationalSociety of Magnetic Resonance in Medicine, Vol. 502, 2001.
43
[109] D. S. Tuch, Q-ball imaging, Magn Reson Med 52 (2004) 1358–1372.[110] J.-D. Tournier, F. Calamante, D. G. Gadian, A. Connelly, Direct estimation of the fiber
orientation density function from diffusion-weighted MRI data using spherical deconvo-lution, NeuroImage 23 (2004) 1176–1185.
[111] Y. Assaf, P. J. Basser, Composite hindered and restricted model of diffusion (CHARMED)MR imaging of the human brain, NeuroImage 27 (2005) 48–58.
[112] M. A. Sharman, J. Cohen-Adad, M. Descoteaux, A. Messé, H. Benali, S. Lehericy, Impactof outliers on diffusion tensor and Q-ball imaging: Clinical implications and correctionstrategies, J Magn Reson Imaging 33 (2011) 1491–1502.
[113] M. Descoteaux, R. Deriche, D. Le Bihan, J.-F. Mangin, C. Poupon, Multiple q-shell diffusionpropagator imaging, Med Image Anal 15 (2011) 603–621.
[114] J.-D. Tournier, S. Mori, A. Leemans, Diffusion tensor imaging and beyond, Magn ResonMed 65 (2011) 1532–1556.
[115] H. Zhang, T. Schneider, C. A. Wheeler-Kingshott, D. C. Alexander, NODDI: practical invivo neurite orientation dispersion and density imaging of the human brain, NeuroImage61 (2012) 1000–1016.
[116] J. L. Andersson, S. N. Sotiropoulos, Non-parametric representation and prediction ofsingle-and multi-shell diffusion-weighted MRI data using Gaussian processes, NeuroIm-age 122 (2015) 166–176.
[117] T. Roine, B. Jeurissen, D. Perrone, J. Aelterman, W. Philips, A. Leemans, J. Sijbers,Informed constrained spherical deconvolution (iCSD), Med Image Anal 24 (2015) 269–281.
[118] P. Batchelor, D. Atkinson, D. Hill, F. Calamante, A. Connelly, Anisotropic noise propaga-tion in diffusion tensor MRI sampling schemes, Magn Reson Med 49 (2003) 1143–1151.
[119] T. E. Behrens, M. W. Woolrich, M. Jenkinson, H. Johansen-Berg, R. G. Nunes, S. Clare,P. M. Matthews, J. M. Brady, S. M. Smith, Characterization and propagation of uncertaintyin diffusion-weighted MR imaging, Magn Reson Med 50 (2003) 1077–1088.
[120] A. Heemskerk, A. Leemans, A. Plaisier, K. Pieterman, M. Lequin, J. Dudink, Acquisitionguidelines and quality assessment tools for analyzing neonatal diffusion tensor MRI data,AJNR Am J Neuroradiol 34 (2013) 1496–1505.
[121] D. J. Larkman, J. V. Hajnal, A. H. Herlihy, G. A. Coutts, I. R. Young, G. Ehnholm, Use ofmulticoil arrays for separation of signal from multiple slices simultaneously excited, JMagn Reson Imaging 13 (2001) 313–317.
[122] D. A. Feinberg, S. Moeller, S. M. Smith, E. Auerbach, S. Ramanna, M. F. Glasser, K. L.Miller, K. Ugurbil, E. Yacoub, Multiplexed echo planar imaging for sub-second wholebrain FMRI and fast diffusion imaging, PloS one 5 (2010) e15710.
[123] K. Setsompop, J. Cohen-Adad, B. Gagoski, T. Raij, A. Yendiki, B. Keil, V. J. Wedeen, L. L.Wald, Improving diffusion MRI using simultaneous multi-slice echo planar imaging,NeuroImage 63 (2012) 569–580.
[124] F. Maes, A. Collignon, D. Vandermeulen, G. Marchal, P. Suetens, Multimodality imageregistration by maximization of mutual information, IEEE Trans Med Imag 16 (1997)187–198.
[125] Y. Bai, D. C. Alexander, Model-based registration to correct for motion between acquisi-
44

tions in diffusion MR imaging, in: Biomedical Imaging: From Nano to Macro. ISBI. 5thIEEE International Symposium on, IEEE, 2008, pp. 947–950.
[126] C. G. Koay, L.-C. Chang, J. D. Carew, C. Pierpaoli, P. J. Basser, A unifying theoreticaland algorithmic framework for least squares methods of estimation in diffusion tensorimaging, J Magn Reson 182 (2006) 115–125.
[127] P. W. Holland, R. E. Welsch, Robust regression using iteratively reweighted least-squares,Commun Stat Theory Methods 6 (1977) 813–827.
[128] P. J. Bickel, Using residuals robustly I: Tests for heteroscedasticity, nonlinearity, TheAnnals of Statistics (1978) 266–291.
[129] P. Meer, D. Mintz, A. Rosenfeld, D. Y. Kim, Robust regression methods for computervision: A review, Int J Comput Vis 6 (1991) 59–70.
[130] J.-F. Mangin, C. Poupon, C. Clark, D. Le Bihan, I. Bloch, Distortion correction and robusttensor estimation for MR diffusion imaging, Med Image Anal 6 (2002) 191–198.
[131] J. Veraart, J. Sijbers, S. Sunaert, A. Leemans, B. Jeurissen, Weighted linear least squaresestimation of diffusion MRI parameters: strengths, limitations, and pitfalls, NeuroImage81 (2013) 335–346.
[132] Q. Collier, J. Veraart, B. Jeurissen, A. J. den Dekker, J. Sijbers, Iterative reweighted linearleast squares for accurate, fast, and robust estimation of diffusion magnetic resonanceparameters, Magn Reson Med 73 (2015) 2174–2184.
[133] L.-C. Chang, D. K. Jones, C. Pierpaoli, RESTORE: robust estimation of tensors by outlierrejection, Magn Reson Med 53 (2005) 1088–1095.
[134] L.-C. Chang, L. Walker, C. Pierpaoli, Informed RESTORE: a method for robust estimationof diffusion tensor from low redundancy datasets in the presence of physiological noiseartifacts, Magn Reson Med 68 (2012) 1654–1663.
[135] K. Pannek, D. Raffelt, C. Bell, J. L. Mathias, S. E. Rose, HOMOR: higher order modeloutlier rejection for high b-value MR diffusion data, NeuroImage 63 (2012) 835–842.
[136] C. M. Tax, W. M. Otte, M. A. Viergever, R. M. Dijkhuizen, A. Leemans, REKINDLE:robust extraction of kurtosis INDices with linear estimation, Magn Reson Med 73 (2015)794–808.
[137] J. Sijbers, A. Den Dekker, Maximum likelihood estimation of signal amplitude and noisevariance from MR data, Magn Reson Med 51 (2004) 586–594.
[138] J. L. Andersson, Maximum a posteriori estimation of diffusion tensor parameters using aRician noise model: why, how and but, NeuroImage 42 (2008) 1340–1356.
[139] J. Veraart, W. Van Hecke, J. Sijbers, Constrained maximum likelihood estimation of thediffusion kurtosis tensor using a Rician noise model, Magn Reson Med 66 (2011) 678–686.
[140] A. Ghosh, T. Milne, R. Deriche, Constrained diffusion kurtosis imaging using ternaryquartics & MLE, Magn Reson Med 71 (2014) 1581–1591.
[141] J. Liu, D. Gasbarra, J. Railavo, Fast estimation of diffusion tensors under Rician noise bythe EM algorithm, journal of J Neurosci methods 257 (2016) 147–158.
[142] P. Mansfield, Multi-planar image formation using NMR spin echoes, Journal of PhysicsC: Solid State Physics 10 (1977) L55.
[143] M. K. Stehling, et al., Echo-planar imaging: magnetic resonance imaging in a fraction ofa second, Science 254 (1991) 43–50.
45
[144] K. P. Pruessmann, et al., SENSE: sensitivity encoding for fast MRI, Magn Reson Med 42(1999) 952–962.
[145] R. Bammer, S. L. Keeling, M. Augustin, K. P. Pruessmann, R. Wolf, R. Stollberger, H.-P.Hartung, F. Fazekas, Improved diffusion-weighted single-shot echo-planar imaging (EPI)in stroke using sensitivity encoding (SENSE), Magn Reson Med 46 (2001) 548–554.
[146] M. A. Griswold, P. M. Jakob, R. M. Heidemann, M. Nittka, V. Jellus, J. Wang, B. Kiefer,A. Haase, Generalized autocalibrating partially parallel acquisitions (GRAPPA), MagnReson Med 47 (2002) 1202–1210.
[147] H. Jiang, P. C. Van Zijl, J. Kim, G. D. Pearlson, S. Mori, DtiStudio: resource programfor diffusion tensor computation and fiber bundle tracking, Comput Methods ProgramsBiomed 81 (2006) 106–116.
[148] D. Morris, R. Nossin-Manor, M. J. Taylor, J. G. Sled, Preterm neonatal diffusion processingusing detection and replacement of outliers prior to resampling, Magn Reson Med 66(2011) 92–101.
[149] Z. Zhou, et al., Automated artifact detection and removal for improved tensor estimationin motion-corrupted DTI data sets using the combination of local binary patterns and2D partial least squares, Magnetic resonance imaging 29 (2011) 230–242.
[150] D. Scelfo, L. Biagi, M. Costagli, M. Tosetti, Automated detection, evaluation and removalof DWI-related artifacts, in: 20th Annual Meeting of Intl Soc Mag Reson Med, 2012, p.3553.
[151] C. B. Lauzon, A. J. Asman, M. L. Esparza, S. S. Burns, Q. Fan, Y. Gao, A. W. Anderson,N. Davis, L. E. Cutting, B. A. Landman, Simultaneous analysis and quality assurance fordiffusion tensor imaging, PloS one 8 (2013) e61737.
[152] I. Oguz, M. Farzinfar, J. Matsui, F. Budin, Z. Liu, G. Gerig, H. J. Johnson, M. Styner,DTIPrep: quality control of diffusion-weighted images, Front Neuroinform 8.
[153] J. L. Andersson, M. S. Graham, E. Zsoldos, S. N. Sotiropoulos, Incorporating outlierdetection and replacement into a non-parametric framework for movement and distortioncorrection of diffusion MR images, NeuroImage 141 (2016) 556–572.
[154] K. Pannek, J. Fripp, J. George, R. Boyd, P. Colditz, S. Rose, Automatic Detection of VolumesAffected by Subvolume Movement, Proceedings 25th Scientific Meeting, InternationalSociety for Magn Reson Med.
[155] A. Leemans, B. Jeurissen, J. Sijbers, D. Jones, ExploreDTI: a graphical toolbox for pro-cessing, analyzing, and visualizing diffusion MR data, in: 17th Annual Meeting of IntlSoc Mag Reson Med, Vol. 209, 2009, p. 3537.
[156] J. Mattiello, P. J. Basser, D. Le Bihan, The b matrix in diffusion tensor echo-planar imaging,Magn Reson Med 37 (1997) 292–300.
[157] T. E. Conturo, R. C. McKinstry, E. Akbudak, B. H. Robinson, Encoding of anisotropicdiffusion with tetrahedral gradients: a general mathematical diffusion formalism andexperimental results, Magn Reson Med 35 (1996) 399–412.
[158] D. Jones, M. Horsfield, A. Simmons, Optimal strategies for measuring diffusion inanisotropic systems by magnetic resonance imaging, Magn Reson Med 42.
[159] N. G. Papadakis, D. Xing, C. L.-H. Huang, L. D. Hall, T. A. Carpenter, A comparativestudy of acquisition schemes for diffusion tensor imaging using MRI, J Magn Reson 137(1999) 67–82.
46
[160] N. G. Papadakis, C. D. Murrills, L. D. Hall, C. L.-H. Huang, T. A. Carpenter, Minimalgradient encoding for robust estimation of diffusion anisotropy, Magn Reson Imaging 18(2000) 671–679.
[161] S. Skare, M. Hedehus, M. E. Moseley, T.-Q. Li, Condition number as a measure of noiseperformance of diffusion tensor data acquisition schemes with MRI, J Magn Reson 147(2000) 340–352.
[162] K. M. Hasan, D. L. Parker, A. L. Alexander, Comparison of gradient encoding schemesfor diffusion-tensor MRI, J Magn Reson Imaging 13 (2001) 769–780.
[163] D. K. Jones, The effect of gradient sampling schemes on measures derived from diffusiontensor MRI: a Monte Carlo study, Magn Reson Med 51 (2004) 807–815.
[164] J. Dubois, C. Poupon, F. Lethimonnier, D. Le Bihan, Optimized diffusion gradient orienta-tion schemes for corrupted clinical DTI data sets, MAGMA 19 (2006) 134–143.
[165] P. A. Cook, M. Symms, P. A. Boulby, D. C. Alexander, Optimal acquisition orders ofdiffusion-weighted MRI measurements, J Magn Reson Imaging 25 (2007) 1051–1058.
[166] K. M. Hasan, D. L. Parker, A. L. Alexander, Magnetic resonance water self-diffusion tensorencoding optimization methods for full brain acquisition, Image Analysis & Stereology21 (2011) 87–96.
[167] E. Caruyer, C. Lenglet, G. Sapiro, R. Deriche, Design of multishell sampling schemeswith uniform coverage in diffusion MRI, Magn Reson Med 69 (2013) 1534–1540.
[168] D. Gasbarra, S. Pajevic, P. J. Basser, Eigenvalues of random matrices with isotropicGaussian noise and the design of Diffusion Tensor Imaging experiments, SIAM J ImagingSci 10 (2017) 1511.
[169] M. Kennis, S. van Rooij, R. Kahn, E. Geuze, A. Leemans, Choosing the polarity of the phase-encoding direction in diffusion MRI: Does it matter for group analysis?, NeuroImage:Clinical 11 (2016) 539–547.
[170] J. Andersson, S. Skare, Image distortion and its correction in diffusion MRI, DiffusionMRI: theory, methods, and applications. Oxford University Press, Oxford (2010) 285–302.
[171] B. C. Lucas, J. A. Bogovic, A. Carass, P.-L. Bazin, J. L. Prince, D. L. Pham, B. A. Land-man, The Java Image Science Toolkit (JIST) for rapid prototyping and publishing ofneuroimaging software, Neuroinformatics 8 (2010) 5–17.
[172] K. Pannek, A. Guzzetta, P. B. Colditz, S. E. Rose, Diffusion MRI of the neonate brain:acquisition, processing and analysis techniques, Pediatr Radiol 42 (2012) 1169–1182.
[173] J. L. Andersson, S. N. Sotiropoulos, An integrated approach to correction for off-resonanceeffects and subject movement in diffusion MR imaging, NeuroImage 125 (2016) 1063–1078.
[174] S. St-Jean, P. Coupé, M. Descoteaux, Non Local Spatial and Angular Matching: Enablinghigher spatial resolution diffusion MRI datasets through adaptive denoising, Med ImageAnal 32 (2016) 115–130.
[175] P. J. Basser, S. Pajevic, Statistical artifacts in diffusion tensor MRI (DT-MRI) caused bybackground noise, Magn Reson Med 44 (2000) 41–50.
[176] A. W. Anderson, Theoretical analysis of the effects of noise on diffusion tensor imaging,Magn Reson Med 46 (2001) 1174–1188.
[177] S. Pajevic, P. J. Basser, Parametric and non-parametric statistical analysis of DT-MRIdata, J Magn Reson 161 (2003) 1–14.
47

[178] A. W. Anderson, Measurement of fiber orientation distributions using high angularresolution diffusion imaging, Magn Reson Med 54 (2005) 1194–1206.
[179] S. Heim, K. Hahn, P. Sämann, L. Fahrmeir, D. Auer, Assessing DTI data quality usingbootstrap analysis, Magn Reson Med 52 (2004) 582–589.
[180] S. M. Smith, et al., Tract-based spatial statistics: voxelwise analysis of multi-subjectdiffusion data, NeuroImage 31 (2006) 1487–1505.
[181] B. A. Landman, J. A. Farrell, C. K. Jones, S. A. Smith, J. L. Prince, S. Mori, Effects ofdiffusion weighting schemes on the reproducibility of DTI-derived fractional anisotropy,mean diffusivity, and principal eigenvector measurements at 1.5 T, NeuroImage 36 (2007)1123–1138.
[182] S. M. Smith, T. E. Nichols, Threshold-free cluster enhancement: addressing problems ofsmoothing, threshold dependence and localisation in cluster inference, NeuroImage 44(2009) 83–98.
[183] H.-E. Assemlal, D. Tschumperlé, L. Brun, K. Siddiqi, Recent advances in diffusion MRImodeling: Angular and radial reconstruction, Med Image Anal 15 (2011) 369–396.
[184] D. K. Jones, T. R. Knösche, R. Turner, White matter integrity, fiber count, and otherfallacies: the do’s and don’ts of diffusion MRI, NeuroImage 73 (2013) 239–254.
[185] M. Bach, F. B. Laun, A. Leemans, C. M. Tax, G. J. Biessels, B. Stieltjes, K. H. Maier-Hein,Methodological considerations on tract-based spatial statistics (TBSS), NeuroImage 100(2014) 358–369.
[186] Y. Chen, O. Tymofiyeva, C. P. Hess, D. Xu, Effects of rejecting diffusion directions ontensor-derived parameters, NeuroImage 109 (2015) 160–170.
[187] K. Pieterman, A. Plaisier, P. Govaert, A. Leemans, M. H. Lequin, J. Dudink, Data qualityin diffusion tensor imaging studies of the preterm brain: a systematic review, PediatrRadiol 45 (2015) 1372–1381.
[188] M. M. Berl, L. Walker, P. Modi, M. O. Irfanoglu, J. E. Sarlls, A. Nayak, C. Pierpaoli,Investigation of vibration-induced artifact in clinical diffusion-weighted imaging ofpediatric subjects, Hum Brain Mapp 36 (2015) 4745–4757.
[189] D. R. Roalf, et al., The impact of quality assurance assessment on diffusion tensor imagingoutcomes in a large-scale population-based cohort, NeuroImage 125 (2016) 903–919.
[190] M. Froeling, C. M. Tax, S. B. Vos, P. R. Luijten, A. Leemans, “MASSIVE” brain dataset:Multiple acquisitions for standardization of structural imaging validation and evaluation,Magn Reson Med 77 (2017) 1797–1809.
[191] J. Coremans, R. Luypaert, F. Verhelle, T. Stadnik, M. Osteaux, A method for myelinfiber orientation mapping using diffusion-weighted MR images, Magn Reson Imaging 12(1994) 443–454.
[192] C.-F. Westin, S. E. Maier, H. Mamata, A. Nabavi, F. A. Jolesz, R. Kikinis, Processing andvisualization for diffusion tensor MRI, Med Image Anal 6 (2002) 93–108.
[193] J. Andersson, M. Richter, W. Richter, S. Skare, R. Nunes, M. Robson, T. Behrens, Effectsof susceptibility distortions on tractography, ISMRM, Kyoto.
[194] M. Descoteaux, R. Deriche, T. R. Knosche, A. Anwander, Deterministic and probabilistictractography based on complex fibre orientation distributions, IEEE Trans Med Imag 28(2009) 269–286.
48

[195] M. O. Irfanoglu, L. Walker, J. Sarlls, S. Marenco, C. Pierpaoli, Effects of image distor-tions originating from susceptibility variations and concomitant fields on diffusion MRItractography results, NeuroImage 61 (2012) 275–288.
[196] G. K. Rohde, A. S. Barnett, P. J. Basser, C. Pierpaoli, Estimating intensity variance due tonoise in registered images: applications to diffusion tensor MRI, NeuroImage 26 (2005)673–684.
[197] Z. Liu, Y. Wang, G. Gerig, S. Gouttard, R. Tao, T. Fletcher, M. Styner, Quality control ofdiffusion weighted images, in: Proceedings of SPIE–the International Society for OpticalEngineering, Vol. 7628, NIH Public Access, 2010, p. 76280J.
[198] B. Iglewicz, D. C. Hoaglin, How to detect and handle outliers, Vol. 16, ASQC QualityPress Milwaukee, WI, 1993.
[199] R. Salvador, A. Peña, D. K. Menon, T. A. Carpenter, J. D. Pickard, E. T. Bullmore, Formalcharacterization and extension of the linearized diffusion tensor model, Hum Brain Mapp24 (2005) 144–155.
[200] J. J. Thomson, XXIV. On the structure of the atom: an investigation of the stability andperiods of oscillation of a number of corpuscles arranged at equal intervals around thecircumference of a circle; with application of the results to the theory of atomic structure,The London, Edinburgh, and Dublin Philosophical Magazine and Journal of Science 7(1904) 237–265.
[201] C. J. Mifsud, Algorithm 154: Combination in lexicographical order, Commun ACM 6(1963) 103.
[202] B. P. Buckles, M. Lybanon, Algorithm 515: Generation of a vector from the lexicographicalindex [G6], ACM Trans Math Softw 3 (1977) 180–182.
[203] D. K. Jones, Tractography gone wild: probabilistic fibre tracking using the wild bootstrapwith diffusion tensor MRI, IEEE Trans Med Imag 27 (2008) 1268–1274.
[204] M. Catani, M. T. de Schotten, Atlas of human brain connections, Oxford University Press,2012.
[205] S. M. Smith, et al., Advances in functional and structural MR image analysis and imple-mentation as FSL, NeuroImage 23 (2004) S208–S219.
[206] J. L. Andersson, M. Jenkinson, S. Smith, Non-linear optimisation. FMRIB technical reportTR07JA1, University of Oxford FMRIB Centre: Oxford, UK.
[207] J. L. Andersson, M. Jenkinson, S. Smith, et al., Non-linear registration, aka Spatialnormalisation FMRIB technical report TR07JA2, FMRIB Analysis Group of the Universityof Oxford 2.
[208] T. E. Nichols, A. P. Holmes, Nonparametric permutation tests for functional neuroimaging:a primer with examples, Hum Brain Mapp 15 (2002) 1–25.
[209] A. M. Winkler, G. R. Ridgway, M. A. Webster, S. M. Smith, T. E. Nichols, Permutationinference for the general linear model, NeuroImage 92 (2014) 381–397.
[210] C. P. Hess, P. Mukherjee, E. T. Han, D. Xu, D. B. Vigneron, Q-ball reconstruction ofmultimodal fiber orientations using the spherical harmonic basis, Magn Reson Med 56(2006) 104–117.
[211] J.-D. Tournier, F. Calamante, A. Connelly, Robust determination of the fibre orienta-tion distribution in diffusion MRI: non-negativity constrained super-resolved sphericaldeconvolution, NeuroImage 35 (2007) 1459–1472.
49

[212] O. Braddick, J. Atkinson, Development of human visual function, Vision Research 51(2011) 1588–1609.
[213] R. Brooks, A. N. Meltzoff, Connecting the dots from infancy to childhood: A longitudinalstudy connecting gaze following, language, and explicit theory of mind, J Exp ChildPsychol 130 (2015) 67–78.
[214] P. Cook, Y. Bai, S. Nedjati-Gilani, K. Seunarine, M. Hall, G. Parker, D. Alexander, Camino:open-source diffusion-MRI reconstruction and processing, in: 14th scientific meeting ofthe international society for Magn Reson Med, Vol. 2759, Seattle WA, USA, 2006.
[215] G. W. Corder, D. I. Foreman, Nonparametric statistics: A step-by-step approach, JohnWiley & Sons, 2014.
[216] M. Hollander, D. A. Wolfe, E. Chicken, Nonparametric statistical methods, John Wiley &Sons, 2013.
[217] M. Stein, C. Winkler, A. Kaiser, T. Dierks, Structural brain changes related to bilingualism:does immersion make a difference?, Frontiers in psychology 5.
[218] M. Catani, M. P. Allin, M. Husain, L. Pugliese, M. M. Mesulam, R. M. Murray, D. K. Jones,Symmetries in human brain language pathways correlate with verbal recall, Proc NatlAcad Sci 104 (2007) 17163–17168.
[219] Y. Li, S. M. Shea, C. H. Lorenz, H. Jiang, M.-C. Chou, S. Mori, Image corruption detectionin diffusion tensor imaging for post-processing and real-time monitoring, PloS one 8(2013) e49764.
[220] M. Ankele, T. Schultz, Quantifying microstructure in fiber crossings with diffusionalkurtosis, in: International Conference on Medical Image Computing and Computer-Assisted Intervention, Springer, 2015, pp. 150–157.
[221] T. Roine, B. Jeurissen, D. Perrone, J. Aelterman, A. Leemans, W. Philips, J. Sijbers, Isotropicnon-white matter partial volume effects in constrained spherical deconvolution, FrontNeuroinform 8.
[222] J. F. Nielsen, N. R. Ghugre, A. Panigrahy, Affine and polynomial mutual informationcoregistration for artifact elimination in diffusion tensor imaging of newborns, MagnReson Imaging 22 (2004) 1319–1323.
[223] V. J. Wedeen, P. Hagmann, W.-Y. I. Tseng, T. G. Reese, R. M. Weisskoff, Mapping complextissue architecture with diffusion spectrum magnetic resonance imaging, Magn ResonMed 54 (2005) 1377–1386.
[224] D. C. Alexander, Maximum entropy spherical deconvolution for diffusion MRI, in: Bien-nial International Conference on Information Processing in Medical Imaging, Springer,2005, pp. 76–87.
[225] M. M. Cheung, E. S. Hui, K. C. Chan, J. A. Helpern, L. Qi, E. X. Wu, Does diffusionkurtosis imaging lead to better neural tissue characterization? A rodent brain maturationstudy, NeuroImage 45 (2009) 386–392.
[226] B. Jeurissen, A. Leemans, D. K. Jones, J.-D. Tournier, J. Sijbers, Probabilistic fiber trackingusing the residual bootstrap with constrained spherical deconvolution, Hum Brain Mapp32 (2011) 461–479.
50