frm credit alpha limited (incorporated in guernsey) annual ... · frm credit alpha limited...
TRANSCRIPT

FRM CREDIT ALPHA LIMITED
(Incorporated in Guernsey)
ANNUAL FINANCIAL REPORT
FOR THE YEAR ENDED 30 JUNE 2012

FRM CREDIT ALPHA LIMITED
2
TABLE OF CONTENTS PAGE DIRECTORS AND OTHER INFORMATION 3-4 DIRECTORS’ REPORT 5-10 CHAIRMAN’S STATEMENT 11 INVESTMENT ADVISER’S REPORT 12 INDEPENDENT AUDITORS’ REPORT 13-14 STATEMENT OF FINANCIAL POSITION 15 STATEMENT OF COMPREHENSIVE INCOME 16 STATEMENT OF CHANGES IN EQUITY 17 STATEMENT OF CASH FLOWS 18 NOTES TO THE ANNUAL FINANCIAL REPORT 19-38 PORTFOLIO STATEMENT 39-41
FRM CREDIT ALPHA LIMITED
3
DIRECTORS AND OTHER INFORMATION DIRECTORS Peter Atkinson (Chairman)* Richard Hotchkis*
Dr. Damian Johnson**(resigned 14 December 2011) Andrew Duquemin* * independent non-executive **non-independent non-executive REGISTERED OFFICE P.O. Box 173 Royal Chambers St. Julian’s Avenue St. Peter Port Guernsey, GY1 4HG Channel Islands MANAGER AND COMPANY SECRETARY FRM Investment Management Limited P.O. Box 173 Royal Chambers St. Julian’s Avenue St. Peter Port Guernsey, GY1 4HG Channel Islands INVESTMENT ADVISER Financial Risk Management Limited Riverbank House 2 Swan Lane London, EC4R 3AD United Kingdom SOLICITORS Herbert Smith Freehills LLP (As to English Law) Exchange House Primrose Street London, EC2A 2HS United Kingdom ADVOCATES Carey Olsen (As to Guernsey Law) P.O. Box 98 Carey House Les Banques St. Peter Port Guernsey, GY1 4BZ Channel Islands REGISTRAR/TRANSFER AGENT Capita Registrars (Guernsey) Limited Longue Hougue House St. Sampson Guernsey, GY2 4JN Channel Islands INDEPENDENT AUDITORS PricewaterhouseCoopers CI LLP Royal Bank Place P.O. Box 321 First Floor 1 Glategny Esplanade St. Peter Port Guernsey, GY1 4ND Channel Islands

FRM CREDIT ALPHA LIMITED
4
DIRECTORS AND OTHER INFORMATION (continued) ADMINISTRATOR J.P. Morgan Hedge Fund Services (Ireland) Limited Newenham House Northern Cross Malahide Road Dublin 17 Ireland CUSTODIAN J.P.Morgan Chase Bank, National Association (London Branch) 125 London Wall London, EC2Y 5AJ United Kingdom FINANCIAL ADVISER Winterflood Securities Limited AND CORPORATE BROKER/ LISTING SPONSOR Cannon Bridge House 25 Dowgate Hill London, EC4R 2GA United Kingdom
FRM CREDIT ALPHA LIMITED
5
DIRECTORS’ REPORT FOR THE YEAR ENDED 30 JUNE 2012 The Directors hereby present their report together with the annual financial report of FRM Credit Alpha Limited (the “Company”) for the year ended 30 June 2012. Company Background The Company, a closed-ended investment company, was incorporated on 1 March 2007 under the laws of Guernsey with registered number 46497. The Company began trading on 27 March 2007 with a listing on the Irish Stock Exchange (the “ISE”). On 4 September 2008, the Company was de-listed from the ISE and since then the Sterling Shares have been listed on the Main Market of the London Stock Exchange. Principal Activities The Company was launched with the objective of delivering better risk-adjusted returns than those achieved by making passive investments in corporate debt securities, when measured over a complete market cycle. The Company sought to achieve its objective by investing in a portfolio of underlying investee funds pursuing a variety of different credit and credit-related trading strategies. The Company is currently subject to a managed wind-down, further details of which are given below under the heading “Managed Wind-Down”. Results The results for the period are shown in the statement of comprehensive income on page 16. Directors The Directors of the Company are set out on page 3. Directors’ Interests The details of Directors’ fees paid during the year are shown in the statement of comprehensive income on page 16. As at 30 June 2012 Richard Hotchkis held 6,002 Sterling Shares (30 June 2011: 14,124 Sterling Shares) in the Company. No other Director holds shares in the Company. Corporate Governance Introduction The Board has carefully considered the principles and recommendations of the AIC Code of Corporate Governance (the “AIC Code”) by reference to the AIC Corporate Governance Guide for Investment Companies (the “AIC Guide”). The AIC Code, as explained by the AIC Guide, addresses all the principles set out in the UK Corporate Governance Code, as well as setting out additional principles and recommendations on issues that are of specific relevance to the Company. The Board considers that reporting against the principles and recommendations of the AIC Code, and by reference to the AIC Guide (which incorporates the UK Corporate Governance Code), will provide better information to Shareholders. The Company has complied with the recommendations of the AIC Code and the relevant provisions of the UK Corporate Governance Code. The UK Corporate Governance Code includes provisions relating to: • Executive Directors’ remuneration • The need for an internal audit function • The role of the chief executive

FRM CREDIT ALPHA LIMITED
6
DIRECTORS’ REPORT FOR THE YEAR ENDED 30 JUNE 2012 (continued) Corporate Governance (continued) Introduction (continued) For the reasons set out in the AIC Guide, and as explained in the UK Corporate Governance Code, the Board considers these provisions are not relevant to the position of the Company, being an externally managed investment company. The Company has therefore not reported further in respect of these provisions. The Company has delegated responsibility for voting in relation to its underlying investee funds to the Investment Manager. The AIC Code explains that Guernsey-domiciled investment companies which report against the AIC Code are not required to report separately against the Guernsey Financial Services Commission (“GFSC”) Finance Sector Code of Corporate Governance. The GFSC does, however, require the submission of an assurance statement from companies by no later than 31 July 2012 to confirm that the Directors have considered the effectiveness of their corporate governance practices and are satisfied with their degree of compliance with the Principles of the Guernsey Code, or alternative codes accepted by the GFSC, and has confirmed that companies which report against either the Governance Code or the AIC Code as an alternative to applying the principles of the Guernsey Code, are still required to submit an assurance statement. The Board confirms that it has considered and approved the Company’s Annual Assurance Statement which was submitted to the GFSC 14 June 2012. The Board considers that reporting against the principles and recommendations of the AIC Code, and by reference to the AIC Guide (which incorporates the Governance Code) will provide better information to shareholders. The Board The Board currently consists of three non-executive Directors all of whom are considered to be independent. Mr Atkinson, and Mr Hotchkis have been members of the Board since the Company’s incorporation on 13 March 2007 and Mr Duquemin has been a member of the Board since 11 September 2007. None of the Directors are on the boards of any other funds managed by the Investment Manager. Both Mr Atkinson and Mr Duquemin are Directors of Blue Diamond Limited, a private trading company unrelated to the Company and Investment Manager. Peter Atkinson, Chairman, is an Advocate of the Royal Court of Guernsey and an English Solicitor. Admitted to the Guernsey Bar in 1980, he was the Senior Partner of Collas Day Advocates for 14 years from 1991 to 2005 and also acted as a Consultant in the course of a career with the firm spanning 25 years from 1981 to 2006. He specialised in corporate and fiduciary work and has been and continues to act as a non-executive director of companies within the financial services sector including companies listed on the London and Channel Islands Stock Exchanges including Schroder Real Estate Investment Trust Limited and Japan Residential Investment Company Limited. He is a former Chairman of the Guernsey Bar and resides in Guernsey. Mr Atkinson is the senior independent Director of the Company. Andrew Duquemin is Chairman of Elysium Fund Management Limited, a company providing fund management and corporate finance services to a range of funds and trading companies. Elysium Fund Management Limited was formed in October 2006 to complete the management buyout of the business of Collins Stewart Fund Management Limited, a Guernsey registered company and wholly owned subsidiary of Collins Stewart Tullett plc, where Andrew was Managing Director. Andrew has extensive experience in providing corporate finance and management consultancy services to companies listed on both the London and the Channel Islands Stock Exchanges. He is also a Director of Corporate Consultants Limited; a Guernsey based consultancy business which has provided corporate finance and management consultancy services since 1991. Andrew sits on the boards of several Guernsey trading companies, has a degree in Accounting and Finance and qualified as a Chartered Accountant in 1983. He is also a Chartered Fellow of the Securities Institute and holds the advanced diploma in Corporate Finance. Mr Duquemin resides in Guernsey. Richard Hotchkis has 30 years’ investment experience. Until October 2006 he was an Investment Manager at the Co-operative Insurance Society, where he started his career in 1976. Mr Hotchkis has wide experience of equity investment in both the UK and overseas and also of the externally managed funds industry, including investment trust and other closed-ended funds, offshore funds and underlying investee funds. Mr Hotchkis sits on the board of a number of Guernsey-based funds including companies listed on the London and Channel Islands Stock Exchanges including Ashmore Global Opportunities, Alternative Investment Strategies, Advance Developing Markets Fund, Advance Frontier Markets Fund (Aim) and he is a Guernsey resident. Dr. Damian Johnson stood down at the Company’s AGM which was held on 14 December 2011, having served as a member of the Board since 13 March 2007. It is not anticipated that any Director will serve for more than nine years.

FRM CREDIT ALPHA LIMITED
7
DIRECTORS’ REPORT FOR THE YEAR ENDED 30 JUNE 2012 (continued) Corporate Governance (continued) The Board (continued) Peter Atkinson was re-elected as a Director of the Company at the Company’s AGM which was held on 14 December 2011. Attendance at the quarterly Board meetings, Audit Committee and other ad hoc meetings during the year was as follows: Date Number of
meetings held
Peter Atkinson Andrew Duquemin Richard Hotchkis Damian Johnson
Quarterly Board Meetings
4
4
4
4
1
Audit Committee Meetings
3
3
3
3
N/A
AdHoc Board Meetings
3
3
2
3
N/A
The Directors are kept fully informed of investment and financial controls and other matters that are relevant to the business of the Company and which should be brought to the attention of the Directors. The Directors also have access to the Company Secretary and, where necessary in the furtherance of their duties, to independent professional advice at the expense of the Company. The Board has a breadth of experience relevant to the Company and the Directors believe that any changes to the Board’s composition can be managed without undue disruption. Given that the Company is now in a managed wind-down phase it is not anticipated that any new Directors will be appointed to the Board. The Board has undertaken an internal review of its performance which concluded that the Board is operating effectively and that Directors have the breadth of skills required to fulfil their role. In order to review their effectiveness the Board carried out a process of formal self-appraisal. The Board considered how they function as a whole and also reviewed the performance of individual members. This process was conducted by the Chairman reviewing the Directors’ performance, contribution and commitment to the Company.
Audit Committee An Audit Committee has been established consisting of Mr Duquemin (chairman), Mr Atkinson and Mr Hotchkis. The Audit Committee examines the effectiveness of the Company’s internal control systems, the annual financial report, the half-yearly unaudited financial report, the auditors’ remuneration and engagement, as well as the auditors’ independence and the non-audit services provided by them. The Audit Committee receives information from the Company Secretary and the external auditors. The Board has not disagreed with any of the Audit Committee's recommendations. Appointment and Remuneration Committee An Appointment and Remuneration Committee has been established consisting of Mr Hotchkis (chairman), Mr Atkinson and Mr Duquemin. The Appointment and Remuneration Committee makes recommendations to the Board in respect of the appointment and remuneration of all non-executive Directors and the Chairman. The Appointment and Remuneration Committee has adopted terms of reference which are in accordance with the matters usually to be considered by such a committee. The Appointment and Remuneration Committee do not envisage appointing any new Directors to the Board given that the Company is in a managed wind-down. Management Engagement Committee A Management Engagement Committee has been established consisting of Mr Hotchkis (chairman), Mr Atkinson and Mr Duquemin. The Management Engagement Committee monitors the performance of the Company’s service providers in the management of the Company’s assets. The Management Engagement Committee receives a report from the Investment Manager on a quarterly basis. It is the view of the Directors that it is in the best interests of the Shareholders to continue with the current appointment of the Investment Manager under the terms agreed.

FRM CREDIT ALPHA LIMITED
8
DIRECTORS’ REPORT FOR THE YEAR ENDED 30 JUNE 2012 (continued) Corporate Governance (continued) Internal Controls The Board is ultimately responsible for the Company’s system of internal control and for reviewing its effectiveness. The Board confirms that there is an ongoing process for identifying, evaluating and managing significant risks faced by the Company. This process has been in place for the period under review and is reviewed by the Board regularly and accords with the guidance published by the FRC Internal Control Revised. See Note 6 for details of specific risks faced by the Company. The UK Corporate Governance Code requires Directors to conduct, at least annually, a review of the Company’s system of internal control, covering all controls including financial, operational, compliance and risk management. The Board has reviewed the effectiveness of the system of internal control. In particular, it has reviewed and updated the process for identifying and evaluating significant risks affecting the Company and the policies by which these risks are managed. The internal control systems are designed to meet the Company’s particular needs and the risks to which it is exposed. Accordingly, the internal control systems are designed to manage rather than eliminate the risk of failure to achieve business objectives and by their nature can only provide reasonable and not absolute assurance against misstatement and loss. The key components designed to provide effective internal control are outlined below:
• the Manager prepares management reports which allow the Board to assess the Company’s activities and review its performance;
• the Board and Manager have agreed clearly defined investment criteria, specified levels of authority and exposure limits; reports on these issues, including
• performance statistics and investment valuations, are regularly submitted to the Board and there are meetings with the Manager as appropriate;
• as a matter of course the Manager’s compliance department continually reviews the Manager’s operations; and • written agreements are in place which specifically define the roles and responsibilities of the Manager,
Administrator and other third party service providers. The Board has considered the need for an internal audit function but, because all of the Company’s executive and administrative functions are delegated to service providers appointed by the Board it has decided to place reliance on the systems and internal audit procedures of those providers. At each of its meetings, the Audit Committee carried out its assessment of internal controls during the year ended 30 June 2012 by considering documentation and verbal reports from the service providers, including the internal audit and compliance functions of the Manager and Administrator and taking account of events since 30 June 2012. The results of these assessments were then reported to the Board at its quarterly meetings. Internal control systems are designed to meet the Company’s particular needs and the risks to which it is exposed. Accordingly, the internal control systems are designed to manage rather than eliminate the risk of failure to achieve business objectives and by their nature can only provide reasonable and not absolute assurance against misstatement and loss. The Board has addressed the issue of the safeguarding of Shareholders’ investments by ensuring that all of the Company’s assets are held by the Custodian, J.P. Morgan Chase Bank, National Association (London Branch). Investment Manager The Company entered into an agreement with the Investment Manager, FRM Investment Management Limited on 16 March 2007. This sets out the Investment Manager’s key responsibilities which include proposing an investment strategy to the Board and, within certain authority limits, selecting investments for acquisition and disposal and arranging appropriate borrowing facilities. As at 30 June 2012 the Company does not have any borrowings. The Investment Manager is also responsible for all issues pertaining to asset management. The independent Directors review the performance of the Investment Manager and the fees and terms of the Investment Management Agreement on an annual basis. During the previous financial year the Investment Management fee was reviewed and amended as detailed in note 3(a) on page 23.

FRM CREDIT ALPHA LIMITED
9
DIRECTORS’ REPORT FOR THE YEAR ENDED 30 JUNE 2012 (continued) Relations with Shareholders The Investment Adviser maintains a regular dialogue with institutional Shareholders, the feedback from which is reported to the Board. In addition, Board members will be available to respond to Shareholders’ questions at the annual general meeting (the “AGM”). The Notice of the AGM and related papers are sent to shareholders at least 20 days before the meeting. Performance reports and Net Asset Value statements are published on the Company’s website on a monthly basis and, as noted below in the section headed “Management Report”, further details of performance throughout the year are available in the Investment Adviser’s Report on page 12. Going Concern Since the Company has entered into a managed wind-down phase, the Directors are satisfied that it is appropriate to prepare the year-end financial report on a break-up basis of accounting and in accordance with International Financial Reporting Standards (IFRS) and the Companies Guernsey Law, 2008. Conversion between Classes The Company’s Articles incorporate provisions to enable Shareholders of any one class of Shares to convert all or part of their holding into any other class of Shares in issue on a twice-yearly basis in accordance with the detailed provisions of the Articles. However, the Company currently only has Sterling denominated Ordinary Shares in issue. Managed Wind-Down On 4 February 2011 a circular recommending proposals for a managed wind-down of the Company and giving notice of an Extraordinary General Meeting to be held on 17 March 2011 was sent to Shareholders. At the Extraordinary General Meeting held on 17 March 2011 the special resolution that the Company modify its investment policy in order to effect a managed wind-down was approved by 100% of voting members. Subsequent to that date the necessary steps have been put in place to begin the managed wind-down of the Company. On 11 May 2011 the Company resolved to return £31,000,000 by way of a compulsory partial redemption of shares at a price of 88.6 pence per share, the Company’s NAV per share as at 31 March 2011. On 14 July 2011 the Company resolved to return £8,003,806 by way of a further compulsory partial redemption of shares at a price of 88.9 pence per share, the Company’s NAV per share as at 30 June 2011. On 23 January 2012 the Company resolved to return £4,500,000 by way of a compulsory partial redemption of shares at a price of 82.0 pence per share, the Company’s NAV per share as at 31 December 2011. On 11 May 2012, the Company resolved to return approximately £2,700,000 by way of a compulsory partial redemption of shares at a price of 79.1 pence per share, the Company’s NAV per share as at 31 May 2012. The remainder of the net assets attributable to holders of shares will be returned in line with the Company’s modified investment policy of realising the Company’s existing investments in an orderly and timely manner, with a view to distributing cash to Shareholders (in accordance with their rights to distributions on a winding-up as set out in the Articles) at appropriate times as sufficient investments are realised. The Company will not make any new investments other than in cash or cash equivalents pending distribution of cash to Shareholders. Independent Auditors The Company’s Independent Auditors, PricewaterhouseCoopers CI LLP, have indicated their willingness to continue in office, and a resolution reappointing them and authorising the Directors to agree their remuneration was agreed at the Annual General Meeting. Audit fees charged during the year are disclosed in the statement of comprehensive income on page 16. DIRECTORS’ RESPONSIBILITY STATEMENT The Directors are responsible for preparing the annual report for each financial year which gives a true and fair view, in accordance with applicable Guernsey law and International Financial Reporting Standards, of the state of affairs of the Company and of the profit or loss of the Company for that year. In preparing this year-end annual report, the Directors are required to: • Make judgements and estimates that are reasonable and prudent; • Prepare the annual report on the going concern basis unless it is inappropriate to presume that the Company will
continue in business. Given the decision to wind down the Company, this financial report has been prepared on a break up basis of accounting;
• Select suitable accounting policies and then apply them consistently and • State whether applicable accounting standards have been followed, subject to any material departures disclosed and
explained in the annual financial report.


FRM CREDIT ALPHA LIMITED
12
INVESTMENT ADVISER’S REPORT FOR THE YEAR ENDED 30 J UNE 2012 The second half of 2011 was dominated by uncertainty resulting in an extremely volatile period for financial markets. The causes of volatility were predominantly; the instability of Europe, concerns over the trajectory of global growth in particular in China and pending regime change in most of the world’s major economies (Europe, the US, Japan and China). World equity markets traded in a 20% range with daily volatility of approximately 2% (MSCI World Free LC Index), US Treasuries experienced a period of tremendous volatility last seen at the collapse of Lehman while the level of the VIX Index ranged been between 15 and 48. In addition, some of the more closely watched financial stress indicators started to move out towards 2008 crisis levels. Despite massive injections of liquidity around the globe, it became increasingly difficult to borrow US dollars almost everywhere outside of the US. Investor risk appetite remained very low, while at the same time, banks were under severe pressure to improve their capital ratios. The first half of 2012 enjoyed a largely unbroken rally across risk assets that extended from January into early April of this year. The delayed and then very rapid digestion of the ECB’s Long Term Refinancing Operations (“LTROs”), a series of improving economic data points in the US (such as unemployment which dropped to 8.1% in April) and a perception that China would be able to engineer a soft landing, propelled the squeeze higher in markets. From mid-April onward, however, the markets went back into risk-off mode as investor concern over the political situation in Europe (such as the inconclusive Greek elections) and questions over the stability of the banking system (the Spanish Bank, Bankia, was bailed out in May) came back into focus. Coincident with the downturn in Europe both the US and Asia, which had been more buoyant, also started to show signs of a slowdown with downward economic surprises such as the moderation in the manufacturing Purchasing Managers’ Index (“PMI”) data in both regions. Against this backdrop, hedge funds en masse struggled to make money and cut risk on both a gross and net basis. Excluding January 2012 and February 2012 when the managers caught some of the updraft from the rally in risk assets both Long Short Credit and Equity Long-Short managers found the environment challenging with long bias, value focussed managers losing ground and no bias or variable bias managers generating only small gains as they flattened net and gross exposures in response to market volatility and European instability. Directional Trading strategies suffered from whipsaw as markets suffered significant reversals intra month. Decent profits tended to be generated on fixed income trades as Treasuries continued to grind lower while shorting the euro also scored gains but again high levels of uncertainty deterred managers from making large directional bets. Relative Value strategies proved the most successful as their lack of dependence on market directionality insulated them from the greatest problems. The absence of proprietary capital also appeared to have a positive impact on their opportunity set boosting returns to technical strategies such as Statistical Arbitrage. As at 30 June 2012 £10.3m of net assets in the fund were made up of £10.0m financial assets and £0.3m cash. This follows distributions since the end of the previous financial year of £8.0m in July 2011, £4.5m in January 2012 and £2.7m in June 2012. The financial assets consisted of US Dollar based hedge funds and receivables held within the portfolio hereon referred to as “USD core”. The performance of this USD core portfolio in Sterling terms is therefore a reflection of both the fluctuation in asset value of the underlying hedge funds and the variation in the US Dollar exchange rate. As the US Dollar appreciates in value so the Sterling value of the financial assets also increases and vice versa. Over the year the Company’s share price fell by -31.3% while the net asset value decreased by -12.1%. The USD core portfolio fell by -14.0%. Liquidation:
We are pleased to report that the return of capital from Plainfield, Cerberus, Oak Hill and Highland Crusader enabled us to make a distribution of £8m at the end of July 2011. In addition further distributions of £4.5m and £2.7m were made in January 2012 and June 2012 respectively. Following these distributions the company’s liquidity profile as at 30 June 2012 was as follows:
Immediate Monthly Quarterly <1 year 1 to 2 years Indeterminate Total 0.0% 2.4% 0.0% 1.9% 0.0% 95.7% 100.0%
Although there are no confirmed redemption points for the remaining assets we are reasonably confident that the remainder of 2012 will see more partial distributions from Highland and Cerberus as well as the total liquidations of both Bluebay and Plainfield. Further distributions will be made in due course. Financial Risk Management Limited Date: August 2012


FRM CREDIT ALPHA LIMITED
16
STATEMENT OF COMPREHENSIVE INCOME FOR THE YEAR ENDE D 30 JUNE 2012
Notes Year ended
30 June 2012 Year ended
30 June 2011 US$ US$ Income
Interest income 2(g) 969 1,381 Other income 11,667 63 Net foreign currency (loss)/gains (349,974) 1,995,332 Other net changes in fair value on financial assets and financial liabilities at fair value through profit or loss
5 (3,359,322)
1,861,620
Total net (loss)/income (3,696,660) 3,858,396 Expenses Management fees 3(a) (158,287) (802,636) Administration & custodian fees 3(c) (32,367) (77,907) Legal fees (16,452) (221,372) Audit fees (34,491) (47,471) Directors fees 3(d) (126,721) (135,276) Other operating expenses (128,837) (134,664) Total operating expenses (497,155) (1,419,326) Operating (loss)/profit (4,193,815) 2,439,070 (Loss)/profit for the year from operations 2(j) (4,193,815) 2,439,070
Basic and diluted earnings per Sterling Share GBP(0.138) GBP0.027 There were no other elements of comprehensive income in the year (30 June 2011: Nil).
The accompanying notes form an integral part of this annual financial report

FRM CREDIT ALPHA LIMITED
17
STATEMENT OF CHANGES IN EQUITY FOR THE YEAR ENDED 3 0 JUNE 2012 Year ended
30 June 2012 Year ended
30 June 2011 US$ US$ Net assets at start of the year 44,413,588 91,713,037 Redemptions of Shares (24,009,527) (49,738,519) Net decrease from Share transactions (24,009,527) (49,738,519) (Loss)/profit for the year from operations (4,193,815) 2,439,070 Net assets at end of the year 16,210,246 44,413,588
Refer to notes 8 and 9 for the movement in Share Capital, Share Premium and Reserves for the year.
The accompanying notes form an integral part of this annual financial report

FRM CREDIT ALPHA LIMITED
18
STATEMENT OF CASH FLOWS FOR THE YEAR ENDED 30 JUNE 2012 Note Year ended
30 June 2012 Year ended
30 June 2011 US$ US$ Cash flows from operating activities (Loss)/profit for the year from operations (4,193,815) 2,439,070
Adjusted for:
Interest income (969) (1,381) (4,194,784) 2,437,689 Operating activities: Net decrease in prepaid expenses 2,201 3,390 Net decrease/(increase) in sales awaiting settlement 13,311,533 (7,599,148) Net decrease in liabilities and accrued expenses (17,596) (121,759) Net decrease in financial assets at fair value through profit or loss
9,667,293 54,281,694
Cash provided by operating activities 18,768,647 49,001,866 Interest received 1,029 1,321 Net cash provided by operating activities 18,769,676 49,003,187 Cash flows used in financing activities Redemption of Shares (24,009,527) (49,738,519) Net cash used in financing activities (24,009,527) (49,738,519) Net decrease in cash and cash equivalents (5,239,851) (735,332) Cash and cash equivalents at the start of the year 5,622,127 6,357,459 Cash and cash equivalents at the end of the year 2(d) 382,276 5,622,127
The accompanying notes form an integral part of this annual financial report

FRM CREDIT ALPHA LIMITED
19
NOTES TO THE ANNUAL FINANCIAL REPORT FOR THE YEAR E NDED 30 JUNE 2012 1. GENERAL INFORMATION
FRM Credit Alpha Limited, a closed ended Investment Company, was incorporated in Guernsey on 1 March 2007 under the laws of Guernsey, with registered number 46497. The Company has three share classes that are authorised for issue; Euro Shares, Sterling Shares and US Dollar Shares. At 30 June 2012 only Sterling Shares were in issue. The Company was launched with the objective of seeking to generate significant returns over cash, with low volatility and beta to global credit markets, when measured over a market cycle. By investing in a combination of investee funds managed by managers who adopt research-based value/event driven or long-short approaches, the Company believed that volatility and peak-to-trough drawdowns would be lower than those typically delivered by long-only approaches. The Company sought to achieve its objective by investing in a portfolio of underlying investee funds pursuing a variety of different credit and credit-related trading strategies. In addition, the Company could invest in a wide variety of financial instruments. The Company has entered into a managed wind-down phase following the approval of proposals that were put to Shareholders at an EGM of the Company held on 17 March 2011, and the objective was modified to focus on realising the underlying assets whilst at the same time maximising the level of capital being returned to investors. The Sterling Shares are listed on the Main Market of the London Stock Exchange. The Company has no employees (30 June 2011: none).
2. SUMMARY OF SIGNIFICANT ACCOUNTING POLICIES
The principal accounting policies applied in the preparation of this annual financial report are set out below. These policies have been consistently applied to all years presented, unless otherwise stated. As detailed in notes 1 and 15, the Company has now entered into a managed wind-down phase and so these accounting policies and the notes that follow should be read in the context of the Company being in managed wind-down and of the Company’s objective now being to focus on realising the underlying assets whilst at the same time maximising the level of capital being returned to investors.
(a) Basis of preparation
The annual financial report has been prepared in accordance with International Financial Reporting Standards (“IFRS”) and the Disclosure and Transparency rules of the Financial Services Authority. The annual financial report has been prepared under the historical cost convention as modified by the revaluation of financial assets and financial liabilities at fair value through profit or loss. The preparation of the annual financial report in conformity with IFRS requires the use of certain critical accounting estimates. It also requires the Board of Directors to exercise its judgement in the process of applying the Company’s accounting policies. The areas involving a higher degree of judgement or complexity or areas where assumptions and estimates are significant to the annual financial report are disclosed in note 2(k). This annual financial report is prepared on a break-up basis since the Company has entered into a managed wind-down phase. The following standards and amendments to existing standards were adopted effective 1 July 2011: The amendment to lAS 24, 'Related party disclosures', clarifies the definitions of a related party. The new definition clarifies in which circumstances persons and key management personnel affect related party relationships of an entity. The amendment also introduces an exemption from the general related-party disclosure requirements for transactions with a government and entities that are controlled, jointly controlled or significantly influenced by the same government as the reporting entity. The adoption of the amendment did not have any impact on the financial position or performance of the Company.
FRM CREDIT ALPHA LIMITED
20
NOTES TO THE ANNUAL FINANCIAL REPORT FOR THE YEAR E NDED 30 JUNE 2012
2. SUMMARY OF SIGNIFICANT ACCOUNTING POLICIES (cont inued)
(a) Basis of preparation (continued) The following standards and amendments to existing standards were adopted effective 1 July 2011 (continued): IFRS 7 (amendment) ‘Financial instruments: Disclosures’. This amendment was part of the IASB’s annual improvement project published in May 2010. The amendment emphasises the interaction between quantitative and qualitative disclosures about the nature and extent of risks associated with financial instruments. Adoption of this amendment did not have a significant impact on the Company’s financial statements. “Improvements to IFRS” were issued in May 2010 and contain several amendments to IFRS, which the IASB consider non-urgent but necessary. “Improvements to IFRS” comprise amendments that result in accounting changes for presentation, recognition or measurement purposes as well as terminology or editorial amendments related to a variety of individual standards. Most of the amendments are effective for annual periods beginning on or after 1 January 2011, with earlier application permitted. No material changes to accounting policies are expected as a result of these amendments. New standards issued but not yet effective and not yet early adopted are detailed below: IFRS 9 “Financial Instruments” is effective for periods beginning on or after 1 January 2015. IFRS 9 specifies how an entity should classify and measure financial assets, including some hybrid contracts. They require all financial assets to be: • Classified on the basis of the entity’s business model for managing the financial assets and the contractual cash
flow characteristics of the financial asset. • Initially measured at fair value plus, in the case of a financial asset not at fair value through profit or loss, particular
transaction costs. • Subsequently measured at amortised cost or fair value. These requirements improve and simplify the approach for classification and measurement of financial assets compared with the requirements of IAS 39. They apply a consistent approach to classifying financial assets and replace the numerous categories of financial assets in IAS 39, each of which had its own classification criteria. They also result in one impairment method, replacing the numerous impairment methods in IAS 39 that arise from the different classification categories. The Company is currently in the process of evaluating the potential effect of this standard. The standard is not expected to have a significant impact on the financial statements since the majority of the financial assets of the Company are at fair value through profit or loss. IFRS 10, 'Consolidated financial statements', effective for annual periods beginning on or after 1 January 2013, builds on existing principles by identifying the concept of control as the determining factor in whether an entity should be included within the consolidated financial statements of the parent company. The standard provides additional guidance to assist in the determination of control where this is difficult to assess. The new standard is not expected to have any impact on the Company's financial position or performance. IFRS 12, 'Disclosures of interests in other entities', effective for annual periods beginning on or after 1 January 2013, includes the disclosure requirements for all forms of interests in other entities, including joint arrangements, associates, special purpose vehicles and other off balance sheet vehicles. The new standard is not expected to have any impact on the Company's financial position or performance.

FRM CREDIT ALPHA LIMITED
21
NOTES TO THE ANNUAL FINANCIAL REPORT FOR THE YEAR E NDED 30 JUNE 2012 (continued) 2. SUMMARY OF SIGNIFICANT ACCOUNTING POLICIES (cont inued)
(a) Basis of preparation (continued)
IFRS 13, 'Fair value measurement' is effective for annual periods beginning on or after 1 January 2013. The standard improves consistency and reduces complexity by providing a precise definition of fair value and a single source of fair value measurement and disclosure requirements for use across IFRSs. The requirements do not extend the use of fair value accounting but provide guidance on how it should be applied where its use is already required or permitted by other standards within IFRS. If an asset or a liability measured at fair value has a bid price and an ask price, the standard requires valuation to be based on a price within the bid-ask spread that is most representative of fair value and allows the use of mid-market pricing or other pricing conventions that are used by market participants as a practical expedient for fair value measurement within a bid-ask spread. The new standard is not expected to have any impact on the Company’s financial position or performance. There are no other standards, interpretations or amendments to existing standards that are effective that would be expected to have a significant impact on the Company.
(b) Foreign currency translation (i) Functional and presentation currency
The annual financial report is prepared in US dollars (“US$”), this being the Company’s functional and presentational currency. Management has chosen US$ as the functional and presentation currency for the Company to reflect the fact that most of the Company’s investments are denominated in US$.
(ii) Transactions and balances
Foreign currency transactions are translated into the functional currency using the exchange rates prevailing at the dates of the transactions. Foreign exchange gains and losses resulting from the settlement of such transactions and from the translation at year-end exchange rates of monetary assets and liabilities denominated in foreign currencies are recognised in the statement of comprehensive income. Foreign exchange gains and losses relating to cash and cash equivalents are presented in the statement of comprehensive income within “net foreign currency (losses)/gains”. Foreign exchange gains and losses relating to the financial assets and liabilities carried at fair value through profit or loss are presented in the statement of comprehensive income within “other net changes in fair value on financial assets and financial liabilities at fair value through profit or loss”.
(c) Financial instruments (i) Classification
In accordance with IAS 39, the Company classifies its investments as financial assets and liabilities at fair value through profit or loss. These financial assets and liabilities are classified as held for trading or designated by the Board of Directors at fair value through profit or loss at inception. Financial assets or financial liabilities held for trading are those acquired or incurred principally for the purposes of selling or repurchasing in the near term or derivatives. The Company does not classify any derivatives as hedges in a hedging relationship. All underlying investee funds held by the Company have been designated by the Board of Directors as held at fair value through profit or loss.

FRM CREDIT ALPHA LIMITED
22
NOTES TO THE ANNUAL FINANCIAL REPORT FOR THE YEAR E NDED 30 JUNE 2012 (continued) 2. SUMMARY OF SIGNIFICANT ACCOUNTING POLICIES (cont inued)
(c) Financial instruments (continued) (ii) Recognition/de-recognition
The Company recognises financial assets and financial liabilities at fair value through profit or loss on the trade date - the date it commits to purchase or sell short the instruments. From this date any gains and losses arising from changes in fair value of the assets or liabilities are recognised. Investments are derecognised when the rights to receive cash flows from the investments have expired or the Company has transferred substantially all risks and rewards of ownership.
(iii) Valuation of investments Investments in underlying investee funds are valued at fair value, as determined by each underlying investee fund’s independent administrator or Investment Manager. In determining fair value, the administrator or Investment Manager utilises the valuations of the underlying investee funds to determine the fair value of its fund interests. The underlying investee funds in which the Company is invested value securities and other financial investments on a mark-to-market or fair value basis of accounting. The estimated fair values of certain of the investments of the underlying investee funds may include private placements and other securities for which prices are not readily available. These estimated fair values are determined by the administrators or Investment Managers of the respective underlying investee funds and may not reflect amounts that could be realised upon immediate sale, or amounts that ultimately may be realised. Accordingly, the estimated fair values may differ significantly from the values that would have been used had a ready market existed for these investments and the differences could be material. A number of underlying investee funds changed their redemption terms so as to restrict investor redemptions by gating redemptions, suspending redemptions or creating side pockets, extending notice periods, delaying redemption payments and introducing or extending lock periods. It is the view of the Board of Directors that despite these redemption restrictions the Net Asset Value (“NAV”) provided by the underlying investee fund managers or their administrators represents the most appropriate basis for fair value of these assets. As such no adjustments have been made to the value of the assets in the annual financial report.
(d) Cash and cash equivalents
Cash and cash equivalents include cash in hand. (e) Expenses
Expenses are accounted for on an accruals basis and are charged to the statement of comprehensive income in the year in which they are incurred.
(f) Redemption of shares
Subject to the Directors exercising their discretion to operate the Redemption Facility on any given occasion, Shareholders may request to have some or all of their Sterling Shares redeemed for cash in a Redemption Offer. Depending on the liquidity within the Company’s portfolio, the Directors may elect to pay redemption proceeds either: (i) at a value equal to the prevailing Net Asset Value per Share as at the relevant Redemption Facility Date less costs of redemption; or (ii) at a value equal to the prevailing Net Asset Value per Share as at 31 March of the following year less the costs of redemption (each a “Redemption Facility Calculation Date”).
(g) Interest income and expense
Interest income and expense is recognised in the statement of comprehensive income on an accruals basis.

FRM CREDIT ALPHA LIMITED
23
NOTES TO THE ANNUAL FINANCIAL REPORT FOR THE YEAR E NDED 30 JUNE 2012 (continued)
2. SUMMARY OF SIGNIFICANT ACCOUNTING POLICIES (cont inued)
(h) Sales awaiting settlement
Sales awaiting settlement represent receivables that have been contracted for but not yet settled on the statement of financial position date. These amounts are recognised initially at fair value and subsequently measured at amortised cost using the effective interest method, less provision for impairment. A provision for impairment is established when there is objective evidence that the Company will not be able to collect all amounts due from the relevant counterparty. Significant financial difficulties of the counterparty, probability that the counterparty will enter bankruptcy or financial reorganisation and default in payments are considered indicators that the amount is impaired.
(i) Taxation
The Company has applied for and has been granted exempt status for Guernsey tax purposes. A company that has exempt status for Guernsey tax purposes is exempt from Guernsey income tax under the provisions of the Income Tax (Exempt Bodies) (Guernsey) Ordinance, 1989 and is charged an annual exemption fee of £600. From 1 January 2008, the Income Tax Authority in Guernsey abolished the exempt regime for some entities. At the same time the standard rate of income tax was reduced from 20% to 0%. Therefore some entities previously exempt from tax under the Income Tax (Exempt Bodies) (Guernsey) ordinance, 1989 are now taxed at 0%. However the Income Tax Authority has confirmed that collective investment schemes such as the Company can continue to apply for exempt status. The Directors intend that the Company be managed and controlled in such a way that it should not be deemed resident in the United Kingdom for tax purposes.
(j) (Loss)/profit for the year from operations
(Deficit)/income not distributed is included in (loss)/profit for the year from operations.
(k) Critical accounting estimates and judgements in applying accounting policies
The Company makes estimates and assumptions that affect the reported amounts of assets and liabilities within the next financial year. Estimates are continually evaluated and based on historical experience and other factors, including expectations of future events that are believed to be reasonable under the current circumstances.
(l) Statement of cash flows
The cash amount shown on the statement of cash flows is the net amount reported in the statement of financial position as cash and cash equivalents. The indirect method has been applied in the preparation of the statement of cash flows.
(m) Operating Segments
Operating segments are reported in a manner consistent with the internal reporting used by the Chief Operating Decision-Maker (“CODM”). The CODM, who is responsible for allocation of resources and assessing the performance of the operating segment, has been identified as the Board of Directors. The Board of Directors makes the strategic resource allocations on behalf of the Company. The Company is managed as one operating segment.
3. FEES AND EXPENSES
(a) Management Fee The Company pays the Manager a management fee together with reimbursement of reasonable out of pocket expenses incurred by it in the performance of its duties. Until 3 May 2011 the management fee in respect of the Sterling Shares was charged at the rate of 1% per annum of the Company’s net assets attributable to the Sterling Shares (before deduction of accruals in respect of the management fee for the current month and any performance fee) as at the first Business Day of each calendar month payable monthly in arrears. With effect from 3 May 2011 the management fee in respect of the Sterling Shares was changed to 1% per annum of the Company’s net assets, attributable to the invested assets of the Company only. The management fee for the year was US$158,287 (30 June 2011: US$802,636) and the amount outstanding at the year end was US$19,023 (30 June 2011: US$52,322).
FRM CREDIT ALPHA LIMITED
24
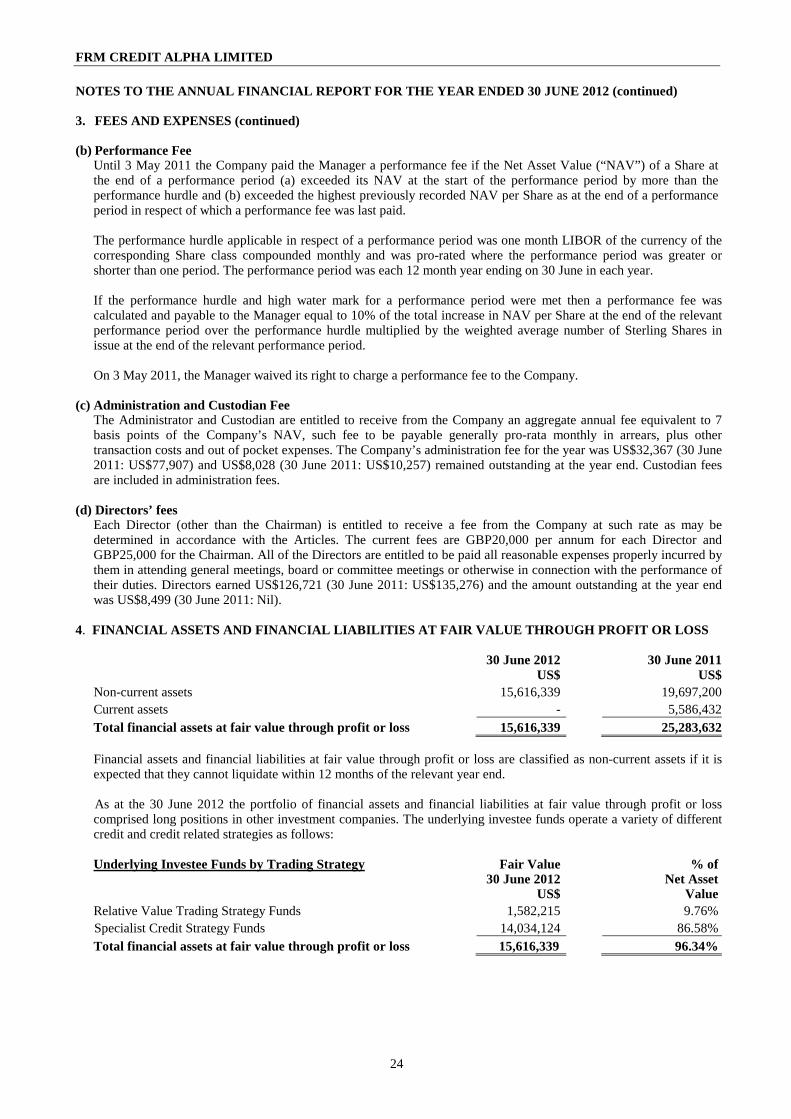
NOTES TO THE ANNUAL FINANCIAL REPORT FOR THE YEAR E NDED 30 JUNE 2012 (continued) 3. FEES AND EXPENSES (continued) (b) Performance Fee
Until 3 May 2011 the Company paid the Manager a performance fee if the Net Asset Value (“NAV”) of a Share at the end of a performance period (a) exceeded its NAV at the start of the performance period by more than the performance hurdle and (b) exceeded the highest previously recorded NAV per Share as at the end of a performance period in respect of which a performance fee was last paid. The performance hurdle applicable in respect of a performance period was one month LIBOR of the currency of the corresponding Share class compounded monthly and was pro-rated where the performance period was greater or shorter than one period. The performance period was each 12 month year ending on 30 June in each year. If the performance hurdle and high water mark for a performance period were met then a performance fee was calculated and payable to the Manager equal to 10% of the total increase in NAV per Share at the end of the relevant performance period over the performance hurdle multiplied by the weighted average number of Sterling Shares in issue at the end of the relevant performance period. On 3 May 2011, the Manager waived its right to charge a performance fee to the Company.
(c) Administration and Custodian Fee
The Administrator and Custodian are entitled to receive from the Company an aggregate annual fee equivalent to 7 basis points of the Company’s NAV, such fee to be payable generally pro-rata monthly in arrears, plus other transaction costs and out of pocket expenses. The Company’s administration fee for the year was US$32,367 (30 June 2011: US$77,907) and US$8,028 (30 June 2011: US$10,257) remained outstanding at the year end. Custodian fees are included in administration fees.
(d) Directors’ fees Each Director (other than the Chairman) is entitled to receive a fee from the Company at such rate as may be determined in accordance with the Articles. The current fees are GBP20,000 per annum for each Director and GBP25,000 for the Chairman. All of the Directors are entitled to be paid all reasonable expenses properly incurred by them in attending general meetings, board or committee meetings or otherwise in connection with the performance of their duties. Directors earned US$126,721 (30 June 2011: US$135,276) and the amount outstanding at the year end was US$8,499 (30 June 2011: Nil).
4. FINANCIAL ASSETS AND FINANCIAL LIABILITIES AT FAIR VALUE THROUGH PROFIT OR LOSS
30 June 2012 30 June 2011 US$ US$Non-current assets 15,616,339 19,697,200Current assets - 5,586,432Total financial assets at fair value through profit or loss 15,616,339 25,283,632
Financial assets and financial liabilities at fair value through profit or loss are classified as non-current assets if it is expected that they cannot liquidate within 12 months of the relevant year end. As at the 30 June 2012 the portfolio of financial assets and financial liabilities at fair value through profit or loss comprised long positions in other investment companies. The underlying investee funds operate a variety of different credit and credit related strategies as follows:
Underlying Investee Funds by Trading Strategy Fair Value % of 30 June 2012
US$ Net Asset
Value Relative Value Trading Strategy Funds 1,582,215 9.76%
, Specialist Credit Strategy Funds 14,034,124 86.58% Total financial assets at fair value through profit or loss 15,616,339 96.34%

FRM CREDIT ALPHA LIMITED
25
NOTES TO THE ANNUAL FINANCIAL REPORT FOR THE YEAR E NDED 30 JUNE 2012 (continued)
4. FINANCIAL ASSETS AND FINANCIAL LIABILITIES AT FA IR VALUE THROUGH PROFIT OR LOSS (continued)
Geographical Exposure Fair Value % of 30 June 2012
US$ Net Asset
ValueGlobal Regions* 14,034,124 86.58%
Europe 928,713 5.73%North America 653,502 4.03%
Total 15,616,339 96.34%
As at the 30 June 2011 the portfolio of financial assets and financial liabilities at fair value through profit or loss comprised long positions in other investment companies. The underlying investee funds operate a variety of different credit and credit related strategies as follows:
Underlying Investee Funds by Trading Strategy Fair Value % of 30 June 2011
US$ Net Asset
ValueRelative Value Trading Strategy Funds 2,686,223 6.05%Specialist Credit Strategy Funds 22,597,409 50.88%Total financial assets at fair value through profit or loss 25,283,632 56.93%
Geographical Exposure Fair Value % of 30 June 2011
US$ Net Asset
ValueGlobal Regions* 22,587,793 50.86%
Europe 2,074,279 4.67%North America 621,560 1.40%
Total 25,283,632 56.93%
*Global Regions includes any underlying investee fund that is not directly exposed to Europe or North America, or is exposed to multiple regions or even globally, such that it is not possible to provide details of specific regional exposure. The portfolio of financial assets at fair value through profit or loss includes positions in other FRM investment funds with a total fair value of US$Nil (30 June 2011: US$1,403,582). A number of underlying investee funds in which the Company invests have undertaken various levels of restructuring which have generally altered the original liquidity terms per their offering documents. These changes have included restructuring, implementing redemption gates, suspending redemptions, creating side pockets, extending notice periods, delaying redemption payments and introducing or extending lock periods. Relative Value Trading Strategy Relative Value is a non-directional market neutral investment strategy that seeks to exploit pricing discrepancies between related securities. The strategy revolves around identifying a pair of related securities where the pricing of the securities does not reflect this relationship. The manager then buys the undervalued security and sells short the overvalued security, locking in a spread. The relative value strategies all involve locking in a spread of some sort and can be identified by the use of the term arbitrage. The opportunities being exploited typically have relatively low risk and commensurately low return, so many managers use leverage to amplify the returns to attractive levels. As a general rule, the closer the relationship between the two securities, the lower the basis risk and the tighter the spread will be. An approach is Relative Value if the position in the portfolio attempts to isolate and capitalise upon a feature of an asset or combination of assets which is mispriced according to theoretical fair value (a position may be made up of several assets but is designed to capture a single pricing element), and all pricing factors other than the identified element are fully hedged or managed, first within the position and then also within the portfolio overall.

FRM CREDIT ALPHA LIMITED
26
NOTES TO THE ANNUAL FINANCIAL REPORT FOR THE YEAR E NDED 30 JUNE 2012 (continued)
4. FINANCIAL ASSETS AND FINANCIAL LIABILITIES AT FA IR VALUE THROUGH PROFIT OR LOSS (continued) Specialist Credit Strategy Specialist Credit could also be described as “fundamental credit investing”. Trades are based around credit analysis of the issuer and security, and may incorporate credit market views. The manager assumes credit risk as a core part of the investment strategy, but interest rate risk is not a significant exposure, being either explicitly hedged or simply far less significant than credit risk. Specialist Credit seeks to buy companies fixed obligation financing (i.e. debt) or 2nd derivatives of that debt (i.e. synthetic credit structures). However, while credit managers will focus predominantly on debt instruments, in certain market environments equities may become a material component in their portfolios e.g. post-reorganisation equity. The investment edge comes from the manager’s ability to perform a high level of micro due diligence on specific issuers and issues and to take advantage of what the manager discerns to be relatively inexpensive securities (cheap). The securities may be inexpensive due to regulatory anomalies or other constraints on traditional lenders (e.g., speed of decision-making process, disclosure rules, etc.). Returns are primarily generated from credit-sensitive investments through capital appreciation (increase in market price), positive carry (yield), or both.
5. OTHER NET CHANGES IN FAIR VALUE ON FINANCIAL ASS ETS AND FINANCIAL LIABILITIES AT FAIR VALUE THROUGH PROFIT OR LOSS
Year ended Year ended 30 June 2012 30 June 2011
US$ US$ (Losses)/gains recognised in relation to financial assets and financial liabilities through profit or loss: Realised (loss)/gain on financial assets and financial liabilities at fair value through profit or loss (6,403,960) 5,336,431 Unrealised gain/(loss) on financial assets and financial liabilities at fair value through profit or loss 3,044,638 (3,474,811) Net realised and unrealised (loss)/gain on financial assets and liabilities at fair value through profit or loss (3,359,322) 1,861,620
The total gains/(losses) recognised in relation to other FRM investment companies are in total: realised (US$1,091,535) (30 June 2011: (US$365,888)) and unrealised US$815,190 (30 June 2011: US$181,243).
6. RISKS ASSOCIATED WITH FINANCIAL INSTRUMENTS
The Board of Directors is ultimately responsible for the Company’s system of internal control and for reviewing its effectiveness. The Board of Directors has established an ongoing process for identifying, evaluating and managing significant risks faced by the Company which involves the Directors conducting, at least annually, a review of the Company’s system of internal control, covering all controls including financial, operational, compliance and risk management. The Board of Directors has reviewed the effectiveness of the system of internal control. In particular, it has reviewed and updated the process for identifying and evaluating significant risks affecting the Company and the policies by which these risks are managed. The internal control systems are designed to meet the Company’s particular needs and the risks to which it is exposed. Accordingly, the internal control systems are designed to manage rather than eliminate the risk of failure to achieve business objectives and by their nature can only provide reasonable and not absolute assurance against misstatement and loss. The Company is exposed to a number of risks as a result of the financial instruments it holds. The Company’s investment activities expose it to various types of risk taken by the Company and the managers of the underlying investee funds, which are associated with the financial instruments and markets in which they invest. The following summary is not intended to be a comprehensive list of all risks and investors should refer to the Prospectus for a more detailed discussion of the risks inherent to investing in the Company.

FRM CREDIT ALPHA LIMITED
27
NOTES TO THE ANNUAL FINANCIAL REPORT FOR THE YEAR E NDED 30 JUNE 2012 (continued)
6. RISKS ASSOCIATED WITH FINANCIAL INSTRUMENTS (con tinued) Market risk The Company can be exposed to market risks by virtue of the underlying investee funds that the Company invests in. Those underlying investee funds may take exposure to a wide range of market factors including equity, credit, foreign exchange, interest rate, emerging and commodity markets. Additionally they may make use of complex derivative instruments to take and manage these exposures. FRM analysts monitor the underlying investee fund managers on a continuing basis on behalf of the Company to ensure that managers have the correct operational controls, systems and skills to manage these risks. Additionally, FRM has an automated fund performance exception reporting process to identify funds that are performing out of line with expectations (which will measure relative analysis to their historic track record and their peer group). Exceptions are discussed at a monthly meeting with the Chief Investment Officer and recorded by the risk team. Market risks at the underlying investee funds portfolio level are controlled via the use of diversification across a wide range of underlying investee fund styles and holdings. This diversification is monitored and controlled via the use of a Value at Risk (“VaR”) system. The broad characteristics of the methodology used to calculate the VaR are as follows: Using return data for the underlying investee funds in each portfolio a return distribution for each fund is estimated. This distribution captures the pertinent features of each of the underlying investee fund’s returns, including return, volatility and any downside risk inherent in the Company. In particular it captures any “fat” tailed effects that a fund may possess. A maximum of five years data is used in this calculation. For funds with short histories, statistical methods are used to backfill the data to a period of sixty months. Statistical methods are then used to simulate a range of possible outcomes for the entire portfolio. These methods not only take into account the correlation between funds (as measured by a covariance matrix), but also the likelihood of tail events happening together. Using this distribution of portfolio returns the overall VaR of the portfolio can then be estimated.
These estimates are produced on a monthly basis by FRM’s risk management team and compared against a set of limits. If the actual values exceed these limits then deviation is discussed with the relevant portfolio manager to agree a relevant course of action. Courses of action may include reducing certain positions, hedging certain factor exposures or changing the limit. Limits are reviewed and signed off by the Chief Investment Officer on a quarterly basis. Currently these expected maximums are set at a value of -2% (30 June 2011: -2%), which means that 95% of the time the maximum monthly loss suffered by the portfolio is not expected to be worse than -2% (30 June 2011: -2%). Since inception, the actual values for the portfolio have ranged from -1% to -6.1% (30 June 2011: -1% to -6.1%).
As at 30 June 2012 the VaR estimate for the Company was -3.40% (30 June 2011: -2.55%). Limitations of the VaR methodology include the following:
• The measure is a point-in-time calculation, reflecting positions as recorded at that date, which do not necessarily
reflect the risk positions held at any other time; • That VaR is a statistical estimation and therefore it is possible that there could be, in any period, a greater
number of days in which losses could exceed the calculated VaR than implied by the confidence level; and • That although losses are not expected to exceed the calculated VaR on, say 95% of occasions, on the other 5% of
occasions, losses will be greater and might be substantially greater than the calculated VaR. The market risk profile of the Company's financial assets as at 30 June 2012 and 30 June 2011 was: 30 Jun 12 30 Jun 11 US$ US$
Financial assets carrying market risk 15,920,524 38,899,350 Currency Risk The Company can be directly exposed to foreign exchange risks by virtue of investments in share classes of funds that are not denominated in its functional currency. Similarly, shareholders in the Company can be directly exposed to foreign exchange risks when investing in share classes of the Company that are not denominated in the Company's functional currency.

FRM CREDIT ALPHA LIMITED
28
NOTES TO THE ANNUAL FINANCIAL REPORT FOR THE YEAR E NDED 30 JUNE 2012 (continued) 6. RISKS ASSOCIATED WITH FINANCIAL INSTRUMENTS (con tinued)
Currency Risk (continued) With effect from 30 December 2010, the Company announced that its currency hedging programme had ceased with immediate effect. It is possible that the underlying investee funds within the portfolio will incur foreign currency risk as an intentional or unintentional part of their investment strategies. The currency risk profile of the Company's financial assets and liabilities as at 30 June 2012 was: Monetary Non-Monetary Total US$ US$ US$
186,130 53 186,183
Total 186,130 53 186,183 The currency risk profile of the Company's financial assets and liabilities as at 30 June 2011 was: Monetary Non-Monetary Total US$ US$ US$
3,763,991 54 3,764,045
Total 3,763,991 54 3,764,045 Interest Rate Risk Interest rate risk is the risk that the fair value or future cash flows of a financial instrument will fluctuate because of changes in market interest rates.
The majority of the Company’s financial assets and liabilities are non-interest bearing and, as a result, the Company is not subject to significant amounts of risk due to fluctuations in the prevailing levels of market interest rates, though the Company may be exposed to interest rate risk at the underlying investee fund level at which the Company invests. The influence of changes in the market rates of interest is not expected to be significant. The Company currently has no credit facility in place. The interest rate risk profile of the Company’s financial assets and liabilities as at 30 June 2012 and 30 June 2011 was: 30 June 2012 30 June 2011 US$ US$ Financial assets not carrying interest rate risk 15,928,411 38,909,498 Financial liabilities not carrying interest rate risk 100,441 118,037 Financial assets carrying interest rate risk 382,276 5,622,127
Credit risk Credit risk relates to the extent to which failures by counterparties to discharge their obligations could reduce the amount of future cash flows from financial assets on hand as at the statement of financial position date. The Company minimises its exposure to credit risk by only dealing with counterparties with high credit ratings and the Manager monitors credit concentrations to reduce associated risk. At the statement of financial position date the Company had all of its cash and cash equivalents held with its Custodian, although from time to time the Company may additionally place cash deposits with banks, limited to those rated AA or higher. Assets held by the Company which potentially expose the Company to credit risk comprise cash balances and receivables in respect of redeemed investments in underlying investee funds. The Company is also exposed indirectly at underlying investee fund level and seeks to actively manage this exposure by performing due diligence checks on each of the underlying investee fund managers. The Company's Custodian is J.P. Morgan Chase Bank, National Association (London Branch) (“J.P. Morgan”). Underlying investee fund holdings are registered in J.P. Morgan nominee accounts which specifically relate to the Company. In respect of cash and cash equivalents held by the Custodian as disclosed in the statement of financial position, the Company may rank as an unsecured creditor in the event of the Custodian’s insolvency and any such cash balances may not be recoverable. Client money is segregated and stored in designated client money accounts within J.P. Morgan. At 30 June 2012 there was no cash held in client money accounts.

FRM CREDIT ALPHA LIMITED
29
NOTES TO THE ANNUAL FINANCIAL REPORT FOR THE YEAR E NDED 30 JUNE 2012 (continued) 6. RISKS ASSOCIATED WITH FINANCIAL INSTRUMENTS (con tinued)
Credit risk (continued) In the event of a default by the Custodian, whether or not the Company could continue would be dependent upon the level of cash lost. Once cash balances within the Company build up to significant levels they are only held for a short time before being distributed to Shareholders. On this basis, it would be expected that the Company would be able to continue in operation. The current ratings of J.P. Morgan are: S&P A+/A-1; Moody’s Aa3/ P-1; and Fitch A+/F1 (30 June 2011: S&P AA-/A-1; Moody’s Aa1/ P-1; and Fitch AA- /F1+). The credit risk profile of the Company's financial assets as at 30 June 2012 and 30 June 2011 was: 30 Jun 12 30 Jun 11 US$ US$
Cash and cash equivalents 382,276 5,622,127Sales awaiting settlement 304,185 13,615,718Interest receivable - 60 All underlying investee fund redemption proceeds are actively monitored by both the Investment Adviser and the Custodian. When underlying investee fund redemptions are placed, the Custodian will follow up with the underlying investee fund administrator to ensure that the redemption request has been received and actioned. They will also ascertain when redemption proceeds are due and will follow up with the administrator if redemption proceeds are not received by this date. Additionally, the Investment Adviser will follow up with the underlying investee fund administrator and/or manager if redemption proceeds are not received by the dates specified in the underlying investee funds’ offering documentation. All outstanding receivables are tracked and monitored on a regular basis and escalated where necessary.
Liquidity risk Liquidity risk is the risk that the Company is unable to meet its obligations as and when they fall due. The Company invests in alternative investment products, which can be highly illiquid. With some underlying investee funds, the Company can only sell their units at certain dates, which may occur monthly, quarterly, annually or less frequently. A lack of liquidity may also result from limited trading opportunities in alternative investment products. The Company may, from time to time, invest in derivative contracts traded over the counter, which are not traded in an organised market and may be illiquid. As a result, the Company may not be able to liquidate quickly its investments in these instruments at an amount close to their fair value to meet its liquidity requirements or to respond to specific events. In accordance with the Company's policy, the Manager monitors the Company's liquidity position on a regular basis with regard to maintaining a reasonable level of liquidity. Significant variation from reasonable levels will result in notification to the Board of Directors. The Company is closed ended and therefore, save for the operation of the Redemption Facility or a distribution being declared by the Directors as part of the managed wind down process, the Shareholders cannot redeem their holdings. Liquidity risk is therefore mitigated as the Board of Directors and Investment Manager are able to manage liquidity risk with respect to the liquidity of the underlying assets held. The Portfolio Management team is responsible for constructing portfolios with appropriate liquidity profiles, which may be specified directly by clients or by third party credit providers. The liquidity impact of any given trade or corporate action is considered by the portfolio managers who will seek advice from the respective sector analyst when making trading decisions. When trades are requested by the Portfolio Management team, the Investment Administration team review the proposed trade to ensure that it complies with any specified liquidity constraints. Trades which do not comply with portfolio liquidity constraints are not executed, and referred back to the respective portfolio manager.

FRM CREDIT ALPHA LIMITED
30
NOTES TO THE ANNUAL FINANCIAL REPORT FOR THE YEAR E NDED 30 JUNE 2012 (continued)
6. RISKS ASSOCIATED WITH FINANCIAL INSTRUMENTS (con tinued) Liquidity risk (continued) As at 30 June 2012 a number of underlying investee funds in which the Company invests had restructured so as to restrict investor redemptions. Restructured funds are defined as those underlying investee funds that have undertaken various levels of restructuring which have generally altered the original liquidity terms per their offering documents. These changes have included creating new share classes (such as continuing and/or liquidating share classes), implementing redemption gates, suspending redemptions, creating side pockets, extending notice periods, delaying redemption payments and introducing or extending lock periods. There have been no changes in respect of these underlying investee funds subsequent to the year end. Having factored in these redemption restrictions and taking into account redemption requests already submitted to underlying investee fund managers prior to the year end it is estimated that as at 30 June 2012 and 30 June 2011 the liquidity profile of the Company was as follows: 30 June 2012
% of 30 June 2011
% of Total Assets Total Assets Up to one month liquidity 2.39% 29.20% One to three months liquidity - 6.82% Three to six months liquidity - 1.91% Up to annual liquidity 1.87% 9.64% Liquidity of more than one year 95.74% 52.43% Total 100.00% 100.00% The Company entered a managed wind-down phase with effect from 17 March 2011. The portfolio manager is liquidating the portfolio under the supervision of the Board with a view to maximising the capital returned to shareholders. On 11 May 2011, the Company resolved to make an initial distribution of £31,000,000. On 14 July 2011, the Company resolved to make a second distribution of approximately £8,000,000. On 23 January 2012 the Company resolved to make a third distribution of approximately £4,500,000. On 11 May 2012 the Company resolved to make a fourth distribution of approximately £2,700,000. As the liquidation of the portfolio progresses and capital is distributed to shareholders the portfolio will become progressively more concentrated in a small number of illiquid investments. This is reflected by the fact that approximately 98% of the portfolio as at 30 June 2012 is invested in assets with a liquidity profile of greater than six months.
It is the view of the Directors that despite these redemption restrictions the NAV provided by the underlying investee fund managers or their administrators represents the most appropriate basis for fair value of these assets. As such no adjustments have been made to the value of these assets in the annual financial report. The table below analyses the Company's financial liabilities into relevant maturity groupings based on the remaining year at the financial reporting date to the contractual maturity date. The amounts in the table are the contractual undiscounted cash flows. Balances due within 12 months equal their carrying balances, as the impact of discounting is not significant.
There follows a table to split the liabilities into periods of up to 1 month, 1 to 3 months and 3 to 6 months:
30 June 2012 (US$)
Up to 1 Month
1 to 3 Months
3 to 6 Months
Total
Accrued expenses and other liabilities payable 64,924 35,517 - 100,441
Total Liabilities 64,924 35,517 - 100,441 30 June 2011 (US$)
Up to 1 Month
1 to 3 Months
3 to 6 Months
Total
Accrued expenses and other liabilities payable 62,579 55,458 - 118,037 Total Liabilities 62,579 55,458 - 118,037

FRM CREDIT ALPHA LIMITED
31
NOTES TO THE ANNUAL FINANCIAL REPORT FOR THE YEAR E NDED 30 JUNE 2012 (continued) 7. FAIR VALUE ESTIMATION
IFRS 7, (Amendment), Financial Instruments: Disclosures, requires the Company to classify fair value measurements using a fair value hierarchy that reflects the significance of the inputs used in making the measurements. The hierarchy gives the highest priority to unadjusted quoted prices in active markets for identical assets or liabilities (level 1 measurement) and the lowest priority to unobservable inputs (level 3 measurements). The fair value hierarchy has the following levels: • Level 1 – Inputs that reflect unadjusted quoted prices in active markets for identical assets or liabilities that the
Company has the ability to access at the measurement date; • Level 2 – Inputs other than quoted prices that are observable for the asset or liability either directly or indirectly,
including inputs in markets that are not considered to be active; and • Level 3 – Inputs for the asset or liability that are not based on observable market data.
Inputs broadly refer to the assumptions that market participants use to make valuation decisions, including assumptions about risk.
The Manager generally uses the unaudited NAV reported by the underlying investee fund manager as the primary input to its valuation; however adjustments to the reported NAV may be made based on various factors, including, but not limited to, the attributes of the interest held, including the rights and obligations, and any restrictions or illiquidity on such interests, and the fair value of the such underlying investee fund's investment portfolio or other assets and liabilities. As at 30 June 2012 no such adjustments have been made.
The level in the fair value hierarchy within which the fair value measurement is categorised is based on the lowest level input that is significant to the fair value measurement. However, the determination of what constitutes “observable” requires significant judgement by the Manager. The Manager considers observable data to be that market data which is readily available, regularly distributed or updated, reliable and verifiable, not proprietary, and provided by multiple, independent sources that are actively involved in the relevant market. The categorisation of an underlying investee fund within the hierarchy is based upon the pricing transparency of that underlying investee fund and does not necessarily correspond to the Manager's perceived risk of that underlying investee fund.
All of the Company's investments in underlying investee funds have been classified as level 3 or level 2, and the Company generally does not hold any investments that could be classified as level 1, as observable prices are typically not available. The Manager uses the "market approach" valuation technique to value its investments in underlying investee funds, as described further below:
Underlying investee funds are generally open-end funds as they typically offer subscription and redemption options to investors. The frequency of such subscriptions or redemptions is dictated by such underlying investee fund's governing documents. The amount of liquidity provided to investors in a particular underlying investee fund is generally consistent with the liquidity and risk associated with the underlying investee fund portfolio (i.e., the more liquid the investments in the portfolio, the greater the liquidity provided to the investors). Liquidity of individual underlying investee funds vary based on various factors and may include "gates", "holdbacks" and "side pockets" imposed by the manager of the underlying investee fund, as well as redemption fees which may also apply. Depending on the redemption options available, it may be possible that the reported NAV represents fair value based on observable data such as ongoing redemption and/or subscription activity. In these cases, the NAV is considered as a level 2 input. However, certain underlying investee funds may provide the Manager with the ability to suspend or postpone redemption (a "gate") or "hold back" from the payment of redemption proceeds a portion of the redemption (e.g. 10%) until the annual financial report are distributed. In the case of the imposition of a gate, the Manager's ability to validate or verify the NAV through redeeming is impaired and the interest is generally classified as level 3.
In the cases of a holdback, the Manager considers the significance of the holdback, its impact on the overall valuation and the associated risk that the holdback amount will not be fully realised based on a prior history of adjustments to the initially reported NAV. If the holdback is significant, then the interest is generally classified as level 3.
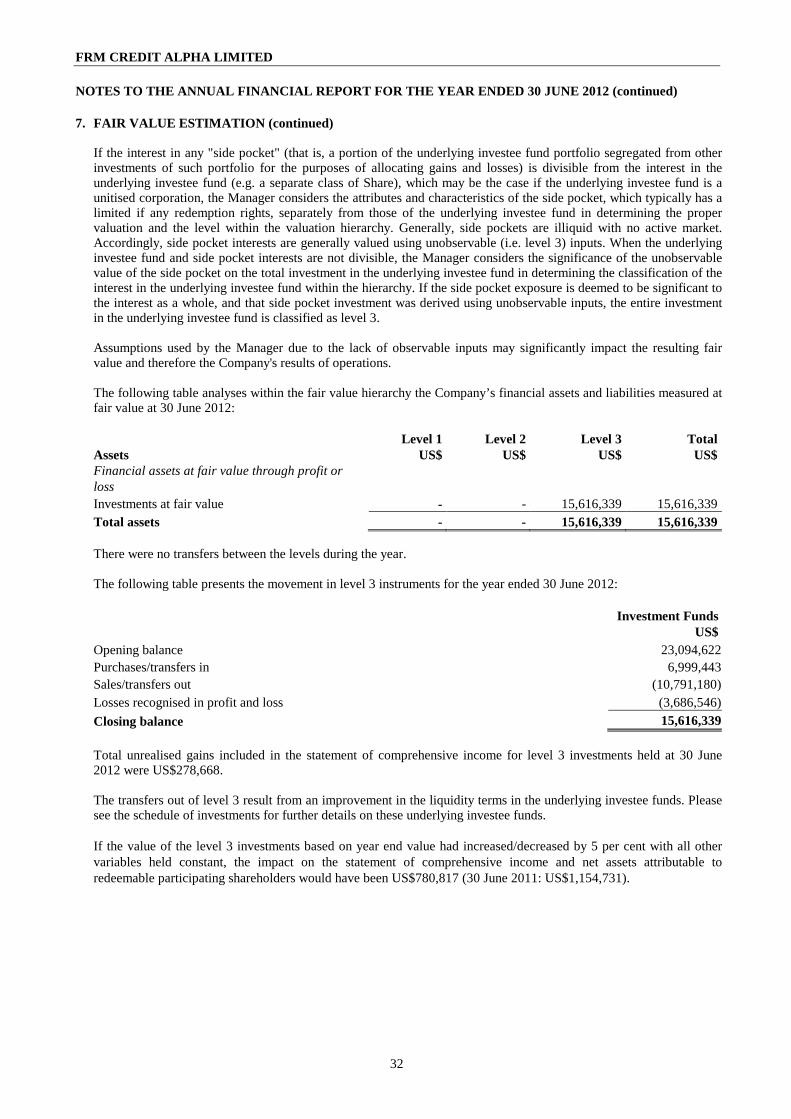
FRM CREDIT ALPHA LIMITED
32
NOTES TO THE ANNUAL FINANCIAL REPORT FOR THE YEAR E NDED 30 JUNE 2012 (continued) 7. FAIR VALUE ESTIMATION (continued)
If the interest in any "side pocket" (that is, a portion of the underlying investee fund portfolio segregated from other investments of such portfolio for the purposes of allocating gains and losses) is divisible from the interest in the underlying investee fund (e.g. a separate class of Share), which may be the case if the underlying investee fund is a unitised corporation, the Manager considers the attributes and characteristics of the side pocket, which typically has a limited if any redemption rights, separately from those of the underlying investee fund in determining the proper valuation and the level within the valuation hierarchy. Generally, side pockets are illiquid with no active market. Accordingly, side pocket interests are generally valued using unobservable (i.e. level 3) inputs. When the underlying investee fund and side pocket interests are not divisible, the Manager considers the significance of the unobservable value of the side pocket on the total investment in the underlying investee fund in determining the classification of the interest in the underlying investee fund within the hierarchy. If the side pocket exposure is deemed to be significant to the interest as a whole, and that side pocket investment was derived using unobservable inputs, the entire investment in the underlying investee fund is classified as level 3. Assumptions used by the Manager due to the lack of observable inputs may significantly impact the resulting fair value and therefore the Company's results of operations. The following table analyses within the fair value hierarchy the Company’s financial assets and liabilities measured at fair value at 30 June 2012:
Level 1 Level 2 Level 3 Total
Assets US$ US$ US$ US$ Financial assets at fair value through profit or loss Investments at fair value - - 15,616,339 15,616,339 Total assets - - 15,616,339 15,616,339
There were no transfers between the levels during the year. The following table presents the movement in level 3 instruments for the year ended 30 June 2012: Investment Funds US$ Opening balance 23,094,622 Purchases/transfers in 6,999,443 Sales/transfers out (10,791,180) Losses recognised in profit and loss (3,686,546)
Closing balance 15,616,339
Total unrealised gains included in the statement of comprehensive income for level 3 investments held at 30 June 2012 were US$278,668. The transfers out of level 3 result from an improvement in the liquidity terms in the underlying investee funds. Please see the schedule of investments for further details on these underlying investee funds. If the value of the level 3 investments based on year end value had increased/decreased by 5 per cent with all other variables held constant, the impact on the statement of comprehensive income and net assets attributable to redeemable participating shareholders would have been US$780,817 (30 June 2011: US$1,154,731).
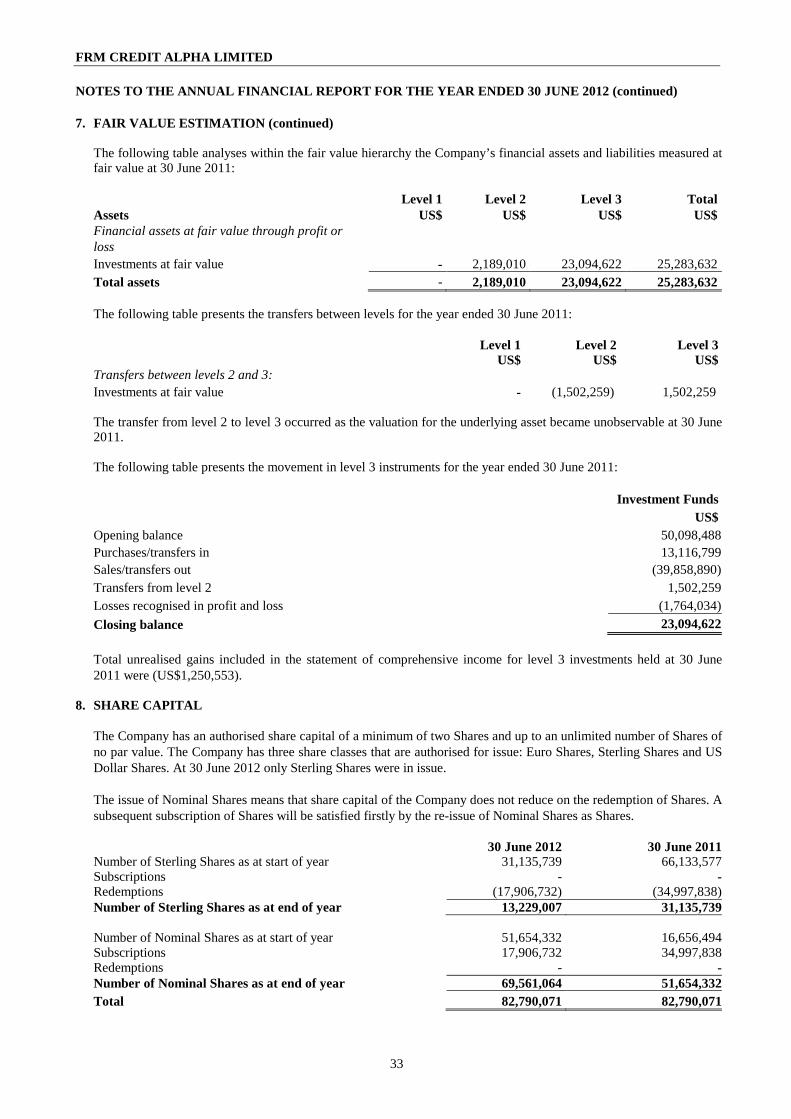
FRM CREDIT ALPHA LIMITED
33
NOTES TO THE ANNUAL FINANCIAL REPORT FOR THE YEAR E NDED 30 JUNE 2012 (continued) 7. FAIR VALUE ESTIMATION (continued)
The following table analyses within the fair value hierarchy the Company’s financial assets and liabilities measured at fair value at 30 June 2011:
Level 1 Level 2 Level 3 Total
Assets US$ US$ US$ US$ Financial assets at fair value through profit or loss Investments at fair value - 2,189,010 23,094,622 25,283,632 Total assets - 2,189,010 23,094,622 25,283,632
The following table presents the transfers between levels for the year ended 30 June 2011: Level 1 Level 2 Level 3
US$ US$ US$ Transfers between levels 2 and 3: Investments at fair value - (1,502,259) 1,502,259 The transfer from level 2 to level 3 occurred as the valuation for the underlying asset became unobservable at 30 June 2011. The following table presents the movement in level 3 instruments for the year ended 30 June 2011: Investment Funds US$ Opening balance 50,098,488 Purchases/transfers in 13,116,799 Sales/transfers out (39,858,890) Transfers from level 2 1,502,259 Losses recognised in profit and loss (1,764,034)
Closing balance 23,094,622
Total unrealised gains included in the statement of comprehensive income for level 3 investments held at 30 June 2011 were (US$1,250,553).
8. SHARE CAPITAL
The Company has an authorised share capital of a minimum of two Shares and up to an unlimited number of Shares of no par value. The Company has three share classes that are authorised for issue: Euro Shares, Sterling Shares and US Dollar Shares. At 30 June 2012 only Sterling Shares were in issue. The issue of Nominal Shares means that share capital of the Company does not reduce on the redemption of Shares. A subsequent subscription of Shares will be satisfied firstly by the re-issue of Nominal Shares as Shares. 30 June 2012 30 June 2011
Number of Sterling Shares as at start of year 31,135,739 66,133,577Subscriptions - -Redemptions (17,906,732) (34,997,838)Number of Sterling Shares as at end of year 13,229,007 31,135,739
Number of Nominal Shares as at start of year 51,654,332 16,656,494Subscriptions 17,906,732 34,997,838Redemptions - -Number of Nominal Shares as at end of year 69,561,064 51,654,332Total 82,790,071 82,790,071
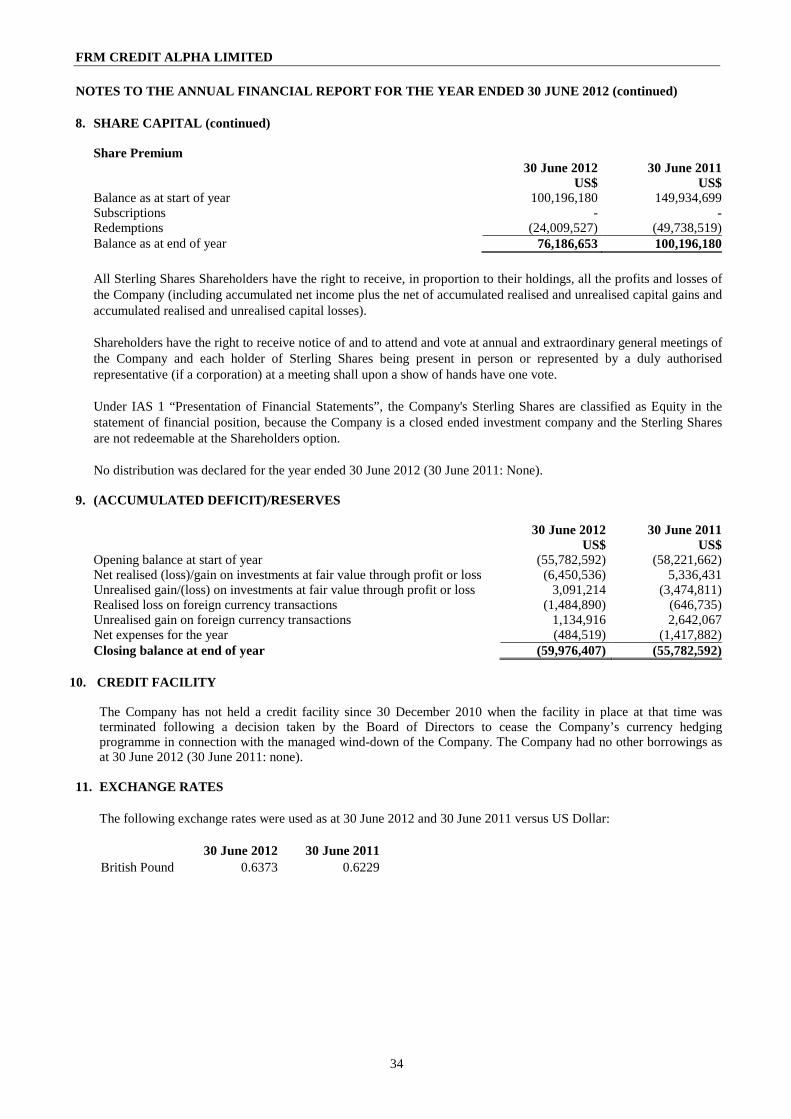
FRM CREDIT ALPHA LIMITED
34
NOTES TO THE ANNUAL FINANCIAL REPORT FOR THE YEAR E NDED 30 JUNE 2012 (continued) 8. SHARE CAPITAL (continued)
Share Premium 30 June 2012 30 June 2011 US$ US$Balance as at start of year 100,196,180 149,934,699Subscriptions - -Redemptions (24,009,527) (49,738,519)Balance as at end of year 76,186,653 100,196,180
All Sterling Shares Shareholders have the right to receive, in proportion to their holdings, all the profits and losses of the Company (including accumulated net income plus the net of accumulated realised and unrealised capital gains and accumulated realised and unrealised capital losses). Shareholders have the right to receive notice of and to attend and vote at annual and extraordinary general meetings of the Company and each holder of Sterling Shares being present in person or represented by a duly authorised representative (if a corporation) at a meeting shall upon a show of hands have one vote. Under IAS 1 “Presentation of Financial Statements”, the Company's Sterling Shares are classified as Equity in the statement of financial position, because the Company is a closed ended investment company and the Sterling Shares are not redeemable at the Shareholders option. No distribution was declared for the year ended 30 June 2012 (30 June 2011: None).
9. (ACCUMULATED DEFICIT)/RESERVES
30 June 2012 30 June 2011 US$ US$
Opening balance at start of year (55,782,592) (58,221,662)Net realised (loss)/gain on investments at fair value through profit or loss (6,450,536) 5,336,431Unrealised gain/(loss) on investments at fair value through profit or loss 3,091,214 (3,474,811)Realised loss on foreign currency transactions (1,484,890) (646,735)Unrealised gain on foreign currency transactions 1,134,916 2,642,067Net expenses for the year (484,519) (1,417,882)Closing balance at end of year (59,976,407) (55,782,592)
10. CREDIT FACILITY
The Company has not held a credit facility since 30 December 2010 when the facility in place at that time was terminated following a decision taken by the Board of Directors to cease the Company’s currency hedging programme in connection with the managed wind-down of the Company. The Company had no other borrowings as at 30 June 2012 (30 June 2011: none).
11. EXCHANGE RATES
The following exchange rates were used as at 30 June 2012 and 30 June 2011 versus US Dollar:
30 June 2012 30 June 2011 British Pound 0.6373 0.6229

FRM CREDIT ALPHA LIMITED
35
NOTES TO THE ANNUAL FINANCIAL REPORT FOR THE YEAR E NDED 30 JUNE 2012 (continued) 12. RELATED PARTY TRANSACTIONS
Parties are considered related if one party has the ability to control the other party or exercise significant influence over the other party in making financial or operational decisions. The Company is managed by FRM Investment Management Limited, an Investment Management Company incorporated in Guernsey, Channel Islands, under the terms of the Investment Management agreement.
The Manager and Investment Adviser are regarded as related parties. Details of fees paid to the Manager are disclosed in note 3(a).
As at 30 June 2012, Richard Hotchkis, a Director of the Company, held 6,002 Sterling Shares (30 June 2011: 14,124) in the Company. The amount of the consideration received from proceeds was £6,900. Details of Directors fees are disclosed in note 3(d). During the year 2012 the Company received shares in underlying investee funds that were transferred from other FRM Managed Funds: Underlying Investee Fund:
Shares transferred from:
No. of
Shares
Fair Value at date of transfer
US$
Harbinger Capital Partners - Class L Holdings (Cayman) Class L Series 2 Sidepocket
FRM Conduit Fund SPC - Harbinger Segregated Portfolio 12 45,830
Harbinger Capital Partners - Class PE Holdings (Cayman) Class PE Series 1 Sidepocket
FRM Conduit Fund SPC - Harbinger Segregated Portfolio 747 385,302
Harbinger Class L Holdings (Cayman), Ltd - Class L Series 04-10
FRM Conduit Fund SPC - Harbinger Segregated Portfolio 1 752
Harbinger Class L Holdings (Cayman), Ltd - Class L Series 07-10
FRM Conduit Fund SPC - Harbinger Segregated Portfolio 1 672
Harbinger Class L Holdings (Cayman), Ltd - Class L Series 10 Sidepocket
FRM Conduit Fund SPC - Harbinger Segregated Portfolio 1 763
Harbinger Class L Holdings (Cayman), Ltd - Class L Series 1-10 Sidepocket
FRM Conduit Fund SPC - Harbinger Segregated Portfolio 1 756
Harbinger Class L Holdings (Cayman), Ltd - Class L Series 3
FRM Conduit Fund SPC - Harbinger Segregated Portfolio 15 49,411
Harbinger Class L Holdings (Cayman), Ltd - Class L Series 6
FRM Conduit Fund SPC - Harbinger Segregated Portfolio
- 829
Harbinger Class PE Holdings (Cayman), Ltd - Class PE Series 01-10 Sidepocket
FRM Conduit Fund SPC - Harbinger Segregated Portfolio 12 6,668
Harbinger Class PE Holdings (Cayman), Ltd - Class PE Series 04-10
FRM Conduit Fund SPC - Harbinger Segregated Portfolio 11 6,668
Harbinger Class PE Holdings (Cayman), Ltd - Class PE Series 07-10
FRM Conduit Fund SPC - Harbinger Segregated Portfolio 9 5,977
Harbinger Class PE Holdings (Cayman), Ltd - Class PE Series 10 Sidepocket
FRM Conduit Fund SPC - Harbinger Segregated Portfolio 12 6,668
Harbinger Class PE Holdings (Cayman), Ltd - Class PE Series 2
FRM Conduit Fund SPC - Harbinger Segregated Portfolio 748 414,207
Harbinger Class PE Holdings (Cayman), Ltd - Class PE Series 6
FRM Conduit Fund SPC - Harbinger Segregated Portfolio
13 7,112
The Company had no investments in funds, which have the same Manager as the Company at 30 June 2012. The Company invested in the following funds, which have the same Manager as the Company at 30 June 2011:
30 June 2011 Value Fund US$ FRM Conduit Fund SPC - Harbinger Segregated Portfolio 1,403,582 Total 1,403,582 All transactions with related parties were at arm’s length.

FRM CREDIT ALPHA LIMITED
36
NOTES TO THE ANNUAL FINANCIAL REPORT FOR THE YEAR E NDED 30 JUNE 2012 (continued) 13. DISTRIBUTION FACILITY
Shareholders are entitled to elect to participate in the Distribution Facility which provides an annual distribution by way of redemption of Sterling Shares, subject to certain limitations and the Directors exercising their discretion to operate the facility on any relevant occasion. Redemption of Sterling Shares on any Distribution Date will be restricted to a specific percentage of the number of Sterling Shares held by a Shareholder. This percentage will be determined by the Directors in their discretion when they declare the annual distribution, but it is their intention to distribute up to two thirds of Total Returns, capped at 3.5 per cent of year end NAV. There was no distribution made under the terms of the Distribution Facility during the year ended 30 June 2012 (30 June 2011: US$Nil).
14. SEGMENTAL REPORTING
Analysis between activities is not presented as the Company’s operations comprise a simple class of business and is not focused on specific geographical regions. IFRS 8 requires disclosure in respect of the Chief Operating Decision Maker (“CODM”) and certain disclosures in respect of the country of origin of income, which may consist of interest and dividends. Management have determined that the CODM is the Board of Directors. The Company trades in a portfolio of underlying investee funds with the objective of pursuing a variety of different credit and credit-related trading strategies. The internal reporting provided to the Board of Directors for the Company’s assets, liabilities and performance is prepared on a consistent basis with the measurement and recognition of IFRS. Generally underlying investees do not declare dividends. The Company earned no dividend income from any of its underlying investee funds investments during the year (30 June 2011: Nil). There were no changes in the reportable segments during the year. The Company is domiciled in Guernsey. Refer to note 4 for details of strategy and geographical exposures. The Company’s Portfolio Statement is shown on pages 39 to 41.
15. SIGNIFICANT EVENTS DURING THE YEAR
Managed Wind-Down The managed wind-down process has continued in line with the Company’s modified investment policy of realising the Company’s existing investments in an orderly and timely manner, with a view to distributing cash to Shareholders at appropriate times as sufficient investments are realised. The Company will not make any new investments other than in cash or cash equivalents pending distribution of cash to Shareholders. On 14 July 2011, the Company resolved to return approximately £8,000,000 by way of a further compulsory partial redemption of shares at a price of 88.9 pence per share, the Company’s NAV per share as at 30 June 2011. Payment in respect of this redemption was made on 29 July 2011. On 20 December 2011, the Company resolved to return approximately £4,500,000 by way of a further compulsory partial redemption of shares at a price of 82.0 pence per share, the Company’s NAV per share as at 31 December 2011. Payment in respect of this redemption was made on 31 January 2012. On 20 June 2012, the Company resolved to return approximately £2,700,000 by way of a further compulsory partial redemption of shares at a price of 79.1 pence per share, the Company’s NAV per share as at 31 May 2012. Payment in respect of this redemption was made on 29 June 2012. Highland Crusader The Company submitted a full redemption request in respect of its holding in Highland Crusader Fund II Ltd (“Highland”) on 30 June 2008.

FRM CREDIT ALPHA LIMITED
37
NOTES TO THE ANNUAL FINANCIAL REPORT FOR THE YEAR E NDED 30 JUNE 2012 (continued) 15. SIGNIFICANT EVENTS DURING THE YEAR (continued)
Highland Crusader (continued) On 15 November 2008, the Manager of Highland advised that Highland’s directors had made a decision to compulsorily redeem all remaining Shares in Highland and that from that time all creditors of Highland including investors who had submitted redemption requests for 30 June 2008 (“prior redeemers”) would be treated in the same way and be subject to market movements on Highland’s assets and liabilities. The Company was classed as a prior redeemer given that it had submitted its redemption request on 30 June 2008. As a result of the action taken by Highland, the Directors, based on recommendations made by FRM Investment Management Limited, agreed to adjust the receivable in each of the monthly valuations to take into account what they believed, on a best information basis, to be the fair value of the receivable. During the financial year ended 31 December 2009, a mediation process was agreed. The mediation involved groups representing prior redeemers and those shareholders who had been compulsorily redeemed (“compulsory redeemers”). As the outcome of this mediation process was unclear, the Directors agreed, with a recommendation from FRM Investment Management Limited, that a provision against the receivable should be included in the monthly valuations. The Directors of the Company considered the appropriateness of these provisions at each valuation point. On 7 July 2011, the Manager of Highland issued a Scheme of Arrangement which was approved by the prior redeemers and the compulsory redeemers and also approved by the Bermuda court. The Scheme of Arrangement set out the treatment of prior and compulsory redeemers and included a plan of distribution in respect of Highland’s assets. Distributions totalling US$809,742, US$411,990, US$416,832 and US$378,185 were paid to the Company in October 2011, November 2011, February 2012 and May 2012 respectively. In October 2011, Highland began to re-issue price statements to its investors. In March 2012 the Directors considered it appropriate to reclassify the balance due from Highland from being shown as a receivable to being shown as a financial asset at fair value through profit or loss. As at 30 June 2012, the balance due from Highland was US$4,317,424. This is based on the Directors having included a provision of 5.7% of the June 2012 price estimate provided by Highland, following a further recommendation made by the Manager of the Company. The table below shows the information as at 30 June 2012 in respect of the balance: Original Sale Proceeds
Cumulative Market Movement to 30 June 2012
Distributions Received
Provision at 30 June 2012
Net Receivable at 30 June 2012
US$ US$ US$ US$ US$ 6,485,931 109,210 (2,016,749) (260,968) 4,317,424 The balance as at 30 June 2012 represents the best estimate of the value which management believes it will receive from Highland as at that date, however this balance is subject to market movements and as such is subject to change on a monthly basis. There have been no other significant events during the year that have impacted the Company and require disclosure in the audited financial statements.
16. SIGNIFICANT EVENTS SINCE THE YEAR END
Highland Crusader As noted above, the provision against the Highland balance as at 30 June 2012 was US$260,968. Subsequent to the year end the Directors have, based on a recommendation made by the Investment Manager, released the provision in full.

FRM CREDIT ALPHA LIMITED
38
NOTES TO THE ANNUAL FINANCIAL REPORT FOR THE YEAR E NDED 30 JUNE 2012 (continued)
16. SIGNIFICANT EVENTS SINCE THE YEAR END (continued) Change of Control On 17 July 2012 Man Group plc completed its acquisition of FRM Holdings Limited. This change of control resulted in Man Group plc becoming the ultimate parent company of the Manager and Investment Adviser with effect from that date. There have been no other significant events since the year end that impact the Company and require disclosure in the annual financial report.
17. APPROVAL OF ANNUAL FINANCIAL REPORT
The annual financial report for the year ended 30 June 2012 was approved by the Board of Directors on 15 October 2012.

FRM CREDIT ALPHA LIMITED
39
PORTFOLIO STATEMENT AS AT 30 JUNE 2012
Quantity Fair Value % of Net US$ Assets
Underlying Investee Fund Trading Strategy –Relative Value Trading Strategy* Bluebay Value Recovery Fund Ltd Class S USD 1 928,713 5.73% Claren Road Class L International Series 1 653,502 4.03%
Underlying Investee Fund Trading Strategy –Specialist Credit Strategy* Cerberus International SPV Ltd 4,987 6,561,197 40.48% Golden Tree Offshore Fund II 401 387,669 2.39% Golden Tree Special Holdings IV Sidepockets 390 16,124 0.10% Harbinger Capital Partners - Class L Holdings (Cayman) Class L Series 2 Sidepocket 12 38,153 0.24% Harbinger Capital Partners - Class PE Holdings (Cayman) Class PE Series 1 Sidepocket 747 310,667 1.92% Harbinger Capital Partners Special Situation Offshore 1 1,645,725 10.16% Harbinger Capital Partners Special Situation Offshore Special Investment Sidepocket 1 43,415 0.27% Harbinger Class L Holdings (Cayman), Ltd - Class L Series 04-10 1 628 0.00% Harbinger Class L Holdings (Cayman), Ltd - Class L Series 07-10 1 555 0.00% Harbinger Class L Holdings (Cayman), Ltd - Class L Series 10 Sidepocket 1 641 0.00% Harbinger Class L Holdings (Cayman), Ltd - Class L Series 1-10 Sidepocket 1 632 0.00% Harbinger Class L Holdings (Cayman), Ltd - Class L Series 3 15 41,127 0.25% Harbinger Class L Holdings (Cayman), Ltd - Class L Series 6 0 681 0.00% Harbinger Class PE Holdings (Cayman), Ltd - Class PE Series 01-10 Sidepocket 12 5,375 0.03% Harbinger Class PE Holdings (Cayman), Ltd - Class PE Series 04-10 11 5,373 0.03% Harbinger Class PE Holdings (Cayman), Ltd - Class PE Series 07-10 9 4,818 0.03% Harbinger Class PE Holdings (Cayman), Ltd - Class PE Series 10 Sidepocket 12 5,374 0.03% Harbinger Class PE Holdings (Cayman), Ltd - Class PE Series 2 748 333,968 2.06% Harbinger Class PE Holdings (Cayman), Ltd - Class PE Series 6 13 5,734 0.04% Highland Crusader II Ltd 1 4,317,424 26.64% King Street Capital Ltd Class S Series 1 278 28,015 0.17%
King Street Capital Ltd Class S Series 4 15 40 0.00%
King Street Capital Ltd Class S Series 5 15 1,016 0.01%
King Street Capital Ltd Class S Series 7 1 27 0.00%
King Street Capital Ltd Class S Series 9 1 96 0.00%
King Street Capital Ltd Class S Series 13 215 15,026 0.09%
King Street Capital Ltd Class S Series 14 200 35,728 0.22%
King Street Capital Ltd Class S Series 18 92 10,879 0.07%
King Street Capital Ltd Class S Series 20 172 17,046 0.11%
King Street Capital Ltd Class S Series 24 18 2,067 0.01%
King Street Capital Ltd Class S Series 28 60 8,691 0.05%
King Street Capital Ltd Class S Series 30 8 53 0.00%
King Street Capital Ltd Class S Series 32 79 8,493 0.05%
King Street Capital Ltd Class S Series 34 78 7,855 0.05%
King Street Capital Ltd Class S Series 40 206 29,333 0.18%
King Street Capital Ltd Class S Series 44 10 1,128 0.01%
King Street Capital Ltd Class S Series 46 16 1,606 0.01%
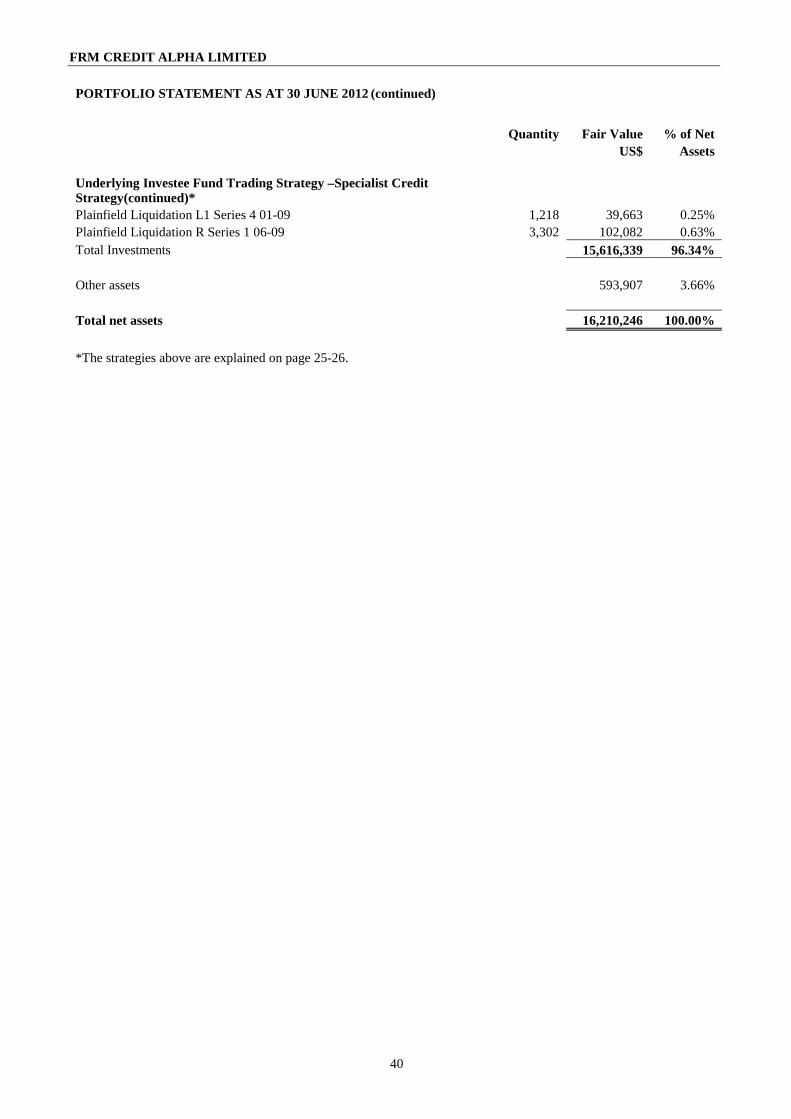
FRM CREDIT ALPHA LIMITED
40
PORTFOLIO STATEMENT AS AT 30 JUNE 2012 (continued)
Quantity Fair Value % of Net US$ Assets
Underlying Investee Fund Trading Strategy –Specialist Credit Strategy(continued)* Plainfield Liquidation L1 Series 4 01-09 1,218 39,663 0.25% Plainfield Liquidation R Series 1 06-09 3,302 102,082 0.63% Total Investments 15,616,339 96.34%
Other assets 593,907 3.66%
Total net assets 16,210,246 100.00%
*The strategies above are explained on page 25-26.

FRM CREDIT ALPHA LIMITED
41
PORTFOLIO STATEMENT AS AT 30 JUNE 2011
Quantity Fair Value % of Net US$ Assets
Underlying Investee Fund Trading Strategy -Relative Value Trading Strategy* BlueBay Value Recovery Fund 30,123 2,064,663 4.65% Claren Road Class L International Series 1 621,560 1.40% Underlying Investee Fund Trading Strategy -Specialist Credit Strategy* Cerberus International SPV Ltd 5,752 7,049,023 15.87% FRM Conduit Fund SPC Harbinger Segregated Portfolio 20,565 1,403,582 3.16% Golden Tree Offshore Fund II 988 1,175,001 2.65% Golden Tree Special Holdings IV Sidepocket 1,227 63,029 0.14% Harbinger Capital Partners Special Situation Offshore 1 3,348,433 7.54% Harbinger Capital Partners Special Situation Offshore Special Investment Sidepocket 1 654,136 1.47% King Street Capital Ltd Class A Post 1 Feb 06 Series 2 7,388 3,676,236 8.28% King Street Capital Ltd Class A Post 1 Feb 06 Series 4 740 98,678 0.22% King Street Capital Ltd Class A Series 2 30 7,794 0.02% King Street Capital Ltd Class S Series 1 278 27,946 0.06% King Street Capital Ltd Class S Series 4 15 156 0.00% King Street Capital Ltd Class S Series 5 15 1,013 0.00% King Street Capital Ltd Class S Series 7 1 52 0.00% King Street Capital Ltd Class S Series 9 1 76 0.00% King Street Capital Ltd Class S Series 13 258 16,957 0.04% King Street Capital Ltd Class S Series 14 724 88,916 0.20% King Street Capital Ltd Class S Series 16 109 17,048 0.04% King Street Capital Ltd Class S Series 18 153 15,327 0.03% King Street Capital Ltd Class S Series 20 172 18,307 0.04% King Street Capital Ltd Class S Series 24 337 37,633 0.08% King Street Capital Ltd Class S Series 28 123 13,075 0.03% King Street Capital Ltd Class S Series 30 8 803 0.00% King Street Capital Ltd Class S Series 32 135 13,221 0.03% King Street Capital Ltd Class S Series 34 78 7,765 0.02% King Street Capital Ltd Class S Series 36 80 7,816 0.02% King Street Capital Ltd Class S Series 38 52 5,056 0.01% King Street Capital Ltd Class S Series 40 378 37,497 0.08% Oak Hill Credit Alpha Fund Ltd Class B 1,195 2,189,010 4.93% Plainfield Liquidation L1 Series 4 01-09 19,182 964,115 2.17% Plainfield Liquidation R Series 1 06-09 34,200 1,650,092 3.72% TRF Liquidating SPV D/1 284 9,616 0.02% Total Investments 25,283,632 56.92% Other assets 19,129,956 43.08%
Total net assets 44,413,588 100.00%
*The strategies above are explained on page 25-26.