fritjof fagerlund - transport of nanoparticles with groundwater affected by soil- and dissolved...
TRANSCRIPT

Transport of nanoparticles with groundwater affected by soil- and dissolved organic matter
Fritjof Fagerlund, Maryeh Hedayati, Jean-Marc Mayotte and
Prabhakar Sharma
Department of Earth Sciences, Uppsala University
Contact: [email protected]
1

Contents
Background
Nanoparticles, transport
Objectives
Laboratory experiments
Results
Discussion
Conclusions
2

Source: http://nano.cancer.gov/learn/understanding/
nanoparticle sand colloid
Nanoparticles
Nanoparticles have
enormous surface-to-
weight ratio
Many nanomaterials
have special properties
that differ from the parent
bulk material

TiO2 nanoparticles (NPs) are widely used in many applications
and products including cosmetics and paints
Sunblock lotions
New applications: Perfluorosilane-coated TiO2 NPs are
used in oil-resistant, self-cleaning paint (Lu et al., Science
347(6226), March 2015)
TiO2 NPs typically don’t penetrate the skin but may cause
damage if inhaled or ingested
May interact with other contaminants. E.g. enhanced uptake of
arsenic (As(V)) was found in carp fish in the presence of TiO2
NPs (Sun et al., 2007)
TiO2 nanoparticles

Nanoparticle transport
. . . . . . . . . .
. . .
. .
. . . . . . . . . .
- - - - -
- - - - -
- - - -
- - - - -
- - - - -
- - - -
+ +
+
+
+ +
+
+ +
+ +
+
+ +
+ +
+
+
+
+ +
+ + +
+ +
+
+ +
+
+
- - - - -
- - - - -
- - - -
- - - - -
- - - - -
- - - -
+ +
+
+
+ +
+
+ +
+ +
+
+ +
+ + +
+
+
+ +
+ + +
+ +
+
+ +
+
+
potential energy
EDL Repulsion
van der Waals
Attraction
energy
barrier
energy
minimum
distance

Dissolved organic matter (DOM)
Soil organic matter (SOM)
Both DOM and SOM are often present –
One example is the artificial recharge of groundwater for the
water supply of Uppsala
The objective of this study was to investigate the effects of DOM
and SOM on TiO2 nanoparticle transport in groundwater
Applications to nanoparticles, pathogens, particle-mediated
contaminant transport
Organic matter & Objectives
Particle – organic matter – soil
interactions
affect particle transport
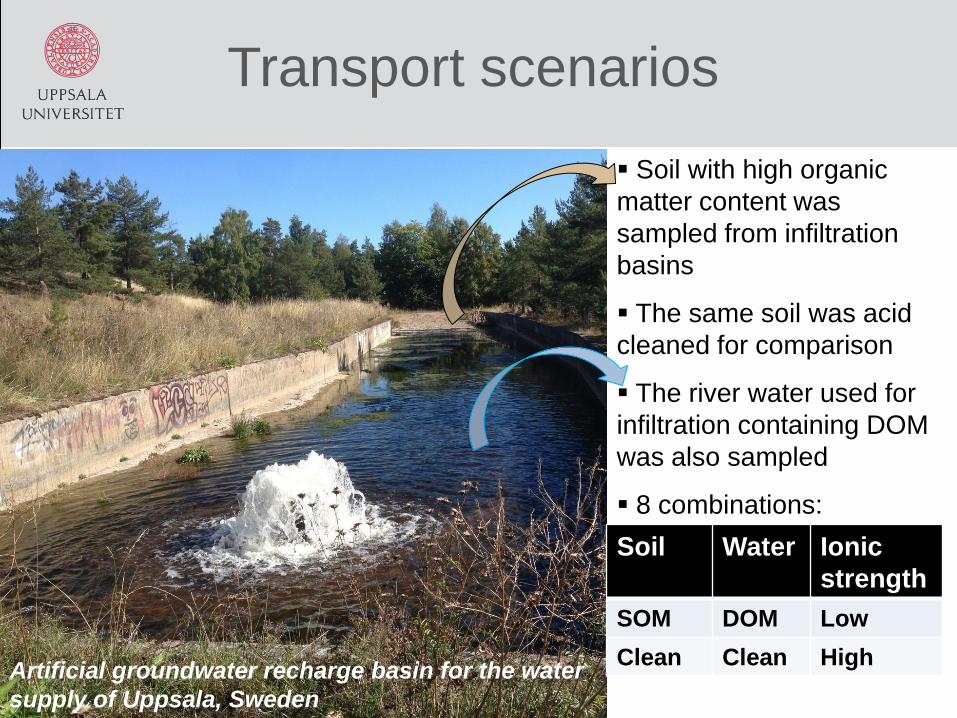
Artificial groundwater recharge basin for the water
supply of Uppsala, Sweden
Soil with high organic
matter content was
sampled from infiltration
basins
The same soil was acid
cleaned for comparison
The river water used for
infiltration containing DOM
was also sampled
8 combinations:
Soil Water Ionic
strength
SOM DOM Low
Clean Clean High
Transport scenarios

Main Solution
(Phase 1)
DI water
(Phase 3)
Background solution
(Phase 2)Sand
Column
Pump
Spectrophotometer Fraction
Collector
Sand column (10 cm)
Switch from background water
to water with TiO2 nanoparticles
(10 mg/L)
Both TiO2 and DOM
concentrations measured using
a spectrophotometer
Transport & retention of TiO2
was studied
Experimental setup

Effects of DOM in water
0
0.2
0.4
0.6
0.8
1
1.2
0 2 4 6
Re
lati
ve
co
nce
ntr
ati
on
C/C
0
Pore volumes
Clean soil with no SOM
Tracer
E2, natural water, Low IS
E4, natural water, high IS
E6, clean water, Low IS
E8, clean water, high IS
Tracer is fully mobile
At low ionic strength
in clean water, TiO2 are
highly mobile
High ionic strength
immobilizes TiO2 in
clean water
With DOM in water
TiO2 has intermediate
mobility both at low and
high ionic strength
Increasing trends
may be due to DOM
attachment to soil DOM ensures that some mobility exists &
reduces the effect of ionic strength

0
0.2
0.4
0.6
0.8
1
1.2
0 2 4 6
Re
lati
ve c
on
cen
trat
ion
C/C
0
Pore volumes
Natural soil with SOM
Tracer
E1, natural water, Low IS
E3, natural water, high IS
E5, clean water, low IS
E7, clean water, high IS
With both SOM and
DOM present, TiO2 are
highly mobile
This is regardless of
high or low ionic
strength
For TiO2 in clean water
at low IS SOM reduces
the mobility compared to
clean soil
For clean water at
high IS SOM increases
TiO2 mobility
Effects of SOM in soil
Combination of SOM & DOM means high TiO2
mobility regardless of IS

-50
-45
-40
-35
-30
-25
-20
-15
-10
-5
0
Z-p
ote
nti
al (
mV
)
Clean soil, Low IS
Clean Soil, High IS
SOM in soil, Low IS
SOM in soil, High IS
soil Z-
potential
TiO2 particles
Z-potential
DOM in
water
Clean
water
Inflow Outflow
- - - - -
- - - - -
- - - -
+ +
+
+
+ +
+ + +
+ +
+
+
+
+
+
+ -
-
-
-
Z-potential of soil and TiO2 NPs
z-potential strongly
negative in soil
- less with SOM & high IS
DOM reduces neg.
z-potential in TiO2 NPs
z-pot. reduced between
inflow and outflow
- This occurs both in
clean soil & with SOM

0
500
1000
1500
2000
2500
Agg
rega
te s
ize
(n
m)
Clean soil, Low IS
Clean soil, High IS
SOM in soil, Low IS
SOM in soil, High IS
DOM in
water Clean water
Inflow Outflow
A correlation between z-
potential and aggregate
size exists
DOM => Average
aggregate size > 1µm
DOM => aggregation
High IS => Large
aggregate size (expected)
For low IS, aggregate
size increases between
inflow and outflow
- This occurs both in
clean soil & with SOM
. . . . . . . . . . . . . . . . . . .
. 0
500
1000
1500
2000
2500
-40 -30 -20 -10 0
Agg
rega
te s
ize
(n
m)
Z-potential (mV)
Average aggregate size of TiO2 NPs

DOM SOM
very
high
mobility
Increase
mobility
at high IS
Red.
mobility
at low IS Red.
mobility
at low IS
Increase
mobility
at high IS
Red.
z-pot. of
TiO2 NPs
Larger
aggreg.
size
slight red.
z-pot. of
soil Produce
DOM
Effect of DOM & SOM on transport
DOM and SOM may
reduce the interaction
between TiO2 NPs and
solid medium
Attachment appears
to be blocked in the
presence of DOM and
SOM
Change in the
dominant retention
mechanism
Very high particle
mobility when both
SOM & DOM present
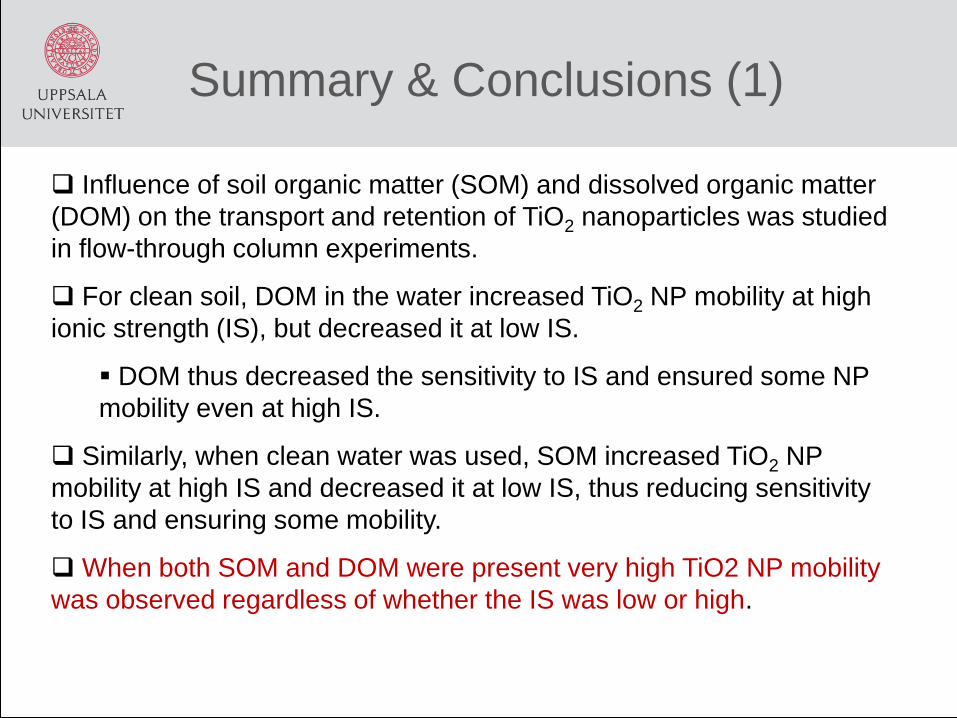
Summary & Conclusions (1)
Influence of soil organic matter (SOM) and dissolved organic matter
(DOM) on the transport and retention of TiO2 nanoparticles was studied
in flow-through column experiments.
For clean soil, DOM in the water increased TiO2 NP mobility at high
ionic strength (IS), but decreased it at low IS.
DOM thus decreased the sensitivity to IS and ensured some NP
mobility even at high IS.
Similarly, when clean water was used, SOM increased TiO2 NP
mobility at high IS and decreased it at low IS, thus reducing sensitivity
to IS and ensuring some mobility.
When both SOM and DOM were present very high TiO2 NP mobility
was observed regardless of whether the IS was low or high.

The presence of DOM and SOM influences particle-particle and
particle-grain interactions.
Reduction in z-potentials can explain increased aggregation and
reduced particle mobility at low ionic strengths.
However, DLVO interactions alone cannot explain the increased
particle mobility when both DOM and SOM are present
It appears SOM and DOM cause blocking of particle attachment to
the medium by attraction forces, favouring particle mobility & transport.
However, the exact mechanism is not yet clear and subject to further
research
To conclude: the mobility of nanoscale particles may be significatly
enhanced in aquifers which contain organic matter => these aquifers
are more vulnerable to unwanted particle transport.
Summary & Conclusions (2)
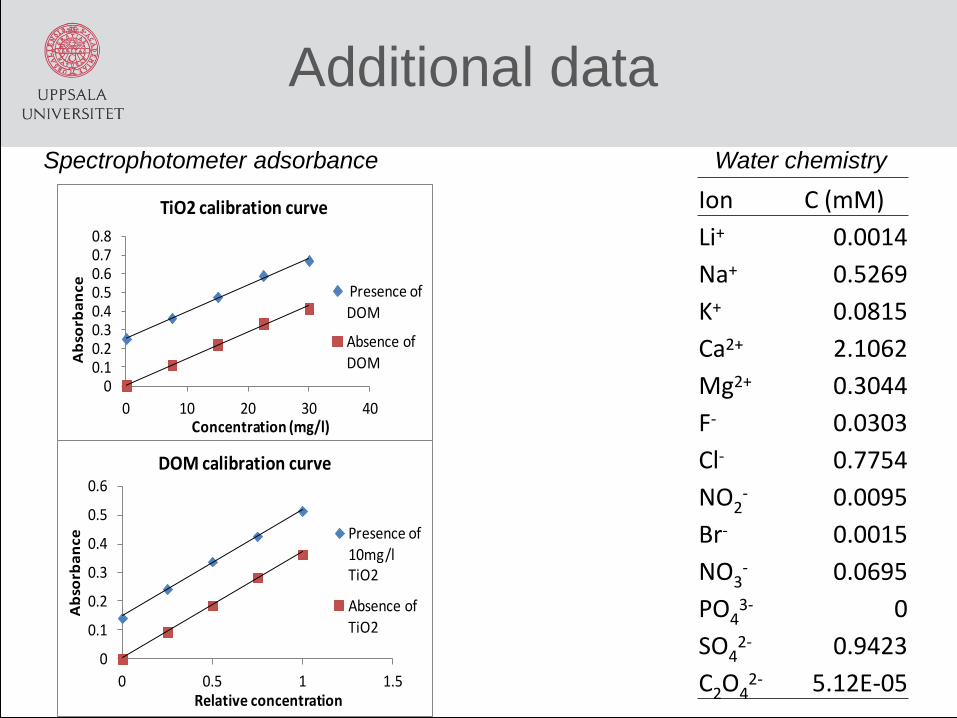
Ion C (mM)
Li+ 0.0014
Na+ 0.5269
K+ 0.0815
Ca2+ 2.1062
Mg2+ 0.3044
F- 0.0303
Cl- 0.7754
NO2- 0.0095
Br- 0.0015
NO3- 0.0695
PO43- 0
SO42- 0.9423
C2O42- 5.12E-05
Water chemistry
0
0.1
0.2
0.3
0.4
0.5
0.6
0 0.5 1 1.5
Ab
sorb
an
ce
Relative concentration
DOM calibration curve
Presence of 10mg/l TiO2
Absence of
TiO2
00.10.20.30.40.50.60.70.8
0 10 20 30 40
Ab
sorb
an
ce
Concentration (mg/l)
TiO2 calibration curve
Presence of DOM
Absence of DOM
Spectrophotometer adsorbance
Additional data

Experiment Soil Water phase
NaCl (mM)
TiO2 Particle Diam. (nm)
Z-Potential (mV)
E1 SOM DOM 7.5* 1003 -15.8 E2 Clean DOM 7.5* 1907 -17.4 E3 SOM DOM 31.5** 1149 -15.1 E4 Clean DOM 31.5** 1195-1509 -16.1 - -17 E5 SOM Clean 7.5 263-659 -21.3 - -35.8 E6 Clean Clean 7.5 283-1000 -11.4 - -28.1 E7 SOM Clean 31.5 370-879 -22.2 - -33.3 E8 Clean Clean 31.5 865-919 -11.3 - -29.5
Column experiment scenarios & measured ranges for particle
size & z-potentials
* Equivalent NaCl concentration, ** Adjusted, equivalent NaCl conc.
- - - - -
- - - - -
- - - -
+ +
+
+
+ +
+ + +
+ +
+
+
+
+
+
+ -
-
-
-