friction coefficient in hot compression of cylindrical specimens
TRANSCRIPT

Friction Coefficient in Hot Compression of Cylindrical Sample
Yunping Li, Emi Onodera and Akihiko Chiba*
Institute for Materials Research, Tohoku University, Sendai 980-8577, Japan
In order to analyze the evolution behavior of friction coefficients during large strain hot forging processes, compression tests were carriedout on IHS38MSV hypoeutectoid steel samples at a stroke rate of 1.2mm/s and temperatures ranging from 1073 to 1473K. The simulationresults of the geometrical change in the sample during the compression process obtained by using various friction coefficients were comparedwith experimental results in order to verify the validity of the ‘‘instantaneous friction coefficient’’. The results showed that the friction coefficientwas a constant at lower strain level, and the instantaneous friction coefficient, ms, showed an approximately exponential relationship at higherstrain level. The simulation results obtained by using ms showed better results as compared to those obtained by using average frictioncoefficients (mc and ma). It was also found from the simulation results that at a certain strain level, the variation of friction coefficient did nothave a strong effect on the shape of deformed sample; however, the radius of the top surface of the sample, Rt, changed greatly due to friction.[doi:10.2320/matertrans.M2010056]
(Received February 15, 2010; Accepted April 16, 2010; Published June 2, 2010)
Keywords: hot forging process, instantaneous friction coefficient, average friction coefficient, barreling factor
1. Introduction
During hot forging processes, friction plays a significantrole in determining the life of tools, the formability of thework materials, and the quality of the final products such as,surface, internal structure, and product properties. Numerousresearches have been carried out for either reducing ordetermining the friction coefficient during hot forgingprocesses.1) In general, lubricants are added to reduce thefriction coefficient. However, friction cannot be reduced to anegligible level, especially during high temperature formingprocesses, because the majority of high-quality lubricantsused at ambient temperatures are organics that cannotwithstand high temperatures. A number of lubricants havebeen developed to be used at high temperatures. However,friction after lubrication is still an important issue, becausethe friction coefficient at high temperatures cannot belowered to a level comparable to that at ambient temper-atures. A number of studies have been conducted in anattempt to obtain the quantitative data on friction or by usingsimulative laboratory tests. Frederiksen et al.2) used friction-testing methods based on the geometrical changes in orderto adjust the frictional conditions in the simulation to thecondition of the real process. Bay3) studied the application ofthe friction model when analyses of bulk metal formingprocess were given. On the basis of these and other results4,5)
an upper–bound theory was developed to effectively deter-mine the average friction coefficient by conducting a barrelcompression test. Using this theory, the average Trescafriction coefficient (hereafter friction coefficient, m) for thecompression test can be determined by measuring just thedegree of barreling (maximum radius, Rm, and heightdifference of cylinder before and after deformation) aftercompression process by using the following equation:
m ¼
R
h� b
4ffiffiffi3
p �2b
3ffiffiffi3
pð1Þ
where m is the average friction coefficient for a hot workingprocess, with its value ranging from 0 (perfect sliding) to 1(sticking friction); b is the barreling factor; and R and h
are the theoretical radius and final height of the sample,respectively. b is given by:6)
b ¼ 4�R
R�h
�h; ð2Þ
where �R is the difference between the maximum radius Rm
and the radius Rt of top surface of the sample, and �h is thereduction in the height of the cylinder after compression.From the average friction coefficient calculated by eq. (2),the analysis of effects of friction in hot working process andthe stress compensation from friction could be carried outeffectively.
The understanding of the friction between two surfaces isat the heart of the science of tribology, an interdisciplinaryfield that involves surface chemistry, materials science,mechanics etc. In practice, direct predicting the frictioncoefficient at a random strain level is difficult becauseof the difficulty with measuring the related parametersof specimens simultaneously in the working process;researchers often simply assume that the friction coefficientis constant or independent of the strain level.7) Detailsregarding the evolution behavior of friction coefficientsduring the hot forging processes have not yet been clarified.The surfaces of the sample contain hills and valleys whenviewed on a microscopic scale. During the hot formingprocess, the surface conditions of the material, including itsprofile and temperature, vary gradually with increasingstrain level due to contact with tools. At higher strain levelssuch as those employed during cylindrical hot compressiontests, the side surface of the sample came closer to the anvilsurface due to barreling, as the strain level increased, andit subsequently came into contact with the anvil surface.This side surface later formed the outmost area of thecontacting surface with the anvil when the strain attained acertain level, possibly leading to sticking in this region andsubsequently to a great increase in the friction coefficient,as found from some of our preliminary observations; thisis considered to be a very important factor in the variation*Corresponding author, E-mail: [email protected]
Materials Transactions, Vol. 51, No. 7 (2010) pp. 1210 to 1215#2010 The Japan Institute of Metals

of the friction coefficient at large strain levels during hotworking processes.
In this study, on the basis of eq. (1) the instantaneousfriction coefficient ms is evaluated quantitatively as afunction of strain. The parameters regarding the shapechange of the sample during real compression process willbe used to compare with the results calculated by DEFORM-3D finite element analysis software by using both theinstantaneous and average friction coefficients.
2. Experimental
2.1 Experimental procedureIHS38MSV hypoeutectoid steel (Sumitomo Metal Indus-
tries, Ltd., Japan) was used in the current study. Cylindricalspecimens, 8mm in diameter and 12mm in height, were cutby electro-discharge machining (EDM) from the outerportion of a huge forged cylinder. Concentric grooves withdepths of 0.1mm were formed on the flat ends surface of thespecimen so that the original top surface profile of sampleafter broadening could be identified easily after deformation.
Compression tests were carried out in vacuum at 1073,1173, 1273, 1373, and 1473K using a computer-aided hotforging simulator (Thermecmaster-Z). The stroke rate wasset as 1.2mm/s. The temperature was varied from ambienttemperature to the test temperatures at a heating rate of 5K/sby induction heating. The samples were held at the testtemperatures for 300 s before compression. The thermocou-ple used was R-type, and the temperature accuracy wasapproximately �3K. In order to avoid the heat dissipationfrom sample end surface to the anvil surface at the contactregion, mica sheets with a diameter of 20mm and thicknessof approximately 0.2mm were used as heat insulators closelycontacting with the anvil surfaces because of its extremelylow thermal conductivity; they were placed close to the anvilsurface. In addition, carbon paper was used as an aid toreduce friction owing to its high heat resistance and highlubricating effect.8) The experimental setup is schematicallyshown in Fig. 1.
2.2 Finite element analysisIn order to evaluate the evolution behavior of the friction
coefficient as a function of the strain level, the samples werecompressed to strain levels of approximately 0.2, 0.4, 0.6,0.8, 1.0, 1.2, 1.4, and 1.6. The average friction coefficientsat each strain level were calculated using eq. (1).
A model of the sample, having the same size as that ofthe actual sample, was generated using the finite elementanalysis DEFORM-3D v6.13 software. In order to reducecomputing time, only one eighth part of the cylindricalsample with enough mesh number of 25000 was carried out.The model of a cylindrical specimen compressed by an anvilfrom the top at the stroke rate of 1.2mm/s is shown in Fig. 2.
3. Results and Discussion
Images of the specimens compressed at 1273K anddifferent strain levels are shown in Fig. 3 along twodirections. The results in Fig. 3 were originally presentedin our previous research.8) The profiles of specimens com-pressed at other temperatures were similar profiles to those ofthe samples at 1273K. At strain levels lower than approx-imately 0.5, the top surface of the specimens after compres-sion were found to be formed mainly from the end surfaces ofthe specimens with grooves; in this instance the radius of thetop surface, Rt, was approximately equal to that of the anvil-contacting surface of the deformed specimen, Rc. However,at higher strain levels (higher than approximately 0.6), Rc
was observed to be formed by both the original top surface ofspecimen with grooves after broadening Rt and the sidesurface of the specimen due to the contacting with anvil. Aschematic of the typical end surface of a specimen com-pressed at higher strain levels observed along the longitudinaldirection, is shown in Fig. 4; Rt, Rc and Rm denote thetop radius, contacting radius, and maximum radius of thedeformed specimen, respectively, and Rc–Rt is the areaformed from the side surface of the specimen due to barrelingand the subsequent contacting with anvil. The end surface ofthe specimen is composed of three parts: the original topsurface of the specimen with grooved profiles Rt, the surfacecome from side surface due to the contacting with anvil Rc–Rt, and the barreling side surface probably going to contactwith the anvil surface at higher strain levels Rm–Rc. In this
Coils
Lubricants
Carbon sheetMica
Thermocouple
Pressure
Fig. 1 Schematic figure for the experimental setup of compression test.
Fig. 2 The model used in FEM calculations.
Friction Coefficient in Hot Compression of Cylindrical Sample 1211
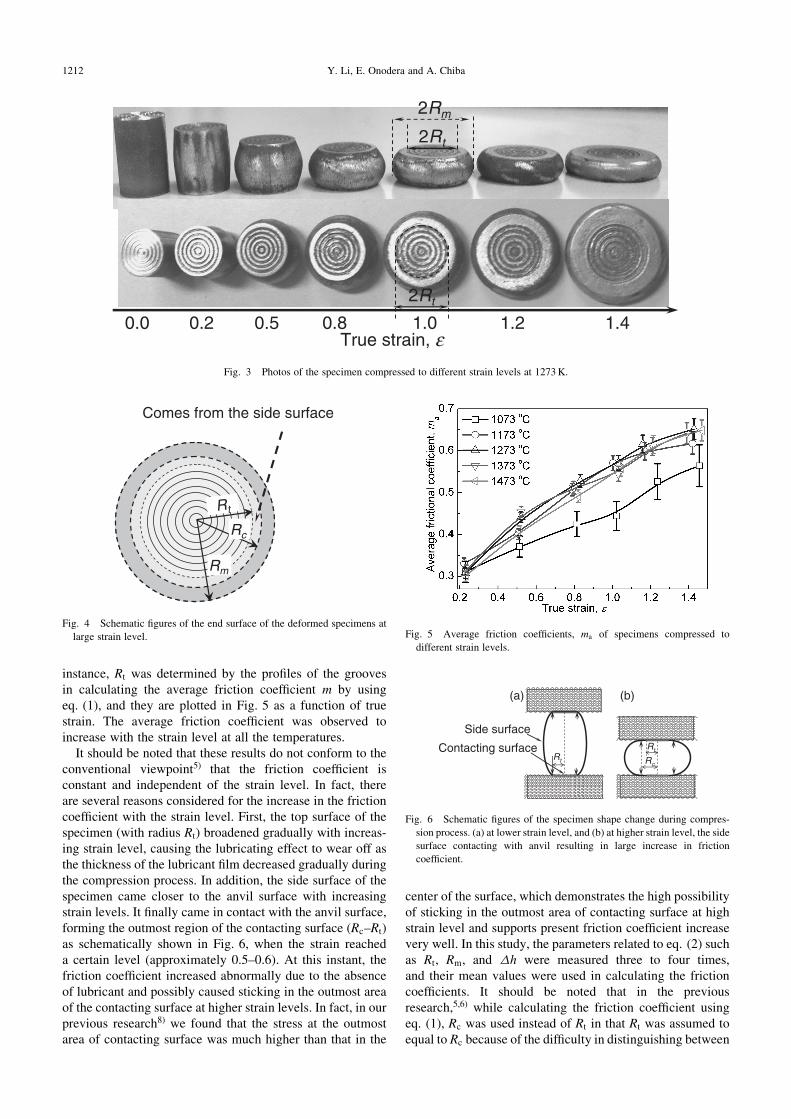
instance, Rt was determined by the profiles of the groovesin calculating the average friction coefficient m by usingeq. (1), and they are plotted in Fig. 5 as a function of truestrain. The average friction coefficient was observed toincrease with the strain level at all the temperatures.
It should be noted that these results do not conform to theconventional viewpoint5) that the friction coefficient isconstant and independent of the strain level. In fact, thereare several reasons considered for the increase in the frictioncoefficient with the strain level. First, the top surface of thespecimen (with radius Rt) broadened gradually with increas-ing strain level, causing the lubricating effect to wear off asthe thickness of the lubricant film decreased gradually duringthe compression process. In addition, the side surface of thespecimen came closer to the anvil surface with increasingstrain levels. It finally came in contact with the anvil surface,forming the outmost region of the contacting surface (Rc–Rt)as schematically shown in Fig. 6, when the strain reacheda certain level (approximately 0.5–0.6). At this instant, thefriction coefficient increased abnormally due to the absenceof lubricant and possibly caused sticking in the outmost areaof the contacting surface at higher strain levels. In fact, in ourprevious research8) we found that the stress at the outmostarea of contacting surface was much higher than that in the
center of the surface, which demonstrates the high possibilityof sticking in the outmost area of contacting surface at highstrain level and supports present friction coefficient increasevery well. In this study, the parameters related to eq. (2) suchas Rt, Rm, and �h were measured three to four times,and their mean values were used in calculating the frictioncoefficients. It should be noted that in the previousresearch,5,6) while calculating the friction coefficient usingeq. (1), Rc was used instead of Rt in that Rt was assumed toequal to Rc because of the difficulty in distinguishing between
2Rt
2Rm
2Rt
True strain,0.5 0.80.0 0.2 1.0 1.41.2
εFig. 3 Photos of the specimen compressed to different strain levels at 1273K.
Comes from the side surface
Rt
Rc
Rm
Fig. 4 Schematic figures of the end surface of the deformed specimens at
large strain level. Fig. 5 Average friction coefficients, ma of specimens compressed to
different strain levels.
(a) (b)
Side surface
Contacting surface Rt
RcRt
Fig. 6 Schematic figures of the specimen shape change during compres-
sion process. (a) at lower strain level, and (b) at higher strain level, the side
surface contacting with anvil resulting in large increase in friction
coefficient.
1212 Y. Li, E. Onodera and A. Chiba
them; however, the ambiguity between these two parametersmay lead to the incorrect calculation of the frictioncoefficient.
The results in Fig. 5 indicated that the friction coefficientis not a constant in a compression test. However, the resultsused in Fig. 5 are the average values of friction coefficientfrom the beginning of compression to a certain strain level.In a specific compression process, the stress variation dueto friction is only related to the friction coefficient at aspecific strain level. In order to obtain the real stress-strain response, the friction coefficient at an instant strainlevel (instantaneous friction coefficient, ms) is consideredextremely necessary. Supposed that mn and mn�1 are theaverage friction coefficients calculated using eq. (1) whenspecimens are directly compressed under two strains of "nand "n�1 applied in close proximity; then, ms at a strain levelof ð"n þ "n�1Þ=2 is considered to be expressed as the integralmean value exploration of this small strain range
msð"n�1þ"nÞ=2 ¼
Z "n
0
mnd"�Z "n�1
0
mn�1d"
"n � "n�1
¼"nmn � "n�1m"n�1
"n � "n�1
ð3Þ
where it was assumed that ms followed an almost linearprofile over a very small range of strain; that is, the averagefriction coefficient over this narrow range of strain levels wasconsidered to be equal to the instantaneous friction coef-ficient msð"n�1þ"nÞ=2 at the strain level of ð"n þ "n�1Þ=2.
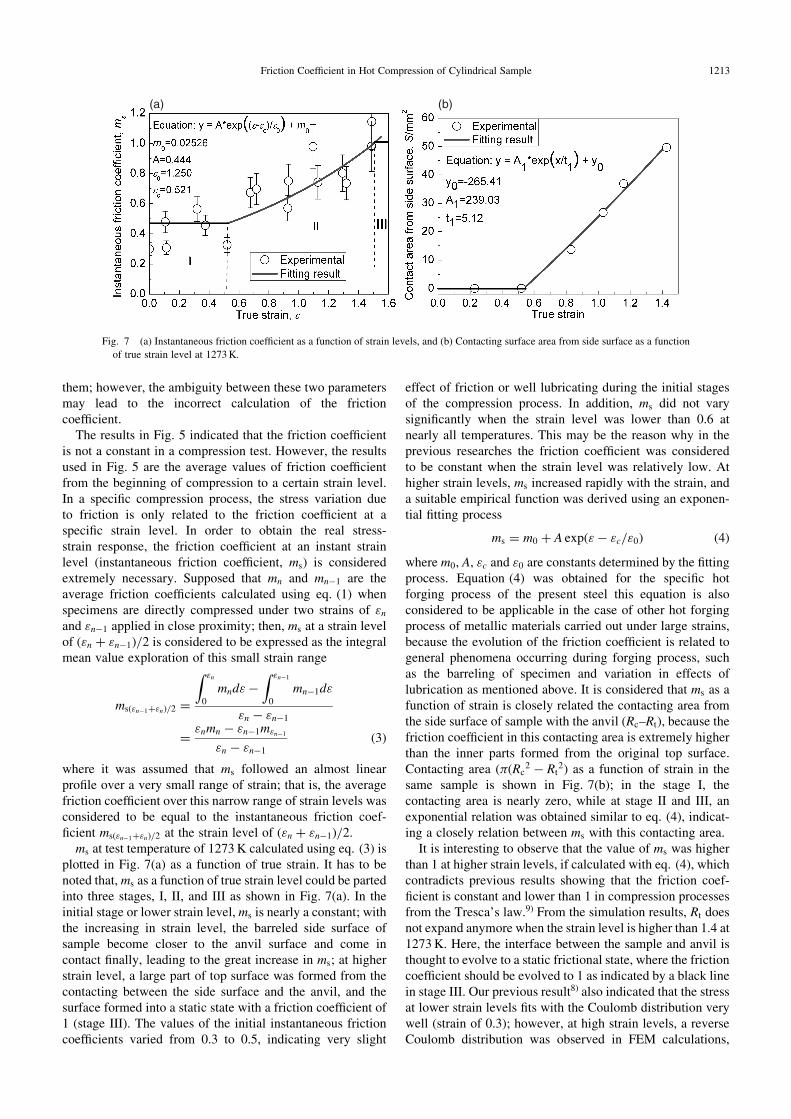
ms at test temperature of 1273K calculated using eq. (3) isplotted in Fig. 7(a) as a function of true strain. It has to benoted that, ms as a function of true strain level could be partedinto three stages, I, II, and III as shown in Fig. 7(a). In theinitial stage or lower strain level,ms is nearly a constant; withthe increasing in strain level, the barreled side surface ofsample become closer to the anvil surface and come incontact finally, leading to the great increase in ms; at higherstrain level, a large part of top surface was formed from thecontacting between the side surface and the anvil, and thesurface formed into a static state with a friction coefficient of1 (stage III). The values of the initial instantaneous frictioncoefficients varied from 0.3 to 0.5, indicating very slight
effect of friction or well lubricating during the initial stagesof the compression process. In addition, ms did not varysignificantly when the strain level was lower than 0.6 atnearly all temperatures. This may be the reason why in theprevious researches the friction coefficient was consideredto be constant when the strain level was relatively low. Athigher strain levels, ms increased rapidly with the strain, anda suitable empirical function was derived using an exponen-tial fitting process
ms ¼ m0 þ A expð"� "c="0Þ ð4Þ
where m0, A, "c and "0 are constants determined by the fittingprocess. Equation (4) was obtained for the specific hotforging process of the present steel this equation is alsoconsidered to be applicable in the case of other hot forgingprocess of metallic materials carried out under large strains,because the evolution of the friction coefficient is related togeneral phenomena occurring during forging process, suchas the barreling of specimen and variation in effects oflubrication as mentioned above. It is considered that ms as afunction of strain is closely related the contacting area fromthe side surface of sample with the anvil (Rc–Rt), because thefriction coefficient in this contacting area is extremely higherthan the inner parts formed from the original top surface.Contacting area (�ðRc
2 � Rt2Þ as a function of strain in the
same sample is shown in Fig. 7(b); in the stage I, thecontacting area is nearly zero, while at stage II and III, anexponential relation was obtained similar to eq. (4), indicat-ing a closely relation between ms with this contacting area.
It is interesting to observe that the value of ms was higherthan 1 at higher strain levels, if calculated with eq. (4), whichcontradicts previous results showing that the friction coef-ficient is constant and lower than 1 in compression processesfrom the Tresca’s law.9) From the simulation results, Rt doesnot expand anymore when the strain level is higher than 1.4 at1273K. Here, the interface between the sample and anvil isthought to evolve to a static frictional state, where the frictioncoefficient should be evolved to 1 as indicated by a black linein stage III. Our previous result8) also indicated that the stressat lower strain levels fits with the Coulomb distribution verywell (strain of 0.3); however, at high strain levels, a reverseCoulomb distribution was observed in FEM calculations,
(a) (b)
Fig. 7 (a) Instantaneous friction coefficient as a function of strain levels, and (b) Contacting surface area from side surface as a function
of true strain level at 1273K.
Friction Coefficient in Hot Compression of Cylindrical Sample 1213

probably due to sticking of the outer area of the top surfacewith the compression anvil (strain 0.65). Nevertheless, thistheorem, regarding the static friction coefficient and theevolution from kinetic friction into static friction in hotforging process for large strain levels, can provide a new fieldof study to researchers in this field.
The shapes of the specimens at 1273K during the hotforging process were simulated using DEFORM-3D v6.130finite element analysis software. In order to verify the validityof ms, three types of friction coefficients were used in thesimulation processes: the average friction coefficient at astrain of approximately 1.43 with a value of about 0.65 mc
was used, because in general the friction coefficient of adeformed sample was calculated in this way.10) The averagefriction coefficient measured at different strain levels asshown in Fig. 5; and the instantaneous friction coefficient ms
calculated using eq. (4). ma measured at different strainlevels (Fig. 5) were fitted with a cubic spline function, andthe values at other strain levels were extrapolated by usingthis function. The typical specimen profiles calculated byusing the above three types of friction coefficients at strainlevels of 0.3, 0.65 and, 1.5 are shown in Figs. 8–10,
respectively. No significant difference can be observedamong the three simulation results judging from the observedsimulated profiles of the specimens. In order to analyze thesimulation results in further details, Rt is plotted in Fig. 11 asa function of the strain level. The agreement between thecalculated and measured results was better when ms was usedthan when the others coefficients (mc and ma) were used; thisshows that the model simulated using ms expressed by eq. (4)was appropriate for the current study. Rt calculated using mc
with a value of 0.65 had lower values while that calculatedusing ma in Fig. 5 had relatively higher values whencompared to the experimental results of Rt as shown by theopen circles in Fig. 11. Rc and Rm of specimen were alsocalculated. The results are plotted in Fig. 12. Both Rc and Rm
of the specimen were observed to have nearly the same valuein case of all the three types of friction coefficients, asmentioned above. The size of the actual specimen, expressedas Rm, is also plotted in the same figure by open circles; theexperimental and calculated results showed good agreementin case of the three types of friction coefficients. From theabove results, it can be observed that friction coefficients hadonly a minor effect on Rc and Rm implying that friction
Rm
Rc
Rt
(a) (b) (c)
Fig. 8 The shape of sample at strain levels of (a) 0.3, (b) 0.65, and (c) 1.5
simulated in FEM calculations at 1273K by using instantaneous friction
coefficient, ms.
(a) (b) (c)
Fig. 10 The shape of the specimen at strain levels of (a) 0.3, (b) 0.65, and
(c) 1.5 simulated in FEM calculations at 1273K by using average friction
coefficient, ma as a function of strain.
Fig. 11 The top radius Rt of the samples as a function of strain by
simulations (solid line: instantaneous friction coefficient, ms; dotted line:
the constant friction coefficient with a value of 0.65, mc; dashed line:
average friction coefficient as a function of strain, ma) and the
experimental results at 1273K (open circles).
(a) (b) (c)
Fig. 9 The shape of the specimen at strain levels of (a) 0.3, (b) 0.65, and
(c) 1.5 simulated by FEM calculations at 1273K by using average friction
coefficient, mc with a value of 0.65.
1214 Y. Li, E. Onodera and A. Chiba
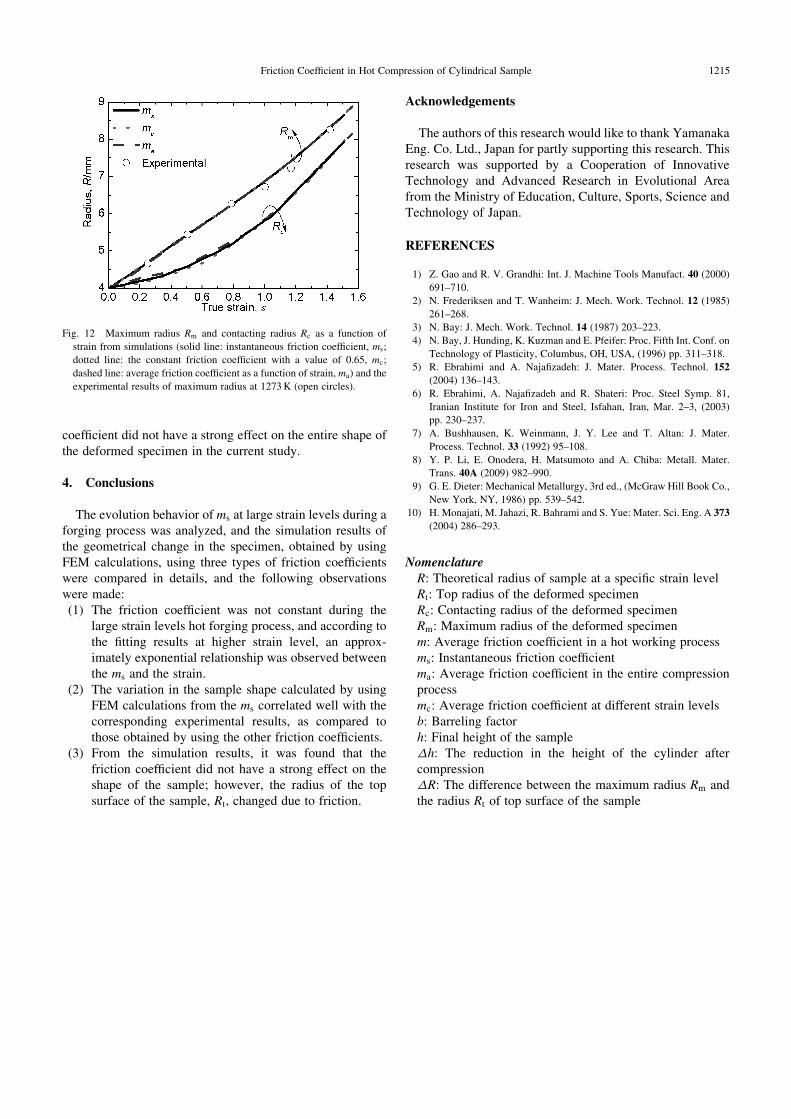
coefficient did not have a strong effect on the entire shape ofthe deformed specimen in the current study.
4. Conclusions
The evolution behavior of ms at large strain levels during aforging process was analyzed, and the simulation results ofthe geometrical change in the specimen, obtained by usingFEM calculations, using three types of friction coefficientswere compared in details, and the following observationswere made:(1) The friction coefficient was not constant during the
large strain levels hot forging process, and according tothe fitting results at higher strain level, an approx-imately exponential relationship was observed betweenthe ms and the strain.
(2) The variation in the sample shape calculated by usingFEM calculations from the ms correlated well with thecorresponding experimental results, as compared tothose obtained by using the other friction coefficients.
(3) From the simulation results, it was found that thefriction coefficient did not have a strong effect on theshape of the sample; however, the radius of the topsurface of the sample, Rt, changed due to friction.
Acknowledgements
The authors of this research would like to thank YamanakaEng. Co. Ltd., Japan for partly supporting this research. Thisresearch was supported by a Cooperation of InnovativeTechnology and Advanced Research in Evolutional Areafrom the Ministry of Education, Culture, Sports, Science andTechnology of Japan.
REFERENCES
1) Z. Gao and R. V. Grandhi: Int. J. Machine Tools Manufact. 40 (2000)
691–710.
2) N. Frederiksen and T. Wanheim: J. Mech. Work. Technol. 12 (1985)
261–268.
3) N. Bay: J. Mech. Work. Technol. 14 (1987) 203–223.
4) N. Bay, J. Hunding, K. Kuzman and E. Pfeifer: Proc. Fifth Int. Conf. on
Technology of Plasticity, Columbus, OH, USA, (1996) pp. 311–318.
5) R. Ebrahimi and A. Najafizadeh: J. Mater. Process. Technol. 152
(2004) 136–143.
6) R. Ebrahimi, A. Najafizadeh and R. Shateri: Proc. Steel Symp. 81,
Iranian Institute for Iron and Steel, Isfahan, Iran, Mar. 2–3, (2003)
pp. 230–237.
7) A. Bushhausen, K. Weinmann, J. Y. Lee and T. Altan: J. Mater.
Process. Technol. 33 (1992) 95–108.
8) Y. P. Li, E. Onodera, H. Matsumoto and A. Chiba: Metall. Mater.
Trans. 40A (2009) 982–990.
9) G. E. Dieter: Mechanical Metallurgy, 3rd ed., (McGraw Hill Book Co.,
New York, NY, 1986) pp. 539–542.
10) H. Monajati, M. Jahazi, R. Bahrami and S. Yue: Mater. Sci. Eng. A 373
(2004) 286–293.
NomenclatureR: Theoretical radius of sample at a specific strain levelRt: Top radius of the deformed specimenRc: Contacting radius of the deformed specimenRm: Maximum radius of the deformed specimenm: Average friction coefficient in a hot working processms: Instantaneous friction coefficientma: Average friction coefficient in the entire compressionprocessmc: Average friction coefficient at different strain levelsb: Barreling factorh: Final height of the sample�h: The reduction in the height of the cylinder aftercompression�R: The difference between the maximum radius Rm andthe radius Rt of top surface of the sample
Fig. 12 Maximum radius Rm and contacting radius Rc as a function of
strain from simulations (solid line: instantaneous friction coefficient, ms;
dotted line: the constant friction coefficient with a value of 0.65, mc;
dashed line: average friction coefficient as a function of strain, ma) and the
experimental results of maximum radius at 1273K (open circles).
Friction Coefficient in Hot Compression of Cylindrical Sample 1215