freshwater fish contaminant monitoring program: … 5 . abstract . results from the freshwater fish...
TRANSCRIPT
Freshwater Fish Contaminant Monitoring Program
2012 Results
May 2014 Publication No. 14-03-020
Publication Information This report is available on the Department of Ecology’s website at https://fortress.wa.gov/ecy/publications/SummaryPages/1403020.html Data for this project are available at Ecology’s Environmental Information Management (EIM) website www.ecy.wa.gov/eim/index.htm. Search Study ID WSTMP12.
Ecology’s Activity Tracker Code for this study is 02-500. Contact Information Authors: Keith Seiders, Casey Deligeannis, Patti Sandvik, Melissa McCall Environmental Assessment Program P.O. Box 47600 Olympia, WA 98504-7600 Communications Consultant Phone: (360) 407-6764 Washington State Department of Ecology - www.ecy.wa.gov o Headquarters, Olympia (360) 407-6000 o Northwest Regional Office, Bellevue (425) 649-7000 o Southwest Regional Office, Olympia (360) 407-6300 o Central Regional Office, Yakima (509) 575-2490 o Eastern Regional Office, Spokane (509) 329-3400 Cover photo: Department of Ecology sampling crew using electro-fishing techniques to collect fish from the Spokane River.
Any use of product or firm names in this publication is for descriptive purposes only and does not imply endorsement by the author or the Department of Ecology.
If you need this document in a format for the visually impaired, call 360-407-6764.
Persons with hearing loss can call 711 for Washington Relay Service. Persons with a speech disability can call 877-833-6341.

Page 1
Freshwater Fish Contaminant Monitoring Program
2012 Results
by
Keith Seiders, Casey Deligeannis, Patti Sandvik, and Melissa McCall
Environmental Assessment Program Washington State Department of Ecology
Olympia, Washington 98504-7710
Water Resource Inventory Area (WRIA) and 8-digit Hydrologic Unit Code (HUC) numbers for the study area: WRIA 4 - Upper Skagit, HUC 17110005 WRIA 47 - Chelan, HUC 17020009 WRIA 54 - Lower Spokane, HUC 17010305 WRIA 57 - Middle Spokane, HUC 17010307 WRIA 62 - Pend Oreille, HUC 17010216

Page 2
This page is purposely left blank
Page 3
Table of Contents
Page
List of Figures and Tables....................................................................................................4
Abstract ................................................................................................................................5
Introduction ..........................................................................................................................7 Spokane River ................................................................................................................7 Pend Oreille River..........................................................................................................7 North Cascades National Park .......................................................................................8
Methods................................................................................................................................9 Field and Laboratory Methods .......................................................................................9 Statistical Approach to Trends Analyses for Spokane River Results ..........................10
Results and Discussion ......................................................................................................11 Spokane River ..............................................................................................................11
Spatial Trends ........................................................................................................14 Temporal Trends ....................................................................................................15
Pend Oreille River........................................................................................................17 North Cascades National Park .....................................................................................18
Conclusions ........................................................................................................................20 Spokane River ..............................................................................................................20 Pend Oreille River and North Cascades National Park ...............................................20
Recommendations ..............................................................................................................21
References ..........................................................................................................................22
Appendix. Glossary, Acronyms, and Abbreviations ........................................................25
Page 4
List of Figures and Tables
Page Figures
Figure 1. Fish sampling locations on the Spokane River, 2012........................................11 Figure 2. Mean values with 95% confidence intervals for PCBs and PBDEs in
Spokane River fish (whole and fillet), 2012. .....................................................12 Figure 3. Proportions of PCB homolog groups as percent of t-PCB values in
Spokane River fish tissue (whole and fillets), 2012. .........................................13 Figure 4. Cumulative frequency distribution of PCBs and PBDEs in fish from
Washington. .......................................................................................................13 Figure 5. Results for TCDD-TEQ in Spokane River fillet tissue, 2012. ..........................14 Figure 6. Mean values with 95% confidence intervals for PCBs and PBDEs in
Spokane River fish tissue (whole and fillet), 2005 and 2012. ...........................16
Tables
Table 1. Number of composite samples analyzed per fish species per site, 2012. .............9 Table 2. Outcome of statistical tests for differences in concentrations of PCBs and
PBDEs in Spokane River fish tissue (whole and fillet) between sites, 2012......15 Table 3. Outcome of statistical tests for differences in concentrations of PCBs,
PBDEs, and four metals in Spokane River fish tissue (whole and fillet) between 2005 and 2012. .....................................................................................17
Table 4. Summary of selected contaminant data in fish fillets from the Pend Oreille River, river miles 56-77 from 2002 through 2012. .............................................18
Table 5. Results for selected contaminants in fish fillets from waterbodies in the North Cascades National Park, 2012. .................................................................19
Table 6. Results for metals (mg/kg) in fish fillets from Ross Lake, 2012. .......................19
Page 5
Abstract Results from the Freshwater Fish Contaminant Monitoring Program in 2012 are summarized for three areas in Washington: the Spokane River, Pend Oreille River, and North Cascades National Park. The sampling goals were to: (1) characterize contaminant levels in fish, and (2) determine spatial and temporal patterns in contaminant levels in Spokane River fish. Results from the Spokane River showed that levels of PCBs and PBDEs in fish remain elevated compared to most areas in Washington. Differences in PCBs and PBDEs among Spokane River sites were found for about half of the 21 site-species pairings examined. Concentrations of PBDEs in mountain whitefish from the Ninemile reach were approximately 4 to 10 times higher than in fish from other sites in the river. In some cases, concentrations found in 2012 appear to be lower than those in 2005. For PCBs, 2 of 11 cases show a decrease, with both cases occurring in the Mission Park reach. For PBDEs, 5 of 11 cases show a decrease. Levels of mercury, PCBs, and dioxins in fish from the Pend Oreille River fall in the 40-80th percentile range of levels found in fish throughout Washington. Contaminant levels in fish from the North Cascades National Park were relatively low for all analytes, except for 4,4’-DDE in kokanee that had returned to the Stehekin River from Lake Chelan. Contamination of Lake Chelan with 4,4’-DDE is well known and is the focus of a water cleanup plan. Washington’s water quality standards for contaminants in fish tissue, expressed as Fish Tissue Equivalent Concentrations (FTECs), were met for most of the chemicals analyzed. However, most samples failed to meet FTECs for PCBs. Several samples of mountain whitefish from the Spokane River did not meet FTECs for dioxins. One sample of kokanee from the Stehekin River did not meet the FTEC for 4,4’-DDE.

Page 6
This page is purposely left blank

Page 7
Introduction Since 2001, the Washington State Department of Ecology (Ecology) Freshwater Fish Contaminant Monitoring Program (FFCMP)1 has characterized bioaccumulative contaminants in freshwater fish statewide with analysis of over 400 fish tissue samples from 150 sites. The FFCMP has two major goals: (1) long-term monitoring for temporal trends and (2) exploratory monitoring to characterize the extent of contamination in areas of interest. Results from fish contaminant monitoring are used for a variety of purposes, such as water quality assessments, health risk assessments, total maximum daily load (TMDL) effectiveness, and evaluating spatial and temporal trends. Target analytes have included mercury, polychlorinated biphenyls (PCBs), dioxins and furans (PCDD/Fs), chlorinated pesticides (CPs), and polybrominated diphenyl ethers (PBDEs). More information about these and other chemicals is at www.ecy.wa.gov/programs/eap/toxics/chemicals_of_concern.html. The accumulation of contaminants can have a variety of health effects on humans and wildlife, such as reproductive abnormalities, neurological problems, and behavioral changes. A primary route of exposure for people is through the consumption of contaminated food, particularly fish. The Washington State Department of Health (Health) currently has a statewide fish consumption advisory (FCA) for mercury in bass and northern pikeminnow. There are also 14 site-specific advisories due to contamination of fish by various chemicals: www.doh.wa.gov/CommunityandEnvironment/Food/Fish.aspx. Results from the 2012 FFCMP are summarized here for three areas: Spokane River, Pend Oreille River, and North Cascades National Park. The goals of the 2012 sampling efforts were to: (1) characterize contaminant levels in fish at all areas, and (2) determine spatial and temporal patterns in contaminant levels in Spokane River fish.
Spokane River The Spokane River Toxics Reduction Strategy (Ecology, 2011a) describes the concerns with PCBs, PBDEs, PCDD/Fs, and metals in the Spokane River and includes a thorough bibliography of studies in the basin. Risks to human health from toxic chemicals remain an important concern: levels of lead and PCBs resulted in a FCA issued in 1999 and revised in 2007 (Health, 2007). Serdar and others assessed sources of PCBs using various monitoring data (Serdar et al., 2011). Fish tissue monitoring is one part of a broader monitoring strategy, and Ecology’s FFCMP has committed to monitoring Spokane River fish well into the future.
Pend Oreille River Renewed concerns about contamination of fish in the Pend Oreille River led to a cooperative effort (Ecology, Health, Washington Department of Fish & Wildlife, and the Kalispel Tribe of Indians) to fill data gaps. Samples of northern pike collected in 2011 showed high levels of 1 www.ecy.wa.gov/programs/eap/toxics/wstmp.html
Page 8
mercury (150-450 ug/kg) which resulted in a FCA being issued in 2012 (Health, 2012). Information about the extent of contaminants, and potential risks to consumers, had not been compiled for other species. The goal of the monitoring effort was to characterize contaminants in several species of fish to inform decisions about the FCA and management of northern pike. Approximately 30 northern pike in three size ranges were collected in the spring and targeted for mercury analysis as individual fish steaks by Health. Ecology collected other species in the fall for analysis of PCBs, PBDEs, PCDD/Fs, CPs, and mercury.
North Cascades National Park Recent work by the National Park Service to assess park resources led to a cooperative effort to characterize contaminant levels in fish from several sites in the North Cascades National Park. The goal of the 2012 study was to supplement data from other studies of lakes in remote and protected areas of Washington and the Pacific Northwest (Moran et al., 2007; Ackerman et al., 2008). Park biologists collected trout from Ross Lake, Battalion Lake, and Thornton Lake as well as kokanee from the Stehekin River. Samples were transferred to Ecology for preparation and laboratory analysis for mercury and organic compounds. Three species of trout from Ross Lake were analyzed for a broader suite of metals due to concerns about potential impacts from mining activities in this lake’s watershed.

Page 9
Methods
Field and Laboratory Methods Twelve species of fish were collected from three general areas and used to form composite samples to meet site-specific objectives (Table 1). Fish were collected by staff from Ecology, Spokane Tribe of Indians, Kalispel Tribe of Indians, and the National Park Service. Sample collection, preparation, and analytical methods followed those described in the project plan for the FFCMP (Seiders, 2013). A total of 98 samples of fish tissue were analyzed for some or all of these chemicals: CPs, mercury, PBDEs, PCBs, and PCDD/Fs. All results were reported on a wet-weight basis.
Table 1. Number of composite samples analyzed per fish species per site, 2012.
Sample Location LSS RBT MWF NPM BNT BLT CTT EBT KOK LMB YP NOP Spokane River Stateline (1-SL) 7 Plante Ferry to Upriver Dam (2-PF) 7 3 1 Mission Park (3-MP) 7 3 5 Ninemile Dam, upstream (4-NM) 7 3 7 Upper Lake Spokane (5-UL) 7 1 7 1 Little Falls Pool (7-LF) 7 3 Spok. Arm of L. Roosevelt (8-SA) 1 5 1 Pend Oreille River Pend Oreille River near Cusick 3 1 1 1 North Cascades National Park Battalion Lake 1 Ross Lake 1 1 1 Stehekin River 1 Thornton Lake 1
Species Codes: BLT = Bull trout, BNT = Brown trout, CTT = Cutthroat trout, EBT = Eastern brook trout, KOK = kokanee, LMB = Largemouth bass, LSS = Largescale sucker, MWF = Mountain whitefish, NOP = Northern pike, NPM = Northern pikeminnow, RBT = Rainbow trout, YP = Yellow perch.
Most composite samples consisted of skin-on fillets from five individual fish of the same species per site, with the exception of largescale suckers which were processed as whole fish. For most Spokane River sites, multiple composite samples of the same species were collected in order to address sampling variability and improve the strength of statistical tests to determine spatial or temporal differences. For the Spokane River, historical data informed the selection of species and fish size ranges for collections in order to improve the spatial and temporal comparability of results among sites and studies. The quality of data from the 2012 study was assessed by reviewing laboratory case narratives, analytical results, and field replicate data. Quality control procedures included a mixture of analyses such as method blanks, calibration and control standards, matrix spikes, matrix spike duplicates, surrogate recoveries, laboratory duplicates, and field replicates. Overall, the 2012
Page 10
data met measurement quality objectives, and all results were deemed usable as qualified. The quality of historical data from Ecology and the Spokane Tribe of Indians was assessed similarly, and all data were deemed acceptable as originally qualified. Further assessment of data quality is beyond the scope of this report. Other quality assurance information is available by contacting the authors of this report.
Statistical Approach to Trends Analyses for Spokane River Results Results from 2012 were plotted to examine relationships between key parameters: total-PCBs (t-PCBs) and total PBDEs (t-PBDEs) to fish length, weight, age, and lipids. Where relationships appeared to exist, Spearman correlations were produced to help quantify the strength of relationships. These operations showed that relationships among these parameters were non-existent, inconsistent, or too weak to use in normalizing the data or performing other adjustments using co-variance. These examinations were pursued to potentially increase the sensitivity of statistical tests for differences among sites or between years. Some samples had PCBs measured using two analytical methods: Aroclor and congener. A paired sample t-test showed that t-PCB values from these different methods were comparable, which is consistent with previous comparisons (Seiders and Deligeannis, 2009; Johnson et al., 2010). Results from these two methods were then pooled for analysis where appropriate. Data sets representing cases of individual fish species and sites were examined for spatial (among sites) and temporal (between 2005 and 2012) differences. Boxplots were used for initial examinations and then data sets were tested to determine whether parametric or non-parametric statistical tests could be used. Data sets often failed assumptions for normal distribution or equality of variances, so parametric tests for comparisons were not pursued. For hypotheses testing, the generalized null hypothesis was that no differences between data sets existed. For these tests, an alpha level of 0.05 was chosen, meaning that there was a low probability (5%) that the observed result from the test was not by chance. For spatial comparisons of the 2012 data, the non-parametric Kruskal-Wallis single-factor ANOVA with Dwass-Steel-Critchlow-Fligner tests for pair-wise comparisons was used. The Mann-Whitney test was used to compare results between the 2005 and 2012 data. Interpretations of these operations were then summarized in tabular format.
Page 11
Results and Discussion Results for most frequently detected analytes are summarized below. All results and site location information for the 2012 sampling are available under the Study ID “WSTMP12” via Ecology’s Environmental Information Management (EIM) database (www.ecy.wa.gov/eim).
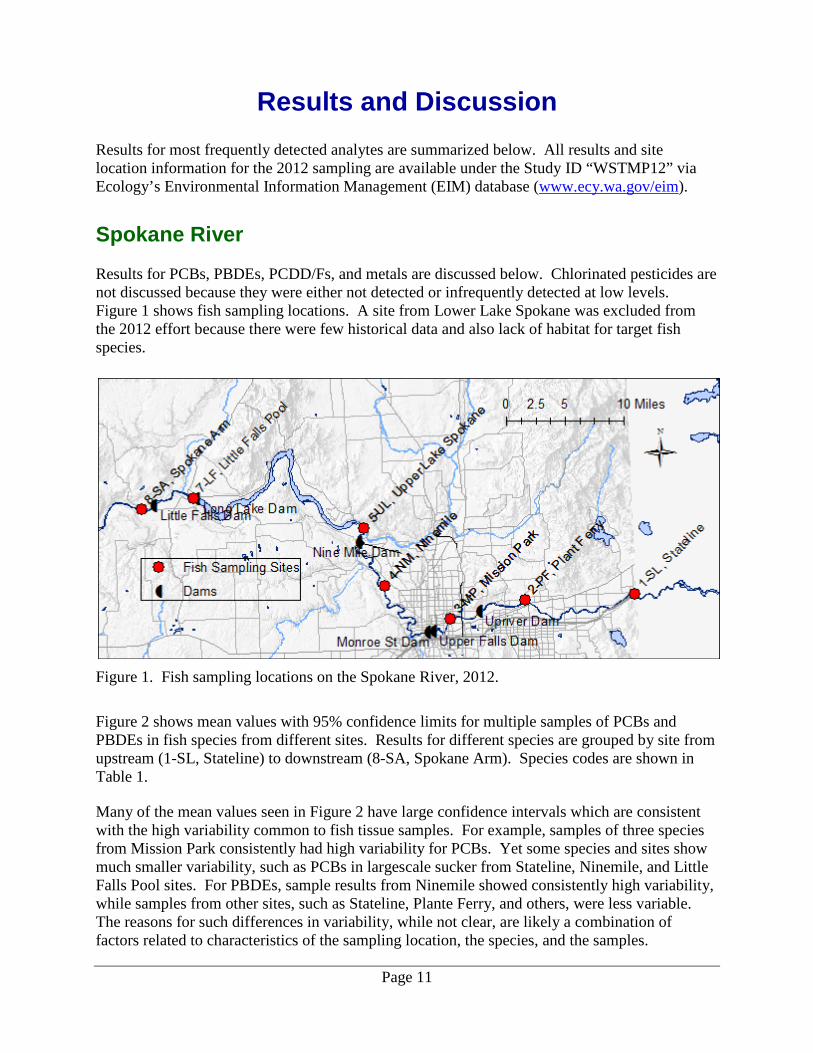
Spokane River Results for PCBs, PBDEs, PCDD/Fs, and metals are discussed below. Chlorinated pesticides are not discussed because they were either not detected or infrequently detected at low levels. Figure 1 shows fish sampling locations. A site from Lower Lake Spokane was excluded from the 2012 effort because there were few historical data and also lack of habitat for target fish species.
Figure 1. Fish sampling locations on the Spokane River, 2012.
Figure 2 shows mean values with 95% confidence limits for multiple samples of PCBs and PBDEs in fish species from different sites. Results for different species are grouped by site from upstream (1-SL, Stateline) to downstream (8-SA, Spokane Arm). Species codes are shown in Table 1. Many of the mean values seen in Figure 2 have large confidence intervals which are consistent with the high variability common to fish tissue samples. For example, samples of three species from Mission Park consistently had high variability for PCBs. Yet some species and sites show much smaller variability, such as PCBs in largescale sucker from Stateline, Ninemile, and Little Falls Pool sites. For PBDEs, sample results from Ninemile showed consistently high variability, while samples from other sites, such as Stateline, Plante Ferry, and others, were less variable. The reasons for such differences in variability, while not clear, are likely a combination of factors related to characteristics of the sampling location, the species, and the samples.

Page 12
Figure 2. Mean values with 95% confidence intervals for PCBs and PBDEs in Spokane River fish (whole and fillet), 2012.
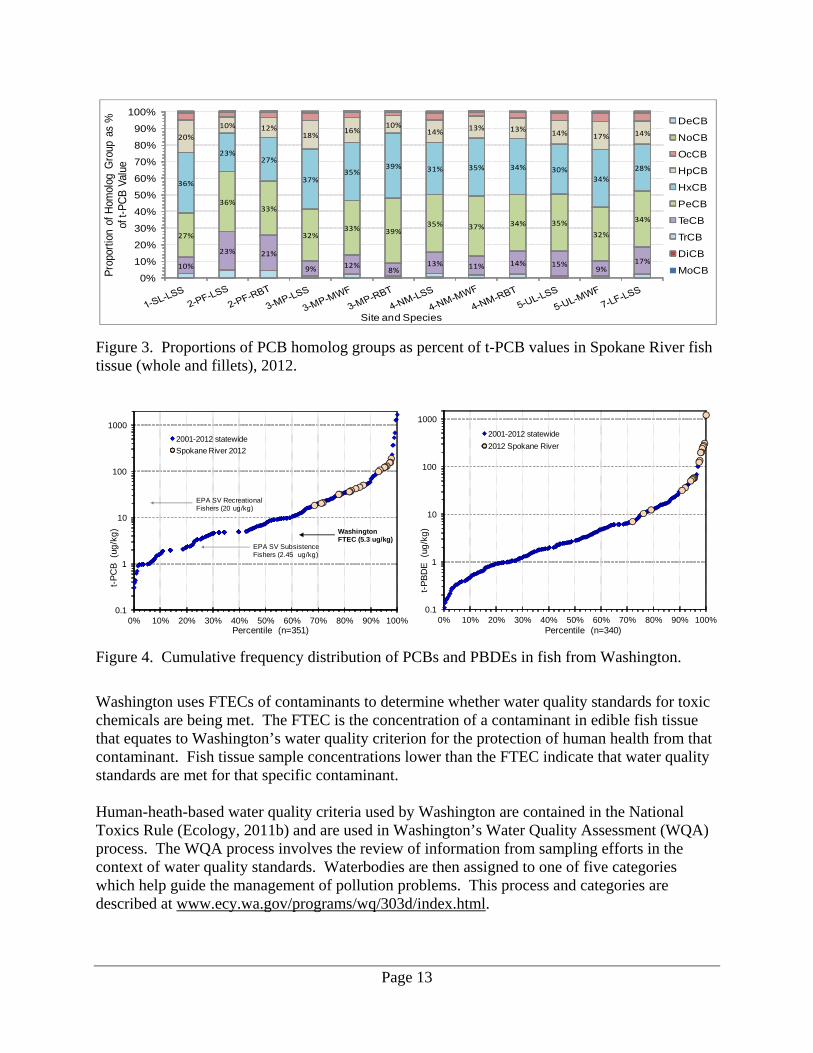
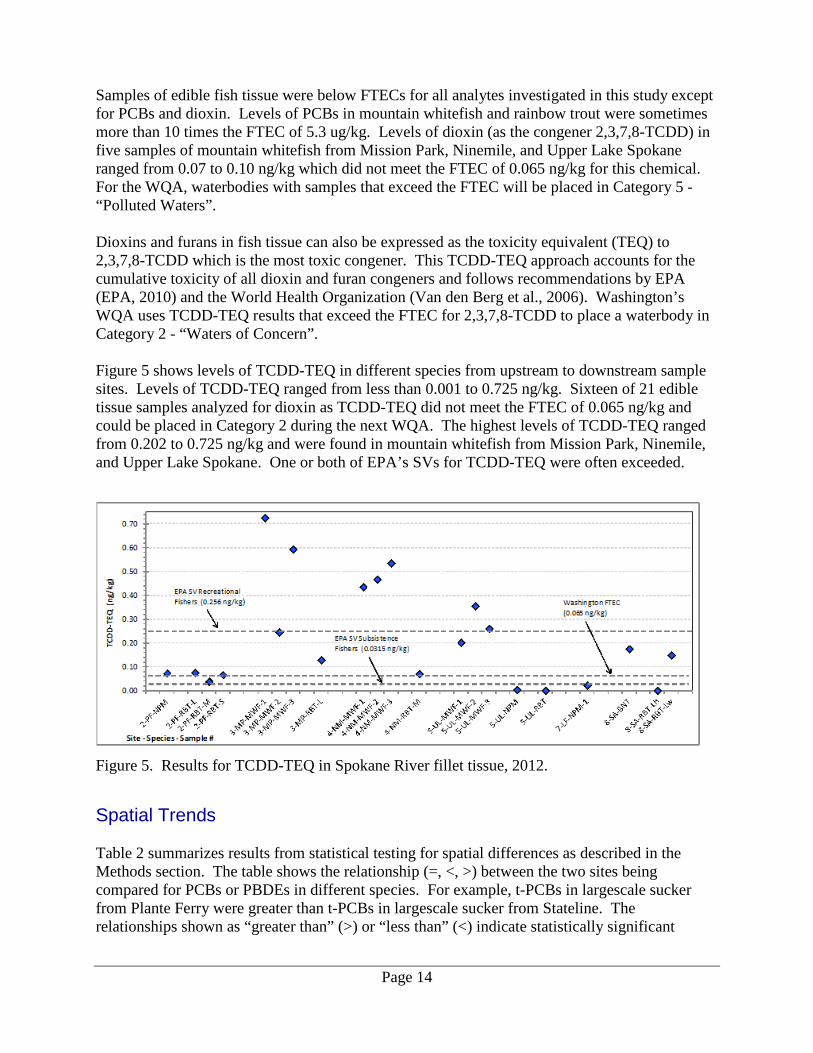
Despite the large confidence intervals, some differences among species and sites appear to exist. For example, levels of PCBs in largescale sucker from Upper Lake Spokane (mean of 191 +/- 52 ug/kg) were much higher than in largescale sucker from the Stateline, Ninemile, and Little Falls Pool sites (range of means 32-46 ug/kg). Also, mountain whitefish samples from Ninemile had far higher levels of PBDEs (mean of 1233 and range of 964-1502 ug/kg) than any other site. Results from testing for statistically significant differences are described in the Spatial Trends section below. Thirty-six samples representing three species of fish were analyzed for PCB congeners. The mean homolog total values of triplicate samples from the same species and sites were calculated and are summarized in Figure 3 as proportions of the t-PCB value for the 12 groups of samples. Figure 3 shows that the penta- and hexa-chlorinated biphenyl (CB) homologs account for about 60-80% of the t-PCB values, while the hepta-CB group accounts for 10-20% of the t-PCB values. In most samples, the tetra-CB homologs contributed an average of 12% to the t-PCB value, except for largescale sucker and rainbow trout from Plante Ferry which averaged 22% of the t-PCB value. The larger proportion of the tetra-CB homolog group in fish from Plante Ferry could potentially be related to past or present sources of PCBs in this reach. Further examination of PCB congener patterns among fish tissue, sediment, wastewater, stormwater, and other media might help inform decisions that address PCBs in the Spokane River. Figure 4 shows how PCBs and PBDEs from Spokane River fish compare to other sites in Washington. Levels of PCBs and PBDEs remain among the highest levels in Washington. For PCBs, Figure 4 also shows values that can be used for assessing risks to human health from consumption of contaminated fish. These are (1) the U.S. Environmental Protection Agency (EPA; EPA, 2000) Screening Values (SVs) for Subsistence and Recreational Fishers, and (2) Washington’s fish tissue equivalent concentration (FTEC) which is also a regulatory threshold. Screening values or regulatory thresholds have not yet been established for PBDEs.
Page 13
Figure 3. Proportions of PCB homolog groups as percent of t-PCB values in Spokane River fish tissue (whole and fillets), 2012.
Figure 4. Cumulative frequency distribution of PCBs and PBDEs in fish from Washington.
Washington uses FTECs of contaminants to determine whether water quality standards for toxic chemicals are being met. The FTEC is the concentration of a contaminant in edible fish tissue that equates to Washington’s water quality criterion for the protection of human health from that contaminant. Fish tissue sample concentrations lower than the FTEC indicate that water quality standards are met for that specific contaminant. Human-heath-based water quality criteria used by Washington are contained in the National Toxics Rule (Ecology, 2011b) and are used in Washington’s Water Quality Assessment (WQA) process. The WQA process involves the review of information from sampling efforts in the context of water quality standards. Waterbodies are then assigned to one of five categories which help guide the management of pollution problems. This process and categories are described at www.ecy.wa.gov/programs/wq/303d/index.html.
10%
23% 21%
9% 12%8%
13% 11% 14% 15%9%
17%
27%
36%33%
32%33% 39%
35% 37% 34% 35%
32%
34%
36%
23%27%
37%35%
39% 31% 35% 34% 30%34%
28%
20%
10% 12%18%
16%10%
14%13% 13%
14% 17% 14%
0%
10%
20%
30%
40%
50%
60%
70%
80%
90%
100%Pr
opor
tion
of H
omol
og G
roup
as
%
of t-
PCB
Valu
e
Site and Species
DeCB
NoCB
OcCB
HpCB
HxCB
PeCB
TeCB
TrCB
DiCB
MoCB
0.1
1
10
100
1000
0% 10% 20% 30% 40% 50% 60% 70% 80% 90% 100%
t-PC
B (u
g/kg
)
Percentile (n=351)
2001-2012 statewideSpokane River 2012
WashingtonFTEC (5.3 ug/kg)
EPA SV Subsistence Fishers (2.45 ug/kg)
EPA SV Recreational Fishers (20 ug/kg)
0.1
1
10
100
1000
0% 10% 20% 30% 40% 50% 60% 70% 80% 90% 100%
t-PBD
E (u
g/kg
)
Percentile (n=340)
2001-2012 statewide2012 Spokane River
Page 14
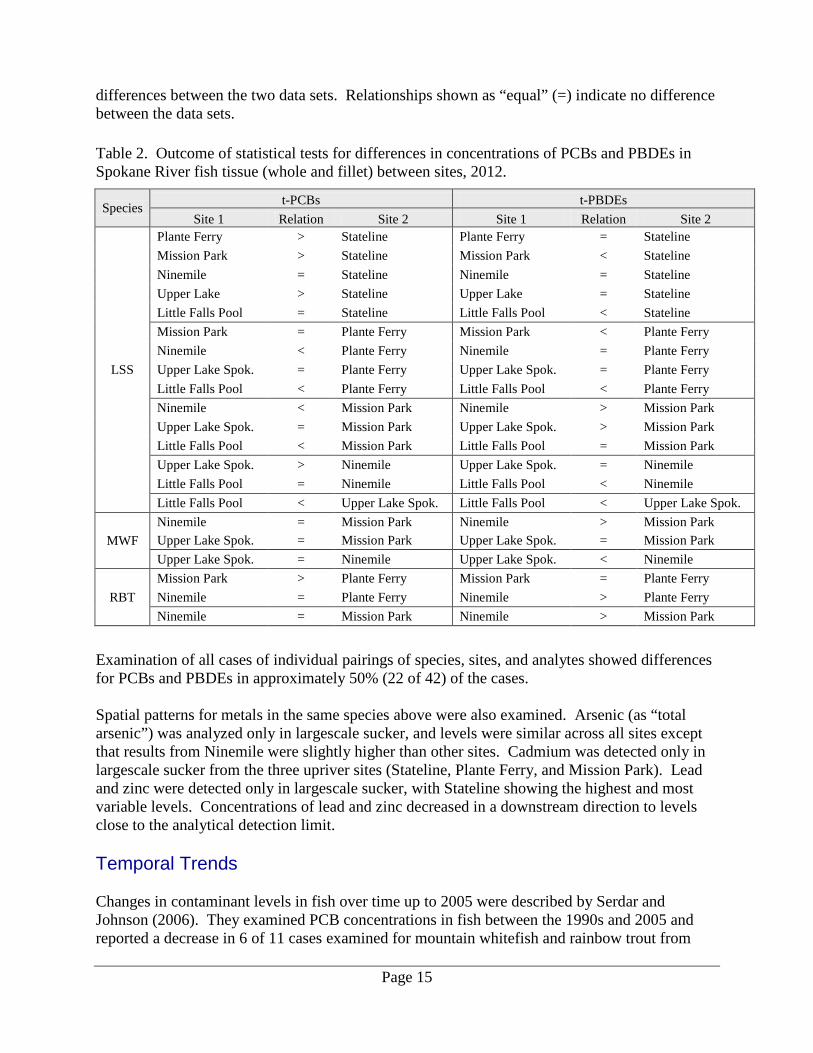
Samples of edible fish tissue were below FTECs for all analytes investigated in this study except for PCBs and dioxin. Levels of PCBs in mountain whitefish and rainbow trout were sometimes more than 10 times the FTEC of 5.3 ug/kg. Levels of dioxin (as the congener 2,3,7,8-TCDD) in five samples of mountain whitefish from Mission Park, Ninemile, and Upper Lake Spokane ranged from 0.07 to 0.10 ng/kg which did not meet the FTEC of 0.065 ng/kg for this chemical. For the WQA, waterbodies with samples that exceed the FTEC will be placed in Category 5 - “Polluted Waters”. Dioxins and furans in fish tissue can also be expressed as the toxicity equivalent (TEQ) to 2,3,7,8-TCDD which is the most toxic congener. This TCDD-TEQ approach accounts for the cumulative toxicity of all dioxin and furan congeners and follows recommendations by EPA (EPA, 2010) and the World Health Organization (Van den Berg et al., 2006). Washington’s WQA uses TCDD-TEQ results that exceed the FTEC for 2,3,7,8-TCDD to place a waterbody in Category 2 - “Waters of Concern”. Figure 5 shows levels of TCDD-TEQ in different species from upstream to downstream sample sites. Levels of TCDD-TEQ ranged from less than 0.001 to 0.725 ng/kg. Sixteen of 21 edible tissue samples analyzed for dioxin as TCDD-TEQ did not meet the FTEC of 0.065 ng/kg and could be placed in Category 2 during the next WQA. The highest levels of TCDD-TEQ ranged from 0.202 to 0.725 ng/kg and were found in mountain whitefish from Mission Park, Ninemile, and Upper Lake Spokane. One or both of EPA’s SVs for TCDD-TEQ were often exceeded.
Figure 5. Results for TCDD-TEQ in Spokane River fillet tissue, 2012.
Spatial Trends Table 2 summarizes results from statistical testing for spatial differences as described in the Methods section. The table shows the relationship (=, <, >) between the two sites being compared for PCBs or PBDEs in different species. For example, t-PCBs in largescale sucker from Plante Ferry were greater than t-PCBs in largescale sucker from Stateline. The relationships shown as “greater than” (>) or “less than” (<) indicate statistically significant
Page 15
differences between the two data sets. Relationships shown as “equal” (=) indicate no difference between the data sets. Table 2. Outcome of statistical tests for differences in concentrations of PCBs and PBDEs in Spokane River fish tissue (whole and fillet) between sites, 2012.
Species t-PCBs t-PBDEs Site 1 Relation Site 2 Site 1 Relation Site 2
LSS
Plante Ferry > Stateline Plante Ferry = Stateline Mission Park > Stateline Mission Park < Stateline Ninemile = Stateline Ninemile = Stateline Upper Lake > Stateline Upper Lake = Stateline Little Falls Pool = Stateline Little Falls Pool < Stateline Mission Park = Plante Ferry Mission Park < Plante Ferry Ninemile < Plante Ferry Ninemile = Plante Ferry Upper Lake Spok. = Plante Ferry Upper Lake Spok. = Plante Ferry Little Falls Pool < Plante Ferry Little Falls Pool < Plante Ferry Ninemile < Mission Park Ninemile > Mission Park Upper Lake Spok. = Mission Park Upper Lake Spok. > Mission Park Little Falls Pool < Mission Park Little Falls Pool = Mission Park Upper Lake Spok. > Ninemile Upper Lake Spok. = Ninemile Little Falls Pool = Ninemile Little Falls Pool < Ninemile Little Falls Pool < Upper Lake Spok. Little Falls Pool < Upper Lake Spok.
MWF Ninemile = Mission Park Ninemile > Mission Park Upper Lake Spok. = Mission Park Upper Lake Spok. = Mission Park Upper Lake Spok. = Ninemile Upper Lake Spok. < Ninemile
RBT Mission Park > Plante Ferry Mission Park = Plante Ferry Ninemile = Plante Ferry Ninemile > Plante Ferry Ninemile = Mission Park Ninemile > Mission Park
Examination of all cases of individual pairings of species, sites, and analytes showed differences for PCBs and PBDEs in approximately 50% (22 of 42) of the cases. Spatial patterns for metals in the same species above were also examined. Arsenic (as “total arsenic”) was analyzed only in largescale sucker, and levels were similar across all sites except that results from Ninemile were slightly higher than other sites. Cadmium was detected only in largescale sucker from the three upriver sites (Stateline, Plante Ferry, and Mission Park). Lead and zinc were detected only in largescale sucker, with Stateline showing the highest and most variable levels. Concentrations of lead and zinc decreased in a downstream direction to levels close to the analytical detection limit. Temporal Trends Changes in contaminant levels in fish over time up to 2005 were described by Serdar and Johnson (2006). They examined PCB concentrations in fish between the 1990s and 2005 and reported a decrease in 6 of 11 cases examined for mountain whitefish and rainbow trout from

Page 16
several sites. For the remaining 5 cases, no change was seen for 4 cases and an increase was seen in only 1 case. Comparisons were not done for PBDEs and metals because of a lack of historical data. The work by Serdar and Johnson can be consulted for more detail on temporal and spatial patterns from the 2005 and earlier sampling efforts. This study compared results from the 2005 and 2012 samples to see whether differences between the two time periods existed for PCBs, PBDEs, and four metals. Comparisons were made using two approaches: (1) in cases where sites, species, and analytes were common between the two periods and (2) by pooling results from the same species from multiple sites. Figure 6 shows the mean values and 95% confidence intervals of PCBs and PBDEs from 2012.
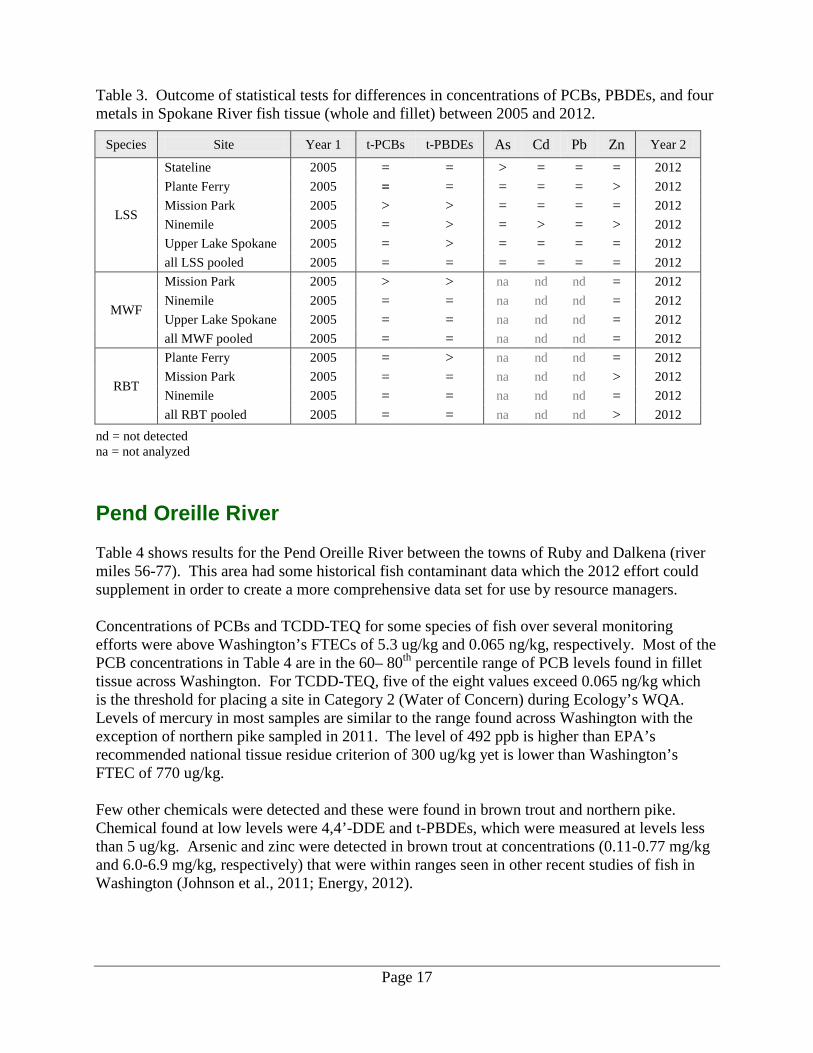
Figure 6. Mean values with 95% confidence intervals for PCBs and PBDEs in Spokane River fish tissue (whole and fillet), 2005 and 2012. Table 3 summarizes results from statistical testing for differences in contaminant concentrations in fish between 2005 and 2012 as described in the Methods section. The table shows the relationship (=, <, >) between the two years being compared for PCBs, PBDEs, and metals in different species. For example, levels of t-PBDEs in largescale sucker at Upper Lake Spokane in 2005 were greater than levels measured in 2012, and this difference was statistically significant. Cadmium and lead were not detected in mountain whitefish and rainbow trout in 2005 and 2012, so differences were not tested. Arsenic was analyzed only in largescale sucker. Table 3 reveals that, in most cases, contaminant levels between 2005 and 2012 have not changed. Yet there are some cases where levels have declined. For PCBs, 2 of 11 cases (18%) show a decrease. These decreases were in largescale sucker and mountain whitefish from Mission Park which is especially significant because this site has historically had some of the highest levels of PCBs in fish from the Spokane River. For PBDEs, 4 of 11 cases show that levels in 2005 were greater than in 2012. For metals, levels of zinc declined in 3 of 11 cases. Arsenic and cadmium declined in 2 cases of largescale sucker, and there were no measurable changes in levels of lead. Serdar and Johnson (2006) reported more cases of declining concentrations of PCBs in mountain whitefish and rainbow trout between the 1990s and 2005 than were seen between 2005 and 2012. The differences between findings in this 2012 study and the 2005 study could be due to a slowing rate of decline in contaminant levels or other factors.
Page 17
Table 3. Outcome of statistical tests for differences in concentrations of PCBs, PBDEs, and four metals in Spokane River fish tissue (whole and fillet) between 2005 and 2012.
Species Site Year 1 t-PCBs t-PBDEs As Cd Pb Zn Year 2
LSS
Stateline 2005 = = > = = = 2012 Plante Ferry 2005 = = = = = > 2012 Mission Park 2005 > > = = = = 2012 Ninemile 2005 = > = > = > 2012 Upper Lake Spokane 2005 = > = = = = 2012 all LSS pooled 2005 = = = = = = 2012
MWF
Mission Park 2005 > > na nd nd = 2012 Ninemile 2005 = = na nd nd = 2012 Upper Lake Spokane 2005 = = na nd nd = 2012 all MWF pooled 2005 = = na nd nd = 2012
RBT
Plante Ferry 2005 = > na nd nd = 2012 Mission Park 2005 = = na nd nd > 2012 Ninemile 2005 = = na nd nd = 2012 all RBT pooled 2005 = = na nd nd > 2012
nd = not detected na = not analyzed
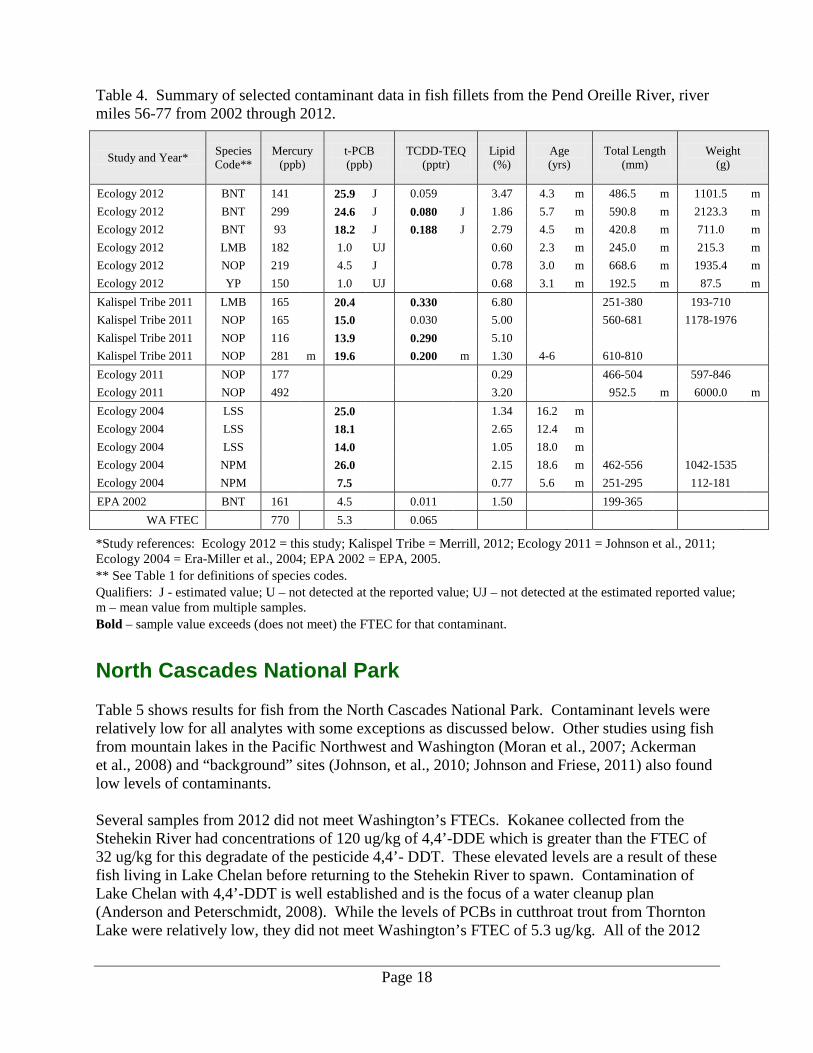
Pend Oreille River Table 4 shows results for the Pend Oreille River between the towns of Ruby and Dalkena (river miles 56-77). This area had some historical fish contaminant data which the 2012 effort could supplement in order to create a more comprehensive data set for use by resource managers. Concentrations of PCBs and TCDD-TEQ for some species of fish over several monitoring efforts were above Washington’s FTECs of 5.3 ug/kg and 0.065 ng/kg, respectively. Most of the PCB concentrations in Table 4 are in the 60– 80th percentile range of PCB levels found in fillet tissue across Washington. For TCDD-TEQ, five of the eight values exceed 0.065 ng/kg which is the threshold for placing a site in Category 2 (Water of Concern) during Ecology’s WQA. Levels of mercury in most samples are similar to the range found across Washington with the exception of northern pike sampled in 2011. The level of 492 ppb is higher than EPA’s recommended national tissue residue criterion of 300 ug/kg yet is lower than Washington’s FTEC of 770 ug/kg. Few other chemicals were detected and these were found in brown trout and northern pike. Chemical found at low levels were 4,4’-DDE and t-PBDEs, which were measured at levels less than 5 ug/kg. Arsenic and zinc were detected in brown trout at concentrations (0.11-0.77 mg/kg and 6.0-6.9 mg/kg, respectively) that were within ranges seen in other recent studies of fish in Washington (Johnson et al., 2011; Energy, 2012).
Page 18
Table 4. Summary of selected contaminant data in fish fillets from the Pend Oreille River, river miles 56-77 from 2002 through 2012.
Study and Year* Species Code**
Mercury (ppb)
t-PCB (ppb)
TCDD-TEQ (pptr)
Lipid (%)
Age (yrs)
Total Length (mm)
Weight (g)
Ecology 2012 BNT 141 25.9 J 0.059 3.47 4.3 m 486.5 m 1101.5 m Ecology 2012 BNT 299 24.6 J 0.080 J 1.86 5.7 m 590.8 m 2123.3 m Ecology 2012 BNT 93 18.2 J 0.188 J 2.79 4.5 m 420.8 m 711.0 m Ecology 2012 LMB 182 1.0 UJ 0.60 2.3 m 245.0 m 215.3 m Ecology 2012 NOP 219 4.5 J 0.78 3.0 m 668.6 m 1935.4 m Ecology 2012 YP 150 1.0 UJ 0.68 3.1 m 192.5 m 87.5 m Kalispel Tribe 2011 LMB 165 20.4 0.330 6.80 251-380 193-710 Kalispel Tribe 2011 NOP 165 15.0 0.030 5.00 560-681 1178-1976 Kalispel Tribe 2011 NOP 116 13.9 0.290 5.10 Kalispel Tribe 2011 NOP 281 m 19.6 0.200 m 1.30 4-6 610-810 Ecology 2011 NOP 177 0.29 466-504 597-846 Ecology 2011 NOP 492 3.20 952.5 m 6000.0 m Ecology 2004 LSS 25.0 1.34 16.2 m Ecology 2004 LSS 18.1 2.65 12.4 m Ecology 2004 LSS 14.0 1.05 18.0 m Ecology 2004 NPM 26.0 2.15 18.6 m 462-556 1042-1535 Ecology 2004 NPM 7.5 0.77 5.6 m 251-295 112-181 EPA 2002 BNT 161 4.5 0.011 1.50 199-365
WA FTEC 770 5.3 0.065
*Study references: Ecology 2012 = this study; Kalispel Tribe = Merrill, 2012; Ecology 2011 = Johnson et al., 2011; Ecology 2004 = Era-Miller et al., 2004; EPA 2002 = EPA, 2005. ** See Table 1 for definitions of species codes. Qualifiers: J - estimated value; U – not detected at the reported value; UJ – not detected at the estimated reported value; m – mean value from multiple samples. Bold – sample value exceeds (does not meet) the FTEC for that contaminant.
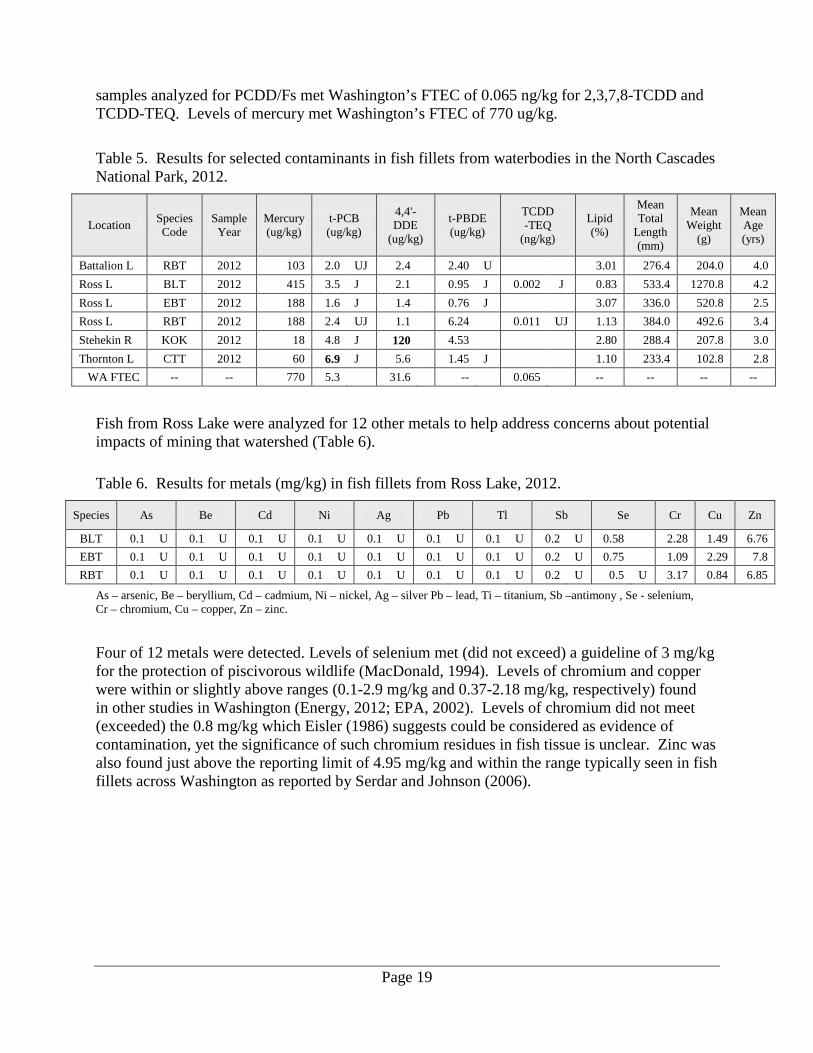
North Cascades National Park Table 5 shows results for fish from the North Cascades National Park. Contaminant levels were relatively low for all analytes with some exceptions as discussed below. Other studies using fish from mountain lakes in the Pacific Northwest and Washington (Moran et al., 2007; Ackerman et al., 2008) and “background” sites (Johnson, et al., 2010; Johnson and Friese, 2011) also found low levels of contaminants. Several samples from 2012 did not meet Washington’s FTECs. Kokanee collected from the Stehekin River had concentrations of 120 ug/kg of 4,4’-DDE which is greater than the FTEC of 32 ug/kg for this degradate of the pesticide 4,4’- DDT. These elevated levels are a result of these fish living in Lake Chelan before returning to the Stehekin River to spawn. Contamination of Lake Chelan with 4,4’-DDT is well established and is the focus of a water cleanup plan (Anderson and Peterschmidt, 2008). While the levels of PCBs in cutthroat trout from Thornton Lake were relatively low, they did not meet Washington’s FTEC of 5.3 ug/kg. All of the 2012
Page 19
samples analyzed for PCDD/Fs met Washington’s FTEC of 0.065 ng/kg for 2,3,7,8-TCDD and TCDD-TEQ. Levels of mercury met Washington’s FTEC of 770 ug/kg.
Table 5. Results for selected contaminants in fish fillets from waterbodies in the North Cascades National Park, 2012.
Location Species Code
Sample Year
Mercury (ug/kg)
t-PCB (ug/kg)
4,4'-DDE
(ug/kg)
t-PBDE (ug/kg)
TCDD -TEQ
(ng/kg)
Lipid (%)
Mean Total
Length (mm)
Mean Weight
(g)
Mean Age (yrs)
Battalion L RBT 2012 103 2.0 UJ 2.4 2.40 U 3.01 276.4 204.0 4.0 Ross L BLT 2012 415 3.5 J 2.1 0.95 J 0.002 J 0.83 533.4 1270.8 4.2 Ross L EBT 2012 188 1.6 J 1.4 0.76 J 3.07 336.0 520.8 2.5 Ross L RBT 2012 188 2.4 UJ 1.1 6.24 0.011 UJ 1.13 384.0 492.6 3.4 Stehekin R KOK 2012 18 4.8 J 120 4.53 2.80 288.4 207.8 3.0 Thornton L CTT 2012 60 6.9 J 5.6 1.45 J 1.10 233.4 102.8 2.8
WA FTEC -- -- 770 5.3 31.6 -- 0.065 -- -- -- --
Fish from Ross Lake were analyzed for 12 other metals to help address concerns about potential impacts of mining that watershed (Table 6).
Table 6. Results for metals (mg/kg) in fish fillets from Ross Lake, 2012.
Species As Be Cd Ni Ag Pb Tl Sb Se Cr Cu Zn
BLT 0.1 U 0.1 U 0.1 U 0.1 U 0.1 U 0.1 U 0.1 U 0.2 U 0.58 2.28 1.49 6.76 EBT 0.1 U 0.1 U 0.1 U 0.1 U 0.1 U 0.1 U 0.1 U 0.2 U 0.75 1.09 2.29 7.8 RBT 0.1 U 0.1 U 0.1 U 0.1 U 0.1 U 0.1 U 0.1 U 0.2 U 0.5 U 3.17 0.84 6.85
As – arsenic, Be – beryllium, Cd – cadmium, Ni – nickel, Ag – silver Pb – lead, Ti – titanium, Sb –antimony , Se - selenium, Cr – chromium, Cu – copper, Zn – zinc.
Four of 12 metals were detected. Levels of selenium met (did not exceed) a guideline of 3 mg/kg for the protection of piscivorous wildlife (MacDonald, 1994). Levels of chromium and copper were within or slightly above ranges (0.1-2.9 mg/kg and 0.37-2.18 mg/kg, respectively) found in other studies in Washington (Energy, 2012; EPA, 2002). Levels of chromium did not meet (exceeded) the 0.8 mg/kg which Eisler (1986) suggests could be considered as evidence of contamination, yet the significance of such chromium residues in fish tissue is unclear. Zinc was also found just above the reporting limit of 4.95 mg/kg and within the range typically seen in fish fillets across Washington as reported by Serdar and Johnson (2006).

Page 20
Conclusions Results of this 2012 study support the following conclusions.
Spokane River The high variability associated with fish contaminant data makes it difficult to detect small differences among locations or over time. Differences could be seen in a few cases where differences were much greater than the variability. Spatial differences were seen for PCBs and PBDEs in 48% of the pairings tested (22 of 42 site-species cases). There were few consistent patterns in overall differences among sites. Exceptions include:
• PCBs were higher in all fish species from Mission Park and Upper Lake Spokane compared to other sites.
• Fish from Little Falls pool and the Spokane Arm of Lake Roosevelt consistently had some of the lowest levels of PCBs and PBDEs.
• PBDEs in the mountain whitefish from Ninemile were about 4-10 times higher than PBDEs in fish from other sites and are the highest levels seen in Washington.
• PBDEs in all species from Ninemile and Upper Lake Spokane were higher than PBDEs in fish from other sites.
Statistical testing of temporal changes indicated that, in most cases, contaminant levels in fish between 2005 and 2012 have not changed. Yet there were some cases where levels declined. For PCBs, 2 of 11 cases (18%) show a decrease, with both cases (largescale sucker and mountain whitefish) being from the Mission Park site. PCB congener analysis indicated that penta-CB and hexa-CB homologs accounted for about 60-80% of the t-PCB values measured, while hepta-CBs accounted for 10-20% of the t-PCB values. Overall, levels of PCBs and PBDEs in fish from the Spokane River remain elevated compared to other areas in Washington. Levels of PCBs in Spokane River fish were often more than 10 times Washington’s FTEC of 5.3 ug/kg.
Pend Oreille River and North Cascades National Park Levels of mercury, PCBs, and dioxins (as TCDD-TEQ) in fish from the Pend Oreille River fall within the 40-80th percentile range of levels found in fish from across Washington. This study’s compilation of fish contaminant data from other efforts should help meet the needs of resource managers from various groups. Contaminant levels in fish from sites in the North Cascades National Park were relatively low for all analytes. An exception was 4,4’-DDE in kokanee that had returned to the Stehekin River from Lake Chelan. Contamination of Lake Chelan with 4,4’-DDE is well known and is the focus of a water cleanup plan.

Page 21
Recommendations Results of this 2012 study support the following recommendations. Future sampling of Spokane River fish for trend analysis should focus on key species at key sites and collect fish with size ranges that are comparable to the 2012 samples. Key species and sites include:
• Largescale sucker at Stateline, Plante Ferry, Mission Park, Ninemile, Upper Lake Spokane, and Little Falls pool.
• Mountain whitefish at Mission Park, Ninemile, and Upper Lake Spokane. The value of sampling rainbow trout in the Spokane River for discerning spatial or temporal trends should be considered only after addressing issues related to: (1) the origins of trout at various sites (hatchery or wild), (2) species identification (mixtures of rainbow, cutthroat, rainbow/cutthroat hybrids, and redband trouts), and (3) efforts to protect the redband trout in the river. Each of these issues can confound the collection of fish and the interpretation of contaminant data for trends. Based on comparisons of contaminant levels in Spokane River fish from 2005 and 2012, re-sampling fish at a frequency of 5-10 years seems appropriate for trend analysis. For all monitoring efforts with fish, where the objective is to discern differences in contaminant concentrations over time or space, a minimum of seven field replicate composite samples of a single fish species per site should be collected. Where sufficient data are available, statistical power analyses should be done to help determine sample sizes needed to meet objectives. Multiple species should be collected when possible to strengthen interpretations using a “weight of evidence” approach. The use of whole largescale suckers should be expanded because this species is widespread and abundant.
Page 22
References Ackerman, L.K., Schwindt, A.R., Massey Simonich, S.L., Koch, D.C., Blett, T.F., Schreck, C.B., Kent, M.L., Landers, D.H., 2008. Atmospherically Deposited PBDEs, Pesticides, PCBs, and PAHs in Western U.S. National Park Fish: Concentrations and Consumption Guidelines. 2008. Environmental Science and Technology. 2008. 42 (7): 2334-2341. Anderson, R. and M. Peterschmidt, 2008. Lake Chelan DDT and PCB TMDL: Water Quality Implementation Plan. Washington State Department of Ecology. Publication No. 08-10-048. https://fortress.wa.gov/ecy/publications/summarypages/0810048.html Ecology, 2011a. Spokane River Toxics Reduction Strategy. Washington State Department of Ecology, Olympia, WA. Publication No. 11-10-038. https://fortress.wa.gov/ecy/publications/summarypages/1110038.html Ecology, 2011b. Water Quality Standards for Surface Waters of the State of Washington: Chapter 173-201A WAC. Washington State Department of Ecology, Olympia, WA. Publication No. 06-10-091. https://fortress.wa.gov/ecy/publications/SummaryPages/0610091.html Eisler, R., 1986. Chromium hazards to fish, wildlife, and invertebrates: a synoptic review. U.S. Fish and Wildlife Service Biological Report 85 (1.6). 60 pp). Energy, 2012. Columbia River Component Risk Assessment. Volume II: Baseline Human Health Risk Assessment. U.S. Department of Energy, Richland WA. Publication No. DOE/RL-2010-117, Volume II, Part 1, Rev. 0. EPA, 2000. Guidance for Assessing Chemical Contaminant Data for Use in Fish Advisories - Volume 2: Risk Assessment and Fish Consumption Limits, Third Edition. U.S. Environmental Protection Agency, Office of Water, Washington, D.C. Publication No. EPA-823-B-00-008. EPA, 2002. Columbia River Basin Fish Contaminant Survey, 1996-1998. U.S. Environmental Protection Agency, Region 10, Office of Water, Seattle, WA. Publication No. EPA-910/R-02-006. http://yosemite.epa.gov/r10/oea.nsf/0703BC6B0C5525B088256BDC0076FC44/C3A9164ED269353788256C09005D36B7?OpenDocument EPA, 2005. National Lake Fish Tissue Study. U.S. Environmental Protection Agency, Office of Water, Washington D.C. http://water.epa.gov/scitech/swguidance/fishstudies/lakefishtissue_index.cfm EPA, 2010. Recommended Toxicity Equivalence Factors (TEFs) for Human Health Risk Assessments of 2,3,7,8-Tetrachlorodibenzo-p-dioxin and Dioxin-Like Compounds. U.S. Environmental Protection Agency, Risk Assessment Forum, Washington D.C. Publication No. EPA/600/R-10/005.
Page 23
Era-Miller, B., 2004. Verification of 303(d)-listed Sites in Northwest, Central, and Eastern Regions of Washington State. Washington State Department of Ecology, Olympia, WA. Publication No. 04-03-035. https://fortress.wa.gov/ecy/publications/summarypages/0403035.html Health, 2007. Health Consultation: Evaluation of PCBs, PBDEs and Selected Metals in the Spokane River, Including Long Lake, Spokane, Washington. Washington State Department of Health. Publication No. DOH 334-147 August 2007. Health, 2012. Pend Oreille Fish Consumption Advisory: Technical Summary. Washington State Department of Health. Publication No. DOH 334-302, July 2012. Johnson, A., K. Seiders, and D. Norton, 2010. An Assessment of PCB and Dioxin Background in Washington Freshwater Fish, with Recommendations for Prioritizing 303(d) Listings. Washington State Department of Ecology, Olympia, WA. Publication No. 10-03-007. https://fortress.wa.gov/ecy/publications/summarypages/1003007.html Johnson, A., M. Friese, J. Roland, C. Gruenenfelder, B. Dowling, A. Fernandez, and T. Hamlin, 2011. Background Characterization for Metals and Organic Compounds in Northeast Washington Lakes, Part 2: Fish Tissue. Washington State Department of Ecology, Olympia, WA. Publication No. 11-03-054. https://fortress.wa.gov/ecy/publications/summarypages/1103054.html Johnson, A. and M. Friese, 2011. Background Characterization for Metals and Organic Compounds in Northeast Washington Lakes, Part 2: Fish Tissue. Washington State Department of Ecology, Olympia, WA. Publication No. 11-03-054. https://fortress.wa.gov/ecy/publications/summarypages/1103054.html MacDonald, D.D., 1994. A Review of Environmental Quality Criteria and Guidelines for Priority Substances in Fraser River Basin. MacDonald Environmental Sciences Limited. Ladysmith, British Columbia. Merrill, K., 2012. Sampling and analysis of Pend Oreille River fish tissue for contaminants by the Kalispel Tribe in 2009 and 2001. Personal communications. Moran, P., N. Aluru, R.W. Black, and M.M. Vijayan, 2007. Tissue contaminants and associated transcriptional response in trout liver from high elevation lakes of Washington. Environmental Science and Technology. 2007, 41, 6591-6597. Seiders, K., 2013. Quality Assurance Project Plan: Washington Freshwater Fish Contaminant Monitoring Program. Washington State Department of Ecology, Olympia, WA. Publication No. 13-03-111. https://fortress.wa.gov/ecy/publications/summarypages/1303111.html Seiders, K. and C. Deligeannis, 2009. Washington State Toxics Monitoring Program: Freshwater Fish Tissue Component, 2008. Washington State Department of Ecology, Olympia, WA. Publication No. 09-03-055. https://fortress.wa.gov/ecy/publications/summarypages/0903055.html
Page 24
Serdar, D. and A. Johnson, 2006. PCBs, PBDEs, and Selected Metals in Spokane River Fish, 2005. Washington State Department of Ecology, Olympia, WA. Publication No. 06-03-025. https://fortress.wa.gov/ecy/publications/SummaryPages/0603025.html Serdar, D., B. Lubliner, A. Johnson, and D. Norton, 2011. Spokane River PCB Source Assessment, 2003-2007. Washington State Department of Ecology, Olympia, WA. Publication No. 11-03-013. https://fortress.wa.gov/ecy/publications/summarypages/1103013.html Van den Berg, M., L. Birnbaum, M. Denison, M. De Vito, W. Farland, M. Feeley, H. Fiedler, H. Hakansson, A. Hanberg, L. Haws, M. Rose, S. Safe, D. Schrenk, C. Tohyama, A. Tritscher, J. Tuomisto, M. Tysklind, N. Walker, and R. Peterson, 2006. The 2005 World Health Organization Re-evaluation of Human and Mammalian Toxic Equivalency Factors for Dioxins and Dioxins-Like Compounds. Toxicological Sciences 2006 93(2):223-241. http://toxsci.oxfordjournals.org/cgi/reprint/kfl055v1?ijkey=pio0gXG6dghrndD&keytype=ref.
Page 25
Appendix. Glossary, Acronyms, and Abbreviations
Glossary Analyte: A substance or constituent being measured in an analytical procedure. (Parameter). A physical, chemical, or biological property whose measured value helps determine the characteristics of something of interest.
Clean Water Act: A federal act passed in 1972 that contains provisions to restore and maintain the quality of the nation’s waters. Section 303(d) of the Clean Water Act establishes the TMDL program.
Congener: In chemistry, congeners are related chemicals. For example, polychlorinated biphenyls (PCBs) are a group of 209 molecules that are related by a similar structure and are called congeners.
Fish Tissue Equivalent Concentration (FTEC): The concentration of a contaminant in fish tissue that equates to Washington’s water quality standard for toxic substances for the protection of human health. Washington uses the National Toxics Rule Water Quality Criteria for the protection of human health. The FTEC is calculated by multiplying the contaminant-specific Bioconcentration Factor (BCF) times the contaminant-specific National Toxics Rule Water Quality Criterion for water.
Spatial: Relating to space, location, and distance, such as between two sampling sites.
Surface waters of the state: Lakes, rivers, ponds, streams, inland waters, salt waters, wetlands and all other surface waters and water courses within the jurisdiction of Washington State.
Temporal: Relating to time, such as between one year and another,.
Total Maximum Daily Load (TMDL): Water cleanup plan. A distribution of a substance in a waterbody designed to protect it from not meeting (exceeding) water quality standards. A TMDL is equal to the sum of all of the following: (1) individual wasteload allocations for point sources, (2) the load allocations for nonpoint sources, (3) the contribution of natural sources, and (4) a Margin of Safety to allow for uncertainty in the wasteload determination. A reserve for future growth is also generally provided.
Trend: A meaningful change or difference that can be measured and differentiated from measurement error. Often used in the context of time (temporal trend) or space (spatial trend).
Water Quality Assessment (WQA): Washington's Water Quality Assessment lists the water quality status for water bodies in the state. This assessment meets the federal requirements for an integrated report under Sections 303(d) and 305(b) of the Clean Water Act. The assessed waters are grouped into categories that describe the status of water quality. The 303(d) list comprises those waters that are in the polluted water category, for which beneficial uses– such as drinking, recreation, aquatic habitat, and industrial use – are impaired by pollution.
Page 26
303(d) list: Section 303(d) of the federal Clean Water Act requires Washington State to periodically prepare a list of all surface waters in the state for which beneficial uses of the water – such as for drinking, recreation, aquatic habitat, and industrial use – are impaired by pollutants. These are water quality-limited estuaries, lakes, and streams that fall short of state surface water quality standards and are not expected to improve within the next two years.
Acronyms and Abbreviations ANOVA Analysis of Variance As Arsenic BLT Bull trout (Salvelinus confluentus) BNT Brown trout (Salmo trutta) CB Chlorinated biphenyl Cd Cadmium CTT Cutthroat trout (Oncorhynchus clarki) DDE Dichlorodiphenyldichloroethylene DDT Dichlorodiphenyltrichloroethane EBT Eastern brook trout (Salvelinus fontinalis) Ecology Washington State Department of Ecology EPA U.S. Environmental Protection Agency FCA Fish Consumption Advisory FFCMP Freshwater Fish Contaminant Monitoring Program FTEC Fish tissue equivalent concentration Health Washington State Department of Health J estimated value KOK Kokanee (Oncorhynchus nerka) LMB Largemouth bass (Micropterus salmoides) LSS Largescale sucker (Catostomus macrocheilus) m mean value from multiple samples MEL Manchester Environmental Laboratory MWF Mountain whitefish (Prosopium williamsoni) na Not analyzed nd Not detected NOP Northern pike (Esox lucius) NPM Northern pikeminnow (Ptychocheilus oregonensis) Pb Lead PBDE Polybrominated diphenyl ether PCB Polychlorinated biphenyl PCDD/F Polychlorinated dibenzo-p-dioxin and -furan RBT Rainbow trout (Oncorhynchus mykiss) SV Screening value t-PCBs Total PCBs t-PBDEs Total PBDEs TCDD 2,3,7,8-tetra-chlorinated dibenzo-p-dioxin TEQ Toxicity equivalent

Page 27
TMDL Total Maximum Daily Load U Not detected at the reported value UJ Undetected at the estimated reported value USGS U.S. Geological Survey WAC Washington Administrative Code WQA Water Quality Assessment WRIA Water Resource Inventory Area YP Yellow perch (Perca flavescens) Zn Zinc Units of Measurement < less than > greater than = equal to ft feet g gram, a unit of mass kg kilograms, a unit of mass equal to 1,000 grams mg milligram mg/kg milligrams per kilogram (parts per million)
ng/kg nanograms per kilogram (parts per trillion) ug/g micrograms per gram (parts per million) ug/kg micrograms per kilogram (parts per billion)