fresh produce marketing trends: implications for …sfp.ucdavis.edu/files/144708.pdf · fresh...
TRANSCRIPT

Fresh Produce Marketing Trends: Implications for Blueberries
Fresh Produce Marketing Trends: Implications for Blueberries
DR. ROBERTA COOKDept. of Ag and Resource Economics
University of California Davis
May 2008

025,00050,00075,000
100,000125,000150,000
Production Imports Exports
U.S. Fresh Blueberries: Production, Imports & Exports, 1,000 Pounds
1985 2000 20041998 2006
Thou
sand
Pou
nds
Source: USDA, ERS, 10-07

US Per Capita Utilization of Fresh Blueberries and Strawberries, 1980-2006
0
2
4
6
8
1980198
2198
4198
6198
8199
0199
2199
4199
6199
8200
0200
2200
4200
6
Blueberry StrawberryPounds
Source: ERS/USDA,10-07
.56
6.13

Estimated trends in N. American greenhouse tomato area, hectares
0
500
1,000
1,500
2,000
2,500
3,000
1994
1995
1996
1997
1998
1999
2000
2001
2002
2003
2004
2005
2006
Mexico*CanadaUS**
Sources: ITC, AMPHI, Stat Canada, and Calvin and Cook
*Excludes most shade house until 2005**Major producers only until 1998

US Average Annual FOB Greenhouse Tomato Prices, 1990-2005, Dollars per Pound
Sources: Greenhouse shippers’ internal records
$0.70
$0.80
$0.90
$1.00
1990 1991 1992 1993 1994 1995 1996 1997 1998 1999 2000 2001 2002 2003 2004 2005 Est
Hurricane effect causing a reduction in field supply,benefiting GH growers.

Dollar Sales
Source:Technomic, Inc.
Quantity Sold
50.2%
49.8%
Retail Foodservice
Foodservice Retail
72.8%
27.2%
US Food System: $998.25 Billion Retail Sales Equivalent, 2006, and Channel Shares

Fresh produce not getting its “fair” share of the rapidly growing foodservice channels
– USDA estimated that only around 10% of fresh fruit and 20% of veggies are purchased in foodservice channels (lettuce, tomatoes and potatoes are big exceptions).
– Seasonality, perishability, supplier size are obstacles.
– Now is the right time for all segments of the foodservice industry to increase fresh produce use, CSR propels action and consumer health and wellness trends support it.
– Everyone must differentiate to successfully compete, fresh produce is a great way – color, “new” products, low plate cost, great flavor.

Fresh produce not getting its “fair” share of the rapidly growing foodservice channels
– Race to innovate!; including for retailers who are developing foodservice as HMR option (HEB, Publix, Wegman’s).
– Foodservice distributors play a leading role in supplying the foodservice industry (over 800,000 outlets) so intermediaries play a much larger role than in retail channels.
– But more fresh produce offerings on menus expands total demand, regardless of whether shippers are serving restaurant chains directly or not.

Chain Sales (million $) RankTop 25 US Fast Casual Chain Restaurants, 2006
Source: The Food Institute’s Food Industry Review, 2007
Panera / St. Louis Bread Co. $1,911.6 1Panda Express 894.5 2Chipotle *837.0 3Boston Market *685.0 4El Pollo Loco *530.0 5Zaxby's *415.0 6Fuddruckers *373.0 7Baja Fresh Mexican Grill *335.0 8Einstein Bros. Bagels *328.5 9Fazoli's *318.0 10
* = estimate

Moe's Southwest Grill 273.0 11Qdoba Mexican Grill *266.0 12McAlister's Deli 255.1 13Taco Cabana *232.8 14Schlotzsky's Deli *220.0 15Au Bon Pain *203.0 16Pollo Tropical *197.1 17Pei Wei Asian Diner 180.4 18Corner Bakery Café *180.0 19Donatos Pizza 175.0 20
Chain Sales (million $) Rank
* = estimateSource: The Food Institute’s Food Industry Review, 2007
Top 25 US Fast Casual Chain Restaurants, 2006

Top 25 US Fast Casual Chain Restaurants, 2006
Source: The Food Institute’s Food Industry Review, 2007
Taco Bueno 173.2 21Atlantic Bread Company
Bakery Café 166.4 22Rubio's Fresh Mexican Grill 155.0 23Wingstop 154.0 24Noodles & Company *152.5 25
TOTAL $9,611.1**
Chain Sales (million $) Rank
* = estimate**But still only 6% of LSR segment.

Source: 2007: The Salad Category Report, Technomic Info. Services, 2007.
Panera Bread / St. Louis Bread Co.Fuji Apple Chicken* $5.69all-natural citrus-herb chicken, field greens, Romaine lettuce, tomatoes, onions, pecans, Gorgonzola, and apple chips with white balsamic Fuji apple vinaigrette
Unusual Salad Offerings: LSR Chains

Source: 2007: The Salad Category Report, Technomic Info. Services, 2007.
CosiSignature Salad $6.59Gorgonzola, grapes, pears, pistachios, dried cranberries, and mixed greens with roasted shallot sherry vinaigrette
FuddruckersChicken Florentine $7.59spinach artichoke dip, Swiss cheese, lettuce, tomatoes, and choice of dressing
Unusual Salad Offerings: LSR Chains

Shipper Fresh Produce Strategies:– Making the investment required to hire foodservice
experts (often outsourced) to work “long term”– Overcome obstacles, consistency in grading, quality,
pricing, packs; in some cases marketing incentives for a menu mention of their brand
– Attempt to understand specific account needs, and what’s required to sell to them in windows, subwindows, or limited time offers – takes into account seasonality and makes it a plus, creating excitement for consumers
– Ensuring that their product offering is aligned with operations and marketing considerations for the chain in question – can it be executed?!


Other B$184.204
Source: Industry Size July 2007, Technomic Inc.
Total US Food Service $513.186 Billion,Forecast, July 2007, share of dollar sales
Bars & Restaurants$328.982B
1%
47%52%19% 11%
14%12%21%23%
Limited Service
Full ServiceBars, Taverns
Retail Hosts Remainder
Travel, Leisure
Bus. & Ind.Educ.
Health-care

U.S. Consumer Store Shopping Habits
0102030405060708090
100
2001
2004
2007
Mass Merch
Super-center
DollarStores
DrugGrocery
Source: ACNielsen
Household Penetration (%)
Club

U.S. Consumer Store Shopping Habits, by Household
0
20
40
60
80 2001
2004
2007
Source: ACNielsen
Mass Merch
Super-center
ClubDollarStore
DrugGrocery
Trips Per Year/Household

Source: ACNielsen
U.S. Consumer Store Shopping Habits, by Household
• Looking back even further, in 1995 consumers made 92 trips/year to a grocery store (supermarket) vs. 59 in 2007.
• But the decline for supermarkets is not the whole story.
• Total shopping trips/year, across all formats, are down from 152 in 2001 to 138 in 2007.
• Conventional grocery retailers are fighting back, (e.g., Safeway lifestyle stores, Ingredients for Life Campaign; Hannaford Guiding Stars), all benefiting fresh produce

Trends in US Store Format Market Shares, and 2006 Grocery Sales* and Store Numbers
2006 Sales$Million
2006 #Stores
2006 $% Share
2011 $% Share
Traditional $427,567 40,552 49.8 43.5Nontraditional $292,409 48,340 34.0 40.3Total C-Stores $138,876 144,130 16.2 16.2GRAND TOTAL $858,851 233,023 100.0 100.0•Grocery sales only, excludes electronics, prescription drugs, toys, jewelry,sporting goods, gas, clothing, footwear, knickknacks, and hardlines.Source: The Future of Food Retailing, Willard Bishop, June 2007

Format # of % of Sales, % ofStores Total Stores Million $ Total Sales
US Grocery Sales and Store Numbers by Key Format, 2006, Excluding Membership Clubs, C-Stores, and
Grocery Stores with Sales <$2M/Yr.
Total 33,405 100.0% $492,951 100.0%Conventional supermkt 27,006 80.8% $345,459 70.1%Supercenter* 2,758 8.3% $124,041 25.2%Combined ltd assortand natural/gourmet 3,641 10.9% $23,449 4.7%supermarkets
*Supermarket-type items only.Source: Based on Progressive Grocer’s 74th Annual Report of the Grocery Industry, as cited in The Food Institute’s Food Industry Review, 2007.

Size of Leading Natural and Limited Assortment Supermarket Retailers
• As of Sept. 30, 2007 Whole Foods operated 276 stores* with $6.6 billion in FY 2007 sales, including Wild Oats; Whole Foods is about ½ the size of HEB
• Trader Joe’s sales are estimated at over $5 billion, with 262 stores in 2006 (owned by the Albrecht family of Germany)
• Conventional supermarket operators are still the primary customers for fresh produce suppliers, and the good news is, most are changing their formats to emphasize freshness, including increased attention to produce departments, however, they are mega-retailers with buying power
Sources: Whole Foods Annual Reports and 10-K filings; The Food Institute.*Includes 6 stores in the UK and 7 in Canada; $5.6B in FY 2006 sales.

2006 Grocery Sales* and Store Numbers; and Non-Traditional Grocery Channel Share of Total US Grocery
Sales, 2006 vs. 20112006 Sales$Million
2006 #Stores
2006 $% Share
2011 $% Share
Total Nontraditional $292,409 48,340 34.0 40.3Wholesale Club $63,504 1,240 7.4 8.2Supercenter $124,675 2,696 14.5 20.3Dollar Store $14,852 20,543 1.7 2.0Drug $42,240 19,864 4.9 4.8Mass Merchandise $43,011 3,826 5.0 4.6Military $4,126 172 .5 .4
•Grocery sales only, excludes gas, hardlines, clothing, electronics, prescription drugs, knickknacks,footwear, sporting goods, toys, and jewelry.
Source: The Future of Food Retailing, Willard Bishop, June 2007
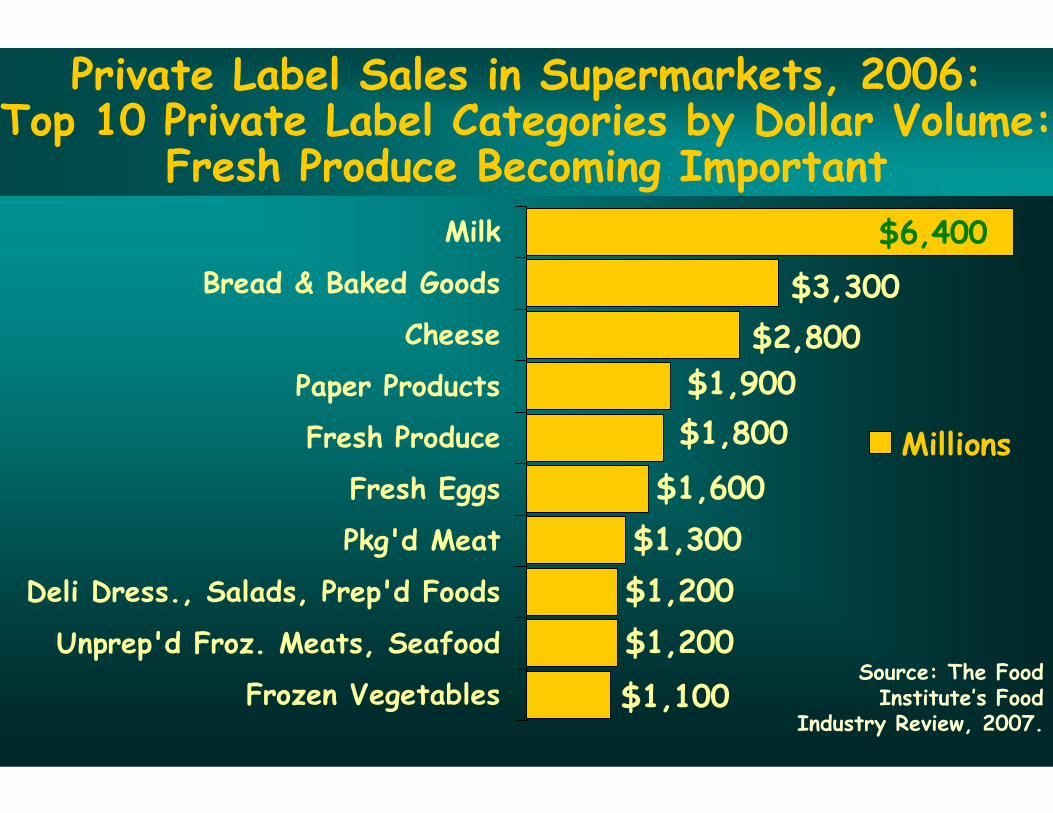
Private Label Sales in Supermarkets, 2006:Top 10 Private Label Categories by Dollar Volume:
Fresh Produce Becoming Important
$1,600$1,300$1,200$1,200
$1,100
$1,800$1,900
$2,800$3,300
$6,400Milk
Bread & Baked Goods
Cheese
Paper Products
Fresh Produce
Fresh Eggs
Pkg'd Meat
Deli Dress., Salads, Prep'd Foods
Unprep'd Froz. Meats, Seafood
Frozen Vegetables
Millions
Source: The Food Institute’s Food
Industry Review, 2007.

Other Food Marketing Channels
Amazon.com starts marketing food, including dried fruits and nuts.
Vending machines, $22.54 billion in 2006 sales, but only $37.9 million was perishables, of all types, and that declined 7% over 2005.
Starbuck’s begins to offer prepared salads and may be adding more fresh produce. Starbucks has 15,000 stores worldwide with $9.4 billion in sales.

Conclusions
The stars are aligned to increase fresh produce sales through most
food marketing channels!!
But…….

Threats and Opportunities
On the one hand, intensified competition among retailers provides opportunities for fresh produce suppliers – since the fresh produce department is a key point of differentiation for retailers.
And other new channels selling fresh produce can create new demand that does not cannibalize retail produce sales.
On the other hand, mega-retailers are likely to exert even more price pressure on suppliers.
Private labels are becoming more important to retailers both as a differentiation tool with innovative rather than just “me-too” products, and as a way to offer value to consumers.
Private labels can represent an opportunity to fresh produce suppliers by generating predictable demand for those items, on the other hand, margins are likely to be thin.

Cost-Price Squeezes are Supply Chain-Wide The growth in new store formats and marketing channels
selling fresh food means more pressure on retail margins.
In addition, food price inflation is increasing.
Whereas in the past, retailers could more readily pass on price increases from suppliers to consumers, the more competitive retail environment constrains retailers.
This likely means more difficulty for fresh produce suppliers/shippers to achieve higher prices as their costs escalate (fertilizer, energy, food safety, labor, etc.).
As costs increase, in this fierce competitive environment, suppliers will need to use information technology/business intelligence to increase efficiency: increasing shipper size.