fresh-cut/value-added produce marketing trends · fresh-cut/value-added produce marketing trends...
TRANSCRIPT

Fresh-Cut/Value-added Produce Marketing Trends
DR. ROBERTA COOK Dept. of Ag and Resource Economics
Cooperative Extension Specialist, Emerita University of California, Davis
September 15, 2016
for
UC Davis Fresh-Cut Products Workshop: Maintaining Quality and Safety
Agenda
• Some important food marketing trends
• Consumer choice exploding
• Overview of value-added/fresh-cut produce market (VAP)
• Leafy greens and bag salads • Value-added fruit (VAF)
• Value-added vegetables (VAV)
• Organics and local
• Conclusions

The economic downturn accelerated pace of change in the food marketing system
• More than originating new trends, it intensified pre-existing forces, such as channel blurring. • Margin pressure at all levels of the food system! • Many produce suppliers facing lower profits.
• Growing food safety, traceability and sustainability expectations all increase costs.
• Need for major investments in info tech systems. • Foodservice took a huge hit, hurting fresh-cut. • Mergers are up (retailers, foodservice, shippers).
+1%
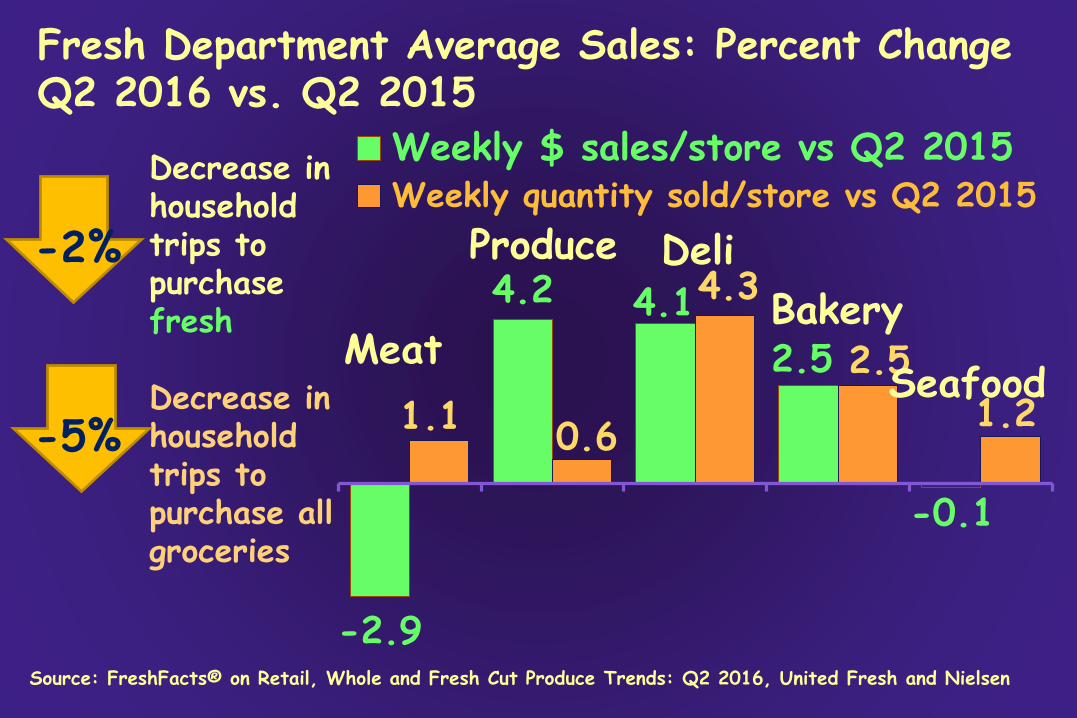
Fresh Department Average Sales: Percent Change Q2 2016 vs. Q2 2015
-2%
Decrease in household trips to purchase fresh
Decrease in household trips to purchase all groceries
Weekly $ sales/store vs Q2 2015 Weekly quantity sold/store vs Q2 2015
Produce Deli 4.2 4.34.1
-2.9
2.5
-0.1
1.1 0.6
2.5
1.2 Seafood
Meat Bakery
-5%
Source: FreshFacts® on Retail, Whole and Fresh Cut Produce Trends: Q2 2016, United Fresh and Nielsen

Shifting Grocery Formats: Growth in nontraditional channels has transformed the US grocery industry
Super
center
46%
Wholesale Club
23%
Drug
13%
Mass
11% $Store
7% Military
1%
2%
Traditional Convenience Nontrad.
Dollar Share by Channel
90%
8% 34%
16%
50%
37%
15%
48%
39%
15%
46% Dollar Share of Food Sales in Nontraditional Formats
1988 2006 2009 2015 Sources: Willard Bishop, various The Future of Food
Traditional=conventional supermarket, fresh format, ltd Retailing reports assortment, super warehouse, other
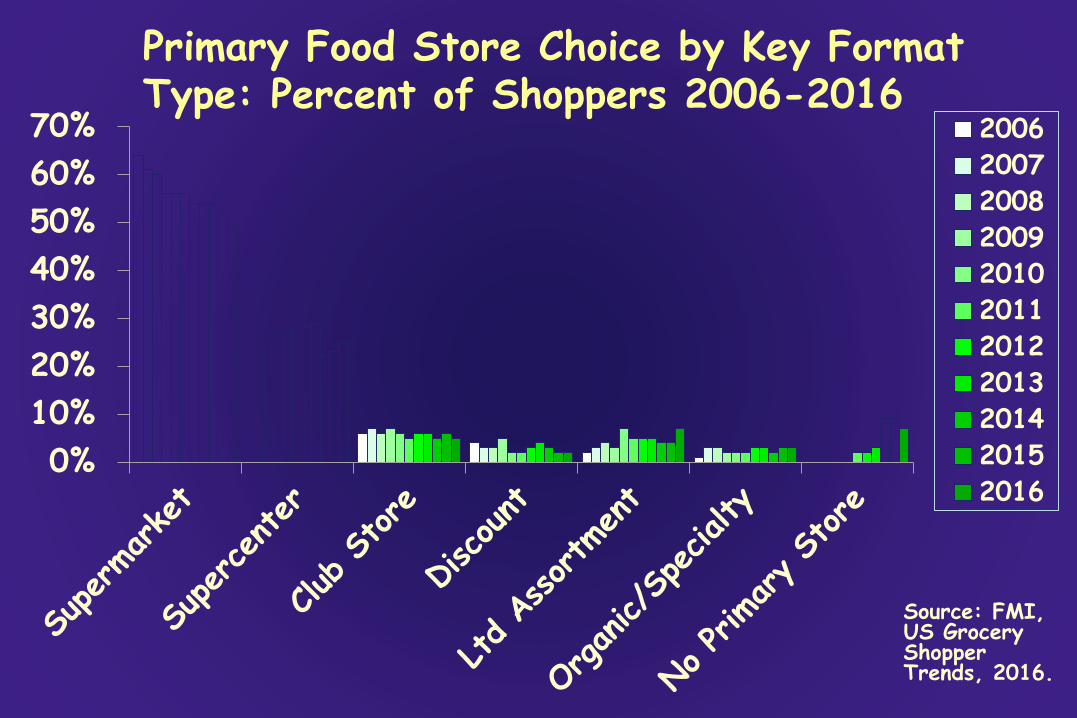
Primary Food Store Choice by Key Format Type: Percent of Shoppers 2006-2016
70% 2006 2007 60% 2008
50% 2009 40% 2010
2011 30% 2012
20% 2013
10% 2014 2015 0% 2016
Source: FMI, US Grocery Shopper Trends, 2016.
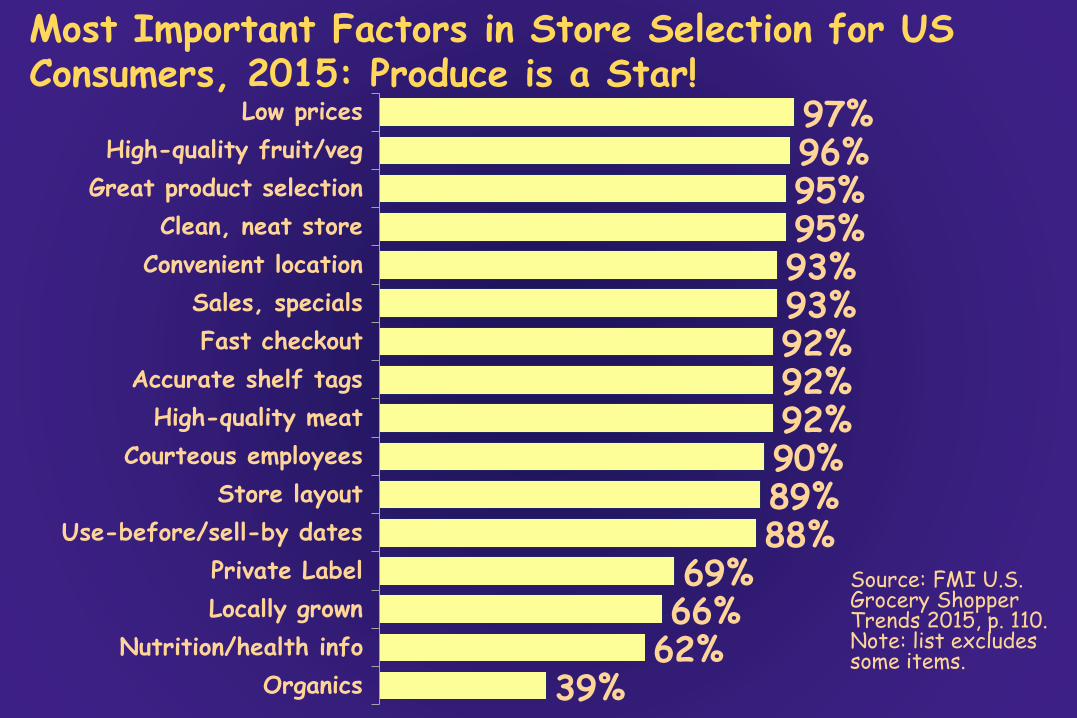
Most Important Factors in Store Selection for US Consumers, 2015: Produce is a Star!
97% 96% 95% 95% 93% 93% 92% 92% 92% 90% 89% 88%
69% 66%
62% 39%
Low prices
High-quality fruit/veg
Great product selection
Clean, neat store
Convenient location
Sales, specials
Fast checkout
Accurate shelf tags
High-quality meat
Courteous employees
Store layout
Use-before/sell-by dates
Private Label
Locally grown
Nutrition/health info
Organics
Source: FMI U.S. Grocery Shopper Trends 2015, p. 110. Note: list excludes some items.

Primary Grocery and Produce Channel Choices
Supermarket
Supercenter
Warehouse Club
Natural, Organic Specialty
Farmers Mkt, Farm Direct
Online
Source: Food Marketing Institute, The Power of Other Produce, 2016.
61% 63%
26% 16%
5% Groceries 3%
Produce 7% 9%
0% Note: 24% of US 8.0% grocery shoppers switch
0.5% their primary store destinations when 0.8% purchasing produce.
0.5% 0.5%

Switching Behavior among Supercenter Shoppers
36% of supercenter primary grocery shoppers switch stores to buy produce.
• 74% switch to supermarkets
• 13% switch to farmers’ markets, farm-direct, produce stands
• 10% switch to organic/specialty stores
They switch because the other channel has…
• Better freshness/quality (54%)
• Better variety (39%) Source: Food Marketing
• Better advertised specials (31%) Institute, The Power of Produce, 2016.
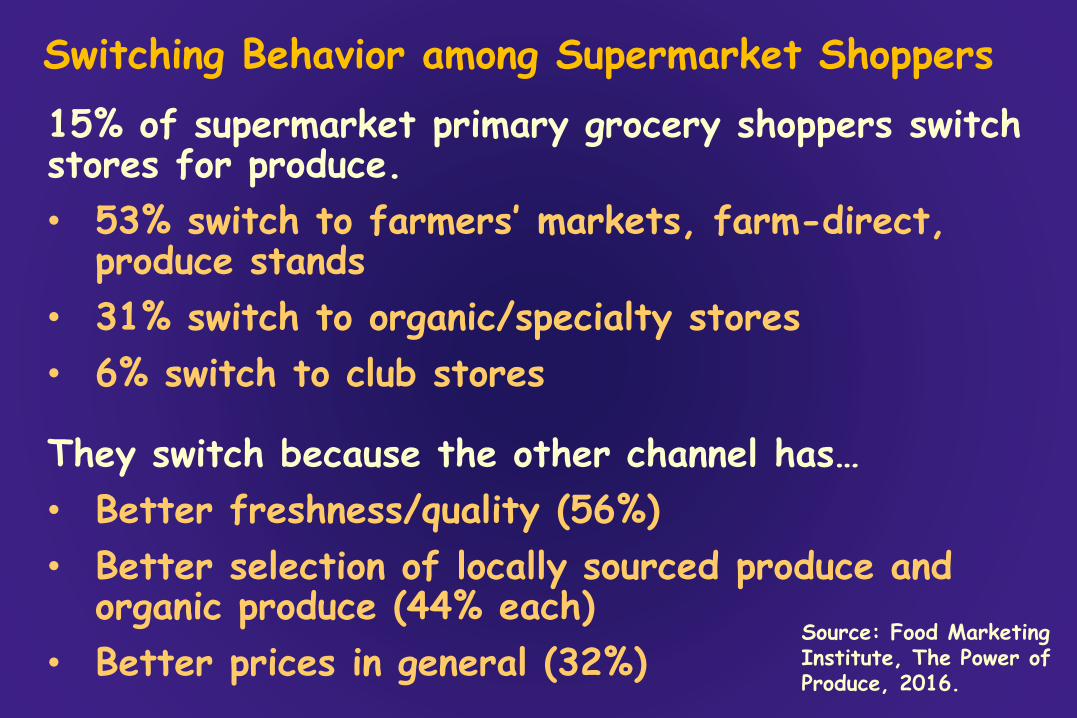
Switching Behavior among Supermarket Shoppers
15% of supermarket primary grocery shoppers switch stores for produce.
• 53% switch to farmers’ markets, farm-direct, produce stands
• 31% switch to organic/specialty stores
• 6% switch to club stores
They switch because the other channel has…
• Better freshness/quality (56%)
• Better selection of locally sourced produce and organic produce (44% each)
Source: Food Marketing Institute, The Power of • Better prices in general (32%) Produce, 2016.
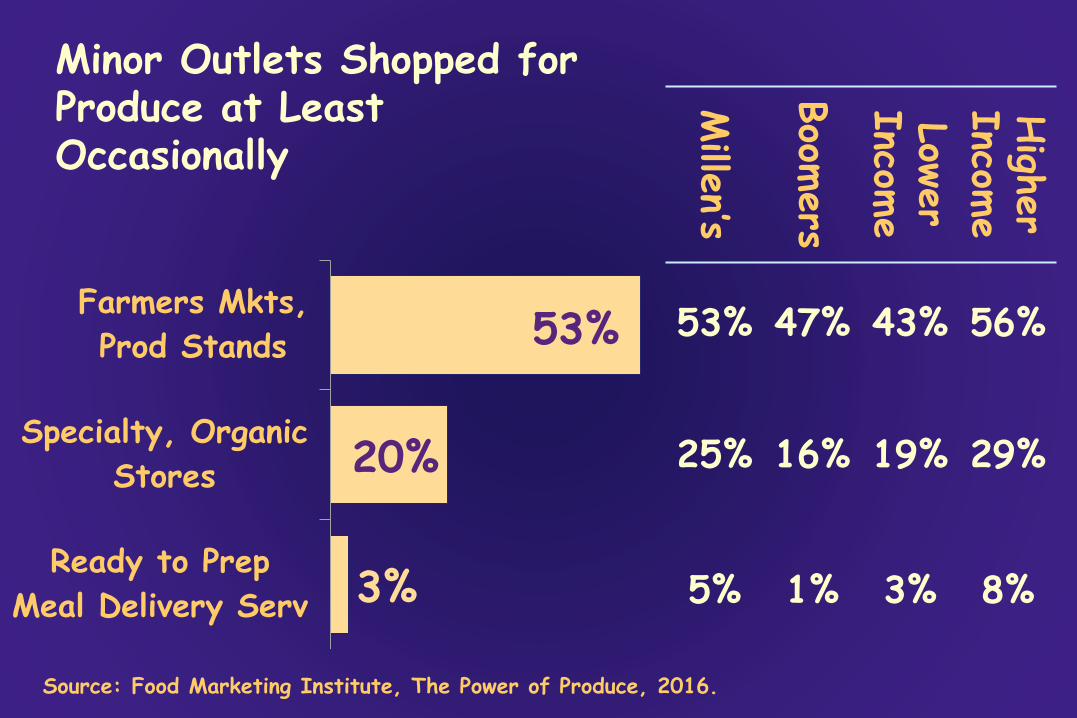
Minor Outlets Shopped for Produce at Least Occasionally
Farmers Mkts, 53%
20%
3%
53% 47% 43% 56% Prod Stands
Specialty, Organic 25% 16% 19% 29%
Stores
Ready to Prep 5% 1% 3% 8%Meal Delivery Serv
High
er
Incom
e Low
er
Incom
e
Boom
ers
Mille
n’s
Source: Food Marketing Institute, The Power of Produce, 2016.

Forecast of Compound Annual Sales Growth Rate vs. Inflation for US Grocery Formats, 2016-2020
Source: The Future of Food Retailing, Willard Bishop, June 2016 -1.4%
0.4% 0.4% 0.9% 1.4% 1.9% 2.6% 2.9% 3.0% 3.3%
4.8% 7.0%
8.6% 23.1%
Mass
Tradl Supermkt
Drug
Military
Conv. w/gas
Conv. wo/gas
Other Sm Groc
Supercenter
Club
Super Whse
Dollar
Ltd Assortm.
Fresh Format
E-Commerce
Food Inflation Compound Annual Rate: 1.5%

200
US Shoppers’ Average Number of Trips/Year by Store Format and Age Group, 2015
Supermrkt Dollar C-store Drug Mass Superctr Club Total
10 13 15 158 11 14 1410 12 13 15
39 48 58 63
10 11 11 10 21 23 25 24
8 12 13 12
106 130 149 153
0
100
Millenial Gen X Baby Greatest
Boomer Generat'n
Source: Nielsen in The Food Institute Report, January 11, 2016.
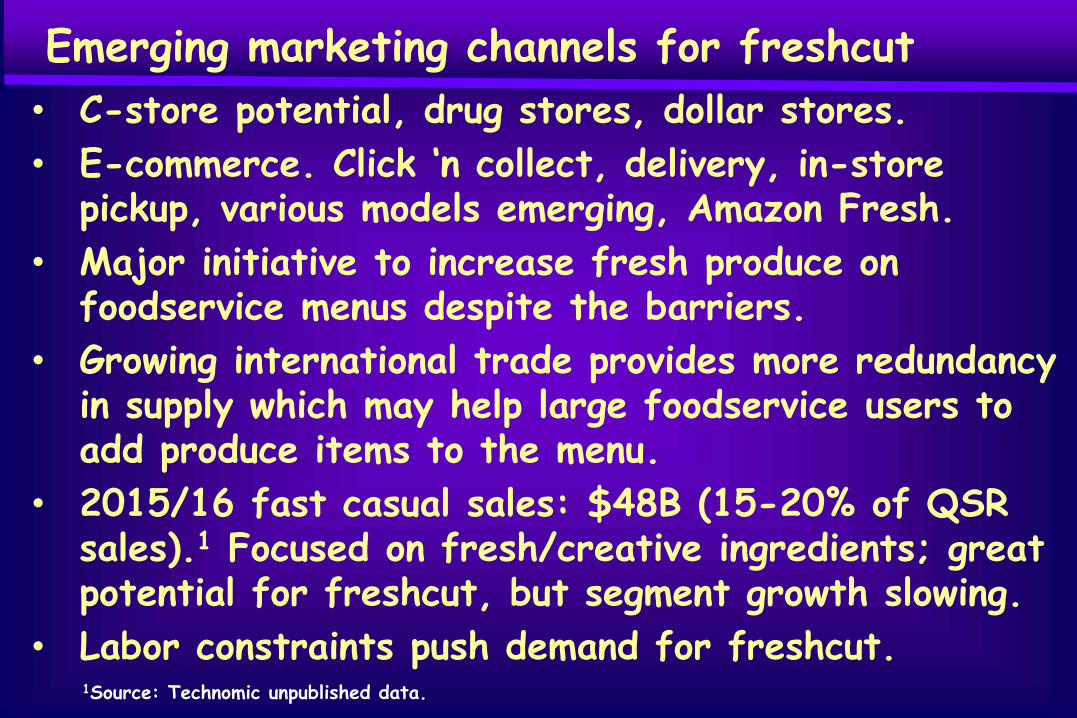
Emerging marketing channels for freshcut
• C-store potential, drug stores, dollar stores.
• E-commerce. Click ‘n collect, delivery, in-store pickup, various models emerging, Amazon Fresh.
• Major initiative to increase fresh produce on foodservice menus despite the barriers.
• Growing international trade provides more redundancy in supply which may help large foodservice users to add produce items to the menu.
• 2015/16 fast casual sales: $48B (15-20% of QSR sales).1 Focused on fresh/creative ingredients; great potential for freshcut, but segment growth slowing.
• Labor constraints push demand for freshcut. 1Source: Technomic unpublished data.
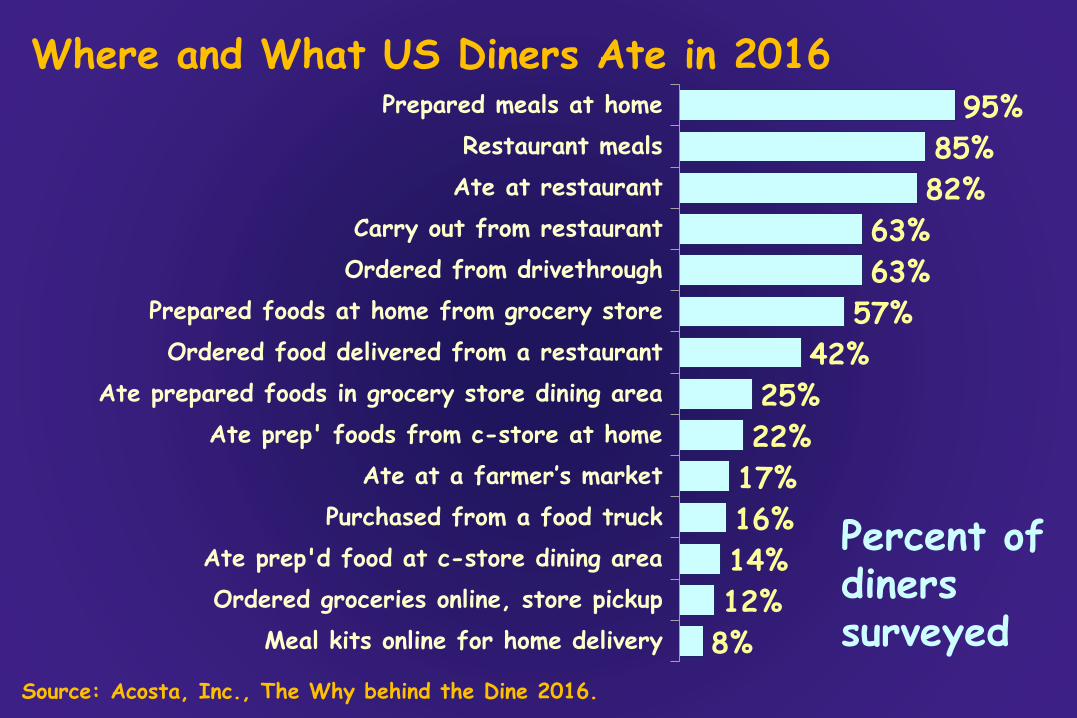
Where and What US Diners Ate in 2016 Prepared meals at home 95%
Restaurant meals 85% Ate at restaurant 82%
Carry out from restaurant 63% Ordered from drivethrough 63%
Prepared foods at home from grocery store 57% Ordered food delivered from a restaurant 42%
Ate prepared foods in grocery store dining area 25% Ate prep' foods from c-store at home 22%
Ate at a farmer’s market 17% Purchased from a food truck 16%
Ate prep'd food at c-store dining area 14% Ordered groceries online, store pickup 12%
Meal kits online for home delivery 8%
Percent of diners surveyed
Source: Acosta, Inc., The Why behind the Dine 2016.
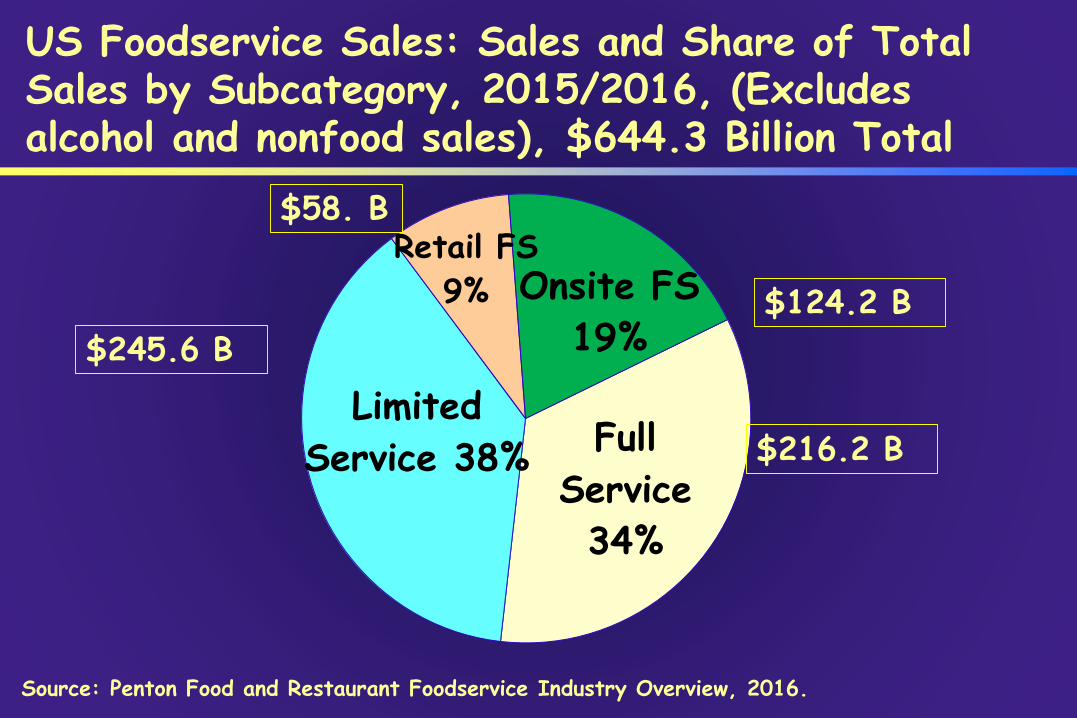
US Foodservice Sales: Sales and Share of Total Sales by Subcategory, 2015/2016, (Excludes alcohol and nonfood sales), $644.3 Billion Total
Full
Service
34%
Limited
Service 38%
Retail FS
9% Onsite FS
19%
$216.2 B
$124.2 B
$58. B
$245.6 B
Source: Penton Food and Restaurant Foodservice Industry Overview, 2016.
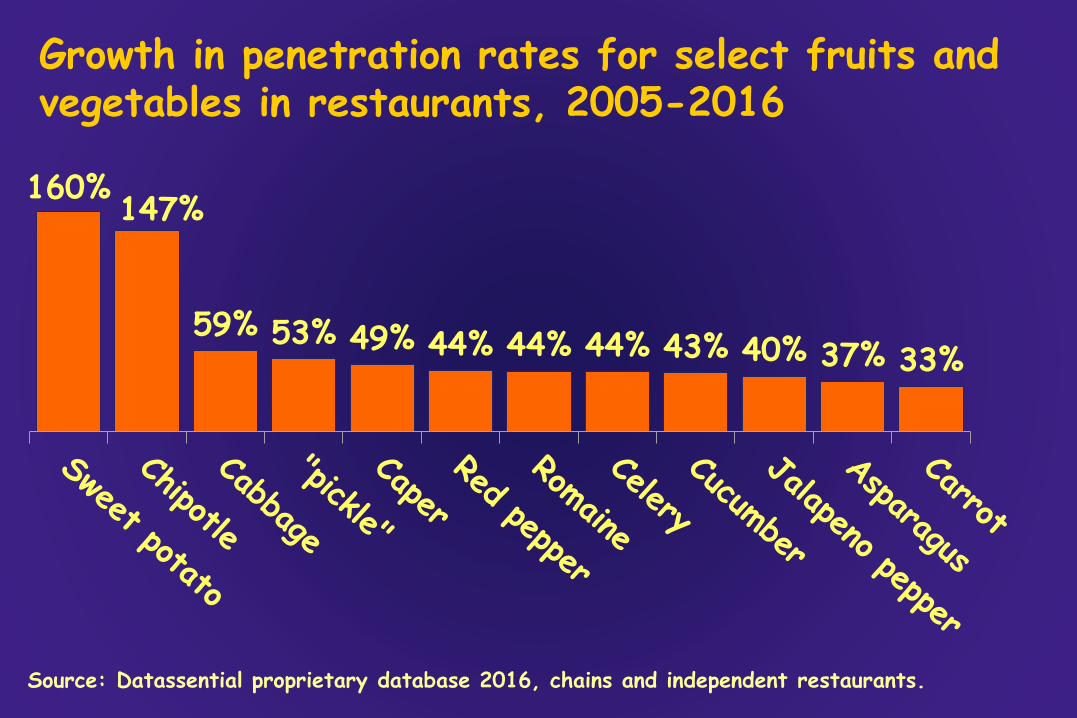
Growth in penetration rates for select fruits and vegetables in restaurants, 2005-2016
160% 147%
59% 53% 49% 44% 44% 44% 43% 40% 37% 33%
Source: Datassential proprietary database 2016, chains and independent restaurants.

Growth in penetration rates for select fruits and vegetables in restaurants, 2005-2016
32% 31% 26% 24%
20% 18% 14% 14% 14% 14% 13% 12%
Source: Datassential proprietary database 2016, chains and independent restaurants.
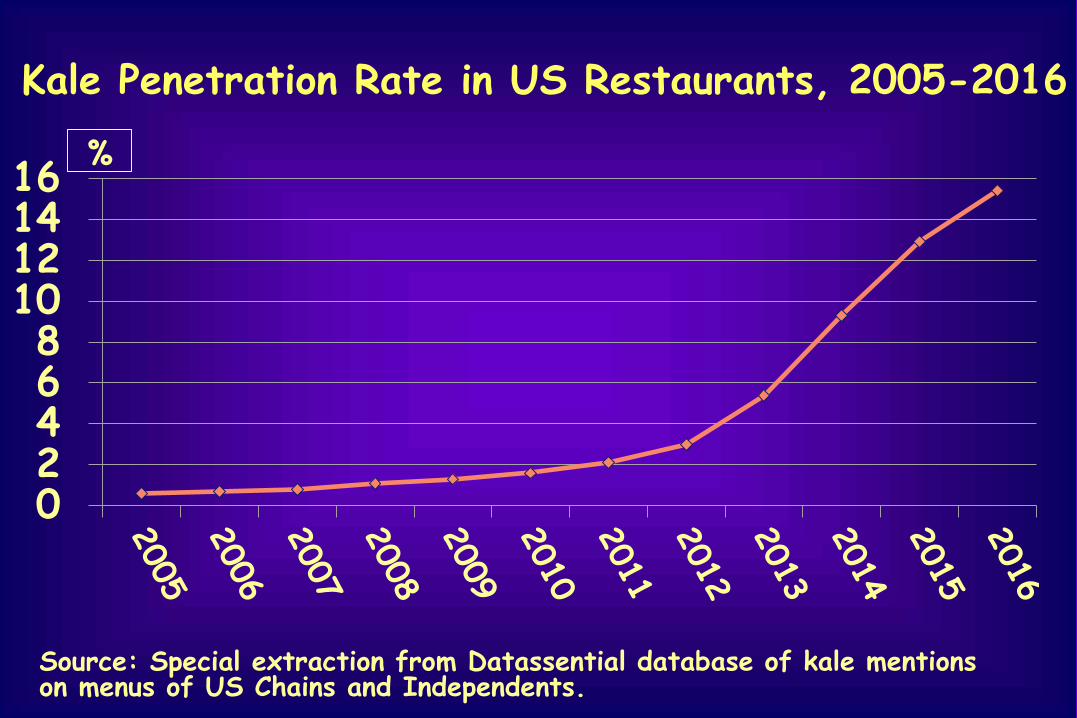
Kale Penetration Rate in US Restaurants, 2005-2016
0 2 4 6 8
10 12 14 16
%
Source: Special extraction from Datassential database of kale mentions on menus of US Chains and Independents.
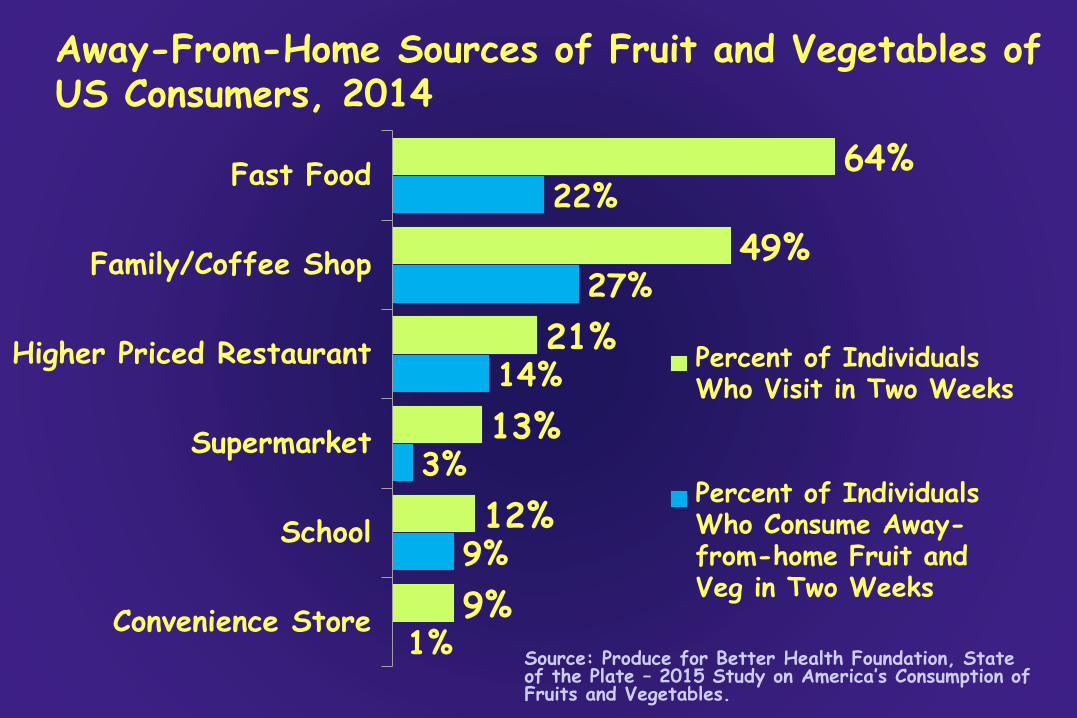
Away-From-Home Sources of Fruit and Vegetables of US Consumers, 2014
Fast Food
Family/Coffee Shop
Higher Priced Restaurant
Supermarket
School
Convenience Store
64%
49%
21%
13%
12%
9%
22%
27%
14%
3%
9%
1%
Percent of Individuals Who Visit in Two Weeks
Percent of Individuals Who Consume Away-from-home Fruit and Veg in Two Weeks
Source: Produce for Better Health Foundation, State of the Plate – 2015 Study on America’s Consumption of Fruits and Vegetables.
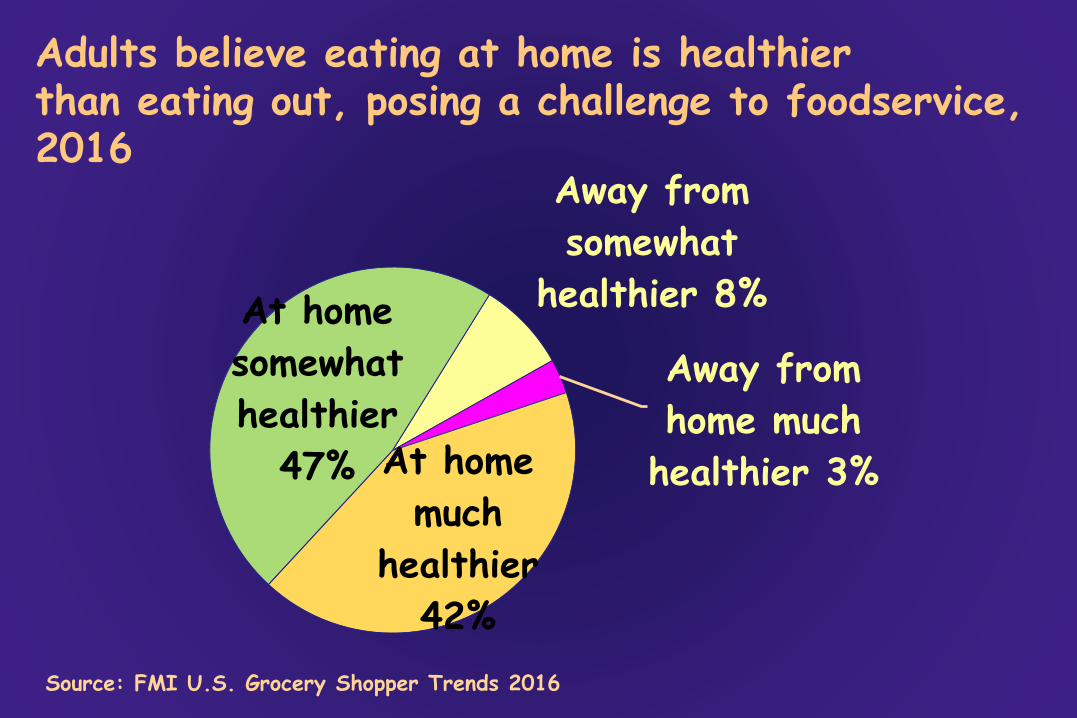
Adults believe eating at home is healthier than eating out, posing a challenge to foodservice, 2016
Away from somewhat
healthier 8%
At home
much
healthier
42%
At home
somewhat
healthier
47%
Away from home much
healthier 3%
Source: FMI U.S. Grocery Shopper Trends 2016
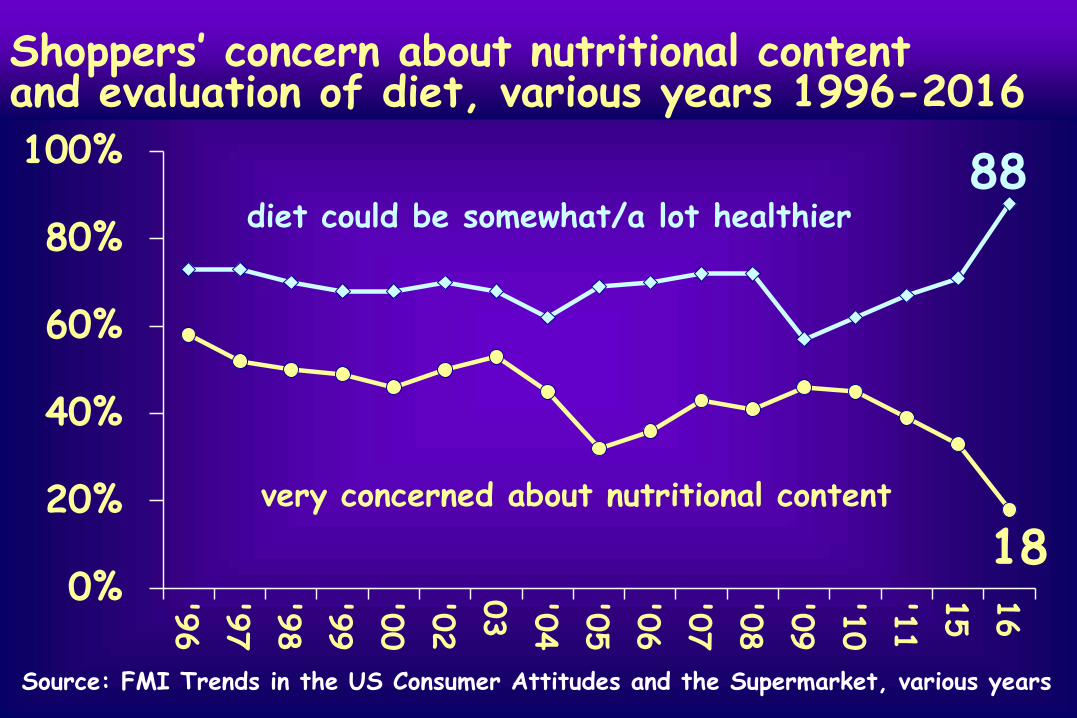
Shoppers’ concern about nutritional content and evaluation of diet, various years 1996-2016
0%
20%
40%
60%
80%
100%
18
88
very concerned about nutritional content
diet could be somewhat/a lot healthier
16
15
'11
'10
'09
'08
'07
'06
'05
'04
03
'02
'00
'99
'98
'97
'96
Source: FMI Trends in the US Consumer Attitudes and the Supermarket, various years

Changing Consumers: Choice and Substitution Abounds!

Underlying Themes
• How can fresh produce capture a bigger share of “better for you” food products?
• From traditional to modern eating culture.
• Role of food “sophisticates.” (Hartman term.) • Trading up prevalent but consumer price
consciousness as high as ever. Cannibalization.
• Growing demand for: convenience, transparency, bold often international flavors, high protein, health and wellness, products with stories.
• Consumer expectation of mass customization.
Responding to Consumer Preferences: Convenience,Nutrition/Wellness, andPersonalization
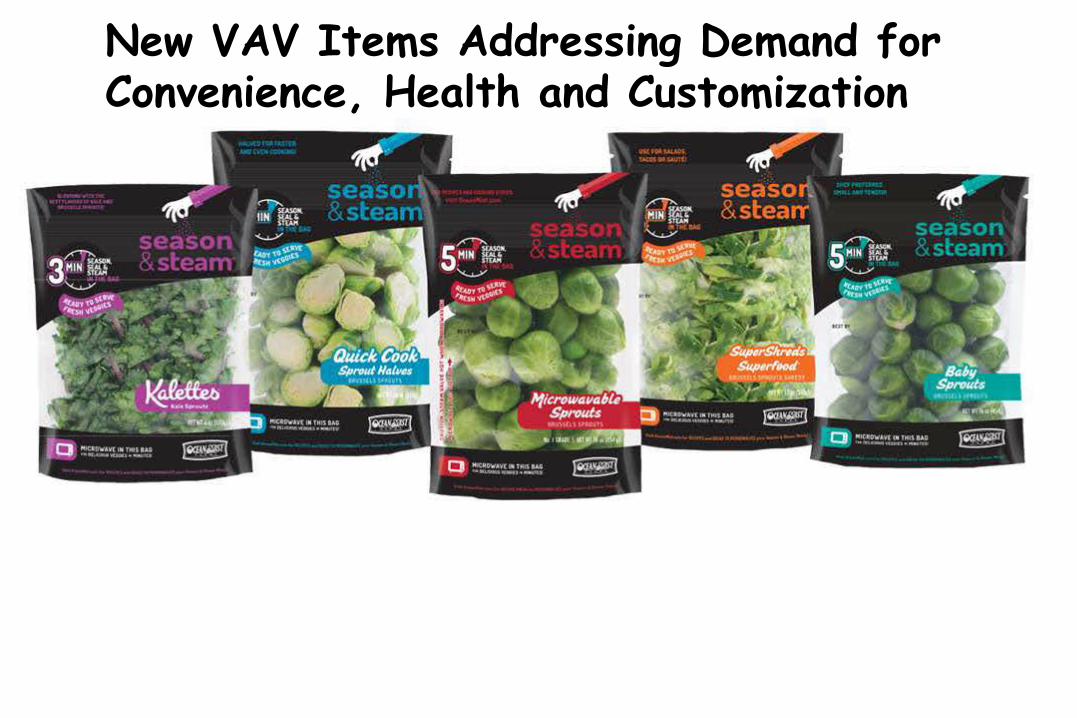
New VAV Items Addressing Demand for Convenience, Health and Customization

Innovations in Breeding: Responding to Consumer Preferences for New, High Flavor, Convenient, and Healthful Produce
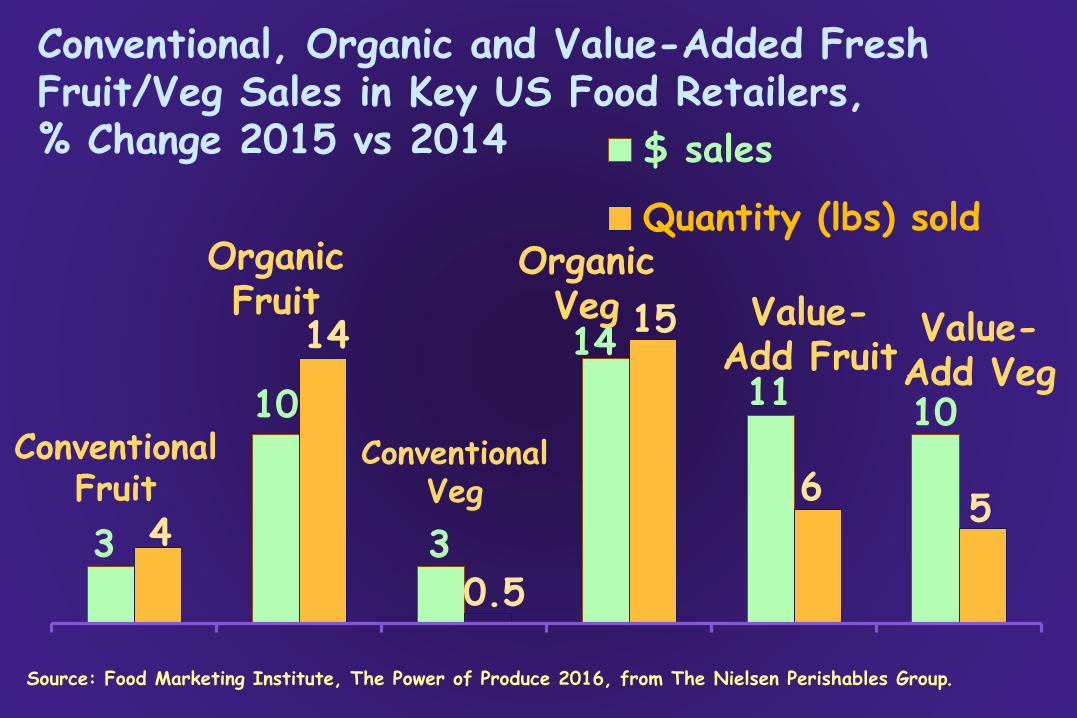
Conventional, Organic and Value-Added Fresh Fruit/Veg Sales in Key US Food Retailers, % Change 2015 vs 2014 $ sales
Quantity (lbs) sold Organic Organic Fruit Veg Value15 Value
3
10
3
14
11 10
4
14
0.5
6 5
Conventional Fruit
Add Fruit
Conventional Veg
Add Veg
Source: Food Marketing Institute, The Power of Produce 2016, from The Nielsen Perishables Group.
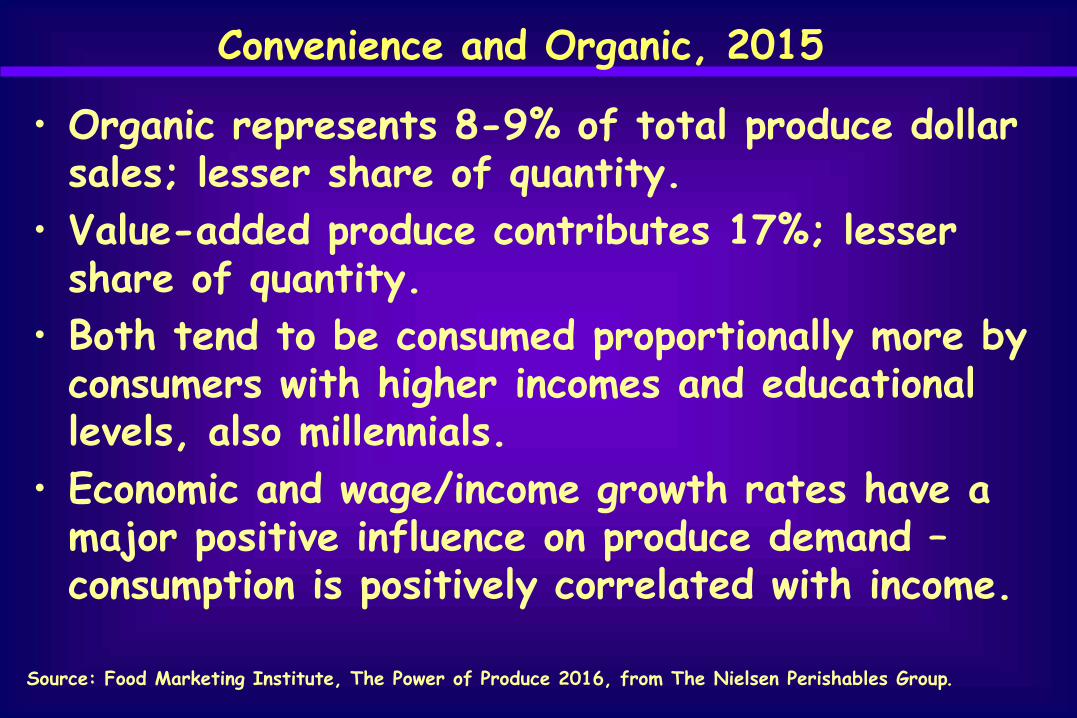
Convenience and Organic, 2015
• Organic represents 8-9% of total produce dollar sales; lesser share of quantity.
• Value-added produce contributes 17%; lesser share of quantity.
• Both tend to be consumed proportionally more by consumers with higher incomes and educational levels, also millennials.
• Economic and wage/income growth rates have a major positive influence on produce demand – consumption is positively correlated with income.
Source: Food Marketing Institute, The Power of Produce 2016, from The Nielsen Perishables Group.
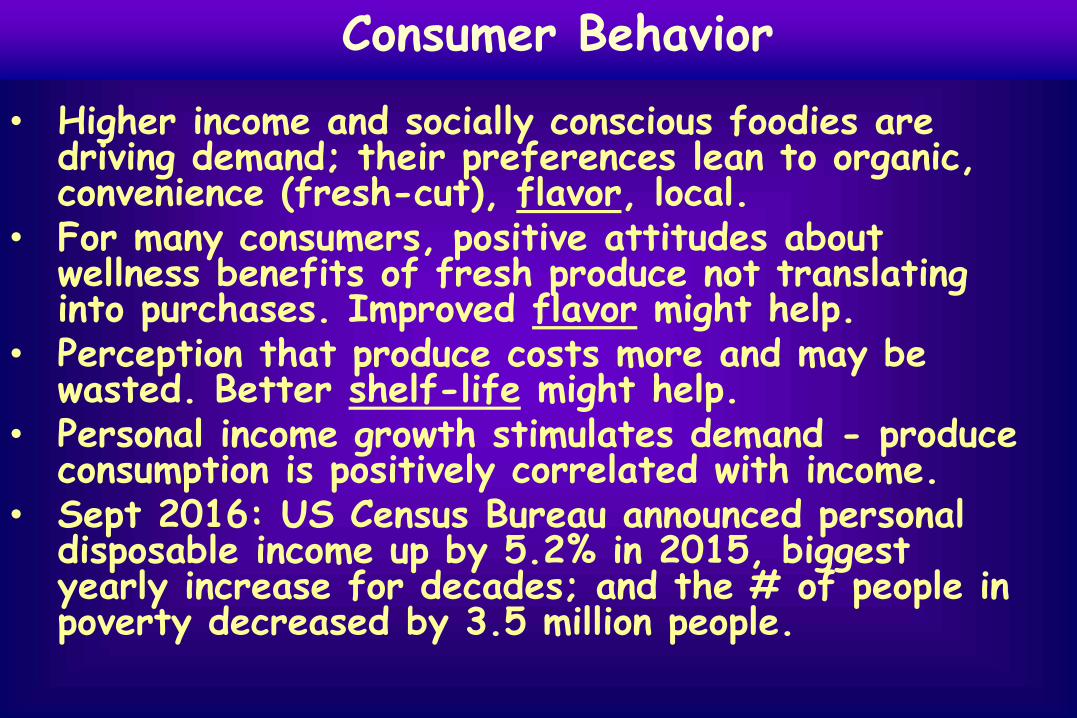
Consumer Behavior
• Higher income and socially conscious foodies are driving demand; their preferences lean to organic, convenience (fresh-cut), flavor, local.
• For many consumers, positive attitudes about wellness benefits of fresh produce not translating into purchases. Improved flavor might help.
• Perception that produce costs more and may be wasted. Better shelf-life might help.
• Personal income growth stimulates demand - produce consumption is positively correlated with income.
• Sept 2016: US Census Bureau announced personal disposable income up by 5.2% in 2015, biggest yearly increase for decades; and the # of people in poverty decreased by 3.5 million people.
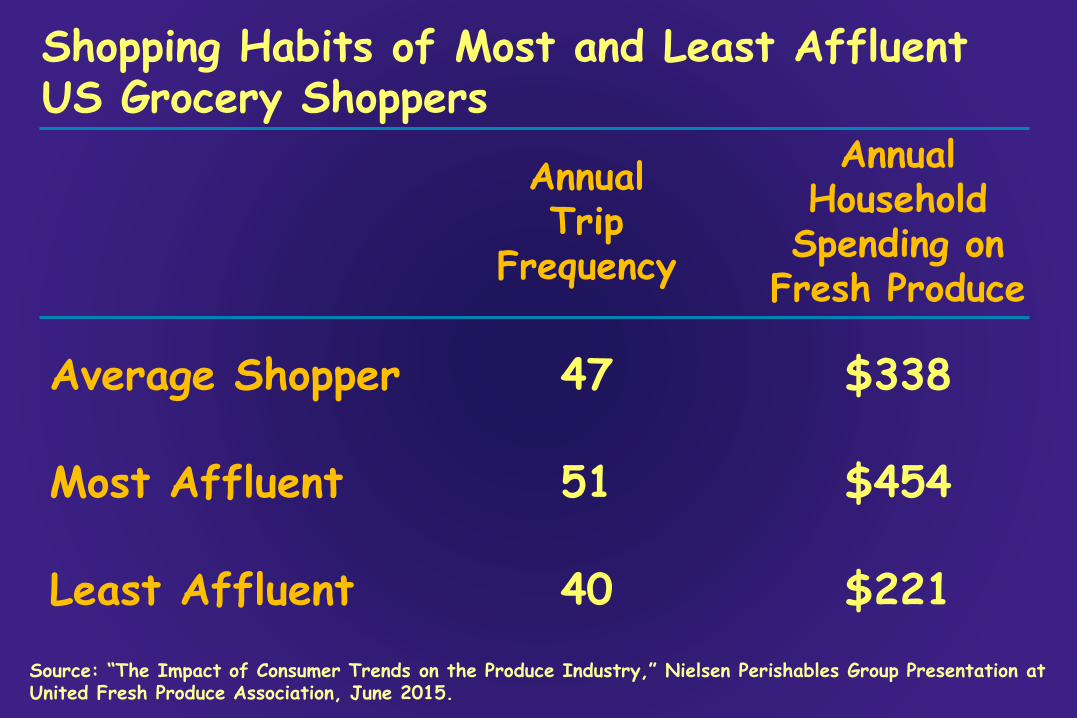
Shopping Habits of Most and Least Affluent US Grocery Shoppers
Annual Annual
HouseholdTrip
Spending on Frequency
Fresh Produce
Average Shopper 47 $338
Most Affluent 51 $454
Least Affluent 40 $221
Source: “The Impact of Consumer Trends on the Produce Industry,” Nielsen Perishables Group Presentation at United Fresh Produce Association, June 2015.
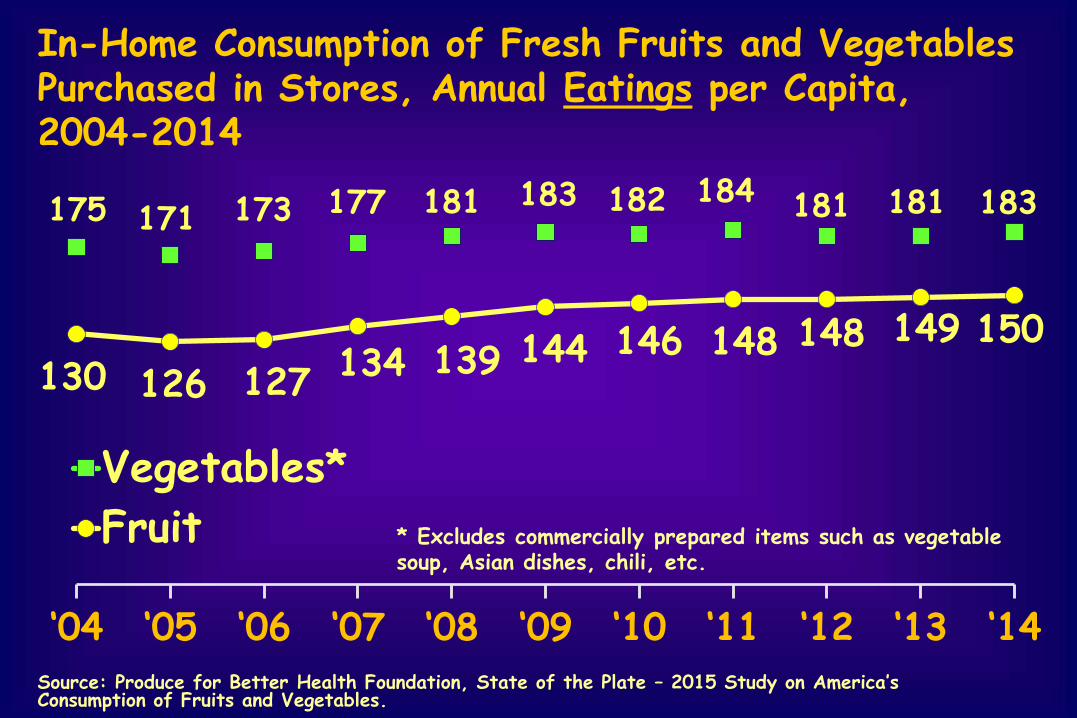
In-Home Consumption of Fresh Fruits and Vegetables Purchased in Stores, Annual Eatings per Capita, 2004-2014
183 184177 181 182 181 183175 173 181171
134 139 144 146 148 148 149 150 130 126 127
Vegetables*
Fruit * Excludes commercially prepared items such as vegetable soup, Asian dishes, chili, etc.
‘04 ‘05 ‘06 ‘07 ‘08 ‘09 ‘10 ‘11 ‘12 ‘13 ‘14Source: Produce for Better Health Foundation, State of the Plate – 2015 Study on America’s Consumption of Fruits and Vegetables.
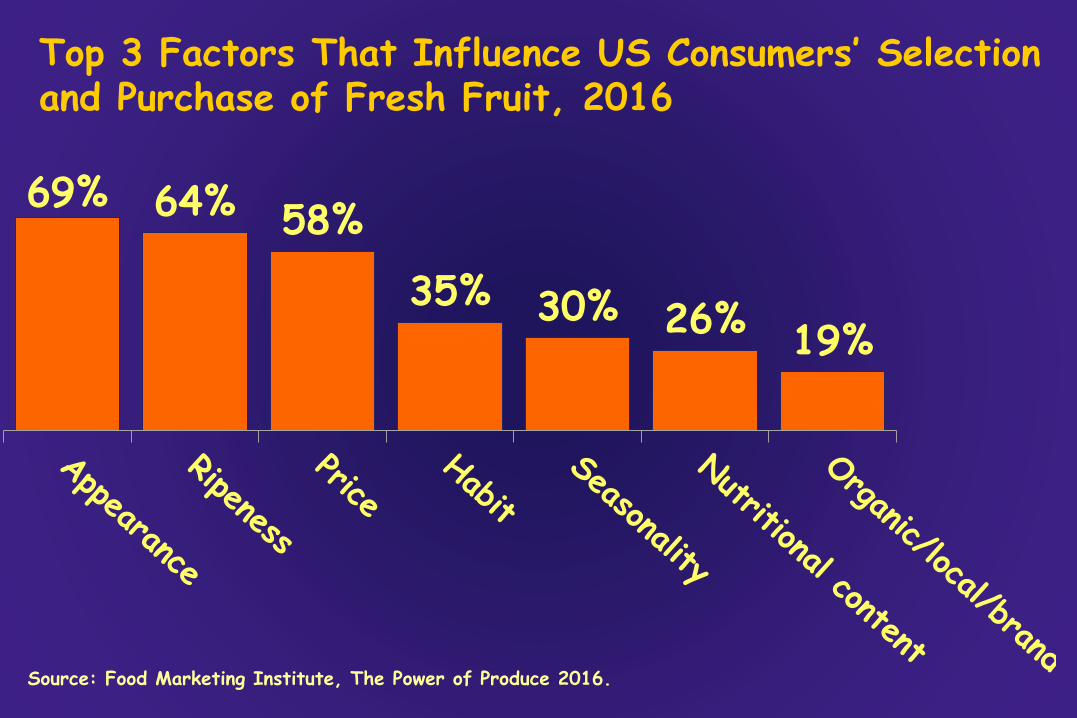
Top 3 Factors That Influence US Consumers’ Selection and Purchase of Fresh Fruit, 2016
69% 64% 58%
35% 30% 26% 19%
Source: Food Marketing Institute, The Power of Produce 2016.
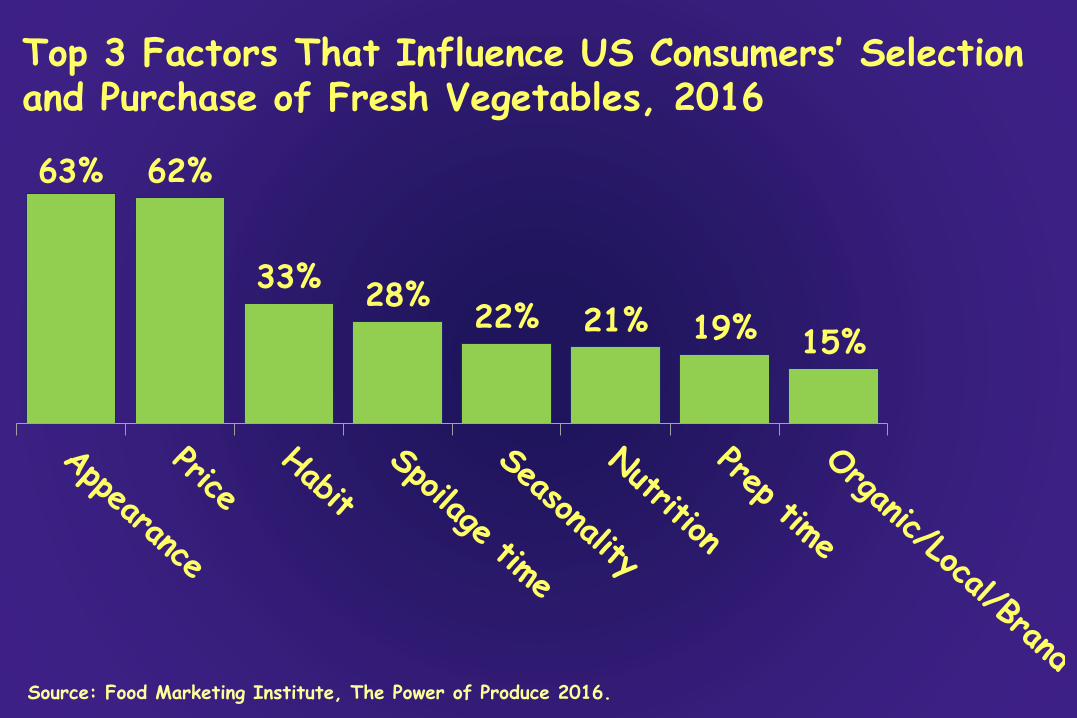
Top 3 Factors That Influence US Consumers’ Selection and Purchase of Fresh Vegetables, 2016
63% 62%
33% 28%
22% 21% 19% 15%
Source: Food Marketing Institute, The Power of Produce 2016.
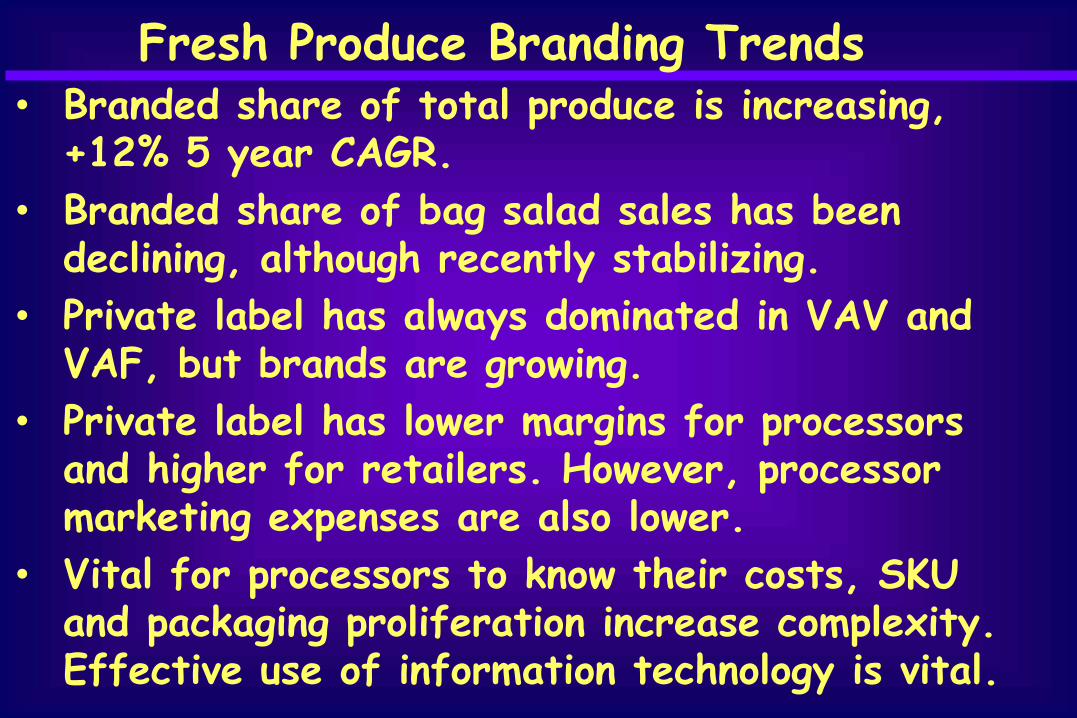
Fresh Produce Branding Trends • Branded share of total produce is increasing,
+12% 5 year CAGR.
• Branded share of bag salad sales has been declining, although recently stabilizing.
• Private label has always dominated in VAV and VAF, but brands are growing.
• Private label has lower margins for processors and higher for retailers. However, processor marketing expenses are also lower.
• Vital for processors to know their costs, SKU and packaging proliferation increase complexity. Effective use of information technology is vital.

Share of Branded vs Unbranded Fresh Produce Sales in US Retailers, 2010 vs. 2014
Branded Unbranded Private Label 100%
90%
80%
70%
60%
50%
40%
30%
20%
10%
0%
9% 11%
64% 55%
34%27%
2010 2014 Source: Fresh Facts on Retail Q3 2015, United Fresh and Nielsen

Importance of Produce Brands to US
Source: Identifying Consumer Trends in the Produce Category, PMA/Hartman, 2011.
Consumers, (both value-added and bulk produce)
Important
27%
Neutral
36%
Not
Important
37%
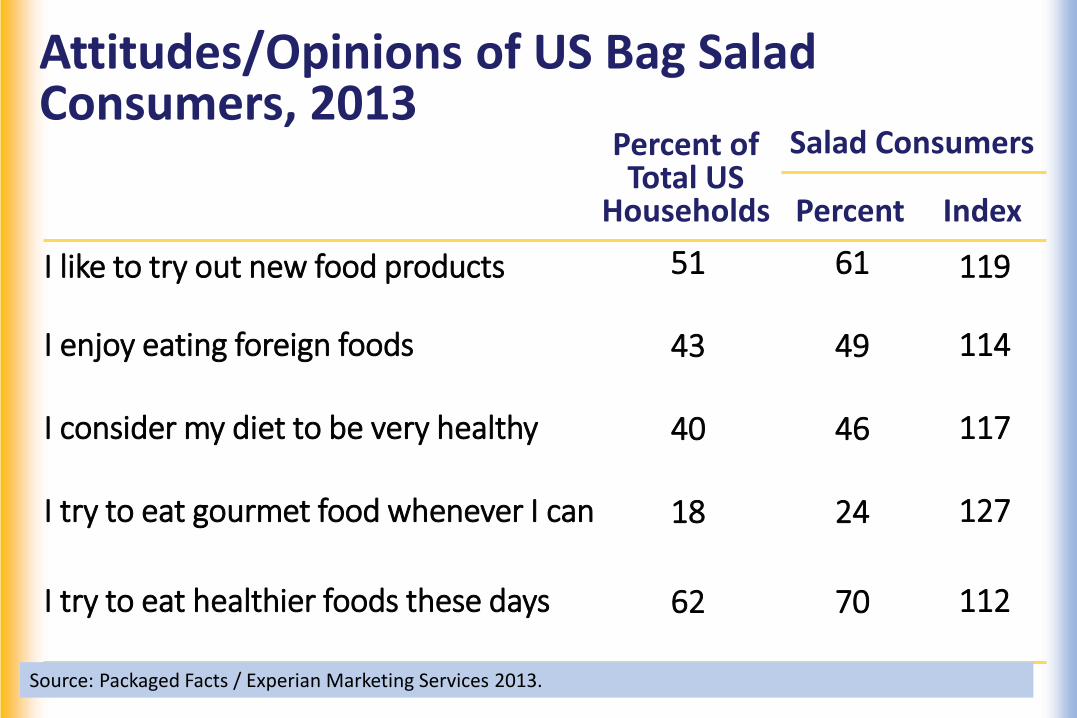
Attitudes/Opinions of US Bag Salad Consumers, 2013
Percent of Total US
Households
Salad Consumers
Percent Index
I like to try out new food products 51 61 119
I enjoy eating foreign foods 43 49 114
I consider my diet to be very healthy 40 46 117
I try to eat gourmet food whenever I can 18 24 127
I try to eat healthier foods these days 62 70 112
Source: Packaged Facts / Experian Marketing Services 2013.

Value-added/Fresh-cut Produce (VAP) Trends

VAP Trends Overview • In general, more consumers are seeking
not only convenience but bolder flavors, unusual ingredients, often international flavors, plus health and wellness, including high protein foods.
• The VAP industry is responding with more meal solutions, including RTE and RTH. Microwavable cooking veg category growing rapidly, as well as salad kits.
• VAP represents about 17% of total produce dept sales. (FMI Power of Produce 2016.)
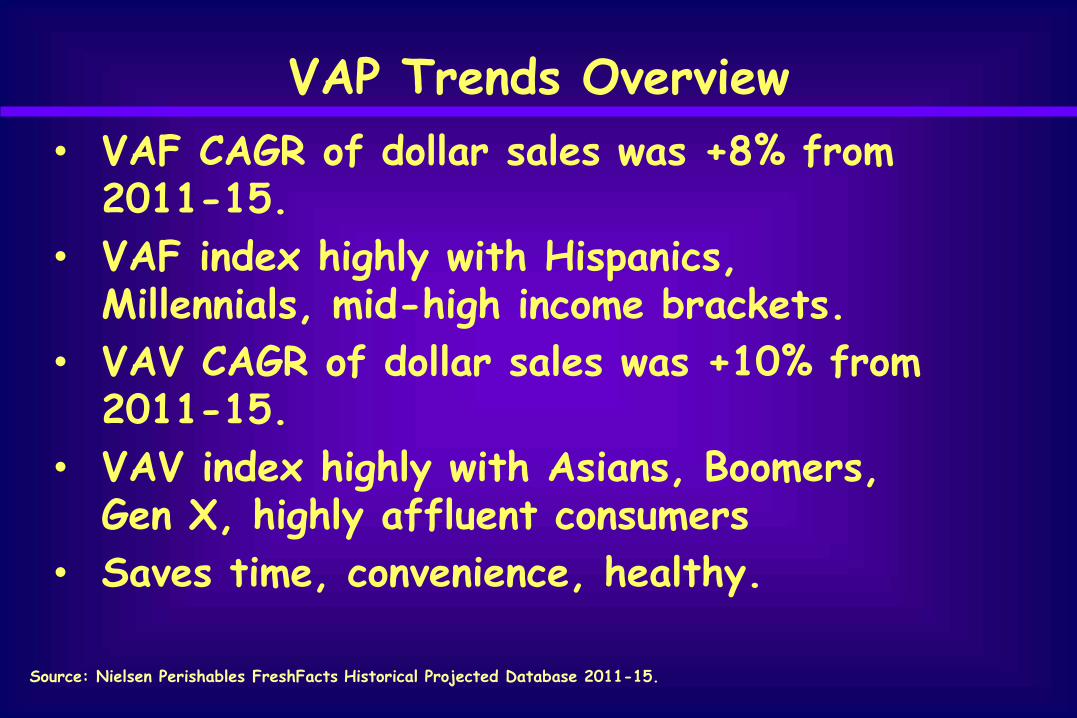
VAP Trends Overview • VAF CAGR of dollar sales was +8% from
2011-15.
• VAF index highly with Hispanics, Millennials, mid-high income brackets.
• VAV CAGR of dollar sales was +10% from 2011-15.
• VAV index highly with Asians, Boomers, Gen X, highly affluent consumers
• Saves time, convenience, healthy.
Source: Nielsen Perishables FreshFacts Historical Projected Database 2011-15.

Penetration Rates: % of US Households Buying Fresh Fruit at Retail, by Category, 2015, (Scanner data so actual purchases)
Bananas
Citrus
Apples Berries Grapes Melons
Stone Fruits
Avocados
Cherries
Value-add fruit
49%
36%
35%
86%
80%
79%
79%
70%
58%
51%
Source: FreshFacts® on Retail, Whole and Fresh Cut Produce Trends: 2015, United Fresh Produce Association and Nielsen, March 2016.
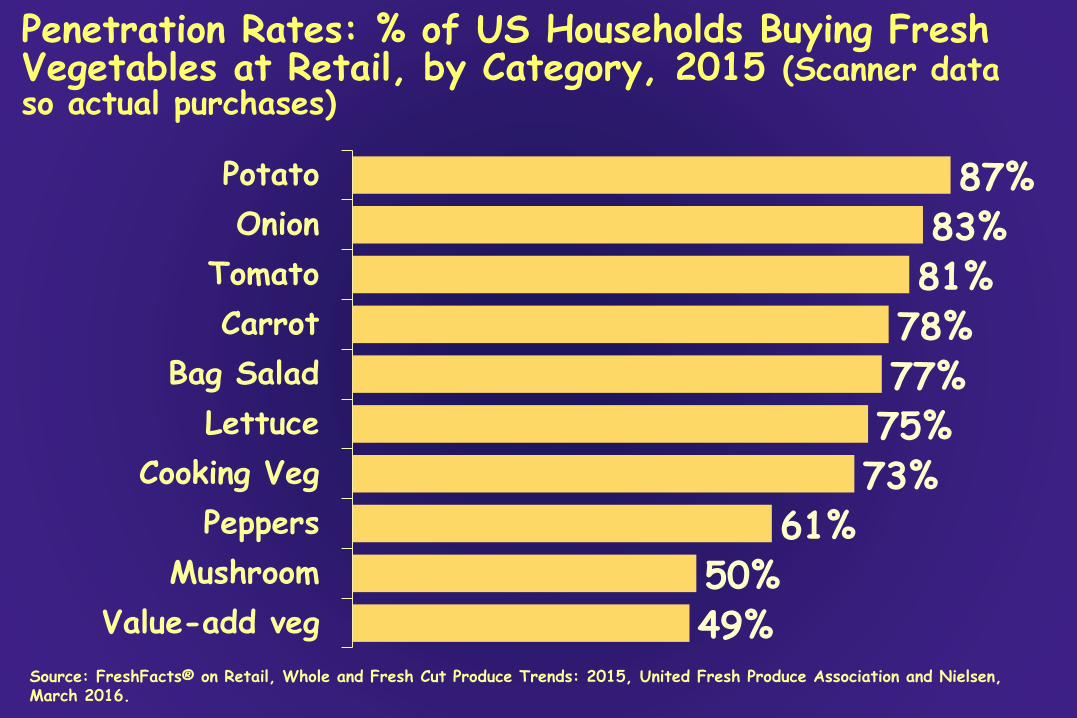
Penetration Rates: % of US Households Buying Fresh Vegetables at Retail, by Category, 2015 (Scanner data so actual purchases)
Potato
Onion
Tomato
Carrot
Bag Salad
Lettuce
Cooking Veg
Peppers
Mushroom
Value-add veg
61% 50% 49%
75% 73%
87% 83% 81%
78% 77%
Source: FreshFacts® on Retail, Whole and Fresh Cut Produce Trends: 2015, United Fresh Produce Association and Nielsen, March 2016.
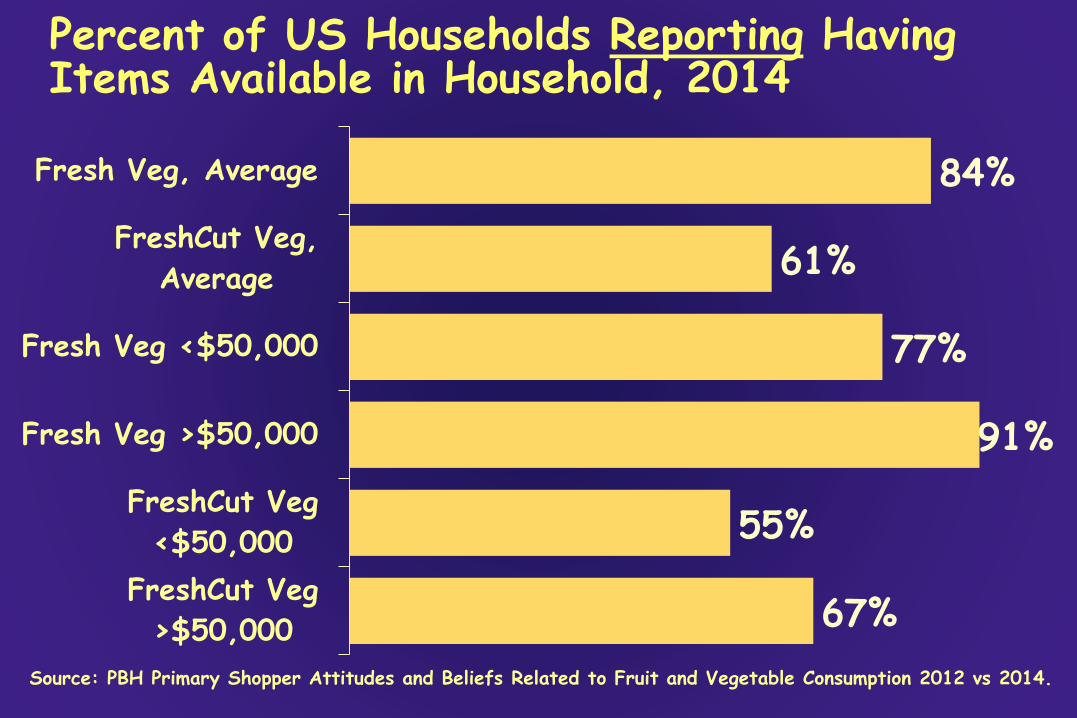
Percent of US Households Reporting Having Items Available in Household, 2014
Fresh Veg, Average
FreshCut Veg,
Average
Fresh Veg <$50,000
Fresh Veg >$50,000
FreshCut Veg
<$50,000
FreshCut Veg
>$50,000
77%
84%
61%
91%
55%
67%
Source: PBH Primary Shopper Attitudes and Beliefs Related to Fruit and Vegetable Consumption 2012 vs 2014.

Percent of US Households Reporting Having Items Available in Household, 2014
Fresh Fruit, Average
FreshCut Fruit,
Average
Fresh Fruit <$50,000
Fresh Fruit >$50,000
FreshCut Fruit
<$50,000
FreshCut Fruit
>$50,000
84%
39%
79%
88%
38%
39%
Source: PBH Primary Shopper Attitudes and Beliefs Related to Fruit and Vegetable Consumption 2012 vs 2014.
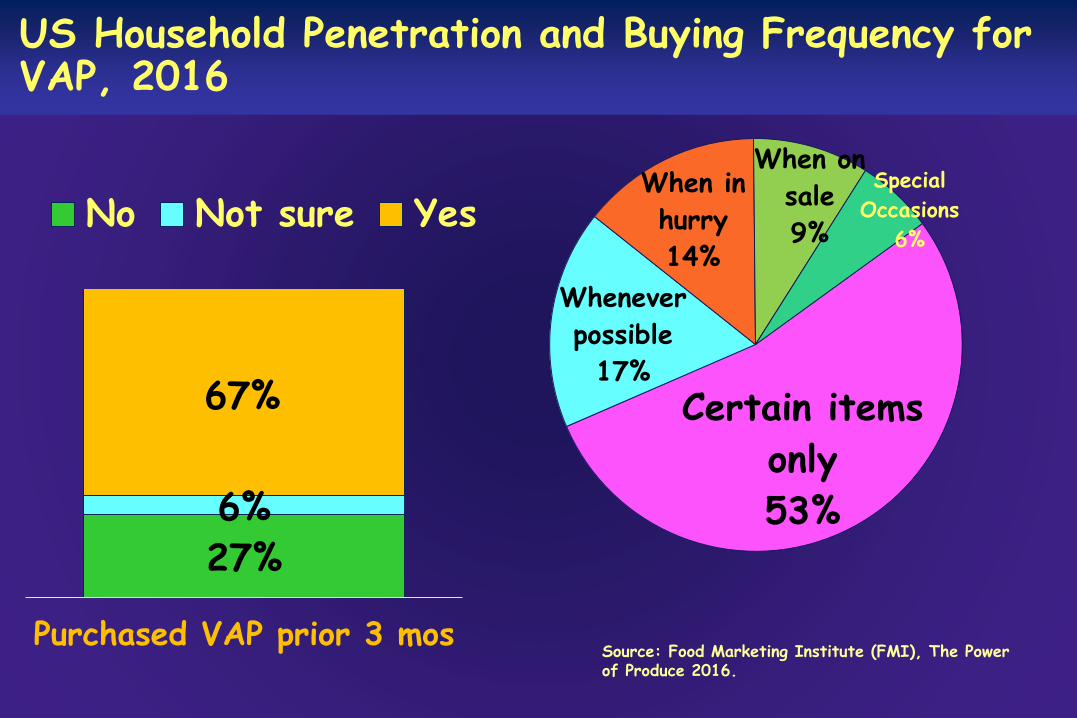
US Household Penetration and Buying Frequency for VAP, 2016
Certain items
only
53%
Whenever
possible
17%
When in
hurry
14%
When on
sale
9%
Special
Occasions
6% No Not sure Yes
67%
6%
27%
Purchased VAP prior 3 mos Source: Food Marketing Institute (FMI), The Power of Produce 2016.
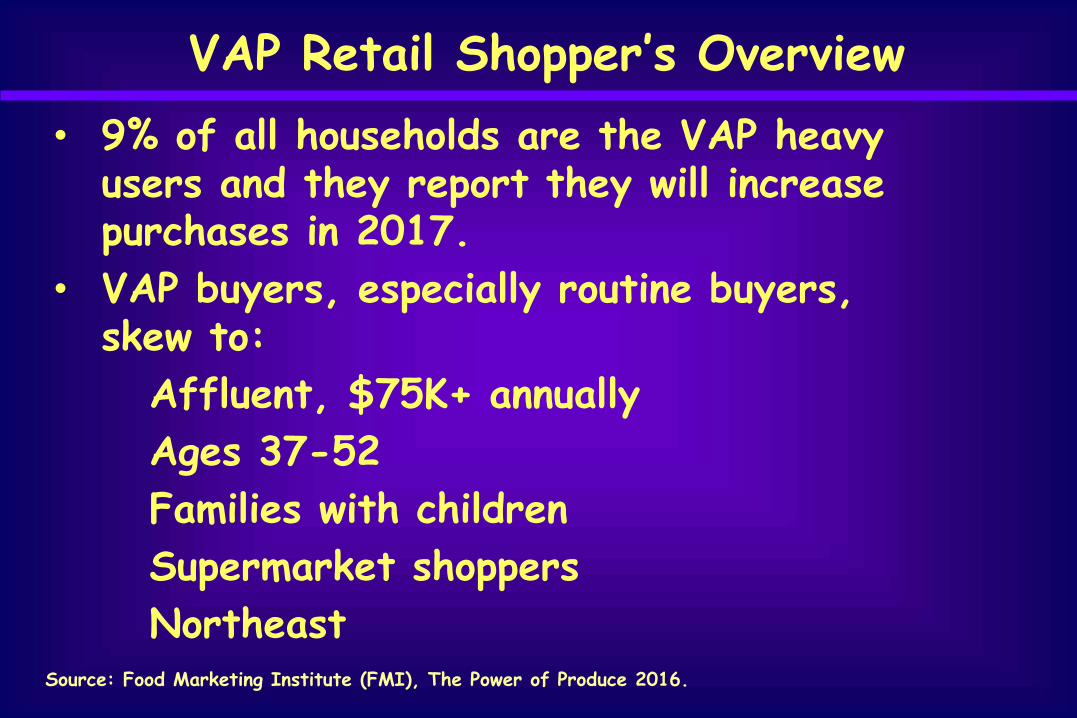
VAP Retail Shopper’s Overview
• 9% of all households are the VAP heavy users and they report they will increase purchases in 2017.
• VAP buyers, especially routine buyers, skew to:
Affluent, $75K+ annually
Ages 37-52
Families with children
Supermarket shoppers Northeast
Source: Food Marketing Institute (FMI), The Power of Produce 2016.

Reasons why shoppers DO NOT Purchase Packaged Produce, 2016
Prefer to prepare myself
Too expensive
Think not as good/fresh
Don't trust food safety
Not readily available 8%
26%
38%
49%
52%
Source: FMI, The Power of Produce 2016
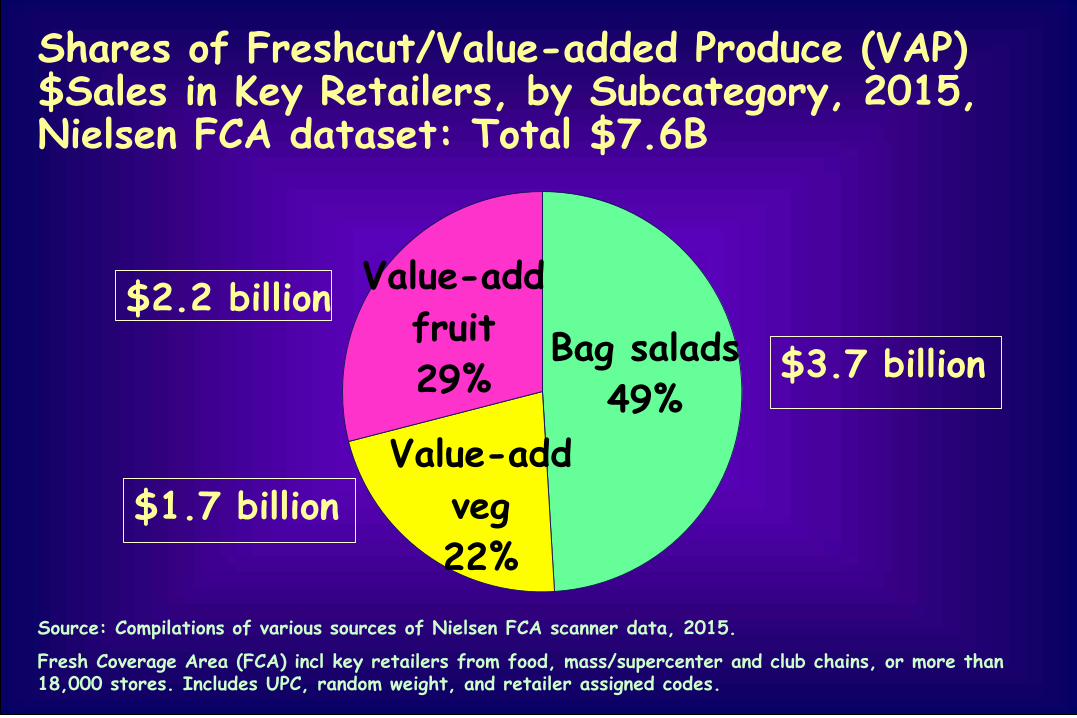
Shares of Freshcut/Value-added Produce (VAP) $Sales in Key Retailers, by Subcategory, 2015, Nielsen FCA dataset: Total $7.6B
Bag salads
49%
Value-add
veg
22%
Value-add
fruit
29%
$2.2 billion
$1.7 billion
$3.7 billion
Source: Compilations of various sources of Nielsen FCA scanner data, 2015.
Fresh Coverage Area (FCA) incl key retailers from food, mass/supercenter and club chains, or more than 18,000 stores. Includes UPC, random weight, and retailer assigned codes.

Understanding Retail Scanner Data
• Scanner data excludes foodservice operators. • Nielsen Fresh Coverage Area (FCA) dataset is a
sample and represents > 60% of grocery food sales via all formats, and retail channels.
• Since FCA is not the complete universe, total national sales are always higher. National sales can be projected assuming that the FCA sample is around 60-62% of total grocery sales.
• For example, based on the data in the prior slide, projected (from FCA) total US VAP retail sales may surpass $12.6 billion.
Sources: FreshFacts® on Retail, Whole and Fresh Cut Produce Trends: 2015, United Fresh Produce Ass’n and Nielsen, March 2016; and unpublished Nielsen data.
Fresh Coverage Area (FCA) incl key retailers from food, mass/supercenter and club chains, or more than 18,000 stores. Includes UPC, random weight, and retailer assigned codes.
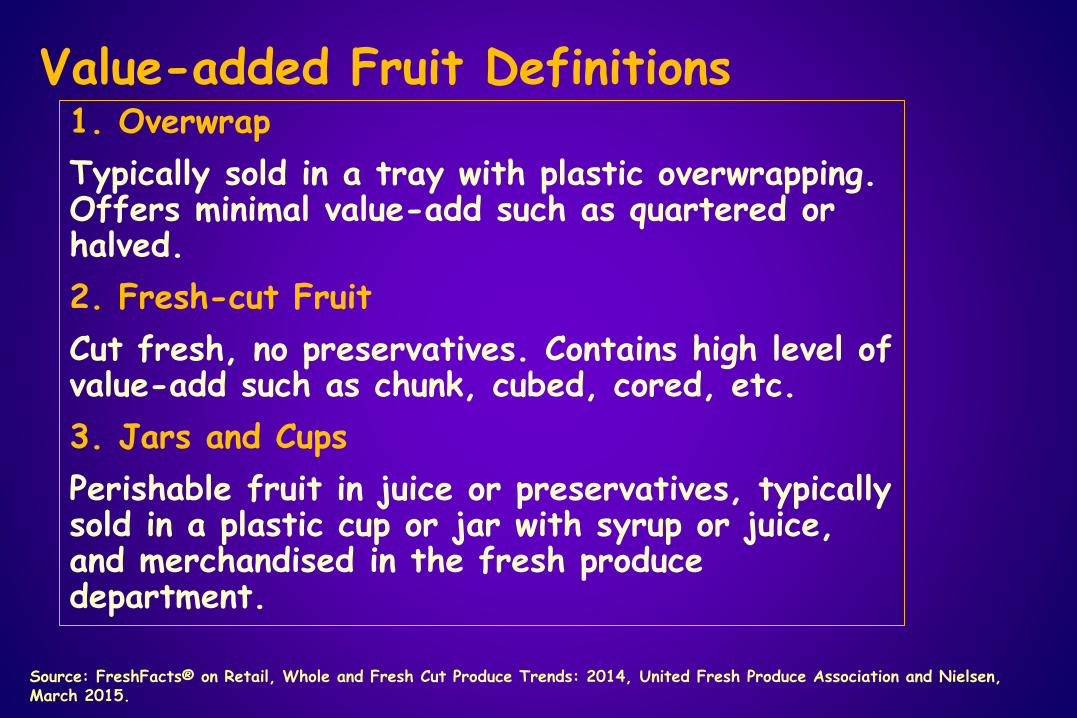
Value-added Fruit Definitions 1. Overwrap
Typically sold in a tray with plastic overwrapping. Offers minimal value-add such as quartered or halved.
2. Fresh-cut Fruit
Cut fresh, no preservatives. Contains high level of value-add such as chunk, cubed, cored, etc.
3. Jars and Cups
Perishable fruit in juice or preservatives, typically sold in a plastic cup or jar with syrup or juice, and merchandised in the fresh produce department.
Source: FreshFacts® on Retail, Whole and Fresh Cut Produce Trends: 2014, United Fresh Produce Association and Nielsen, March 2015.
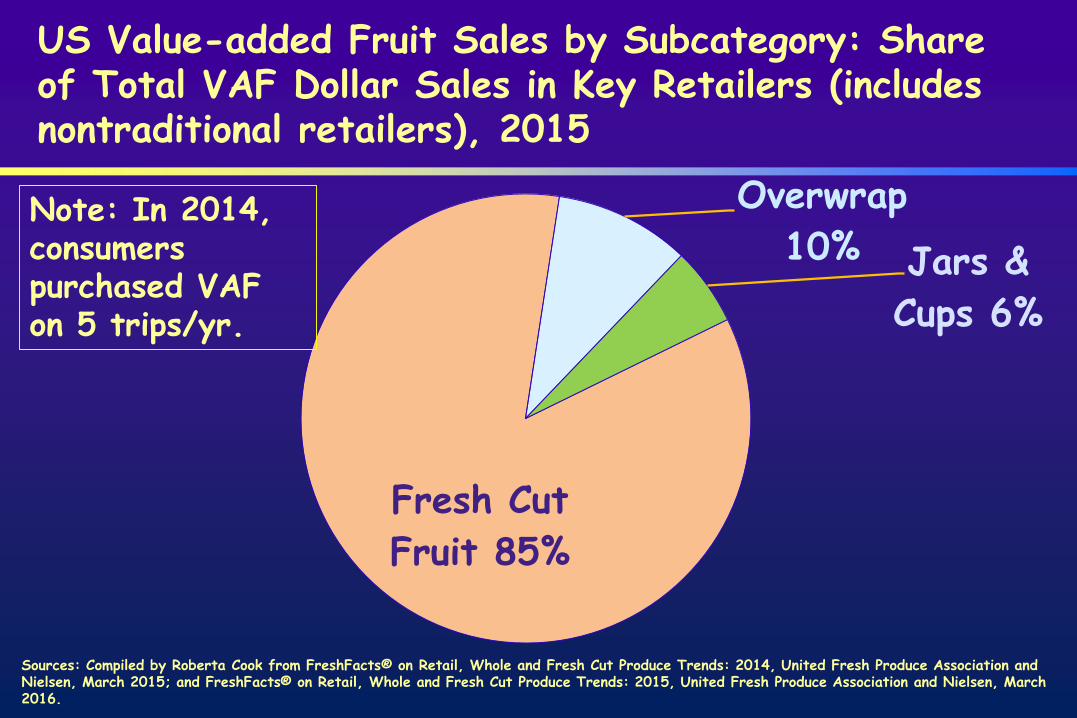
US Value-added Fruit Sales by Subcategory: Share of Total VAF Dollar Sales in Key Retailers (includes nontraditional retailers), 2015
Fresh Cut
Fruit 85%
Overwrap
10% Jars &
Cups 6%
Note: In 2014, consumers purchased VAF on 5 trips/yr.
Sources: Compiled by Roberta Cook from FreshFacts® on Retail, Whole and Fresh Cut Produce Trends: 2014, United Fresh Produce Association and Nielsen, March 2015; and FreshFacts® on Retail, Whole and Fresh Cut Produce Trends: 2015, United Fresh Produce Association and Nielsen, March 2016.

Value-added Fruit Category Sales and Pricing in Key US Food Retailers, 2015 vs 2014. VAF=5% total produce dept sales
% Change vs. 2014
Weekly $ Weekly Vol. Average Sales / Store per Store Retail Price
Value-Added Fruit 7.8 1.4 6.3
Fresh-cut Fruit 8.9 4.0 4.7
Overwrap 9.8 -1.0 10.9
Jars & Cups -8.2 -9.0 0.8
Source: FreshFacts® on Retail, Whole and Fresh Cut Produce Trends: 2015, United Fresh Produce Association and Nielsen, March 2016.
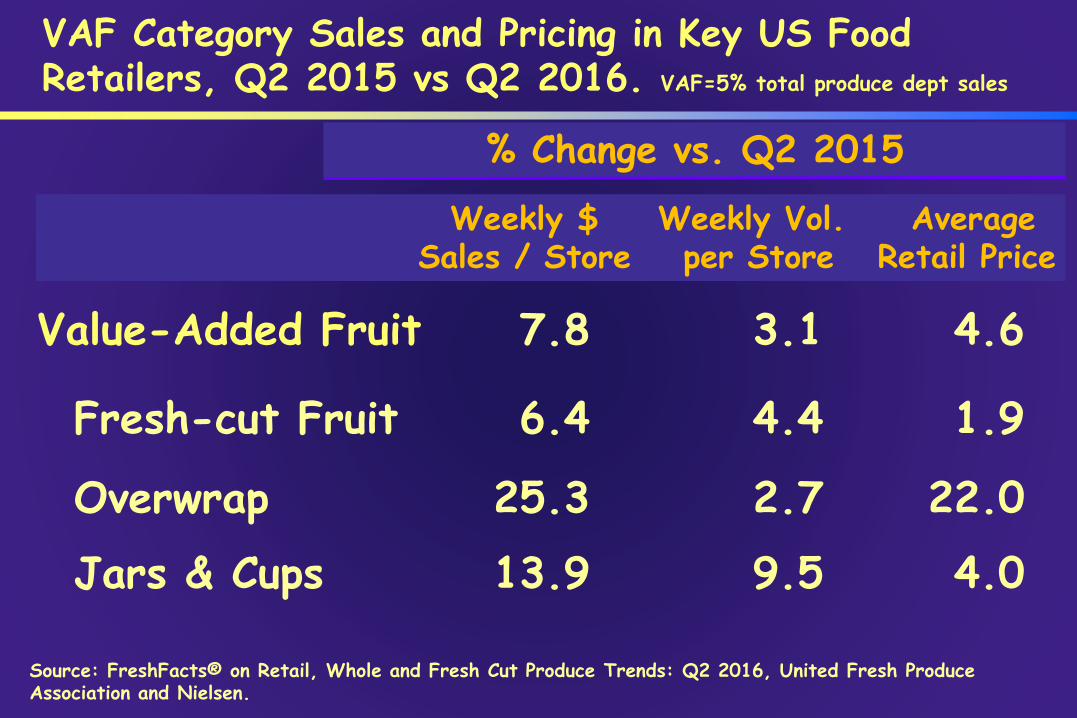
VAF Category Sales and Pricing in Key US Food Retailers, Q2 2015 vs Q2 2016. VAF=5% total produce dept sales
% Change vs. Q2 2015
Weekly $ Weekly Vol. Average Sales / Store per Store Retail Price
Value-Added Fruit 7.8 3.1 4.6
Fresh-cut Fruit 6.4 4.4 1.9
Overwrap 25.3 2.7 22.0
Jars & Cups 13.9 9.5 4.0
Source: FreshFacts® on Retail, Whole and Fresh Cut Produce Trends: Q2 2016, United Fresh Produce Association and Nielsen.
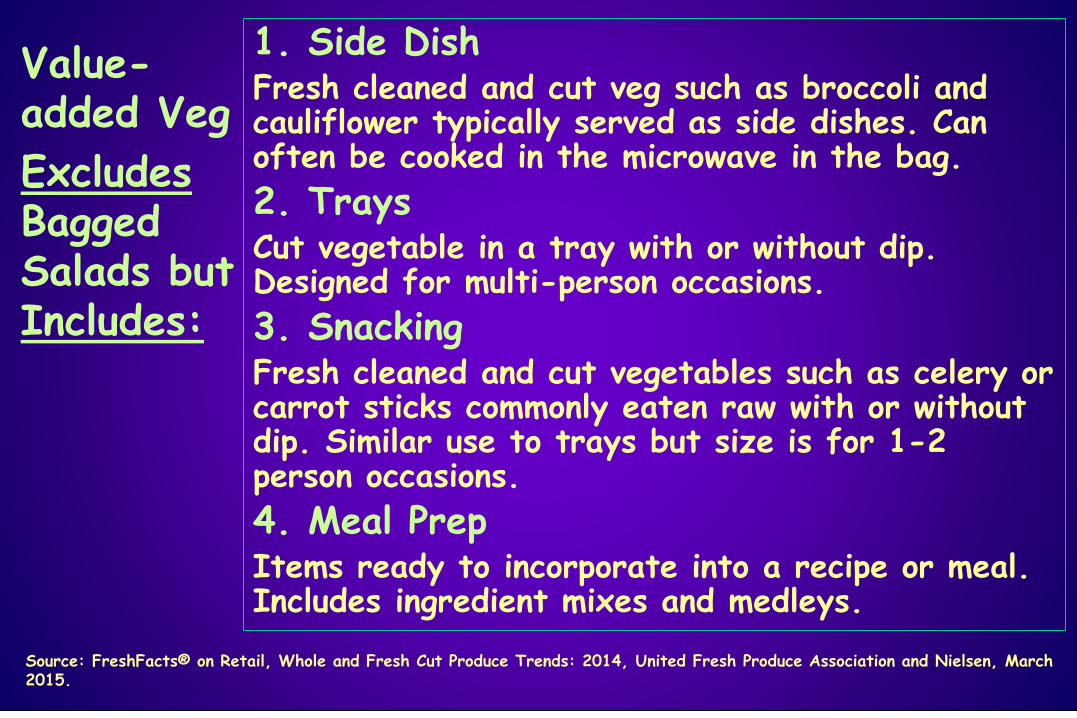
Value-added Veg
Excludes Bagged Salads but Includes:
1. Side Dish Fresh cleaned and cut veg such as broccoli and cauliflower typically served as side dishes. Can often be cooked in the microwave in the bag.
2. Trays Cut vegetable in a tray with or without dip. Designed for multi-person occasions.
3. Snacking Fresh cleaned and cut vegetables such as celery or carrot sticks commonly eaten raw with or without dip. Similar use to trays but size is for 1-2 person occasions.
4. Meal Prep Items ready to incorporate into a recipe or meal. Includes ingredient mixes and medleys.
Source: FreshFacts® on Retail, Whole and Fresh Cut Produce Trends: 2014, United Fresh Produce Association and Nielsen, March 2015.
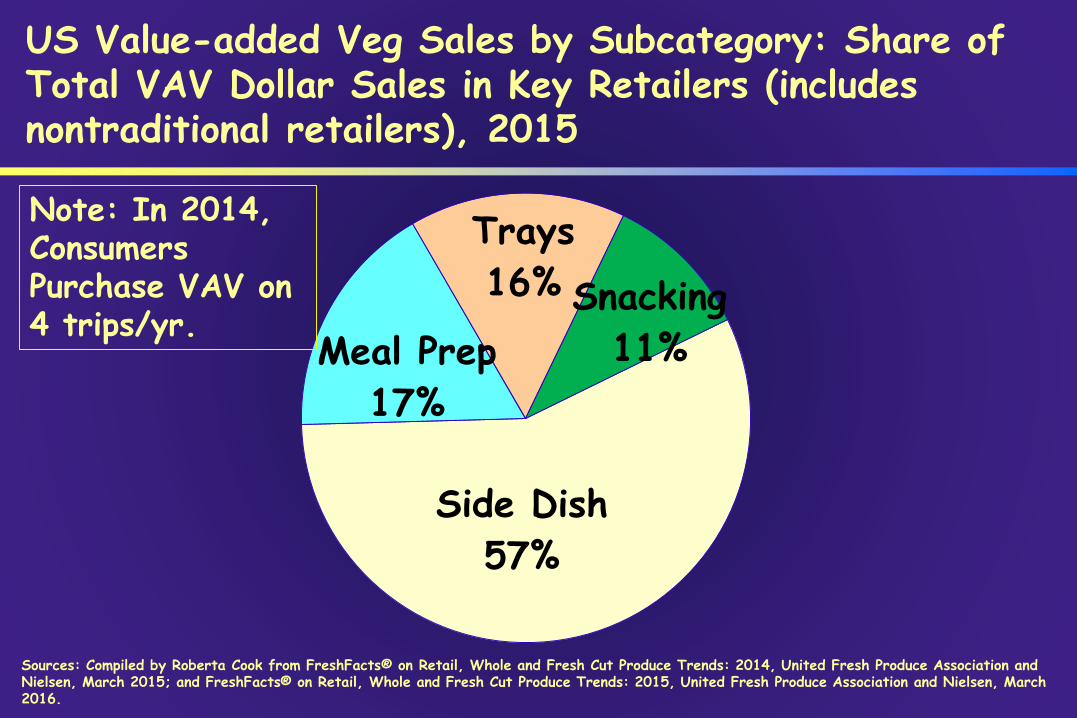
US Value-added Veg Sales by Subcategory: Share of Total VAV Dollar Sales in Key Retailers (includes nontraditional retailers), 2015
Side Dish
57%
Meal Prep
17%
Trays
16% Snacking
11%
Note: In 2014, Consumers Purchase VAV on 4 trips/yr.
Sources: Compiled by Roberta Cook from FreshFacts® on Retail, Whole and Fresh Cut Produce Trends: 2014, United Fresh Produce Association and Nielsen, March 2015; and FreshFacts® on Retail, Whole and Fresh Cut Produce Trends: 2015, United Fresh Produce Association and Nielsen, March 2016.
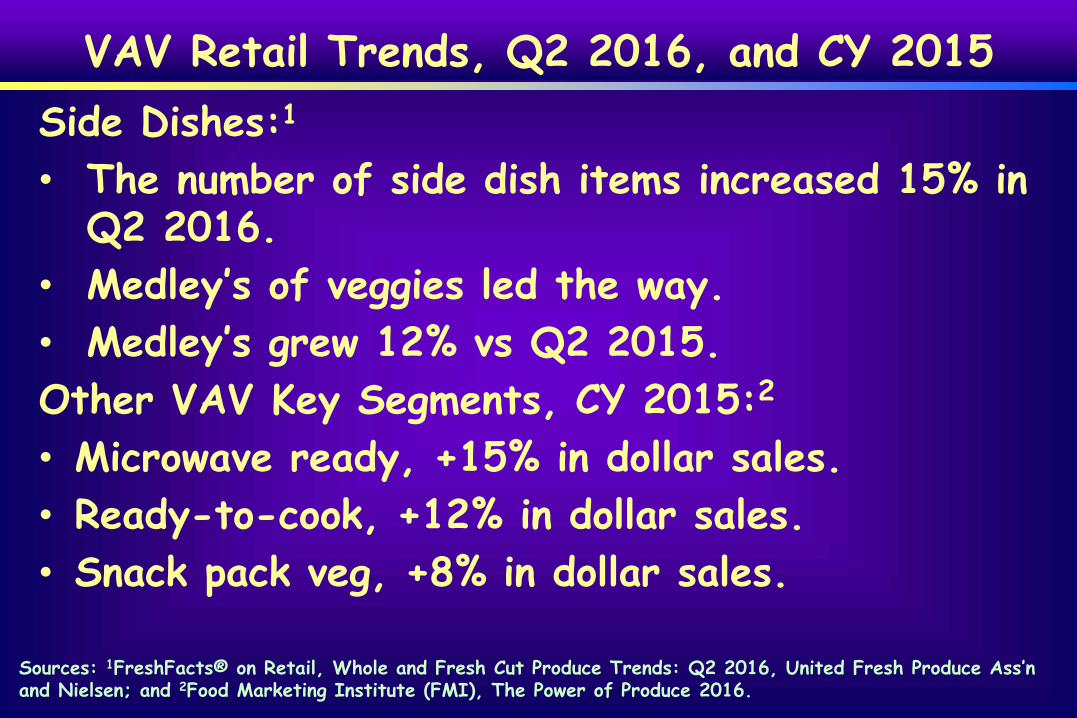
VAV Retail Trends, Q2 2016, and CY 2015
Side Dishes:1
• The number of side dish items increased 15% in Q2 2016.
• Medley’s of veggies led the way. • Medley’s grew 12% vs Q2 2015. Other VAV Key Segments, CY 2015:2
• Microwave ready, +15% in dollar sales.
• Ready-to-cook, +12% in dollar sales.
• Snack pack veg, +8% in dollar sales.
Sources: 1FreshFacts® on Retail, Whole and Fresh Cut Produce Trends: Q2 2016, United Fresh Produce Ass’n and Nielsen; and 2Food Marketing Institute (FMI), The Power of Produce 2016.
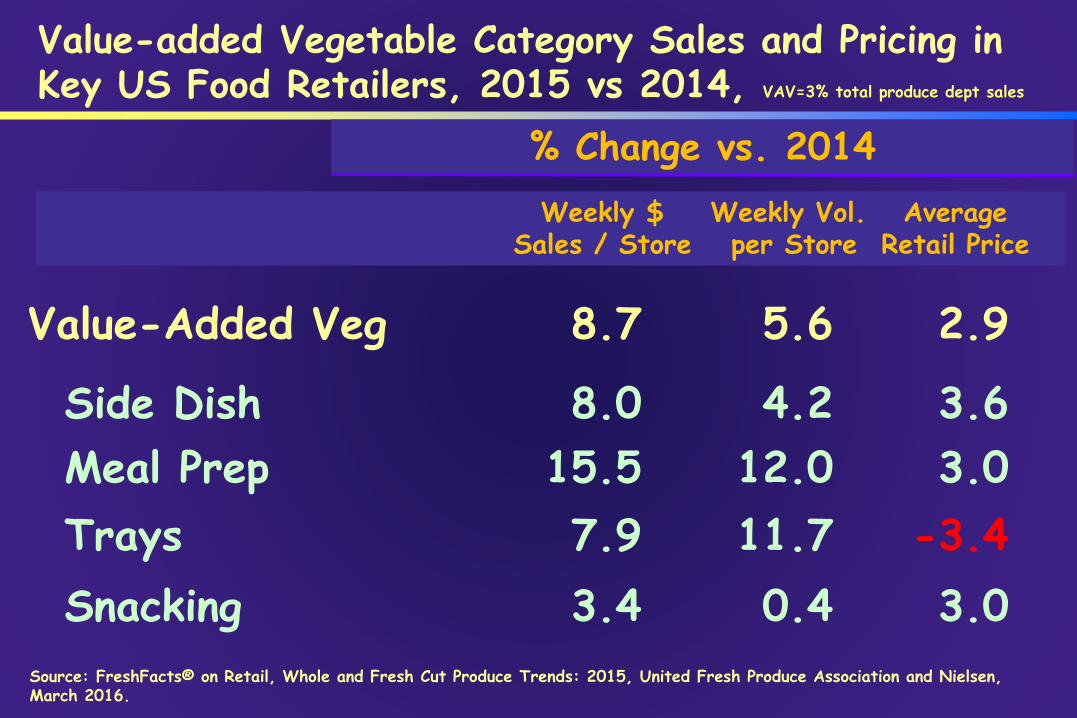
Value-added Vegetable Category Sales and Pricing in Key US Food Retailers, 2015 vs 2014, VAV=3% total produce dept sales
% Change vs. 2014
Weekly $ Weekly Vol. Average Sales / Store per Store Retail Price
Value-Added Veg 8.7 5.6 2.9
Side Dish 8.0 4.2 3.6 Meal Prep 15.5 12.0 3.0 Trays 7.9 11.7 -3.4
Snacking 3.4 0.4 3.0
Source: FreshFacts® on Retail, Whole and Fresh Cut Produce Trends: 2015, United Fresh Produce Association and Nielsen, March 2016.

Leafy Greens and Bag Salads

USA Household Likeliness of Bag Salad Purchase, by Income and Age, 2015
Income Percent Age Percent
<$25,000 39 21-39 50
$25-49,900 53 40-49 60 $50-99,900 58 50-58 56 $100,000+ 59 59+ 59
Source: Fresh Trends 2015, Vance Publishing, The Packer
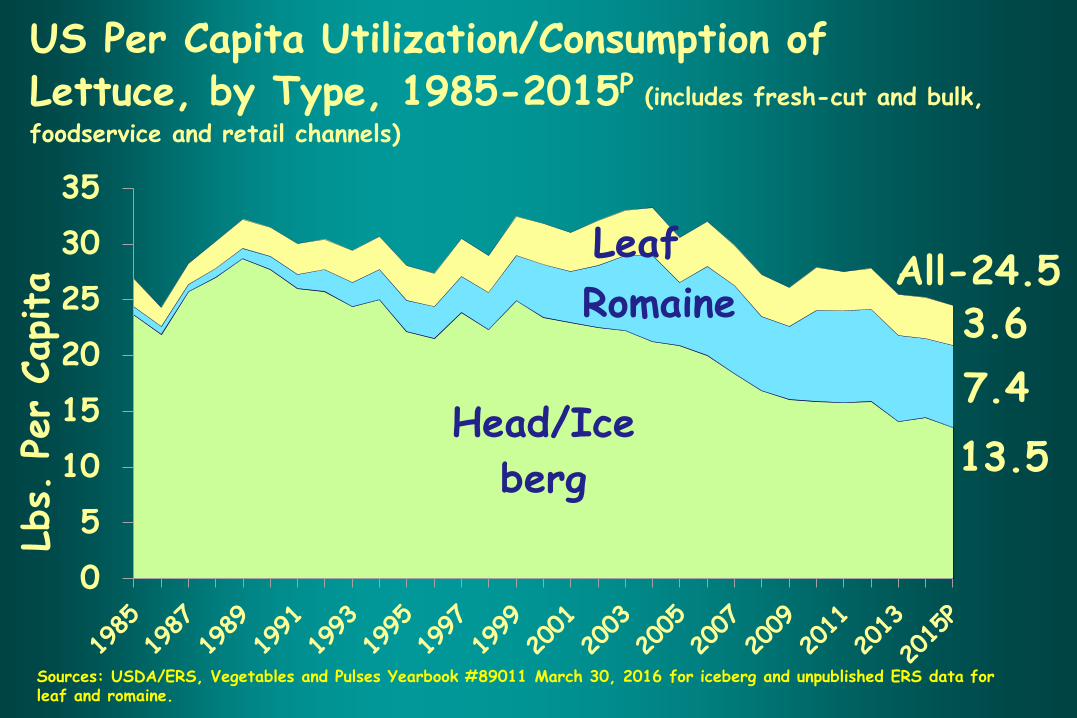
US Per Capita Utilization/Consumption of Lettuce, by Type, 1985-2015P (includes fresh-cut and bulk,
foodservice and retail channels)
Head/Ice
berg
Romaine
Leaf
0
5
10
15
20
25
30
35
7.4
3.6
Lbs.
Per
Capita
All-24.5
13.5
Sources: USDA/ERS, Vegetables and Pulses Yearbook #89011 March 30, 2016 for iceberg and unpublished ERS data for leaf and romaine.
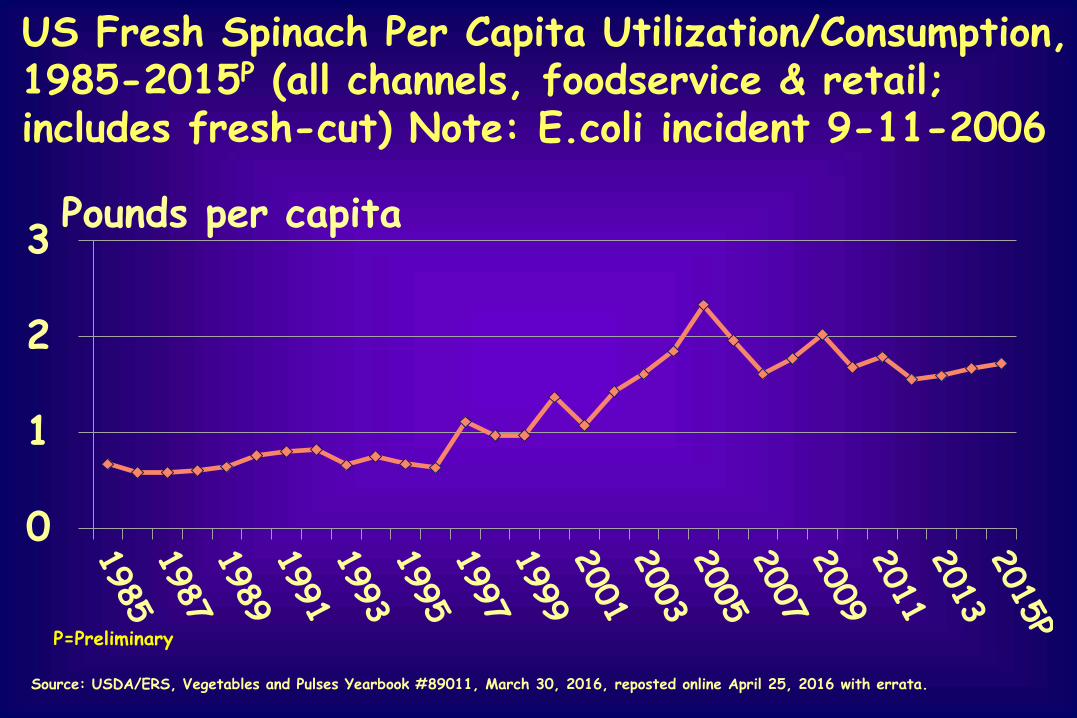
US Fresh Spinach Per Capita Utilization/Consumption, 1985-2015P (all channels, foodservice & retail; includes fresh-cut) Note: E.coli incident 9-11-2006
Pounds per capita
0
1
2
3
P=Preliminary
Source: USDA/ERS, Vegetables and Pulses Yearbook #89011, March 30, 2016, reposted online April 25, 2016 with errata.

Top 10 Vegetable Sales and Pricing in Key US Food Retailers, 2015 vs. 2014
Weekly $ Percent Weekly Percent Avg Percent Sales per Change Vol. per Change Retail Change
Product Store vs. 2014 Store vs. 2014 Price vs. 2014
Bag Salad $3,877 9.2% 1,378 5.9% $2.81 3.1% Tomatoes $2,666 3.4% 1,169 1.1% $2.28 2.3% Potatoes $2,521 -1.4% 3,619 -2.4% $0.70 1.0% Cooking Veg $1,841 3.4% 1,071 -1.0% $1.72 4.4% Value-Add Veg $1,754 8.7% 564 5.6% $3.11 2.9% Onions $1,530 -1.9% 1,527 -2.6% $1.00 0.7% Peppers $1,471 5.0% 657 3.9% $2.24 1.1% Lettuce $1,312 3.2% 709 0.2% $1.85 3.1% Carrots $878 -2.5% 516 -2.8% $1.70 0.3% Mushroom $863 3.3% 347 1.3% $2.49 2.0%
Source: FreshFacts® on Retail, Whole and Fresh Cut Produce Trends: 2015, United Fresh Produce Association and Nielsen FCA dataset, March 2016.
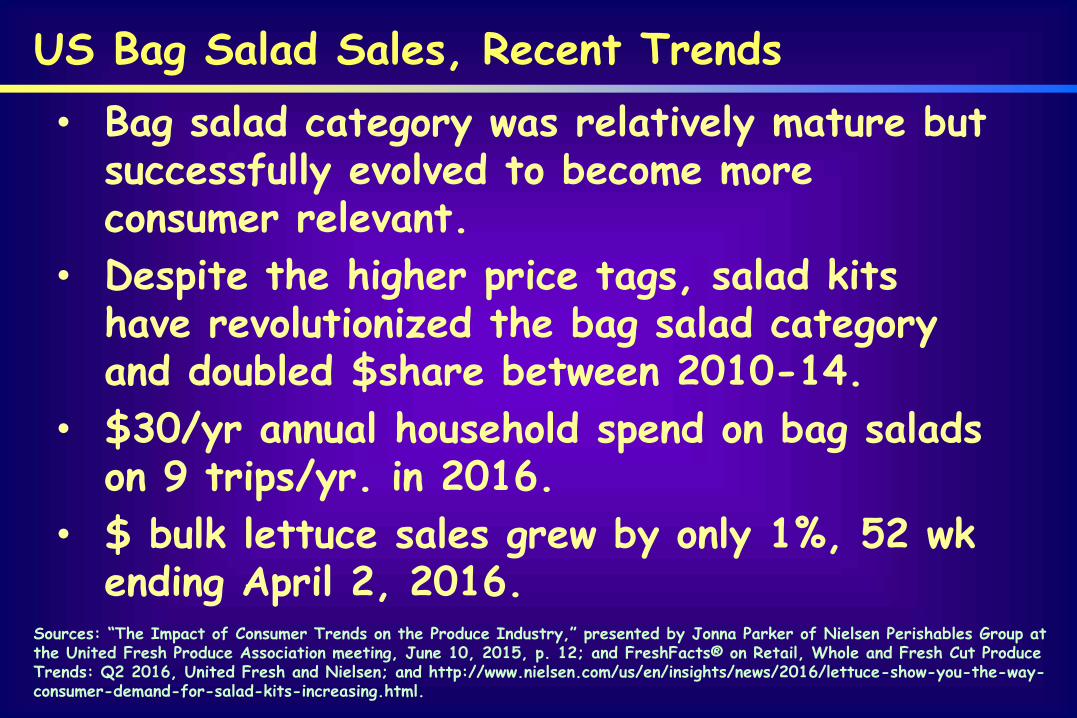
US Bag Salad Sales, Recent Trends
• Bag salad category was relatively mature but successfully evolved to become more consumer relevant.
• Despite the higher price tags, salad kits have revolutionized the bag salad category and doubled $share between 2010-14.
• $30/yr annual household spend on bag salads on 9 trips/yr. in 2016.
• $ bulk lettuce sales grew by only 1%, 52 wk ending April 2, 2016.
Sources: “The Impact of Consumer Trends on the Produce Industry,” presented by Jonna Parker of Nielsen Perishables Group at the United Fresh Produce Association meeting, June 10, 2015, p. 12; and FreshFacts® on Retail, Whole and Fresh Cut Produce Trends: Q2 2016, United Fresh and Nielsen; and http://www.nielsen.com/us/en/insights/news/2016/lettuce-show-you-the-wayconsumer-demand-for-salad-kits-increasing.html.
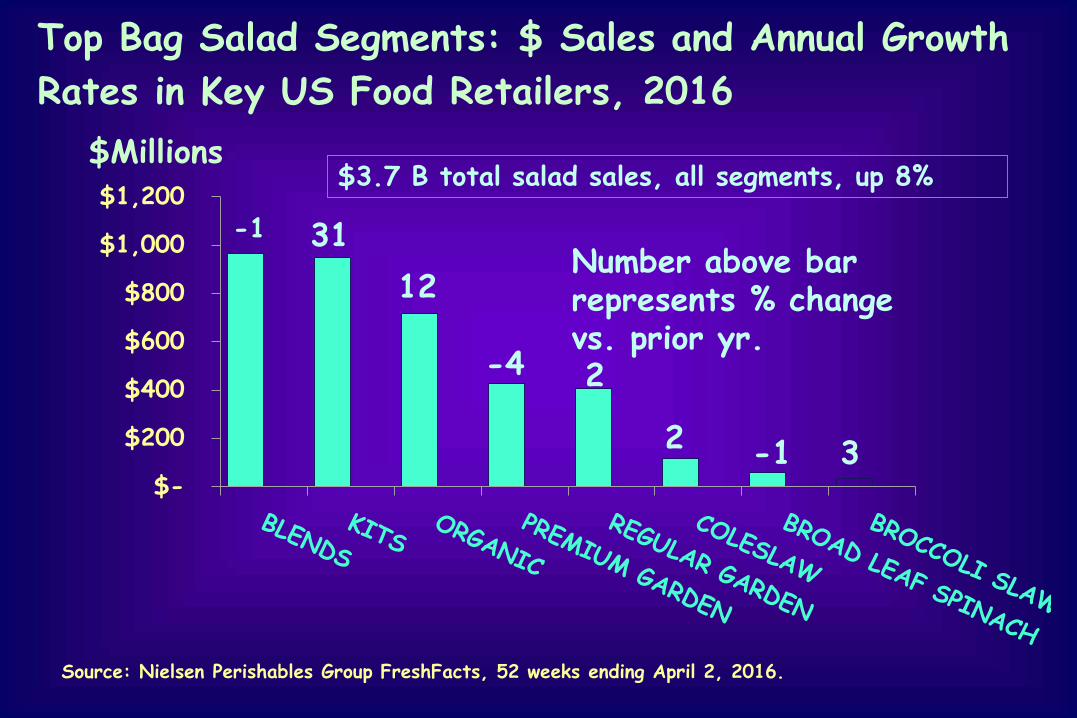
Top Bag Salad Segments: $ Sales and Annual Growth
Rates in Key US Food Retailers, 2016
$Millions $1,200
$1,000
$800
$600
$400
$200
$
$3.7 B total salad sales, all segments, up 8%
-1 3
-1 Number above bar represents % change vs. prior yr.
31
12
-4 2
2
Source: Nielsen Perishables Group FreshFacts, 52 weeks ending April 2, 2016.
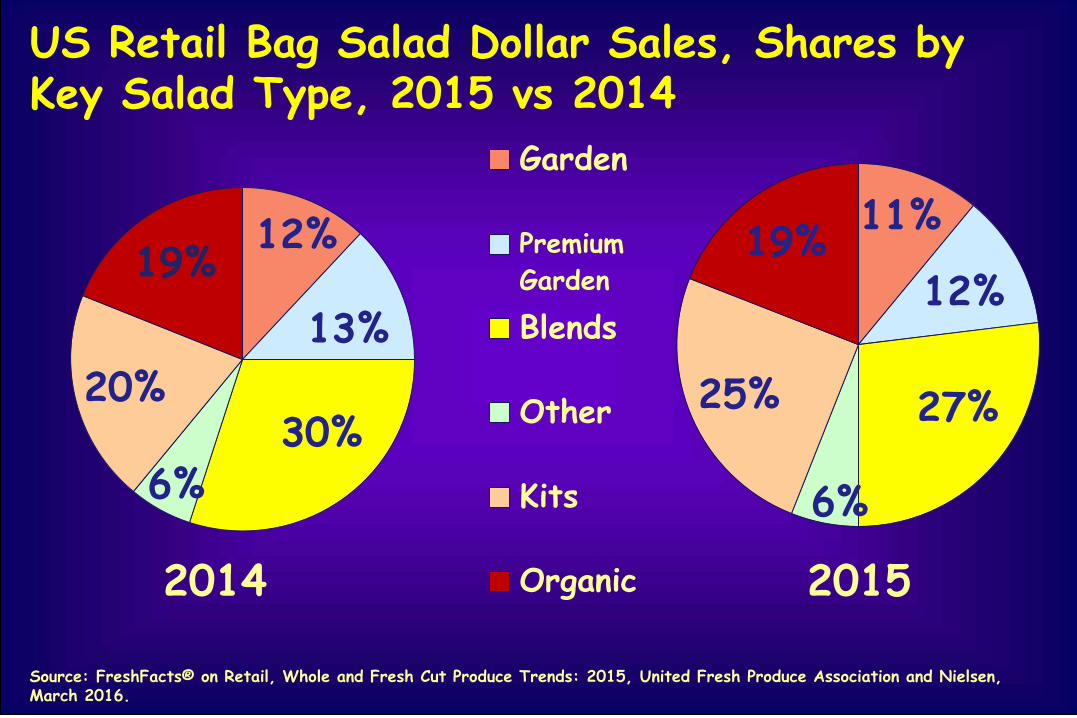
US Retail Bag Salad Dollar Sales, Shares by Key Salad Type, 2015 vs 2014
Garden
12%
13%
30% 6%
20%
19% Premium
Garden
11%
12%
27%
6%
25%
19%
Blends
Other
Kits
Organic 20152014
Source: FreshFacts® on Retail, Whole and Fresh Cut Produce Trends: 2015, United Fresh Produce Association and Nielsen, March 2016.
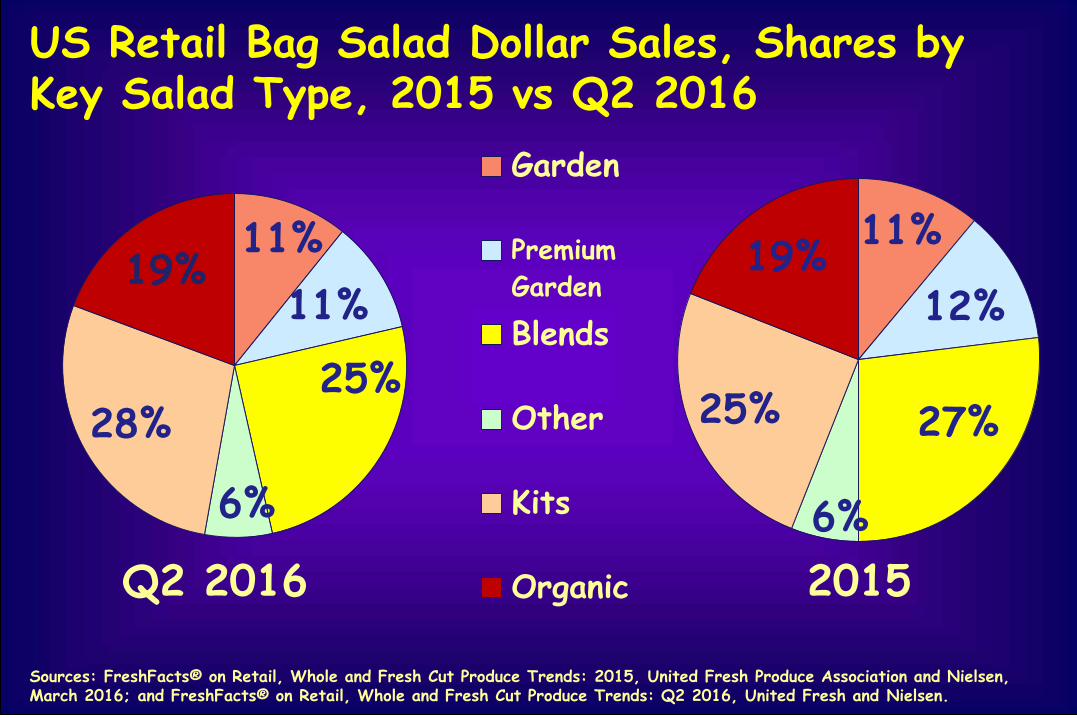
US Retail Bag Salad Dollar Sales, Shares by Key Salad Type, 2015 vs Q2 2016
Garden
11%
11%
25%
6%
28%
19% Premium
Garden
Blends
Other
Kits
11%
12%
27%
6%
25%
19%
Q2 2016 Organic 2015
Sources: FreshFacts® on Retail, Whole and Fresh Cut Produce Trends: 2015, United Fresh Produce Association and Nielsen, March 2016; and FreshFacts® on Retail, Whole and Fresh Cut Produce Trends: Q2 2016, United Fresh and Nielsen.

US Bag Salad Market Shares in Select Retailers, by Key Firm (% total $ sales), and Point Change in Market Share 2014 vs 2013
% Share Share Point Change
Private label 29.7 0.2
Fresh Express 28.7 -0.8 Dole 19.7 -1.2 Earthbound Farm 6.7 0.7 Ready Pac 3.5 -0.2 Organic Girl 2.8 0.3 All Other 8.1 NA Source: Nielsen 52 weeks ending July 12, 2014. Excludes nontraditional retailers, such as, Walmart and clubs.

US Bag Salad Market Shares in Select Retailers: Top 5 Firms and Private Label, Share of Dollar Sales Private Other share
61% 30%
9%label share 2%
6%
Private label share
Other share
Top 5 firms 91%
Top 5 firms
1994 2014 Sources: 1994 - IRI; Nielsen *52 weeks ending July 14, 2014. Excludes Walmart and clubs.
Value-added Fruit Trends
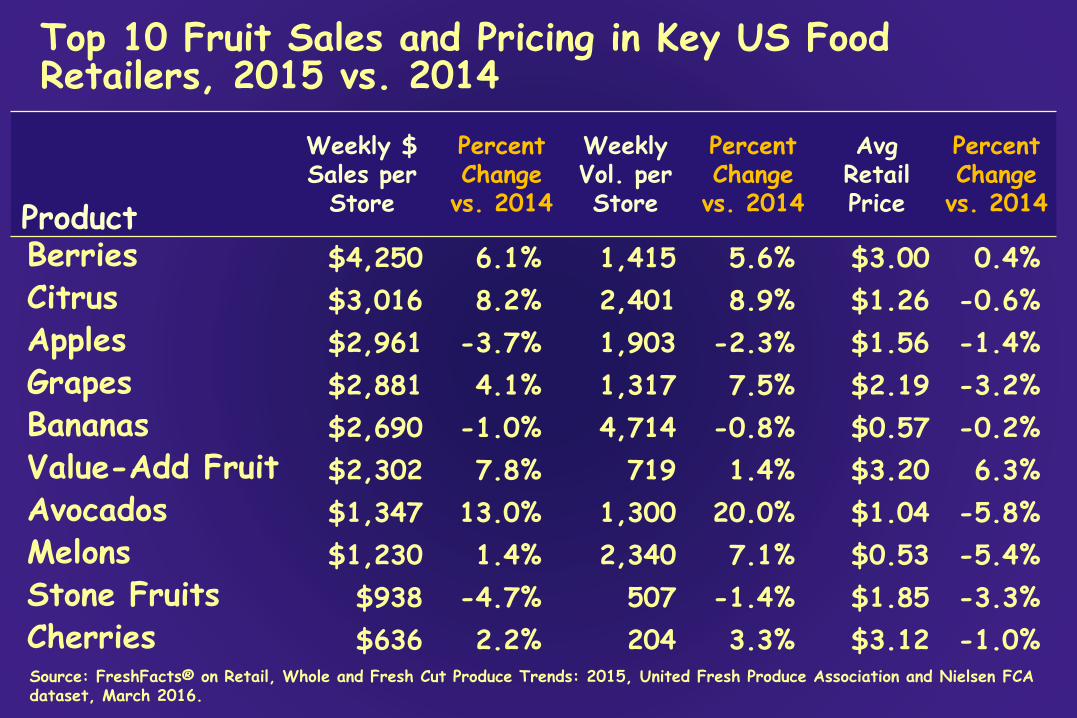
Top 10 Fruit Sales and Pricing in Key US Food Retailers, 2015 vs. 2014
Weekly $ Percent Weekly Percent Avg Percent Sales per Change Vol. per Change Retail Change
Product Store vs. 2014 Store vs. 2014 Price vs. 2014
Berries $4,250 6.1% 1,415 5.6% $3.00 0.4%
Citrus $3,016 8.2% 2,401 8.9% $1.26 -0.6%
Apples $2,961 -3.7% 1,903 -2.3% $1.56 -1.4%
Grapes $2,881 4.1% 1,317 7.5% $2.19 -3.2%
Bananas $2,690 -1.0% 4,714 -0.8% $0.57 -0.2%
Value-Add Fruit $2,302 7.8% 719 1.4% $3.20 6.3%
Avocados $1,347 13.0% 1,300 20.0% $1.04 -5.8%
Melons $1,230 1.4% 2,340 7.1% $0.53 -5.4%
Stone Fruits $938 -4.7% 507 -1.4% $1.85 -3.3%
Cherries $636 2.2% 204 3.3% $3.12 -1.0% Source: FreshFacts® on Retail, Whole and Fresh Cut Produce Trends: 2015, United Fresh Produce Association and Nielsen FCA dataset, March 2016.
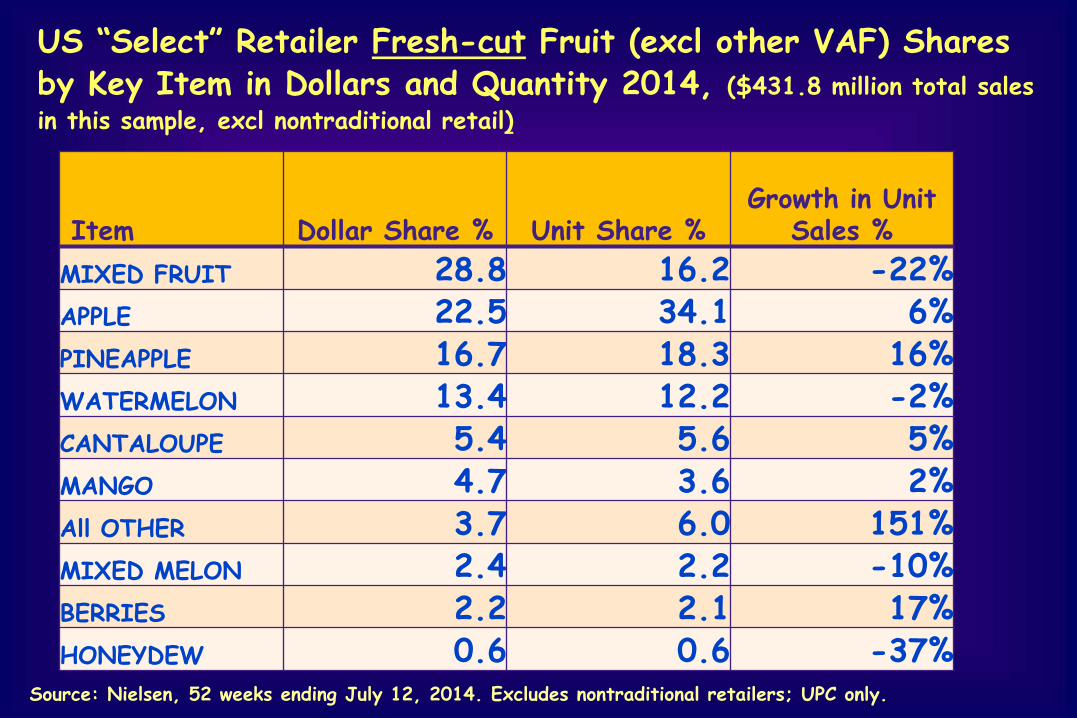
US “Select” Retailer Fresh-cut Fruit (excl other VAF) Shares by Key Item in Dollars and Quantity 2014, ($431.8 million total sales
in this sample, excl nontraditional retail)
Item Dollar Share % Unit Share % Growth in Unit
Sales %
MIXED FRUIT 28.8 16.2 -22%
APPLE 22.5 34.1 6%
PINEAPPLE 16.7 18.3 16%
WATERMELON 13.4 12.2 -2%
CANTALOUPE 5.4 5.6 5%
MANGO 4.7 3.6 2%
All OTHER 3.7 6.0 151%
MIXED MELON 2.4 2.2 -10%
BERRIES 2.2 2.1 17%
HONEYDEW 0.6 0.6 -37% Source: Nielsen, 52 weeks ending July 12, 2014. Excludes nontraditional retailers; UPC only.
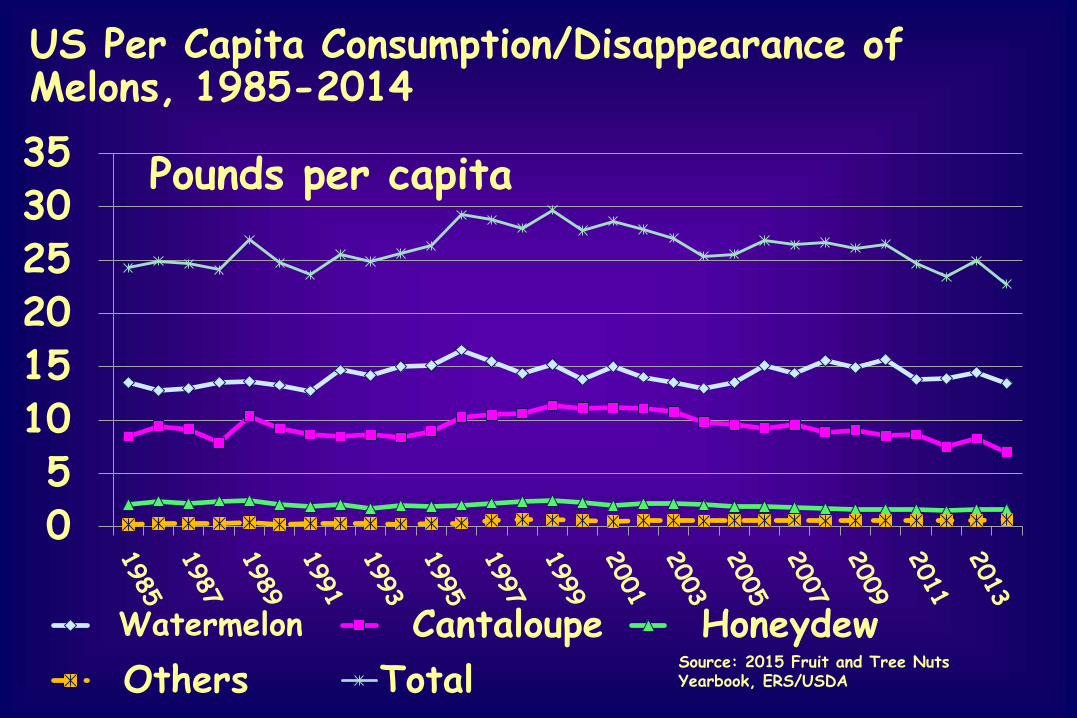
US Per Capita Consumption/Disappearance of Melons, 1985-2014
Pounds per capita
0 5
10 15 20 25 30 35
Watermelon Cantaloupe HoneydewSource: 2015 Fruit and Tree Nuts
Total Yearbook, ERS/USDA Others

Fresh-cut Fruit Top 5 Brand Shares, by Key Firm, in Select US Food Retailers, 2014
Source: Perishables Group Nielsen, 52 weeks ending July 12, 2014. Excludes nontraditional retailers.
PRIVATE
LABEL
34
CRUNCH PAK
9
DEL
MONTE
9
READY PAC
6
CHIQUITA 5 GARDEN HIGHWAY 2
OTHER
35
Fresh-cut Vegetable Trends
Note: in general, scanner data show growth rates in cooking veg items such as brussel sprouts much higher for value-added (fixed weight) than bulk (random weight).
Cauliflower a star, in part due to variety in presentations and packaging, and versatility in uses.
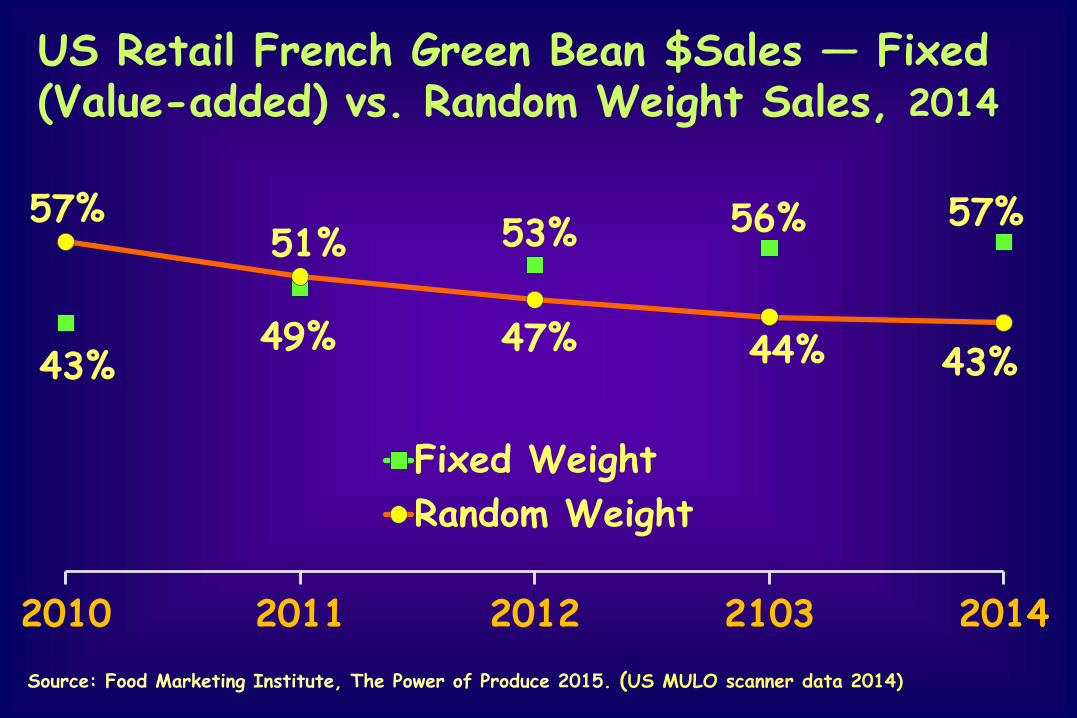
US Retail French Green Bean $Sales — Fixed (Value-added) vs. Random Weight Sales, 2014
57% 56% 57% 53%51%
49% 47% 44%43% 43%
Fixed Weight Random Weight
2010 2011 2012 2103 2014 Source: Food Marketing Institute, The Power of Produce 2015. (US MULO scanner data 2014)

Top Value-added Vegetable Side Dish Sales and Pricing in Key US Food Retailers, Q3 2014 vs. 2013
Weekly $ Percent Weekly Percent Sales per Change Vol. per Change
Product Store vs. 2013 Store vs. 2013
Side Dish Total $805 10.5 263 11.0
French/Green Beans $138 -1.8 41 2.0
Cooking greens $111 32.3 36 26.2
Broccoli $108 9.7 38 10.6
Sugar snap peas $101 -1.6 31 0.9
Veg medley $80 4.7 26 5.5
Brussel sprouts $59 33.7 18 26.1
Broccoli/cauliflower $35 10.4 14 10.0
Stir fry $27 7.8 10 8.0
Squash $22 25.4 7 19.1 Source: FreshFacts® on Retail, Whole and Fresh Cut Produce Trends: Q3 2014, United Fresh Produce Association and Nielsen.
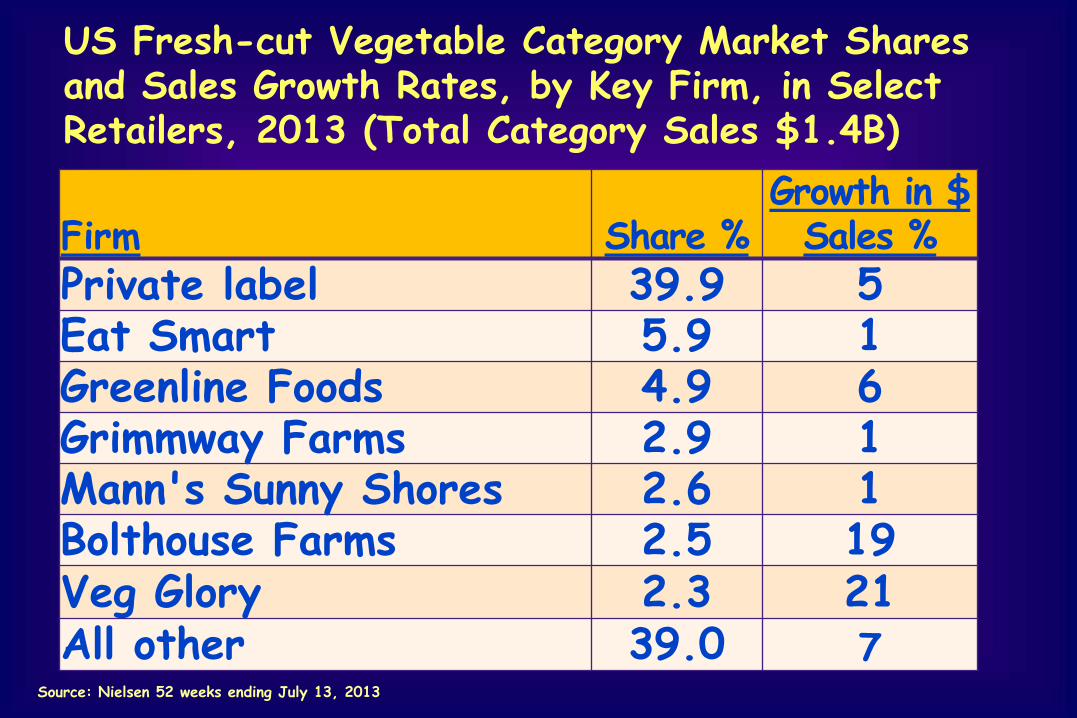
US Fresh-cut Vegetable Category Market Shares and Sales Growth Rates, by Key Firm, in Select Retailers, 2013 (Total Category Sales $1.4B)
Firm Share % Growth in $
Sales %
Private label 39.9 5 Eat Smart 5.9 1 Greenline Foods 4.9 6 Grimmway Farms 2.9 1 Mann's Sunny Shores 2.6 1 Bolthouse Farms 2.5 19 Veg Glory 2.3 21 All other 39.0 7
Source: Nielsen 52 weeks ending July 13, 2013

Organics and Local
Note: Despite sustained rapid growth in organics, in 2015, they still represent only 8% of total fresh produce dept. sales. (Nielsen)
Organics and Local
Note: Despite sustained rapid growth in organics, in 2015, they still represent only 8-9% of total 2015/16 fresh produce dept. sales. (Nielsen)

Annual Growth Rates in $ Sales of Conventional and Organic Produce in Key US Retailers, 2011-2015
Conventional Produce Organic Produce 22%
2%
7%
3% 3%
18% 19%
13%
2012 vs 2011 2013 vs 2012 2014 vs 2013 2015 vs 2014 Source: Food Marketing Institute, The Power of Produce, 2016.
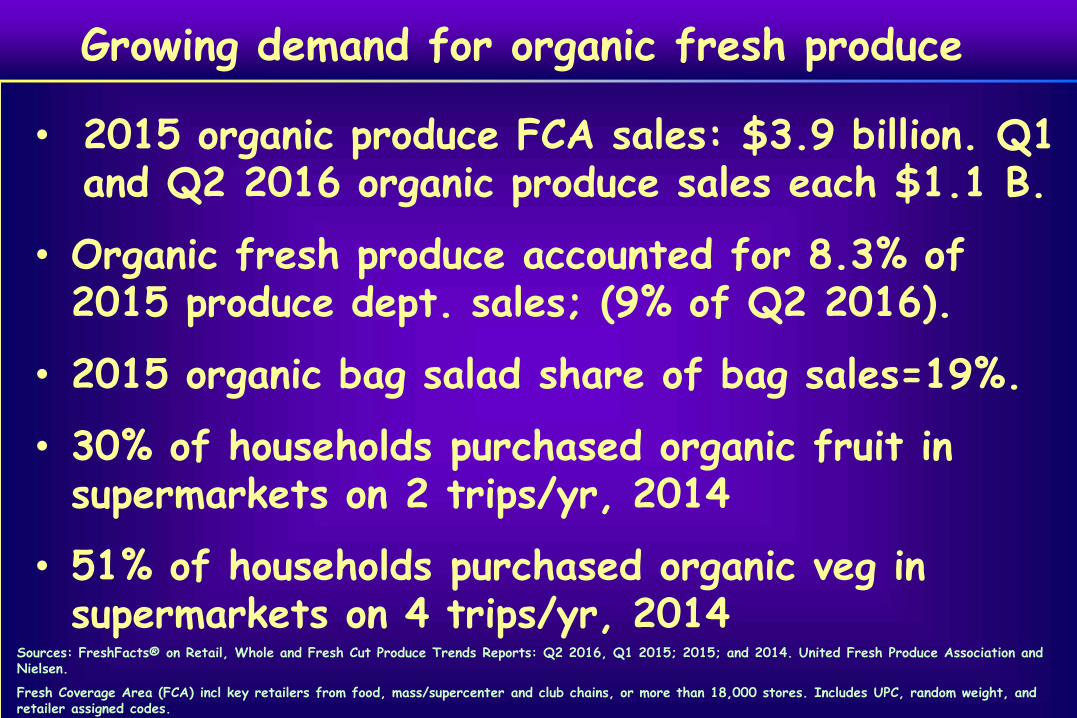
Growing demand for organic fresh produce
• 2015 organic produce FCA sales: $3.9 billion. Q1 and Q2 2016 organic produce sales each $1.1 B.
• Organic fresh produce accounted for 8.3% of 2015 produce dept. sales; (9% of Q2 2016).
• 2015 organic bag salad share of bag sales=19%.
• 30% of households purchased organic fruit in supermarkets on 2 trips/yr, 2014
• 51% of households purchased organic veg in supermarkets on 4 trips/yr, 2014
Sources: FreshFacts® on Retail, Whole and Fresh Cut Produce Trends Reports: Q2 2016, Q1 2015; 2015; and 2014. United Fresh Produce Association and Nielsen.
Fresh Coverage Area (FCA) incl key retailers from food, mass/supercenter and club chains, or more than 18,000 stores. Includes UPC, random weight, and retailer assigned codes.

Organic Fruit and Vegetable Sales and Pricing in Key US Food Retailers, 2015 vs. 2014
Weekly $ Percent Weekly Percent Avg Percent Organic Sales per Change Vol. per Change Retail Change
Store vs. 2014 Store vs. 2014 Price vs. 2014 Product
Veg $2,362 14 841 13 $2.81 0.7
Fruit $1,245 16 622 22 $2.00 -5.5
Source: FreshFacts® on Retail, Whole and Fresh Cut Produce Trends: 2015, United Fresh Produce Association and Nielsen, March 2016.
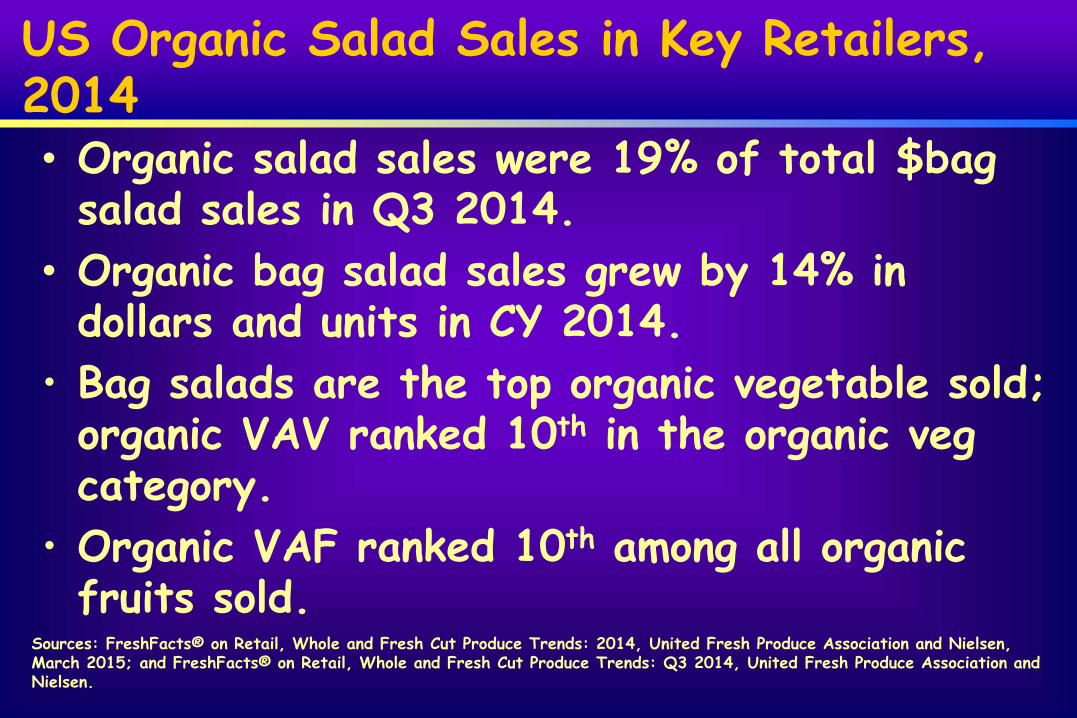
US Organic Salad Sales in Key Retailers, 2014 • Organic salad sales were 19% of total $bag salad sales in Q3 2014.
• Organic bag salad sales grew by 14% in dollars and units in CY 2014. • Bag salads are the top organic vegetable sold; organic VAV ranked 10th in the organic veg category.
• Organic VAF ranked 10th among all organic fruits sold.
Sources: FreshFacts® on Retail, Whole and Fresh Cut Produce Trends: 2014, United Fresh Produce Association and Nielsen, March 2015; and FreshFacts® on Retail, Whole and Fresh Cut Produce Trends: Q3 2014, United Fresh Produce Association and Nielsen.
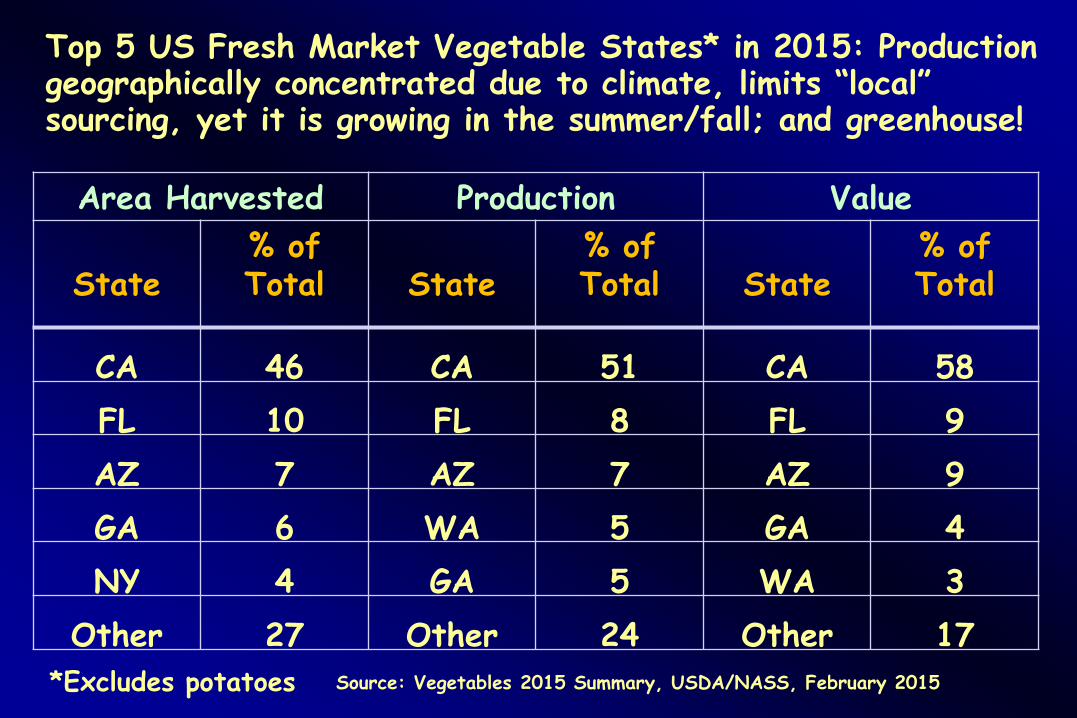
Top 5 US Fresh Market Vegetable States* in 2015: Production geographically concentrated due to climate, limits “local” sourcing, yet it is growing in the summer/fall; and greenhouse!
Area Harvested Production Value
State % of Total State
% of Total State
% of Total
CA 46 CA 51 CA 58
FL 10 FL 8 FL 9
AZ 7 AZ 7 AZ 9
GA 6 WA 5 GA 4
NY 4 GA 5 WA 3
Other 27 Other 24 Other 17
*Excludes potatoes Source: Vegetables 2015 Summary, USDA/NASS, February 2015
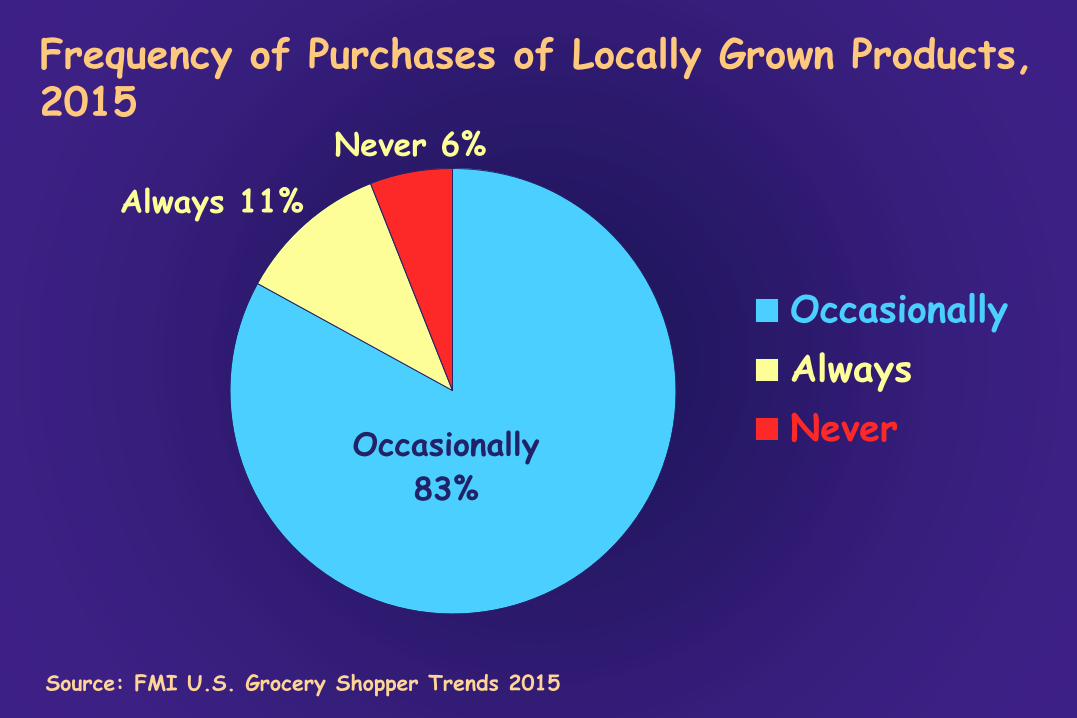
Frequency of Purchases of Locally Grown Products, 2015
Never 6%
Occasionally
83%
Always 11%
Occasionally
Always
Never
Source: FMI U.S. Grocery Shopper Trends 2015

Reasons for Buying Locally Grown Fresh Produce at Retail, 2016
Support local economy
Freshness
Knowing where grown
Less environmental impact
Unique product
Knowing farm story
Better price
Better nutrition
45%
38%
25%
23%
20%
20%
79%
74%
Source: FMI The Power of Produce, 2016
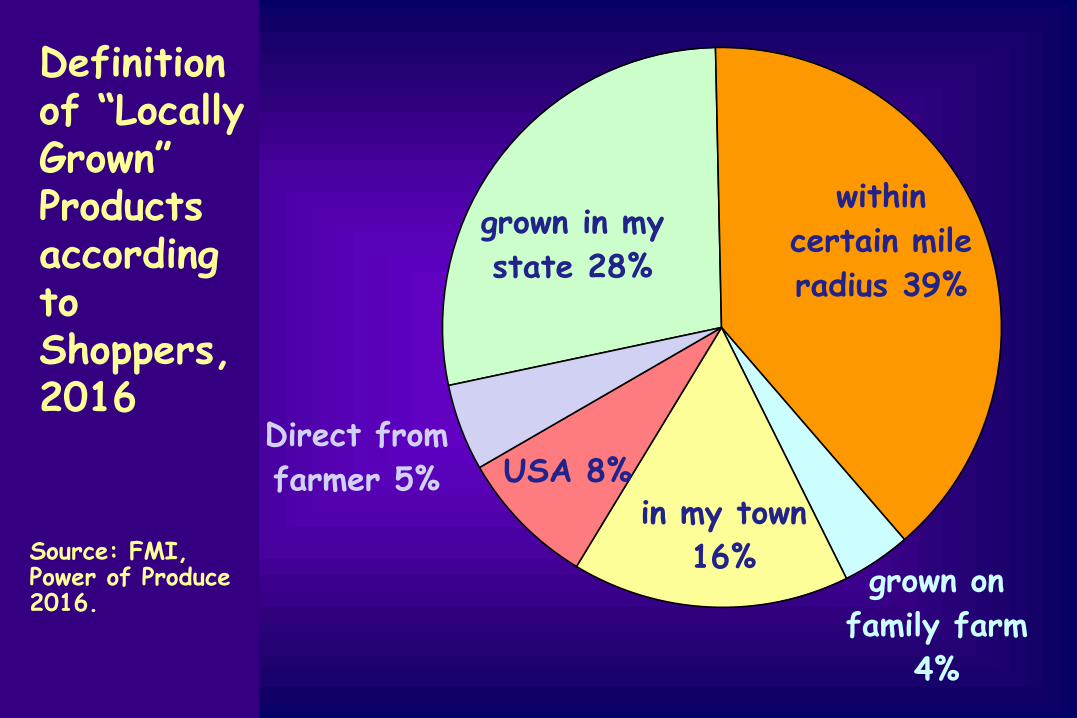
grown in my
state 28%
within
certain mile
radius 39%
grown on
in my town
16%
USA 8%
Definition of “Locally Grown” Products according to Shoppers, 2016
Direct from farmer 5%
Source: FMI, Power of Produce 2016.
family farm
4%
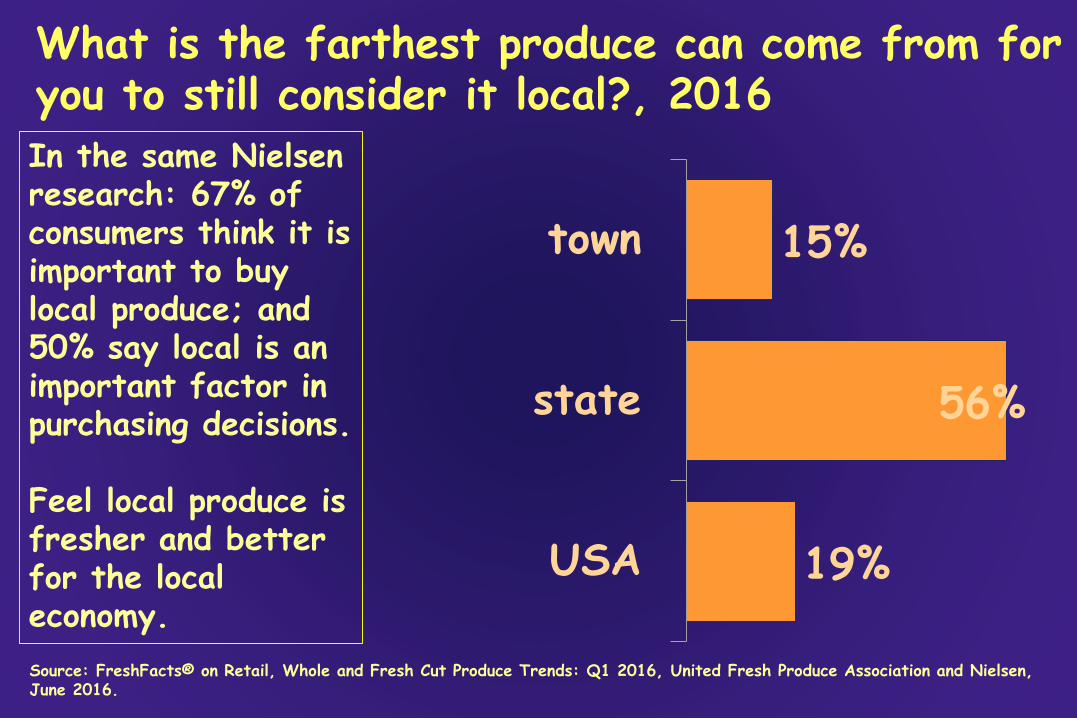
What is the farthest produce can come from for you to still consider it local?, 2016
In the same Nielsen research: 67% of consumers think it is important to buy local produce; and 50% say local is an important factor in purchasing decisions.
Feel local produce is fresher and better for the local economy.
town
state
USA
15%
56%
19%
Source: FreshFacts® on Retail, Whole and Fresh Cut Produce Trends: Q1 2016, United Fresh Produce Association and Nielsen, June 2016.
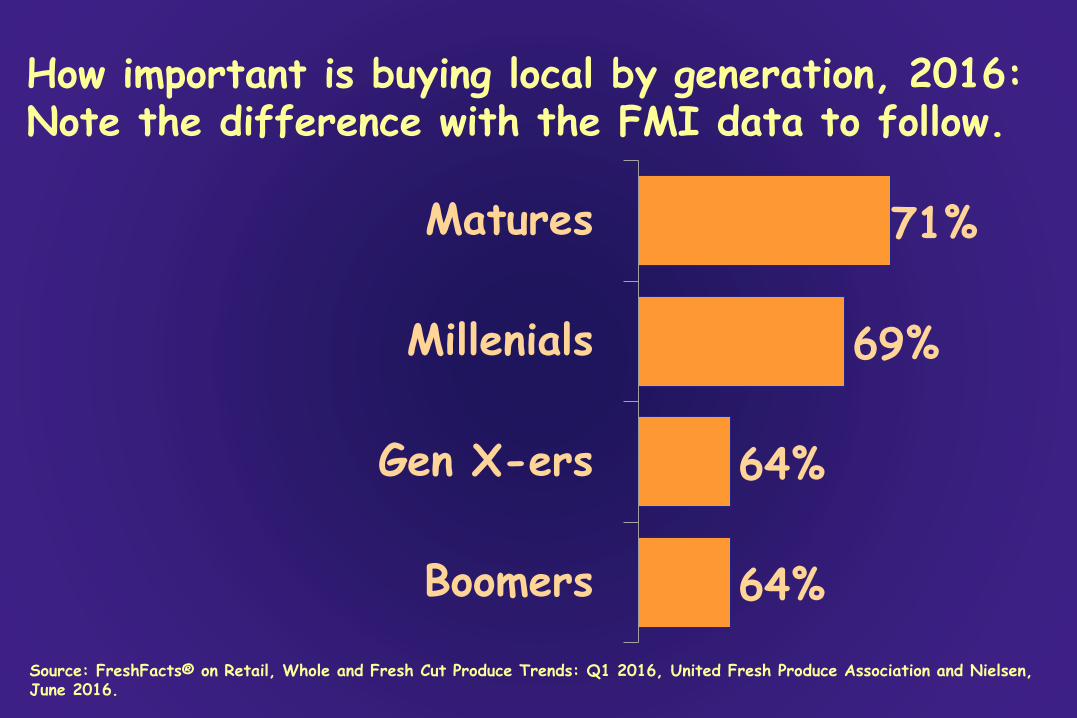
How important is buying local by generation, 2016: Note the difference with the FMI data to follow.
Matures 71%
Millenials 69%
Gen X-ers 64%
Boomers 64%
Source: FreshFacts® on Retail, Whole and Fresh Cut Produce Trends: Q1 2016, United Fresh Produce Association and Nielsen, June 2016.
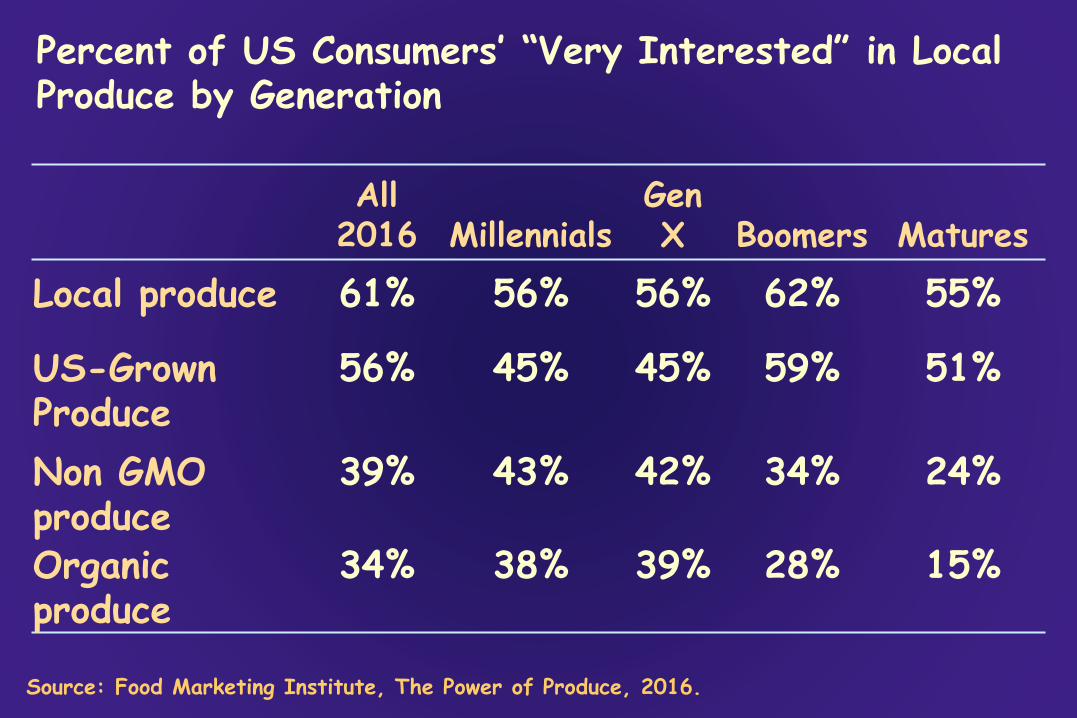
Percent of US Consumers’ “Very Interested” in Local Produce by Generation
All Gen 2016 Millennials X Boomers Matures
61% 56% 56% 62% 55%
56% 45% 45% 59% 51%
39% 43% 42% 34% 24%
34% 38% 39% 28% 15%
Local produce
US-Grown Produce
Non GMO produce Organic produce
Source: Food Marketing Institute, The Power of Produce, 2016.
Conclusions
• Channel blurring will continue to have major impact.
• Consumer demand for convenience, health and wellness should
drive further expansion in fresh-cut sales.
• New product innovation is key as consumers seek more
interesting ingredients and flavors.
• Processors will be selling more products and pack sizes,
making cost control more of a challenge.
• Fresh-cut leads in category development (in the produce
dept) but there is still great potential to improve store level
assortments “right sizing,” pricing and promo, reducing
shrink; helps maintain margins.
• The complexity of doing business will continue to
Conclusions
• Ongoing margin squeeze means that firms must
become more efficient. Information technology will
play a growing role.
• Future growth rate of freshcut depends partly on
success of foodservice in adding healthy menu
options. Labor constraints favorable to freshcut.
• Snacking trend will stimulate small pack sizes in
both retail and foodservice.
• New marketing channels may expand fresh-cut
sales, such as c-stores, dollar stores, drug stores
and e-commerce.