frequency response characteristic survey training … 200718 reliability based...frequency response...
TRANSCRIPT

Frequency Response Characteristic Survey Training Document Training Document Subsections A. Frequency Response
Frequency Response Characteristic Response to Internal and External Generation/Load Imbalances Frequency Bias versus Frequency Response Characteristic (FRC) Effects of a Disturbance on all CONTROL AREAS External to the Contingent CONTROL AREA Effects of a Disturbance on the Contingent CONTROL AREA
B. Survey Procedures C . Survey Review This document includes the purpose and description of the Frequency Response Characteristic (FRC) Survey, describes the complete survey procedure including specific instructions to complete the survey form and discusses the use of survey results. A. Frequency Response [Appendix 1A – The Area Control Error Equation]
Frequency Response Characteristic Surveys are conducted to determine the frequency response characteristic of a control area. Accurate measurement of system response is difficult unless the frequency deviation resulting from a system disturbance is significant. Therefore, surveys are usually requested when significant frequency deviations occur.
Disturbances can cause the frequency to increase from loss of load or decrease from loss of generation. Frequency Response Surveys may be requested for either event.
1. Frequency Response Characteristic. For any change in generation/load balance in the
INTERCONNECTION, a frequency change occurs. Each CONTROL AREA in the INTERCONNECTION will respond to this frequency change through:
• A load change that is proportional to the frequency change due to the load’s frequency
response characteristic,1 and • A generation change that is inverse to the frequency change due to turbine governor
action. The net effect of these two actions is the CONTROL AREA’S response to the frequency change, that is, its frequency response characteristic. The combined response of all CONTROL AREAS in the INTERCONNECTION will cause the INTERCONNECTION frequency to settle at some value different from the pre-disturbance value. It will not return frequency to the pre-disturbance value because of the turbine governor droop characteristic. Frequency will remain different until the CONTROL AREA with the generation/load imbalance (referred to as the “Αcontingent CONTROL AREA”) corrects that imbalance, thus returning the INTERCONNECTION frequency to its pre-disturbance value.
2. Response to Internal and External Generation/Load Imbalances. Most of a CONTROL
AREA’S frequency response will be reflected in a change in its actual net interchange. By 1Rotating (motor) and inductive loads are the predominating factor. Resistive loads do not change with changing frequency.
FRC–1 January 1, 1989
Frequency Response Characteristic Survey Training Document A. Frequency Response
FRC–2 January 1, 1989
monitoring the frequency error (the difference between actual and scheduled frequency) and the difference between actual and scheduled interchange and by using its response to frequency deviation, a CONTROL AREA’S automatic generation control (AGC) can determine whether the imbalance in load and generation is internal or external to its system. If internal, the CONTROL AREA’S AGC should correct the imbalance. If external, the CONTROL AREA’S AGC should allow its generator governors to continue responding through its frequency bias contribution until the contingent CONTROL AREA corrects its imbalance, which should return frequency to its pre-disturbance value.
3. Frequency Bias versus Frequency Response Characteristic (FRC). The CONTROL AREA
should set its bias to match its FRC. In doing so, the CONTROL AREA’S bias would exactly offset the tie line flow error (NiA – NiS) of the ACE that results from governor action following a frequency deviation on the INTERCONNECTION. The following sections 4 and 5 discuss the effects of bias on control action and explain the importance of setting the bias equal to the CONTROL AREA’S FRC. The discussion explains the control action on all CONTROL AREAS external to the contingent CONTROL AREA (the CONTROL AREA that experienced the sudden generation/load imbalance) and on the contingent CONTROL AREA itself. While this discussion deals with loss of generation, it applies equally to loss of load, or any sudden contingency resulting in a generation/load mismatch. Each CONTROL AREA’S frequency response will vary with each disturbance because generation and load characteristics change continuously. This discussion also assumes that the frequency error from 60 Hz was zero (all ACE values were zero) just prior to the sudden generation/load imbalance.
For an explanation of the ACE equation, refer to the Area Interchange Error Training Document.
4. Effects of a Disturbance on all CONTROL AREAS External to the Contingent CONTROL
AREA. When a loss of generation occurs, an INTERCONNECTION frequency error will occur as rotating kinetic energy from the generators is expended2. All CONTROL AREAS’ generator governors will respond to the frequency error and increase the output of their generators accordingly. This will cause a change in the CONTROL AREAS’ actual net interchange. In other words, NiA will be greater than NiS for all but the contingent CONTROL AREA, and the result will be a positive flow out of the non-contingent CONTROL AREAS.
If the CONTROL AREAS were using only tie line flow error (i.e., flat tie control ignoring the frequency error), this non-zero ACE would cause their AGC to reduce generation until NiA was equal to NiS; ACE would then be zero. However, doing this would not help arrest INTERCONNECTION frequency decline because the control areas would not be helping to temporarily replace some of the generation deficiency in the INTERCONNECTION. With the tie-line bias method, the CONTROL AREAS’ AGC should allow their governors to continue responding to the frequency deviation until the contingent control area replaces the generation it lost. The resulting tie flow error (NiA – NiS) will be counted as INADVERTENT INTERCHANGE. In order for the AGC to allow governor action to continue helping in this way, a frequency bias is added to the tie flow error in the ACE equation. This bias is equal in magnitude and opposite in direction to the governor action and should be exactly equal to each CONTROL AREA’S frequency response characteristic measured in MW/0.1 Hz. Then, when multiplied by the frequency error, the bias should exactly counteract the tie flow error portion of the ACE calculation.
2An amount of kinetic energy proportional to the power (generation) lost will be withdrawn from the stored energy in the generator rotors throughout the Interconnection. Thus, Interconnection frequency decreases proportionally.

Frequency Response Characteristic Survey Training Document A. Frequency Response
FRC–3 January 1, 1989
In other words, bias contribution = 10β(fAΒfS). ACE will be zero, and AGC will not readjust generation.
The ACE equation now becomes:
)f-f(10 - )Ni-Ni( = ACE SASA β
If the bias setting is greater than the CONTROL AREA’S actual frequency response characteristic, then its AGC will increase generation beyond the governor response, which further helps arrest the frequency decline, but increases INADVERTENT INTERCHANGE. Likewise, if the bias setting is less than the actual FRC, its AGC will reduce generation, reducing the CONTROL AREA’S contribution to arresting the frequency change. In both cases, the control action is unwanted.
5. Effects of a Disturbance on the Contingent CONTROL AREA. In the contingent CONTROL
AREA where the generation deficiency occurred, most of the replacement power comes from the INTERCONNECTION over its tie lines from the frequency bias contributions of the other CONTROL AREAS in the INTERCONNECTION. A small portion will be made up internally from the contingent CONTROL AREA’S own governor response (bias contribution). In this case, the difference between NiA and NiS for the contingent CONTROL AREA is much greater than its frequency bias component. Its ACE will be negative, and its AGC will begin to increase generation. The contingent CONTROL AREA must take appropriate steps to reduce its ACE to zero within ten minutes of the contingency. (Reference: Operating Criterion II.A.) The energy supplied from the INTERCONNECTION is posted to the contingent CONTROL AREA’S inadvertent balance, and must be paid back.
Frequency Response Characteristic Survey Training Document
FRC–4 January 1, 1989
B. Survey Procedures
Frequency Response Characteristic Surveys will be conducted to compare each CONTROL AREA’S FRC with respect to its bias setting.
1. Issuance of Survey
Surveys will be conducted for periods selected by the chairman or vice chairman of the Resources Subcommittee or designee, on the chairman’s or vice chairman’s own motion, or in response to specific requests from members of the Subcommittee.
• As soon as possible after the survey period is chosen by the chairman, the chairman or
vice chairman shall notify each appropriate Subcommittee member by letter of the survey date and time, the frequency points A, B, and C, frequency deviation, and date for the survey to be returned.
• Each Subcommittee member shall notify each reporting CONTROL AREA within the Region by written request. The Subcommittee member shall provide each CONTROL AREA a copy of the survey form “NERC Frequency Response Characteristic Survey.”
• Each reporting control area shall return one completed copy of the survey form and a
copy of its frequency chart. • Each Subcommittee member shall review the appropriate control area results and send
the copies of survey form results to the NERC staff. • The NERC staff shall combine the control area data into one report and send one copy to
each Subcommittee member. • Each Subcommittee member shall be responsible for reproducing and distributing the
summary report within their Region. 2. Instructions for FRC Survey
The table is the Control Area Frequency Response Characteristic Survey form.
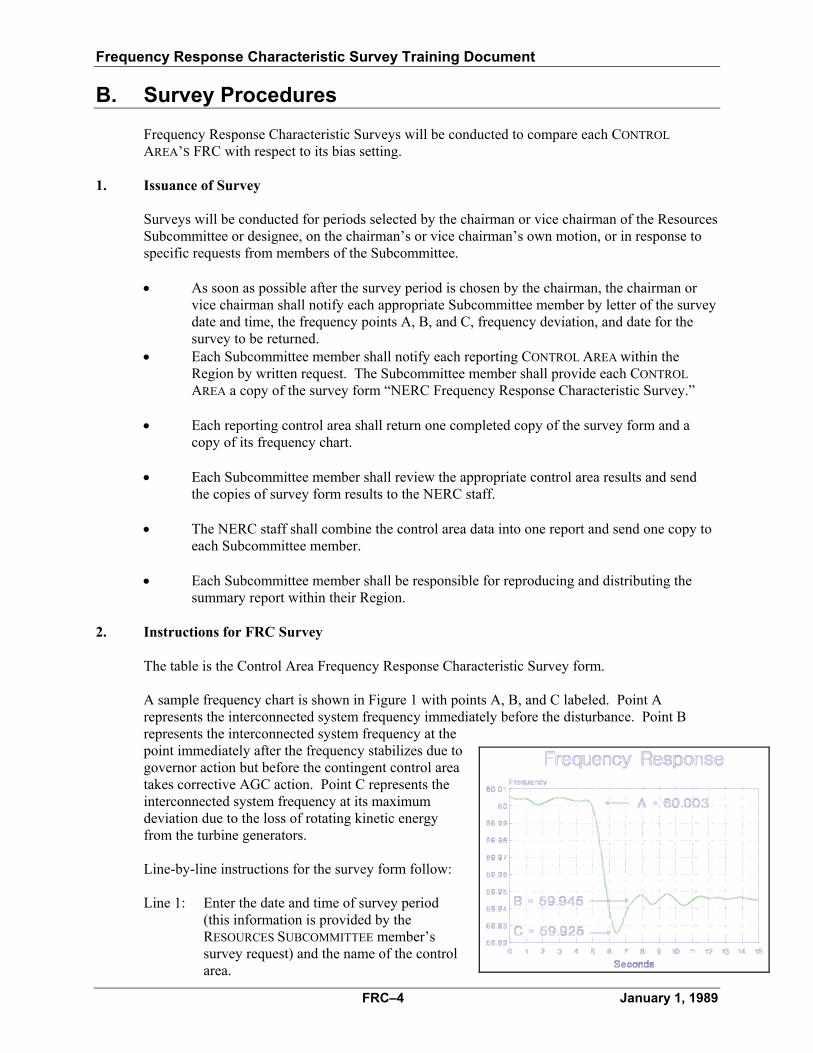
A sample frequency chart is shown in Figure 1 with points A, B, and C labeled. Point A represents the interconnected system frequency immediately before the disturbance. Point B represents the interconnected system frequency at the point immediately after the frequency stabilizes due to governor action but before the contingent control area takes corrective AGC action. Point C represents the interconnected system frequency at its maximum deviation due to the loss of rotating kinetic energy from the turbine generators.
Line-by-line instructions for the survey form follow:
Line 1: Enter the date and time of survey period
(this information is provided by the RESOURCES SUBCOMMITTEE member’s survey request) and the name of the control area.

Frequency Response Characteristic Survey Training Document B. Survey Procedures
FRC–5 January 1, 1989
Line 2: Enter the net interchange of the control area immediately before the survey period
(corresponding to Point A). Sign convention for net power into a CONTROL AREA is negative (–), and net power out of a control area is positive (+).
Line 3: Enter the net interchange of the control area immediately after the survey period
(corresponding to Point B). Use the same sign convention as Line 2. A Line 4: Enter the change in net interchange of the CONTROL AREA. Line 4 = Line 3 – Line 2.
For a disturbance that causes the frequency to decrease, this value should be positive except for the contingent CONTROL AREA, in which case it is negative.
Line 5: If the control area completing the survey suffered the loss, enter the load or generation
lost by the control area. Otherwise, leave this line blank. Sign convention for generation loss is negative (−) and for load loss is positive (+).
Line 6: Enter the control area response. This value is (Line 4 – Line 5).
Line 7: Enter the change in interconnected system frequency as specified in the letter of
transmittal.
Line 8: Enter the frequency response characteristic of the CONTROL AREA based on the change in interconnected system frequency. This value is:
)10.07(6
LineLine = FRC
(The factor of 10.0 is used to change the units to MW/0.1 Hz.) This value approximates the frequency response of the control area for this disturbance.
Line 9: Enter the frequency bias setting of the CONTROL AREA.
Line 10: Enter the CONTROL AREA’S net system load immediately before the disturbance.
Line 11: Enter the CONTROL AREA’S total capacity synchronized to the INTERCONNECTION
immediately before the disturbance. Jointly owned units should be reported in their entirety by the CONTROL AREA in which they are located.
Lines 12, 13, and 14:
Enter the frequency values you observed from the frequency chart for Points A, B, and C, respectively.
Frequency Response Characteristic Survey Training Document
FRC–6 January 1, 1989
C. Survey Review
Each NERC RESOURCES SUBCOMMITTEE member shall analyze the survey results of the CONTROL AREAS within their Region. The survey data received on the survey form shall be reviewed for uniformity, completeness, and compliance to the instructions. The NERC Resources Subcommittee will review the total frequency response for the total INTERCONNECTION surveyed to ensure adequate frequency bias exists to maintain the scheduled frequency.

FRC–7 January 1, 1989
North American Electric Reliability Council Frequency Response Characteristic Survey
Form FRC 1
1. Date Hr. Ending (CST/CDT): Control Area:
Region:
AREA FREQUENCY RESPONSE CALCULATION
2: Actual Net Interchange Immediately Before Disturbance (Point A)*
MW
3: Actual Net Interchange Immediately After Disturbance (Point B)*
MW
4: Change in Net Interchange
MW Line 3 − Line 2
5: Load (+) or Generation (Β) Lost Causing the Disturbance
MW
6. Control Area Response
MW Line 4 − Line 5
7. Change in Interconnection Frequency from Point A to Point B
Hz (−) for frequency decrease; (+) for frequency increase
8. Frequency Response Characteristic
MW/0.1 Hz Line 6 /(Line 7 x 10.0)
OTHER INFORMATION
9. Frequency Bias Setting
MW/0.1 Hz
10. Net System Demand Immediately Before Disturbance (Point A)
MW
11. Synchronized Capacity Immediately Before Disturbance (Point A)
MW
12.
Frequency at Point A
Hz
13.
Frequency at Point B
Hz
14.
From your
charts Frequency at Point C
Hz
Notes: Net power delivered out of a control area (over-generation) is positive (+). Net power received into a control area (under-generation) is negative (−). *CONTROL AREAS that have a Net Tie Deviation From Schedule Recorder should obtain these values from that device.