frequency of what: how simple is the story of syntax...
TRANSCRIPT

Frequency of what: How simple is the story of syntax acquisi8on?
Amanda Nili In collabora/on with Lisa Pearl

A Preview • How do we know right from wrong, gramma/cally speaking? • A simple theory of language acquisi/on: how oBen we hear something (a syntac/c structure) determines how correct that structure is • Is the simplest version of this story true? • Looking at child-‐directed speech (because this is a study of acquisi/on) • End result: syntax acquisi/on is not so simple (problems with the kind of frequency)

A Theory of Language Acquisi8on
• Rela/onship between frequency & gramma/cality: If our brains are great computers (i.e., tracking sta/s/cs), they will be able to take in all of the data, analyze the frequency of every structure’s use, then translate that to how acceptable the structure is, right?

Frequency of what?
• Frequency of structure use
Frequency of what?
• S/ll, there are different ways of analyzing frequency: (1) direct reflec/on (simple): we analyze the most surface forms and make
minimal abstrac/on about the structure we hear (2) something more sophis/cated (less simple)
Subject (determiner + singular noun) + present tense intransi7ve verb. This appears 20 /mes. Ex: The pig grunts.
Frequency of what?
“Who” + auxiliary verb + subject (noun phrase) + transi7ve verb? This appears 43 /mes. Ex: Who did Marvin poison?
Frequency of what?
Measuring gramma8cality how? • Gramma/cality of that structure (how gramma/cal na/ve speakers think it is) – oBen assessed by an acceptability score (an average of scores from mul/ple instances of each structure to control for seman/c influence, which we hope reflects gramma/cality in a well-‐controlled experiment)

• These acceptability scores are actually Z-‐scores (ranging from -‐1.19 to +1.13): they test standard devia/on from the mean, and the direc/on of that devia/on
Measuring gramma8cality how?

Subject (determiner + singular noun) + present tense intransi7ve verb. Acceptability score: 0.65. Ex: The pig grunts. Reminder: Structure appears 20 /mes.
Measuring gramma8cality how?
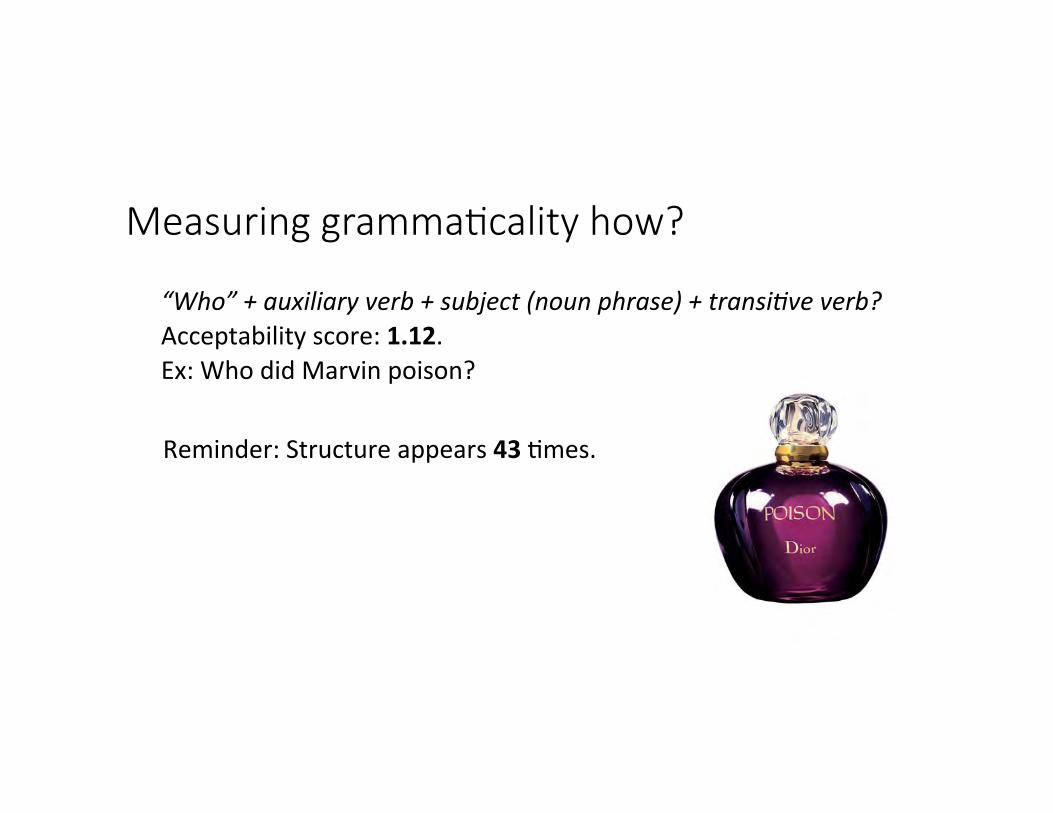
“Who” + auxiliary verb + subject (noun phrase) + transi7ve verb? Acceptability score: 1.12. Ex: Who did Marvin poison?
Reminder: Structure appears 43 /mes.
Measuring gramma8cality how?

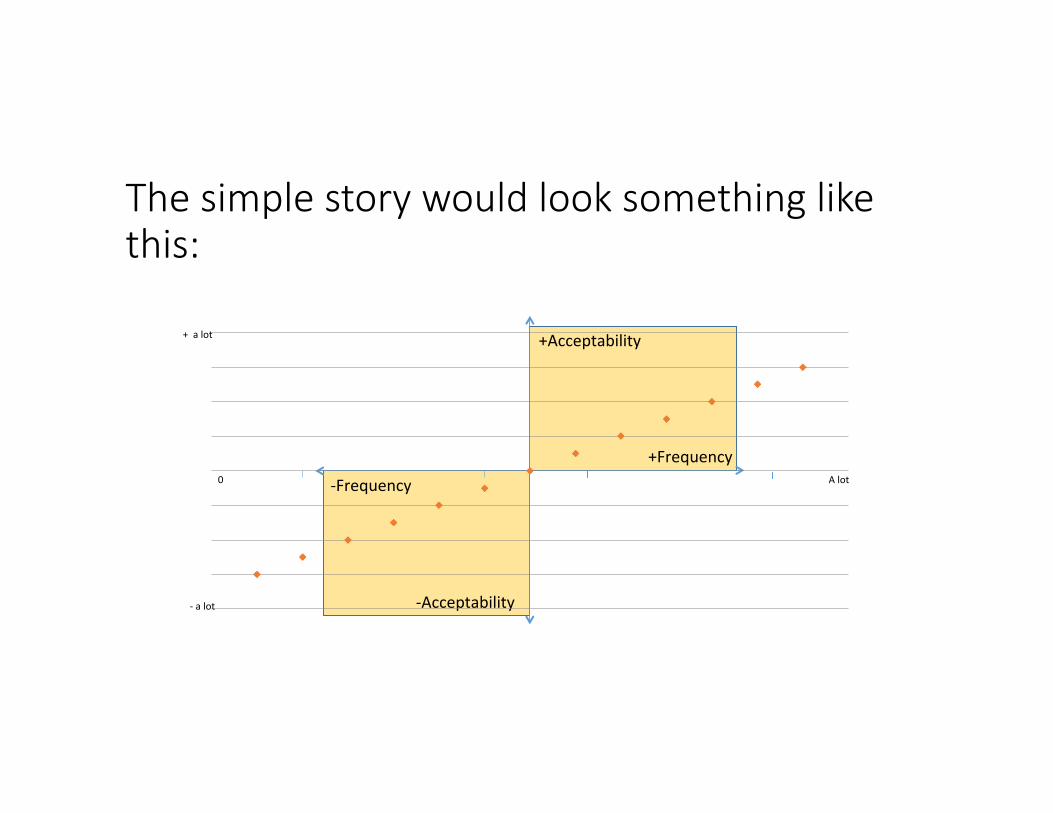
The simple story would look something like this:
+Frequency
+Acceptability
-‐Frequency
-‐Acceptability
+Frequency
+Acceptability
-‐Frequency
-‐Acceptability
The simple story would look something like this:
0 A lot
-‐ a lot
+ a lot
Is the simple story true?
• Previous studies have found a gap: frequency values not matching perfectly (or even well) with acceptability scores • Different explana/ons as to why that gap exists

The “gap” and other problems for the simple story:
+Frequency
+Acceptability
-‐Frequency
-‐Acceptability
Quadrant II
Quadrant IV

Who believes the simple story?
• Kempen and Harbusch (2005): “[Object to findings of a frequency-‐gramma/cality gap on the basis that] … quite a few orderings that are rated at least average to gramma/cal quality also have zero corpus frequencies.” • Bad Method: The simple correla/on is there, it’s just that your naïve na/ve speakers don’t know what they find acceptable and what they don’t, so they’re ra/ng umerances as more acceptable than they actually are!

Actually, the method is fine…
• Sprouse & Almeida (2012): different methods of collec/ng acceptability data accused of unreliability; a comparison of data from all methods shows that’s not the case (all methods are premy convincingly reliable)
Maybe it’s not so simple…
• Jurafsky (2002): “… the mismatch between corpus frequencies and psychological norming studies is to be expected. These are essen/ally two different kinds of produc/on studies, with different constraints on the produc/on process.” • When linguists try to compare these two data sets, they are doing something fundamentally incorrect: we don’t find an r of 1 because, perhaps, acceptability data (from psychological norming studies) are expressive of something more abstract, whereas the frequency data are more concrete

Not so simple: Linear Op8mality Theory
• Keller (2000): the acceptability-‐frequency rela/onship isn’t so straight forward. It’s about how significant a linguis/c constraint (and its viola/on) is.

• Hard constraint: Subject-‐Verb Agreement • Trish has painted a picture of Arthur. • *Trish have painted a picture of Arthur.
• SoB constraint: Definite Ar/cle Use • Which friend has Trish painted a picture of? • *Which friend has Trish painted the picture of?
Not so simple: Linear Op8mality Theory

Really not so simple
• Pearl & Sprouse (2013): these authors make the comparison between frequency and acceptability data. • Frequency of what? Really abstract representa/ons (WH-‐ques/ons). • Find no obvious correla/on at that level of abstrac/on.
[CP Who did [IP she [VP like _]]]?

Note: Pearl & Sprouse’s (in prep.) study of WH-‐ques/ons has found a less-‐than-‐great correla/on between adult-‐directed speech frequencies and gramma/cality (as measured by acceptability).
Really not so simple
-‐1.50
-‐1.00
-‐0.50
0.00
0.50
1.00
1.50
-‐5.5 -‐5 -‐4.5 -‐4 -‐3.5
'Frequency vs Acceptability'

Not found (by Pearl & Sprouse):
+Frequency
+Acceptability
-‐Frequency
-‐Acceptability
0 A lot
-‐ a lot
+ a lot

What about child-‐directed speech?
(1) Important for understanding how we learn to have these gramma/cality intui/ons. (2) Known differences at various levels between child-‐directed and adult-‐directed speech (e.g. motherese). Maybe there’s a significant difference at the structural level, when looking at less abstract things. (OBen there is a difference for sound distribu/ons, words, and simple structures. Although Pearl & Sprouse find it does not apply for wh-‐dependencies).

Acceptability Data
• Collected by Sprouse & Almeida (2012), using umerances in the Adger’s Core Syntax textbook for linguis/cs students • Scores assigned by naïve na/ve speakers using mul/ple data-‐collec/on methods
• Each structure presented mul/ple /mes, using different words: • Collected averages of the mul/ple itera/ons => one averaged score per structure
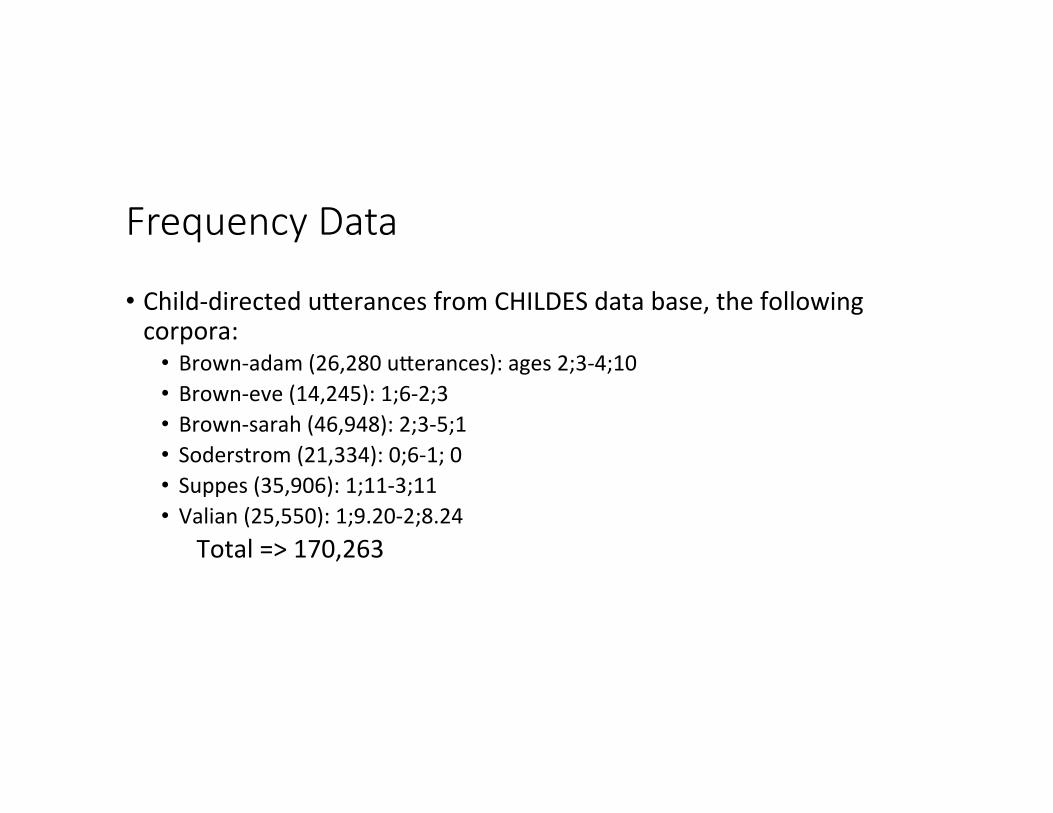
Frequency Data
• Child-‐directed umerances from CHILDES data base, the following corpora: • Brown-‐adam (26,280 umerances): ages 2;3-‐4;10 • Brown-‐eve (14,245): 1;6-‐2;3 • Brown-‐sarah (46,948): 2;3-‐5;1 • Soderstrom (21,334): 0;6-‐1; 0 • Suppes (35,906): 1;11-‐3;11 • Valian (25,550): 1;9.20-‐2;8.24
Total => 170,263

+Frequency
+Acceptability
-‐Frequency
-‐Acceptability
Frequency values are nega/ve because the normalized values are very small numbers, so each is the log10 of the calculated frequency. For example: “The pig grunts.” Appears 20 /mes, has a frequency score of 0.000117465, which we take log10 of, to get the more easily graphed (nega/ve) value of -‐3.930090286.

The expecta8on:
+Frequency
+Acceptability
-‐Frequency
-‐Acceptability
0 A lot
-‐ a lot
+ a lot

r = 1
Not Pictured:
Frequency values are nega/ve because they are log10
r = 0.509 -‐1.50
-‐1.00
-‐0.50
0.00
0.50
1.00
1.50
-‐6 -‐5.5 -‐5 -‐4.5 -‐4 -‐3.5 -‐3
Frequency v Acceptability

• Comparing Sprouse & Almeida’s 2012 study of acceptability scores [of 219 structures] rated by naïve na/ve speakers with the actual frequency of umerance appearance in the CHILDES corpora (using child-‐directed speech only) results in some ques/onable data:
+Frequency
+Acceptability
-‐Frequency
-‐Acceptability
Quadrant II
Quadrant IV
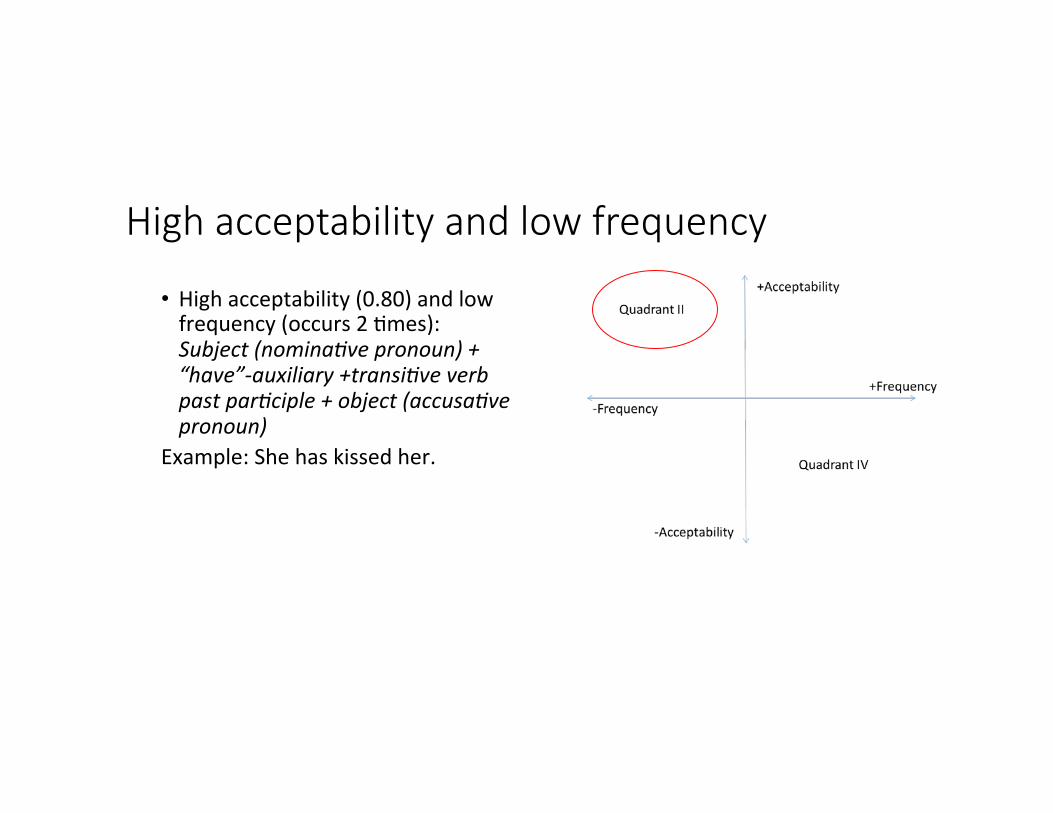
High acceptability and low frequency
• High acceptability (0.80) and low frequency (occurs 2 /mes): Subject (nomina7ve pronoun) + “have”-‐auxiliary +transi7ve verb past par7ciple + object (accusa7ve pronoun)
Example: She has kissed her.

Low acceptability and existent frequency • Low acceptability (-‐0.09) and existent frequency (occurs 7 /mes): NP = [singular count noun with no determiner] + verb + PP, nothing aJer
Example: *Lemer is on the table. • Consider that a high acceptability umerance (“Joss’s idea is brilliant”) has the same raw frequency score, but an acceptability score of 1.07.

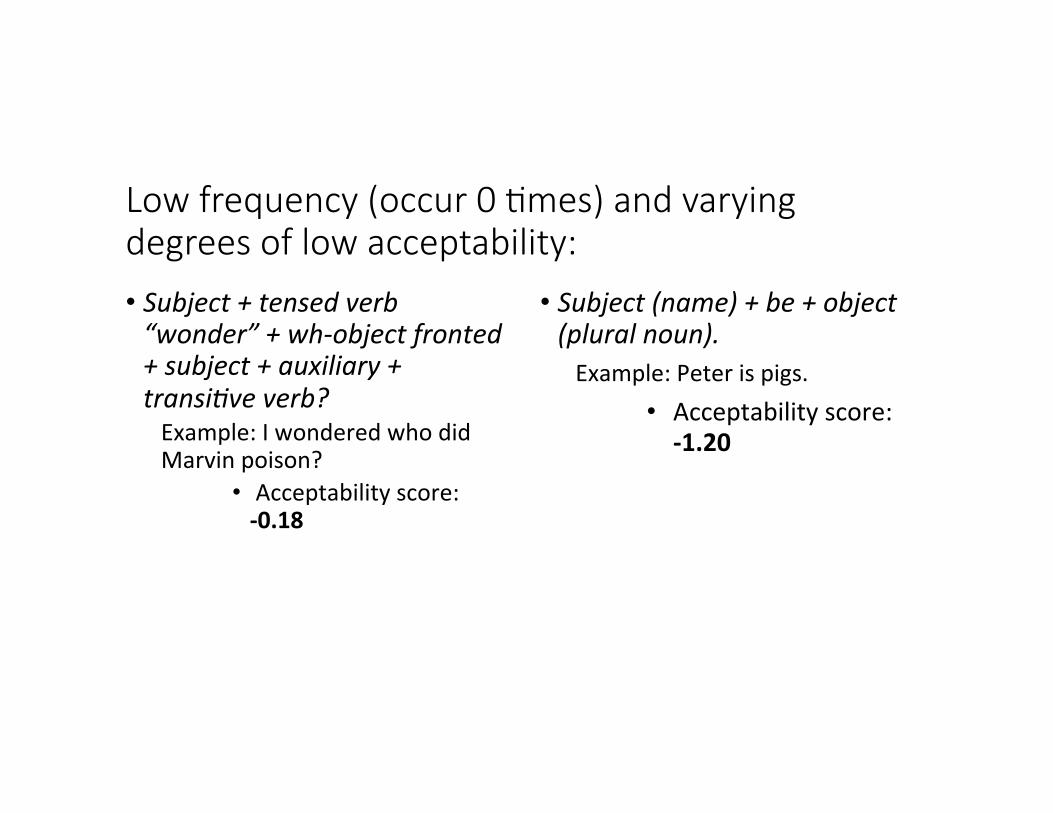
Low frequency (occur 0 8mes) and varying degrees of low acceptability:
Low frequency (occur 0 8mes) and varying degrees of low acceptability:
• Subject + tensed verb “wonder” + wh-‐object fronted + subject + auxiliary + transi7ve verb? Example: I wondered who did Marvin poison?
• Acceptability score: -‐0.18
• Subject (name) + be + object (plural noun). Example: Peter is pigs.
• Acceptability score: -‐1.20
The data suggest:
• Frequency of simple structures is NOT the only factor to determine how acceptable structures are to na/ve speakers • (Not the simple version)
• Child-‐judgment data • The different levels at which we study frequency
Future direc8ons for research:
Future direc8ons for research: Child judgment data • Children learning a first language very likely don’t perceive that language the same way adults do, but we compare frequency of linguis/c input against adult judgment data – this may not be telling us enough about how children learn what’s acceptable and what’s not

Future direc8ons for research: Different kinds of frequency • Frequency of what? • Different levels of abstrac/on may be necessary for the different kinds of unacceptable umerances
• Example: “The book ran.” v “The thief ran.” • We accounted for seman/c category viola/ons such as “The book ran.” However…
• Consider: some of the umerances may show correla/on between frequency and acceptability, because less abstract level of comparison is appropriate—other umerances may require something more abstract in order to correlate their acceptability scores with their frequencies.

About that ques8on…
• Can we account for syntax acquisi/on with a simple story, or do we need something more sophis/cated (a different understanding of frequency) to make sense of the data?

Frequency of what?:
• We know that base frequencies of structure usage don’t correlate well with acceptability judgment data • This could be because base frequencies are only part of the story • Future research should focus on the frequency of what: determining how abstracted our informa/on about syntax is
“The penguins.” DT NNS NP DT-‐bird NP-‐animate
A special thanks to: • Lisa Pearl • The Computa/on of Language Laboratory • UROP