freight on road: why eu shippers prefer truck to train
TRANSCRIPT


DIRECTORATE GENERAL FOR INTERNAL POLICIES
POLICY DEPARTMENT B: STRUCTURAL AND COHESION POLICIES
TRANSPORT AND TOURISM
FREIGHT ON ROAD: WHY EU SHIPPERSPREFER TRUCK TO TRAIN
STUDY

This document was requested by the European Parliament's Committee on Transport andTourism.
AUTHORS
Steer Davies Gleave - Francesco Dionori, Lorenzo Casullo, Simon Ellis, Davide Ranghetti,Konrad Bablinski, Christoph Vollath, Carl Soutra
RESPONSIBLE ADMINISTRATOR
Marc ThomasPolicy Department Structural and Cohesion PoliciesEuropean ParliamentB-1047 BrusselsE-mail: [email protected]
EDITORIAL ASSISTANCE
Adrienn Borka
LINGUISTIC VERSIONS
Original: EN.
ABOUT THE PUBLISHER
To contact the Policy Department or to subscribe to its monthly newsletter please write to:[email protected]
Manuscript completed in March 2015.© European Union, 2015.
This document is available on the Internet at:http://www.europarl.europa.eu/studies
DISCLAIMER
The opinions expressed in this document are the sole responsibility of the author and donot necessarily represent the official position of the European Parliament.
Reproduction and translation for non-commercial purposes are authorized, provided thesource is acknowledged and the publisher is given prior notice and sent a copy.
DIRECTORATE GENERAL FOR INTERNAL POLICIES
POLICY DEPARTMENT B: STRUCTURAL AND COHESION POLICIES
TRANSPORT AND TOURISM
FREIGHT ON ROAD: WHY EU SHIPPERSPREFER TRUCK TO TRAIN
STUDY
AbstractThis is an assessment of the influences on the transport mode choice of shippersin the EU, highlighting why they often prefer road to rail. Drawing on the analysisof long-term trends of freight transport, a number of national case studies(Germany, Poland, France, Italy and Spain) and interviews with industry actors,the study investigates the main underlying factors driving freight mode choice.The concluding chapter provides recommendations on the key elements of aneffective strategy to incentivise the use of rail, building on the lessons learnt fromprevious policy experience.
IP/B/TRAN/FWC/2010-006/LOT1/C1/SC10 2015
PE 540.338 EN


Freight on road: why EU shippers prefer truck to train____________________________________________________________________________________________
3
CONTENTS
LIST OF ABBREVIATIONS 5
LIST OF TABLES 7
LIST OF FIGURES 7
EXECUTIVE SUMMARY 9
1. OVERVIEW OF THE GENERAL CONTEXT 131.1. Introduction 13
1.2. Trends of modal share of freight transport in the EU 13
2. FACTORS CONTRIBUTING TO SHIPPERS MODE CHOICE 252.1. Introduction 25
2.2. Literature review 25
2.3. Potential for modal shift from road to rail 32
2.4. Evidence from case studies 34
3. EXISTING MEASURES AIMED AT MODE CHOICE 413.1. Introduction 41
3.2. EU level assistance and policies 41
3.3. Member States assistance and policies 44
4. STRATEGIES FOR MODIFYING SHIPPERS’ MODE CHOICE 614.1. Introduction 61
4.2. Prioritising strategies with high policy leverage 61
4.3. The available policy toolkit 63
4.4. The elements of an effective strategy for mode shift 67
REFERENCES 69

Policy Department B: Structural and Cohesion Policies____________________________________________________________________________________________
4

Freight on road: why EU shippers prefer truck to train____________________________________________________________________________________________
5
LIST OF ABBREVIATIONS
ADIF Administrador de Infraestructuras Ferroviarias (Spanish infrastructuremanager)
AFA Autostrada ferroviaria Alpina (rolling highway between Italy and France)
AGTC European Agreement on Important International Combined TransportLines and Related Installations
ARAFAutorité de régulation des activités ferroviaires (French rail regulationauthority)
CEF Connecting Europe Facility
EEA European Environment Agency
ERTMS European Rail Traffic Management System
EU-13 The 13 Member States which joined the European Union since 2004(Bulgaria, Croatia, Cyprus, Czech Republic, Estonia, Hungary, Latvia,Lithuania, Malta, Poland, Romania, Slovakia, Slovenia).
EU-15 The 15 Member States of the European Union before the EU-13 joinedthe EU (Austria, Belgium, Denmark, Finland, France, Germany, Greece,Ireland, Italy, Luxembourg, Netherlands, Portugal, Spain, Sweden,United Kingdom).
FOC Freight Operating Company
FTE Full-time equivalent (unit of measure of workloads)
GDP Gross domestic product
HGV Heavy goods vehicle
LGV Light goods vehicle
MS Member State
OECD Organisation for Economic Co-operation and Development
SNCF Société nationale des chemins de fer français (French national railwaycompany)
TEU Twenty-foot equivalent unit (unit of cargo capacity)
TICPETaxe intérieure de consommation sur les produits énergétiques (Frenchtax on energy products)
TRAN Committee on Transport and Tourism of the European Parliament
TSL Transport – shipping – logistics

Policy Department B: Structural and Cohesion Policies____________________________________________________________________________________________
6

Freight on road: why EU shippers prefer truck to train____________________________________________________________________________________________
7
LIST OF TABLES
Table 1Changes in volume of freight transported, by mode, in billion tkm 14
Table 2Volumes and growth rates of road and rail freight transport in the EU Member States,Switzerland and the US, 2000-2012 (billion tkm) 15
Table 3Summary of research conclusions on modal shift potential 34
Table 4Survey of shippers in Aragon – scores by mode and characteristic 39
Table 5Funding and financing for transport at the EU level 2007-2013 42
Table 6Factors affecting modal choice and respective policy leverage 62
Table 7The elements of an effective strategy for mode shift 67
LIST OF FIGURES
Figure 1Change in the modal shares in freight transport, in % of the volume transported 14
Figure 2Modal share of rail in inland freight transport in the EU-15, 2000-2012 16
Figure 3Modal share of rail in inland freight transport in the EU-13, 2000-2012 17
Figure 4Change in volumes of freight transported by mode, 2000-2012 18
Figure 5Modal share of inland transport by MS (based on tonne-km), 2012 18
Figure 6Railway freight transport, by type of transport and MS 19
Figure 7Total freight transported in the EU-28 (ordered by commodity category), 2012 20
Figure 8Modal share by commodity category (based on tonne-km) in the EU-28, 2012 20
Figure 9Distribution of transport modes by good type in France, 2014 21

Policy Department B: Structural and Cohesion Policies____________________________________________________________________________________________
8
Figure 10Evolution of good types transported by rail in the UK, 1998-2012 21
Figure 11Volume of rail freight transport relative to GDP by country, indexes 22
Figure 12Micro-based approach to freight transport modal choice: a simplified framework 26
Figure 13Index of road and rail freight against industrial production, 1995-2012 30
Figure 14Factors impacting on modal choice in France 35
Figure 15Importance of selected barriers to growth of the intermodal transport market, in theopinion of Polish Freight Operating Companies 38
Figure 16Shippers’ preferences in Spain – average scores for road and rail transport 39
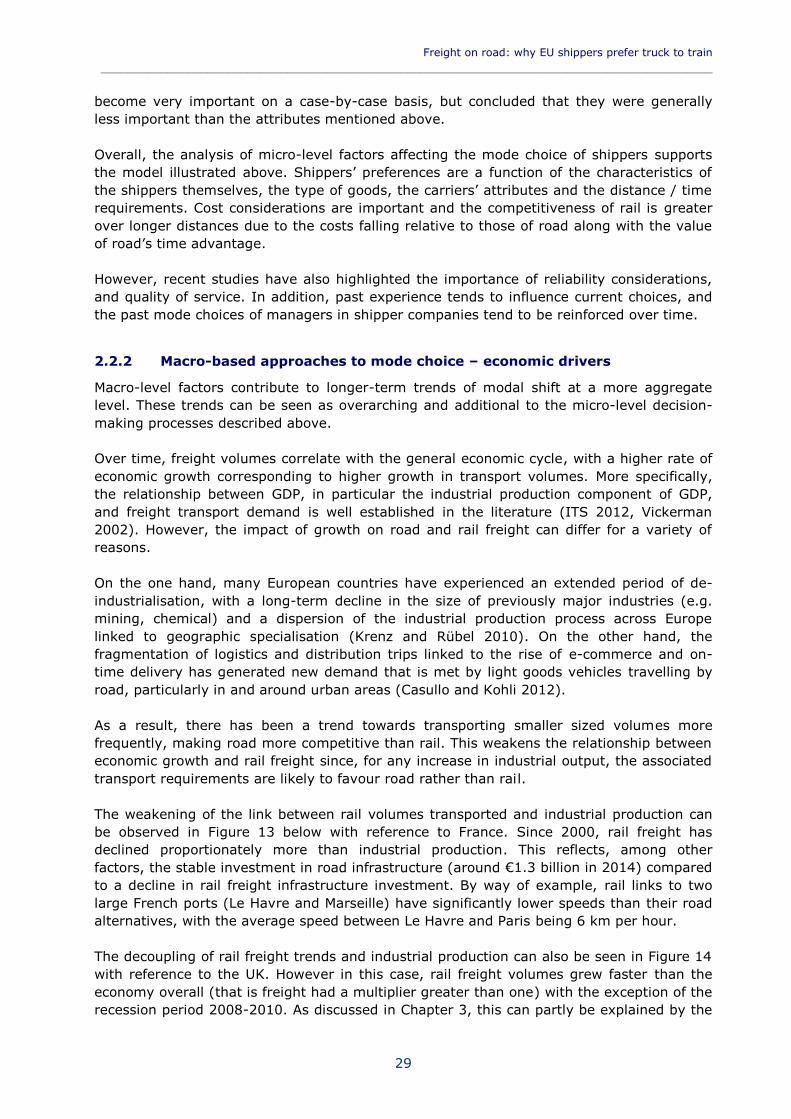
Figure 17Evolution of the number of private sidings in Germany 47
Figure 18Total expenditure in road infrastructure in Spain 55
Figure 19Policy measures in a selection of Member States 58
Figure 20Annual growth rates of rail modal share in inland freight transport 58
Figure 21TEN-T Core network corridors 65

Freight on road: why EU shippers prefer truck to train____________________________________________________________________________________________
9
EXECUTIVE SUMMARY
STRUCTURE OF THIS STUDY
This study provides an assessment of the influences on the transport mode choice of EUfreight shippers, highlighting why they often prefer road to rail. The assessment is informedby four analytical components.
First, the main trends in road and rail freight transport volumes are analysed. Historicaltrends are observed across different geographies (EU Member States, and Switzerland andthe US for comparison purposes), and across different commodity types. The data analysissection is presented in Chapter 1.
Chapter 2 presents the main findings of the second component, namely a review of theliterature on the factors contributing to shippers’ mode choice. This chapter also assessesthe potential for mode shift from road to rail in the EU, based on a number of studies.
In Chapter 3, we review the existing policy measures for achieving mode shift, both at theEU and at Member State level. Insights from five case studies (covering France, Germany,Italy, Poland and Spain) inform both Chapter 2 and Chapter 3.
Chapter 4 provides recommendations on the key elements of an effective strategy toincentivise the use of rail freight, building on the lessons learnt from previous policyexperience both at the EU level and nationally.
TRENDS IN ROAD AND RAIL FREIGHT
On average, rail freight transport has experienced low levels of absolute growth across theEU since 2000. In relative terms, the share of rail freight has declined at the expense ofroad freight. The average trend masks substantial differences between Member States,with some experiencing strong growth in rail freight volumes (e.g. Germany and the BalticMember States) and others experiencing a sharp decline (e.g. France, Bulgaria andSlovakia).
National trends depend on a number of factors, including the extent of railway networks,the proportion of international traffic in total traffic and the extent of competition fromother modes (e.g. inland waterways). The share of freight carried by road and rail variesgreatly depending on the type of goods transported. Heavy bulk transport (such as coal) ispredominantly transported by rail, whereas goods that are lighter and/or more perishableare transported by road.
FACTORS CONTRIBUTING TO SHIPPERS MODE CHOICE
In between the extreme cases of goods that are almost always carried by rail and thosemost likely to be transported by road, a number of micro-level factors influence modechoice. Decisions made by shippers (the key decision makers in this process) are a functionof the characteristics of past experience, the type of goods carried, the carriers’ attributesand distance/time requirements.

Policy Department B: Structural and Cohesion Policies____________________________________________________________________________________________
10
In addition, some overarching and structural factors also contribute to long-term changesin modal share. These include the relationship between economic growth and freighttransport, with road generally more responsive to changes in the economic cycle than rail.Changes in the industrial production process and the fragmentation of logistics havenegatively affected rail freight; new forms of intermodal transport conversely represent ahigh-growth market segment for rail.
Evidence about shippers’ preferences from national case studies points to the importance ofcost considerations in some countries where rail freight is perceived to be too expensive(France, Italy). More broadly, the need for high-quality and better connected railinfrastructure is demonstrated by all case studies, with a focus on bottlenecks (Germany),capacity (Italy, France) and reliability (Spain, Poland).
Various studies have assessed the potential shift from road to rail or intermodal services;estimates of the shift range from 1 to 14 percentage points. The literature also points to athreshold of 200-300km above which rail is particularly competitive and the potential formodal shift is higher. A realistic overall target for the share of freight carried by rail in theEU could be, in the medium term, around 20% of all inland transport volumes, measured interms of tonne-km.
EXISTING MEASURES AIMED AT MODE CHOICE
A number of initiatives targeted at modal shift from road to rail have been introduced atthe EU level. These include the Eurovignette Directive, introducing road charging based onexternal costs, railway reforms opening freight markets to competition and improvinginteroperability, and programmes for funding investment in intermodal infrastructure andoperations, such as TEN-T and Marco Polo programmes.
In parallel, Member States have implemented a range of measures, including directfinancial support targeted at rail infrastructure development (for instance by providingbetter gauge clearance for heavier trains and reinstating sidings). Taken together,however, national measures have not had a major impact on modal shift. This can beattributed to the generally small scale of the investment in rail and intermodal transportrelative to investment in roads, and to a lack of coordination of rail freight policy initiativesat the EU and national levels. Road charges have been introduced in a number of countries,although the impact on road freight has typically been offset by other measures tending toencourage the use of road transport
The most effective policies appear to have been those targeting intermodal transport,either through targeted subsidies to intermodal operators, or through specific agreementsat key intermodal nodes, with a particular focus on ports, such as in Germany, Spain andthe UK.
STRATEGIES FOR MODIFYING SHIPPERS’ MODE CHOICE
The analysis carried out for this study suggests that active policies to encourage mode shiftcan have an impact on shippers’ choices by targeting the key factors affecting thecompetitiveness of rail freight. These policies encompass both targeted regulatoryincentives and infrastructure investment measures.

Freight on road: why EU shippers prefer truck to train____________________________________________________________________________________________
11
Three main conclusions can be drawn from the lack of effectiveness of past policies, as wellas from the good practices identified by the national case studies:
First, better coordination of strategies at different administrative levels, as wellas across modes, will be critical. Mode shift programmes need to avoid apatchwork approach to monetary incentives. Lessons learnt from each schemeneed to be better shared within the industry. The forthcoming Shift2Rail initiativeshould serve this purpose by focusing on solutions to enhance capacity,consolidate reliability and improve the life cycle of the European rail systems.Coordination of rail and road policies is also needed as any measures affectingthe competitive position of one mode have repercussions on the other.
Second, it is important that mode shift strategies are tailored to the specificcircumstances in which they are implemented. For example the recognition thatlonger-distance, cross-border transport is most likely to shift from road to rail isbeing reflected in the development of EU policies.
Third, the implementation of effective strategies will require stable and sufficientfunding from both the EU and Member States. The Connecting Europe Facility(CEF) will help in this respect by providing substantial resources to co-fund thedevelopment of the TEN-T network and ERTMS. While transport funds are notring-fenced under the new CEF policy, this could incentivise project sponsors tocompete for funding and demonstrate the real value added of each investmentscheme.
More effort will be needed to reverse the trend decline in the mode share of rail freight. Inthe light of future parliamentary debates on the actions to be taken by the EU to affect themode choice of shippers in favour of rail, the above recommendations should be taken intoaccount to ensure that future strategies prioritise pro-rail policies with high leveragepotential, are suitably tailored to the characteristics of national markets, are wellcoordinated across levels of administration and modes, and receive an adequate level offunding.

Policy Department B: Structural and Cohesion Policies____________________________________________________________________________________________
12

Freight on road: why EU shippers prefer truck to train____________________________________________________________________________________________
13
1. OVERVIEW OF THE GENERAL CONTEXT
1.1. Introduction
The share of rail freight in intra-EU transport has been constantly decreasing over recentdecades. Conversely, the share of road freight has been increasing. This general trend hasheld during both periods when the volume of goods transported has increased and periodsof decline in transport activity. It has also continued through periods of strong economicgrowth as well as during economic recession.
From 2000 to 2012, the relative decline of rail freight compared to other modes has beenaccompanied by moderate growth in absolute terms (+0.4%). In addition, the overallfigure for the EU hides some significant differences between Member States: in some, railfreight volumes have grown by more than 15% (e.g. Austria, the Netherlands, Latvia andLithuania), while in others they have declined dramatically (e.g. Ireland). Note also thataround 40% of all freight traffic in the EU took place in Germany and Poland in 2012.
These trends are in sharp contrast to EU policy objectives, which include a target shift of30% from road freight to rail freight for journeys over 300km by 2030, and a shift of over50% by 2050, as set out in the 2011 White Paper on transport1. At the same time, theytend to strengthen the need for other objectives set out in the White Paper, including theremoval of major barriers and bottlenecks through improvements in rail signallingtechnology (European Rail Traffic Management System) and information management. TheEU has also been providing financial incentives to modal shift through the funding andfinancing of specific infrastructure projects and policy initiatives. In particular, the CohesionFund, the European Regional Development Fund, Trans European Transport Network (TEN-T) funding, the Marco Polo and INTERREG Programmes (as well as funds from the variousresearch programmes) have contributed to a number of freight specific projects acrossEurope.
The following chapter examines freight trends in more detail, analysing the variation involumes by mode, geography and type of goods transported, providing context for theremainder of the study in which the reasons for shippers’ preferences for road as opposedto rail are identified and analysed.
1.2. Trends of modal share of freight transport in the EU
The total volume of freight transported in the EU28 rose by over 7% between 2000 and2012, from 3,513 billion to 3,768 billion tonne-km. Volumes and growth rates of freighttransported by road, sea, rail, inland waterways, oil pipelines and air are shown in Table 1.The changes in modal shares between 2000 and 2012 are shown in Figure 1.
1 Roadmap to a Single European Transport Area – Towards a competitive and resource efficient transportsystem (COM(2011)144 final).

Policy Department B: Structural and Cohesion Policies____________________________________________________________________________________________
14
Table 1: Changes in volume of freight transported, by mode, in billion tkm
Freight transport inthe EU
20002 2012 Variation2000/2012
Total tkm (billion) 3513.3 3768.1 +7.3%
Road 1521.6 1692.6 +11.2%
Sea 1322.8 1401.0 +5.9%
Rail 405.5 407.2 +0.4%
Inland Waterway 133.9 150.0 +12.0%
Oil Pipeline 127.1 114.8 -9.7%
Air 2 3 +50%
Figure 1: Change in the modal shares in freight transport, in % of the volumetransported
Source: SDG elaboration on Eurostat data.
Road is the dominant transport mode, its share of total freight transported increasing from43% in 2000 to 45% in 2012. Sea is the second most important mode in freight transport,its share having remained broadly constant at around 37% since 2000. Rail’s share hasbeen substantially lower, at between 10% and 12%, and transport by inland waterway andoil pipeline each accounted for around 3.5% throughout the period.
1.2.1 Analysis of trends by geography
Volumes and growth rates of freight transported by road and rail in the EU Member States– and, for comparison, in Switzerland and the US – are shown in Table 2.
2 Data for 2000 refer to all 28 Member States – thus including also those that joined the EU later on. Source:EU transport in figures Statistical Pocketbook 2014.

Freight on road: why EU shippers prefer truck to train____________________________________________________________________________________________
15
Table 2: Volumes and growth rates of road and rail freight transport in the EUMember States, Switzerland and the US, 2000-2012 (billion tkm)
Road Rail2000 2012 Variation 2000 2012 Variation
EU-28 1,521.6 1692.6 11.2% 405.5 407.2 0.4%
EU-15 1,328.9 1234.5 -7.1% 257.1 263.8 2.6%
EU-13 192.7 458.1 137.7% 148.4 143.3 -3.4%
Austria 35.1 26.1 -25.7% 16.6 19.5 17.5%
Belgium 51.0 32.1 -37.1% 7.7 7.3 -5.1%
Bulgaria 6.4 24.4 280.6% 5.5 2.9 -47.5%
Croatia 2.9 8.6 202.8% 1.8 2.3 30.4%
Cyprus 1.3 0.9 -31.6% - - -
Czech Republic 37.3 51.2 37.3% 17.5 14.3 -18.5%
Denmark 24.0 16.7 -30.6% 2.0 2.3 12.1%
Estonia 3.9 5.8 47.3% 8.1 5.1 -36.7%
Finland 32.0 25.5 -20.4% 10.1 9.3 -8.2%
France 204.0 172.4 -15.5% 57.7 32.6 -43.6%
Germany 280.7 307.0 9.4% 82.7 110.1 33.1%
Greece 29.0 20.8 -28.1% 0.4 0.3 -33.7%
Hungary 19.1 33.7 76.4% 8.8 9.2 4.9%
Ireland 12.3 10.0 -18.7% 0.5 0.1 -81.5%
Italy 184.7 124.0 -32.8% 22.8 20.2 -11.3%
Latvia 4.8 12.2 154.3% 13.3 21.9 64.3%
Lithuania 7.8 23.4 201.8% 8.9 14.2 58.9%
Luxembourg 7.6 8.0 4.5% 0.6 0.2 -61.9%
Malta 0.3 0.3 0.0% - - -
Netherlands 79.6 67.8 -14.8% 4.5 6.2 36.2%
Poland 75.0 222.3 196.4% 54.0 48.9 -9.4%
Portugal 38.9 32.9 -15.4% 2.2 2.4 10.9%
Romania 14.3 29.7 107.6% 16.4 13.5 -17.6%
Slovakia 14.3 29.7 107.1% 11.2 7.6 -32.4%
Slovenia 5.3 15.9 199.8% 2.9 3.5 21.5%
Spain 148.7 199.2 34.0% 11.6 10.0 -14.3%
Sweden 35.6 33.5 -6.0% 19.5 22.0 13.2%
United Kingdom 165.6 158.5 -4.3% 18.1 21.4 18.5%
Switzerland 9.8 13.0 +32.3% 11.1 11.1 -0.2%
USA 1,741.2 2,038.9* +17.1% 2,257.6 2,649.2* +17.3%(*) 2011 data
Source: EU transport in figures statistical pocketbook 2014.
In 2000, the modal share of rail in EU inland freight transport (i.e. including road, rail,inland waterway and oil pipelines and excluding air and maritime transport within the EU)was 18.5%, falling to 15.7% in 2009 as a result of recession but then rising to 17.2% in2012 in response to mild economic recovery in most Member States. However, the
Policy Department B: Structural and Cohesion Policies____________________________________________________________________________________________
16
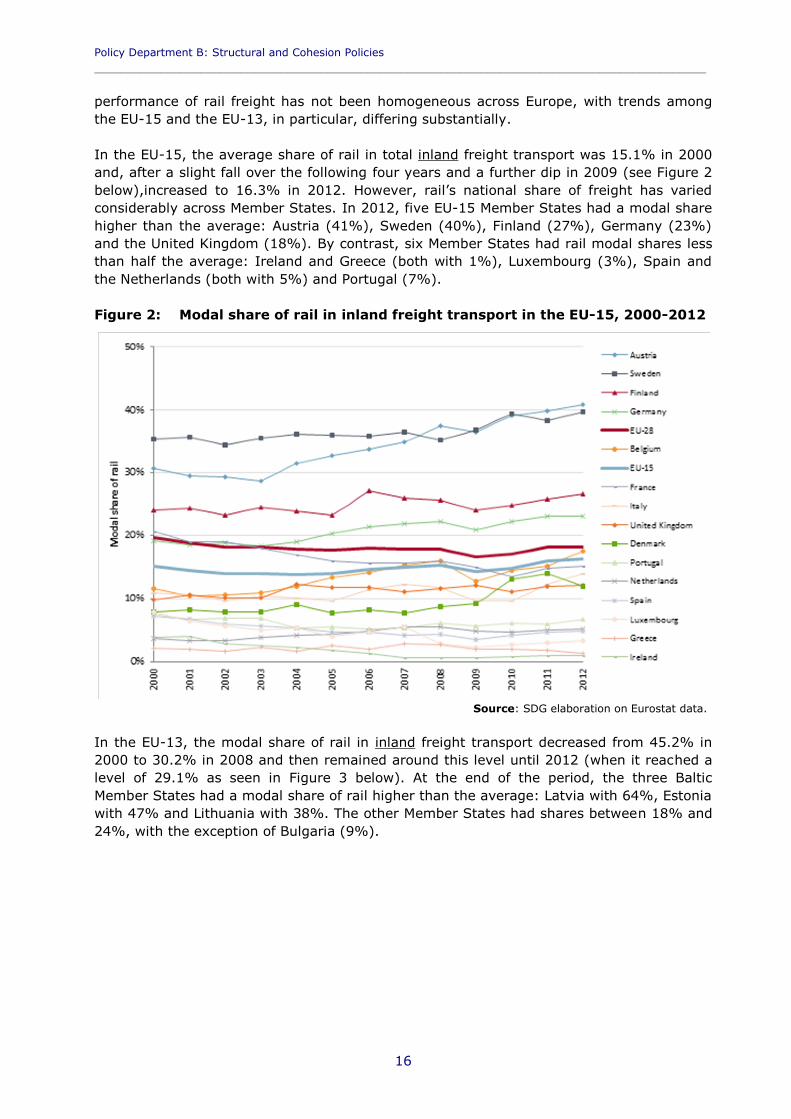
performance of rail freight has not been homogeneous across Europe, with trends amongthe EU-15 and the EU-13, in particular, differing substantially.
In the EU-15, the average share of rail in total inland freight transport was 15.1% in 2000and, after a slight fall over the following four years and a further dip in 2009 (see Figure 2below),increased to 16.3% in 2012. However, rail’s national share of freight has variedconsiderably across Member States. In 2012, five EU-15 Member States had a modal sharehigher than the average: Austria (41%), Sweden (40%), Finland (27%), Germany (23%)and the United Kingdom (18%). By contrast, six Member States had rail modal shares lessthan half the average: Ireland and Greece (both with 1%), Luxembourg (3%), Spain andthe Netherlands (both with 5%) and Portugal (7%).
Figure 2: Modal share of rail in inland freight transport in the EU-15, 2000-2012
Source: SDG elaboration on Eurostat data.
In the EU-13, the modal share of rail in inland freight transport decreased from 45.2% in2000 to 30.2% in 2008 and then remained around this level until 2012 (when it reached alevel of 29.1% as seen in Figure 3 below). At the end of the period, the three BalticMember States had a modal share of rail higher than the average: Latvia with 64%, Estoniawith 47% and Lithuania with 38%. The other Member States had shares between 18% and24%, with the exception of Bulgaria (9%).

Freight on road: why EU shippers prefer truck to train____________________________________________________________________________________________
17
Figure 3: Modal share of rail in inland freight transport in the EU-13, 2000-2012
Source: SDG elaboration on Eurostat data.
Overall, there is a pattern of convergence towards the average share for the EU-28 amongmany of the EU-15 and EU-13 Member States. In particular, the modal share of rail in theEU-13 has fallen significantly and the gap between this value and the average for the EU-28 has decreased correspondingly. As shown in Figure 4, this trend has been mainly drivenby a strong increase in the volume of freight transported by road in the EU-13, which in2012 was 2.4 times the 2000 value. The Member States which have experienced thestrongest growth in road freight transport are Bulgaria (+281%), Croatia (+203%),Lithuania (+202%), Slovenia (+200%), Poland (+196%), Latvia (+154%), Romania(+108%) and Slovakia (+107%). Over the same period, volumes of freight transported byroad in the EU as a whole have grown by 11.2%, and have decreased by 7.1% in the EU-15. Note, however, that tonne-km transported by rail have remained stable (+0.4% in theEU overall, -3.4% in the EU 13 and +2.6% in the EU-15).
A comparison of EU Member States (plus Switzerland) by modal share of inland freighttransport is reported in Figure 5 below. In general, road accounts for almost the entireshare not taken by rail, except in those Member States where inland waterways areimportant. In Cyprus and Malta, which have neither railway networks nor inland waterwaytransport networks, share of road is 100%.

Policy Department B: Structural and Cohesion Policies____________________________________________________________________________________________
18
Figure 4: Change in volumes of freight transported by mode, 2000-2012
Source: SDG elaboration on Eurostat data.
Figure 5: Modal share of inland transport by MS (based on tonne-km), 2012
Source: SDG elaboration on Eurostat data.
The following chart sets out data on rail freight transport by type of transport – domestic,international, and transit transport – and country. In ten Member States, domestic railtransport is higher than the EU average of 55%. In particular, in five countries the share ofdomestic transport is greater than 80%: Ireland (100%), the United Kingdom (98%),Portugal (85%), Romania and Spain (both with 81%). International transport accounts forthe majority of volumes transported in Latvia (90%), Estonia and Luxembourg (both with

Freight on road: why EU shippers prefer truck to train____________________________________________________________________________________________
19
87%), the Netherlands (85%), Greece (84%), Belgium (70%), Slovenia (65%), Croatia andHungary (both with 57%), Lithuania (54%), and Italy (slightly more than 50%).As regards transit transport, it accounts for a significant share in Denmark (85%), Slovakia(41%), Hungary (27%), Austria (25%), Croatia and Lithuania (both with 21%).
Figure 6: Railway freight transport, by type of transport and MS (million tonnekm), 2012
Source: SDG elaboration on Eurostat data.
1.2.2 Analysis of trends by type of goods
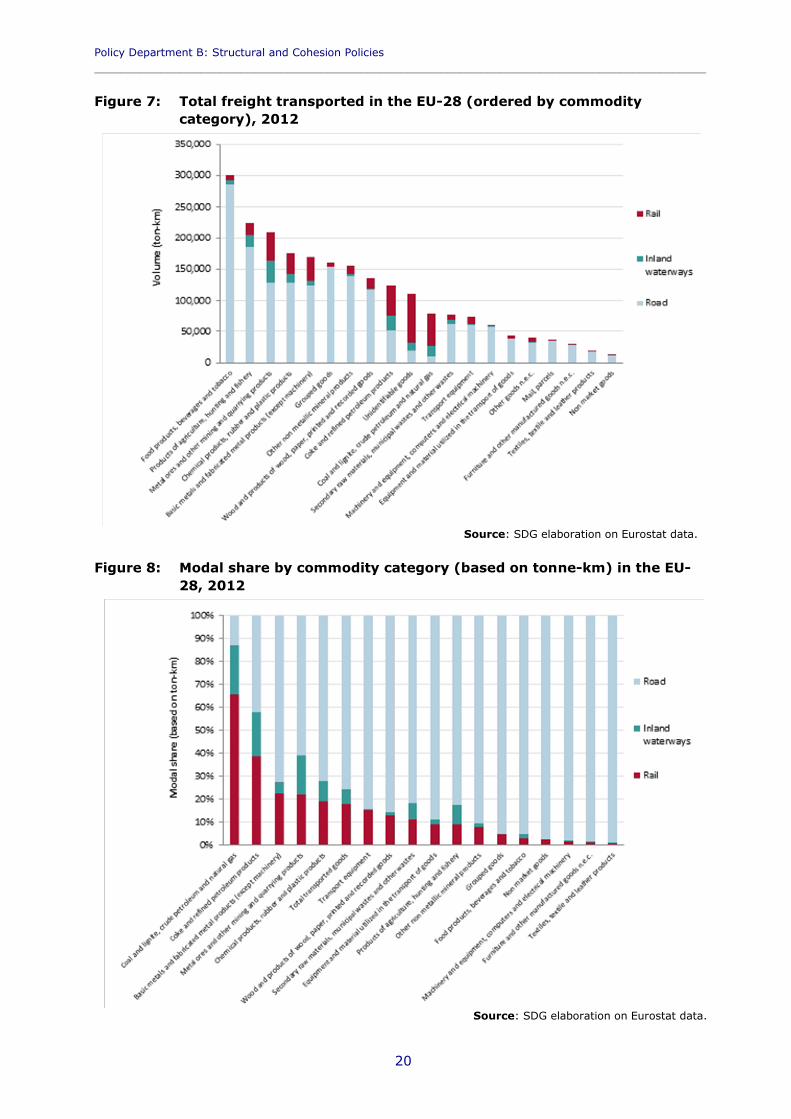
It is useful to categorise the transport of goods by different commodity categories, sincethe choice between rail and road is often linked to the attributes of the goods transported,as discussed further below. Figure 7 shows disaggregated data on inland freight transportin 2012 by commodity category and transport mode. Food and beverages account for thehighest volumes, followed by agricultural products, hunting and fishery, metal ores andother mining/quarrying products, chemical, rubber and plastic products, and basic metalsand metal products.
Policy Department B: Structural and Cohesion Policies____________________________________________________________________________________________
20
Figure 7: Total freight transported in the EU-28 (ordered by commoditycategory), 2012
Source: SDG elaboration on Eurostat data.
Figure 8: Modal share by commodity category (based on tonne-km) in the EU-28, 2012
Source: SDG elaboration on Eurostat data.

Freight on road: why EU shippers prefer truck to train____________________________________________________________________________________________
21
In Figure 8, the commodity categories are arranged by share of freight transported by rail.“Coal and lignite, crude petroleum and natural gas” is the only commodity group for whichrail accounts for a higher share than any other mode (65.5% of total freight). Only 38.6%of “coke and refined petroleum products”, the second ranking commodity group, istransported by rail, and for only three other commodity categories - “basic metals andfabricated metal products (except machinery)”, “metal ores and other mining and quarryingproducts” and “chemical products, rubber and plastic products” – is rail’s share above theaverage. Rail accounts for less than 5% of volumes transported in the case of sixcategories: ”grouped goods”, ”food and beverages”, ”non-market goods”, ”machinery andequipment (included computers and electrical machinery)”, ”furniture and othermanufactured goods”, and ”textile and leather products”.
Figure 9: Distribution of transport modes by good type in France, 2014
Source: Eurogroup Consulting, Baromètre de perception des chargeurs sur le transport ferroviaire, 2014.
Figure 10: Evolution of good types transported by rail in the UK, 1998-2012
Source: Network Rail 2013.
Policy Department B: Structural and Cohesion Policies____________________________________________________________________________________________
22
Using country-specific data emerging from the case studies, Figure 9 show thedisaggregation of transport modes by commodity category in France. Road is the mostfrequently used mode for all types of goods. Rail freight is mostly used to transport metalproducts, dangerous goods and chemical industry products, aggregates and constructionmaterials and cars. Combined rail/road transport is mainly used to transport consumergoods, dangerous products and chemical industry products.
1.2.3 Analysis of trends with economic variables
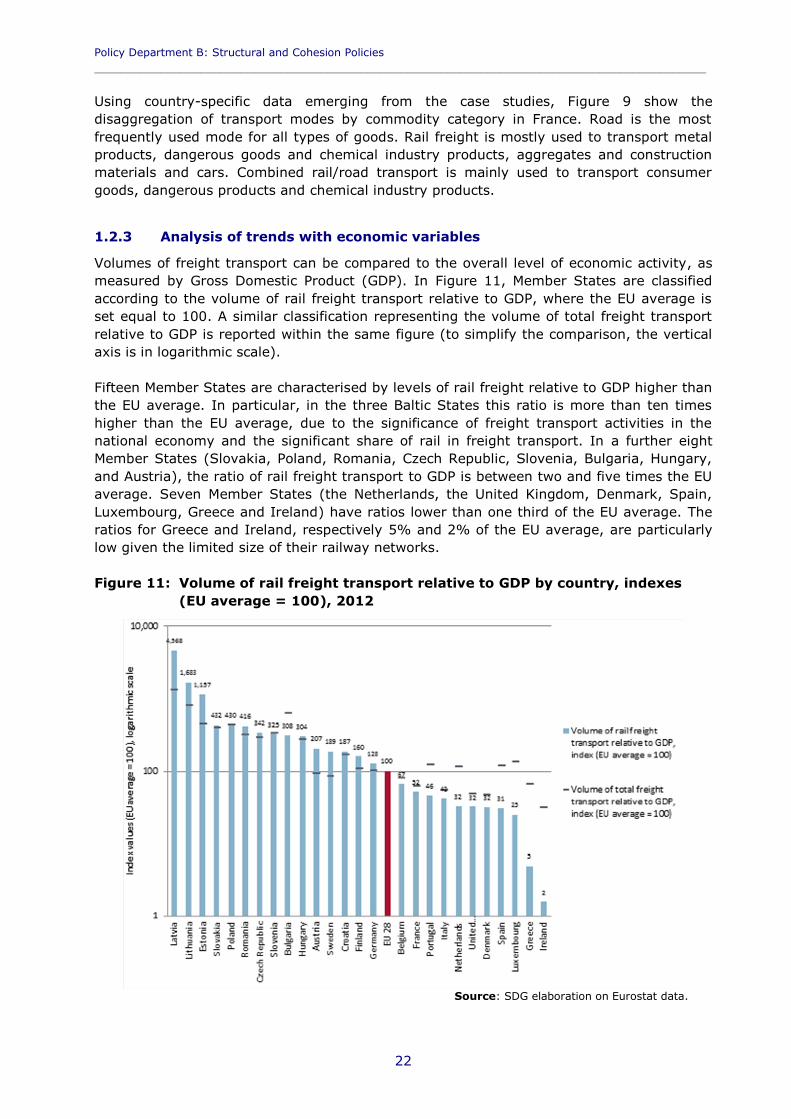
Volumes of freight transport can be compared to the overall level of economic activity, asmeasured by Gross Domestic Product (GDP). In Figure 11, Member States are classifiedaccording to the volume of rail freight transport relative to GDP, where the EU average isset equal to 100. A similar classification representing the volume of total freight transportrelative to GDP is reported within the same figure (to simplify the comparison, the verticalaxis is in logarithmic scale).
Fifteen Member States are characterised by levels of rail freight relative to GDP higher thanthe EU average. In particular, in the three Baltic States this ratio is more than ten timeshigher than the EU average, due to the significance of freight transport activities in thenational economy and the significant share of rail in freight transport. In a further eightMember States (Slovakia, Poland, Romania, Czech Republic, Slovenia, Bulgaria, Hungary,and Austria), the ratio of rail freight transport to GDP is between two and five times the EUaverage. Seven Member States (the Netherlands, the United Kingdom, Denmark, Spain,Luxembourg, Greece and Ireland) have ratios lower than one third of the EU average. Theratios for Greece and Ireland, respectively 5% and 2% of the EU average, are particularlylow given the limited size of their railway networks.
Figure 11: Volume of rail freight transport relative to GDP by country, indexes(EU average = 100), 2012
Source: SDG elaboration on Eurostat data.

Freight on road: why EU shippers prefer truck to train____________________________________________________________________________________________
23
KEY FINDINGS
On average, rail freight transport has experienced low levels of absolute growthacross the EU since 2000. In relative terms, the share of rail freight has declined atthe expense of road freight.
The average trend conceals sharp differences between Member States. Rail freightvolumes have grown by more than 30% in Germany, the Netherlands and the BalticMember States, but have declined sharply in France, Bulgaria and Slovakia. Nationaltrends depend on a number of factors, including the extent of railway networks, theproportion of international traffic in total traffic and the extent of competition fromother modes (e.g. inland waterways).
The share of freight carried by road and rail varies greatly depending on the type ofgoods transported. Heavy bulk transport (such as coal) is predominantly transportedby rail, whereas goods that are lighter and/or more perishable are transported byroad.

Policy Department B: Structural and Cohesion Policies____________________________________________________________________________________________
24

Freight on road: why EU shippers prefer truck to train____________________________________________________________________________________________
25
2. FACTORS CONTRIBUTING TO SHIPPERS MODECHOICE
2.1. IntroductionThis chapter provides an assessment of the factors influencing the choice of freighttransport mode made by shippers, based on a review of the relevant literature and anumber of case studies on EU Member States.
As shown in Chapter 1, some types of goods are intrinsically better transported by certainmodes. For example, heavy bulk goods (such as coal) are predominantly transported by railas they tend not to be time sensitive and the quantities involved favour the economics ofrail freight. However, even bulk goods may be transported by road over relatively shortdistances. By contrast, perishable foodstuffs that are subject to a short production-to-outletwindow can generally only be transported by road. While some food products aretransported in refrigerated rail wagons, this form of transport is not suited to all perishableproducts.
In between these extremes there are products that may be transported by road, rail, or acombination of the two. Comparisons are usually made between road-only transport andtransport combining rail and other modes – intermodal transport – as door-to-door railservices that can compete with the equivalent road service are comparatively rare. Thechoice between road and intermodal transport is affected by a number of factors,categorised as micro-level factors affecting individual decision-making processes in theshort term, and macro-level factors which influence long-term trends at a more aggregatelevel.
2.2. Literature review
2.2.1 Micro-level approaches to mode choice – identifying key attributes
The following summary of relevant literature on mode choice provides a framework forunderstanding micro-level factors influencing individual preferences for road and railtransport.
The preferences of two different parties, the shipper and the carrier, can determinewhether freight is transported using road-only solutions or intermodal services. Patterson etal. (2008) find that, even if carriers generally organise the movement of consignmentsfrom shippers to receivers, their decisions about using intermodal services are constrainedby shippers’ preferences, and thus shippers can be seen as the principal decision-makersaffecting the demand of intermodal services. Based on this observation, it is possible todescribe a simple model of modal choice in which the shipper determines the appropriatecarrier according to a number of attributes. A graphical representation of this simplifiedenvironment is shown in Figure 12.

Policy Department B: Structural and Cohesion Policies____________________________________________________________________________________________
26
Figure 12: Micro-based approach to freight transport modal choice: a simplifiedframework
Source: SDG elaboration.
In this model, factors contributing to modal choice can be divided between shipper andshipment attributes, geographic and time characteristics, and carrier attributes3.
Shipper attributes include firm size, accessibility – in particular the ability or otherwise todirectly access the rail network – and custom and practice among decision-makers inshipping companies. Custom and practice, in turn, is influenced by past experience of theshipper with respect to different transport modes, with shippers who have already madeuse of rail/intermodal solutions in the past likely to behave differently from shippers whohave not.
Shipment attributes include the type of goods, density (in terms of weight per unit ofvolume) and value per unit of product transported, degree of perishability and shelf-life,and package characteristics.
Carrier attributes and modal characteristics include total shipment costs, total deliverytime, infrastructure capacity, service reliability (in particular in-time reliability), degree ofsafety, service flexibility, service frequency, availability of special equipment (e.g.refrigerated wagons, location trackers, etc.), quality of customer service and handlingoperations, and the level of environmental sustainability ensured by each mode.
Other factors affecting modal choice are the distance covered and the flow rate at whichshipments are carried out. For all distances below some 200 km, road transport is markedlysuperior to rail transport in terms of cost and feasibility (Cambridge Systematics).
3 This is the approach followed, for instance, in Patterson, Ewing and Haider (2008) and Samimi,Mohammadian and Kawamura (2010).

Freight on road: why EU shippers prefer truck to train____________________________________________________________________________________________
27
Similarly, rail flow rates are less competitive due to the lack of flexibility on timetabledroutes sharing both passenger and freight flows.
Within this framework, each shipper chooses the best transport solution (i.e. the bestcarrier) by considering the various shipments and carrier attributes of each transportoption. Mode choice by individual shippers can therefore be seen as an optimisation processbased on both matching and trading off of attributes. By way of example, consider amedium-sized shipper, located in close proximity to a freight terminal, which has usedintermodal transport before. The shipper wishes to dispatch a large quantity of bulk goodsto a destination some 400 km away, which is relatively accessible from the rail network viaa short journey by road. As long as the freight services available are considered reliableand safe, this shipper is likely to choose a rail carrier.
In practice, many decisions are more complex, and understanding the outcome in aparticular case may require explicit quantification of the value of different attributes. Statedpreference (SP) techniques are widely used to support this quantification, providing aninsight into the relative importance of time, cost and other characteristics in makingdecisions at the margin between road and intermodal transport4 In addition, recentadvances in freight transport modelling (De Jong et al 2012) are allowing a more preciseidentification of the importance of different factors, the interdependencies between them,and the integration of different elements of the journey such as long-distance transport andlast-mile connectivity.
A number of trade-offs clearly emerge from the literature. When shippers are mostlyconcerned with the timely delivery of goods, they are more likely to choose road.Conversely, when considerations about the costs of consignments are more important,shippers are more likely to view rail favourably. This is because shippers preferring rail aremore sensitive to cost than time.
In support of this view, Danielis et al. (2004) found that road mainly enjoys a time-relatedadvantage over other modes, and that the shorter the travel time, the more important timebecomes relative to cost. Research by Samimi et al. (2010), covering approximately 900shippers in the United States, confirmed these results and found that use of road is moresensitive to haul time than use of rail. Over longer distances, rail becomes morecompetitive because its cost advantage increases and its time disadvantage decreasesrelative to road, and shippers are therefore more likely to use rail transport for longerdistances. (Patterson et al. 2008).
In addition, the relative competitiveness of rail can be enhanced during times of sharp andsubstantial fuel price increases. Any significant and unexpected increase in fuel costs willaffect the costs of road transport, but the effect is greatest when the increase is sudden(e.g. due to a sudden change in market perceptions of the supply of oil relative to demand)and fuel costs account for a large proportion of total costs. However, fuel price impact tendto be offset by specific contracting arrangements, whereby shippers pay for the fuel costsincurred by carriers, as well as policy measures offering reimbursement of carrier fuelcosts.
The importance of factors other than time and cost is also highlighted in the literature. Thereliability of services – that is, on-time reliability and availability of the equipment at the
4 The SP approach involves the use of specially designed surveys in which respondents are asked to expresstheir preferences by choosing an outcome from a series of proposed alternatives, usually involving a trade-off between cost and time, or cost and quality of service.

Policy Department B: Structural and Cohesion Policies____________________________________________________________________________________________
28
required time and in required amounts – was found to be the most important decidingfactor in mode-choice in a study of the Indian freight market by Cook et al (1999).Research carried out by Danielis et al. (2004), based on a SP survey conducted in theItalian market, confirmed these findings and recorded a high willingness to pay for qualityin freight transport services, especially for reliability and safety. On-time reliability wasfound to strongly increase the probability of choosing a carrier, a finding confirmed byPatterson et al. (2008) based on analysis of shippers’ behaviour on a Canadian freightcorridor. Reliability of the transportation service was similarly found to be an importantfactor in carrier choice in Turkey in a study by Kofteci et al. (2010). For shippers requiringvery reliable transport flows, as in the case of shippers of chemical goods, reliability is ofparticular importance (Cook et al. 1999).
In Shinghal and Fowkes (2002), frequency of service also appeared to be an importantfactor in mode choice, especially for shippers making frequent, low volume shipments.These findings were confirmed by research conducted by Combes (2012) on the basis of alarge database of some 3,000 shippers in France. Combes indicated that the rate of thecommodity flow to which a shipment belonged appeared to play an important role indetermining shipment size and mode choice. At the same time, a study of transportlogistics and modal split of Spanish exports to Europe, conducted by García-Menéndez et al(2006), concluded that while quality of service attributes influence modal choice for therelatively high-value sectors (e.g. vehicle parts and household appliances), relatively low-value sectors (e.g. agro-industrial and ceramics products in their study) are mainly affectedby transport costs.
In Samimi et al. (2010), shipment weight/size emerged as a significant variable, indicatingthat larger shipments are more likely to be transported by rail. Combes (2012) finds thatshipment size is dependent on transportation mode, but that freight mode choice alsodepends on shipment size, and concludes that shipment size and mode choice aredetermined simultaneously.
Independently from shipment attributes, the role of managers in charge of decision-making, in particular their past experience with each mode, was also found to play asignificant role. Absence of past experience with rail indicates that the shipper is unfamiliarwith the mode in terms of service quality, cost and other factors, and could be unaware ofthe potential benefits of rail transport. Furthermore, shipments that are organised by athird-party logistics company are more likely to be shipped by rail as these companies havea broader knowledge of available modes and perform a more comprehensive analysis formode selection.
The issue of the reputation of rail was raised in Patterson et al. (2008). From this researchit emerged that there is a very strong bias against the use of rail and intermodal services infreight transport. In the authors’ words, “even if a carrier had the same cost, on-timeperformance, etc. as another carrier, but used intermodal services, the odds of its beingchosen would be halved”. This was interpreted as a bias which probably reflected generalshipper perceptions of rail versus road-only transportation services. The study concludedthat increasing the rail share of freight transportation would require a change in reputationas well as improvements in the standard attributes.
Cook et al. (1999) took into account the influence of a series of other parameters such asloss and damage, access to decision makers, the attitude of the staff of the transporter tocustomers, ease of payment, negotiability, time involved in processing claims andinformation available to customers. The authors acknowledged that these variables can
Freight on road: why EU shippers prefer truck to train____________________________________________________________________________________________
29
become very important on a case-by-case basis, but concluded that they were generallyless important than the attributes mentioned above.
Overall, the analysis of micro-level factors affecting the mode choice of shippers supportsthe model illustrated above. Shippers’ preferences are a function of the characteristics ofthe shippers themselves, the type of goods, the carriers’ attributes and the distance / timerequirements. Cost considerations are important and the competitiveness of rail is greaterover longer distances due to the costs falling relative to those of road along with the valueof road’s time advantage.
However, recent studies have also highlighted the importance of reliability considerations,and quality of service. In addition, past experience tends to influence current choices, andthe past mode choices of managers in shipper companies tend to be reinforced over time.
2.2.2 Macro-based approaches to mode choice – economic drivers
Macro-level factors contribute to longer-term trends of modal shift at a more aggregatelevel. These trends can be seen as overarching and additional to the micro-level decision-making processes described above.
Over time, freight volumes correlate with the general economic cycle, with a higher rate ofeconomic growth corresponding to higher growth in transport volumes. More specifically,the relationship between GDP, in particular the industrial production component of GDP,and freight transport demand is well established in the literature (ITS 2012, Vickerman2002). However, the impact of growth on road and rail freight can differ for a variety ofreasons.
On the one hand, many European countries have experienced an extended period of de-industrialisation, with a long-term decline in the size of previously major industries (e.g.mining, chemical) and a dispersion of the industrial production process across Europelinked to geographic specialisation (Krenz and Rübel 2010). On the other hand, thefragmentation of logistics and distribution trips linked to the rise of e-commerce and on-time delivery has generated new demand that is met by light goods vehicles travelling byroad, particularly in and around urban areas (Casullo and Kohli 2012).
As a result, there has been a trend towards transporting smaller sized volumes morefrequently, making road more competitive than rail. This weakens the relationship betweeneconomic growth and rail freight since, for any increase in industrial output, the associatedtransport requirements are likely to favour road rather than rail.
The weakening of the link between rail volumes transported and industrial production canbe observed in Figure 13 below with reference to France. Since 2000, rail freight hasdeclined proportionately more than industrial production. This reflects, among otherfactors, the stable investment in road infrastructure (around €1.3 billion in 2014) comparedto a decline in rail freight infrastructure investment. By way of example, rail links to twolarge French ports (Le Havre and Marseille) have significantly lower speeds than their roadalternatives, with the average speed between Le Havre and Paris being 6 km per hour.
The decoupling of rail freight trends and industrial production can also be seen in Figure 14with reference to the UK. However in this case, rail freight volumes grew faster than theeconomy overall (that is freight had a multiplier greater than one) with the exception of therecession period 2008-2010. As discussed in Chapter 3, this can partly be explained by the

Policy Department B: Structural and Cohesion Policies____________________________________________________________________________________________
30
presence of investment strategies to strengthen the role of rail at major ports,underpinning the growth of intermodal transport.
Conversely in both France and the UK, road freight transport volumes have been closelyrelated to industrial production since 1995.
Figure 13: Index of road and rail freight against industrial production, 1995-2012
Source: SDG elaboration on Eurostat data.
Recent econometric studies (Müller et al 2014) have concluded that the majority of theoverall (small) increase in rail traffic volume in Europe over the last two decades came fromthe emergence of new markets for transport services. The remaining growth was driven bymarket share gains at the expense of other transport modes, driven for instance by thegrowth in transit and international traffic over longer distances and across transport modes(e.g. port-rail integration). Furthermore, the European Intermodal Association (whichincludes many of the major European players) has indicated that some factors adverse torail freight have emerged in the aftermath of the recent period of economic recession andstagnation. The persistent lack of confidence in the recovery of the market has discouraged

Freight on road: why EU shippers prefer truck to train____________________________________________________________________________________________
31
traders from taking up new opportunities – in this case new infrastructure and technologysupporting freight transport – which are perceived as more risky. Lower investment andinnovation in the rail freight sector can hamper its competition position.
We have noted that, in contrast with the EU long-term trend of declining rail freight shares,the US has experienced significant growth in rail freight transport. In a comparative study,Vassallo and Fagan (2007)5 drew on the observation that the evolution of modal shares inthe US and Europe has differed significantly in recent decades. While the share of freightcarried by rail was similar in the US and Europe during the 1950s, the two markets beganto diverge in the 1960s and by 2000 rail’s share of freight (in terms of volumestransported) had increased to 38% in the US but had fallen to 8% in Europe.
This difference in trends in modal share has a number of causes. It is clear that thegeographic characteristics of the US tend to favour investment in rail freight. In particular,longer shipment distances combined with low competition from maritime transport,especially along the East-West axis, enable railways to compete effectively with coastalshipping. In Europe, however, coastal shipping is more competitive, tending to reduce rail’sshare. In addition, public policy in the US has generally been more supportive of rail freightthan in Europe.
However, Vassallo and Fagan (2007) have identified some aspects of transport policy thathave been more favourable to rail freight in the EU than in the US. In particular, in Europerailways have been subsidised for much of their history and road fuel prices have generallybeen higher and road tolls more prevalent as compared with the US. However, the studyalso suggested that the lack of an interoperable infrastructure network in the EU hassignificantly disadvantaged the European rail freight industry relative to the US industry.The latter also benefitted from, inter alia, the sale of light-density lines to specialised short-line operators, and the fact that rail infrastructure (not electrified) allowed for longer freighttrains and double-stack container services.
A further important difference between the US and European industries lies in the fact thatmarket opening, which took place in the 1980s in the US, was not achieved until the 2000sin the EU. Moreover, European rail networks have invariably given priority to passengerservices, with complex scheduling designed to accommodate a range of services withinconstrained infrastructure capacity. By contrast, the US released the private railways fromthe obligation of providing passenger services between the 1950s and the 1970s and theneliminated government controls over freight rates in 1980, thus allowing railway companiesthe freedom to focus on freight.
In summary, the evidence relating to macro-level factors affecting the mode choice ofshippers indicates that several structural trends contribute to long-term changes in modalshare. In particular, while road is more responsive to changes in the economic cycle, railhas been more affected by the process of deindustrialisation and the fragmentation oflogistics, which have tended to reduce the demand for rail freight transport, although thishas been offset to some extent by the development of new forms of intermodal transport. Acomparison between the EU and the US also shows that public policies can have a stronglong-term impact on modal trends, an issue explored in more detail in Chapter 3.
5 This research covers only EU-15 data.

Policy Department B: Structural and Cohesion Policies____________________________________________________________________________________________
32
2.3. Potential for modal shift from road to railHaving identified the main factors affecting modal choice, it is important to understandwhat the size of the contestable market for rail is. According to the theory of contestablemarkets, the competitiveness of a market depends on the presence of entry and exitbarriers, the degree of sunk costs required to enter it and the relative technologicaldevelopment of competitors. In the case of rail freight, these characteristics determine theextent to which the portion of the overall freight market currently dominated by road couldbe contested by rail operators.
In recent years, several studies have sought to assess and quantify the opportunities forrail and intermodal freight services to secure market share in competition with road. Themajor findings, categorised according to the different techniques used for estimating impacton market share, are summarised in this following paragraphs.
2.3.1 Estimates based on changes in costs
The potential for internalisation of external costs has been investigated in detail by theEuropean Commission. For example, impact assessments were carried out prior to theintroduction of the Eurovignette Directive, as well as during the monitoring of itsimplementation. Further, a number of studies produced as part of the “external transportcost calculator” project for the International Union of Railways (UIC)6 assessed the effectsof various scenarios for internalising external costs using a bespoke model. The analysiscovered policy options involving charges reflecting both variable infrastructure costs andexternal costs on road and rail. The results indicated that if road pricing were in placeacross Europe in 2020, road transport demand would fall by 7% while rail transportdemand would increase by some 10%.
A study carried out by the Policy Research Corporation (PRC) (2007) for the Ministry ofTransport of the Netherlands examined the possibility of incentivising modal shift towardsrail freight transport through measures such as road pricing. The study concluded thatincreases in road haulage prices could induce a maximum potential shift of freight transportvolumes from road to alternative modes of approximately 3%. Most of the modal shiftwould occur in the so-called “fight market” (transport of freight over distances of between400 and 600 km) where rail and inland waterways can more easily compete with roadtransport. The required price increase differed between market segments, ranging from20% in the fight market to nearly 400% on shorter distances. Under the assumption thatprice increases were similar to those resulting from the introduction of the heavy vehicletoll in Germany (see Chapter 4), the potential modal shift in volumes was estimated ataround 0.4% to 0.6%.
Further insights come from a study by Significance and CE Delft (2010) on potential freightmodal shift resulting from changes in relative prices, which included reviews of severalsurvey articles on elasticities of transport demand for each commodity and mode. The priceelasticities reviewed included own-price elasticities (change in demand with respect tochanges in price within the mode) and cross-price elasticities (change in demand withrespect to changes in the price of one mode, such as road haulage, relative to the price ofanother, such as rail freight). Significance/CE Delft estimates of price elasticities varysignificantly across samples, indicating a high level of uncertainty about actual modal shiftin response to price changes. Moreover, the effectiveness of strategies involving altering
6 Van Essen, Boon, Schroten and Otten from CE Delft, Maibach and Schreyer from INFRAS, Doll fromFraunhofer ISI, Jochem from IWW, Bak and Pawlowska from the University of Gdansk (2008).

Freight on road: why EU shippers prefer truck to train____________________________________________________________________________________________
33
relative prices (e.g. fuel taxes and costs of environmental regulation) varies substantiallyby commodity as well as by market and trade flow. Overall, the demand for transport ofcommodities was found to be relatively inelastic for both rail and road modes (elasticitieswere generally between zero and -1), tending to confirm the view that the potential forachieving modal shift through price changes alone is limited.
Müller et al. (2014) investigated the potential growth opportunities for European rail freightand found that intermodal competition is likely to be unstable over the coming years,strengthening the case for policy intervention in favour of rail freight. In their central casescenario, rail’s share of freight traffic was broadly constant until 2025, while in their highand low case scenarios it varied between 5% and 15% depending on a number of factorsand policy interventions.
2.3.2 Estimates based on commodity type and distance
In research conducted for the European Environment Agency (EEA), Zimmer and Schmied(2008) estimated the potential for modal shift from road to rail in the EU by considering thesuitability of different commodity types for transport by rail, taking account of theimportance of transport distances. They estimated the modal shift potential for the EU-27to be 362 billion tonne-kilometres, corresponding to a shift from road to rail of some 14percentage points, based on consideration of the physical characteristics of commoditiesalone. However, after taking account of other factors such as cost, access to infrastructureand service quality, they found that only one per cent of freight transport volumes couldshift from road to rail. Hence, while they concluded that the theoretical potential for modalshift was significant, they also noted that in practice a number of supply side factors suchas high costs, unattractive schedules and poor service quality continued to limit thedemand for rail freight transport.
2.3.3 Estimates based on supply-side measures
A study by NEA7 (2004) for the European Commission estimated the potential changes intraffic volumes as a result of the completion of the Trans-European Transport Network(TEN-T). It concluded that, compared with a reference scenario, an additional 100 milliontonnes of freight would be shipped by rail in 2020 as a result of some 10% of EUinternational freight traffic shifting from road. Overall, approximately 2% of road transport,or 1.4 percentage points of total freight transport, could be expected to shift to rail.
Research into the German freight transport market, conducted by the German FederalEnvironment Agency (UBA) (2010), indicated that a doubling of national rail capacity andtransport volumes could be achieved by 2025 as a result of a range of supply-sidemeasures. One-third of the growth in rail traffic would come from better use of the currentinfrastructure, while the remainder would be delivered through enhancement of thenetwork.
A study of the potential for modal shift, carried out by den Boer, van Essen and Brouwerfrom CE Delft and Pastori and Moizo from TRT (2011), showed that only by maximising theuse of existing infrastructure, a 30 to 40% growth in train-kilometres could beaccommodated by 2020. Moreover, if the increased capacity were allocated equally tofreight and passenger services, rail freight traffic could grow by 83% and passengertransport by 23% overall.
7 M. Gaudry, COWI, PWC, TINA, IWW, NESTEAR, Mkmetric, HERRY and IVT (2004).

Policy Department B: Structural and Cohesion Policies____________________________________________________________________________________________
34
2.3.4 Estimates based on international benchmarking
Based on their analysis of the differences between freight modal shares in the EU and theUS, Vassallo and Fagan (2007) estimated how rail transportation volumes in the US wouldhave changed if the market share of shipments and the commodity mix had been the sameas in Europe, holding policy interventions constant. They estimated that some four fifths ofthe difference in modal shares was the result of natural or inherent differences, with theremainder due to policy. The study concluded that if the residual policy gap were closed,rail’s share of freight volumes in Europe would increase by 8 to 13%.
Table 3 summarises the main results of the research attempting to quantify the potentialfor modal shift. The estimates produced are not directly comparable as they are based ondifferent methodologies and modelling scenarios, and are expressed in terms of differentunits of measure.
Table 3: Summary of research conclusions on modal shift potential
Source Unit of measure Potential modeshift to rail
Notes
Vassallo andFagan (2007)
Volume (tonnes) 5 percentagepoints
Macro approach (comparison ofmode split in Europe and the US)
Zimmer andSchmied (2008)
Volume (tonne-km)
14 percentagepoints
Only physical constraints to modeshift considered
Zimmer andSchmied (2008)
Volume (tonne-km)
1 percentagepoint
Physical, economic, access andquality constraints to mode shiftconsidered
NEA et al. (2004) Volume (tonnes) 1.4 percentagepoints
Potential mode shift due to thecompletion of the TEN-T network
PRC (2007) Volume (tonnes) 3 percentagepoints
Effect of fiscal measuresdisadvantaging trucks(price)increases higher than 20%)
PRC (2007) Volume (tonnes) 0.4 – 0.6percentage points
Effect of fiscal measuresdisadvantaging trucks (price)increases between 10% and 20%)CE Delft et al.
(2007)Volume (tonne-km)
+10% of currentrail volume
Scenarios for internalising externalcosts
Müller et al.(2014)
Volume (tonne-km)
5 percentagepoints
Upper range estimate
Ce Delft and TRT(2011)
Mileage (train-km)
+23% of currentrail traffic
Effect of maximising the use ofexisting infrastructure
Overall, a number of studies have found that there is potential for modal shift from road torail (or intermodal services). However, their conclusions on the size of this shift differsignificantly, ranging from 1 to 14 percentage points. The literature also indicates that thepotential for a shift in long distance transport is higher than in the shorter distance market,with rail being more competitive above a threshold of 200-300km. This is in line with theEU policy objectives referred to in Chapter 1.
2.4. Evidence from case studiesIn order to validate and complement the findings from the literature review, we havecarried out a number of country-specific case studies. Our findings from these studies aredescribed in the following paragraphs.

Freight on road: why EU shippers prefer truck to train____________________________________________________________________________________________
35
2.4.1 France
A recent survey conducted by Eurogroup Consulting (2014) suggests that theattractiveness of rail freight in France is hindered by poor reliability, higher costs relative toroad over comparable distances and inadequate connectivity with the main logistics sites.As shown in Figure 14, price is the main factor determining the modal choice of shippers,reflecting the fact that transport costs represent a significant proportion of total productioncosts and that, consequently, shippers are price sensitive when procuring transportservices. Road transport is generally perceived to be cheaper, and pricing structures forroad haulage are considered simpler.
Figure 14: Factors impacting on modal choice in France
Source: Eurogroup Consulting, Baromètre de perception des chargeurs sur le transport ferroviaire, 2014.
In addition, shippers perceive a gap between demand and supply: rail capacity along themost important corridors cannot always accommodate demand, and service frequency isnot sufficiently attractive. Shippers also consider booking procedures to be inflexible, andthe fines they pay when they need to cancel a path unreasonably high (although we notethat ARAF, the rail regulatory authority in France, is currently seeking to rebalance thisover time).
The survey also provided an opportunity for interviewees to highlight the main advantagesof using rail freight. These were identified as being:
Protection of the environment;
Guaranteeing the safety and integrity of goods transported (this is particularly truein the case of dangerous goods); and
Suitability for goods with certain characteristics (in terms of volume, weight, etc).
While recognising that rail freight has some important advantages, stakeholders noted thelack of effectiveness of recent incentive measures and the withdrawal of plans to introducean environmental tax for road hauliers. They considered that while the infrastructureimprovements planned over the next few years should help to strengthen the competitiveposition of rail, price considerations would continue to be the primary determinant of modechoice.

Policy Department B: Structural and Cohesion Policies____________________________________________________________________________________________
36
2.4.2 Germany
Both road and rail freight transport have grown significantly in Germany since the mid-90s.Between 1995 and 2012, national road freight grew by 26%, international road freight by44% and rail freight by 56%. The evolution of freight movements in Germany has beendriven by a number of factors, including the enlargement of the EU which resulted in astrong increase in transit freight traffic between East and West as well as between Westernand Southern European Member States. In addition, the location of a number of majorports (e.g. Hamburg and Bremerhaven) along the northern coast of Germany hasencouraged major freight flows from locations elsewhere in the country requiring portaccess.Despite the high share of rail freight (23% of tonne-km in 2012), policy-makers considerthat there is potential to increase it by addressing a number of factors reducing railcompetitiveness. A recent survey carried out by HSH Nordbank8 (2014) amongst railwayundertakings and rail freight forwarders highlighted four main barriers to further expansionof rail freight transport in Germany, namely:
Strong price competition with road freight hauliers;
Non-adequate infrastructure conditions;
Technical and organisational barriers with respect to cross-border traffic; and
Lack of flexibility, reliability and punctuality.
2.4.3 Italy
The geographical characteristics of Italy have a direct impact on where and how goods aretransported. In particular, the shape of the peninsula means that freight travels longdistances along a limited number of North-South routes, as well as along the East-WestCorridor in Northern Italy. In addition, there are a number of corridors that carry freightinternationally including, the Corridor from Genoa to the Swiss border, the Brenner Corridorto the border with Austria and the extensions of the East-West Corridors to Slovenia andFrance.
All these corridors are served by both rail and road, with road offering door-to-doorconnectivity while rail transport usually involves at least one transhipment. In addition, asignificant amount of freight arrives at (and departs from) the main Italian ports: onlysome of them have adequate railway connections while all of them have road connections.
The main factors making road transport more attractive than rail in Italy relate to costs andthe quality of infrastructure. Thus, it has been estimated that the average cost of roadtransport in Italy is approximately €1 per km while the cost of rail transport is closer to €18per train-km9. The differential is significantly lower when calculated in terms of tonne-km(because trains carry much larger loads than trucks) but it remains the case that the costof rail transport is higher than the cost of road transport unless longer distances arecovered. This is attributed to:
The higher cost of labour in the rail sector (for example two drivers are needed onmost freight services and the employment contracts are less flexible); and
8 HSH Nordbank (2014) Zukunft des Schienengüterverkehrs.9 Mercintreno Conference 2014, Rome.

Freight on road: why EU shippers prefer truck to train____________________________________________________________________________________________
37
The relative costs of access to infrastructure in Italy, equivalent to some €3 pertrain-km for freight trains compared to road charges that are only applied on partsof the motorways network.
In addition, the lack of appropriate rail infrastructure is considered to be a strong barrier tomodal shift, in particular because of:
Low gauge clearance limiting the possibility to piggyback heavy goods vehicles ontrains;
Maximum allowed train lengths being much shorter than in other Member States(with most trains on the Italian network being limited to 550m compared to over700m on other European networks); and
Maximum allowed trainload weights being lower than in other Member States.
2.4.4 Poland
Based on interviews with the Association of Independent Freight Operating Companies inPoland, we have identified the following as the main barriers to modal shift:
The low quality of railway infrastructure (in relation to road infrastructure);
The high level of track access charges on the rail network; and
Existing administrative procedures discouraging customers from using rail.
The Association also suggested that the following initiatives could encourage freight modalshift:
Large-scale modernisation and development of rail infrastructure;
Liberalisation of regulations, especially for users of railway sidings;
Lowering track access charges;
Introducing a regulatory framework that would equalise the competitive positions ofrailway and road; and
Reduction of administrative, regulatory and technical (e.g. interoperability) barriersto using rail in Poland.
The perception is that road transport performs much better in Poland in terms of transittime (as a result of door-to-door solutions), reliability and availability. This competitiveadvantage is primarily due to the rapid development and improvement of the road networkrelative to the railway network, which has not benefitted from significant renewal orenhancement in recent years. Indeed, such modernisation of the national rail infrastructureas has occurred has focused on passenger services, with ‘unnecessary’ secondary lines aswell as stations and passing loops frequently used by freight trains being frequently closed.Moreover, in recent years, many railway sidings have fallen into disuse because of a lack ofinvestment and the complex regulatory procedures governing access to them (e.g. theneed to obtain certification).
At the same time, attitudes towards road and rail transport vary depending on thecharacteristics of the shippers themselves. For example, the larger the shipper, the morelikely it is to transport goods by rail because of the potential economies of scale, and thoselocated relatively close to the rail network also tend to make greater use of rail freighttransport. A number of stakeholders noted that railways can be competitive, depending on

Policy Department B: Structural and Cohesion Policies____________________________________________________________________________________________
38
the route, shipment size and market segment in question, and several confirmed that railfreight tended to be more competitive over distances above 200km.
A study of the Polish railway intermodal market commissioned by the Polish Office of RailRegulation (2012) included a survey of the opinion of freight operating companies andreached similar conclusions. The results of the survey are summarised in Figure 15. Thecompanies perceived the high level of access charges and low quality of infrastructure asthe main barriers to using rail freight in Poland. More than nine out of ten respondentshighlighted the lack of subsidies for intermodal operators and the high cost of terminalinvestment; the limited number of access points and difficulties in accessing infrastructurewere identified by some two-thirds of interviewees. In addition, more than 60% of freightoperators pointed to a lack of available specialised rolling stock dedicated to intermodaltransport as the barrier to growth of rail freight. Rolling stock statistics support thisconclusion as the Polish domestic freight fleet is dominated by obsolete coal wagons.
Figure 15: Importance of selected barriers to growth of the intermodal transportmarket, in the opinion of Polish Freight Operating Companies
Source: Polish Office of Rail Regulation (2012) Analysis of railway intermodal market.[Original title and content in Polish: Analiza rynku kolejowych przewozów intermodalnych], p. 33.
2.4.5 Spain
In Spain, rail freight transport has been declining both in absolute terms and in terms ofmodal share over the last two decades. This has left the Spanish rail freight market with amodal share of less than 5%, one of the lowest in Europe. Long-term investmentprogrammes by national and regional governments has tended to favour the expansion ofthe road network, and motorways in particular. Moreover, while there has been significantinvestment in the rail network over the last 10 years, this has been focused primarily onpassenger rather than freight services. Rail freight also suffers from other structuralbarriers, including a polycentric geography, dispersed industrial production patterns and thedifference in the rail gauge with France and other EU Member States.

Freight on road: why EU shippers prefer truck to train____________________________________________________________________________________________
39
A survey of shippers carried out by the Chamber of Commerce of Zaragoza (2010)10
showed that rail is considered to be a slightly cheaper alternative to road, receiving a scoreof 3.3 out of 5 on price as compared with 3.1 for road. However, rail services are ratedworse than road for all other indicators. In particular, rail is considered to be particularlyinflexible, receiving a score of only 1.5. A summary of all scores is presented in the tablebelow.
Table 4: Survey of shippers in Aragon – scores by mode and characteristic (scoresbetween 1 and 5)
Characteristics Rail Road
Price 3.3 3.1
Quality 2.6 3.6
Speed 2.3 3.6
Flexibility 1.5 3.7
Punctuality 2.6 3.6
Source: Zaragoza Chamber of Commerce (2010).
The survey highlights the importance of flexibility, speed and punctuality in mode choice. Italso indicates a significant difference between shippers according to whether they operateon their own account or for hire and reward. Companies that have internalised haulagefunctions and operate own account transport services express a preference for rail overroad across all of the indicators. This may be evidence of the fact that shippers wouldprefer rail over road if the supply-chain were to be simplified and rail infrastructure morewidely accessible.
Figure 16: Shippers’ preferences in Spain – average scores for road and railtransport (scores between 1 and 5)
Source: Feo-Valero et al. (2011).
10 Estudio del sector del transporte de mercancías por carretera en Aragón, Camara de Comercio de Zaragoza,2010.

Policy Department B: Structural and Cohesion Policies____________________________________________________________________________________________
40
KEY FINDINGS
In between the extreme cases of goods that are almost always carried by rail andthose most likely to be transported by road, a number of micro-level factorsinfluence mode choice. Decisions made by shippers (the key decision makers in thisprocess) are a function of the characteristics of past experience, the type of goodscarried, the carriers’ attributes and the distance/time requirements. Costconsiderations are important and the competitiveness of rail is enhanced over longerdistances.
Several overarching and structural factors also contribute to long-term changes inmodal share. These include the relationship between economic growth and freighttransport, whereby road is more responsive to changes in the economic cycle thanrail. Trends of delocalisation of the industrial production process and thefragmentation of logistics negatively affect rail freight; new forms of intermodaltransport conversely represent a high-growth market segment for rail.
Various studies have assessed the potential shift from road to rail or intermodalservices; estimates range from 1 to 14 percentage points. The literature also showsa threshold of 200-300km above which rail is particularly competitive and thepotential for modal shift is higher.
Evidence from national case studies about shippers’ preferences points to theimportance of cost considerations in some countries where rail freight is perceived tobe too expensive (France, Italy). More broadly, the need for high-quality and morecapillary rail infrastructure is emphasised across all case studies, with a focus onbottlenecks (Germany), capacity (Italy, France) and reliability (Spain, Poland).

Freight on road: why EU shippers prefer truck to train____________________________________________________________________________________________
41
3. EXISTING MEASURES AIMED AT MODE CHOICE
3.1. Introduction
This chapter sets out the policy initiatives intended to support modal shift that have beenundertaken at both the EU and national/regional levels. The analysis reveals that, despitenumerous policies being adopted, their impact on modal shift has been minimal. Weanalyse and discuss some reasons for this lack of effectiveness below.
3.2. EU level assistance and policies
3.2.1 Main policy measures
The main EU level initiatives to affect the relative competitiveness of freight transportmodes are as follows:
In the case of roads, the Eurovignette Directive (1999) was adopted with a view toincreasing the contribution that the road sector made to covering its external costs.The Directive also set out the principles for applying tolls. Since 2006, MemberStates have been able to differentiate tolls according to a vehicle's emissioncategory ("EURO" classification), the level of damage it causes to roads, place, timeand amount of congestion. This makes it possible to address the problems of trafficcongestion as well as damage to the environment, on the basis of the "user pays"and "polluter pays" principles.
In the case of rail, the First Railway Package (2001, modified by the Rail Recast in2012) requires infrastructure managers to levy access charges that cover themarginal cost of running the railway, adding a mark-up only where the market canbear it. Since 2007, the European rail freight market has been completelyliberalised. Competition from new entrants is seen as a way of increasing the qualityof service provided by freight operators whilst also bringing prices down. The FourthRailway Package (currently under negotiation between the European Parliament andthe Council of the European Union) features several proposals aimed at improvingthe competitiveness of rail. These include an increased role for the EuropeanRailway Agency in authorising and certifying railway vehicles, making the processsimpler and more efficient for cross-border traffic.
In addition, intermodal transport has been promoted and implemented throughprogrammes, such as Marco Polo and Trans-European transport networks, designedto stimulate investment in infrastructure projects of common interest across modesof transport.
The biggest direct monetary contributions to supporting modal shift have come from thefunding and financing of specific infrastructure projects and policy initiatives. In particularthe Cohesion Fund, the European Regional Development Fund, Trans European TransportNetwork (TEN-T) funding, and the Marco Polo and INTERREG Programmes (as well as fundsfrom the various research programmes) have contributed to a number of freight specificprojects across Europe, some of which had the aim of taking freight off the road network.

Policy Department B: Structural and Cohesion Policies____________________________________________________________________________________________
42
Table 5: Funding and financing for transport at the EU level 2007-201311
Project Period Total budget
Cohesion Funds for transport 2007-2013 € 82,000 million
TEN-T 2007-2013 € 8,013 million
Marco Polo II 2007-2013 € 450 million
INTERREG 2007-2013 € 321 millionSource: European Commission and DG MOVE.
Over the period 2007-2013, TEN-T funding focussed on “the need for sustainability”. Of atotal of 30 Priority Projects, 18 related to rail, 3 to mixed rail-road and 2 to inlandwaterways. The horizontal Priority Project “Motorways of the Sea” was designed to enableshort-sea shipping to compete on more door-to-door corridors. In addition, Regulation EU913/2010 concerning a European Rail Network for Competitive Freight requested MemberStates to establish international, market-oriented rail freight corridors. This Regulationencouraged the strengthening of co-operation between Infrastructure Managers andpromoted inter-modality between rail and other modes.
The financial mechanism for TEN-T during the current programming period (2014-2020),the “Connecting Europe Facility” (CEF), will make €26.25 billion available to co-fund TEN-Tprojects in Member States, €11.31 billion of which will be allocated to TEN-T projects inMember States eligible to receive Cohesion Funds. There has been a shift from thepatchwork of Priority Projects to a real network approach. Core network corridors will assistin removing bottlenecks, building missing cross-border connections and promoting modalintegration and interoperability. These corridors will integrate the rail freight corridorsdiscussed previously.
The Marco Polo programme was launched in 200312 to fund direct modal shift or trafficavoidance projects and to provide support to enable freight to switch from road to othermodes of transport. The last calls for proposals were issued in 2013. The programmecomprised five funding areas:
Modal shift from road to rail and waterborne systems;
Catalyst actions which promote modal shift;
Motorways of the sea between major ports;
Traffic avoidance; and
Common learning actions.
These objectives are to be achieved through the new "Shift2Rail research initiativelaunched in 2014, which seeks to accelerate modal shift to the rail sector. The researchinstrument will be managed in a joint undertaking under Horizon2020, the EU’s Researchand Innovation programme for 2014-2020. The overall budget is estimated to be €1 billionover a six to seven year period and will be co-financed by the private sector and the EU.The initiative will concentrate on developing solutions to enhance capacity, consolidatereliability and improve the life cycle of the European rail system. Both CEF and Shift2Railare still in their infancy and it has therefore not been possible to assess their effect, buttheir potential impact is described in Chapter 4.
11 http://ec.europa.eu/regional_policy/how/policy/doc/strategic_report/2013/factsheet8_road.pdf12 Regulation (EC) No 1382/2003 of 22 July 2003.

Freight on road: why EU shippers prefer truck to train____________________________________________________________________________________________
43
3.2.2 Effectiveness of the measures
Although the policies implemented at the EU level over the past 15 years have shared thegoal of fostering modal shift, the analysis presented in Chapter 1 shows that their overallimpact on the modal share of rail in the EU freight transport market has been minimal. Themain reason for this lack of effectiveness is the failure to coordinate the various policyinitiatives and funds, both within the European framework and between the EU andindividual Member States.
The Eurovignette Directive is not mandatory. In addition, the legislation does not specifyhow road user charges should be developed. As a result, Member States have applieddifferent methodologies for calculating the charges and they can be based on a range offactors such as vehicle weight, emissions and road type. This, in turn, has led to aconsiderable variation in the level charges applied across the EU. As of February 2014, 23Member States had introduced some form of road charging on heavy goods vehicles(European Commission) with nine levying charges through vignettes, five using electronictolls and nine having conventional tolls. Five Member States had no road user charging inplace.
The liberalisation of international rail freight has had varying levels of success. A number ofnew entrants have emerged; some of these have “cherry-picked” existing freight flows,while others have created new traffic and moved freight from road to rail. In addition, theeffectiveness of intra-modal competition depends on the presence of a level-playing-fieldacross modes.
In its 2013 Special Report on the Marco Polo programme, the European Court of Auditorsfound that the programme had been ineffective, and recommended that it should bediscontinued in its current form. The funded programmes did not meet targets, had littleimpact on shifting freight off the roads and there was no data to assess the achievement ofthe policy objectives (e.g. the environmental impact of freight transport, road congestion orroad safety). There was a lack of relevant project proposals put forward because of marketconditions, and the programme rules discouraged operators from taking part in thescheme. The audit also found that many of the projects would have gone ahead evenwithout an EU subsidy, with 13 of the 16 beneficiaries audited stating that they would havestarted to run the transport service even in the absence of additional EU funding.
Just under a quarter of all Cohesion Policy funds (some €82 billion) between 2007 and 2013were allocated to transport projects. These were distributed through 238 operationalprogrammes covering all modes of transport, although again there was a particularemphasis on road projects (approximately €41 billion or 50% of transport funding), withrail projects accounting for approximately €23 billion (30% of transport funding) and otherprojects (in urban transport, ports, multimodal transport, airports and inland waterways)for the remaining €16 billion. Between 2007 and 2013, over 75% of Cohesion funds forroad were spent in the EU-13 Member States, where a marked decline in rail freight hasbeen observed over the same period.
With respect to EU policies, the stakeholders interviewed agreed that there was a systemicfailure with the Marco Polo programme and agreed that alternatives should be found. Amajority of stakeholders gave a positive assessment of the regulatory and financialmeasures taken in the past five years, which had the effect of bringing the issue of railfreight and inter-modality to the forefront of the public debate and increasing publicawareness of the importance of the logistics sector. However, it is still the case that

Policy Department B: Structural and Cohesion Policies____________________________________________________________________________________________
44
intermodal freight transport is often not able to survive without some form of publicfunding, in particular to provide the necessary infrastructure and kick-start operations. Todate, EU funding has not been able to secure the long term growth of the intermodalsector, although it has achieved short term improvements in its competitive position.
3.3. Member States assistance and policiesThe national case studies provide examples of Member State specific policies that havebeen introduced to incentivise modal shift. In this section, we set out the main findingsfrom these case studies and provide a summary of those national policies aimed atincentivising modal shift, as identified by the UN Economic Commission for Europe13.
3.3.1 Main policy measures: France
In France, pro-rail policies have focused mainly on supporting infrastructure investmentand improving technical standards for rail freight. The failure to achieve significant modalshift can be attributed to insufficient financial incentives for expansion of the rail freightsector and ineffective interventions targeting the external costs of road transport.
Pro-rail policies
In France, in recent years there has been increased public sector support for freighttransport, and rail in particular, in order to internalise the impact of road transport and toprovide support for a rail sector whose financial sustainability is in doubt. Specific measuresinclude simplification of technical regulations for rail freight, a system to develop prioritypaths for freight trains and the creation of a network of major rail corridors. In addition,rolling motorways through the Alps and from the Spanish border to Luxembourg are now inoperation on a daily basis, and others linking Calais and the Spanish border (Boulou andTarnos) are planned to open in 2015 and 2016. In parallel, measures addressing cross-border barriers and bottlenecks are being implemented, such as the planned Turin-Lyonlink across the Alps.
The government supports combined transport operators for the transhipment of containers.The objective of those measures is to compensate for the additional costs of handling,which do not occur in the case of road transport operations. The government also providesfinancial support for the creation, improvement or extension of combined transportterminals, including those located in seaports. However, to date only 23% of containers aretransported by rail and inland waterways whereas 77% are carried by road.
Investment is being channelled into improving the rail connectivity of the main ports withthe hinterland. “Opérateurs ferroviaires de proximité” are also developing to meet ademand for flexible transport that the main rail operators are not able to satisfy in thesmaller ports. Regulations have been modified in order to compel leading terminaloperators to remove barriers to access to their facilities, in particular by offering fair andtransparent access terms.
Support has also been provided at the local and regional level. More specifically, publicinstitutions (central government, regions, departments, municipalities) provide financialsupport for investments in the construction and extension of terminals and relatedequipment. Support may cover up to 50% of total investment. In addition, initial and
13 UNECE Working Party on Intermodal Transport and Logistics (WP.24).

Freight on road: why EU shippers prefer truck to train____________________________________________________________________________________________
45
terminal hauls by road enjoy an exemption from the vehicle axle tax up to a maximum of75%. However, this initiative has only had a limited impact on modal shift.
Tests of longer trains were also carried out at Sibelin marshalling yard (Rhône) in January2014, with the joining of two 750-metre trains to form a 4,000-tonne, 1,500m train14. Adouble train of this kind can transport up to 70 wagons compared to 35 wagons carried bya conventional 750-metre train. Allowing longer trains would therefore enable railcompanies to carry additional traffic without paying for extra train paths and secureimportant productivity gains.
The test took place within the framework of Project Marathon (MAke RAil The HOpe forprotecting Nature, a project co-founded by the European Commission) and was designed tovalidate the technical feasibility of the “double train” ahead of a possible commercial launchin 2016. Technically, the innovation focuses on a radio control system which makes itpossible to link the head locomotive manned by a driver with the driverless locomotivesituated in the middle of the train.
Intermodal transport was previously further incentivised by the provision in Directive96/53/EC allowing heavy goods vehicles of up to 44 tonnes to operate in France if theywere part of a combined rail-road transport journey (trucks not part of a combinedtransport being limited to 40 tonnes). As of January 2013, this limitation was removed forall heavy goods vehicles, thus removing the competitive advantage of combined transport.
Anti-road policies
Road freight taxation includes the "taxe intérieure de consommation sur les produitsénergétiques" (TICPE) and an additional axle tax. The TICPE tax is set at the national level(currently 0.45€/L) but since 2007 Regions can add an additional rate (up to a maximum of0.015€/L of fuel) and with the exception of Poitou-Charente and Corsica, they all do so. Anadditional rate has applied since 2011 (up to a maximum of 0.0135€/L). Revenue from thissecond funding stream must exclusively finance infrastructure projects for sustainabletransport. In the end, regional rates for TICPE range from 0.4169 €/L to 0.4419 €/L.Transport operators can claim a partial refund on those taxes (as happens in Italy, Belgiumand Slovenia) up to a maximum of 0.0474 €/L if they opt for a lump sum. The axle tax isconsistent with the requirements of the Eurovignette Directive.
The French government had signed a contract with the company "Écomouv" to introduce aroad tax known as "Écotaxe", proportionate to the level of emissions of heavy vehicles. Thistax was meant to be introduced in 2012 on all the motorways currently not underconcession agreements. One of the main objectives of Écotaxe was to internalise externalcosts of road transport and stimulate a modal shift towards rail. After postponing itsintroduction several times, the government has decided to cancel the tax, replacing it withan additional tax on diesel fuel (potentially at a rate of around 0.04 €/L of diesel).
14 Information published on 29 January 2014 in the UIC electronic newsletter "UIC eNews" Nr 383.

Policy Department B: Structural and Cohesion Policies____________________________________________________________________________________________
46
3.3.2 Main policy measures: Germany
Germany has incentivised combined transport through a mix of financial support andregulatory measures. The rehabilitation of railway sidings has also contributed to improvinginfrastructure quality and availability for rail freight. This, coupled with the introduction of aspecific road toll, has contributed to the growth of rail freight volume by more than 30%between 2000 and 2012.
Promoting the use of combined transport
Combined transport plays an important role in the German integrated freight transportstrategy. It supports the objectives of the government, which are aimed at strengtheningthe position of rail and inland waterways as environmental friendly modes of transportwithin the logistic supply chain by increasing their respective shares in total freighttransported in Germany.
Since 1998, the Federal Government has granted subsidies to private companies for theconstruction or extension of transhipment facilities for combined transport. The most recentrules on the promotion of combined transport, in force since January 2012, limit themaximum amount of subsidies to 80% of investments directly related with transhipmentfacilities. In order to receive a subsidy, a company must demonstrate that this money isessential if the investment is to be undertaken and that access to the new facilities will benon-discriminatory. This support is intended to encourage growth in the use of combinedtransport services, even over relatively short distances.
In addition to the rules on financial subsidies, other policy measures have been applied toincentivise the use of combined transport15:
An increased overall weight of 44t for heavy goods vehicles on pre- and post-railhauls;
Exemptions from the Sunday and public holiday driving restrictions for vehicles onpre- and post-rail hauls;
Time spent by drivers on a rolling motorway (on the train) may be credited as partof the mandatory rest period;
An exemption from vehicle tax for vehicles used exclusively for pre- and post-railhauls; and
A refund of vehicle tax for the use of the rolling motorway.
Promoting the construction or rehabilitation of private sidings
Private sidings are an important interface between the industry and the transport network,and a wide network of private sidings is crucial for strengthening the competitive position ofrail transport. This is demonstrated by the fact that, in Germany, 85% of rail freight volumestarts from/ends at private sidings16. Since 2004, the Federal Ministry of Transport hasbeen providing subsidies for the construction and rehabilitation of private sidings in order toincrease the share of goods transported on rail.
The rules on the promotion of the construction and rehabilitation of private sidings allowthe granting of subsidies up to 50% of eligible investments. Beneficiaries are required to
15 http://www.forschungsinformationssystem.de/servlet/is/288106/16 Responses to a parliamentary question of the Green Party to the Federal Government,
http://dipbt.bundestag.de/dip21/btd/17/071/1707163.pdf
Freight on road: why EU shippers prefer truck to train____________________________________________________________________________________________
47
guarantee a volume of newly or additionally generated freight handled over the siding for aperiod of at least five years. The agreed amount of freight handled needs to be achieved atthe latest five years after the start of operations of the private siding.
Figure 17: Evolution of the number of private sidings in Germany
Source: Forschungs-informations-system.
Since the rules on the promotion of private sidings came into force, 120 projects acrossGermany have been granted subsidies (as at December 2012) and the decline in thenumber of private sidings has been stemmed: this number remained almost constantbetween 2004 and 2011, as illustrated in the figure above. At the same time, thecompetitive position of rail has been strengthened by the introduction of a heavy goodsvehicle toll. This has led to an increase in the number of new entrants into the German railfreight market which, in turn, is likely to have had a beneficial effect on the profitability ofprivate sidings.
Anti-road policies
Germany has introduced a number of anti-road policies since the early 2000s. For example,since 2005 heavy goods vehicles (HGVs) beyond a gross vehicle weight of 12 tonnes havebeen required to pay a charge for the use of the federal motorway network. In 2013, totalHGV tolls collected on German motorways and similar federal roads amounted to around€4.39 billion17. The main objective of the introduction of the HGV toll was to internalise theexternal costs of road transport and promote modal shift of freight transport from road torail. However the toll was soon perceived to disadvantage German hauliers against theirEuropean competitors. Hence, two years after its introduction the Federal Governmentlaunched a programme to alleviate its impact on the national road transport industrythrough €600 million of tax reductions, including:
A reduction in vehicle tax for HGV (resulting in lower revenues of around €150million); and
A reduction in motor vehicle taxes equivalent to €450 million.
17 http://www.bmvi.de/SharedDocs/DE/Artikel/UI/lkw-maut-innovativ-oekologisch-und-gerecht.html

Policy Department B: Structural and Cohesion Policies____________________________________________________________________________________________
48
Overall, the net impact of anti-road policies has therefore not been as large as it could havebeen in the absence of the tax reductions.
3.3.3 Main policy measures: Italy
In recent years, both road and rail have received some form of subsidy/incentive in Italy.However, the progressive reduction in rail freight’s modal share suggests that incentives touse road transport have been stronger overall. This can be attributed to both the structuralnature of road transport funding (by way of annual budgetary commitments as opposed tothe uncertainty of rail freight funds), and the fragmentation of rail incentives at the regionallevel.
Pro-rail policies
Since 2002, the Italian Government has sought to incentivise rail freight transport, inparticular combined transport, by granting incentives to freight companies for the period2004 to 2006. Under Article 38 of Law 166/2002, a company could receive incentives:
If it was entering into a contract with the Ministry of Transport and a railwayundertaking to run a complete combined transport (or dangerous materials) train;or
If it bought equipment which directly benefitted the development of freight withparticular focus on combined transport, dangerous materials or rolling motorways (aform of combined transport involving the conveying of HGVs by rail, which isrelatively common in Alpine regions); or
If it was a railway undertaking entering into a framework contract with the Ministryof Transport to provide combined or accompanied freight transport.
The total funds available amounted to €20 to 25 million. Subsidy under the first and third ofthese provisions was paid on a per km basis, while subsidies under the second case werepaid as a lump sum. The first case was subsequently extended for a further two yearsbeyond 2006, while the other two were extended for three years. All three provisions wererenewed for a further year under the Financial Law of 2008. In each case, receipt ofsubsidy was conditional on the majority of the benefits being passed on to customers.
There is a correlation between the provision of these funds and growth in the rail freightmarket, although it is difficult to determine the direct impact of these measures with anyprecision: rail freight traffic (in terms of tonne-km) grew by 9% in 2004, 3% in 2005 and6% in 2006, with volumes in 2006 reaching a level some 19% higher than in 2003. Overthe same period, road freight traffic grew by 7%.
The most recent scheme (described in the box below) was set up by the Ministry ofTransport in 201018. Known as the “Ferrobonus”, it incentivised switching of freight trafficfrom road to rail. Ferrobonus has been credited with increasing rail freight volumes by 6%in 2011, a year which saw a continued economic decline and a fall in freight volumes in allsectors.
18 Through Ministerial Decree 592 of the 4th August 2010 subsequently modified by Ministerial Decree 750 ofthe 14 October 2010.
Freight on road: why EU shippers prefer truck to train____________________________________________________________________________________________
49
Box 1: Monetary incentives to rail freight
The Ferrobonus in Italy
The Italian Ministry of Transport set up a direct incentive to intermodal transport in2010 known as the “Ferrobonus”. It incentivised the switching of freight traffic fromroad to rail. In order to apply for the bonus, operators were required to provideintermodal freight transport services with one leg undertaken using rail and other legsusing other forms of transport (rail only services were excluded). All companies meetingthe eligibility criteria were eligible for funding. The incentive was calculated by takingthe total amount of funds available and dividing it by the total number of train-kmtravelled by the approved services. The final incentive was set at €1.078 per train-km.If the beneficiary was a combined transport or intermodal operator, they were requiredto pass at least 40% of the value of the incentive on to the ultimate customer.
Notwithstanding a period of prolonged economic decline and a fall in overall freightvolumes, volumes moved by rail increased by 5% in 2011 and by 9% in 2012, an effectattributed to Ferrobonus. As reported by the European Court of Auditors in 2011, theItalian administration managed the programme with a multi-million budget that waspaid out almost in full (82.3% of funds were allocated). 15 employees were required toadminister the scheme, at a cost of 1.2 % of the total programme budget. However, thescheme was discontinued in 2012 as a result of budgetary pressures.
Trenitalia – the incumbent train operator in Italy – also currently benefits from a publicservice contract with the State to carry freight by rail to the south of the country. Thiscontract is valued at €128 million per annum and covers some 11 million train-km. Due toa recent European Commission investigation under State Aid legislation, this contract wasnot renewed at the end of 2014.
Another €7 million per annum have been granted by the Ministry of Transport to the “Alpinerolling highway”, a combined transport service operating over a distance of 175 kmbetween France and Italy via the Mont Cenis Tunnel. The service has been operated byAutostrada Ferroviaria Alpina (AFA), a subsidiary of SNCF and Trenitalia, since 2003.
Regional policies
In addition, a number of Regions in Italy have set up schemes to encourage the transfer offreight from road to rail. These regional interventions have taken the form of public servicecontracts, open to all operators, with the aim of serving freight locations that previouslyhad not been served within a region or that could no longer be considered economicallyviable in the absence of financial support.
In 2004, the Friuli Venezia Giulia region introduced measures aimed at encouraging thedevelopment of combined transport and reducing access charges. The plan was limited to athree-year period and a budget of €2.7 million. Funds were allocated to rail businesses thatprovided combined transport services by rail and originated in the territory of the region(€1.5 million) as well as to shipping companies that established regular lines for thetransport of intermodal loading units (€1.2 million). Grants were limited to offsetting thedifference between the external costs of road transport and combined transport. Morerecently, the Friuli Venezia Giulia region has allocated €12 million to logistic companies oversix years (2010-2015) for the development of rail/road combined transport and roll-on/roll-off (Ro/Ro) maritime services, and another €12 million over the same period for newcombined railway and motorway services.

Policy Department B: Structural and Cohesion Policies____________________________________________________________________________________________
50
Within the Programming Period 2007-2013, the Veneto Region allocated a total of €55million in funding for the implementation of three projects involving investment inintermodal transport: (i) the construction of an intermodal terminal at the logistic centre ofPadua, (ii) the construction of a warehouse for the management of cargo handling at thelogistic centre of Rovigo; and (iii) the enhancement of the logistic terminal at the port ofChioggia.
The Emilia Romagna region has offered subsidies for freight companies wishing to transferfreight from road to rail for a number of years. The latest incentive plan provides formaximum subsidies of €150,000 per company, less generous than the previous (2009) planunder which subsidies of up to € 400,000 were available. Over the period 2010-2012, theregion has also granted funding of €9 million for the development of traffic to and from theport of Ravenna.
In 2009, the Campania Region allocated €1.3 million to launch a new rail freight servicebetween the port of Naples and the intermodal centre of Nola. The objective was to shift15,000 HGVs per day (8.5% of all such traffic) from road to rail within three years. Nomonitoring reports are available yet to assess the impact of these measures.
Impact of rail policies
However, even though significant funds have been directed towards increasing thecompetitiveness of rail freight, many more are directed at increasing the competitivenessand effectiveness of road freight. Road transport in Italy in the period 2006-2013 isestimated to have received some €5.2 billion of public funding, of which €3.0 billion wereordinary funding provided through national Budget Laws and €2.2 billion by means of otherfunds, while over the same period rail freight transport was granted €1.1 billion. Moreover,the piecemeal nature of both national and regional initiatives in Italy has tended to limit theimpact of incentives intended to encourage modal shift to rail. Although the modal share ofrail freight grew from 11.4% in 2006 to 14.0% in 2012, this seems to have been the resultof road freight traffic declining much more than rail freight traffic during the recession (overthe period, road freight fell by 34% while rail freight fell by 16%). Nevertheless, theexperience of the Ferrobonus is generally regarded as demonstrating the potential forincentive-based policies to deliver positive results if implemented over a sufficiently longtimeframe.
3.3.4 Main policy measures: Poland
In Poland, road transport has improved its competitive position in relation to rail in recentyears. Relatively ineffective policies for discouraging road use, coupled with insufficientinvestment in rail freight infrastructure and similarly ineffective policy incentives to use railinstead of road, resulted in a decrease of rail’s share of goods transported (measured interms of tonne-km) from 35% in 2003 to 18% in 2012.
Pro-rail policies
In 2002, Poland ratified the AGTC Agreement19 and currently 4,278 km of railway linesmeet AGTC standards. Poland has also started implementing the European Rail TrafficManagement System (ERTMS) on the main railway corridors, as outlined in the NationalPlan for ERTMS Implementation. Projects are co-funded by the EU Cohesion Fund20. More
19 European Agreement on Important International Combined Transport Lines and Related Installations.20 Operational Program Infrastructure and Environment, the National Strategic Reference Framework for the
years 2007–2013, action 7.1: Development of Railway Transport.

Freight on road: why EU shippers prefer truck to train____________________________________________________________________________________________
51
projects are to be launched in the 2014-2020 programming period to provide additionalcapacity on heavily congested lines, assure interoperability and meet EU legal obligations.The choice of lines on which ERTMS is, or will, be implemented shows some considerationof the requirements of freight train operators as a number of key freight corridors21 areincluded in the investment plan.
The government’s aim has generally been to focus financial support for the rail sector onunprofitable but socially important public passenger services with the expectation that allfreight trains can be operated on a purely commercial basis. Hence, unlike in other EUcountries, no subsidies were granted to compensate shippers for longer rail journey times(in comparison to road transport) resulting from the low quality of railway infrastructure.
However, in 2010 the Infrastructure Manager introduced a pilot scheme whereby trackaccess charges for fully loaded container wagons operated as block trains were reduced by25%. The discount validity period and scope have been extended and currently allintermodal wagons, loaded or unloaded, qualify for the discount (although the block trainrequirement remains). According to the Polish Office of Rail Regulation, intermodal railtransport is expected to grow by some 8% per annum from 2014 onwards.
Another attempt made by the Polish government to make transporting goods by rail moreattractive was the introduction of tax reductions for combined transport. The amended Acton taxes and local charges22 states that taxpayers transporting goods as part of a combinedtransport service may be eligible to obtain a refund on vehicle tax. The amount ofreimbursement is determined according to the number of trips (both with and without load)made by the rail element of the transport service in a given tax year (with provision for upto 100% reimbursement). In addition, there are exemptions from traffic bans for vehiclesused in combined transport on Sundays or bank holidays, and the maximum permissibleweight of road vehicles operating as part of a combined transport service is 44 tonnes,while the national limit is 40 tonnes23.
The Polish Act on Rail Transport opened up the market for rail freight and, followingliberalisation, the Polish freight railway market is one of the most contested in the EU withmore than 75 active FOCs (Freight Operating Companies). Nevertheless, the high level oftrack access charges, low quality of infrastructure (leading to extended journey times),limited number and inadequate spatial structure of terminals as well as investment policygiving priority to passenger trains, continue to be major barriers to transporting goods byrail. Against this background the limited incentives for the development of rail freight, whilepositive, have failed to reverse the trend decline in volumes carried.
Infrastructure investment
Discussions with the Association of Independent Freight Operating Companies highlightedthe Polish government’s primary focus on road infrastructure development. In the 2007-2013 programming period, funding was allocated between road and rail in the ratio 86:14,although the EU had initially required Poland to allocate at least 40% of funds to rail. In the2014-2020 programming period some 60% of funds were initially earmarked for rail
21 An example of this is Line 131 (Coal-Trunk Line) linking the southern industrial region Silesia with the BalticSea ports in northern Poland.
22 The Polish Parliament (2002) Act on taxes and local charges (amended) [in:] Journal of Laws, Article 8 and11a. [Original content and title in Polish: Ustawa o podatkach i oplatach lokalnych].
23 The Ministry of Transport, Construction and Maritime Economy (2012) The effect of planned changesintroduced by the European Commission Directive 96/53/EC of July 1996 on establishing for certain vehiclecategories maximum dimensions in national and international transport and maximum weights ininternational road transport in Poland – expertise.

Policy Department B: Structural and Cohesion Policies____________________________________________________________________________________________
52
investment, but the final allocation has again favoured the road sector. The Secretary ofthe Association also stated that the current condition of railway infrastructure required atleast 1,000 km of railway lines to be modernised each year, although in the last decadeannual renewals amounted to only 100 to 200 km. While EU co-funding has accelerated theprocess, a prolonged period of underinvestment has inevitably resulted in a deterioration inthe quality of rail infrastructure and hence in rail’s competitive position in the freighttransport market.
Box 2: Bringing together the key elements of mode choice
A strategy to reverse mode share decline in Poland
The Master Plan for rail transport 2030, drafted by the Polish Ministry of Infrastructurein 2008, sets out a strategy for improving the competitiveness of rail freight over thelong term. The government predicts that rail will transport 67-71 billion tonnes offreight in 2030, compared to 49 billion in 2010. In the same period, freight transportedby road will grow from 259 billion to 427-460 billion tonnes, assuming no majorchanges to investment levels or existing regulations.
The Plan also anticipates that goods transported by rail will increasingly be carried byintermodal transport, and that the transport of bulk commodities by rail will decline inimportance. It recognises that rail must respond to such changes in order to remaincompetitive and commercially viable, and that the development of intermodal transportmust therefore be a priority. The following activities are considered necessary toachieve this objective:
1) Development of line and point railway infrastructure on the AGTC network in orderto adapt it to the needs of intermodal transport users.
2) Development of multimodal terminals on the TEN-T network.
3) Development of multimodal functions of airports and maritime ports on the TEN-Tnetwork through their better integration with the road and railway network.
4) Improvement of operational parameters of inland waterways to enable integration ofriver transport with the intermodal supply chains.
Investment will be funded through a combination of European, national, regional andlocal funding sources.
In addition, the Plan emphasises the need to invest in rolling stock with a view tomodernising the existing fleet of freight trains. There is a lack of specialised, dedicatedcarriages for intermodal transport (in 2010, the share of customised wagons was 10-15% of the total), the average age of the simplest platform cars is more than 24 yearsand the fleet is dominated by coal wagons. Further, development of intermodaltransport in Poland will be supported by initiatives to improve skills and enhance thequalifications of managers and employees from the transport, shipping and logisticssector.
Anti-road policies
One of the main measures designed to internalise the negative externalities of roadhaulage was the microwave electronic toll collection system "viaTOLL", introduced by theGeneral Directorate for National Roads and Motorways (GDDKiA) from the 1st July 2011.

Freight on road: why EU shippers prefer truck to train____________________________________________________________________________________________
53
The system is operating on 2,650 km of motorways, expressways and other roads. The tollamount depends on the road class, vehicle gross weight and the EURO emission class.However, although road tolling has increased the cost of shipping freight by road, it has nothad the effect of reversing the long-term decline in rail’s share of the market.
In summary, Poland has introduced a number of policies to shift freight from road to rail,but their implementation has been challenging. While the Master Plan for rail transportprovides a long term strategy for the development of rail freight, substantial investment toimprove the quality of the rail network will be required if incentives to use intermodal andother services are to prove effective.
3.3.5 Main policy measures: Spain
According to the European Commission’s rail market monitoring report (RMMS) 2014, Spainhas the lowest tariffs per train-km for rail freight. However, this has not been sufficient toincrease the share of rail which tops out at just over 5% of inland modes. In recent years,an imbalance in investment in favour of road, coupled with moderate road taxes and thegeographic characteristics of the country, have helped to sustain road’s share of themarket. Moreover, a combination of relatively low freight access charges and marketliberalisation has not led to the level of competition in rail freight observed in other MemberStates (the incumbent operator Renfe retains 80% of the rail freight market), and theimpact on final market prices for shippers has therefore been small.
Pro-rail policies
A key factor affecting the competitiveness of rail freight transport is the quality ofinfrastructure, which in turn depends on the level of investment in the network. In Spain,total annual investment in rail infrastructure, both passenger and freight, is estimated tohave increased from €1.7 billion in 2000 to €10 billion in 201024. This increase has beenaccompanied by a less than proportionate increase in road spending, leading to a growth inthe share of spending allocated to rail from 33% in 2000 to 53% in 2010. This represents areversal in the historic trend which has seen road investment being favoured over railhistorically (rail only received around 9% of total investment between 1991 and 2000).
However, rail freight stakeholders have noted that most of the investment in rail has beenin the Spanish high-speed network, which is exclusively dedicated to passenger transport.By contrast, freight transport networks have instead suffered from underinvestment(Serrano Martinez 2012), resulting in slow progress on key improvements such aselectrification and gauge clearance. However, investment in the conventional rail network isnow being undertaken with a view to exploiting spare capacity arising from the transfer ofpassenger traffic to the high-speed network and developing intermodal facilities.
In addition, longer trains of around 750 metres have been operating on the Spanishnetwork since 201125. These can carry up to 48 containers and have the potential toreplace significant road freight flows. Initially, they are being used to provide overnightservices along the Madrid-Valencia line, taking advantage of the 7-hour period needed totravel between these two destinations. The estimated annual cost savings for shippersduring this pilot period are in the order of 15%, based on a comparison of costs pre andpost the introduction of the new rolling stock, and the initiative is expected to make a
24 Martinez, José María Serrano, Transporte de mercancías por ferrocarril en Espana, Boletin de la Asociación deGeografos Espanoles N 60 - 2012.
25 http://blogs.elpais.com/eco-lab/2011/10/trenes-de-mercancias-extralargos.html
Policy Department B: Structural and Cohesion Policies____________________________________________________________________________________________
54
significant contribution to modal shift on the Madrid-Valencia corridor. (Alonso Timón2011).
ADIF, the Spanish rail infrastructure manager, wishes to increase the share of intermodalfreight transport from its current level of 5% to around 18%, in line with the average forthe EU as a whole. The organisation’s main focus is on upgrading the quality and capacityof logistics centres in order to address concerns that they too far away from the nationalrail freight network and increase their utilisation. Accordingly, in 2011 ADIF signedagreements with 17 port authorities26 to facilitate rail access to ports as well as rail freightoperations within ports.
Significant investment in intermodal transport is also being undertaken, including at majorports. In September 2013, the Ministry of Development and the Catalan regionalgovernment signed an agreement to build a new rail connection to the Port of Barcelona.Other partners in the project include ADIF and FGC, a regional train operator. The projectwill enable rail access to the new southern extension to the port.
Box 3: Maximising the impact of investment
Modal shift at the Port of Barcelona
Investment at the Port of Barcelona is intended to help counter the national trend of railfreight decline in Spain. Rail traffic to and from the Port has grown from 557,000 tonnesin 2008 to 2.1 million tonnes in 2012, and rail’s share of the associated maritimecontainer market grew from 3% to 12% over the same period. This share is stillconsiderably lower than that observed at other ports in the EU (for example, the shareof rail in the market for hinterland distribution of sea containers arriving at the port ofHamburg was 42% in 2012), but rail freight traffic through Barcelona is neverthelesshaving positive effect on the rest of the Spanish network.
In 2013, rail services in Catalonia transported 10,331 TEUs, an increase of over 200%year on year (mainly due to increased traffic with Tarragona). Moreover, new productswere carried by rail, including the transportation of 100,000 cars between the SEATfactory in Martorell and the Port, and 385,000 tonnes of bulk cargo from the mines inSuria and Sallent. This demonstrates that rail can compete for freight transport overrelatively short distances if rail access to key facilities is established.
Road network investment
Road infrastructure spending in Spain is highly dependent on the availability of governmentfunding, with expenditure divided between the National Government and Local Authorities.Following sustained spending on both new construction and upgrades, the length of theroad network has grown by 249% over the past 20 years. However, this investment in roadinfrastructure has been interrupted as a result of the recession and subsequent slow paceof recovery, with a particularly large reduction in the National Government budgetallocation for roads (a fall from €6 billion in 2008 to just €76 million in 2012).
26 The ports are La Coruña, Algeciras, Alicante, Avilés, Barcelona, Bilbao, Castellón, Ferrol, Huelva, Marín,Pasajes, Santander, Sevilla, Tarragona, Valencia, Vigo and Vilagarcía.

Freight on road: why EU shippers prefer truck to train____________________________________________________________________________________________
55
Figure 18: Total expenditure in road infrastructure in Spain
Source: Ministerio de Fomento (2013).
Anti-road policies
Total road freight traffic in Spain grew steadily between 2000 and 2007, but declinedthereafter as a result of the economic crisis, in particular the associated downsizing of theconstruction sector. International transport has, however, been more resilient, experiencinga small recovery between 2010 and 2011. The return to growth has been particularlymarked in the market for freight transport between Spain and France.
Motorways in Spain are subject to distance-based road pricing, with tolls on national roadsunder public ownership levied by the Government, and concessionaires charging for the useof private roads. While tolls vary across the country, analysis conducted by the OECD27
found that average toll rates in Spain were around €0.17 per km in 2012, just under EU of€0.20 per km, and rates have remained fairly stable over the past decade. The sameanalysis shows that both vehicle taxes and fuel duty are below the EU average. Moreover,levels of fuel and vehicle taxation have been relatively moderate. Hence, while the roadhaulage market continues to be driven by the economic cycle and associated effects onmanufacturing and construction, it has not been materially affected by the cost of roadtransport relative to the cost of rail.
3.3.6 Other EU Member States
Financial support
Most EU Member States have sought to support the development of intermodal/combinedfreight transport in recent years. In the following paragraphs, we provide an overview ofthe funding schemes identified by the UN Economic Commission for Europe.
In Austria, the “Programme for the support of transhipment points for intermodal transport(road/rail/ship)” (2006-2012) and the "Innovation programme for combined freighttransport" (2009-2014) have supported substantial investment as well as the purchase ofmobile equipment for the transport or handling of goods using combined transport services.In addition, the Government has identified a number of combined transport servicesconstituting ”public service operations” under the Austrian Federal Railways Act, concludingannual contracts for the provision of high quality services with ÖBB (Austrian FederalRailways, the wholly state-owned group that manages rail infrastructure and operatespassenger and freight services) as well as private railways. These services are eligible for
27 OECD, International Transport Forum, Road Haulage Charges and Taxes, Discussion Paper 2013-08.

Policy Department B: Structural and Cohesion Policies____________________________________________________________________________________________
56
public sector financial support as they are considered to be in the public interest (e.g.because of the associated environmental benefits), and €46 million of funding wasprovisionally allocated for this purpose in 2005.
In Belgium, the Federal Government has also provided financial support to railwaycompanies organising combined freight transport services. This took the form of paymentof a flat rate subsidy per km and unit of goods, covering all intermodal services including arail journey with a minimum distance of 51 km inside Belgium. The scheme was initially putin place for the period 2005 and 2008, but was subsequently extended to 2012. Supportwas provided to operators organising combined freight transport services by rail and tooperators introducing regular international train services.
In Bulgaria, rail freight services were supported through the “Development of [a] Strategyfor Integration of the Bulgarian Railway Infrastructure into the European IntermodalTransport Network”. This initiative was in place until 2006, and supported through thePhare Programme 2000-2006 (one of the pre-accession programmes, financed by the EU,to assist countries of Central and Eastern Europe applying for membership of the Union).Since 2006, there has been a continued decline in rail freight in Bulgaria; however thiscannot be directly attributed to withdrawal of intermodal initiatives.
In the Czech Republic the “Programme of Aid for Combined Transport” and its two sub-programmes - “Construction of the New and Modernization of the Existing Terminals withPublic Access” and “Innovative Technology for the New Lines of Combined Transport” – wasin place between 2006 and 2010. Under this programme, start-up phase funding wasprovided to support the operation of new unaccompanied28 combined transport services.
In Lithuania, financial support for investment is provided in the form of State guaranteesfor loans from international financial institutions. Specific support for investment in newrolling stock and modernisation of railway infrastructure was also provided according to the“State Investment Programme for 2008-2010”. In addition, the creation of three publiclogistics centres was partly financed through “European Union Structural Assistance for2007–2013”.
In Slovakia, subsidies equivalent to 30% of eligible operating costs can be granted by theMinistry of Transport in support of new combined transport services. Support is availablefor up to three years following start-up.
Other measures
Several EU Member States guarantee a reduction or an extension of the road tax for thosefreight vehicles that are exclusively used in initial and terminal haulage for combinedrail/road transport. In Austria, all national vehicles exceeding 3.5 tonnes are exempt fromthe monthly vehicle tax if during that month they are used exclusively for initial/terminalhaulages. Moreover, national vehicles exceeding 3.5 tonnes using the rolling road or usedto provide unaccompanied combined transport are reimbursed 15% of the monthly vehicletax for each combined transport journey made by rail (this reimbursement may reach100% of the annual vehicle tax).
28 Railway operators offer two types of intermodal transport: accompanied transport and unaccompaniedtransport. In the first case, also known as “rolling road”, or “rolling highway”, the whole truck is loaded onthe railway wagon. In the second case, the loading units (e.g. container or semi-trailer) are carried by roador by vessel to a purpose-built transhipment terminal, where they are loaded onto trains to continue thejourney by rail.

Freight on road: why EU shippers prefer truck to train____________________________________________________________________________________________
57
In the Czech Republic, full exemption from heavy vehicle tax is available for those vehiclesthat are exclusively used in initial/terminal haulage, and variable relief (of 25 to 90 percent) is available for those vehicles making trips as part of a combined transport service. InFrance, there is a reduction in vehicle axle tax of up to 75% for vehicles used in combinedtransport, while in Germany there is full exemption from vehicle tax for vehicles usedexclusively for initial and terminal haulage.
In Romania, agents involved in combined transport may be granted temporary exemptionsfrom earnings tax in return for investment in infrastructure and in theacquisition/modernisation of installations relating specifically to combined transport.National road vehicles are exempt from vehicle tax in Slovakia if they are used forcombined rail/road transport, with 50% reimbursement available for vehicles making morethan 60 combined transport journeys in a year.
In a number of Member States, including Austria, France, Germany, Lithuania, Poland,Slovakia and Slovenia, the maximum permissible weight of road vehicles (including anytrailers) has been increased from 40 tonnes to a maximum of 44 tonnes for vehiclesoperating on the initial and terminal road legs of a combined transport service. Otherincentives include the application of less demanding regulations for drivers of HGVs usingrolling motorways.
In the UK, investment strategies are in place to strengthen the role of rail at major ports.Rail freight has proven integral to growth at the Port of Felixstowe, where the volume offreight carried by rail has more than doubled and the number of scheduled rail services hasincreased by 50% over the last 10 years. Around 11,500 containers are moved every weekon the 60 trains that serve Felixstowe. Modal shift has been substantial, and the Portestimates that more than 250,000 lorries have been removed from the road. Theimplementation of a £40 million (circa €50 million) investment plan, put in place in 2010,has further improved the port’s rail freight facilities. One of the latest developmentsincludes the opening of a third terminal and a number of new chords linking Felixstowe to17 inland destinations within an hour, providing greater choice for shippers. This has madea major contribution to the growth of container freight, with volumes reaching record levels(830,000 TEUs) in 2013.
In addition, many Member States have pursued wider policies aimed at discouraging theuse of road freight through the introduction of road tolls and increasing fuel duty. Theevidence suggests that these have affected the demand for road transport significantly inthe short run, but have been absorbed over the longer term through improvements intechnology. For example, higher fuel duties have been partially offset by large increases infuel efficiency over time. Moreover, there is no evidence that policies to discourage roaduse have been coordinated effectively with policies relating to the promotion of rail freight.
3.3.7 Effectiveness of the measures
Policy measures designed to change the relative price of rail freight transport compared toroad, whether through investment or operating subsidies, only affect one of the factorstaken into account by shippers in choosing between modes. Other factors, for exampleflexibility, reliability and punctuality, are more difficult to influence, often requiringsubstantial support for enhancement of rail infrastructure.
The following figures show the timing of key policy interventions in the Member Statesabove-mentioned and relate these interventions to changes in rail freight modal share.

Policy Department B: Structural and Cohesion Policies____________________________________________________________________________________________
58
Figure 19: Policy measures in a selection of Member States
Figure 20: Annual growth rates of rail modal share in inland freight transport
Source: SDG elaboration on EU transport in figures statistical pocketbook 2014.
Direct financial support has been targeted at rail infrastructure development, for exampleby providing better gauge clearance for heavier trains and reinstating sidings. The impactof these measures is only likely to be observed in the medium to long term, with theutilisation of new infrastructure ramping up over time. However, where investment hasbeen sustained over an extended period, as in Germany, a significant increase in rail’sshare of freight transport has already been achieved.
Road charges have been introduced in a number of Member States, but the impact on roadfreight has been reduced as a result of other policy measures tending to favour roadtransport, as in the case of the Écotaxe in France. In other countries where road tolls arelevied, the costs of road freight may nevertheless be relatively low because of policy inrelation to fuel and vehicle taxes.The most effective policies appear to have been those focused on the development ofintermodal transport, either through operating subsidies provided to intermodal serviceproviders, or through specific support to improve connections to the rail network, forexample at key ports. Measures of this kind have enabled a strengthening of rail freight’scompetitive position and supported an increase, albeit marginal, in rail’s share of freighttransport markets in a number of Member States.

Freight on road: why EU shippers prefer truck to train____________________________________________________________________________________________
59
KEY FINDINGS
A number of initiatives targeted at modal shift from road to rail have beenintroduced at the European level. These include the Eurovignette Directive;introducing road charging based on external costs; railway reforms opening freightmarkets to competition and improving interoperability; and programmes for fundinginvestment in intermodal infrastructure and operations, such as Marco Polo and theTEN-T.
In parallel, Member States have similarly implemented a range of measures toincentivise modal shift. Direct financial support has been targeted at railinfrastructure development, for instance by providing better gauge clearance forheavier trains and reinstating sidings. In addition, road charges have beenintroduced in a number of countries, although the impact on road freight hastypically been offset by other measures tending to encourage the use of roadtransport.
Taken together, however, these measures have not had a major impact in terms ofpromoting modal shift. This can be attributed to the generally small scale of theinvestment in rail and intermodal transport relative to investment in other modes,and to a lack of coordination of rail freight policy initiatives at the EU and nationallevels.
The most effective policies appear to have been those targeting intermodaltransport, either through targeted subsidies to intermodal operators, or throughspecific agreements at key intermodal nodes, with a particular focus on ports.

Policy Department B: Structural and Cohesion Policies____________________________________________________________________________________________
60

Freight on road: why EU shippers prefer truck to train____________________________________________________________________________________________
61
4. STRATEGIES FOR MODIFYING SHIPPERS’ MODECHOICE
4.1. Introduction
This chapter outlines a number of strategies that could be introduced to further incentivisemodal shift towards rail by affecting shippers’ choices. The previous chapters of this reportprovide the necessary background to this exercise. Chapter 2 discusses the main factorsthat can affect modal choice and provides some quantification of the potential for modalshift, based on previous research. Chapter 3 offers an overview of policy measures thathave already been implemented and a commentary on their effectiveness.
Based on our review of the evidence, we have concluded that there is potential to increaserail’s share of EU freight traffic significantly. We also consider that the share of railobserved in Switzerland and the United States (where around half of all inland freight trafficis carried by rail) could usefully inform long term policy objectives, although achieving asimilar market share for rail across the EU is unlikely except in the very long term.
A more specific, yet ambitious, target is set by the EU Transport White Paper (2011), whichstates that 30% of all flows above 300km should shift away from road by 2030. This wouldcorrespond to a shift from road of some 3.5% of the volume of freight transported withinthe Union, and a reduction of approximately 8% in EU CO2 emissions29. Based on theanalysis in Section 2.2., a realistic overall target for the share of freight carried by rail inthe EU could be, in the medium term, around 20% of all inland transport volumesmeasured in terms of tonne-km (compared with 17.2% in 2012).
However, while targets help to inform the direction of policy, they can only be met throughthe implementation of effective strategies. In considering the relative merits of differentstrategies, the following conclusions from previous chapters should be kept in mind:
Any strategies for modifying shippers’ choices should focus on the key leversidentified by industry players as having the greatest influence on modal choice.
A number of policies aimed at promoting modal shift already exist, and anyadditional strategies should complement and improve upon the existing policyframework.
There remain structural barriers that limit the ability of shippers to choose rail overroad and thus constrain the size of the contestable market.
Most incentives introduced at the national and EU level have not been successful atreversing the trend decline in rail’s share of freight traffic, although an assessmentof the effects of these policies in isolation is difficult given the range of economicand other factors influencing the demand for rail freight services.
4.2. Prioritising strategies with high policy leverageAny assessment of the effectiveness of policy measures aimed at affecting mode choicemust take account of shippers’ preferences, as identified in the course of this study. Whilenot exhaustive, the findings of the research summarised in Chapter 2 indicate a range ofsuch factors, all of which have implications for policy at both the EU and national level.
29 Tavasszy and van Meijeren, Modal Shift Target for Freight Transport Above 300 km: An Assessment (2011).

Policy Department B: Structural and Cohesion Policies____________________________________________________________________________________________
62
As shown in Chapter 2, mode choice is affected by both micro and macro level factors.Whereas some of micro factors fall predominantly outside the sphere of influence of policymakers (e.g. commodity type), others are integral to the design of effective, mode-specific,policy measures (e.g. service reliability and network capability). By contrast, macro levelfactors are generally more difficult to target other than through wider policy intervention ofa fiscal or monetary nature, although the introduction of large-scale infrastructureimprovement programmes influence behaviour at the macro level, as seen in the US. Thetable below summarises the main micro and macro level factors and a number ofassociated policy measures.
Table 6: Factors affecting modal choice and respective policy leverage
Factor Higher policy leverage Lower policy leverage
Shipperattributes Location Firm size, business planning
and decision making
Shipmentattributes Size and weight Commodity type, value,
perishability
Carrierattributes
Cost, speed, reliability, safety,intermodal services
Flexibility, frequency
InfrastructureNetwork capacity, quality andavailability of terminals,intermodal facilities
Topography and territorialbarriers
Macrovariables
Large-scale interoperableinfrastructure
Economic growth, industry sizeand production cycles, importand export flows
Source: Steer Davies Gleave elaboration.
The strategies with the highest leverage are those affecting the quality of service perceivedby the shipper. Those with the lowest leverage tend to focus on factors that are less easilytargeted by policy, including the volumes transported by shippers, the type of commoditiestransported, the flexibility of rail services offered and more general macroeconomicconditions.
A number of policy measures are available, intended to increase rail’s share of the EUfreight market. The following are considered to be particularly effective:
Regulatory measures:
o Reducing the cost of rail freight transport, in particular through lowerinfrastructure access charges and targeted discounts to incentivise modeshift;
o In parallel, introducing road charging schemes that better reflect the externalcosts of road transport;
o Providing a level playing field for competition in the rail freight market andimproving its transparency by applying the provisions of the various RailwayPackages;
o Adopting a more flexible approach to rail capacity allocation processes inMember States, including by accommodating requests for freight paths onnational rail networks currently dominated by passenger services;
o Allowing the circulation of longer and heavier trains, while limiting theexpansion of longer and heavier HGVs;

Freight on road: why EU shippers prefer truck to train____________________________________________________________________________________________
63
o Accelerating the speed and ease of contracting by shippers, in order that theycan compete more effectively against road by offering greater flexibility andavailability than at present; and
o Investing in the promotion of rail freight services to raise awareness of themamong existing and potential customers and raise the profile of the industrymore generally.
Infrastructure investment:
o Improving the interoperability of freight services and removing cross-borderbottlenecks by investing in common signalling systems (e.g. through ERTMSdeployment) and working towards uniform gauge sizes;
o Promoting the construction and expansion of intermodal facilities, includingrailway sidings and dedicated connections to ports and industrial areas whichincentivise combined transport and thus better integrate transport modes;and
o Expanding the rail network to increase its density and coverage, particularlyin Member States that have witnessed a decline in rail freight investmentrelative to spending on road infrastructure in recent years.
Different strategies can be deployed to address the priority measures summarised above.The available policy toolkit to develop strategies that target both rail and road is presentedin the next section, together with recommendations for policy-makers.
4.3. The available policy toolkit
4.3.1 Targeting rail
The competitive position of rail freight can be improved through a number of regulatorymeasures and infrastructure investment measures. The former category includes monetaryincentives which increase the price-competitiveness of rail, while the latter encompassesthose investment projects that, inter alia, improve the quality and reliability of the railfreight infrastructure.
Regulatory incentives
One measure through which policy makers at the national level can reduce the cost of railfreight for shippers is maintaining infrastructure charges at a sustainable level,effectively internalising external costs while improving the competitiveness of rail vis-à-visroad transport. Member States in which infrastructure charges are the lowest also tend tobe the most successful in terms of increasing rail’s share of freight transport (e.g. Swedenand the United Kingdom). However, other factors also influence outcomes, for exampleroad tolls and fuel prices.
The effectiveness of relatively low infrastructure charges also depends on the extent towhich freight operating companies pass these on to their customers in the form of lowerprices. Strong competition between operators, as in Germany, Hungary and the UK,can help to ensure this. In addition, the entry of new operators can be supported byreducing the administrative burden of processes related to market entry (such as grantinglicences and homologation) and ensuring non-discriminatory frameworks are applied inrespect of access to services and facilities.

Policy Department B: Structural and Cohesion Policies____________________________________________________________________________________________
64
At the national level, the correlation between the presence of direct monetary incentivesto shippers using rail and modal shift from road to rail is weak. Similarly at the EU level,the effectiveness of the Marco Polo Programme has been questioned by the European Courtof Auditors. A key lesson from this Programme is that any incentive scheme must besupported by effective monitoring of results and should avoiding rewarding outcomes thatwould anyway have happened in the absence of incentives (the deadweight effect); inshort, better targeting of funding is needed.
Monetary incentives for specific rail freight operations that form part of intermodaltransport provide an example of effective, targeted funding. These types of incentive havehad a significant effect on modal shift at the national level. They include the flat ratesubsidies in Italy and Belgium and the grants for combined transport available in Austria.Incentives should not distort competition in the freight market, but should be designed toachieve clear and measurable outputs. In addition, incentives designed to encourageintermodal transport have tended to be more effective than rail-only incentives. This isbecause rail is already a component of an intermodal service and the incentive cantherefore operate at the margin, encouraging shippers to extend the length of the railjourney rather than switch mode for the entire journey.
Infrastructure investment
It is difficult to overstate the importance of investing in the expansion and upgrade of railfreight infrastructure if rail is to compete effectively with road for freight traffic. Thenumerous barriers to interoperability and capacity mentioned by shippers, freight operatorsand their associations result in the presence of bottlenecks and in a mismatch betweenthe needs of the industry and the availability and quality of infrastructure. More specifically,poor infrastructure contributes to poor industry performance in terms of reliability andpunctuality as well as limiting the availability of train paths. Two areas of infrastructureinvestment are particularly important in enhancing the attractiveness of rail freight:intermodal facilities and cross-border transport.
Infrastructure investment that supports intermodal transport is necessary because it isextremely rare for freight transport movements to rely exclusively on rail; hence betterfacilities enable shippers to make as much use of rail transport as possible while continuingto benefit from the flexibility offered by road connectivity. Transhipment facilities as well asterminals for handling containers are examples of infrastructure likely to increase thelength of a freight journey undertaken by rail.
A focus on cross-border transport is also beneficial for the growth of rail freight.Shippers tend to be less sensitive to costs in the case of longer freight movements –typically above 300 km – on which the competitive position of rail vis-à-vis road ismaximised due to a fall in unit costs. Since longer-distance journeys in Europe are likely toinvolve a cross-border component, ensuring that the barriers to cross-border transport areremoved is of particular importance in improving the competitiveness of rail freight.
EU policies and funding programmes have been increasingly focused on rail infrastructureinvestment, including intermodal and cross-border transport. A Mid-Term Review of the2007-2013 TEN-T MAP Project Portfolio recognised that the TEN-T programme wasprogressing well, aided by the appointment of European Coordinators and the TEN-TExecutive Agency. Through increased resources and co-funding rates, in particular forcross-border projects, the programme contributed to the achievement of some mode shift.

Freight on road: why EU shippers prefer truck to train____________________________________________________________________________________________
65
Of the 30 Priority Projects underway in 2010, 18 were railway projects, three combined railand-road infrastructure and 21 were cross-border projects. The focus of EU strategies inthis area has been recently strengthened by the new TEN-T Guidelines adopted in 2013.These have marked a shift from a patchwork of Priority Projects to a dual layer networkapproach, consisting of the Core Network, to be completed by 2030, and theComprehensive Network, addressing wider infrastructure links. The Core Network Corridorswill facilitate project implementation, with a focus on removing bottlenecks, buildingmissing cross-border connections, and promoting modal integration and interoperability.The nine Core Network Corridors are shown in the figure below.
Figure 21: TEN-T Core network corridors
Source: Steer Davies Gleave elaboration.
Targeted investment in ports and related intermodal facilities provides an example. Ports(both seaports and inland ports) are key points of modal transfer and 90% of Europe'sinternational trade is handled at these locations. They also handle almost 40% of intra-Community trade30. The Core Network will connect 83 main European ports with better railand road links. Similarly the Brenner Base Tunnel between Italy and Austria, co-funded bythe TEN-T programme, aims to remove a major bottleneck in an environmentally sensitivearea, shifting heavy traffic from road to a high quality rail service.
30 TEN-T Policy Review Green Paper.

Policy Department B: Structural and Cohesion Policies____________________________________________________________________________________________
66
The Connecting Europe Facility (CEF) regulation was also adopted in 2013. It sets outthe rules for awarding EU financial support for each type of project during the 2014-2020programme period. Under the CEF, €26.25 billion will be made available from the EU’s2014-2020 budget to co-fund TEN-T projects.
The approach adopted at the European level could pave the way to targeting investmentwhere it is more needed, providing shippers with better rail networks particularly for thepurpose of cross-border transport. These initiatives will depend on a number of factors, andwill rely on active involvement by Member States for co-funding.
4.3.2 Targeting road
A holistic strategy aimed at influencing shippers’ choices should encompass measurestargeting road as well as rail. The main historical drivers of growth in road freight transporthave been sustained investment in road building and upgrading by Member States overmany years, and a pattern of de-industrialisation and dispersion of the industrial productionprocess. As noted in Chapter 2, both factors have made road more competitive than rail fortransporting goods.
There are various policy measures that can reverse this trend, as discussed in Chapter 3.Road user charges intended to internalise the external environmental costs of roadtransport, and / or finance road maintenance and investment through the revenuescollected, exist in a number of Member States. However, the charging principles that areset at the EU level by the Eurovignette Directive have been applied in just nine MemberStates, and there are only a few national, network-wide tolling systems in place (e.g. inGermany, Poland, Austria). The unsuccessful attempts to introduce the Écotaxe (anenvironmental tax on all HGVs on the national road network) in France point to the politicaland practical difficulties of implementing country-wide charging schemes.
In addition, the evidence around the impact on mode choice of higher road user charges ismixed: some Member States where road charges are in place have achieved significantgrowth in rail freight (e.g. Germany, Austria), but others without any tolling systems havealso experienced substantial increases in rail freight volumes (e.g. UK, Denmark). Thissupports the conclusion that, in the context of relatively small cost differences betweenroad and rail, attributes other than cost affect mode choice by shippers. Road chargingshould therefore be viewed as a useful, but not sufficient, element of a broader strategy forincreasing the overall competitiveness of rail.
Against this background, a number of other policies targeting road can, directly orindirectly, favour a shift towards intermodal transport. As for rail-targeted strategies, theseinclude both regulatory and investment measures and are most successful whenimproving modal integration.
On the regulatory side, examples of incentives designed to support the growth ofintermodal transport include lower road taxes for hauliers involved in the provision ofintermodal services as well as relaxing regulations on the maximum weight and height forHGVs used to carry goods to and from rail freight terminals. Examples of investmentpromoting modal integration include rolling motorways (a form of combined transportallowing trucks to piggyback rail wagons for a section of their journeys) and improvingcargo handling facilities.

Freight on road: why EU shippers prefer truck to train____________________________________________________________________________________________
67
4.4. The elements of an effective strategy for mode shiftThere are several factors at play that determine shippers’ mode choice. Some of thesefactors pertain to the economic cycle and other macroeconomic and structural attributesthat are beyond the control of policy makers. In addition, de-industrialisation and thefragmentation of the logistics process can be seen as macro level factors limiting the abilityof shippers to choose rail over road and thus constraining the size of the contestablemarket.
However, the analysis carried out for this study suggests that active policies to encouragemode shift can have an impact on shippers’ choices by targeting the key factors affecting thecompetitiveness of rail freight. These policies encompass both regulatory incentives andtargeted investment measures, summarised in the following table. Each policy will need to beinitiated at the appropriate level (i.e. by Member States or by EU institutions) and willaddress different factors.
Table 7: The elements of an effective strategy for mode shift
Mode Policycategory
Policymeasure
Political level Factorsaddressed
Key successindicators
Rail
Regulatoryincentives
Infrastructurecharges
Member StatesCost
competiveness,innovation, final
price tocustomers
Long-term stability ofcharges
Marketcompetition
EU Legislation Transparency offrameworks
Monetaryincentives
Member States Mode shift avoidingdeadweight effects
Infrastructureinvestment
Intermodalfacilities
Member Statesand EU (CEF)
Quality ofservice, speedand reliability,
intermodalconnections
Growth in intermodaltransport market share
Cross-bordertransport
EU (CEF) andMember States
Growth in cross-bordertransport
Stimulateinvestment
Freight andlogisticscompanies,with support
Market growth anddomino effects withbetter quality services
RoadRegulatoryincentives
Incentives forintermodaltransport
Member StatesCost
competiveness,modal
integration
Growth in intermodaltransport market share
Infrastructureinvestment
Intermodalfacilities
Member Statesand EU (CEF)
Market growth, privateinvestment
Source: Steer Davies Gleave elaboration.
Two main conclusions can be drawn from the lack of effectiveness of past policies, as well asfrom the good practices identified by the national case studies. First, better coordination ofstrategies at different administrative levels, as well as across modes, will be needed. Second,it is important that mode shift strategies are tailored to the specific circumstances in whichthey are implemented.
The need for better coordination of mode shift strategies has been highlightedthroughout this study. As seen in the previous chapters there have been, and still are, anumber of national and EU level programmes aimed at incentivising a shift to rail throughmonetary incentives. However, these programmes have been subject to a number ofshortcomings. First, a patchwork approach to monetary incentives across, and within,Member States diminishes the effectiveness of each scheme, although the partial failure of anEU-wide approach to mode shift incentives (through the Marco Polo programme) suggeststhat achieving coordination at this level may be too difficult. Second, the lessons learnt from

Policy Department B: Structural and Cohesion Policies____________________________________________________________________________________________
68
each scheme need to be better shared within the industry. The forthcoming implementationof the Shift2Rail initiative should serve this purpose by focusing on solutions to enhancecapacity, consolidate reliability and improve the life cycle of the European rail system.Shift2Rail should therefore be supported by Member States and private funders.
The second level of coordination needed is between rail and road policies. Shippers typicallytrade the cost, time and convenience of these two modes against each other. Any measuresaffecting the competitive position of one mode have repercussions on the other. The failureto implement common road charging principles through the 1999 Eurovignette, and thedifficulties witnessed by Member States in implementing national charging schemes, act asreminders that mode shift strategies should not rely on road policies only.
While recognising the relative importance of regulatory incentives, this study identifiestargeted infrastructure investment as critically important in mode shift strategies. Therecognition that longer-distance, cross-border transport is most likely to shift from road torail is being reflected in the development of EU policies. In particular, the new TEN-T policyand the establishment of a Core Network, with key corridors along which to focusinvestment, are both directed towards encouraging the growth of longer distance rail freighttraffic.
Better coordination can be achieved in the identification and removal of persistentbottlenecks that limit the growth of rail freight. A corridor-based approach provides anopportunity for national governments, rail freight companies, infrastructure managers andlocal authorities to cooperate in terms of identifying and addressing those major barriers. Inthis respect, targeting investment and incentives with a view to addressing issues at the locallevel will continue to be important. Incentives focused on outputs, such as the grants (50%of capital cost) provided by the German Government to halt the decline of private sidings,and the bonus for intermodal transport introduced by the Italian government (a fixed sumper train-km carried by rail), are likely to be particularly effective: the German scheme hashad the effect of halting the decline in sidings observed since the early 1990s, while theItalian bonus scheme has clearly supported the growth of national rail freight volumes.
Finally, the implementation of effective strategies will require stable and sufficient fundingfrom both the EU and Member States. CEF will help in this respect by providing substantialresources to co-fund the development of the TEN-T network and ERTMS. While transportfunds are not ring-fenced under the new CEF policy, this could incentivise project sponsors tocompete for funding and demonstrate the real value added of each investment scheme.
More effort will be needed to reverse the trend decline in the mode share of rail freight. Thiscould come in the form of more strictly enforced long-term agreements between MemberStates providing more certainty around specific infrastructure projects to attract privateinvestors, as well as the channelling of further investment in rail infrastructure from othersources of funding, including Structural Funds and funding for research and development.New tools, such as those contained in the Shift2Rail initiative, demonstrate the scope forpolicy innovation at the European level.
In the light of future parliamentary debates on the actions to be taken by the EU to affect themode choice of shippers in favour of rail the above recommendations should be taken intoaccount to ensure that future strategies prioritise pro-rail policies with high leveragepotential, are suitably tailored to the characteristics of national markets, are well coordinatedacross levels of administration and modes, and receive an adequate level of funding.

Freight on road: why EU shippers prefer truck to train____________________________________________________________________________________________
69
REFERENCES
Brogan, J.J. & Aeppli, A.E. & Beagan, D.F & Brown, A. & Fischer, M.J. & Grenzeback,L.R. & McKenzie, E. & Vimmerstedt, L. & Vyas, A.D. & Witzke, E. (2013), FreightTransportation Modal Shares: Scenarios for a Low-Carbon Future, TransportationEnergy Futures Series, prepared by Cambridge Systematics, Inc. (Cambridge, MA), andthe National Renewable Energy Laboratory (Golden, CO) for the U.S. Department ofEnergy, Washington, DC. DOE/GO-102013-3705, 2013
Casullo, Lorenzo & Kohli, Serbjeet (Steer Davies Gleave) (2012), The Ascent of theWhite Van Man: Causes and Consequences, European Transport Conference, 2012 -trid.trb.org
Combes, François (2012), An empirical evaluation of the EOQ model of choice ofshipment size in freight transport, Transportation Research Record - Journal of theTRB, 2269 (2012), 92-98
Community of European Railways (2013), Rail Freight Status Report 2013, Rail freightafter a decade of EU rail policy, April 2013
Cook, Peter D. & Sanjay, Das & Aeppli, Andreas & Martland, Carl (1999), Key factors inroad-rail mode choice in India: applying the logistics cost approach, Proceedings of the31st conference on Winter simulation – A bridge to the future, vol. 2, pages 1280-1286,1999
Danielis, Romeo & Marcucci, Edoardo & Rotaris, Lucia (2005), Logistics managers'stated preferences for freight service attributes, Transportation Research Part E:Logistics and Transportation Review, Elsevier, vol. 41(3), pages 201-215, May 2005
De Jong, Gerard (Significance) & Schroten, Arno (CD Delft) & van Essen, Huib (CDDelft) & Otten Matthijs (CD Delft) & Bucci, Pietro (Significance) (2010), Price sensitivityof European road freight transport: towards a better understanding of existing results,Report 9012-1, 2010
De Jong, Gerard & Vierth, Inge & Tavasszy, Lori & Ben-Akiva, Moshe (2013), Recentdevelopments in national and international freight transport models within Europe,Transportation, Springer, vol. 40(2), pages 347-371, February 2013
Eelco den Boer & Huib van Essen & Femke Brouwer (CE Delft), Enrico Pastori &Alessandra Moizo (TRT) (2011), Potential of modal shift to rail transport – Study on theprojected effects on GHG emissions and transport volumes, Delft, March 2011
Eurogroup Consulting (2012), Rail freight, a competitive mode for the future in Europe?Viewpoints from shippers, operators and public bodies, Europe SITL – SemaineInternationale du Transport et de la Logistique, March 2012
Eurogroup Consulting (2014), Baromètre de perception des chargeurs sur le transportferroviaire, Eurogroup Consulting France, Puteaux Cedex
European Commission, (2011), White Paper: Roadmap to a Single European TransportArea – Towards a competitive and resource efficient transport system, CommissionStaff Working Paper
European Court of Auditors (2013), Have the Marco Polo programmes been effective inshifting traffic off the road?, Special Report No 3

Policy Department B: Structural and Cohesion Policies____________________________________________________________________________________________
70
Feo-Valero, María & García-Menéndez, Leandro & Sáez-Carramolino, Lorena & Furió-Pruñonosa, Salvador (2011), The importance of the inland leg of containerisedmaritime shipments: An analysis of modal choice determinants in Spain, Transportationresearch: an international journal, 2011, Amsterdam, Elsevier, ISSN 1366-5545, ZDB-ID 13809696. - Vol. 47.2011, 4, p. 446-461
García-Menéndez, Leandro & Martinez-Zarzoso, Inmaculada & Perez-Garcia, Eva Maria(2006), Transport Logistics and Modal Split of Spanish Exports to Europe: EmpiricalEvidence, Available at SSRN: http://ssrn.com/abstract=903048 orhttp://dx.doi.org/10.2139/ssrn.903048
Grue, Berit & Ludvigsen, Johanna (2006), Decision factors underlying transport modechoice in European freight transport, Association for European Transport andcontributors
Holzhey, Michael (KCW GmbH) (2010), Schienennetz 2025/2030: Ausbaukonzeptionfür einen leistungsfähigen Schienengüterverkehr in Deutschland, Berlin,Umweltbundesamt
H.P. van Essen, B.H. Boon, A. Schroten, M. Otten (CE Delft); M. Maibach and C.Schreyer (INFRAS); C. Doll (Fraunhofer Gesellschaft - ISI); P. Jochem (IWW); M. Bakand B. Pawlowska (University of Gdansk) (2008), Internalisation measures and policyfor the external cost of transport – Produced within the study Internalisation Measuresand Policies for all external cost of Transport (IMPACT) – Deliverable 3 Delft, CE Delft,2008
ITF, OECD (2013), Road Haulage Charges and Taxes - Summary analysis and datatables 1998-2012, Discussion Paper 2013-8
Kofteci, Sevil & Ergun, Murat & Ay, Serpil (2010), Modeling freight transportationpreferences: Conjoint analysis for Turkish Region, Scientific Research and Essays Vol.5(15), pp. 2016-2021, 4 August, 2010
Krenz, A. Rubel, G. (2010), Industrial Localization and Countries' Specialization in theEuropean Union: An Empirical Investigation, University of Gottingen, CEGE DiscussionPapers, Number 106
Müller, Jürgen (McKinsey) & Girardet, Daniel (McKinsey) & Ott, Anselm (McKinsey) &Zils, Markus (2014), Bold moves needed to secure modal share, Railway GazetteInternational, DVV Media UK Ltd., September 2014, pp. 74-80.
NEA Transport research and training BV, COWI, IWW, NESTEAR, PWC, TINA, IVT,HERRY, MKmetric (2004), TEN-STAC: Scenarios, Traffic Forecasts and Analysis ofCorridors on the Trans-European network – Traffic, Bottlenecks and environmentalanalysis on 25 corridors, NEA Transport research and training BV, 2009
Patterson, Zachary & Ewing, Gordon & Haider, Murtaza (2008), Shipper PreferencesSuggest Strong Mistrust of Rail: Results from Stated Preference Carrier Choice Surveyfor Quebec City-Windsor Corridor in Canada, Transportation Research Record: Journalof the TRB, 2008, pp 67-74.
Policy Research Corporation (PRC) (2007), Onderzoek naar de effecten van eengeforceerde modal shift, Rotterdam, 2007
Samimi, Amir & Mohammadian, Abolfazl & Kawamura, Kazuya (2010), A behavioralfreight movement microsimulation model: method and data, Transportation Letters:The International Journal of Transportation Research, vol. 2: (53-62), 2010

Freight on road: why EU shippers prefer truck to train____________________________________________________________________________________________
71
Shinghal, Nalin & Fowkes, Tony (2002), Freight mode choice and adaptive statedpreferences, Transportation Research Part E: Logistics and Transportation Review,Elsevier, vol. 38(5), pages 367-378, September 2002
Tavasszy, L. van Meijeren, J. (2011), Modal shift target for transport above 300km: Anassessment, Discussion Paper – 17th ACEA SA G Meeting – October 2011
Vassallo, Jose & Fagan, Mark (2007), Nature or nurture: why do railroads carry greaterfreight share in the US than in Europe?, Transportation, Springer, vol. 34(2), pages177-193, March 2006
Zimmer, Wiebke & Schmied, Martin (Öko-Institut) (2008), Potentials for a modal shiftfrom road to rail and ship: methodological approach, ETC/ACC, December 2008, 62 pp.


