freight efficiency and competitiveness phase i - competitiveness phase i appendices june 2006 ......
TRANSCRIPT

Prepared for the
in cooperation with U.S. Department of Transportation
Federal Highway Administration
Freight Efficiency & Competitiveness Phase I
Appendices
June 2006
Prepared By
Wilbur Smith Associates Heffron Transportation
NohBell Group RNO Group
Freight Efficiency & Competitiveness Phase IFinal Report
Appendix A Survey Form
This appendix contains the survey form used for this study. The survey form was used as a template to help guide the interview process. Upon request, a copy of the survey was provided to the interviewee to help prepare and collect the data for the interview.
Wilbur Smith Associates with Heffron Transportation, NohBell Group, & RNO Group
June 2006 Page A - 1

1
FREIGHT COMPETITIVENESS
& EFFICIENCY SURVEY
Pre-Interview Questionnaire (To Provide Interviewee with Sample Questions)
Purpose of Interview:
1. Provide background information about company logistics patterns in the Puget Sound region.
2. Identify bottlenecks or deficiencies in the current transportation system of the Region that
hampers business operations.
3. Identify performance measures (i.e. time, operating costs) for each segment of the supply
chain.
Data to be gathered includes:
1. Overall commodities moving to and from the region
2. Daily, weekly, or seasonal peaks in either outbound or inbound shipments
3. Major market destinations for inbound and outbound shipments
4. Greatest obstacles due to transportation infrastructure in achieving efficient supply chain
management.
Organization of Questionnaire:
1. Background – 3 questions
2. Inbound transportation – 8 questions
3. Outbound transportation – 8 questions
4. Supply chain segmentation – 9 questions
5. Overall transportation/logistics – 5 questions

2
FREIGHT COMPETITIVENESS & EFFICIENCY SURVEY
INTERVIEWER:
DATE:
Company Name:
Location/Address:
Contact: Title:
Phone: e-mail:
Background
1. How many full time employees does your company employ in the Puget Sound region?
Please check the one applicable to your firm (optional)
a. ___ Under 100 b. ___ 100-300 c. ___ OVER 300
2. How long has this operation been at its current location? ___________years.
3. What are typical hours of operation for your facility?
a. Daytime only from _______ a.m. to _______ p.m.
b. Day / Evening from _______ a.m. to _______ p.m.
c. ____ 24 hours a day
3
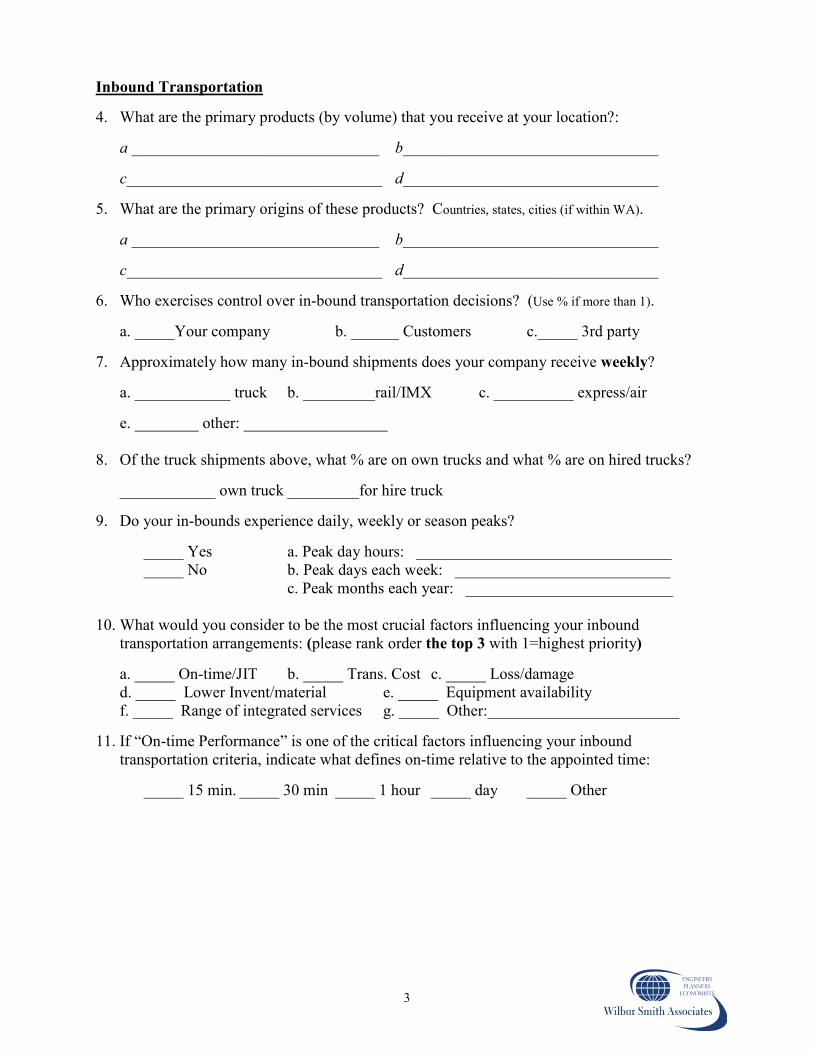
Inbound Transportation
4. What are the primary products (by volume) that you receive at your location?:
a _______________________________ b________________________________ c________________________________ d________________________________
5. What are the primary origins of these products? Countries, states, cities (if within WA).
a _______________________________ b________________________________ c________________________________ d________________________________
6. Who exercises control over in-bound transportation decisions? (Use % if more than 1).
a. _____Your company b. ______ Customers c._____ 3rd party
7. Approximately how many in-bound shipments does your company receive weekly?
a. ____________ truck b. _________rail/IMX c. __________ express/air
e. ________ other: __________________
8. Of the truck shipments above, what % are on own trucks and what % are on hired trucks?
____________ own truck _________for hire truck
9. Do your in-bounds experience daily, weekly or season peaks?
_____ Yes a. Peak day hours: ________________________________
_____ No b. Peak days each week: ___________________________
c. Peak months each year: __________________________
10. What would you consider to be the most crucial factors influencing your inbound
transportation arrangements: (please rank order the top 3 with 1=highest priority)
a. _____ On-time/JIT b. _____ Trans. Cost c. _____ Loss/damage
d. _____ Lower Invent/material e. _____ Equipment availability
f. _____ Range of integrated services g. _____ Other:________________________
11. If “On-time Performance” is one of the critical factors influencing your inbound
transportation criteria, indicate what defines on-time relative to the appointed time:
_____ 15 min. _____ 30 min _____ 1 hour _____ day _____ Other

4
Outbound Transportation
12. What are the primary products (by volume) that you ship from your location?:
a _______________________________ b________________________________ c________________________________ d________________________________
13. What are the primary destinations for these products? Countries, states, cities (if within WA).
a _______________________________ b________________________________ c________________________________ d________________________________
14. Who exercises control over out-bound transportation decisions? (Use % if more than 1).
a. _____Your company b. ______ Customers c._____ 3rd party
15. Approximately how many out-bound shipments does your company receive weekly?
a. ____________ truck b. _________rail/IMX c. __________ express/air
e. ________ other: __________________
16. Of the truck shipments above, what % are on own trucks and what % are on hired trucks?
____________ own truck _________for hire truck
17. Do your out-bounds experience daily, weekly or season peaks?
_____ Yes a. Peak day hours: ________________________________
_____ No b. Peak days each week: ___________________________
c. Peak months each year: __________________________
18. What would you consider to be the most crucial factors influencing your out-bound
transportation arrangements: (please rank order the top 3 with 1=highest priority)
a. _____ On-time/JIT b. _____ Trans. Cost c. _____ Loss/damage
d. _____ Lower Invent/material e. _____ Equipment availability
f. _____ Range of integrated services g. _____ Other:________________________
19. If “On-time Performance” is one of the critical factors influencing your out-bound
transportation criteria, indicate what defines on-time relative to the appointed time:
_____ 15 min. _____ 30 min _____ 1 hour _____ day _____ Other
Supply Chain Segmentation
Purpose of the following sets of questions is to broadly segment your overall supply chain, to
determine which segments are most sensitive to key performance measures. Specifically, which
segments are most prone to materials build-up/bottlenecking, most sensitive to level of
service/time/delay, and which have the highest transport costs. And why.

5
20. Sensitivity to material ownership: Which three supply chain segments have the highest
share of inventory/material ownership?
Supply Chain Segment 1: a. Material/Product:______________________________________
b. Origin: __________________________ Dest: _____________________________
c. Mode (circle one): Rail Truck Ship Barge Air d. Routing: ______________________
e. Where does inventory build-up (circle one): Supplier Plant DC Along line haul
f. Share of total inventory/material cost________________________________________
g. Top factors that influence inventory levels?: % Contribution
________________________________________________ ________________
________________________________________________ ________________
h. How does materials build-up along this segment impact your overall operation:
______________________________________________________________________
Supply Chain Segment 2: a. Material/Product:______________________________________
b. Origin: __________________________ Dest: _____________________________
c. Mode (circle one): Rail Truck Ship Barge Air d. Routing: ______________________
e. Where does inventory build-up (circle one): Supplier Plant DC Along line haul
f. Share of total inventory/material cost________________________________________
g. Top factors that influence inventory levels?: % Contribution
________________________________________________ ________________
________________________________________________ ________________
h. How does materials build-up along this segment impact your overall operation:
______________________________________________________________________
Supply Chain Segment 3: a. Material/Product:______________________________________
b. Origin: __________________________ Dest: _____________________________
c. Mode (circle one): Rail Truck Ship Barge Air d. Routing: ______________________
e. Where does inventory build-up (circle one): Supplier Plant DC Along line haul
f. Share of total inventory/material cost________________________________________
g. Top factors that influence inventory levels?: % Contribution
________________________________________________ ________________
________________________________________________ ________________
h. How does materials build-up along this segment impact your overall operation:
______________________________________________________________________

6
21. Sensitivity to level of service/time: Which three supply chain segments have the greatest
variance in level of service/time?
Supply Chain Segment 1: a. Material/Product:______________________________________
b. Origin: __________________________ Dest: _____________________________
c. Mode (circle one): Rail Truck Ship Barge Air d. Routing: ______________________
e. Where dwelling/delay occurs (circle one): Supplier Plant DC Along line haul
f. Share of total supply chain/process time ________________________________________
g. Top factors that influence delay/dwell: % Contribution
________________________________________________ ________________
________________________________________________ ________________
h. How do delays/dwell time along this segment impact your overall operation:
______________________________________________________________________
Supply Chain Segment 2: a. Material/Product:______________________________________
b. Origin: __________________________ Dest: _____________________________
c. Mode (circle one): Rail Truck Ship Barge Air d. Routing: ______________________
e. Where dwelling/delay occurs (circle one): Supplier Plant DC Along line haul
f. Share of total supply chain/process time ________________________________________
g. Top factors that influence delay/dwell: % Contribution
________________________________________________ ________________
________________________________________________ ________________
h. How do delays/dwell time along this segment impact your overall operation:
______________________________________________________________________
Supply Chain Segment 3: a. Material/Product:______________________________________
b. Origin: __________________________ Dest: _____________________________
c. Mode (circle one): Rail Truck Ship Barge Air d. Routing: ______________________
e. Where dwelling/delay occurs (circle one): Supplier Plant DC Along line haul
f. Share of total supply chain/process time ________________________________________
g. Top factors that influence delay/dwell: % Contribution
________________________________________________ ________________
________________________________________________ ________________
h. How do delays/dwell time along this segment impact your overall operation:
______________________________________________________________________

7
22. Sensitivity to transportation costs: Which supply chain segments represent the highest
transportation costs as a share of overall supply chain transportation costs?
Supply Chain Segment 1: a. Material/Product:______________________________________
b. Origin: __________________________ Dest: _____________________________
c. Mode (circle one): Rail Truck Ship Barge Air d. Routing: ______________________
e. Where is cost allocated (circle one): Supplier Plant DC Along line haul
f. Share of total supply chain transport cost ________________________________________
g. Top factors that influence transport cost: % Contribution
________________________________________________ ________________
________________________________________________ ________________
h. How do transport costs along this segment impact your overall operation:
______________________________________________________________________
Supply Chain Segment 2: a. Material/Product:______________________________________
b. Origin: __________________________ Dest: _____________________________
c. Mode (circle one): Rail Truck Ship Barge Air d. Routing: ______________________
e. Where is cost allocated (circle one): Supplier Plant DC Along line haul
f. Share of total supply chain transport cost ________________________________________
g. Top factors that influence transport cost: % Contribution
________________________________________________ ________________
________________________________________________ ________________
h. How do transport costs along this segment impact your overall operation:
______________________________________________________________________
Supply Chain Segment 3: a. Material/Product:______________________________________
b. Origin: __________________________ Dest: _____________________________
c. Mode (circle one): Rail Truck Ship Barge Air d. Routing: ______________________
e. Where is cost allocated (circle one): Supplier Plant DC Along line haul
f. Share of total supply chain transport cost ________________________________________
g. Top factors that influence transport cost: % Contribution
________________________________________________ ________________
________________________________________________ ________________
h. How do transport costs along this segment impact your overall operation:
______________________________________________________________________

8
Overall Transportation/Logistics Management
23. What is the greatest challenge your currently face in meeting your company’s transportation
/ logistics needs?
______________________________________________________________________________
______________________________________________________________________________
24. From a business perspective, what do you feel is the weakest link in the transportation
services currently available in the Puget Sound Region?
______________________________________________________________________________
______________________________________________________________________________
25a. Which modes of transportation would you most like to see improved in the transportation
system of the Puget Sound Region?
______________________________________________________________________________
25b. What part of the transportation system would you fix? And how?
26. Do you currently collaborate with any other companies for any parts of your supply chain
(e.g. warehousing, transportation, etc). If so, how?
27a. What type of supply chain management software do you use, and is it able to provide real-
time information about products in transit? __________________________________________
27b. Does it provide real time information about traffic tie ups, congestion at terminals, etc. –
Would such information be useful? ________________________________________________
27b. Are there any circumstances under which you would be willing to share information with
public agencies (e.g. information about traffic conditions, etc). _______________________________________

Freight Efficiency & Competitiveness Phase IFinal Report
Appendix B Supply Chain Summary
Wilbur Smith Associates with Heffron Transportation, NohBell Group, & RNO Group
June 2006 Page B-1

Freight Efficiency & Competitiveness Phase IFinal Report
Appendix C Industry Interview Summaries
Interview Summaries Attached:
1. Quadrant Homes, Bob’s New Construction, and Woodinville Lumber
2. Bob’s New Construction Warehouse
3. Woodinville Lumber Yard
4. Cadman, Inc.
5. International Beverage Company (name withheld)
6. Processed Food Company (name withheld)
7. Starbucks Coffee Company
8. Trident Seafoods
9. United States Bakery (Franz)
10. Boeing Corporation
11. Goodrich Aircraft Technical Services
12. Goodrich Cargo Group
13. TMX Aerospace
14. Carlile Transportation Systems
Wilbur Smith Associates with Heffron Transportation, NohBell Group, & RNO Group
June 2006 Page C - 1

Freight Efficiency & Competitiveness Phase I Final Report
INTERVIEW SUMMARY Project: Freight Efficiency & Competitiveness Phase 1
Subject: Interview with Quadrant Homes, Bob’s New Construction, and Woodinville Lumber
Interview Date: November 7, 2005
Interviewers: Tom Jones and Sophie Hartshorn
Attendees
Mark Gray Senior Vice President Quadrant Homes 1110 112th Ave NE, Suite 300 Bellevue, WA 98009 [email protected] Vern Olson Bob’s New Construction (Pacific Heating, Inc.) 13633 NE 126th Pl., #350 Kirkland, WA 98034 [email protected] Craig MacKay Woodinville Lumber 15900 Woodinville Redmond Rd. NE Woodinville, WA 98072 [email protected]
Summary of Business Operations
Quadrant Quadrant is the number-one single-family home builder in the Puget Sound region, averaging 15,000-18,000 new homes every year for the past 5 years. They employ about 200 people in their Bellevue offices, with an additional 50 sales agents out in the field.
Wilbur Smith Associates with Heffron Transportation, NohBell Group, & RNO Group
June 2006 Quadrant/Bob’s/Woodinville-1

Freight Efficiency & Competitiveness Phase I Final Report
Quadrant works on a what they call an “evenflow” system, where each home is completed on a very aggressive set schedule. In general, at any point in time there are:
• 6 new homes started each day • Over 300 homes sold but not started • 60 homes sold but not released for construction • Over 300 homes in process • A 6-week backlog of homes
In general, this system appears to be one that is reliable and efficient. Woodinville Lumber Woodinville Lumber (WL) is the primary supplier of floor joists, walls, trusses and pre-manufactured framing panels for Quadrant homes. All materials used in the Puget Sound region are distributed out of a large Central Distribution site (CD) in Woodinville. This site is approximately 18 acres in size, and is used to store several day’s worth of inventory. A smaller distribution and truss manufacturing facility exists in Burlington, Washington, but this site only sees about 15 percent of all revenue (and a corresponding amount of the volume of lumber). Together, the two sites employ about 500 people. Since Quadrant homes is one of the largest clients of WL, the service area of WL tends to grow geographically and volumetrically similar to Quadrant. Bob’s New Construction Bob’s New Construction (BNC) distributes and installs furnaces, air coolers, water heaters, and all associated parts and craftsmanship into the majority of Quadrant Homes. They are headquartered in Kirkland, with additional locations in Tacoma and Burlington that are operationally similar to the Kirkland site. These remote sites exist in order to serve the expanding Quadrant Homes market in these two regions. All sites are large enough to hold a backlog of inventory, and also to serve as a staging area for unloading and loading trucks. BNC employs 158 employees, and owns its own fleet of 118 trucks.
Inbound Transportation
Quadrant Quadrant relies on many products to complete homes, including:
1. Lumber (wood) 2. Sheet rock 3. Concrete 4. Dirt
Numerous other products, including sinks, furnaces, panels, etc., are also needed to complete a house. In all cases, Quadrant asks the supplier to bring each product directly to the jobsite. Quadrant Homes therefore does not directly oversee any inbound or outbound shipments.
Wilbur Smith Associates with Heffron Transportation, NohBell Group, & RNO Group
June 2006 Quadrant/Bob’s/Woodinville-2
Freight Efficiency & Competitiveness Phase I Final Report
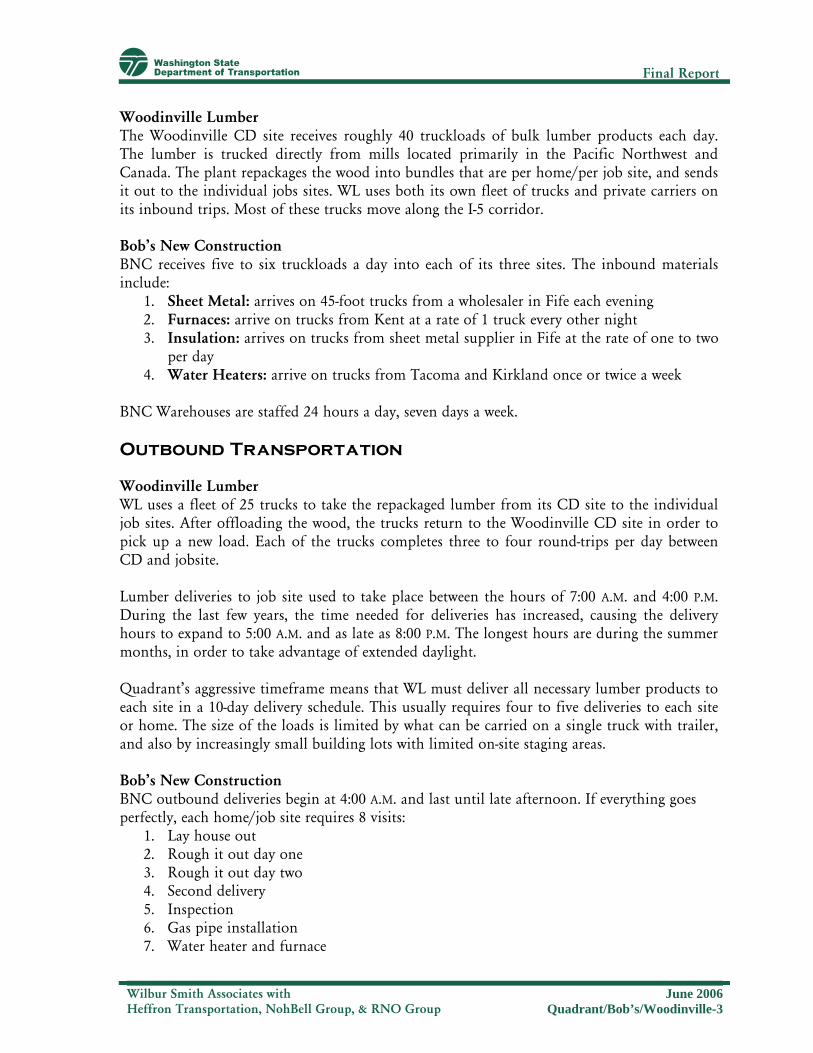
Woodinville Lumber The Woodinville CD site receives roughly 40 truckloads of bulk lumber products each day. The lumber is trucked directly from mills located primarily in the Pacific Northwest and Canada. The plant repackages the wood into bundles that are per home/per job site, and sends it out to the individual jobs sites. WL uses both its own fleet of trucks and private carriers on its inbound trips. Most of these trucks move along the I-5 corridor. Bob’s New Construction BNC receives five to six truckloads a day into each of its three sites. The inbound materials include:
1. Sheet Metal: arrives on 45-foot trucks from a wholesaler in Fife each evening 2. Furnaces: arrive on trucks from Kent at a rate of 1 truck every other night 3. Insulation: arrives on trucks from sheet metal supplier in Fife at the rate of one to two
per day 4. Water Heaters: arrive on trucks from Tacoma and Kirkland once or twice a week
BNC Warehouses are staffed 24 hours a day, seven days a week. Outbound Transportation
Woodinville Lumber WL uses a fleet of 25 trucks to take the repackaged lumber from its CD site to the individual job sites. After offloading the wood, the trucks return to the Woodinville CD site in order to pick up a new load. Each of the trucks completes three to four round-trips per day between CD and jobsite. Lumber deliveries to job site used to take place between the hours of 7:00 A.M. and 4:00 P.M. During the last few years, the time needed for deliveries has increased, causing the delivery hours to expand to 5:00 A.M. and as late as 8:00 P.M. The longest hours are during the summer months, in order to take advantage of extended daylight. Quadrant’s aggressive timeframe means that WL must deliver all necessary lumber products to each site in a 10-day delivery schedule. This usually requires four to five deliveries to each site or home. The size of the loads is limited by what can be carried on a single truck with trailer, and also by increasingly small building lots with limited on-site staging areas. Bob’s New Construction BNC outbound deliveries begin at 4:00 A.M. and last until late afternoon. If everything goes perfectly, each home/job site requires 8 visits:
1. Lay house out 2. Rough it out day one 3. Rough it out day two 4. Second delivery 5. Inspection 6. Gas pipe installation 7. Water heater and furnace
Wilbur Smith Associates with Heffron Transportation, NohBell Group, & RNO Group
June 2006 Quadrant/Bob’s/Woodinville-3

Freight Efficiency & Competitiveness Phase I Final Report
8. Trim
It is important to note that only half of these visits originate at the BNC warehouses. Trips made by employees to the job sites begin at their homes, since they generally bring the work trucks home with them at the end of the day. Out of 158 employees, generally half of these will start their day from places dispersed though out the Puget Sound region. BNC has furnished maps to illustrate where their employees live. Risk management has caused BNC to install GPS units in each of its trucks. This helps to track the amount of miles driven, and to control the use and movement of BNC-owned trucks. BNC offered the following information about its fleet:
1. All trucks drive about 153,333 miles/month total 2. That breaks down to about 1,291 mile/month/vehicle
Supply Chain Segmentation
Woodinville Lumber WL is seeing its time and costs of shipping increase every year. This is due to:
1. Increasing fuel costs 2. Increasing time lost to congestion 3. Increasing geographic spread of market
The inefficiencies caused by these three factors are passed on to Quadrant, and ultimately on to the consumer. WL has responded to these factors by:
1. Increasing delivery hours from eight or nine to 12 hours per day 2. Doubling the number of trucks used, although volumes have only increased 20
percent in the last few years. 3. Assembling more and more parts off-site and trucking them to the job site. 4. Increasing the size of the shipments by using larger trucks and adding trailers (thus
saving fuel by taking fewer trips). Though WL says that “most” of the roadway network is problematic, its biggest problems are on:
1. I-405 2. SR 167
Bob’s New Construction BNC is struggling with the same challenges as WL:
1. Increasing fuel costs 2. Increasing time lost to congestion 3. Increasing geographic spread of market
Wilbur Smith Associates with Heffron Transportation, NohBell Group, & RNO Group
June 2006 Quadrant/Bob’s/Woodinville-4

Freight Efficiency & Competitiveness Phase I Final Report
The inefficiencies caused by these three factors are passed on to Quadrant, and ultimately on to the consumer. Between January and September, fuel prices rose $1.02 per gallon. This worked out to an additional $16,614 in fuel costs. Though BNC says that “most” of the roadway network is problematic, it’s biggest problems are on:
1. I-405 2. SR 167 3. SR 410 4. SR 18 5. I-5
Policy Issues
Woodinville Lumber WL occasional suffers inefficiencies in its freight delivery system during morning delivery of large loads on I-5. Regulations on this highway prohibit the moving of oversize vehicles south of Burlington on I-5 until after 9:00 A.M. Bob’s New Construction BNC is experimenting internally with ways to counteract productivity lost to congestion. It is working with new loading/unloading technologies, longer hours, and more efficient warehousing in order to make up some of the time lost to congestion.
Wilbur Smith Associates with Heffron Transportation, NohBell Group, & RNO Group
June 2006 Quadrant/Bob’s/Woodinville-5

Freight Efficiency & Competitiveness Phase I Final Report
INTERVIEW SUMMARY Project: Freight Efficiency & Competitiveness Phase 1
Subject: Interview with Bob’s New Construction Warehouse
Interview Date: December 16, 2005
Interviewer: Sophie Hartshorn
Attendees
Patrick Beulke Bob’s New Construction Safety Fleet Project and Cell Phone Communications Manager 206-378-6734 This was a follow up interview to the Quadrant/Woodinville Lumber meeting of 11/7/2005. It involved the Yard Manager at Bob’s New Construction, one of the major suppliers of furnaces, water heaters, and other HVAC equipment to Quadrant Homebuilders. It was conducted in order to get a better understanding of the truck movements and schedules of a major second-tier construction company in the Puget Sound region. Summary of Business Operations
Bob’s New Construction (BNC) is one of the largest suppliers of residential HVAC equipment in the Pacific Northwest. It owns a fleet of 115 vehicles, of which 90 percent are cargo vans and about 10 percent are flatbed trucks. BNC is a major supplier to Quadrant Homes, which accounts for about 25-35 percent of all BNC business. BNC has three warehouse locations, in Burlington, Tacoma, and Kirkland. These three warehouse locations collectively serve an area that is bordered by Canada to the north, Olympia to the south, North Bend to the east, and the Pacific Ocean to the west. Each warehouse serves its local market segment. In general, each warehouse exists for three purposes:
1. Receive vendor shipments of water heaters, coolers, etc. 2. Store parts as inventory so that “several days’ worth” are always on hand 3. Serve as a distribution point to carry materials from warehouse to job site
As is evidenced by the above language, BNC does not operate on “just-in-time” (JIT) inventory. The warehouses are kept stocked with a good amount of inventory.
Wilbur Smith Associates with Heffron Transportation, NohBell Group, & RNO Group
June 2006 Bob’s New Construction-1

Freight Efficiency & Competitiveness Phase I Final Report
Inbound Transportation
BNC receives vendor deliveries into its three warehouses between the hours of 6:30 and 7:00 A.M. It is estimated that 4-10 trucks make drops at each warehouse during this time period. Other things to note about the vendor deliveries include:
• BNC employees do not help with the unloading of vendor trucks. • Gensco, a major vendor, actually has a full-time employee in the BNC warehouse to
oversee delivery, unloading, and warehousing of Gensco products. • Since JIT inventory is not kept at BNC, congestion is not really an issue for these inbound
shipments. There is never a situation where delay causes a part to be missing or out of stock.
Outbound Transportation
BNC outbound shipments consist of the BNC fleet of cargo vans and flatbed trucks leaving each of the warehouses and traveling out to job sites. This occurs every Monday, Wednesday, and Friday. The vehicles in the fleet are driven by employees, who take the vans home and drive directly to the job site on the second day. This minimizes the time lost to travel between warehouse and jobsite. It also decreases the amount of usable parking needed at each warehouse. Other outbound shipment facts include:
1. Between 5:00 and 6:00 A.M. on Monday, Wednesday, and Friday, 15-40 empty trucks enter each warehouse location.
2. Each truck/van comes in empty except for returned parts and garbage. 3. The load time is therefore quite short, about 35 minutes average per truck. 4. Drivers are not fined for slow delivery; however, very fast drivers are rewarded. Rewards
are usually monthly and take the form of a $50 gift certificate or something akin to that. 5. Eight vans can be loaded at one time; fewer flatbed trucks can be loaded simultaneously.
Innovations/Adaptations
BNC’s major innovation to fight the time lost to congestion is a “2nd Day Delivery” system. In essence, this system streamlines the amount of time lost to driving by streamlining the delivery of forgotten, broken, or incorrect parts. 2nd Day Delivery operates like this:
• A truck at a job site realizes that it has an incorrect, broken, or wrong part after pickup and delivery on Monday.
• Instead of turning around on Tuesday and driving back to the warehouse, the truck instead faxes the warehouse with a description of the issue.
• The warehouse organizes all the parts and loads them onto a single truck (one operates north of I-90, one operates south of I-90).
• The truck leaves the warehouse at 4:00 A.M. the next day, delivering all of the parts to the correct worksites, and saving each individual driver from having to make a journey.
They have also done the following to combat time lost to travel/congestion:
• Changed delivery start time from 6:00 A.M. to 5:00 A.M., in order to make one delivery before the morning rush.
• Equipped each driver with a walkie-talkie to keep in touch with other drives and discuss problemmatic traffic points.
Wilbur Smith Associates with Heffron Transportation, NohBell Group, & RNO Group
June 2006 Bob’s New Construction-2

Freight Efficiency & Competitiveness Phase I Final Report
• Equipped each truck with a GPS unit. This is done to track the movements of the trucks
and to record the unloading/dwell time at each warehouse or job site. • Developed efficiency gains in the yard, such as streamlining the loading and unloading
process, and being more creative so that turn-around time for trucks is shorter. • Loaded the night before in order to get the earliest trucks on the road ASAP in the
morning.
Infrastructure Issues
Most BNC shipments are north-south, traveling on roads in the Olympia-to-Canada corridor. Therefore, 520 or I-90 are not counted as problematic. Instead, the worst infrastructure issues are:
• I-5, especially near Everett and up to Route 2 • I-405, especially northbound through the S-curves • 167 to Tacoma
Policy Issues
BNC does not notice many ramifications of policy issues on its truck movements. The one policy it mentioned is that HOV lanes do not accept flatbed trucks.
Wilbur Smith Associates with Heffron Transportation, NohBell Group, & RNO Group
June 2006 Bob’s New Construction-3

Freight Efficiency & Competitiveness Phase I Final Report
INTERVIEW SUMMARY Project: Freight Efficiency & Competitiveness Phase 1
Subject: Interview with Woodinville Lumber Yard
Interview Date: November 22, 2005
Interviewer: Sophie Hartshorn
Attendees
Eric Conklin Woodinville Lumber Yard Manager 425-766-2993 This was a follow up interview to the Quadrant/Woodinville Lumber meeting of 11/7/2005. It involved the Yard Manager at Woodinville Lumber, one of the major suppliers of lumber to Quadrant Homebuilders. It was conducted in order to get a better understanding of the truck movements and schedules of a major lumber company in the Puget Sound region. This interview also clarified that the Woodinville Lumber Truss plant has a separate set of trucking issues due to the high volume of oversize loads.
Summary of Business Operations
The Woodinville umber yard serves as the main facility for all of Woodinville Lumber’s receiving, repackaging, and re-distribution of lumber. Lumber arrives, by truck, from mills all over the Pacific Northwest and Canada. It is then repackaged in the Woodinville facility, loaded onto another truck, and taken to the job sites.
Inbound Transportation
The Woodinville lumber yard receives 10-12 inbound truck shipments per day into the Woodinville facility. Roughly half of these trucks come from within the Puget Sound region. The other half comes from locations within British Columbia, Canada. Receiving hours at the yard are from 6:00 A.M. to 2:30 P.M. Later deliveries, up to 7:00 P.M., are possible by limited appointment only. The vast majority of inbound shipments use independent carriers not affiliated with Woodinville Lumber.
Wilbur Smith Associates with Heffron Transportation, NohBell Group, & RNO Group
June 2006 Woodinville Lumber Yard-1

Freight Efficiency & Competitiveness Phase I Final Report
The following apply to shipments received from Canada:
• The deliveries are set by appointment, at the rate of one per hour. There is no fine levied in the event of a missed delivery appointment.
• Every effort is made to unload trucks as soon as they are brought in. • Three to four times a month, a truck is delayed at the border. Most trucks use Blaine
border crossing. • Increasingly, trucks are arriving at odd hours outside of their appointment time. For
example, many times trucks will arrive at 6:00 A.M., even though their appointment is not until 10:00 A.M. If possible, these trucks are accommodated. However, they are occasionally asked to circle around for a few hours until the yard can accommodate them. In addition, there is a two-truck “waiting area” in the yard. The costs for these delays are borne by the carrier.
• It takes about 15 minutes to half an hour to unload the truck and get it back on the road.
Outbound Transportation
The Woodinville lumber yard owns 12 trucks dedicated to outbound shipments. These 12 trucks are responsible for 99 percent of the outbound shipments from the yard. The outbound shipments occur between the hours of 5:00 A.M. and 5:00 P.M. daily. The following apply to shipments leaving the lumber yard:
• The majority of outbound shipments go south, towards Dupont, Puyallup, etc. • About 35-40 trucks leave the plant each day. This means that each of the 12 trucks is
completing three to four trips per day. • GPS units are installed on each truck. This was done in order to:
o Manage driver productivity o Keep a log file of truck movements in the event of a reported accident or report
of property damage due to trucks (i.e., a rock breaking a windshield) o Track turnaround times and look at the length of stops
• Two truck types are used for outbound shipments. The two types have slightly different loading and unloading characteristics.
o Tractor trailers Have a one-hour average turnaround time. This represents the time for
the driver to return to the yard, take a break, and reload with lumber before leaving the yard fully loaded.
Carry a forklift to make deliveries at job sites. Take about 45 minutes at each jobsite in order to get forklift off, unload
lumber, and reload forklift. Try to visit three job sites per trip.
o 10-wheeled flatbeds Have a 50minute average turnaround time at the lumber yard. Take about 20 minutes to unload lumber at each jobsite. Try to visit two to three job sites per trip.
Wilbur Smith Associates with Heffron Transportation, NohBell Group, & RNO Group
June 2006 Woodinville Lumber Yard-2
Freight Efficiency & Competitiveness Phase I Final Report
Innovations/Adaptations
Woodinville lumber yard has undergone several adaptations and innovations to try and cut time from the overall delivery process. These adaptations have been in three main categories:
1. Decreasing time lost in loading/unloading and other “dwell” time 2. Increasing hours of operation to try and combat increasing congestion 3. Incorporating traffic management devices
More specifically, they have done the following:
• Changed delivery start time from 6:00 A.M. to 5:00 A.M., in order to make one delivery before the morning rush.
• Installed traffic gauges on all trucks, so truckers can see upcoming congestion/safety concerns.
• Increased the amount of traffic monitoring and feedback to drivers (including DOT camera monitoring)
• Developed their own dispatch and traffic monitoring system, operated by two people. • Developed efficiency gains in the yard, such as streamlining the loading and unloading
process, and being more creative so that turnaround time for trucks is shorter.
Infrastructure Issues
Most of the Woodinville lumber shipments are north-south, either from Canada and points north, or en route to places such as Puyallup or Dupont. Therefore, the worst infrastructure issues are:
• I-5, especially southbound in the morning • I-405, both directions, most of the day after 5:45 A.M.
Policy Issues
Time restrictions on oversize loads are a concern, particularly the rule that no oversize trucks may move on I-5 until after 9:00 A.M. This problem is exacerbated on the day before holidays, (such as December 23); when all oversized loads must be off the freeway by noon.
Wilbur Smith Associates with Heffron Transportation, NohBell Group, & RNO Group
June 2006 Woodinville Lumber Yard-3

Freight Efficiency & Competitiveness Phase I Final Report
INTERVIEW SUMMARY Project: Freight Efficiency & Competitiveness Phase 1
Subject: Interview with Cadman, Inc.
Interview Date: September 29, 2005
Interviewer: Marni C. Heffron, P.E., P.T.O.E.
Attendee
Rob Johnson, Vice President, Concrete Cadman, Inc. 7554 – 185th Avenue NE P.O. Box 97038 Redmond, WA 98073-9738 Phone: (425) 961-7155 e-mail: [email protected] Summary of Business Operations
Cadman, Inc., has two primary lines of business: ready-mix (concrete) and aggregate. This interview focused on the ready-mix line of business because of its time-sensitive delivery needs. Cadman employs about 320 people in the Puget Sound region, about 200 of which work in the ready-mix division. Cadman has facilities located in:
• Seattle’s Duwamish Industrial Area (on East Marginal Way) • Issaquah (co-located with the Lakeside Industries) • Bellevue (a satellite site that is available when needed for large commercial projects) • Redmond (on Union Hill Road) • Black Diamond (on SR 169 at Green Valley Road) • Mill Creek (on SR 527) • Monroe (near the prison)
Wilbur Smith Associates with Heffron Transportation, NohBell Group & RNO Group
June 2006 Cadman-1
Freight Efficiency & Competitiveness Phase I Final Report
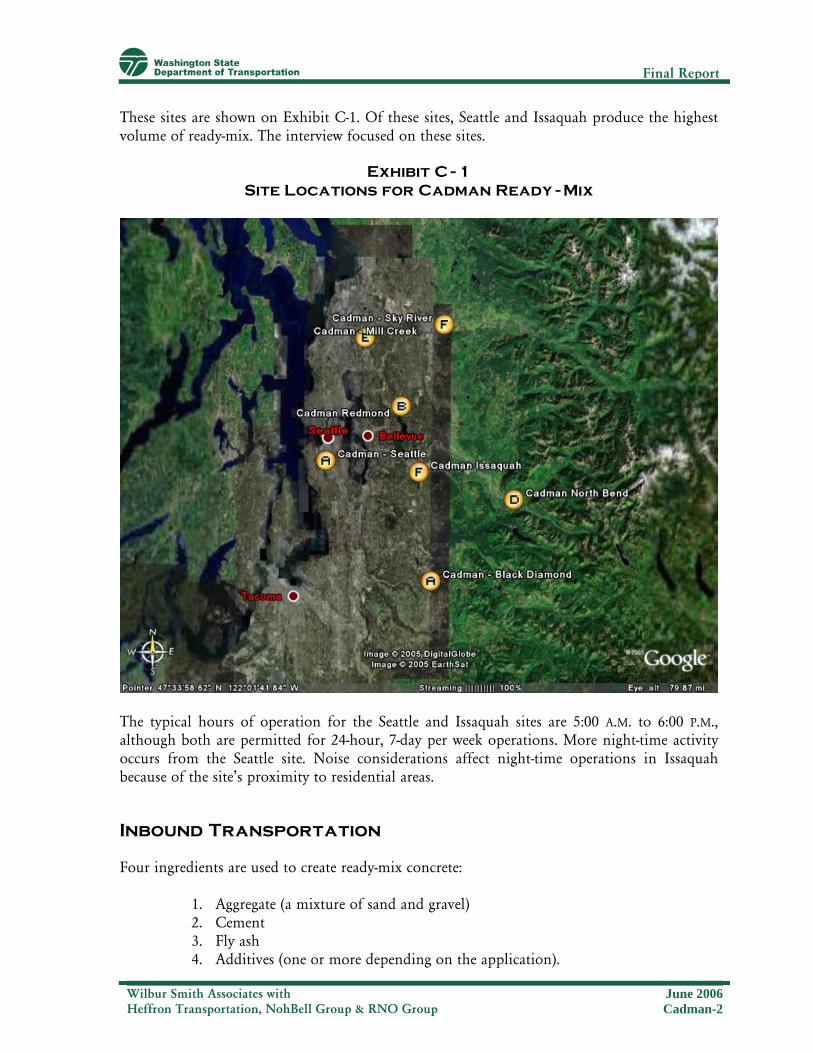
These sites are shown on Exhibit C-1. Of these sites, Seattle and Issaquah produce the highest volume of ready-mix. The interview focused on these sites.
Exhibit C-1 Site Locations for Cadman Ready-Mix
The typical hours of operation for the Seattle and Issaquah sites are 5:00 A.M. to 6:00 P.M., although both are permitted for 24-hour, 7-day per week operations. More night-time activity occurs from the Seattle site. Noise considerations affect night-time operations in Issaquah because of the site’s proximity to residential areas.
Inbound Transportation
Four ingredients are used to create ready-mix concrete:
1. Aggregate (a mixture of sand and gravel) 2. Cement 3. Fly ash 4. Additives (one or more depending on the application).
Wilbur Smith Associates with Heffron Transportation, NohBell Group & RNO Group
June 2006 Cadman-2

Freight Efficiency & Competitiveness Phase I Final Report
Different modes and sources are used for each of these materials depending on the site where the ready-mix is made. The origin and mode of transport for the Seattle and Issaquah site are shown in Exhibit C-2:
Exhibit C-2 Origin and Mode of Transport for Ready-Mix Ingredients
to Seattle and Issaquah Sites
Origin and Method of Transport to:
Material Seattle Site Issaquah Site
Aggregate Gravel barged from Dupont, Washington Sand from Canada. Average of about 1½ barges per week.
75% of material comes directly from site; 25% (course material) is trucked from North Bend. Average of 10 to 20 loads trucked from North Bend per day for concrete mixing. (Additional trucks bring course material to Lakeside Paving for asphalt).
Cement Barged from Canada. Average of about 1½ barges per week.
Trucked from the Seattle site. Average of about 5 to 6 truck loads per day.
Fly ash Trucked from Centralia. Average of about 2 truck loads per day.
Trucked from Centralia. Average of about 1½ truckloads per day.
Additives Trucked from South Seattle. About 2 trucks per month.
Trucked from South Seattle. About 2 trucks per month.
Most of the aggregate deliveries are made by Cadman-owned trucks when they are available. Sometimes these deliveries are made by contract haulers. The inbound fly ash and additives are delivered by hired trucks. All inbound truck deliveries are controlled and scheduled by Cadman. The Seattle and Issaquah sites have on-site storage that would allow production of up to three days’ worth of ready-mix. Deliveries generally occur daily to restock the supply. The most crucial factor influencing inbound transportation arrangements is noise restrictions at their sites (or supply sites) that prohibit loading and unloading during certain times of the day. While this is not a critical issue at the Seattle site, it does affect most of the other sites in Cadman’s system. For this reason, most deliveries are scheduled to occur during daytime hours, but avoiding the peak commute periods. The trucks being used to haul aggregate and cement to the facility general make multiple trips during the day, spaced out over time; therefore, there is no peak time of day when truck movements are highest.
Wilbur Smith Associates with Heffron Transportation, NohBell Group & RNO Group
June 2006 Cadman-3
Freight Efficiency & Competitiveness Phase I Final Report
Outbound Transportation
Ready-mix concrete is the only product that is shipped out of Cadman’s facilities. Once mixed, concrete must be poured within 2½ hours, and Cadman’s goal is to have trucks unload within 90 minutes of leaving the plant. The market area for each site is set to provide about 20-minute travel times between the site and the customer, which is approximately a 10-mile radius in the urban areas and slightly larger in the rural areas (e.g., from the Black Diamond or Monroe sites). The customer sets the requirements for outbound flow. Cadman will request information about a concrete pour’s start time and the desired volume per hour (which is often dictated by the equipment and construction personnel at a site) to determine the spacing of trucks leaving the plant. For example, a customer might request 60 yards per hour. Each truck can carry about 10 yards each, so they will be set to arrive every 10 minutes. Cadman has 22 concrete-mixing trucks in Seattle, and each can haul about four loads per day. This relates to a weekly volume of about 400 to 450 loads per week. There are 25 trucks at the Issaquah site, and the weekly volume is about the same as Seattle’s. There are peaks in the ready-mix business which follow the peak construction seasons. During a peak month, each site’s volume might increase to about 500 truckloads per week. The increase is generally accomodated through longer work days (since the fleet size remains the same). All of the concrete mixer trucks are owned and operated by Cadman. The most crucial factor influencing the outbound transportation arrangements is on-time delivery. Concrete is a perishable commodity and has a very short shelf life (90 to 150 minutes after the truck has been loaded). Therefore, it is highly susceptible to congestion-related or unexpected delays. Cadman’s on-time performance is measured from 15-minutes early to dead on-time to the delivery schedule predicted for the customer. With the use of sophisticated dispatch software, very few loads are lost because the product is delivered past its viability deadline. Most losses occur because of jobsite delays, but with pumping technology at the jobsites, this has also become less frequent. An unusable load is trucked to a facility that makes concrete-waste products such as ecology blocks. The value of a lost load is about $75 to $80 per yard, or about $800 per truck. Cadman uses sophisticated supply management software (called Command Series, which is used by the vast majority of ready-mix companies worldwide) that tracks each customer’s truck demand, pour rates, turn times, and expected travel time. They have GPS transponders in all of their trucks that track through a screen in the dispatch software. They can access this information as needed. The dispatch system estimates travel times, but those are generally an average during off-peak hours. It does not account for unexpected delays. While they do use the WSDOT web sites to track congestion, they have found that their own radio communication is more reliable and timely (they know about congestion before the WSDOT web site does). All of their truck drivers know the best alternative routes in their market area.
Wilbur Smith Associates with Heffron Transportation, NohBell Group & RNO Group
June 2006 Cadman-4

Freight Efficiency & Competitiveness Phase I Final Report
Supply Chain Segmentation
Because it is a perishable product, the end product—ready-mix concrete—and its delivery to the customer is the element of the supply chain that has the highest share of material ownership, is most susceptible to variations in level of service, and has the highest transportation costs. All of the transportation of this product is performed in Cadman-owned concrete mixer trucks. Any inventory of this material is also held in the trucks, since that is where it is made. The only other element of the supply chain that is subject to variance are the barge shipments of cement that arrive at Cadman’s plant on the Duwamish River from Canada. The Seattle facility has on-site storage for approximately 5,000 tons of cement. This is about a 3-day supply of materials. They closely track and coordinate the barge shipments to make sure that the supply does not run low. The barge loading used to be susceptible to tide fluctuations because they did not have the needed depth. They recently dredged the dock area, which has relieved this issue. The dredging required a lengthy permitting process. In terms of transportation costs, about 25 percent of the cost of ready-mix is related to delivery—70 percent of which is labor, 20 percent for truck maintenance, and a combined 10 percent for fuel, insurance, etc. They are able to pass on the recent fuel-cost increases through the indexed fuel surcharge. Current turn times (the number of loads a truck can deliver in a day) are about the same as they were several years ago because the pour rates have improved substantially (primarily related to the fact that most large projects now use pump equipment). Further improvements in pour rates are not expected, so congestion will likely affect turn times in the future. Their primary advantage is the fact that they have multiple locations from which to make deliveries.
Infrastructure Issues
Unpredictable delay is the greatest challenge facing the transportation system. Key corridors and locations where Cadman experiences the most delay (and unpredictability) are:
• I-5 through downtown Seattle • I-405/SR 167 interchange • I-405 through downtown Bellevue • SR 522 inbound from Monroe • I-405/SR 522 interchange
Policy Issues
A new policy enacted by the City of Seattle concurrent with the closure of the downtown Seattle Bus Tunnel has severely restricted concrete deliveries to the downtown core. The new system requires a permit for all daytime truck activity in the downtown core. No trucks are allowed between 6:00 and 9:00 A.M. and between 3:00 and 7:00 P.M., unless an exception is granted by Seattle Department of Transportation (SDOT). For large construction projects that
Wilbur Smith Associates with Heffron Transportation, NohBell Group & RNO Group
June 2006 Cadman-5
Freight Efficiency & Competitiveness Phase I Final Report
need concrete, this essentially limits the delivery times to between 9:00 A.M. and about 2:00 P.M. (to exit before the restriction is imposed). Most projects in the downtown core do not have construction occur at night because of noise restrictions. The permit to access the downtown core is $150 per truck per month per jobsite. The permits are required for the number of trucks that could be circulating in the downtown core for a single project at any one time. For example, one project might need 100 yards per hour, which would require about 15 trucks cycling for that job, eight of which could be in the downtown restricted zone at any one time. The City would then require the company to purchase eight permits (which can then be copied and put into all 15 trucks.) For large projects, this equates to about an extra $0.50 to $0.75 per yard of concrete. For small projects such as a street utility patch that might require only four yards of concrete, the company would require a one-day permit for $20 plus the time involved in getting the permit. This could add about $30 to the cost for four yards. Cadman is currently providing concrete for the WaMu Tower on Second Avenue. Had the permit system been in place for that project, it could have added another $75,000 to the project costs in permit fees alone. Cadman will pass on the costs of the permits to the general contractor, who in turn will pass it on to the owner. The cost of the permit is secondary to the additional cost related to extended schedules. The time restrictions imposed could double the time needed to complete concrete work on a large downtown project. The additional schedule time and financial carrying costs could exceed tens of millions of dollars for high-value projects. This could affect decisions to develop projects in the downtown core. Nighttime pours are not a good option since most of these would require waivers of the noise ordinances. Also, with unionized labor (in both the concrete truck and on the construction site), nighttime construction costs a premium in labor. This in unlike most truck deliveries that require only a receiving clerk to accept a delivery. Concrete must have the construction crew on site to place the material. Cadman understands the afternoon peak hour restrictions. However, on some streets, the morning congestion has not been an issue with the buses out of the tunnel. SDOT should review the traffic conditions in the morning to determine if exceptions could be made to the 6:00 to 9:00 A.M. restriction in some areas.
Potential Actions
1. Review local policies to make sure they have adequately assessed the economic consequences of time restrictions for construction vehicles. Determine if morning peak period restrictions are necessary based on congestion.
2. Address chokepoints that result in unpredictable delays.
3. Consider daytime incident management along major corridors, not just during the commuter peak hours.
Wilbur Smith Associates with Heffron Transportation, NohBell Group & RNO Group
June 2006 Cadman-6
Freight Efficiency & Competitiveness Phase I Final Report
INTERVIEW SUMMARY Project: Freight Efficiency & Competitiveness Phase 1
Subject: Interview with Distribution Division of an International Beverage Company
Interview Date: November 22, 2005
Interviewer: Tim Duffy
Attendee
Director Northwest Logistics, Bellevue, Washington
Summary of Business Operations
Please note: This company did not give permission to reference their name directly in the public version of this study. SUBJECT-COMPANY is the distribution arm of an international beverage company. SUBJECT-COMPANY operates 431 facilities throughout North America and Western Europe, generating over $18 billion in revenues. The Northwest division of SUBJECT-COMPANY is located in Bellevue, Washington, and is the focus of this interview. Employing over 300 people in the Puget Sound area, SUBJECT-COMPANY-Northwest operates 24 hours a day producing Name brand beverages at their bottling plant located in Bellevue, Washington. Once produced, product is shipped to distribution centers throughout Washington and several points outside the state. From the distribution centers, finished product is shipped to the point of sale at supermarkets, convenience stores, and other retailers within the immediate market areas. In addition to their Bellevue bottling plant and distribution center, SUBJECT-COMPANY-Northwest has distribution facilities located in the following areas within Washington State:
• Bellingham • Marysville • Tacoma • Bremerton
• Olympia • Woodland • Wenatchee • Spokane
Wilbur Smith Associates with Heffron Transportation,. NohBell Group, & RNO Group
June 2006 International Beverage Company-1
Freight Efficiency & Competitiveness Phase I Final Report
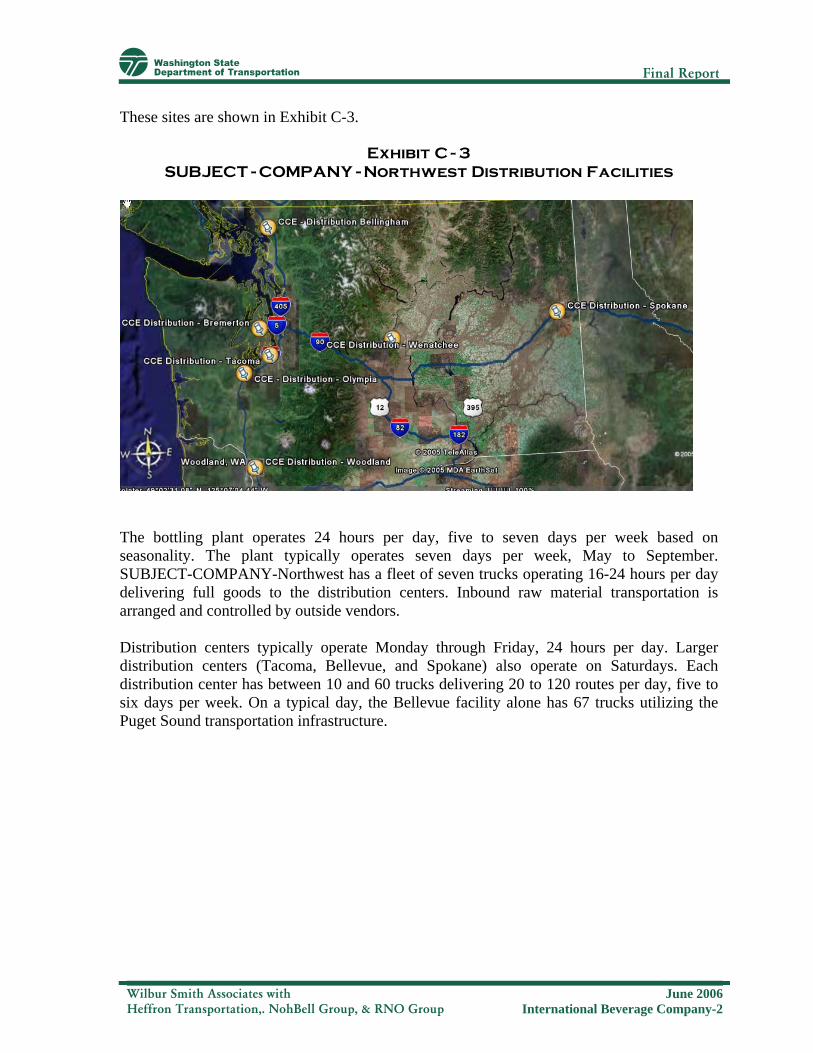
These sites are shown in Exhibit C-3.
Exhibit C-3 SUBJECT-COMPANY-Northwest Distribution Facilities
The bottling plant operates 24 hours per day, five to seven days per week based on seasonality. The plant typically operates seven days per week, May to September. SUBJECT-COMPANY-Northwest has a fleet of seven trucks operating 16-24 hours per day delivering full goods to the distribution centers. Inbound raw material transportation is arranged and controlled by outside vendors. Distribution centers typically operate Monday through Friday, 24 hours per day. Larger distribution centers (Tacoma, Bellevue, and Spokane) also operate on Saturdays. Each distribution center has between 10 and 60 trucks delivering 20 to 120 routes per day, five to six days per week. On a typical day, the Bellevue facility alone has 67 trucks utilizing the Puget Sound transportation infrastructure.
Wilbur Smith Associates with Heffron Transportation,. NohBell Group, & RNO Group
June 2006 International Beverage Company-2

Freight Efficiency & Competitiveness Phase I Final Report
Inbound Transportation
The bottling plant receives over 200 inbound shipments each week. The primary components that make up Name brand finished product include empty cans or bottles, liquid sweetener, liquefied gasses, concentrate, and packaging materials. (Please see Exhibit C-4). Peak inbound hours are from 8:00 A.M. to 5:00 P.M. each day. Peak days of the week are Monday and Friday, peak months are May through September. The shipping vendors control 90 percent of the inbound transportation. SUBJECT-COMPANY picks up approximately 10 percent of inbound shipments using company owned trucks.
Exhibit C-4 Inbound Product Categories (Sorted by Volume)
Product Category Point(s) of
Origin
Mode
Target Inventory On-Hand
Empty Cans/Bottles Kent, Olympia Truck 2 Hours
Liquid Sweetener & Liquefied Gasses Fife Tanker
Truck 24 Hours
Concentrates Texas Truck 3 days
Packaging Materials California Truck 7 Days
The bottling plant has limited storage capacity. Raw material inventory supply on-hand ranges from two hours for empty cans and bottles to seven days for packaging materials. Since SUBJECT-COMPANY runs with limited raw material inventory on-hand, inbound on-time delivery is critical. Vendors are expected to meet scheduled appointments within a 15-minute window. A delay of inbound product could result in line down time, increased labor cost, and lost sales downstream. SUBJECT-COMPANY estimates current inventories are inflated 20 percent to compensate for infrastructure-related transportation delays. Because the bottling operation is so dependent on on-time delivery of raw materials, SUBJECT-COMPANY suppliers have compensated for the Puget Sound area congestion by arriving early and waiting for scheduled delivery times, increasing overall transportation costs.
Wilbur Smith Associates with Heffron Transportation,. NohBell Group, & RNO Group
June 2006 International Beverage Company-3
Freight Efficiency & Competitiveness Phase I Final Report
Outbound Transportation From the bottling plant, SUBJECT-COMPANY ships 145-180 truckloads of full goods each week, primarily Name brand beverages, to distribution centers located in the Puget Sound area, eastern Washington and several points outside the state. Puget Sound area distribution centers are located within 90 miles of the bottling plant. SUBJECT-COMPANY ships 90 percent of outbound shipments using company-owned and -controlled trucks. Storage capacity at the distribution centers is limited to a seven-day supply. Demand and supply variability require the distribution centers to depend on daily plant deliveries to fulfill current orders. As a result, on-time delivery is one of the most crucial factors in arranging outbound transportation from the bottling facility. Deliveries are expected to arrive within one hour of a scheduled appointment. SUBJECT-COMPANY distribution centers ship product to the point of sale at supermarkets, convenience stores, and other retailers in their respective market areas. Typically, deliveries are made within 31 miles of the distribution center. Each distribution center has a fleet of trucks delivering routes within their market area. Small facilities have a fleet of 10 trucks operating at least 16 hours per day, five days per week. Bellevue, the largest distribution facility, has 60 trucks delivering 120 routes per day, five to six days per week.
Supply Chain Segmentation
Full goods (those that have completed production) is the element of the supply chain that has the highest share of transportation cost, is subject to the greatest variance in service level, and represents one of the highest shares of material ownership. The majority of full goods shipments are performed using SUBJECT-COMPANY trucks. Full goods are produced 24 hours daily, five to seven days per week, and shipped out at a rate of 30-40 trucks per day from the Bellevue bottling plant. Empty cans and bottles represent the other segment of the supply chain that is subject to variability. With only a two-hour supply of inventory on hand, on-time delivery of this component is critical. Delayed shipments result in line downtime and increased labor costs. Suppliers ship product early to minimize the risk of missing a delivery appointment, resulting in increased transportation costs and underutilized equipment. Due to congestion in the Puget Sound area, SUBJECT-COMPANY has experienced significant transportation efficiency declines at both the bottling plant and the distribution centers. Transportation efficiency is deteriorating at a rate of 15-20 percent annually. In 2001, a round trip to Tacoma from the Bellevue bottling plant took 90 minutes, compared with 120-150 minutes today. SUBJECT-COMPANY compensates for the deteriorating infrastructure by paying driver overtime and/or purchasing additional trucks and hiring more drivers.
Wilbur Smith Associates with Heffron Transportation,. NohBell Group, & RNO Group
June 2006 International Beverage Company-4

Freight Efficiency & Competitiveness Phase I Final Report
Infrastructure Issues The Puget Sound highway capacity, particularly I-405, Highway 167, and Highway 520, has not kept pace with the commercial and population growth in the region. Since 2001, SUBJECT-COMPANY transportation efficiency has declined 15-20 percent annually due to congestion on area highways. As congestion increases, the likelihood of unpredictable delays (i.e., accidents, merging issues etc.) increases. Area congestion has made it impossible for SUBJECT-COMPANY to achieve their goal of keeping transportation costs flat through productivity improvements, despite increasing fuel, labor, and contract carrier costs. SUBJECT-COMPANY is challenged by the overtaxed Puget Sound highway system at the bottling plant as well as at each of the five Puget Sound area distribution centers.
Potential Actions
• Expand the highway system to provide alternative routes and/or additional lanes or raised roadways.
• Take pressure off existing highway infrastructure by building a light rail system for commuter activity that is comprehensive, inexpensive, and user-friendly.
• Preserve the ability for fleets to license their fleets to 105,000lbs GVW to allow for the continued ability to take advantage of larger payloads and fewer trips.
• Encourage local retailers to accommodate off-hour deliveries (from 6:00 P.M. to 3:00 A.M.) to relieve daytime congestion on the roadways.
Wilbur Smith Associates with Heffron Transportation,. NohBell Group, & RNO Group
June 2006 International Beverage Company-5
Freight Efficiency & Competitiveness Phase I Final Report
INTERVIEW SUMMARY Project: Freight Efficiency & Competitiveness Phase 1
Subject: Interview with Distribution Division of a Processed Food Company
Interview Date: November 10, 2005
Interviewer: Tim Duffy
Attendee
Director, Logistics, Kent, Washington
Summary of Business Operations
Please note: This company did not give permission to reference their name directly in the public version of this study. SUBJECT-COMPANY is a family-owned and -operated processed food company that has been operating in the Puget Sound area for over 85 years. SUBJECT-COMPANY manufactures over 400 products under various brands. Because they are a tightly held company, certain data, including sales volume information, is not released to the public. SUBJECT-COMPANY manufactures product in four locations: Kent, Washington; Airport Way, Seattle; Rainier Avenue, Seattle; and Albany, Oregon. All finished goods are consolidated and shipped from their distribution center attached to the Kent manufacturing facility. Raw materials are sourced domestically and internationally. Meat is imported from Brazil, shipped ocean freight to the port of New Jersey, railed to Tacoma, and trucked to the plants. Packaging film is sourced from Asia and corrugated packaging is sourced locally mostly from Kent, Washington. SUBJECT-COMPANY also sources spices from California. SUBJECT-COMPANY receives approximately 53 trucks of material each week. Inbound volume generally does not have a peak period. Volume has limited variability across the week, month, or year. November through February tend to be the slowest months.
Wilbur Smith Associates with Heffron Transportation, NohBell Group, & RNO Group
June 2006 Processed Food Company-1

Freight Efficiency & Competitiveness Phase I Final Report
On average, SUBJECT-COMPANY ships 290 orders each week. The majority of shipments are less-than-truck-load (LTL) orders. An estimated 15 orders per week are full truck load. SUBJECT-COMPANY ships primarily shelf-stable product to markets across the country. About 50 percent of out-state volume leaves via I-90 and 50 percent via I-5. Transportation costs, on-time delivery, and damage are the top three factors influencing inbound and outbound freight decisions. Inbound and outbound on-time performance is based on a 30-minute delivery window.
Inbound Transportation
Components used in SUBJECT-COMPANY ‘s manufacturing process are primarily processed meat, packaging film, corrugate packaging, and spices (see Exhibit C-5). SUBJECT-COMPANY controls the transportation decisions for about one-half of the inbound volume. Transportation for imported packaging film and meat is controlled by a third-party freight forwarder. Inbound corrugate transportation is controlled by SUBJECT-COMPANY using hired trucks for 75 percent of the volume and company-owned trucks for the balance. Company-owned trucks are also used to shuttle finished goods to the distribution center. Cost is the primary factor influencing inbound transportation decisions.
Exhibit C-5 Inbound Product Categories (Sorted by Volume)
Product Category Point(s) of Origin Weekly Volume (Truckloads)
Corrugate Seattle/Kent 26
Processed Meat Brazil via the Port of New Jersey 12
Packaging Film Asia via the Port of Seattle 12
Spices California Unknown
Outbound Transportation
Finished goods produced at the SUBJECT-COMPANY processing facilities are consolidated and shipped from the Kent distribution center. Although SUBJECT-COMPANY does not experience significant peaks and valleys in their demand curve, the highest outbound volume period is between April and August. Daily volume peaks between 2:00 and 5:00 P.M.
Wilbur Smith Associates with Heffron Transportation, NohBell Group, & RNO Group
June 2006 Processed Food Company-2
Freight Efficiency & Competitiveness Phase I Final Report
SUBJECT-COMPANY ships processed meat products, primarily jerky, to retailers and other food service establishments across the country. The majority of shipments are LTL. Approximately 274 LTL orders per week are consolidated and shipped on roughly 15 hired trucks. In addition, SUBJECT-COMPANY ships approximately 15 full truck load orders each week. Out-of-state demand leaves the Kent area via I-5 and I-90 equally.
Supply Chain Segmentation
There are three segments of the supply chain most susceptible to variance that are critical to SUBJECT-COMPANY’s ability to effectively meet customer demand while maintaining profitability: finished goods, inbound meat, and local packaging supply.
Finished Goods Finished goods is the segment of the supply chain that has the highest share of material ownership (50 percent), represents the highest share of total transportation costs (50 percent), and is susceptible to variance in transportation-related service levels. SUBJECT-COMPANY controls all outbound shipments leveraging multiple LTL carriers. SUBJECT-COMPANY customers maintain limited inventory in their systems. A typical order is comprised of two to three pallets and weighs 850 pounds. SUBJECT-COMPANY maintains a 1-2-week inventory balance. Any service variation in the supply chain has an immediate impact on customer service levels and SUBJECT-COMPANY’s profitability.
Inbound Meat Meat is imported from Brazil, shipped ocean freight to the port of New Jersey, railed to Tacoma, and trucked to the plants. Thirty percent of inventory is invested in processed meat. Processed meat also consumes 30 percent of the total transportation budget. Delays occur at both the outbound and inbound ports. Rail service is unpredictable. Shipments can sit at any one of several points along the rail line. The last mile from Tacoma to the plants takes increasingly greater amounts of time due to traffic congestion in the Puget Sound area.
Packaging Materials Packaging film is imported mostly from Asia and received through the Port of Seattle. Corrugate is sourced locally and delivered by the vendors or picked up using SUBJECT-COMPANY trucks. SUBJECT-COMPANY controls the timing of all corrugate deliveries. Packaging materials represent 20 percent of total transportation costs. Vendor production delays and port congestion are the primary factors causing service issues for packaging film. SUBJECT-COMPANY estimates 15 percent of current inventory levels, or $1-2 million, is in place to buffer transportation-related service issues. Causes of supply chain variability include:
• Local traffic congestion; affecting both interplant transfers, outbound to customers, and
Wilbur Smith Associates with Heffron Transportation, NohBell Group, & RNO Group
June 2006 Processed Food Company-3

Freight Efficiency & Competitiveness Phase I Final Report
inbound product from the ports, rail yards, and local vendors.
• Limited LTL capacity drives up costs, causes service variability • Fuel surcharges • Rail service levels and capacity issues • Port of Seattle and Port of New Jersey congestion/capacity issues.
Infrastructure Issues/Possible Actions
On-time delivery at a reasonable cost, of LTL and FTL shipments, has been identified as one of one of SUBJECT-COMPANY’s greatest transportation challenges. SUBJECT-COMPANY associates this challenge with the lack of competitive carriers in the Puget Sound area and the lack of a viable rail alternative with consistent service for LTL or FTL service. SUBJECT-COMPANY would like to see significant investment in improving rail service regionally and across the country. Improvements include:
• An integrated rail system that allows seamless accounting of shipments • Improved, measurable loading/off-loading in the rail yards; • Expand equipment to support the efficient handling of LTL loads • Integrated Information Systems infrastructure to measure on-time delivery (similar to
the airlines) Congestion on the I-5 and I-90 corridors is a significant contributor to increasing transportation costs and delivery delays particularly between SUBJECT-COMPANY facilities. Travel time between facilities has increased significantly over the past five years. Specific data were not provided.
Wilbur Smith Associates with Heffron Transportation, NohBell Group, & RNO Group
June 2006 Processed Food Company-4
Freight Efficiency & Competitiveness Phase I Final Report
INTERVIEW SUMMARY Project: Freight Efficiency & Competitiveness Phase 1
Subject: Interview with Starbucks Coffee Company
Interview Date: October 31, 2005
Interviewer: Tim Duffy
Attendee
Brent Denniston, Director, Transportation Starbucks Coffee Company 2401 Utah Avenue South Seattle, WA 98102 206-318-7950 e-mail: [email protected]
Summary of Business Operations
Starbucks Coffee Company purchases and roasts over 200 million pounds of whole bean coffee and sells it along with related food, beverages, and merchandise primarily through its company-operated retail stores. Starbucks’ company-owned and -licensed stores currently exceed 10,000 locations worldwide. Starbucks also sells whole bean and ground coffee as well as other coffee-related food and beverages through grocery and institutional channels. Starbucks has strategic alliances with many highly visible brands and organizations, including Pepsi-Cola Company, Dreyer’s Grand Ice Cream, Kraft Foods Inc., CARE, Conservation International, Johnson Development Corporation, and many other hotel, food service, technology, communications, retail, and financial institutions. Starbucks has domestic roasting plants and distribution centers in Kent, Washington, Renton,Washington, York, Pennsylvania, and Carson Valley, Nevada. Starbucks also leverages third-party fulfillment houses to distribute dairy, perishable foods, paper, and ready-to-drink beverages. Due to space constraints and/or product shelf life, stores require a relatively high frequency of deliveries. Product is distributed to company stores through one of four channels.
• Roasting plant shipments • Third-party dry goods distribution service • Third-party perishable delivery service • Vendor direct delivery
Wilbur Smith Associates with Heffron Transportation, NohBell Group, & RNO Group
June 2006 Starbucks-1

Freight Efficiency & Competitiveness Phase I Final Report
Roasting Plant Shipments Roasted coffee, merchandise, packaged foods, and store supplies are shipped one to three times weekly via less-than-truck-load (LTL) contract carrier. Shipments are scheduled to arrive within a predetermined four-hour window between 6:00 A.M. and 2:00 P.M. Stores plan labor around scheduled arrival times. If product arrives outside the scheduled window, the store incurs incremental labor, and the product typically sits in an area that impedes either customer or employee flow.
Third-Party Dry Goods Distribution Service Paper supplies (cups, lids, napkins, etc.), dry bar condiments, and ready-to-drink beverages are delivered through a third party delivery service one to two times each week.
Third-Party Perishable Delivery Service Depending on store location, dairy, pastry, and beverage components are shipped nightly through a third-party carrier. Product is dropped at the store between 10:00 P.M. and 5:00 A.M. by drivers that are secured with store keys and security information. Daily orders are maintained by each store. Product is checked in as part of the daily store opening process.
Vendor Direct Delivery Stores located in rural areas rely on local delivery services or vendors to supply dairy and other fresh products. All inbound and outbound deliveries are executed using contract carriers or third-party fulfillment houses. However, Starbucks controls the timing of all logistical movements. Because of its size and presence in the Puget Sound area, this interview focused primarily on the Kent roasting and distribution facility. To a lesser extent, the interview focused on the Renton facility and Puget Sound third-party fulfillment houses. The Kent facility operates from 6:00 A.M. to 6:00 P.M., Monday through Friday. Schedule varies during peak shipping periods in October/November. Starbucks Puget Sound area locations include:
• Roasting and Distribution Facility – Kent, Washington • Seattle’s Best Distribution – Renton, Washington • Corporate Headquarters – Seattle, Washington • Third Party Consolidated Distribution Facility – Kent, Washington • Third Party Paper/RTD Distribution Facilities – Seattle, Tacoma, Everett
Inbound Transportation
Starbucks receives 71 containers of green coffee each week into the Puget Sound area, primarily from Latin America, North Africa, and Indonesia. Green coffee receiving peaks between April and July, coinciding with the harvest seasons. 80 percent of coffee import
Wilbur Smith Associates with Heffron Transportation, NohBell Group, & RNO Group
June 2006 Starbucks-2
Freight Efficiency & Competitiveness Phase I Final Report
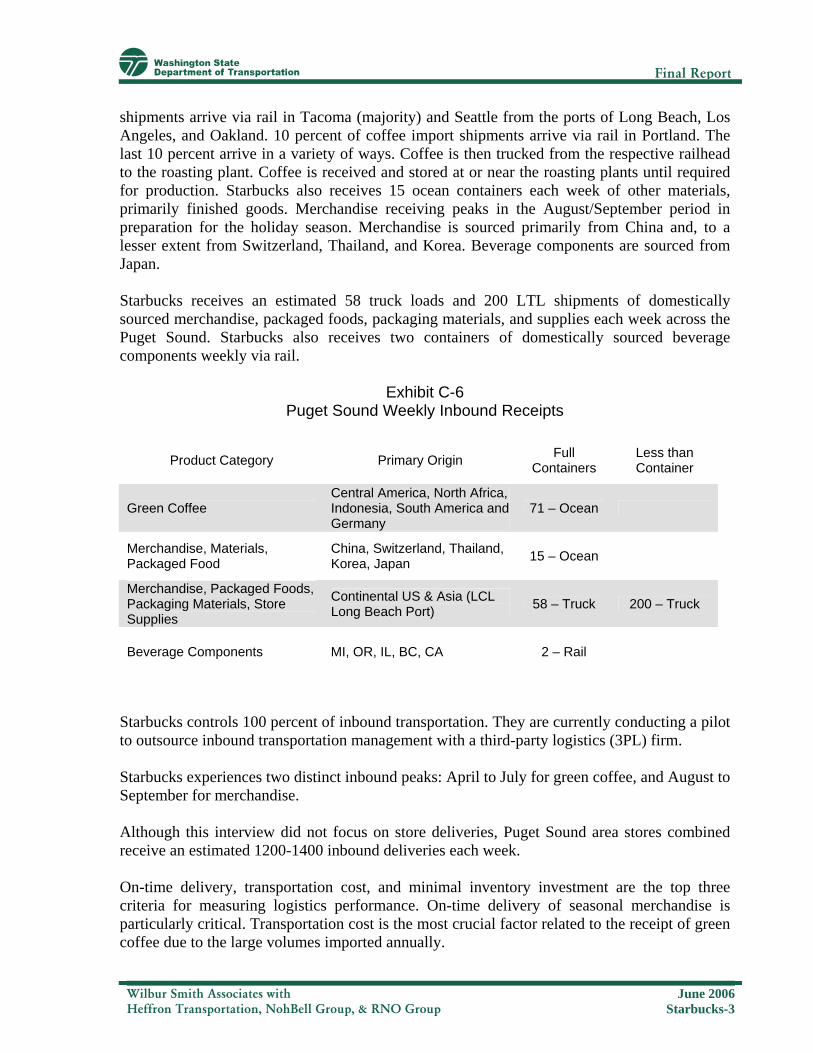
shipments arrive via rail in Tacoma (majority) and Seattle from the ports of Long Beach, Los Angeles, and Oakland. 10 percent of coffee import shipments arrive via rail in Portland. The last 10 percent arrive in a variety of ways. Coffee is then trucked from the respective railhead to the roasting plant. Coffee is received and stored at or near the roasting plants until required for production. Starbucks also receives 15 ocean containers each week of other materials, primarily finished goods. Merchandise receiving peaks in the August/September period in preparation for the holiday season. Merchandise is sourced primarily from China and, to a lesser extent from Switzerland, Thailand, and Korea. Beverage components are sourced from Japan. Starbucks receives an estimated 58 truck loads and 200 LTL shipments of domestically sourced merchandise, packaged foods, packaging materials, and supplies each week across the Puget Sound. Starbucks also receives two containers of domestically sourced beverage components weekly via rail.
Exhibit C-6 Puget Sound Weekly Inbound Receipts
Product Category Primary Origin Full Containers
Less than Container
Green Coffee Central America, North Africa, Indonesia, South America and Germany
71 – Ocean
Merchandise, Materials, Packaged Food
China, Switzerland, Thailand, Korea, Japan 15 – Ocean
Merchandise, Packaged Foods, Packaging Materials, Store Supplies
Continental US & Asia (LCL Long Beach Port) 58 – Truck 200 – Truck
Beverage Components MI, OR, IL, BC, CA 2 – Rail
Starbucks controls 100 percent of inbound transportation. They are currently conducting a pilot to outsource inbound transportation management with a third-party logistics (3PL) firm. Starbucks experiences two distinct inbound peaks: April to July for green coffee, and August to September for merchandise. Although this interview did not focus on store deliveries, Puget Sound area stores combined receive an estimated 1200-1400 inbound deliveries each week. On-time delivery, transportation cost, and minimal inventory investment are the top three criteria for measuring logistics performance. On-time delivery of seasonal merchandise is particularly critical. Transportation cost is the most crucial factor related to the receipt of green coffee due to the large volumes imported annually.
Wilbur Smith Associates with Heffron Transportation, NohBell Group, & RNO Group
June 2006 Starbucks-3

Freight Efficiency & Competitiveness Phase I Final Report
Outbound Transportation
The Kent distribution facility supplies coffee, merchandise, and other supplies to over 1900 stores located throughout Washington, British Columbia, Oregon, and portions of California. Approximately 1800 LTL shipments originate from the Kent and Renton facilities (primarily Kent). Many parcel and express shipments originate from these facilities each week. Starbucks also ships approximately 20 truck loads every week to specialty sales and grocery customers. Store shipments are picked by geography and loaded on an LTL carrier for routing and delivery. Approximately one-half of all product shipped by weight from the Kent and Renton facilities is roasted coffee. The balance of product shipped includes retail supplies and merchandise. On-time delivery is the most crucial factor in measuring outbound transportation performance. Deliveries are made at every store during a pre-determined four-hour window between 6:00 A.M. and 2:00 P.M. Labor is scheduled specifically to receive and stock inbound product. Delays in delivery cost stores incremental labor and interrupts business flow if the delivery sits in the store during high volume periods.
Supply Chain Segmentation
Receipt of green coffee represents the segment of the supply chain that has the highest share of material ownership. Limited rail head capacity hinders Starbucks’ ability to mitigate fluctuations in inbound transportation costs and service. Lack of direct service from Latin American ports to Seattle and Tacoma require coffee to be routed through the ports of Long Beach, Los Angeles, and Oakland, shipped to the Portland, Tacoma, and Seattle railheads via rail, and subsequently shipped over the road to Seattle, causing Starbucks to incur additional handling costs as well as service and cost variability caused by port and traffic congestion. Rail congestion limits flexibility and requires extended lead-times for merchandise imported from Europe. Outbound transportation to the stores is the element of the supply chain that has the highest transportation costs and is most sensitive to variations in service level. Stores have a specific delivery window and receive product one to three times each week. Product scheduled for delivery is often promotionally based and is part of an overall marketing campaign. On-time performance is measured within 15 minutes of the delivery window. Starbucks’ has attempted to mitigate rising fuel costs through improved efficiencies; however, their efforts have been hindered by increased Puget Sound congestion. Congestion limits the number of stops a route driver can make in a set period of time.
Infrastructure Issues
During an average week, Starbucks has an estimated 500 trucks using the Puget Sound transportation infrastructure. Issues include traffic congestion, local freeway connections, local and national rail capacity issues, and the inability to receive less-than-container load (LCL) loads into a Washington port.
Wilbur Smith Associates with Heffron Transportation, NohBell Group, & RNO Group
June 2006 Starbucks-4

Freight Efficiency & Competitiveness Phase I Final Report
National and local rail capacity issues hinder Starbucks’ ability to reduce transportation costs by an estimated $200,000 annually. Containers originating from Latin America must be routed through the ports of Long Beach, Los Angeles, and Oakland, shipped via rail to the Portland, Tacoma, and Seattle railheads, and then trucked to Seattle. It is not uncommon for a container to take 15 days to clear the Port of Long Beach and arrive in Seattle. Railhead congestion regularly results in delays to coffee and merchandise deliveries. Starbucks builds in additional lead time to compensate for expected railhead inefficiencies. Local railhead congestion has also forced Starbucks to terminate a number of Asia-to-U.S. East Coast shipments in Seattle and, instead, ship the product over-the-road to make up lost time. Traffic congestion in the Puget Sound area increases overall costs of Starbucks’ transportation. Starbucks supplies over 200 locations in the Puget Sound area, representing 1200-1400 deliveries each week. Route efficiencies are directly impacted by area traffic conditions. Specific areas of concern include Highway 167, I-405, and I-5.
Potential Actions
Identify bottlenecks and invest in infrastructure that will reduce cycle times through the port terminals. Review logistics infrastructure between the Puget Sound Ports and the rail heads to identify and reduce congestion points between the two systems. Create incentives, invest in rail infrastructure to relieve capacity constraints and improve transit times along the West Coast.
Wilbur Smith Associates with Heffron Transportation, NohBell Group, & RNO Group
June 2006 Starbucks-5

Freight Efficiency & Competitiveness Phase I Final Report
INTERVIEW SUMMARY Project: Freight Efficiency & Competitiveness Phase 1
Subject: Interview with Trident Seafoods
Interview Date: October 27, 2005
Interviewer: Mike Siegmund, Tim Duffy
Attendee
Ron Hildebrandt, Chief Logistics Officer, Trident Seafoods Trident Seafoods 5303 Shilshole Avenue Northwest Seattle, WA 98107 206-783-3818 e-mail: [email protected] Summary of Business Cluster
Trident Seafoods is the largest vertically-integrated harvester, processor, and marketer of frozen seafood products in the country. Founded in 1973, Trident is a privately held corporation operating offshore processors and shore-side plants throughout Alaska and the Pacific Northwest. Trident is one of the largest companies identified as part of Seattle’s Maritime Cluster. This cluster is comprised of fishing, ship building/repair, marine construction, seafood processing, water transportation, marine goods/service, and cold storage companies. According to the City of Seattle Office of Economic Development, the combined sales of this cluster exceeded $4 billion in 2002 and employed over 45,000 across King County. Summary of Business Operations
Trident harvests and processes over 100 million pounds of seafood annually. Ninety-five percent of raw materials (seafood) are caught off the Alaskan coast and, to a lesser extent, the coastline of the Pacific Northwest. Seafood is processed, cubed, and frozen in bulk form in one of twelve on- or off-shore bulk processing facilities primarily located in or off the coast of Alaska. In addition, Trident has three salmon canning facilities located in Alaska. Once processed, bulk product is either exported or shipped to secondary processing facilities and converted to consumer-ready finished goods.
Wilbur Smith Associates with Heffron Transportation, NohBell Group, & RNO Group
June 2006 Trident-1

Freight Efficiency & Competitiveness Phase I Final Report
Trident experiences both demand and supply seasonality. Supply seasonality is driven by the pollack fishing seasons, January to May and July to October. The harvests peak in March and August respectively. Demand seasonality peaks during the Lenten months between February and April. Trident employs over 5,000 people, with approximately 650 people in the Puget Sound region. In season, Trident supplies the personnel and living essentials to staff and support remote and at-sea operations in Alaska. Approximately 4,000 people are dispatched to Alaskan operations via Seattle annually. Trident estimates they are Alaska Airlines’ single largest customer. The majority of bulk product harvested in the Pacific is shipped into the Puget Sound area for secondary processing. Trident owns and operates three ships that shuttle bulk product in 1,000-ton increments from Alaska every 10 days during the fishing seasons: January to May and July to October. An inbound shipment of bulk, processed seafood requires 50 containers and must be unloaded within 30 hours. A crew of 200 people supports the logistics on a single boat. An unloading delay of 1 day costs Trident $20,000 or $833 per hour per boat. Bulk product is shuttled from the port to Western Washington secondary processing facilities based on planned production or space availability. Trident operates a hub-and-spoke processing/distribution model in the Puget Sound area. Bulk seafood is converted into approximately 2,500 different consumer-ready finished goods in one of four facilities. It is then shipped to and consolidated at the Seattle Pier 91 facility for distribution across the country. Some full truck load orders are shipped direct from processing facilities; however, the majority of outbound shipments (95 percent) originate from Pier 91. Sixty percent of outbound shipments leave the state via I-90 and 40 percent leave via I-5. Puget Sound secondary processing facilities are located in:
• Bellingham • Anacortes • Seattle Pier 91 (secondary processing and main distribution hub) • Fife
Trident also has a labeling facility located in Kent. In Alaska, salmon is processed into unlabelled cans and shipped to Kent for labeling, then distributed to customers. This interview focused primarily on the secondary processing facilities located in Western Washington.
Wilbur Smith Associates with Heffron Transportation, NohBell Group, & RNO Group
June 2006 Trident-2
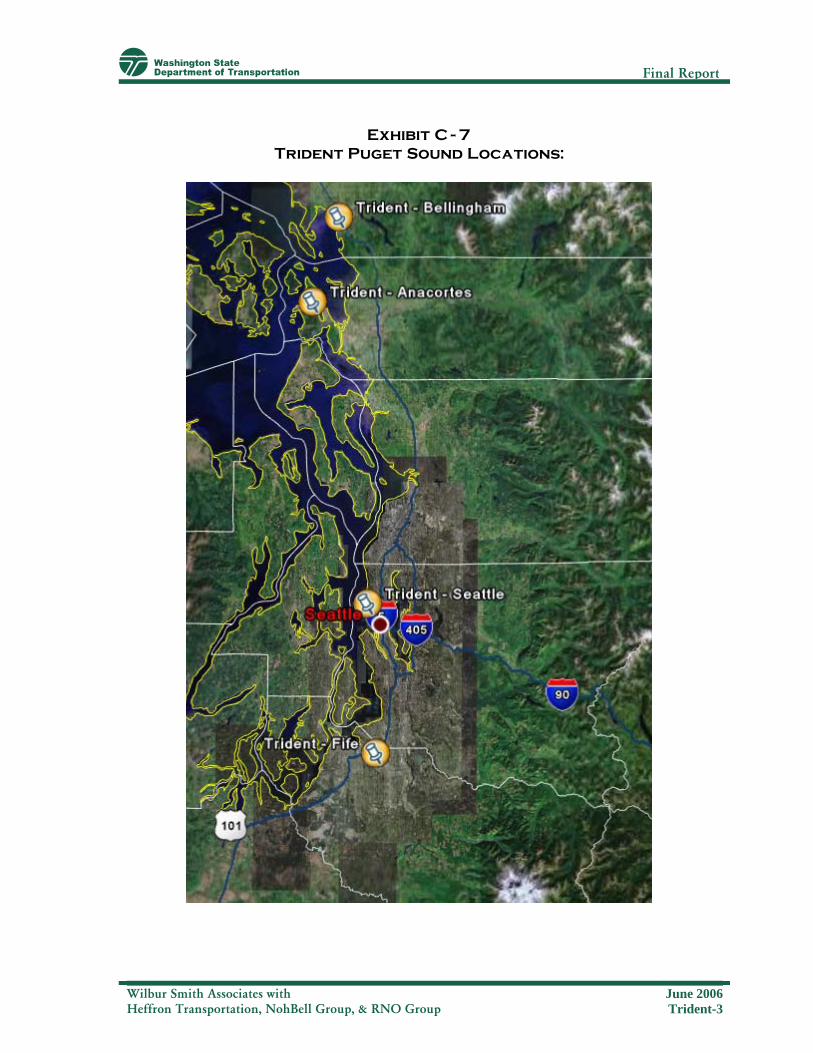
Freight Efficiency & Competitiveness Phase I Final Report
Exhibit C-7 Trident Puget Sound Locations:
Wilbur Smith Associates with Heffron Transportation, NohBell Group, & RNO Group
June 2006 Trident-3
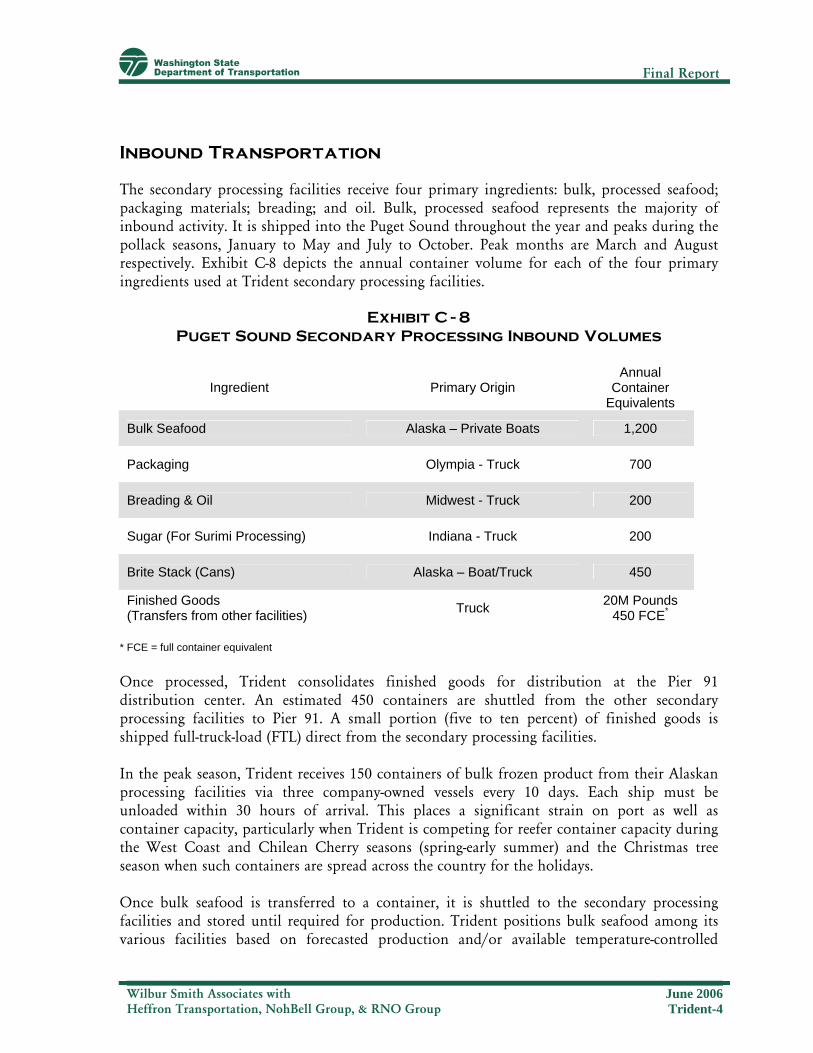
Freight Efficiency & Competitiveness Phase I Final Report
Inbound Transportation
The secondary processing facilities receive four primary ingredients: bulk, processed seafood; packaging materials; breading; and oil. Bulk, processed seafood represents the majority of inbound activity. It is shipped into the Puget Sound throughout the year and peaks during the pollack seasons, January to May and July to October. Peak months are March and August respectively. Exhibit C-8 depicts the annual container volume for each of the four primary ingredients used at Trident secondary processing facilities.
Exhibit C-8 Puget Sound Secondary Processing Inbound Volumes
Ingredient Primary Origin Annual
Container Equivalents
Bulk Seafood Alaska – Private Boats 1,200
Packaging Olympia - Truck 700
Breading & Oil Midwest - Truck 200
Sugar (For Surimi Processing) Indiana - Truck 200
Brite Stack (Cans) Alaska – Boat/Truck 450
Finished Goods (Transfers from other facilities) Truck 20M Pounds
450 FCE*
* FCE = full container equivalent Once processed, Trident consolidates finished goods for distribution at the Pier 91 distribution center. An estimated 450 containers are shuttled from the other secondary processing facilities to Pier 91. A small portion (five to ten percent) of finished goods is shipped full-truck-load (FTL) direct from the secondary processing facilities. In the peak season, Trident receives 150 containers of bulk frozen product from their Alaskan processing facilities via three company-owned vessels every 10 days. Each ship must be unloaded within 30 hours of arrival. This places a significant strain on port as well as container capacity, particularly when Trident is competing for reefer container capacity during the West Coast and Chilean Cherry seasons (spring-early summer) and the Christmas tree season when such containers are spread across the country for the holidays. Once bulk seafood is transferred to a container, it is shuttled to the secondary processing facilities and stored until required for production. Trident positions bulk seafood among its various facilities based on forecasted production and/or available temperature-controlled
Wilbur Smith Associates with Heffron Transportation, NohBell Group, & RNO Group
June 2006 Trident-4

Freight Efficiency & Competitiveness Phase I Final Report
space. Trident uses several local carriers, including Horizon Lines, Coastal Transportation, Northland, and Sampson. They also use their own fleet of trucks. The majority of packaging materials are trucked from Olympia by vendor-controlled shippers. Trident receives an estimated 700 truckloads of packaging annually. Approximately 200 truckloads of breading and oil are received annually from the Midwest. Another 200 truckloads of sugar are received to support surimi processing. An estimated 450 containers each year of unlabelled canned salmon are received through the port into the Kent labeling facility. The canned salmon is labeled and shipped to customers across the country. One of the biggest challenges with inbound transportation is congestion at the Port of Seattle. With limited staging capacity, trucks often back up and create congestion at the freeway access points. A delay in unloading of a single vessel can cost Trident almost $1,000 per hour. Trident balances raw material product mix between facilities requiring transfers up and down the I-5 corridor. In addition, the majority of finished goods are shuttled to the Seattle Pier 91 distribution facility. Trident estimates they are carrying a minimum of five percent incremental inventory in each location to compensate for congestion issues on the I-5 corridor and access-related issues between the Maritime Cluster and I-5. Trident has limited interest in using rail as a modal option because of service concerns. Their perception of rail service is that it is bad and getting worse.
Outbound Transportation
Trident packages, markets, and ships approximately 2,500 finished goods. The shelf-life for each finished good is between 90 and 180 days. The majority of finished goods are stored in, and shipped from, an 800,000 cubic foot frozen distribution center at the Seattle Pier 91 processing facility. On average, Trident ships 1.2 million frozen pounds each week, mostly from the Pier 91 distribution facility. Approximately 60 percent of outbound shipments leave the Puget Sound via I-90 and 40 percent via I-5. The majority of shipments are less-than-truck load (LTL). The typical order consists of 35 items and weighs 4,200 pounds. Including FTL orders, the average order weighs 8,800 pounds. Thursday and Friday are peak days, with an estimated outbound volume of 66 trucks each day. Trident’s customers expect product to ship on Thursday or Friday to ensure product will arrive by the following week in time to support weekend sales demand. Due to the price point of inventory and space constraints, customers are not interested in receiving product any sooner than required for the weekend business. If product is not shipped by Thursday/Friday, it must be expedited to the customer, most often using air freight. Outbound shipments Monday through Wednesday average 15 trucks each day. Due to shelf life issues and distribution-related costs, Trident has concluded that opening distribution facilities closer to their markets cannot be justified. Trident estimates inventory would increase 35 percent to support a single additional downstream facility. Generally, any interruption in the supply chain is handled by using temperature-controlled air freight.
Wilbur Smith Associates with Heffron Transportation, NohBell Group, & RNO Group
June 2006 Trident-5
Freight Efficiency & Competitiveness Phase I Final Report
In an effort to mitigate the Puget Sound infrastructure issues, Trident has investigated relocation of the Pier 91 operations south of Tacoma. Estimated cost to relocate is $30 million. Trident does not expect to implement such a plan since moving would remove them from significant industry support within the maritime cluster.
Supply Chain Segmentation
While each element of Trident’s supply chain is sensitive to transportation-related variation, two key segments are critical to their operation and have the greatest potential implications to their profitability: inbound receipt of bulk seafood and consolidation/shipping of finished goods. Due to the service expectations set by the customer and the hub-and-spoke configuration of Trident’s distribution model, finished goods handling represents the segment of the supply chain that has the highest share of material ownership, is most susceptible to variations in service, and has the highest transportation cost. Transfers from secondary processing facilities to Pier 91 are controlled by Trident and executed using local transport firms or Trident-owned and -operated trucks. All outbound shipments are controlled by Trident using outside LTL trucking firms. Trident estimates inventories are inflated five percent to anticipate Puget Sound logistical issues. Inbound bulk seafood is the other segment of the supply chain most susceptible to variation. The seafood industry is inherently seasonal. In season, Trident ships 150 containers of bulk product into the Puget Sound ports every 10 days. Trident competes for container capacity with other seasonal industries (fruit harvests, export) that peak during the pollack seasons. Ships are expected to turn within 30 hours. Trident estimates unloading delays cost an estimated $833 per hour. Truck staging capacity at the port is limited, causing congestion at the freeway entrance and exit points.
Infrastructure Issues
Accessibility to I-5 and unpredictable traffic congestion in the Puget Sound area represent the greatest challenges Trident faces with Puget Sound transportation infrastructure. Specific issues include but are not limited to:
• Highway 99 lacks a direct link to I-5 north of Spokane Street.
• The current design of I-5 lacks a single lane that flows directly through Seattle without requiring a lane change. This increases the chance of congestion, accidents, etc.
• Lack of port staging capacity at the terminals hinders Trident’s ability to efficiently turn their inbound containers.
• As similarly stated in the City of Seattle study of the Maritime Cluster, Trident experiences huge delays navigating to and from the port due to congestion at the access
Wilbur Smith Associates with Heffron Transportation, NohBell Group, & RNO Group
June 2006 Trident-6

Freight Efficiency & Competitiveness Phase I Final Report
points to the Seattle port and harbor. Because the grades of roads and railways are not separated in the downtown area, significant delays occur every day.
Trident Seafoods, in conjunction with the Maritime Cluster, have identified the Alaska Way Viaduct as central to their collective businesses. Closing the viaduct while rebuilding or replacing it would place a significant financial burden on their enterprises. They would like to see the viaduct repaired in place and access to and from the Maritime Cluster improved. Access to rail service, competitive pricing, and predictable service levels combined eliminate rail as a possible mode of transportation for Trident.
Policy Issues
Trident noted the lack of consistency over the governance of trucking corridors. They would like the state to establish standards for truck route design (lane widths, turning area, etc.) and prevent local municipalities from superseding state-defined design requirements.
Wilbur Smith Associates with Heffron Transportation, NohBell Group, & RNO Group
June 2006 Trident-7

Freight Efficiency & Competitiveness Phase I Final Report
INTERVIEW SUMMARY Project: Freight Efficiency & Competitiveness Phase 1
Subject: Interview with United States Bakery (Franz)
Interview Date: December 8, 2005
Interviewer: Michael Siegmund, Tim Duffy
Attendee
Rosalie Delaurenti, Shipping & Transportation Manager United States Bakery 2006 S. Weller Street Seattle, WA 98144 206-322-0931 e-mail: [email protected]
Summary of Business Operations
United States Bakery/Franz Family Bakeries, headquartered in Portland, Oregon, is a family-owned and -operated business serving the Northwest since 1906. They manufacture and market a full range of bakery products. Their market reach extends across all of Oregon and Washington as well as northern California and parts of Idaho, Montana, and Alaska. Sales channels include grocery, restaurant, food service, and institutional customers. U.S. Bakery operates a hub-and-spoke distribution model, with multiple bakeries and distribution hubs to meet customer demands. The largest bakery operation in the Northwest, U.S. Bakery operates two bakeries in the Seattle area and multiple distribution hubs employing over 900 people in the Puget Sound area alone.
Wilbur Smith Associates with Heffron Transportation, NohBell Group, & RNO Group
June 2006 U.S. Bakery-1

Freight Efficiency & Competitiveness Phase I Final Report
Bakery locations include:
• Weller Street – Seattle • 6th Ave – Seattle • Spokane – Washington • Eugene – Oregon • Portland – Oregon
• McMinnville – Oregon
Distribution/Transfer hubs include:
• 6th Ave – Seattle • Parkland • Bremerton – Auto Way • Olympia • Bremerton – Perry Ave • Aberdeen • Port Angeles • Lynnwood • East Kirkland • Everett • George Washington • Mount Vernon • South Tukwila • Bellingham • Kent • Portland, OR • Tacoma • Clackamus, OR
This interview focused on the Weller Street bakery and distribution center, which services the central Puget Sound area. The primary components used in the manufacturing process at the Weller Street facility include flour, miscellaneous bakery ingredients (i.e., yeast), sugar, and packaging materials. The majority of materials and ingredients are received daily and inventoried for “just-in-time” (JIT) usage. Product produced at the Weller Street facility is consolidated with finished goods sourced from other bakery locations and shipped to Northwest distribution hubs. Product is expected to reach U.S. Bakery customers within 24-48 hours of manufacture.
Inbound Transportation
U.S. Bakery’s Weller Street facility in Seattle’s Duwamish Industrial Area operates 24 hours per day, seven days per week. Peak hours are between 8:00 A.M. and 4:30 P.M. daily. Weekly volumes are based on annual averages. U.S. Bakery experiences significant spikes during the summer months. The Weller Street facility receives approximately 10 trucks each day of finished product from bakeries in Spokane and Portland/Eugene for distribution to area markets.
Wilbur Smith Associates with Heffron Transportation, NohBell Group, & RNO Group
June 2006 U.S. Bakery-2
Freight Efficiency & Competitiveness Phase I Final Report
In addition, the Weller Street facility receives approximately six trucks each day of ingredients and packaging. Materials include flour, miscellaneous bakery ingredients (i.e., yeast), sugar, and packaging. Points of origin are primarily Montana, California, Kansas, and Wisconsin. Because the production lines are scheduled based on inbound arrivals, on-time delivery of inbound product is the most crucial factor influencing inbound transportation arrangements, followed by cost and equipment availability. Inbound shipments are expected to arrive within one hour of scheduled appointments. Inbound logistics are controlled and scheduled by the Weller Street facility. Hired trucks are contracted and scheduled to deliver an estimated 30 truck loads of ingredients and materials each week. Using company trucks, the Weller Street facility also controls the shipment and receipt of approximately 50 loads of finished goods originating from the other U.S. Bakery manufacturing locations each week. The Weller Street facility is ideally located with convenient access to both I-5 and I-90. However, due to city zoning changes and parking restrictions, staging and maneuvering transportation equipment in the area around the plant has become increasingly challenging. Trucks are required to be staged “off-site” until space is available for loading or unloading.
Outbound Transportation
The Weller Street facility manufactures baked goods, consolidates them with product sourced from other bakeries, and transports them to distribution hubs for local delivery to U.S. Bakery customers. Twenty eight routes are scheduled daily, delivering product to 18 distribution hubs five to six days per week. The majority of the distribution hubs are located within the Puget Sound area. The Weller Street facility ships between 250 and 300 truckloads each week. Although the focus of this interview was limited to Weller Street operations, it is important to note that U.S. Bakery operates 228 daily routes, originating from the distribution hubs, delivering bakery product to their customers. On any given day, U.S. Bakery could have over 400 trucks on the road across the Puget Sound area. U.S. Bakery owns a fleet of 36 transport/trailers, which originate from the Weller Street location. Outbound product is shipped using these trucks, giving U.S. Bakery complete control of outbound shipments. Because baked goods are perishable, very little inventory is held in the supply chain. As a result, the two most crucial factors influencing outbound transportation arrangements are on-time delivery and total transportation cost. Any interruption in the supply chain typically costs U.S. Bakery in discounted or lost sales and increased labor costs. In 2001, several transport route deliveries were made during the day. U.S. Bakery determined route efficiency had declined 20 percent over time due to traffic-related delays and inefficiency. To compensate for the increase in costs, the majority of transport route deliveries were scheduled during off peak hours between 7:00 P.M. and 7:00 A.M. Route efficiency improved 7-10 percent as
Wilbur Smith Associates with Heffron Transportation, NohBell Group, & RNO Group
June 2006 U.S. Bakery-3
Freight Efficiency & Competitiveness Phase I Final Report
a result of the scheduling change. While delivering during off-peak hours proved more efficient, U.S. Bakery found that traffic-related inefficiencies are not limited to peak traffic hours.
Infrastructure Issues
Unpredictable traffic congestion represents one of the greatest challenges to U.S. Bakery in controlling transportation costs. U.S. Bakery locations are strategically placed along the I-5 corridor. Congestion along the I-5 corridor has steadily increased over the past several years. A delivery between the Weller Street facility and Tacoma took less than 2 hours 10 years ago, compared with more than 4 hours today. In response to the growing transportation challenges related to area congestion, U.S. Bakery has initiated an effort to measure route efficiency based on average cost per minute of operation for each route. In addition, U.S. Bakery is evaluating route optimization software to assist in reducing overall transportation costs. U.S. Bakery also monitors WSDOT’s traffic web site for congestion information to assist in rerouting transportation.
Policy Issues
Recent parking and zoning changes as well as increased development near the Weller Street location have increased the overall cost of routing trucks into or out of the facility. Trucks have to be staged far off site while waiting to load or unload. This increases the overall cost of operating at its current location due to transportation dwell times and delivery delays.
Possible Actions
• Create commerce-only lanes to expedite freight delivery in the Puget Sound area. HOV lanes are underutilized.
• Expand Highway 18 to four lanes each way to create a by-pass for commercial traffic between Everett and Fife, reducing overall traffic on the I-5 corridor.
• Evaluate the key main interchanges to improve traffic flow. (i.e., I-405 North to 167 interchange keeps traffic moving)
• Assist U.S. Bakery with finding a solution to truck staging around the Weller Street facility that balances community needs with efficient operation of the business.
Wilbur Smith Associates with Heffron Transportation, NohBell Group, & RNO Group
June 2006 U.S. Bakery-4

Freight Efficiency & Competitiveness Phase I Final Report
INTERVIEW SUMMARY Project: Freight Efficiency & Competitiveness Phase 1
Subject: Interview with Boeing Corp.
Interview Date: October 4, 2005
Interviewer: Arno Hart and Sophie Hartshorn
Attendees
Elizabeth Warner, Manager, Boeing Local Government Relations Tal Evanger, Director of Boeing Puget Sound Licensed Transportation Supply Chain Services Jack Dove, Manager- Boeing Enterprise Traffic Management Spares Distribution Center- Sea Tac Supply Chain Services Beverly Clark, Boeing Shared Services Communication Summary of Business Operations
Boeing is the largest maker of aircraft in the nation. Though its corporate headquarters are located in Chicago, it has major plant operations throughout much of the Puget Sound region. There are two main business lines at Boeing—the Integrated Defense Systems (IDS) Group (which is responsible for about 15 percent of all Boeing freight moved in the Puget Sound area) and Boeing Commercial Aviation (BCA) (which is responsible for about 85 percent of all Boeing freight moved in the Puget Sound area). The remainder of this summary focuses on the BCA operations in the Pacific Northwest. Overall Production Philosophy and Supply Chain Vulnerability Boeing’s production/service goal is to be able to provide a finished airplane to a customer within 6 months of their first contact with Boeing. For that reason, BCA is increasingly farming out to suppliers and emerging into the role of integrator--integrating the aircraft at the final stages. This increased focus on outsourcing has a significant effect on the impact/role of the Puget Sound transportation on the overall supply chain. The opinions about the effect of transportation congestion vary between Boeing and its suppliers. Boeing is responsible for most of the local transport moves between Puget Sound manufacturing plants, and is more reliant and vulnerable to congestion and delay on the local transportation system than its supplies, many of whom make longer-distance moves to the region. Boeing has adopted the concepts of the LEAN manufacturing process methodology—which is a philosophy of
Wilbur Smith Associates with Heffron Transportation, NohBell Group, & RNO Group
June 2006 Boeing-1

Freight Efficiency & Competitiveness Phase I Final Report
production that aims to minimize all resources (including time) used by cutting out unnecessary steps and processes, which means there is very little room for variance. Overall Production Hierarchy In its simplest form, Boeing’s complex supply chain can be boiled down to those functions that Boeing performs, and those performed by suppliers. The higher up the production hierarchy you look, the more Boeing is visible. Boeing manages the entire assembly process. It fabricates only some of the segments that are used to assemble the planes; more of the fabricated segments are being outsourced. The parts and components that go into the fabrication are almost entirely outsourced. Boeing ships a tremendous quantity of material into and through the Puget Sound region. Much of this movement is accomplished by its private truck fleet of 240 vehicles and drivers. This fleet is diversified and ranges from small trucks (for moving electronics and other small parts) up to very large flat bed haulers (for moving fuselages or other large, heavy items). Approximately 85 percent of all freight moved in the Puget Sound region is for BCA, and 15 percent is for IDS.
Inbound Transportation
Boeing first takes responsibility for goods as they enter the Puget Sound region. Usually, these goods are being shipped from Tier I and II suppliers, who can be from anywhere in the world. The largest single supply chain is from California, though there is also considerable freight traffic from the East Coast ports (and therefore Europe and other international destinations), the Midwest, and other points within Washington State.
• 300-500 truckloads inbound weekly, 50 percent by Boeing’s own fleet • 30-60 rail/interposal shipments • 1,000-5,000 inbound express/air shipments weekly • 100-300 ocean containers weekly • Daily peak is 6 A.M. to 6 P.M., but open 24 hours • On-time service is #1 priority, lowering inventory cost is #2, transport cost is #3 • Defines on-time within a one day window.
Assembly Final assembly occurs at facilities in Renton (narrow-body aircraft--window aisles only) and Everett (wide-body--middle aisle along with window aisles). Final assembled planes are delivered out of Boeing and Paine fields. Fabrication This is the stage where major parts that go into the assembly process are fabricated. Wings, fuselage, wires/tubes, landing gear, seats, galley, engines, lavatory, and electronics are all major parts that are fabricated prior to shipment to the assembly plants. Boeing fabricates the wings, fuselage, wires/tubes, and landing gear. The rest of the fabrication parts are outsourced to
Wilbur Smith Associates with Heffron Transportation, NohBell Group, & RNO Group
June 2006 Boeing-2
Freight Efficiency & Competitiveness Phase I Final Report
suppliers. It is noted that the BUYER is responsible for furnishing these fabricated parts to the assembly plant. Boeing also has an “Emergent Manufacturing” plant in Auburn. If something is damaged, incomplete, or late, the Auburn plant can manufacture almost anything that is needed. The transportation choice depends on product (for example, if it is tubes, they will go by van to Everett or Renton).
• Wings o Fabricated locally by Boeing in Auburn and Frederickson (large parts like wing
skins and spars). Large parts are forged mainly from steel, titanium, aluminum, and composites. Raw materials are forged into custom-sized ingots at the source and delivered to Boeing, mostly by flatbed truck, except aluminum by rail from California Rail spurs from Auburn and Fredrickson provide mobility. (See interview with TMX which supplies raw materials.)
o All of the small parts and components are outsourced, and are shipped (mostly from California) in small quantities known as “less-than-truckload” (LTL). The shipments are generally received and consolidated at a non-Boeing warehouse before being sent to Boeing.
o Fabricated wing parts move from fabrication to assembly plant by truck. • Fuselage
o Fabricated in Wichita, Kansas and shipped by rail to assembly plant o Rail is extremely vital
• Wires and Tubing
o Wires and tubes come in a wide range of sizes and configurations and are fabricated in Auburn. Used for conveyance of power, water, fuel, fluids, air, and exhaust, they are fabricated locally. Raw materials (wire, copper, titanium, and plastic) come from all over the U.S.
o Raw materials are brought into the Auburn plant and cut to the right length. o Tubes are made of titanium and used for fuel from the wings to the engines,
exhaust, air, etc. Some are made in Spokane and trucked to the Auburn plant. o Fabricated parts are trucked (small) into the assembly plant on demand (three
truck loads per plane). Trucks roll directly onto the assembly floor (roll-on/roll-off) next to the aircraft being assembled.
• Engines
o Engines are 90 percent complete when they arrive at the Boeing plant. The Boeing plant finishes them, by installing electronic components, tubes, fans, etc.
o The largest suppliers of engines are located in the United Kingdom; some come from Ohio, and some from Connecticut.
o Engines are trucked to Boeing one or two at a time as an oversized flatbed delivery.
Wilbur Smith Associates with Heffron Transportation, NohBell Group, & RNO Group
June 2006 Boeing-3

Freight Efficiency & Competitiveness Phase I Final Report
o Deliveries need oversize permits and have to follow time restrictions levied by
states. For example, oversized loads are not allowed on I-5 South of Burlington until after 9 A.M. on weekdays. Therefore, deliveries can take longer since oversize loads can only be on the highway for a few hours per day.
o 777 engines come in at SeaTac and are loaded on flatbeds for the final delivery leg.
o Engines leave SeaTac by flatbed truck and go to either Renton or Everett for final integration into the aircraft.
• Lavatories
o Lavatories are trucked in from Woodinville on local, semi-crated vehicles. They are complete when they arrive at Renton/Everett and ready to roll into place on the aircraft.
o They are made of fiberglass/plastics/steel.
• Galleys o They are brought by container ship from Amsterdam to East Coast ports, then
trucked across the U.S. to the Everett or Renton assembly plants. o They come fully assembled to Boeing and roll into place.
• Landing Gear
o Boeing makes the majority of these in Portland, and then delivers them by truck to the Puget Sound region. Raw materials are trucked into Portland from tertiary suppliers, most of which are based in California.
o The components for the landing gear are trucked to Goodrich fabrication plant near Seattle. Fabricated landing gear is trucked to assembly plant.
o They rely on hydraulics, tires, and titanium.
• Seats o Seats are shipped from France on container ships that arrive at East Coast ports
and are trucked across the country to Renton or Everett. o Trucks are used because of the time savings they provide.
• Electronics
o Electronics consist of fabricated radio/communications and navigation systems.
o Most are locally made and rely on smaller vehicles, which does not pose a big logistics issue.
o Most are made in Auburn, where large trucks bring the raw materials. Finished products go by small truck or van to the assembly plant.
Parts and Components Parts and components that are inbound to Boeing’s fabrication plants and to those run by its suppliers in the region rarely direct ship by full truck load (TL). Instead, they are trucked (by LTL service) to locally based staging areas (warehouses/distributions centers) from around the region and the country (California, the Midwest, and some from the East Coast).
Wilbur Smith Associates with Heffron Transportation, NohBell Group, & RNO Group
June 2006 Boeing-4

Freight Efficiency & Competitiveness Phase I Final Report
Outbound Transportation
Assembled Aircraft • Final assembled aircraft are delivered at Boeing Field and Paine Field. Customers fly
the aircraft home from there. Return Tooling
• 100 truckloads outbound weekly, 65 percent by Boeing’s own fleet • 30+ rail/intermodal shipments • 500-2,000 outbound express/air shipments weekly • 45+ ocean containers weekly • Daily peak is 6 A.M. to 6 P.M., but open 24 hours • Transport cost is #1; lowering inventory cost is #2; range of integrated services is #3.
Key Supply Chain Segments
• Wings and Spars: Trucked from Frederickson to Renton and Everett • Seats and Tracks: From France to Renton and Everett via ocean and truck and some
air • Repairs/Emergent: From SDC/Renton/Everett to worldwide via truck and some air • Fuselage: From Wichita to Renton/Everett via rail (6 days); Boeing takes ownership
when they leave Wichita • Fan Cowlings: From Wichita to Renton/Everett via truck and some air • Landing Gear: From Everett to Renton/Everett via truck • Landing Gear Components (and other Portland components): From Portland to
Everett via truck; 2 years ago round trip took 9 hours and now it takes 10-12 hours, bordering on the truck driver hours-of-service restriction
• Engines: From Connecticut (Pratt), Ohio (GE), the United Kingdom (Rolls, other) to Renton/Everett via truck and some air
Infrastructure Issues
In general, Boeing controls the flow of goods only within the Puget Sound region, and therefore is primarily concerned with the movement of trucks on the roadway network. Unpredictable delay is the greatest challenge facing the transportation system in the Puget Sound region. Key corridors and locations where Boeing experiences the most delay (and unpredictability) include all the major corridors in the region:
• I-5 through downtown Seattle • I-405/SR 167 interchange • I-90
Wilbur Smith Associates with Heffron Transportation, NohBell Group, & RNO Group
June 2006 Boeing-5
Freight Efficiency & Competitiveness Phase I Final Report
Policy Issues
• Boeing uses trucks for most of its shipping within the nation and also within the Puget Sound region. This is chiefly because of the time savings provided by trucks.
• A well-functioning highway system is the most important transportation feature in the Puget Sound region.
o The movement of fabricated parts between key plants is sensitive to time variance from congestion on the major corridors; however, these shipments tend to be scheduled (flexibility in delivery). These also tend to have higher incidence of permit requirements (oversize).
o The movement of parts and components is impacted by highway in two ways. First, the long-haul inbound trip to local staging points is prone to congestion on I-5 and I-90, resulting in higher sensitivity to hours of operations window. Second, delivery from warehouse to fabricating plant (Boeing and local third party suppliers) tends to be on short notice, with tighter delivery windows, and prone to trip variance on local haul, hence impacting performance within delivery window. Hours of service not an issue.
• Rail deliveries from the California and East Coast ports are the second most important element.
• Boeing recognizes that an integrated, multi-modal, appropriate capacity system using many corridors is important: a system that does not support any one corridor to the detriment of another and has adequate redundancy.
• Boeing believes that set-aside truck capacity along key corridors is a critical path toward ensuring redundancy. Toll facilities can be a valid part of the transportation system. Boeing is willing to pay their fair share for toll facilities or other user-financed projects, but does not think that they should be asked to pay more than their fair share.
• Fuel costs, congestion, and surcharge for roads (on top of taxes) are making it very difficult to convince truckers to move to the Puget Sound region; this results in a constant shortage of qualified truckers to move goods in the region.
• Boeing thinks the WTP plan does not give enough support to freight mobility and fails to recognize that much of it needs to be on trucks. Boeing certainly supports transit, but clearly cannot use it for freight delivery.
• Boeing is trying to reduce the number of people moving between sites, as they realize that it is just as logistically challenging as moving freight.
• Boeing needs to obtain permits prior to shipping oversize items such as engines or wing spans and has to follow time restrictions levied by states. This means that some shipments can take many days to complete, with much time wasted as drivers sit in the trucks, unable to use the roadways.
Wilbur Smith Associates with Heffron Transportation, NohBell Group, & RNO Group
June 2006 Boeing-6

Freight Efficiency & Competitiveness Phase I Final Report
INTERVIEW SUMMARY Project: Freight Efficiency & Competitiveness Phase 1
Subject: Interview with Goodrich Aircraft Technical Services
Interview Date: November 22, 2005
Interviewer: Arno Hart and Sophie Hartshorn
Attendees
Bill Major Goodrich Corporation Cargo Systems 6700 Hardeson Rd. Ste 104 Everett, WA 98203 (425) 407-1191 [email protected] Summary of Business Operations
Goodrich is headquartered in Charlotte, North Carolina, and is a pure aerospace industry supplier, focusing almost exclusively on aerospace. It employs 20,000 worldwide, most of these involved in Original Equipment Manufacturing (OEM) for the aerospace industry. A small segment focuses on aftermarket services such as Aircraft Technical Services (ATS), which does maintenance and repair. Goodrich manufacturing includes the following three segments, each of which has 8-10 business lines:
1. Engines: including the aero-structure and cargo divisions. Goodrich does not make engines, only parts that go into making engines. They are therefore a second/third tier supplier to makers of engines that go to Boeing and others.
2. Airframes: including the landing gear and the ATS group (for maintenance and overhaul of airplanes). Goodrich does not build airframes, only parts of airframes. They are therefore a first tier supplier to builders of airframes, including Boeing.
3. Electronics: including sensors and all accompanying parts. Goodrich is a second/third tier supplier.
This interview was a two-in-one with the Cargo group and an overview of the ATS group, both of which are in the Airframes section. This is a summary of the ATS part of the interview. The
Wilbur Smith Associates with Heffron Transportation, NohBell Group, & RNO Group
June 2006 Goodrich ATS-1

Freight Efficiency & Competitiveness Phase I Final Report
interview also included an overview of the ATS group. The ATS group is responsible for both routine maintenance and repair of airplanes (they do Category C and D checks, which occur once a year or more (A and B checks are more frequent), including all mechanical, structural, and electronic systems. The group is a service provider, not a manufacturer, and customers are commercial airlines, not Boeing. Their facility is at Paine Field, and customers fly their aircraft in for maintenance. Peak maintenance seasons are during the months that immediately follow peak commercial travel seasons. They handle all parts that are needed for aircraft maintenance and repair, from any given OEM supplier used by the customer (and not just parts produced by other Goodrich groups). The turnaround time for performing such services is very tight; it is not unheard-of to have 15-minute supplier turnaround windows. Therefore, just-in-time (JIT) delivery of parts is extremely important to the ATS group. In addition, the ATS group carries a large inventory of parts that may be needed for maintenance and repair, and carries larger inventories than the OEM counterparts within Goodrich. Though Boeing is cited as the largest client to both the Cargo products and ATS services, Goodrich products and services are used by many other major airlines and carriers throughout the world.
Inbound Transportation
• Customers make transportation decisions 70 percent of the time. • 50-800 truckloads are inbound to the Everett facility each week. Of these:
o 4 percent use the Goodrich private fleet o 96 percent use for-hire, public trucks
• Goodrich receives from 1,000-3,500 inbound shipments of express/air shipments weekly (using DHL, UPS, and Fedex). Many of these shipments are carrying parts that were initially sent out from the ATS division to be repaired at sites around the nation.
• Demand is seasonal and peaks immediately after high travel seasons, when airlines service aircraft.
• ATS receives shipments of parts from all over the world. • Inbound shipments are dominantly 2nd day air/express through UPS, Fedex, and DHL
into SeaTac International Airport. This reflects the time-sensitive nature of the deliveries and the fact that the maintenance schedule of the airplanes is very tight.
• Some shipments are flown into Paine field in Everett (not many). • Overland shipments are all by truck from the Midwest and East Coast, taking 5-7 days.
Goodrich does not use rail for any shipments. • On-time performance is the top priority, followed by cost, for shipping. It is estimated
that a 15-minute criterion is used to judge “on-time performance.” • ATS is encouraged to hold an inventory to prevent service and maintenance delays. This
is accomplished by using facilities in Paine field and at the Cargo systems facility in Everett:
o Four 25,000 square foot facilities in Everett o Five 25,000 square foot hangers at Paine field
Wilbur Smith Associates with Heffron Transportation, NohBell Group, & RNO Group
June 2006 Goodrich ATS-2

Freight Efficiency & Competitiveness Phase I Final Report
Outbound Transportation
• Aircraft that have been maintained or repaired in the Everett facility are flown out of Paine Field.
• Other primary outbound shipments are of aircraft tooling and aircraft parts. • The destinations for these products vary—they are worldwide in scope. • 50-800 truckloads leave the Everett facility each week. Of these:
o 4 percent use the Goodrich private fleet o 96 percent use for-hire, public trucks
• Goodrich sends out from 1,000-3,500 outbound express/air shipments per day (using DHL, UPS, and Fedex).
Supply Chain Issues
Because it is entirely JIT focused, the ATS group has three key supply chain issues. The first is that its supply chain is globally rather than locally based. Suppliers are predominantly based in the Midwest and East Coast. Because they provide a quick turnaround service (days, not weeks or months), freight velocity is key. The time it takes to ship parts (2 days for express and 5-7 days by truck) seriously cuts into their service turnaround time. Therefore, they cannot afford road or air cargo delays. Another key issue is that the ATS group does not have any systems redundancy for its main east-west roadway supply corridor. As is pointed out below, the only viable roadway connection is I-90 (see details below). This lack of redundancy causes the ATS group to carry more inventory than its OEM counterparts within Goodrich. Growing traffic congestion is the leading supply chain issue for local trips. Since on-time performance must fall within a 15-minute window, on-time variability is expected to increase as congestion continues to grow.
Infrastructure Issues
Because a majority of Goodrich shipments for the ATS group arrive from locations in the Midwest and East Coast, the single biggest concern of Goodrich is I-90. I-90 is problematic at all times for freight shipping, particularly across Snoqualmie Pass. The situation has been exacerbated recently with lane closures through the pass. Highway 2 does not serve as an alternative to I-90, because its challenging topography is not conducive to truck travel. I-5 is also a big issue, not specifically any location or bottleneck, but more from an overall systems congestion standpoint. The lack of an alternative option can make it difficult to meet a tight delivery window.
Wilbur Smith Associates with Heffron Transportation, NohBell Group, & RNO Group
June 2006 Goodrich ATS-3

Freight Efficiency & Competitiveness Phase I Final Report
Overall Comments
While the interview was able to add to the picture of the overall strategic role played by the freeway system for serving high-service truck freight, but the group was not very forthcoming with information and insight regarding cost implications and other economic information. The company did not wish to share this information with the public sector.
Wilbur Smith Associates with Heffron Transportation, NohBell Group, & RNO Group
June 2006 Goodrich ATS-4

Freight Efficiency & Competitiveness Phase I Final Report
INTERVIEW SUMMARY Project: Freight Efficiency & Competitiveness Phase 1
Subject: Interview with Goodrich Aircraft Cargo Group
Interview Date: November 22, 2005
Interviewer: Arno Hart and Sophie Hartshorn
Attendees
Bill Major Goodrich Corporation Cargo Systems 6700 Hardeson Rd. Ste 104 Everett, WA 98203 (425) 407-1191 [email protected] Summary of Business Operations
Goodrich is headquartered in Charlotte, North Carolina, and is a pure aerospace industry supplier, focusing almost exclusively on aerospace. It employs 20,000 worldwide, most of these involved in Original Equipment Manufacturing (OEM) for the aerospace industry. A small segment focuses on aftermarket services such as Aircraft Technical Services (ATS) which does maintenance and repair. Goodrich manufacturing includes the following three segments, each of which has 8-10 business lines:
1. Engines: including the aero-structure and cargo divisions. Goodrich does not make engines, only parts that go into making engines. Therefore, it is a second/third tier supplier to makers of engines that go to Boeing and others.
2. Airframes: including the landing gear and the ATS group (for maintenance and overhaul of airplanes). Goodrich does not build airframes, only parts of airframes. It is therefore a first tier supplier to builders of airframes, including Boeing.
3. Electronics: including sensors and all accompanying parts. It is a second/third tier supplier.
Wilbur Smith Associates with Heffron Transportation, NohBell Group, & RNO Group
June 2006 Goodrich Cargo-1
Freight Efficiency & Competitiveness Phase I Final Report
This interview was a two-in-one with the Cargo group and an overview of the ATS group, both of which are in the Airframes section. This is a summary of the Cargo part of the interview. The Cargo group includes all cargo handling systems and everything involved with the conveyance, guidance, and restraint of cargo within the aircraft, typically wide-bodied aircraft (those that have at least one middle aisle in addition to window aisles). The group is based in North Dakota, where it supplies a variety of customers including Boeing. It ships direct from North Dakota to the Boeing plant in Everett. The Cargo facility in Everett is not a manufacturing or staging/assembly facility. It is primarily a testing, customer service, and research facility. Therefore, it is not as affected by “just-in-time” (JIT) delivery, or by delays due to weather or congestion. No inventory is held at the Everett facility; Boeing holds the inventory at its plant. Shipments come to Boeing’s Everett plant, since this is where Boeing makes its wide-body aircraft (narrow-body in Kent), and cargo is more common in wide-body aircraft. While Boeing is cited as the largest client to the Cargo group, it has a broad range of customers worldwide.
Inbound Transportation
• Most parts ship directly to Boeing in Everett, from North Dakota. • Shipments are almost exclusively trucked.
o Takes 24-36 hours o Wooden crates on flatbed
• The Cargo group does not perform any manufacturing in the Pacific Northwest. There are therefore no staging areas in the region; instead, all assembled parts are trucked from the North Dakota manufacturing site. Parts are integrated into the aircraft by Boeing.
• Trucking is exclusively for-hire.
Outbound Transportation
• None.
Supply Chain Issues
The Cargo group does not foresee any significant supply chain issues. Because Boeing’s production process is fairly well-scheduled, the Cargo group has significant advanced notice to schedule deliveries and to anticipate any potential traffic delays.
Infrastructure Issues
A majority of Goodrich shipments for the Cargo group arrive from their headquarters in North Dakota; therefore, shipments come inbound from the east on I-90. As in the case with the ATS group, the lack of east-west highway systems redundancy (Highway 2 not an option) is an issue. There is no significant movement within the Puget Sound region for the Cargo group, except for express deliveries from SEATAC. The service providers tend to mange this well.
Wilbur Smith Associates with Heffron Transportation, NohBell Group, & RNO Group
June 2006 Goodrich Cargo-2

Freight Efficiency & Competitiveness Phase I Final Report
INTERVIEW SUMMARY Project: Freight Efficiency & Competitiveness Phase 1
Subject: Interview with TMX Aerospace
Interview Date: November 18, 2005
Interviewer: Arno Hart
Attendees
George Waara Operations Manager TMX Corporation 20425 72nd Ave S, Suite 400 Kent, WA 98032 253-239-5712 Summary of Business Operations
TMX supplies all of the raw material aluminum, titanium, and other metals (plates, sheets and extruded product) for Boeing and its suppliers in the region and throughout the world. It operates mostly a ship-and-store service, but also performs some value-added, customized packaging. Overall, TMX supplies the raw ingredients for more aircraft than any other provider nation-wide. TMX has 5 locations in the United States:
• Santa Fe Springs, California • Wichita, Kansas • Wallingford, Connecticut • San Antonio, Texas • Kent/Auburn, Washington
o Pacific Northwest location (opened eight years ago) to service Boeing and suppliers locally (within a 50-mile radius)
o North-south orientation on I-5 corridor, from Monroe (30 percent) north to Tacoma (70 percent) south
o 5 years ago, 80 percent local and 20 percent U.S./global o In 2005, 60 percent local and 40 percent U.S./global o Shipping is becoming more far-flung in nature as Boeing sources out more to
suppliers
Wilbur Smith Associates with Heffron Transportation, NohBell Group, & RNO Group
June 2006 TMX-1

Freight Efficiency & Competitiveness Phase I Final Report
Inbound Transportation
Domestic Inbounds (70 percent) 100 percent supplier (or outsourced) delivery to TMX
• TMX does not tightly control these movements since on-time delivery is not crucial. • Mostly truck (flatbed)
o 4000 loads weekly o Arizona: 20 percent -- three days’ transit o California: 10 percent --- three days’ transit o Iowa: 45 percent (including Eastern Washington) -- three days’ transit time o Eastern Washington: 45 percent (including Iowa) - five hours’ transit time
• 40 express/air shipments weekly International Inbounds (30 percent) Primarily shipped from Europe (75 percent) and Russia (25 percent)
• Ocean to Port of New York/New Jersey (PONY/NJ) o 20-day voyage o Two days’ transit
• Intermodal rail to Seattle o Five to seven days transit time
Outbound Transportation
Local Trucking (60 percent) TMX handles almost all of the outbound shipments:
• 5,000 truck shipments weekly • 100 air/express • 10 percent customer pickup, 60 percent own trucking, 30 percent for-hire
o On-time delivery is most important, so they want to control delivery internally Have developed a very reliable delivery schedule:
• 99 percent on time in 2004 o One-hour delivery window
• 93 percent in 2005, but this drop was not due to congestion but commodity shortage o Chinese consumption of metals o Decrease in mill capacity
• Drivers make two turns a day o Morning (scheduled two to four days out) - 75 percent of volume
Three-hour line haul turn with multiple drops 50 percent time queuing and unloading 50 percent en route
Wilbur Smith Associates with Heffron Transportation, NohBell Group, & RNO Group
June 2006 TMX-2

Freight Efficiency & Competitiveness Phase I Final Report
o Afternoon (for same-day emergent needs) - 25 percent of volume
Two-hour line haul turn with multiple drops 25 percent time queuing and unloading 75 percent en route
• Although turns likely took less time in the past, traffic congestion impact is only anecdotal. Increase in the number of orders may be the biggest reason for increased time.
• Traffic is pretty much “tribal knowledge” and plan around it Long Distance Transport (40 percent)
• Overseas: 15 percent (five percent Asia, ten percent Europe) o Freight forwarder handles all shipments o 90 percent ocean
One-fourth through Port of Houston (container on truck or rail) One-fourth through PONY/NJ (container on truck or rail) One-fourth through Port of Los Angeles/Long Beach (flatbed truck,
containerized in California) One-fourth through Port of Seattle (container on truck)
• U.S. – 85 percent (California, Florida, New Jersey, Kansas, Texas, Arizona, and Utah)
o For-hire, mostly flatbeds Inventory Turnover
• 65 percent: 1.5 times a week • 20 percent: once every five to six weeks • 15 percent: every five to six days
Supply Chain Issues
• Inbound Over-the-Road from the East: Shipments are vulnerable to delay at the pass on I-90
o At least once a year, drivers are stuck for several days
• Local Shipments: Drivers know the traffic patterns and tendencies, but have to work hard at it
o Local roads are the weakest link for local deliveries. o They have an issue with mill drivers that do not have sophisticated tracking
systems. Raw materials (low value) Suppliers buy transportation on a lowest-contract-bid basis Not getting the best service
Wilbur Smith Associates with Heffron Transportation, NohBell Group, & RNO Group
June 2006 TMX-3

Freight Efficiency & Competitiveness Phase I Final Report
Infrastructure Issues
Key corridors and locations where TMX experiences the most delay (and unpredictability) include all the major corridors in the region, especially:
• I-5 through downtown Seattle • I-90 at Snoqualmie
Policy Issues
• Despite their good on-time performance, local congestion is the weakest link in the transportation system.
o Recommend establishment of truck only lane and/or allow trucks to use existing HOV lanes.
Wilbur Smith Associates with Heffron Transportation, NohBell Group, & RNO Group
June 2006 TMX-4

Freight Efficiency & Competitiveness Phase I Final Report
INTERVIEW SUMMARY Project: Freight Efficiency & Competitiveness Phase 1
Subject: Interview with Carlile Transportation Systems
Interview Date: November 19, 2005
Interviewer: Arno Hart
Attendees
Linda Leary, Vice President of Sales Mike Walls, Dispatch Supervisor Summary of Business Operations
Carlile is an asset-based motor carrier headquartered in Anchorage, Alaska. The company provides a full range of services including less-than-truckload (LTL), full truck load (TL), heavy haul, liquid, third-party logistics (3PL), etc. Their focus is on the Alaska market, and the bulk of their business is in Alaska. In 1984, they expanded their businesses to provide full service transportation from the Pacific Northwest to Alaska. They have at least one other operation that runs an overland service between Houston, Edmonton, and Fairbanks (targeted at the petroleum industry with trucks that carry oil field supplies from Houston to Fairbanks). This operation runs teams of drivers in both directions, a trip that takes 5-7 days, one way. Loads are mostly inbound to Alaska. Prices are based on both directions to cover the cost of the empty return haul. This interview was conducted with the overall manager and the traffic manager at the Kent facility. The Kent operation is in the process of being relocated to the Port of Tacoma. While the primary business focus is on trucking, they are planning to diversify into rail (they have a rail spur into the Tacoma facility) and direct barge (their new site in Tacoma has barge access), although the latter is not a certainty given the existence of competitive barge services. The Kent operation offers services over two main trade lanes. The main lane is waterborne between the Ports of Tacoma/Seattle and Alaska, and the second lane is an overland service by truck between Seattle and Anchorage/Fairbanks.
Wilbur Smith Associates with Heffron Transportation, NohBell Group, & RNO Group
June 2006 Carlile-1

Freight Efficiency & Competitiveness Phase I Final Report
Seattle-Alaska Waterborne Lane In general, approximately 2,200 trailers/containers ship from Seattle to Alaska each week. Carlile handles 15 percent of that market. This is the dominant service for the company (90 percent of its volume out of the Pacific Northwest). They use steamship service out of the Port of Tacoma and barge service out of the Port of Seattle. The Tacoma service has a 5-day transit time, and the Seattle service has a 10-day transit time. Seattle-Fairbanks/Anchorage Over-the-Road This service complements air cargo service between Seattle and Fairbanks/Anchorage. This service provides an alternative to regular airline cargo service that is approaching capacity due to air mail, tourists and seafood. They provide refrigerated service.
Inbound Transportation
Seattle-Alaska Waterborne Lane The inbound volumes are split 50/50 between TL and LTL.
• TL: Approximately 75 inbound loads weekly. TL goes directly to marine dock. o Pickup dwell time at customer location is 45-60 minutes.
• LTL: The LTL loads come to the cross dock truck facility, where they are consolidated with other loads. Loads are built over 2-3 days between sailings.
o Sail times are at midnight, cutoff is at 11 P.M. Therefore LTL loads have to be at bay by 5 P.M., noon for freeze/chill.
o Does not offer storage (transit), typically priced in/out same day. o Pickup transit time at customer location is 15-20 minutes (not significant).
• LTL Local Market Splits: o North Seattle/Kent Market
75 percent of inbounds 2.5 hour turn time (1.5 hours 3-5 years ago)
o Everett Market 3.5 hour turns
o Olympia Market 1.5 hour turns
o Portland Market 7.5 hour turns Leave Seattle before 5 A.M. to miss traffic Must leave Portland by 2 P.M. in order to meet window Planning to open a Portland depot to build loads there and truck direct
to port. Hot seat trucks run day and night Seattle-Fairbanks/Anchorage Over-the-Road Customers are in the Seattle area, Southern California, Chicago, and Portland -- almost exclusively inbound traffic. Shippers route shipments to them on an ad-hoc basis (not typically scheduled) as the need arises (i.e., if they cannot find space on air lift). They also pick up from
Wilbur Smith Associates with Heffron Transportation, NohBell Group, & RNO Group
June 2006 Carlile-2

Freight Efficiency & Competitiveness Phase I Final Report
80 percent of the LTL service customers in the greater Seattle area. 80 percent of this local LTL is between Kent and North Seattle. Pickups in Portland are handled as TL. Outbound Transportation
Seattle-Alaska Waterborne Lane Carlile moves about 150 loads a week over the water.
• 90 percent of the outbound moves are through the Port of Tacoma o 95 percent is roll-on/roll-off (Ro/Ro) trailer chassis by steamship o 5 percent is container on chassis by steamship o 5 days transit
• 10 percent through Port of Seattle o Container on chassis by barge o 10 days transit
Seattle-Fairbanks/Anchorage Over-the-Road They run seven days a week, using 53’ tractor-trailer combinations. The trip takes 52 hours. Volume ranges from 10-20 loads per week.
Key Supply Chain Segments/Issues
Seattle-Alaska Waterborne Lane There are two overall segments to this supply chain: the local pickup and the long-haul lane.
• Long-Haul: The waterborne segment is not something they control, and no issues were identified. However, access to the Ports of Tacoma and Seattle were identified as key issues to this supply chain segment. Note, though, that once they open their Port of Tacoma facility, the issue of access translates into a local pickup issue.
• Local Pickup: As with the over-the-road service, the critical aspect of this segment is the 11 P.M. cutoff to meet the midnight sail time. The LTL loads have to be at the cross dock by 5 P.M. to give enough time to build full trailer loads. Those that miss the cutoffs sail out on the next available sailing. While the ocean lane is not as service-critical as the over-the-road service (perishables), responsibility for a missed sailing lies with the hauler since they pick up at the client. The routes that cause the greatest incidence of delay are I-5, SR 167, I-405, and I-205 (for shipments from Portland).
Seattle-Fairbanks/Anchorage Over-the-Road There are two overall parts to this supply chain: the local pickup and the long-haul lane.
• Long Haul: This is a fairly cut-and-dried service with no real significant supply chain issues. Because of the length of the haul, there is built-in flexibility to make up for lost time, particularly that caused by Seattle congestion.
• Local Pickup: The critical aspect of this segment is the midnight cutoff to meet the long-haul departure cutoff. Local congestion has an impact on the reliability of this service. Missing the cutoff means that delivery to Fairbanks/Anchorage is delayed by a day (cannot make up a day on the long-haul segment). This affects the quality of
Wilbur Smith Associates with Heffron Transportation, NohBell Group, & RNO Group
June 2006 Carlile-3

Freight Efficiency & Competitiveness Phase I Final Report
service to the customer; again, this is a high-service segment given the time-sensitivity/perishable shelf life of the shipped goods.
Infrastructure Issues
Seattle-Alaska Waterborne Lane The dominant infrastructure issues identified are in two areas:
• Access directly to the ports, particularly the Port of Tacoma o The interchange at I-5 and 54th Street o The interchange at I-5 and Port of Tacoma Rd o The intersection between Taylor Way and Hwy 509
• The main north-south corridors o The completion of the SR 167 extension to Port of Tacoma was cited as a key
opportunity to improve north-south mobility o I-5 needs additional capacity from the Port of Seattle to Chehalis/Lacey (see
warehouse trends in next section) o Additional capacity is needed along I-5 north of Seattle toward Bellingham
• Local congestion affects the cost of local supply chain by adding the need for additional equipment and drivers
o Need 30 percent more equipment and drivers o Translates to $300,000 per year o Given that they handle 15 percent of the Seattle/Alaska market, the overall cost
of local congestion to this overall supply chain is $2,000,000 per year Seattle-Fairbanks/Anchorage Over-the-Road For the long-haul segment of this service, the key infrastructure issue is the I-5 route through Seattle. However, this is only a very small segment of the supply chain, and they have schedule redundancy to make up for delays. For the local pickup segment of this service, the key infrastructure issues are the main north-south freeway corridors between Kent and North Seattle. There is no systems redundancy (alternate north-south routes) or schedule redundancy to make up for delays.
Policies & Trends
Trend toward Migration of Warehouse/Distribution Densities From the perspective of this carrier (and perhaps others) a key trend that should be a factor in future freight transport policy is the continued migration of freight-intensive activities toward the south (Kent and south to Chehalis).
• Currently, the key freight customer market centers from north to south are (rank in size):
o Everett (3) o Seattle (1) o Tacoma/Kent (2) o 75 percent of the market is in #1 and #2.
Wilbur Smith Associates with Heffron Transportation, NohBell Group, & RNO Group
June 2006 Carlile-4
Freight Efficiency & Competitiveness Phase I Final Report
• The market is evolving toward:
o Everett (3) o Seattle (2) o Tacoma/Kent (1) o Lacey/Chehalis (4)
This is forcing the carriers to rethink their market service strategies in a variety of ways:
• Their market is moving further south, so the carriers themselves are moving their operations south, either by relocating further south or setting up satellite operations further south.
• At the same time, the market around Everett is also expected to continue growing, spreading the linear reach of the market even further. Carriers therefore have to split their operations to serve the larger (longer) market reach.
• With carriers focusing further south, the markets to the north (Everett, etc.) are becoming less serviceable from a single location (in the south).
• This emerging market split between the north and the south is the result of the Seattle bottleneck. The lack of north-south highway capacity through downtown Seattle creates a bottleneck, and increases turnaround times. This, coupled with a longer distance, has caused carriers to split the market service areas.
• The implications of this are higher transport costs and lower service levels for customers, specifically in the northern market, since it is and will continue to be the smaller relative market. This has implications for major customers expanding their northern operations, such as Boeing.
• As the Puget Sound market continues to spread south, Portland begins to fall into the overall market reach, placing further emphasis on increasing service levels toward the south. With a southern location, carriers are able to increase their local LTL/cross-dock market reach to Portland.
From an investment policy standpoint, this trend points to the need to strengthen policies toward advancing north-south highway freight capacity, specifically in advance of market saturation. Some specific freight policies mentioned included:
• Set aside highway capacity for trucks, or • Use of HOV lanes by trucks. • While the use of pricing was discussed, it was not viewed in a positive light. However,
it was noted that the carrier industry is sophisticated enough to make pricing decisions. In other words, they would not avoid a specific alternative route that is tolled solely on the basis that it is tolled. They have pricing models that can determine whether the tolled alternative provides benefits greater or less than the additional toll price. If the benefits are greater, they will use the tolled facility.
Wilbur Smith Associates with Heffron Transportation, NohBell Group, & RNO Group
June 2006 Carlile-5