free version
TRANSCRIPT

Incentive Effects of Fiscal Rules on the Finance Minister’s Behaviour: Evidence from
Revenue Projections in Swiss Cantons
Florian Chatagny
CESIFO WORKING PAPER NO. 5223 CATEGORY 1: PUBLIC FINANCE
FEBRUARY 2015
An electronic version of the paper may be downloaded • from the SSRN website: www.SSRN.com • from the RePEc website: www.RePEc.org
• from the CESifo website: Twww.CESifo-group.org/wp T
ISSN 2364-1428

CESifo Working Paper No. 5223
Incentive Effects of Fiscal Rules on the Finance Minister’s Behaviour: Evidence from
Revenue Projections in Swiss Cantons
Abstract Predicting available tax revenue accurately is a key step of fiscal policy. It has recently been shown that revenue projection errors have a direct impact on fiscal deficits. In this paper, we explore the relationship between the ideology of the finance minister and tax revenue projection errors, and assess how the stringency of fiscal rules alters this relationship. We use a panel dataset of 26 Swiss cantons over the period 1980-2007 as well as a new dataset of 99 finance ministers at the cantonal level. Our empirical strategy exploits the fact that the allocation of the departments - including the department of finance - to the elected politicians is a random process from the point of view of the voters. We identify a rather counter-intuitive positive effect of the ideology of the finance minister on tax revenue projection errors in the sense that a more left-wing finance minister produces relatively more conservative forecasts. We also find that fiscal rules reduce the effect of ideology on tax revenue projection errors. These results suggest that left-wing finance ministers need to curb deficits relatively more in order to signal the same level of competence to the voters than right-wing finance ministers. They also suggest that fiscal rules render the signal less informative to the voters and thereby reduce the incentive for left-wing finance ministers to be more conservative in their projections.
JEL-Code: C230, H680, H710.
Keywords: ideology, finance minister, fiscal rules, tax revenue projections.
Florian Chatagny ETH Zurich
KOF Swiss Economic Institute Leonhardstrasse 21
Switzerland – 8092 Zurich [email protected]
I thank Marko Koethenbuerger, Peter Egger, Doina Radulescu, Federica Liberini, Randolph Luca Bruno, Jan-Egbert Sturm, Nils C. Soguel, Laure Athias, Yvon Rocaboy, Fabio Padovano, Marius Brülhart, Lars Feld, Christoph Schaltegger, Massimo Bordignon, Thierry Madiès, Roland Hodler, Eduardo Engel, Ronny Freier and Roland Vaubel as well as participants of the KOF Brown Bag seminar (Zurich, Switzerland), of the IDHEAP Post-doctoral conference (Lausanne, Switzerland), of the ZEW conference on Public Finance (Mannheim, Germany), of the American Public Choice Society (Charleston, USA), of the EPCS conference (Cambridge, UK), of the DEFAP Workshop in Political Economy (Milan, Italy), of the journées LAGV (Aix-en-Provence, France), of the Silvaplana Workshop in Political Economy (Switzerland), of the IIPF annual congress (Lugano, Switzerland) and of the 8th Cesifo Workshop on Political Economy (Dresden, Germany) for their useful comments. I particularly thank Lars Feld and Christoph Schaltegger for the fiscal rule index data. I am also grateful to the Swiss National Science Foundation (Grant Nr. 113587) as well as to the Institute IDHEAP for their financial and logistic support. The standard disclaimer applies.

1. Introduction
The prediction and planning of major fiscal aggregates such as expenditure and revenue are key aspects of
fiscal policy. Accurate projections allow fiscal policy-makers to anticipate and correct undesirable imbalances
in the budget, thereby improving public finances sustainability. In that respect, accurately predicting tax
revenue is a particularly central aspect of fiscal planning since it sets the amount of resources available for
financing public policies. From a performance point of view, revenue projections set the limits within which
expenditure must remain in order to reach fiscal balance. Recently, the dimension of fiscal projections in
general, and revenue projections in particular, has attracted an increasing attention from scholars. The
most recent studies have shown that political determinants such as the ideology of the government (Bischoff
and Gohout, 2010), elections (Beetsma et al., 2013) or political fragmentation (Goeminne et al., 2008) are
important drivers of tax revenue projection errors (TRPE). These studies suggest that policy-makers use
revenue projections to influence fiscal policy and achieve their political objectives. Some authors (Goeminne
et al., 2008; van der Ploeg, 2010; von Hagen, 2010) have also suggested that the finance minister may play a
key role in the determination and therefore in the manipulation of revenue projections. This particular role
of the finance minister in the tax revenue budgeting process has remained empirically unexplored and this
paper provides a first attempt to fill in this gap.
Using a new dataset of 99 finance ministers in the Swiss cantons over the period 1980-2007, this paper
explores how the personal characteristics of the finance minister, in particular his ideology, shape tax rev-
enue prediction errors. This paper also addresses the more traditional question of the effect of budgetary
institutions on fiscal outcomes. Many authors have already explored the effect of different budgetary insti-
tutions such as balanced budget rules, debt ceiling or multi-year budgeting on fiscal outcomes.1 However,
little is still known about the channels through which the effect of budgetary institutions on fiscal outcomes
materializes. For instance, by rendering deficits more costly, balanced budget fiscal rules are expected to
create incentives that modify the behaviour of the policy-makers involved in the budgetary process. This
paper addresses this aspect of fiscal policy by looking at how balanced budget fiscal rules in Swiss cantons
create incentives that modify the finance minister’s behaviour and eventually revenue projection errors.
In order to cleanly identify the causal effect of the ideology of the finance minister on TRPE as well as the
incentive effect of fiscal rules on the ideological behaviour of the finance minister, we exploit two key aspects
in the context of Swiss cantons. First, like other authors before us (Feld et al., 2011; Feld and Kirchgaessner,
1See, among others, Poterba (1994); Swank (2002); von Hagen (2010); Hallerberg et al. (2007); Bohn and Inman (1996);Milesi-Ferretti (2003); Feld and Kirchgaessner (2008); Pina and Venes (2011); Blume and Voigt (2013); Luechinger and Schal-tegger (2013); Vlaicu et al. (2014)
1

2008; Luechinger and Schaltegger, 2013), we rely on the fact that Swiss cantons have experienced a staggered
introduction of balanced budget fiscal rules over time and that fiscal rules still show a strong heterogeneity
across cantons in their degree of stringency. Second, in order to cleanly estimate the effect of the ideology
of the finance minister on TRPE we exploit the fact that the allocation of departments within cantonal
cabinets occurs in a quasi-random way from the point of view of the voters. To the best of our knowledge,
this paper is the first to rely on this feature of the Swiss institutional context as an identification strategy
which, together with the staggered introduction of fiscal rules, makes us confident in the causal interpretation
of the results found.
The estimation of a panel data model using robust standard errors clustered at the finance minister and
time level shows, rather counter-intuitively, that left-wing finance ministers produce more conservative tax
revenue projections than right-wing finance ministers. Furthermore, we show that more stringent balanced
budget fiscal rules tend to reduce the effect of the ideology of the finance minister on TRPE. Robustness
checks suggest that this incentive effect of fiscal rules is particularly strong for left-wing finance ministers.
These results are robust to alternative specification of the model as well as to different estimation methods
such as system GMM and GLS with panel corrected standard errors.
These results are also consistent with the theoretical argument that, a priori, left-wing finance ministers
are perceived as less competent by the voters when it comes to balancing the budget. Thus, left-wing finance
ministers need to curb deficits more than their right-wing counterpart in order to signal to the voters the
same level of competence and therefore need to be more conservative in their revenue projections. Balanced
budget fiscal rules, by reducing deficits, make the signal less informative to the voters who attribute the
lower deficits to the rule rather than to the finance minister. This creates incentives for the finance minister
to engage in other types of signaling activities, and therefore reduce the incentive for the finance minister
to produce conservative projections. This incentive is stronger for left-wing finance ministers since they
need to compensate for the relatively negative signal sent by their ideology when it comes to balancing the
budget. A policy implication of these results is that fiscal rules may be an efficient tool for reducing political
manipulation of revenue projections and improve their accuracy.
This paper is structured as follows. Section 2 provides a theoretical discussion and formulates the tested
empirical hypotheses. Section 3 provides a detailed presentation of the empirical background and of the
data. Section 4 discusses the empirical method. Section 5 presents and discusses the results and Section 6
concludes.
2. Theoretical considerations and testing hypotheses
This section provides a theoretical discussion of the expected effect of the finance minister’s ideology
on TRPE and of how the expected effect may be altered by the incentives created by fiscal rules. Some
2

testing hypotheses underlying our empirical analysis will be derived. In order to frame our argumentation,
we first formulate three assumptions consistent with the context of Swiss cantons, which we believe also
apply to many other countries or jurisdictions. First, we assume that underestimating tax revenue tends
to reduce both expenditure and deficits. This first assumption intuitively makes sense since the amount
of projected revenue usually determines the resources available to finance expenditures. Underestimated
revenue projections keep expenditure at a lower level than realized revenue would. This subsequently results
in a lower deficit (higher surplus) once actual revenue materializes. It has actually been shown in the context
of the Swiss cantons that underestimating tax revenue by one Swiss franc per capita reduces deficit by around
0.75 Swiss franc per capita (Chatagny and Soguel, 2012). Second, we assume that the finance minister is
in charge of the department of finance and is responsible for producing tax revenue projections. Thus, an
asymmetry of information in favour of the finance minister exists in the budgeting process. This feature
does not seem to be particular to Swiss cantons. In the context of European countries, von Hagen (2010,
p.489) mentions that:”Among the ministers, only the minister of finance has the resources and administrative
capacity to produce the economic and fiscal forecasts published by the government. The minister of finance is
also typically responsible for managing the annual budget process. This gives him a considerable informational
and strategic advantage over the other cabinet members, which he can use to pursue his political agenda”.
Finally, we assume that manipulating revenue projections is the less costly way for the finance minister to
influence fiscal policy. This is reasonable and realistic since, in order to change the tax law or to reduce
expenditure, the finance minister needs to convince a majority of spending ministers, a majority of parliament
members and, as is often the case in Swiss cantons due to financial referenda, a majority of voters. The
three assumptions that have just been formulated will underlie the following discussion, starting with the
effect of the ideology of the finance minister on TRPE.
2.1. Expected effect of the FM’s Ideology on Revenue Projection errors
Under the assumptions presented above and everything else being equal, one would intuitively expect a
right-wing finance minister to produce relatively more conservative projections in order to achieve a relatively
lower level of expenditure. In this study, we intend to go beyond intuition by conducting a different line of
argument, which is based on the idea that elections are a way of selecting the most competent politician
(Persson and Tabellini, 2000, p.81). This kind of model was developed by Rogoff and Sibert (1988) and
Rogoff (1990) to analyse fiscal policy and the political business cycle. Such models assume that voters do
not have full information about the competence of politicians, which implies that voters are backward looking
because the past performance of incumbents provides information about their competence. Consequently,
incumbents also have an incentive to use policies to send signals to the voters about their competence. In the
context of tax revenue projections, it does not appear realistic to argue that the finance minister uses TRPE
per se to send a signal to the voters. Actually, it does not appear realistic to assume that voters look at
3
revenue projection errors in order to assess politicians’ performance. Projection errors do not get important
media coverage and remain largely disregarded by the public. However, the actual level of expenditure
or deficit, partly resulting from the revenue projections, can be observed by voters and used to infer how
competent the finance minister is. In this paper, we define the competence of the finance minister as his/her
ability to balance the budget by reducing deficits. This definition of competence is based on the fact that,
within the cabinet, the finance minister is the only politician responsible for the overall budget. It is therefore
natural to think that voters will evaluate the competence of the finance minister according to his/her ability
to keep the budget balanced. This idea is backed up by some empirical evidence showing that voters punish
incumbents who run deficits. In a study on 74 countries, Brender and Drazen (2008, p.2215) find that
:”voters, especially in developed countries and established democracies, do not like deficits”. Furthermore,
since each spending minister is responsible for only a share of the budget, the finance minister operates in
the context of a deficit bias, the so-called common-pool problem applied to the public budget (Weingast
et al., 1981; Velasco, 2000; Borge, 2005; Schaltegger and Feld, 2009; van der Ploeg, 2010; Baskaran, 2013).
This common-pool problem is likely to be more severe the higher the number of political parties that are
represented among the spending ministers. This is what we call the weak government hypothesis (de Haan
et al., 1999; Perotti and Kontopoulos, 2002). Coalitions are indeed the rule rather than the exception in
Swiss cantonal cabinets.2 In such a context, the finance minister has an incentive to underestimate tax
revenue irrespective of whether he/she is a left-wing or right-wing finance minister.3 Therefore one may
wonder in what way ideology plays a role in such a setting. Party affiliation is information about the finance
minister which is public. It is a signal about the finance minister’s ideology that is sent to the voters and
from which they can infer their competence. Here we argue that, everything else being equal, a left-wing
finance minister will be seen by the voters as less competent a priori - no matter whether this is true
or not - than a right-wing finance minister when it comes to curbing deficits and balancing the budget.
This argument is both reasonable and realistic. The prior belief that left-wing incumbents are likely to
generate larger deficits than their right-wing counterparts is both widespread among scholars and in the
general public. Since the seminal contribution by Hibbs (1977), the hypothesis that left-wing governments
generate higher budget deficits has been formulated and tested in numerous empirical studies. In spite of
mixed evidence, this hypothesis is still dominant in the literature. One of the most recent cases in point
which is closely related to this study is the study by Jochimsen and Thomasius (2014) who formulate the
hypothesis that deficits are higher under a left-wing finance minister. In the Swiss context, opinion surveys
2Cantonal governments are characterized by a rather high degree of political fragmentation. Indeed, in our sample, there areat least two parties in power in more than 75 per cent of the cases. See summary statistics for the variable called ”Fragmentation”in Table (.9).
3This argument is backed up by the fact that, in all Swiss cantons except Bern tax revenue are underestimated. See Table1
4

suggest that right-wing parties are perceived as more credible when it comes to fiscal policy.4 This prior
belief of voters that left-wing finance ministers are less likely to balance the budget combined with their
preference for balanced budgets create an incentive for left-wing finance ministers to signal that they are at
least as competent as right-wing finance ministers. Therefore, in order to signal the same level of competence
as a right-wing finance minister, a left-wing finance minister needs to produce lower deficits and, therefore,
underestimate tax revenue to a larger extent. In line with this last prediction, we formulate our first testing
hypothesis :
(H1) left-wing incumbent finance ministers produce more conservative direct tax revenue
projections
2.2. Incentive effects of fiscal rules
Provided an effect of ideology on tax revenue projection errors is observed, one may also wonder whether
the implementation of fiscal rules may alter this relationship. Fiscal rules render the creation of deficits more
costly for instance by imposing automatic expenditure cuts and/or tax increases which may be very costly to
incumbents from an electoral point of view. Therefore, depending on their degree of stringency, fiscal rules
are expected to create incentives for the spending ministers to be more cautious in their spending claims
in order to avoid high deficits. Numerous empirical studies provide evidence that fiscal rules are effective
in reducing fiscal deficits and/or debt accumulation (see, among others, Bohn and Inman (1996); Feld and
Kirchgaessner (2008); Canova and Pappa (2006); Debrun et al. (2008); Blume and Voigt (2013)). Fewer
studies look at the effect of fiscal rules on fiscal projections. While Pina and Venes (2011) do not find any
effect of balance budget rules on deficit forecasts, Luechinger and Schaltegger (2013) show that fiscal rules
increase the probability of accurate deficit projections by reducing the over-pessimistic bias in projections.
Without showing it explicitly, this last study on the Swiss cantons suggests that, in the presence of a balanced
budget fiscal rule, the necessity to reduce deficits by underestimating tax revenue is expected to be lower,
irrespective of the ideology of the finance minister. Even if curbing deficits turns out to be necessary, voters
may attribute a reduction in deficits to the implemented fiscal rule rather than to the competence of the
finance minister. This makes a further reduction in deficits a less informative signal to the voters about the
competence of the finance minister. Therefore, the finance minister has an incentive to engage in other types
of signalling activity which, under a fiscal rule, is relatively more informative to the voters. This incentive
is stronger for relatively more left-wing finance ministers since they need to compensate for the negative
4In a 2008 opinion survey, respondents considered the main Swiss right-wing parties, CVP, FDP and SVP as very or rathercredible in 38%, 37% and 50 % of the cases while left-wing parties (SP and GPS) are seen as credible in 35% of the cases.Conversely, the right-wing parties are perceived as absolutely not credible in 15%, 10% and 16% of the cases while the left-wingparties received 21% (see Longchamp, C., Finanzmonitor 2008 Souveran fur eine Nachhaltige Finanzpolitik, Economiesuisse,2008).
5
signal sent by their ideology. The stronger reaction of the left-wing finance ministers imply that fiscal rules
must reduce the positive effect of ideology on tax revenue projection errors. Consequently, we can state our
second testing hypothesis as follows :
(H2) The effect of the ideology of the finance minister on tax revenue projection errors
decreases with the stringency of fiscal rules.
In order to test our hypotheses, we rely on a panel dataset of the 26 Swiss cantons over the period
1980-2007 as well as a new dataset of 99 finance ministers at the cantonal level. We present the background
of the Swiss cantons and our data in more detail in the next section.
3. Institutional background and data
In Switzerland, the cantons form the sub-national level of the government. They possess well established
institutions such as a constitution, a government and a parliament and enjoy a high degree of budgetary
autonomy. They make up for about 40 percent of total public expenditure and revenue. They also have a
high degree of sovereignty to levy, collect and predict taxes. For instance, they can decide on a tax coefficient
and on the progressivity of the tax schedule that applies to personal income. They generate 47 percent of
the total personal income tax revenue while the additional revenue is collected by the federal state and
the municipalities. In aggregate, direct tax revenue (personal and corporate income tax) represent about
46 percent of the cantons’ current revenue. Transfers represent 31 percent while excise, fees and other tax
revenue represent 23 percent of cantonal current revenue.
3.1. Revenue Projections in Swiss cantons
In order to identify the effect of the finance minister’s ideology on revenue projections, we focus on direct
taxes. Indeed, transfers are paid and therefore predicted by other levels of jurisdiction than the cantons. For
instance, the federal administration produces a publicly available projection of the transfers paid to each
canton in the frame of the national fiscal equalization. When it comes to fees, excise or other taxes, it may not
be the department headed by the finance minister that is responsible for collecting revenue and producing
projections. For instance, in the canton of Zurich, the tax on vehicles (”Verkehrsabgabe”), is collected
by the Road and Traffic Office (”Strassenverkehrsamt”) which depends on the Department for Security
(”Sicherheitsdirektion”) and not the Department of Finance. These examples show that the prediction of
transfers and fees is not in the hands of the finance minister and does not leave him with room to manoeuvre.
Direct tax revenue however is collected and predicted by each canton’s own tax offices. In every canton,
without exception, the tax office directly depends on the department of finance, which is headed by the
incumbent finance minister. The cantonal departments of finance are very independent in producing direct
revenue projections. While in some cantons the department of finance is responsible for producing direct tax
6

revenue forecasts for the municipalities, it does not have to apply projections or other data that are provided
by the federal state. In spite of the fact that the federal state and the cantons share the same tax base for
direct taxes, they produce projections only for their own budgets independently of each other. Furthermore,
cantonal departments of finance are free to use any data source ranging from individual taxpayer data to
macroeconomic forecasts or municipal data in order to produce their projections. They are also free to
use any methodology such as micro simulations, time series analysis or more intuitive experts’ judgemental
estimations. The methodologies are not presented in details in official and publicly available documents
and the projection errors are not systematically assessed. Even the technical forecast, as produced by the
tax revenue office, is not publicly available. Among the members of the cantonal cabinet, only the finance
minister has direct access to this information. Finally, the projection made by the department of finance
is not challenged by alternative forecasts. No governmental or independent institution produces their own
revenue projection for individual cantons and for detailed revenue items. Overall, the direct tax revenue
budgeting process in Swiss cantons provides the finance minister with a high degree of control and a strong
informational advantage towards other players in the budgeting process. Note that finance ministers in Swiss
cantons are not vested with particular powers like veto or agenda-setting power like in European countries,
for instance.5 In that sense, the position of finance ministers in Swiss cantons appears to be relatively weak
with respect to fiscal policy choices. This makes revenue projection a particularly appealing tool to influence
fiscal policy decisions. In order to identify possible manipulations in revenue projections, we computed direct
tax revenue projection errors as explained in the next section.
3.2. Data on direct tax revenue projection errors
In order to compute direct tax revenue projection errors, we collected projected as well as realized direct
tax revenue as published in cantonal public accounts over the period 1980-2007.6 In the literature about
tax revenue forecasting accuracy,7 absolute errors are often used as an indicator in order to avoid positive
and negative errors offsetting each other. However, in this paper, we are looking to find precise information
about the direction in which projections are potentially manipulated. Thus, we choose the difference between
the projected amount of tax revenue and the actual amount. Cantonal population has been chosen as the
denominator. This allows us to compare tax revenue projection errors between cantons. Thus, our main
indicator measuring tax revenue projection errors may be expressed as follows :
Errorijt =(Rp
ijt −Raijt)
Pijt(1)
5For example, see von Hagen (2010) for a presentation on the budgetary institutions in the European context.6Note that, over the period of interest 1980-2007, public accounts do not distinguish between personal and corporate tax
revenue for every canton and/or every time span. For this reason, we used what we call ”direct taxes”, i.e. the addition of bothpersonal and corporate tax. Using this aggregate allows us to use of a complete and homogenous dataset across both cantonsand years.
7See for example Mocan and Azad, 1995, p.419
7

,where R denotes Direct Tax Revenue, the subscript a stands for actual, the subscript p stands for projected
and P denotes the cantonal population. i identifies finance ministers, j identifies cantons and t identifies
years. Table (1) lists summary statistics for the average TRPE over time for each canton. Cantons are
ranked according to the average tax revenue budgeting error over the considered period.
Table 1: Tax Revenue Projection Errors per Capita (1980-2007)
canton mean sd min max range N
BE 36.96827 81.64759 -129.2704 201.4522 330.7226 28
UR -14.06001 128.6291 -293.7344 237.378 531.1124 28
SH -15.59604 76.27386 -135.4608 168.287 303.7477 28
JU -16.72336 61.70619 -147.9202 89.91608 237.8363 28
AR -23.40973 59.14726 -110.858 128.5307 239.3887 28
ZH -23.456 137.3845 -433.2509 174.6628 607.9137 28
SO -26.40169 132.1977 -287.9469 300.2846 588.2315 28
TG -35.07672 83.22178 -183.1832 145.8114 328.9946 28
NE -35.27104 120.2942 -267.6661 224.1479 491.814 28
LU -41.15983 91.98276 -237.707 139.6689 377.3759 28
SG -43.58655 76.21494 -219.4491 152.3872 371.8363 28
OW -54.33199 83.78898 -193.8892 179.7751 373.6643 28
AG -55.51718 112.7451 -246.1751 195.932 442.1071 28
NW -65.94932 120.5269 -538.529 104.1314 642.6604 28
VS -74.92986 93.28039 -259.4183 189.9564 449.3747 28
VD -75.06823 193.6663 -552.7347 359.1893 911.924 28
SZ -75.87744 108.8037 -309.7535 157.1612 466.9147 28
GR -85.87241 57.24932 -188.2635 45.87022 234.1338 28
FR -101.8898 90.83454 -383.7159 64.05879 447.7747 28
GE -113.9392 528.3911 -1430.055 1142.728 2572.783 28
AI -122.1199 121.228 -344.7328 98.15961 442.8924 28
GL -137.1442 191.3831 -437.0659 233.31 670.3759 28
BL -144.7217 199.0107 -839.1275 149.5214 988.6489 28
TI -157.4365 206.4838 -571.5998 269.7093 841.3091 28
BS -193.2389 489.8768 -1237.159 556.99 1794.149 28
ZG -222.5467 213.0142 -672.3793 263.3303 935.7096 28
Tot -73.78293 193.3494 -1430.055 1142.728 2572.783 728
It shows that, except for the canton of Bern (BE), all cantons have tax revenue budgeted errors below zero
on average. Thus, we clearly observe a tendency to underestimate tax revenue. This pattern is consistent
with the idea that the finance minister is operating in the context of a deficit bias, the fiscal common problem,
and has an incentive to be conservative in his/her revenue projections independently of his/her ideology. We
also observe strong heterogeneity across cantons. While a canton like Bern overestimated direct tax revenue
by about 37 Swiss francs per capita on average, cantons like Basel-Stadt or Zug massively underestimated
their tax revenue with, respectively, -193 and -222 Swiss francs per capita over the same period. We naturally
expect the characteristics of the finance minister - in particular his/her ideology - to explain an important
part of the observed inter-cantonal and inter-temporal variability. Indeed, due to their position within the
government cabinet, the finance minister is expected to have a particularly high influence on projected tax
revenue and, therefore, on TRPE.
3.3. Finance ministers in the Swiss cantons : a new dataset
In order to test whether the ideology of the finance minister indeed has an impact on revenue projections,
we collected personal data on 99 finance ministers from 1980-2007. Table (2) presents the indicator used to
8
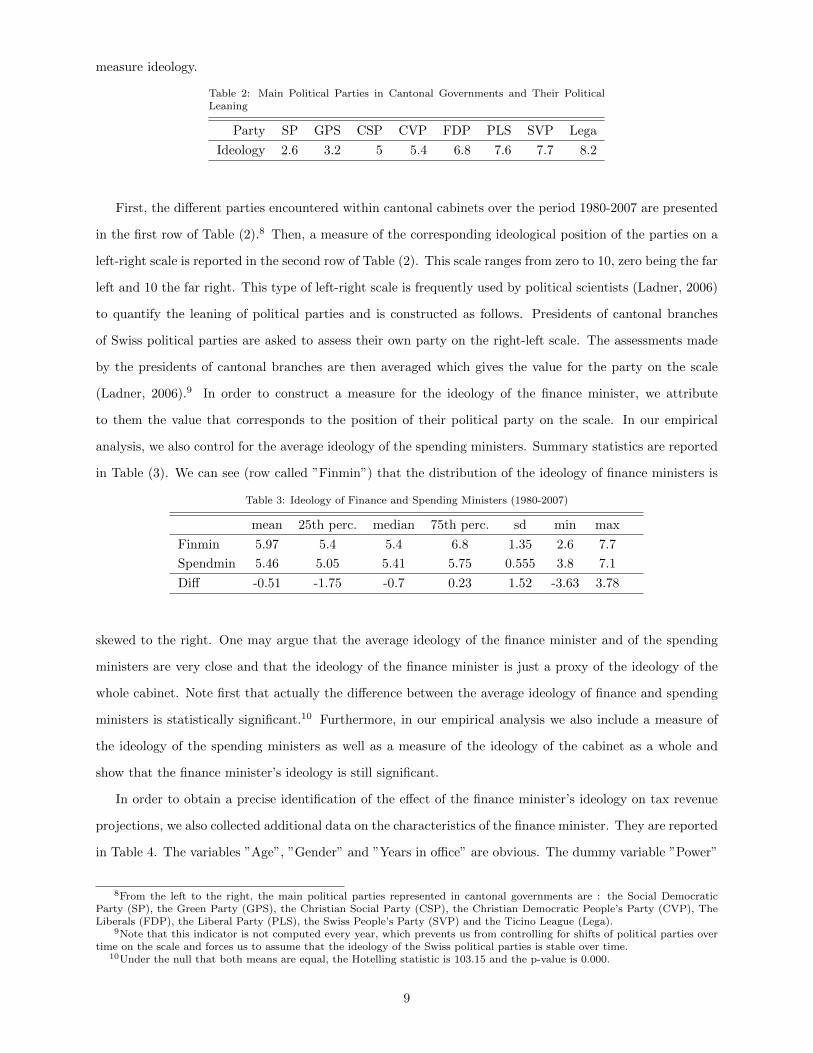
measure ideology.
Table 2: Main Political Parties in Cantonal Governments and Their PoliticalLeaning
Party SP GPS CSP CVP FDP PLS SVP Lega
Ideology 2.6 3.2 5 5.4 6.8 7.6 7.7 8.2
First, the different parties encountered within cantonal cabinets over the period 1980-2007 are presented
in the first row of Table (2).8 Then, a measure of the corresponding ideological position of the parties on a
left-right scale is reported in the second row of Table (2). This scale ranges from zero to 10, zero being the far
left and 10 the far right. This type of left-right scale is frequently used by political scientists (Ladner, 2006)
to quantify the leaning of political parties and is constructed as follows. Presidents of cantonal branches
of Swiss political parties are asked to assess their own party on the right-left scale. The assessments made
by the presidents of cantonal branches are then averaged which gives the value for the party on the scale
(Ladner, 2006).9 In order to construct a measure for the ideology of the finance minister, we attribute
to them the value that corresponds to the position of their political party on the scale. In our empirical
analysis, we also control for the average ideology of the spending ministers. Summary statistics are reported
in Table (3). We can see (row called ”Finmin”) that the distribution of the ideology of finance ministers is
Table 3: Ideology of Finance and Spending Ministers (1980-2007)
mean 25th perc. median 75th perc. sd min max
Finmin 5.97 5.4 5.4 6.8 1.35 2.6 7.7
Spendmin 5.46 5.05 5.41 5.75 0.555 3.8 7.1
Diff -0.51 -1.75 -0.7 0.23 1.52 -3.63 3.78
skewed to the right. One may argue that the average ideology of the finance minister and of the spending
ministers are very close and that the ideology of the finance minister is just a proxy of the ideology of the
whole cabinet. Note first that actually the difference between the average ideology of finance and spending
ministers is statistically significant.10 Furthermore, in our empirical analysis we also include a measure of
the ideology of the spending ministers as well as a measure of the ideology of the cabinet as a whole and
show that the finance minister’s ideology is still significant.
In order to obtain a precise identification of the effect of the finance minister’s ideology on tax revenue
projections, we also collected additional data on the characteristics of the finance minister. They are reported
in Table 4. The variables ”Age”, ”Gender” and ”Years in office” are obvious. The dummy variable ”Power”
8From the left to the right, the main political parties represented in cantonal governments are : the Social DemocraticParty (SP), the Green Party (GPS), the Christian Social Party (CSP), the Christian Democratic People’s Party (CVP), TheLiberals (FDP), the Liberal Party (PLS), the Swiss People’s Party (SVP) and the Ticino League (Lega).
9Note that this indicator is not computed every year, which prevents us from controlling for shifts of political parties overtime on the scale and forces us to assume that the ideology of the Swiss political parties is stable over time.
10Under the null that both means are equal, the Hotelling statistic is 103.15 and the p-value is 0.000.
9

Table 4: Finance Minister Characteristics : Summary Statistics
Variable Mean Std. Dev. Min. Max. N
Age 52.237 6.558 33 69 712
Gender 0.092 0.289 0 1 728
Years in office 5.402 3.654 1 18 728
Power 0.88 0.325 0 1 728
President 0.166 0.373 0 1 728
Federal Council 0.033 0.179 0 1 728
takes value 1 when the finance minister belongs to the majority. For instance, a right-wing finance minister
belongs to the majority if half of the seats in the cantonal cabinet plus one are held by right-wing politicians.
The variable ”President” takes value 1 in the years during which the finance minister is also president of
the cantonal government. Finally, we intend to capture career concerns of finance ministers by including a
dummy variable taking value 1 whenever a finance minister is elected to the Federal Council, which is the
highest possible political position within an executive governmental entity in Switzerland.
3.3.1. Finance ministers’ ideology and TRPE
Of all the characteristics presented above, the ideology of the finance minister is expected to be a particu-
larly important driver of tax revenue projection errors. To motivate this claim we report in Table 5 summary
statistics for the tax revenue projection errors within each type of ideology of the finance ministers.
Table 5: Direct Tax Revenue Projection Error per Capita by Ideology
Ideology mean sd min max range N
SP -177.4019 287.206 -1237.159 224.1479 1461.307 60
GP -1146.358 401.2085 -1430.055 -862.6603 567.3945 2
Misc -101.9834 185.0647 -344.7328 167.0657 511.7984 11
CVP -66.61592 112.7158 -672.3793 300.2846 972.6639 275
FDP -84.20896 181.4824 -839.1275 436.7046 1275.832 254
LP 50.68671 387.493 -1029.024 1142.728 2171.753 32
SVP -16.68983 128.7526 -437.0659 299.5135 736.5794 94
Total -73.78293 193.3494 -1430.055 1142.728 2572.783 728
The average projection error exhibits very important differences between types of ideologies of the finance
ministers with a tendency of the left-wing finance ministers (SP and GP) to produce a lower average error
than the center right finance ministers (CVP and FDP) and than the right-wing finance ministers SVP.
These summary statistics not only support the idea that the ideology of the finance minister drives part of
the differences observed in tax revenue projection errors but also suggest that left-wing finance ministers
tend to produce more conservative forecasts.
To support our argument further we provide in figures 1 to 3, examples of individual cantons within
which the average tax revenue projection error sharply dropped whenever the ideology of the incumbent
10

FDP (right)
FDP (right)
SP (left) −6
0−4
0−2
00
20A
vera
ge P
roje
ctio
n E
rror
1980 1985 1990 1995 2000 2005Year
Figure 1: Shift in the Average Revenue Projection Error : Schaffhausen
shifted from right to left. In the figures 1 to 3 the tax revenue projection errors are averaged over the years
during which a particular finance minister exercised power. In these examples, we can observe a clear and
sharp negative deviation of the average tax revenue projection error whenever the ideology of the finance
minister shifts from right-wing to left-wing. What figures also show, however, is that the average error also
exhibits some shifts when the ideology of the finance minister does not change. This is especially obvious
in figure 1. Clearly, revenue projection errors may be driven by many other factors that must be controlled
for in order to obtain a clean estimation of the effect of the ideology of the finance minister and draw some
clear-cut conclusions. In particular, fiscal rules are expected to shape TRPE through the incentive effect
they have on the behaviour of the finance minister. In the next subsection we explain how balanced budget
fiscal rules in the Swiss cantons are empirically addressed.
CVP (right)
SP (left)
CVP (right)
−110
−100
−90
−80
−70
Ave
rage
Pro
ject
ion
Err
or
1980 1985 1990 1995 2000 2005Year
Figure 2: Shift in the Average Revenue Projection Error : Fribourg
11

LP (right)
SP (left)
LP (right)
−600
−400
−200
020
040
0A
vera
ge P
roje
ctio
n E
rror
1990 1995 2000 2005Year
Figure 3: Shift in the Average Revenue Projection Error : Geneva
3.4. Fiscal rules
Should an effect of the ideology of the finance minister on TRPE be observed, we expect fiscal rules to
reduce it. The context of Swiss cantons is particularly appropriate to test this hypothesis since, between
1980 and 2007, several, but not all, Swiss cantons experienced an introduction of fiscal rules which was
staggered over time. Across cantons, fiscal rules also exhibit a relatively high heterogeneity in their degree of
stringency. This makes Swiss cantons a particularly appropriate setting for identifying the incentive effects
of fiscal rules on cantonal finance ministers.
3.4.1. Measure of the stringency of fiscal rules
Table 6: Fiscal Rules Index : Summary Statistics
N Mean S.d. Min. Max
Fiscal rule index 728 0.452 0.943 0 3
In order to measure the stringency of fiscal rules, we rely on the index suggested by Feld and Kirchgaessner
(2008).11 The approach developed by Feld and Kirchgaessner (2008) makes use of three criteria to assess the
stringency of fiscal rules.12 The first criterion assesses whether or not budget planning is strongly connected
to actual budget execution. The second criterion captures the existence or absence of strong numerical
constraints. The third criterion captures the existence of effective sanctions (in the form of automatic tax
adjustments for instance) whenever the numerical constraint is not respected . Using these three criteria, an
index of the stringency of fiscal rules from zero (none of the criteria are fulfilled) to three (all of the three
11For detailed description of this index, see Feld et al. (2011). A detailed description of the legal and constitutional require-ments of Swiss cantonal fiscal rules is also provided by Luechinger and Schaltegger (2013).
12The following description is based on Feld et al. (2011)
12
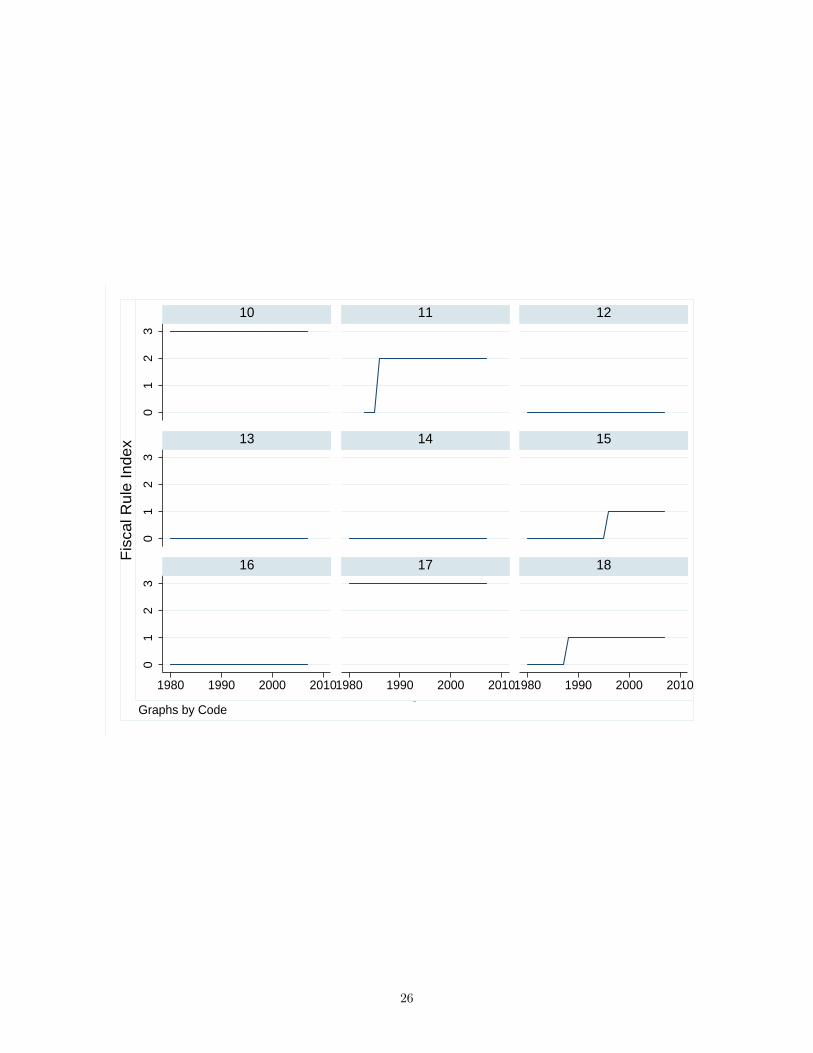
criteria are fulfilled) is constructed for each canton. Table 6 shows the summary statistics for the fiscal rules
index. The staggered introduction of fiscal rules in Swiss cantons over the period is illustrated in Appendix
6.
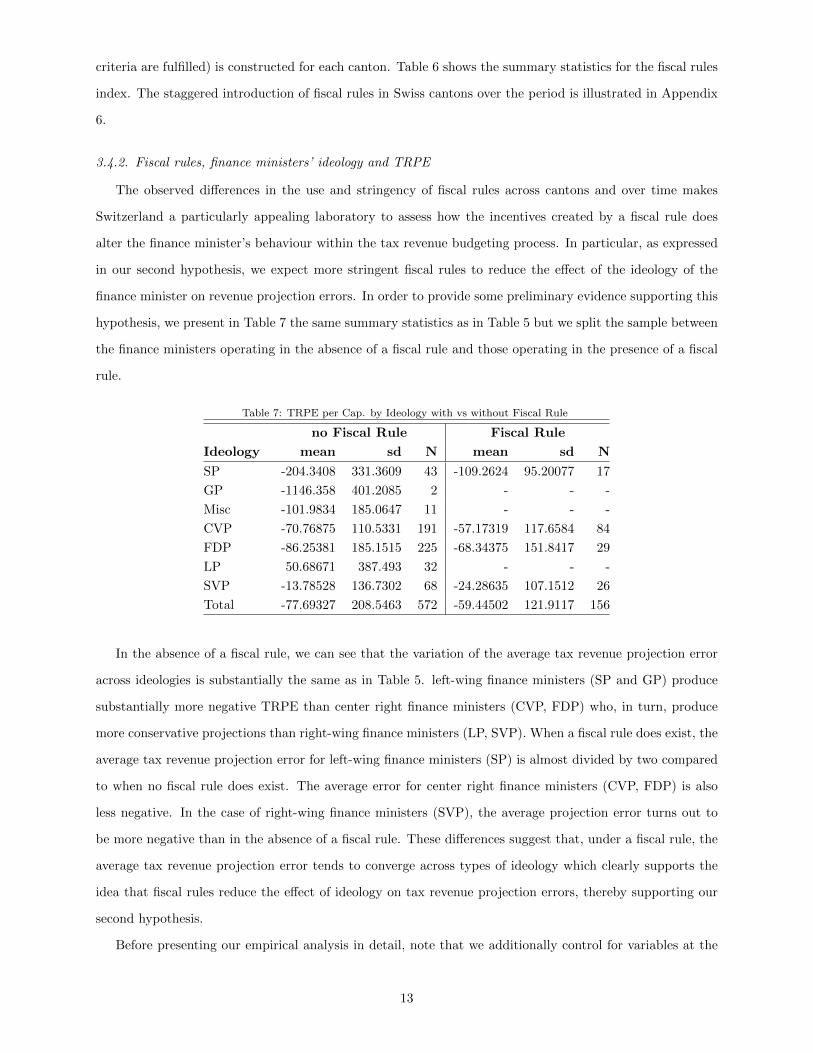
3.4.2. Fiscal rules, finance ministers’ ideology and TRPE
The observed differences in the use and stringency of fiscal rules across cantons and over time makes
Switzerland a particularly appealing laboratory to assess how the incentives created by a fiscal rule does
alter the finance minister’s behaviour within the tax revenue budgeting process. In particular, as expressed
in our second hypothesis, we expect more stringent fiscal rules to reduce the effect of the ideology of the
finance minister on revenue projection errors. In order to provide some preliminary evidence supporting this
hypothesis, we present in Table 7 the same summary statistics as in Table 5 but we split the sample between
the finance ministers operating in the absence of a fiscal rule and those operating in the presence of a fiscal
rule.
Table 7: TRPE per Cap. by Ideology with vs without Fiscal Rule
no Fiscal Rule Fiscal Rule
Ideology mean sd N mean sd N
SP -204.3408 331.3609 43 -109.2624 95.20077 17
GP -1146.358 401.2085 2 - - -
Misc -101.9834 185.0647 11 - - -
CVP -70.76875 110.5331 191 -57.17319 117.6584 84
FDP -86.25381 185.1515 225 -68.34375 151.8417 29
LP 50.68671 387.493 32 - - -
SVP -13.78528 136.7302 68 -24.28635 107.1512 26
Total -77.69327 208.5463 572 -59.44502 121.9117 156
In the absence of a fiscal rule, we can see that the variation of the average tax revenue projection error
across ideologies is substantially the same as in Table 5. left-wing finance ministers (SP and GP) produce
substantially more negative TRPE than center right finance ministers (CVP, FDP) who, in turn, produce
more conservative projections than right-wing finance ministers (LP, SVP). When a fiscal rule does exist, the
average tax revenue projection error for left-wing finance ministers (SP) is almost divided by two compared
to when no fiscal rule does exist. The average error for center right finance ministers (CVP, FDP) is also
less negative. In the case of right-wing finance ministers (SVP), the average projection error turns out to
be more negative than in the absence of a fiscal rule. These differences suggest that, under a fiscal rule, the
average tax revenue projection error tends to converge across types of ideology which clearly supports the
idea that fiscal rules reduce the effect of ideology on tax revenue projection errors, thereby supporting our
second hypothesis.
Before presenting our empirical analysis in detail, note that we additionally control for variables at the
13

level of cantons and which are traditionally encountered in the literature.13 The so-called political budget
cycle is captured by a dummy variable equal to 1 for the years when elections are held, and 0 otherwise.14
Following Goeminne et al. (2008), we also include a variable controlling for the degree of fragmentation
within the government cabinet, measured by the number of parties in the government. We control for
political concordance which is measured by the percentage of the seats in the legislature that are occupied
by members of parties represented in the executive. We also control for the number of departments which
is equivalent to the number of members in the cabinet since, in Swiss cantons, each member of a cantonal
government is in charge of a department. The ideology of the executive as a whole is controlled for by
the variable ”Right” which is measured by the proportion of right-wing members in cantonal executives.
”Postnumerando” is a dummy variable taking value 1 when a canton uses the postnumerando taxation
system and zero when a praenumerando system is in use.15 ”Grant” measures the degree of tax autonomy
using federal transfers as a share of actual direct tax revenue. Deficit(-1) is the lagged cantonal fiscal balance.
Finally, we control for economic conditions with the growth rate of cantonal income (variable ”Growth”)
and the annual change in the cantonal unemployment rate (”Unemployment(D)”).
4. Empirical Analysis
4.1. Econometric model
In this section, we present the methodology used to perform the analysis. The estimated model is
formalized by equation 2 below.
Errorijt = βIdeologyijt + λRulejt + µ(Ideologyijt ∗Rulejt) + δXijt + γWjt + α+ θj + τt + εijt (2)
, where i = 1, ..., 99 identifies finance ministers, j = 1, ..., 26 identifies cantons and t = 1980, ..., 2007 identifies
years. Error is our measure of tax revenue projection error. Ideologyijt is the ideology of the finance minister
measured by his party affiliation as explained above, and β the associated coefficient measuring the effect on
revenue forecast errors. Rulejt is the index measuring the stringency of fiscal rules. (Ideology ∗Rule) is an
interaction term taking into account the effect of a fiscal rule on the effect of the finance minister’s ideology
on TRPE. Xijt is a matrix of controls constituted by the personal characteristics of the finance minister
as presented in Table 4, and δ is the associate vector of parameters. Wjt is a matrix of controls at the
cantonal level reflecting the economic, political and institutional environment in which the finance minister
is exercising power as presented in Table .9 of the Appendix, and γ is the associated vector of parameters.
13The summary statistics are reported in Table .9 of Appendix 614In the empirical model we include also a lagged and forwarded election dummy to account for ante- and post-elections
effects.15Luechinger and Schaltegger (2013) also control for the taxation system.
14

Note that Wjt includes the ideology of the spending ministers as well as three dummy variables for the pre-,
post- and electoral year. α is an intercept. θj and τt are canton and time fixed effects respectively and εijt
is the error term.
in order to have a clearer picture of how fiscal rules influence the effect of the finance minister’s ideology
on tax revenue projection errors, it will be of interest to compute the marginal effect of ideology. We can
derive it from equation (2):
∂Errorijt∂Ideologyijt
= β + µ ∗Rulejt (3)
According to our hypotheses, β and µ are expected to be significantly positive and negative respectively.
A positive β means that a more right-wing finance minister produces relatively less conservative forecasts
than a left-wing finance minister. A negative µ means that the stringency of fiscal rules reduces the average
marginal effect of ideology on tax revenue projection errors.
4.2. Estimation
The data and, therefore, standard errors are potentially identified over three dimensions : finance min-
ister, canton and year. Standard errors may thus be correlated within the clusters existing in these three
dimensions, thereby possibly leading to inference problems. Furthermore, while clusters related to finance
ministers and cantons are nested, this is not the case for years and finance ministers or years and can-
tons. Therefore, in order to estimate equation 2, we follow the methodology suggested by Cameron et al.
(2011) for multi-way non-nested clustering. The parameters of interests will be estimated through OLS with
cluster-robust standard errors with clustering occurring at the finance minister level and at the year level.
Alternative estimators will be used to check for the robustness of the results. System GMM will be used to
estimate a dynamic version of the model and a GLS estimator with panel corrected standard errors will also
be used in order to better account for the panel specific autoregressive structure of the error term. Results
turn out to be robust.
4.3. Identification
As usual in any study on the impact of political variables and/or fiscal institutions on fiscal variables one
can question whether the estimation is not plagued with endogeneity problems, in particular reverse causality
and omitted variable bias. One could argue that all three variables of interest, namely revenue projection
errors, finance minister’s ideology and fiscal rules are determined by general fiscal conditions and/or citizens
preferences. Similarly one could think that tax revenue projection errors are being observed by citizens who
modify their voting behaviour and choose the finance minister accordingly. This would mean that TRPE
explain part of the finance minister’s ideology. In this paper, we argue that our empirical findings can be
interpreted in a causal way for several reasons.
15
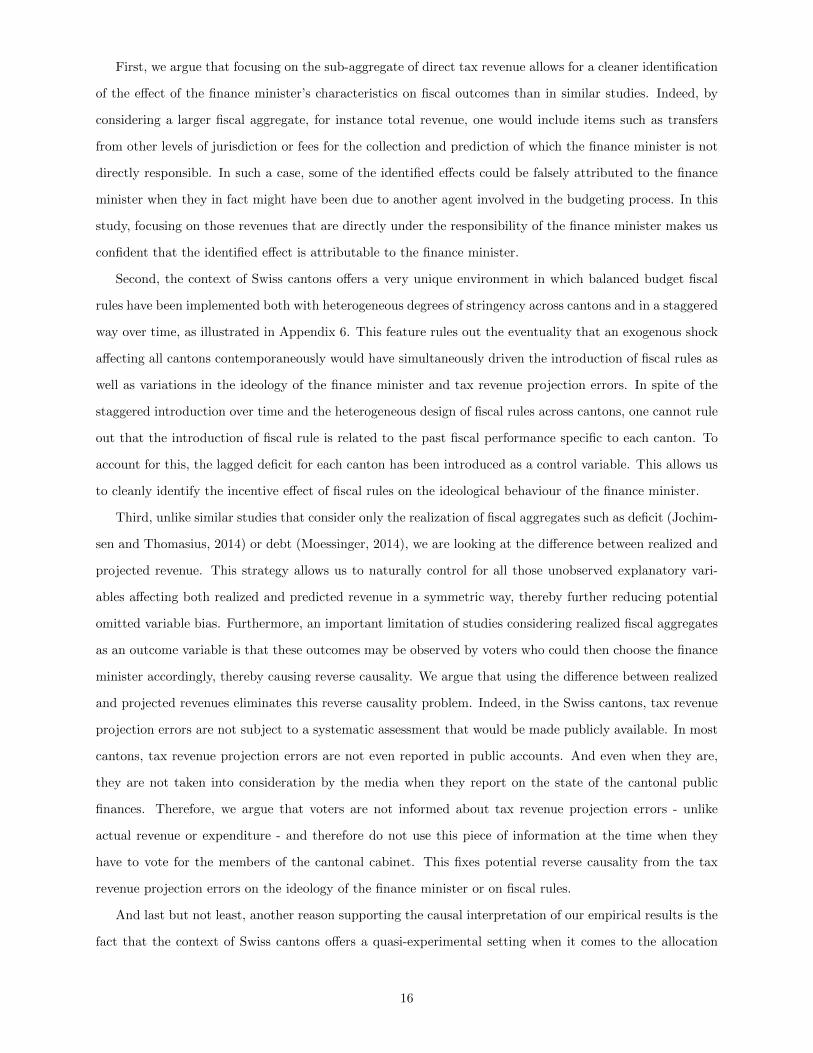
First, we argue that focusing on the sub-aggregate of direct tax revenue allows for a cleaner identification
of the effect of the finance minister’s characteristics on fiscal outcomes than in similar studies. Indeed, by
considering a larger fiscal aggregate, for instance total revenue, one would include items such as transfers
from other levels of jurisdiction or fees for the collection and prediction of which the finance minister is not
directly responsible. In such a case, some of the identified effects could be falsely attributed to the finance
minister when they in fact might have been due to another agent involved in the budgeting process. In this
study, focusing on those revenues that are directly under the responsibility of the finance minister makes us
confident that the identified effect is attributable to the finance minister.
Second, the context of Swiss cantons offers a very unique environment in which balanced budget fiscal
rules have been implemented both with heterogeneous degrees of stringency across cantons and in a staggered
way over time, as illustrated in Appendix 6. This feature rules out the eventuality that an exogenous shock
affecting all cantons contemporaneously would have simultaneously driven the introduction of fiscal rules as
well as variations in the ideology of the finance minister and tax revenue projection errors. In spite of the
staggered introduction over time and the heterogeneous design of fiscal rules across cantons, one cannot rule
out that the introduction of fiscal rule is related to the past fiscal performance specific to each canton. To
account for this, the lagged deficit for each canton has been introduced as a control variable. This allows us
to cleanly identify the incentive effect of fiscal rules on the ideological behaviour of the finance minister.
Third, unlike similar studies that consider only the realization of fiscal aggregates such as deficit (Jochim-
sen and Thomasius, 2014) or debt (Moessinger, 2014), we are looking at the difference between realized and
projected revenue. This strategy allows us to naturally control for all those unobserved explanatory vari-
ables affecting both realized and predicted revenue in a symmetric way, thereby further reducing potential
omitted variable bias. Furthermore, an important limitation of studies considering realized fiscal aggregates
as an outcome variable is that these outcomes may be observed by voters who could then choose the finance
minister accordingly, thereby causing reverse causality. We argue that using the difference between realized
and projected revenues eliminates this reverse causality problem. Indeed, in the Swiss cantons, tax revenue
projection errors are not subject to a systematic assessment that would be made publicly available. In most
cantons, tax revenue projection errors are not even reported in public accounts. And even when they are,
they are not taken into consideration by the media when they report on the state of the cantonal public
finances. Therefore, we argue that voters are not informed about tax revenue projection errors - unlike
actual revenue or expenditure - and therefore do not use this piece of information at the time when they
have to vote for the members of the cantonal cabinet. This fixes potential reverse causality from the tax
revenue projection errors on the ideology of the finance minister or on fiscal rules.
And last but not least, another reason supporting the causal interpretation of our empirical results is the
fact that the context of Swiss cantons offers a quasi-experimental setting when it comes to the allocation
16
of departments to elected politicians. Swiss cantons exhibit majoritarian electoral systems in which the
members of the cantonal cabinet are elected individually.16 However, the individual politicians do not run
for a particular department that would be identified ex ante. After the elections, members of the cantonal
cabinet allocate the departments. Neither is this allocation monitored by explicit and binding rules nor is
the protocol of the sessions during which the elected politicians bargain over this allocation made public.
In fact, departments may be allocated according to very different types of implicit rules or criteria such
as seniority in office, electoral score, professional background, personal interests, experience, etc. Even re-
elected finance ministers are not guaranteed to remain finance minister after their re-election. Therefore,
from the point of view of the voters, the allocation of a politician with a certain ideology to the department
of finance is quasi-random. Voters cannot anticipate which politician is going to become finance minister.
This argument is supported by our sample data as the average number of years a finance minister stays in
office is 5.4 (see Table 4).17 Provided that the electoral period lasts four or five years, this statistic means
that the politician in charge of the department of finance changes rather frequently which makes it difficult
for the voters to predict the outcome of the allocation process. This frequent change of finance minister has
also been illustrated with some selective cases in figures 1 to 3. For all the reasons just mentioned, we are
confident in the causal interpretation of the empirical results found, which we present in the next section.
5. Results
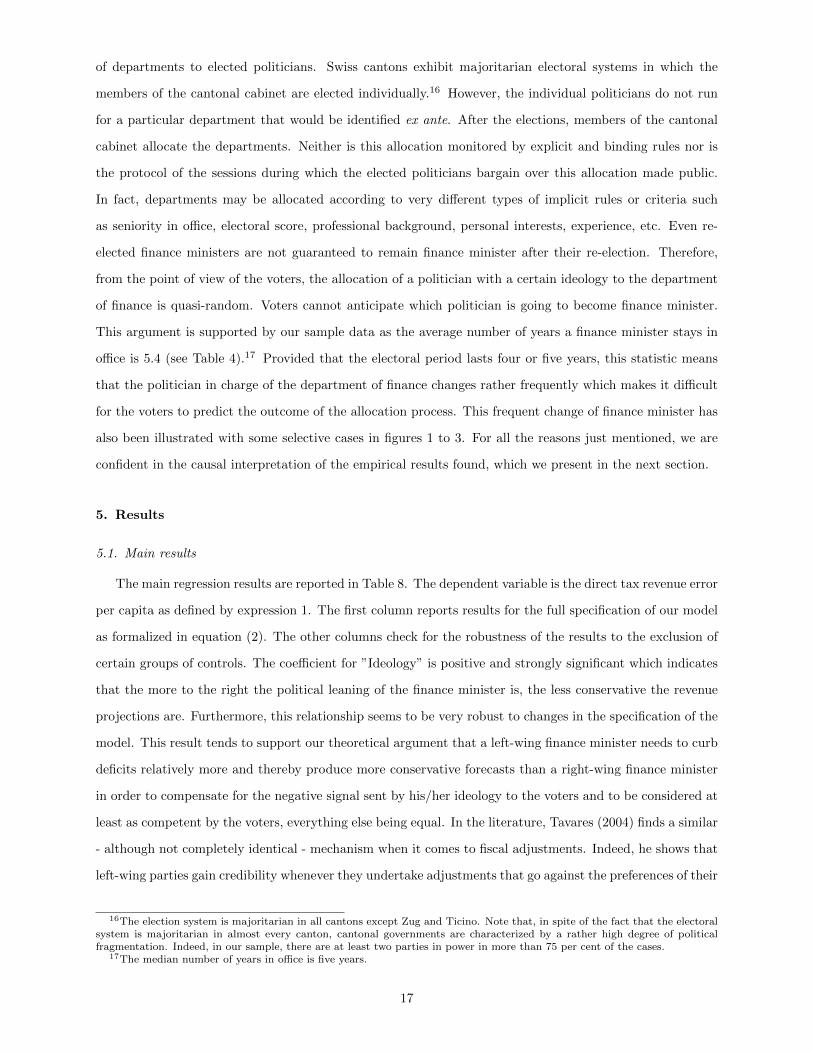
5.1. Main results
The main regression results are reported in Table 8. The dependent variable is the direct tax revenue error
per capita as defined by expression 1. The first column reports results for the full specification of our model
as formalized in equation (2). The other columns check for the robustness of the results to the exclusion of
certain groups of controls. The coefficient for ”Ideology” is positive and strongly significant which indicates
that the more to the right the political leaning of the finance minister is, the less conservative the revenue
projections are. Furthermore, this relationship seems to be very robust to changes in the specification of the
model. This result tends to support our theoretical argument that a left-wing finance minister needs to curb
deficits relatively more and thereby produce more conservative forecasts than a right-wing finance minister
in order to compensate for the negative signal sent by his/her ideology to the voters and to be considered at
least as competent by the voters, everything else being equal. In the literature, Tavares (2004) finds a similar
- although not completely identical - mechanism when it comes to fiscal adjustments. Indeed, he shows that
left-wing parties gain credibility whenever they undertake adjustments that go against the preferences of their
16The election system is majoritarian in all cantons except Zug and Ticino. Note that, in spite of the fact that the electoralsystem is majoritarian in almost every canton, cantonal governments are characterized by a rather high degree of politicalfragmentation. Indeed, in our sample, there are at least two parties in power in more than 75 per cent of the cases.
17The median number of years in office is five years.
17

Table 8: Main Regression Results
(1) (2) (3) (4) (5)
Ideology 72.24∗∗∗ 69.57∗∗∗ 38.46∗∗∗ 63.38∗∗∗ 69.09∗∗∗
(7.297) (6.989) (8.031) (8.000) (6.257)
Rule 61.22 54.77 25.23∗ 67.64∗∗ 79.08∗
(44.45) (40.51) (14.35) (31.89) (41.97)
Ideology x Rule -10.84∗ -9.601 -0.742 -11.42∗∗∗ -13.46∗∗
(6.480) (6.228) (3.426) (4.013) (5.513)
Pre-election year -31.02∗∗ -29.41∗∗∗ -34.56∗∗ -30.40∗∗∗
(13.18) (9.904) (14.25) (11.78)
Election year -4.843 -6.142 -5.849 -3.602
(13.16) (13.83) (15.58) (13.05)
Post-election year -17.66∗ -15.26∗ -21.73∗∗ -15.76∗
(9.102) (8.361) (10.82) (8.840)
Minister controls Yes Yes Yes Yes No
Canton controls Yes Yes Yes No Yes
Canton FE Yes Yes No Yes Yes
Time FE Yes No Yes Yes Yes
R-squared 0.3314 0.2521 0.2534 0.3162 0.3179
F-test (p-value) 0.0000 0.0000 0.0000 0.0000 0.0000
Observations 653 653 653 709 669
Standard errors in parentheses∗ p < .10, ∗∗ p < .05, ∗∗∗ p < .01
Standard errors clustered at the finance minister and year levels.
constituencies, i.e. whenever they reduce expenditures. By finding an effect of the ideology of the finance
minister on TRPE and by proposing an innovative identification strategy, our empirical analysis contributes
to the literature on revenue projections. (Feenberg et al., 1989; Bretschneider et al., 1989; Bretschneider
and Gorr, 1992; Mocan and Azad, 1995; Jones et al., 1997; Cassidy et al., 1989; Deschamps, 2004; Voorhees,
2004; Campbell and Ghysels, 1997; Couture and Imbeau, 2009; Ohlsson and Vredin, 1996; Paleologou, 2005;
Goeminne et al., 2008; Bischoff and Gohout, 2010; Beetsma et al., 2013). While many of these studies look
at the ideology of the government as a whole, none have looked at the role of the finance minister. Our
results also extend the literature on the effect of the personal characteristics of individual politicians on fiscal
outcomes.18 More precisely, this paper is the first to identify a causal relationship between the ideology of
the finance minister and a fiscal outcome variable. Jochimsen and Thomasius (2014) look at how personal
characteristics of the finance ministers in German states between 1960 and 2009 influence budget deficits.
They use a dummy variable taking value one when the finance minister is left-wing. They do not find any
significant effect. Similarly, Moessinger (2014) does not find any significant impact of the left-wing ideology
of the finance minister on the increase in debt-to-GDP in European countries.
The parameter associated with the interaction term between fiscal rules and the finance minister’s ideology
18For a review of the literature, see Hayo and Neumeier (2014).
18

turns out to be significant and negative. This result is not robust only in the cases where canton or time
fixed effects are dropped (column (2) and (3)). However, joint tests of significance show that canton and time
fixed effects should be included in the model.19 This negative sign means that the more stringent fiscal rules
are, the smaller the positive effect of the ideology of the finance minister on tax revenue projection errors
is. Note that the direct effect of fiscal rules (row ”Rule” in Table 8) on projection errors is not significant.
This suggests that, if fiscal rules have an effect on TRPE, this effect is channelled through the behaviour of
the finance minister.0
2040
6080
Effe
cts
on L
inea
r Pre
dict
ion
0 1 2 3Rule
Average Marginal Effect of Ideology
Figure 4: Average Marginal Effect of Ideology on Revenue Projections
To illustrate more precisely how the stringency of fiscal rules alters the effect of ideology on tax revenue
projection errors, we have computed and plotted the marginal effect of the finance minister’s ideology as
formulated in expression (3). As shown in Figure (4), the marginal effect of Ideology unambiguously decreases
when fiscal rules become more stringent. The marginal effect turns out to be significant at any value of the
fiscal rule indicator.20 This result is in line with our theoretical argument, thereby suggesting that fiscal rules
tend to render the signal sent by a reduction in deficits less informative to the voters and create incentives
for the finance minister to engage in other types of signalling activities. This reduces the necessity for the
finance minister to underestimate tax revenue. This incentive is stronger for left-wing finance ministers since
they have to compensate for the negative signal sent by their ideology to the voters. Our results show, for
the first time, that fiscal rules tend to reduce political manipulations of revenue projections. This is in line
with Luechinger and Schaltegger (2013) who argue, without showing it explicitly, that fiscal rules, by curbing
19The value of the Chi2 of the test for joint significance(with 25 degrees of freedom) of the canton and time fixed effects is30813.31 and 3945.12 respectively.
20The marginal effect and its significance at every level of stringency of fiscal rules is reported in Table .10 of the Appendix.
19

the spending ministers financial appetite, reduce the necessity for the finance minister to be conservative in
revenue projections. Therefore, by identifying a channel through which balanced budget rules affect TRPE,
this paper extends the literature on the effect of budgetary institutions on fiscal outcomes.
5.2. Robustness checks
In order to assess the robustness of our results and also to better understand what drives them, we
performed different robustness checks. Table 8 already provides information about the robustness of our
results to the exclusion of certain controls and fixed effects which we already discussed. A natural bat-
tery of robustness checks to perform pertains to the exclusion of individual cantons and finance ministers.
Qualitatively our results are very robust since the sign of the parameter associated with the ideology of
the finance minister and the sign of the parameter of the interaction term never change. The parameter
for ideology is always very significant and is insensitive to the exclusion of individual finance ministers or
cantons. Although the parameter associated with the interaction term is always negative, its significance and
magnitude turn out to be sensitive to the exclusion of individual cantons or finance ministers. Interestingly,
the significance drops only when left-wing finance ministers - i.e. from the socialist or the green party - or
cantons in which left-wing finance ministers have exercised power are excluded from the sample. This shows
that the interaction effect is particularly driven by left-wing finance ministers and supports our theoretical
argument.21
Furthermore, we also used alternative estimators to estimate our model. More precisely we estimated
a dynamic version of the model that includes the lagged tax revenue projection error and the twice lagged
tax revenue projection error. We estimated this dynamic version of the model alternatively with the system
GMM estimator (Arellano and Bover, 1995; Blundell and Bond, 1998) and with the GLS estimator with
panel corrected standard errors suggested by Beck and Katz (1995). Results are reported in Table .11 in the
appendix and show that our results are robust to this alternative specification and estimation strategy.
Finally, one may argue that the direction and the size of the effect of the ideology of the finance minister
does not depend on the finance minister’s absolute position on the left-right scale but rather on his/her
position relative to the spending ministers. To check for the robustness of our results to this hypothesis we
included the difference between the ideology of the finance minister and the average ideology of the spending
ministers in the model and estimated it. The results are reported in Table .12 and show that the ideological
gap between the finance minister and the spending ministers is very significant. Nonetheless our results
remain unaltered by the inclusion of the ideological gap between the finance minister and the spending
ministers.
21Due to the high number of regressions (125) these robustness checks represent, the results are not reported in the currentpaper. However, they are available upon request.
20
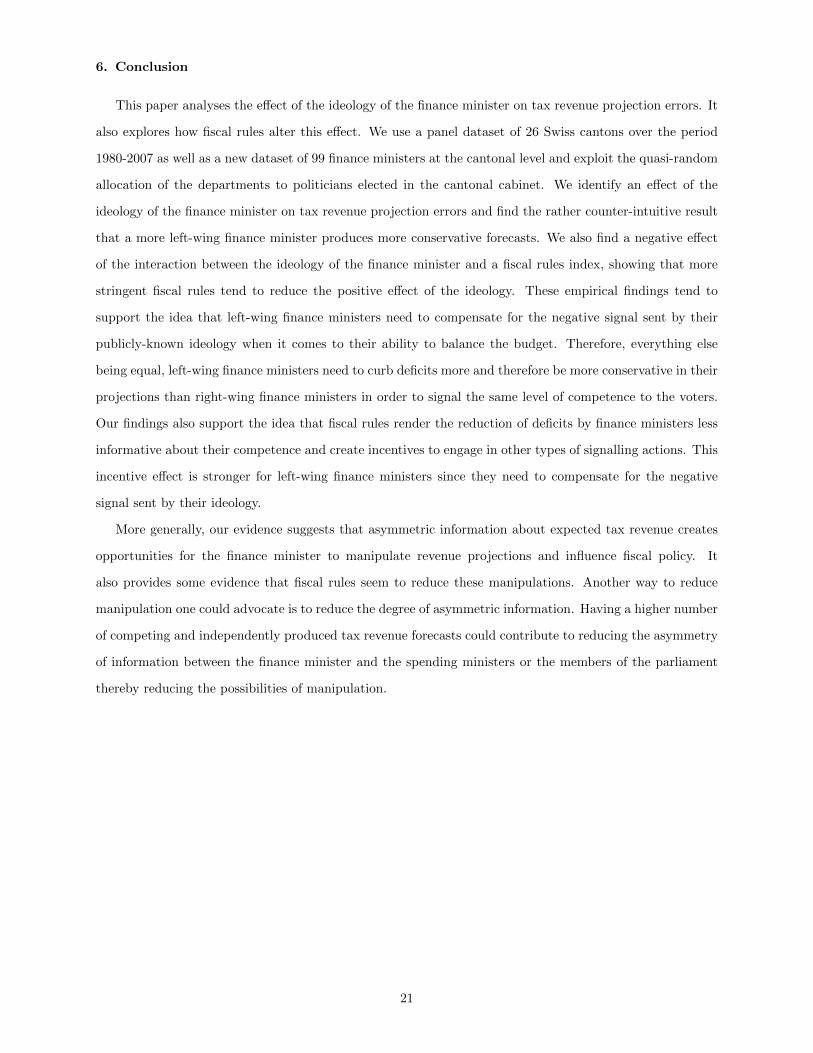
6. Conclusion
This paper analyses the effect of the ideology of the finance minister on tax revenue projection errors. It
also explores how fiscal rules alter this effect. We use a panel dataset of 26 Swiss cantons over the period
1980-2007 as well as a new dataset of 99 finance ministers at the cantonal level and exploit the quasi-random
allocation of the departments to politicians elected in the cantonal cabinet. We identify an effect of the
ideology of the finance minister on tax revenue projection errors and find the rather counter-intuitive result
that a more left-wing finance minister produces more conservative forecasts. We also find a negative effect
of the interaction between the ideology of the finance minister and a fiscal rules index, showing that more
stringent fiscal rules tend to reduce the positive effect of the ideology. These empirical findings tend to
support the idea that left-wing finance ministers need to compensate for the negative signal sent by their
publicly-known ideology when it comes to their ability to balance the budget. Therefore, everything else
being equal, left-wing finance ministers need to curb deficits more and therefore be more conservative in their
projections than right-wing finance ministers in order to signal the same level of competence to the voters.
Our findings also support the idea that fiscal rules render the reduction of deficits by finance ministers less
informative about their competence and create incentives to engage in other types of signalling actions. This
incentive effect is stronger for left-wing finance ministers since they need to compensate for the negative
signal sent by their ideology.
More generally, our evidence suggests that asymmetric information about expected tax revenue creates
opportunities for the finance minister to manipulate revenue projections and influence fiscal policy. It
also provides some evidence that fiscal rules seem to reduce these manipulations. Another way to reduce
manipulation one could advocate is to reduce the degree of asymmetric information. Having a higher number
of competing and independently produced tax revenue forecasts could contribute to reducing the asymmetry
of information between the finance minister and the spending ministers or the members of the parliament
thereby reducing the possibilities of manipulation.
21

References
Arellano, M. and O. Bover (1995). Another look at the instrumental variable estimation of errorcomponents
models. Journal of Econometrics 68, 29–51.
Baskaran, T. (2013). Coalition governments, cabinet size, and the common pool problem: Evidence from
the german states. European Journal of Political Economy 32 (0), 356 – 376.
Beck, N. and J. N. Katz (1995). What to do (and not to do) with time series-cross section data in comparative
politics. American Political Science Review 89, 634–647.
Beetsma, R., M. Giuliodori, M. Walschot, and P. Wierts (2013). Fifty years of fiscal planning and imple-
mentation in the netherlands. European Journal of Political Economy 31 (0), 119 – 138.
Bischoff, I. and W. Gohout (2010). The political economy of tax projections. International Tax and Public
Finance 17 (2), 133–150.
Blume, L. and S. Voigt (2013). The economic effects of constitutional budget institutions. European Journal
of Political Economy 29 (0), 236 – 251.
Blundell, R. and S. Bond (1998). Initial conditions and moment restrictions in dynamic panel data models.
Journal of Econometrics 87, 115–143.
Bohn, H. and R. P. Inman (1996). Balanced-budget rules and public deficits: evidence from the u.s. states.
Carnegie-Rochester Conference Series on Public Policy 45 (1), 13–76.
Borge, L.-E. (2005). Strong politicians, small deficits: evidence from norwegian local governments. European
Journal of Political Economy 21 (2), 325 – 344.
Brender, A. and A. Drazen (2008). How do budget deficits and economic growth affect reelection prospects?
evidence from a large panel of countries. American Economic Review 98 (5), 2203–2220.
Bretschneider, S. and W. Gorr (1992). Economic, organizational, and political influences on biases in
forecasting state sales tax receipts. International Journal of Forecasting 7 (4), 457–466.
Bretschneider, S. I., W. L. Gorr, G. Grizzle, and E. Klay (1989). Political and organizational influences on
the accuracy of forecasting state government revenues. International Journal of Forecasting 5 (4), 307–319.
Cameron, A. C., J. B. Gelbach, and D. L. Miller (2011). Robust inference with multiway clustering. Journal
of Business & Economic Statistics 29 (2), 238–249.
Campbell, B. and E. Ghysels (1997, August). An empirical analysis of the canadian budget process. Canadian
Journal of Economics 30 (3), 553–576.
Canova, F. and E. Pappa (2006). The elusive costs and the immaterial gains of fiscal constraints. Journal
of Public Economics 90 (89), 1391 – 1414.
Cassidy, G., M. Kamlet, and D. Nagin (1989). An empirical examination of bias in revenue forecasts by
state governments. International Journal of Forecasting 5 (3), 321–331.
Chatagny, F. and N. Soguel (2012). The effect of tax revenue budgeting errors on fiscal balance: evidence
from the swiss cantons. International Tax and Public Finance 19, 319–337. 10.1007/s10797-011-9189-5.
22

Couture, J. and L. M. Imbeau (2009). Do governments manipulate their revenue forecasts? budget speech
and budget outcomes in the canadian provinces. In Do They Walk Like They Talk? Speech and Action in
Policy Processes, Studies in Public Choice, Chapter 9, pp. 155–166. Springer.
de Haan, J., J.-E. Sturm, and G. Beekhuis (1999). The weak government thesis: Some new evidence. Public
Choice 101 (3-4), 163–176.
Debrun, X., L. Moulin, A. Turrini, J. Ayuso-i Casals, and M. S. Kumar (2008). Tied to the mast? national
fiscal rules in the european union. Economic Policy 23 (54), 297–362.
Deschamps, E. (2004). The impact of institutional change on forecast accuracy: A case study of budget
forecasting in washington state. International Journal of Forecasting 20, 647–657.
Feenberg, D. R., W. Gentry, D. Gilroy, and H. S. Rosen (1989). Testing the rationality of state revenue
forecasts. The Review of Economics and Statistics 71 (2), 300–308.
Feld, L. P., F. Heinemann, A. Kalb, M.-D. Moessinger, and S. Osterloh (2011). Sovereign bond market
reactions to fiscal rules and no-bailout clauses - the swiss experience. Mimeo, University of Freiburg.
Feld, L. P. and G. Kirchgaessner (2008). On the effectiveness of debt brakes: The swiss experience. In
R. Neck and J.-E. Sturm (Eds.), Sustainability of Public Debt, Chapter 9, pp. 223–255. Cambridge: MIT
Press.
Goeminne, S., B. Geys, and C. Smolders (2008). Political fragmentation and projected tax revenues: evidence
from flemish municipalities. International Tax and Public Finance 15, 297–315.
Hallerberg, M., R. Strauch, and J. von Hagen (2007). The design of fiscal rules and forms of governance in
european union countries. European Journal of Political Economy 23, 338–359.
Hayo, B. and F. Neumeier (2014). Political leaders’ socioeconomic background and fiscal performance in
germany. European Journal of Political Economy 34 (0), 184 – 205.
Hibbs, Douglas A., J. (1977). Political parties and macroeconomic policy. The American Political Science
Review 71 (4), pp. 1467–1487.
Jochimsen, B. and S. Thomasius (2014). The perfect finance minister: Whom to appoint as finance minister
to balance the budget. European Journal of Political Economy 34 (0), 390 – 408.
Jones, V. D., S. Bretschneider, and W. L. Gorr (1997). Organizational pressures on forecast evaluation:
Managerial, political, and procedural influences. Journal of Forecasting 16 (4), 241–254.
Ladner, A. (2006). Das schweizer parteiensystem in bewegung. In O. Niedermayer, R. Stss, and M. Haas
(Eds.), Die Parteiensysteme Westeuropas. Wiesbaden: VS Verlag fr Sozialwissenschaften.
Luechinger, S. and C. Schaltegger (2013). Fiscal rules, budget deficits and budget projections. International
Tax and Public Finance 20 (5), 785–807.
Milesi-Ferretti, G. M. (2003). Good, bad or ugly? on the effects of fiscal rules with creative accounting.
Journal of Public Economics 88 (1-2), 377–394.
Mocan, N. H. and S. Azad (1995). Accuracy and rationality of state general fund revenue forecasts: Evidence
from panel data. International Journal of Forecasting 11 (3), 417 – 427.
23

Moessinger, M.-D. (2014). Do the personal characteristics of finance ministers affect changes in public debt?
Public Choice, 1–25.
Ohlsson, H. and A. Vredin (1996). Political cycles and cyclical policies. Scandinavian Journal of Eco-
nomics 98 (2), 203–218.
Paleologou, S.-M. (2005). Political manoeuvrings as sources of measurement errors in forecasts. Journal of
Forecasting 24, 311–324.
Perotti, R. and Y. Kontopoulos (2002). Fragmented fiscal policy. Journal of Public Economics 86 (2), 191
– 222.
Persson, T. and G. Tabellini (2000). Political Economics: Explaining Economic Policy. MIT Press.
Pina, I. M. and N. M. Venes (2011). The political economy of edp fiscal forecasts: An empirical assessment.
European Journal of Political Economy 27, 534–546.
Poterba, J. M. (1994). State responses to fiscal crises: The effects of budgetary institutions and politics.
Journal of Political Economy 102 (4), 799–821.
Rogoff, K. (1990, March). Equilibrium political budget cycles. The American Economic Review 80 (1),
21–36.
Rogoff, K. and A. Sibert (1988, January). Elections and macroeconomic policy cycles. The Review of
Economic Studies 55 (1), 1–16.
Schaltegger, C. A. and L. P. Feld (2009). Do large cabinets favor large governments? evidence on the fiscal
commons problem for swiss cantons. Journal of Public Economics 93 (12), 35 – 47.
Swank, O. H. (2002, April). Budgetary devices for curbing spending prone ministers and bureaucrats. Public
Choice 111 (3), 237–257.
Tavares, J. (2004). Does right or left matter? cabinets, credibility and fiscal adjustments. Journal of Public
Economics 88 (12), 2447–2468.
van der Ploeg, F. (2010). Political economy of prudent budgetary policy. International Tax and Public
Finance 17, 295–314. 10.1007/s10797-009-9117-0.
Velasco, A. (2000). Debts and deficits with fragmented fiscal policymaking. Journal of Public Eco-
nomics 76 (1), 105 – 125.
Vlaicu, R., M. Verhoeven, F. Grigoli, and Z. Mills (2014). Multiyear budgets and fiscal performance: Panel
data evidence. Journal of Public Economics 111 (0), 79 – 95.
von Hagen, J. (2010). Sticking to fiscal plans: the role of institutions. Public Choice 144, 487–503.
Voorhees, W. R. (2004). More is better : Consensual forecasting and state revenue forecast error. Interna-
tional Journal of Public Administration 27 (8/9), 651–671.
Weingast, B. R., K. A. Shepsle, and C. Johnsen (1981, August). The political economy of benefits and costs:
A neoclassical approach to distributive politics. Journal of Political Economy 89 (4), 642–664.
24

Appendix
Stringency of Fiscal Rules in Swiss Cantons (1980-2007)
01
23
01
23
01
23
1980 1990 2000 20101980 1990 2000 20101980 1990 2000 2010
1 2 3
4 5 6
7 8 9
Fis
cal R
ule
Inde
x
Year
Graphs by Code
25
01
23
01
23
01
23
1980 1990 2000 20101980 1990 2000 20101980 1990 2000 2010
10 11 12
13 14 15
16 17 18
Fis
cal R
ule
Inde
x
Year
Graphs by Code
26

0.5
11.
52
0.5
11.
52
0.5
11.
52
1980 1990 2000 2010
1980 1990 2000 20101980 1990 2000 2010
19 20 21
22 23 24
25 26
Fis
cal R
ule
Inde
x
Year
Graphs by Code
27
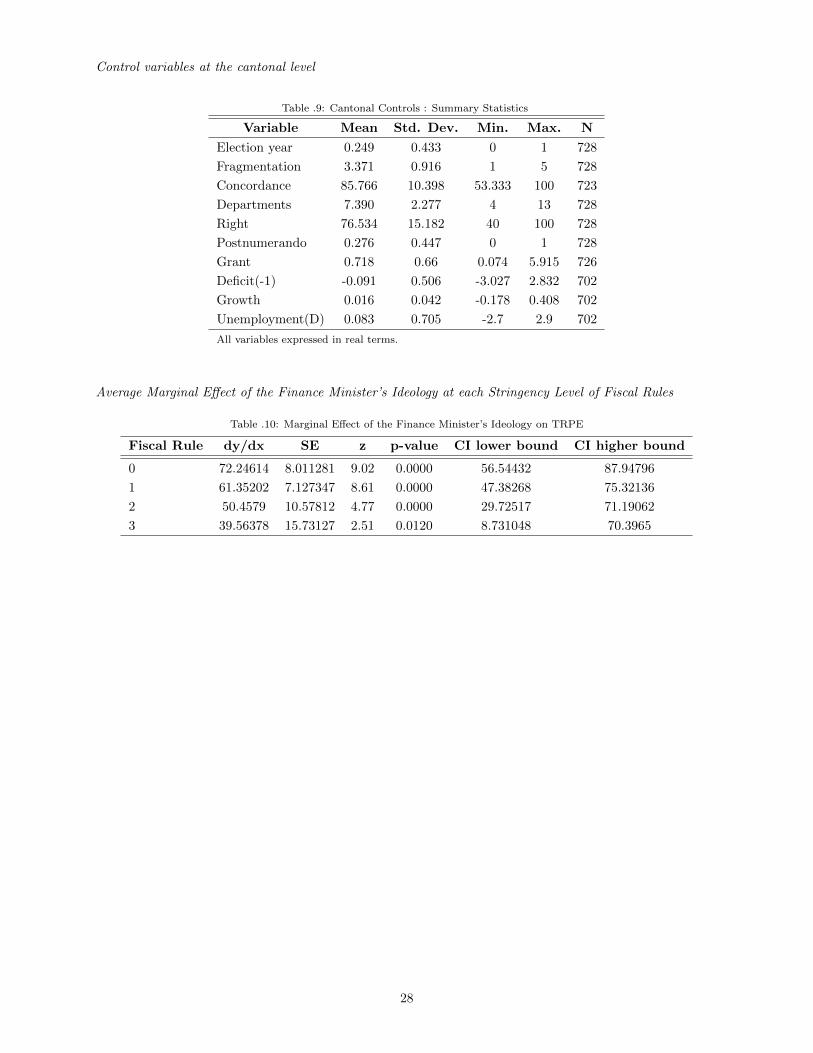
Control variables at the cantonal level
Table .9: Cantonal Controls : Summary Statistics
Variable Mean Std. Dev. Min. Max. N
Election year 0.249 0.433 0 1 728
Fragmentation 3.371 0.916 1 5 728
Concordance 85.766 10.398 53.333 100 723
Departments 7.390 2.277 4 13 728
Right 76.534 15.182 40 100 728
Postnumerando 0.276 0.447 0 1 728
Grant 0.718 0.66 0.074 5.915 726
Deficit(-1) -0.091 0.506 -3.027 2.832 702
Growth 0.016 0.042 -0.178 0.408 702
Unemployment(D) 0.083 0.705 -2.7 2.9 702
All variables expressed in real terms.
Average Marginal Effect of the Finance Minister’s Ideology at each Stringency Level of Fiscal Rules
Table .10: Marginal Effect of the Finance Minister’s Ideology on TRPE
Fiscal Rule dy/dx SE z p-value CI lower bound CI higher bound
0 72.24614 8.011281 9.02 0.0000 56.54432 87.94796
1 61.35202 7.127347 8.61 0.0000 47.38268 75.32136
2 50.4579 10.57812 4.77 0.0000 29.72517 71.19062
3 39.56378 15.73127 2.51 0.0120 8.731048 70.3965
28
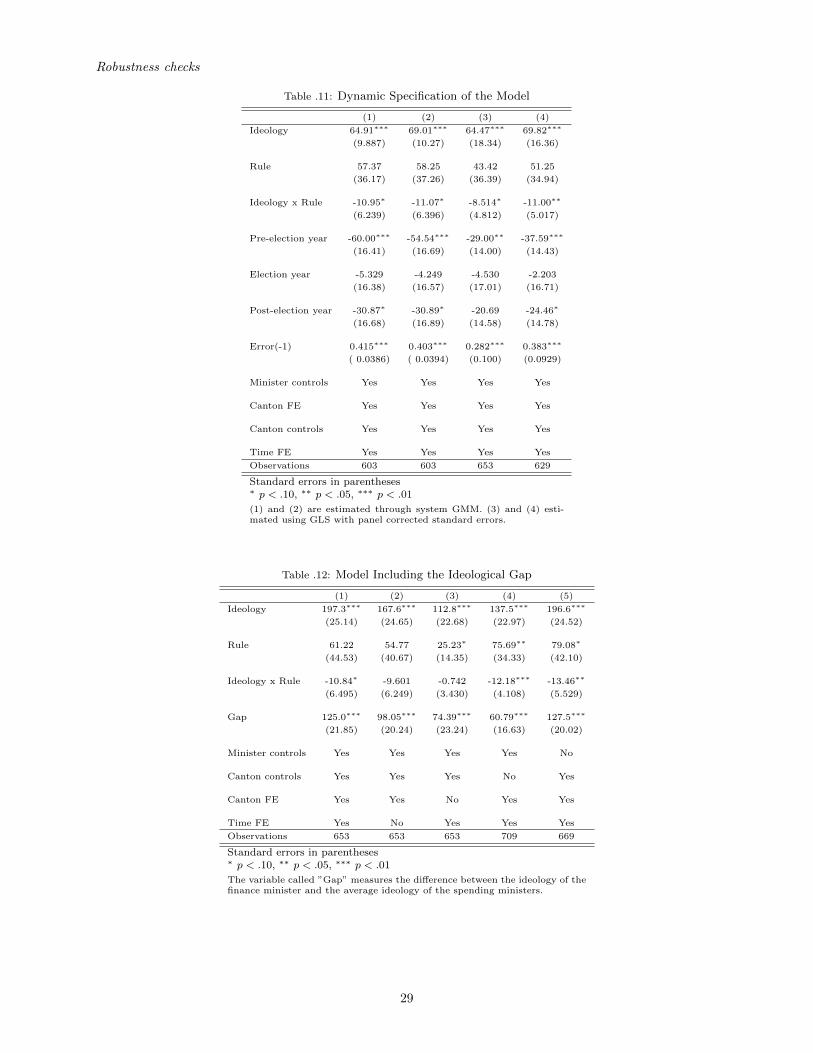
Robustness checks
Table .11: Dynamic Specification of the Model
(1) (2) (3) (4)
Ideology 64.91∗∗∗ 69.01∗∗∗ 64.47∗∗∗ 69.82∗∗∗
(9.887) (10.27) (18.34) (16.36)
Rule 57.37 58.25 43.42 51.25
(36.17) (37.26) (36.39) (34.94)
Ideology x Rule -10.95∗ -11.07∗ -8.514∗ -11.00∗∗
(6.239) (6.396) (4.812) (5.017)
Pre-election year -60.00∗∗∗ -54.54∗∗∗ -29.00∗∗ -37.59∗∗∗
(16.41) (16.69) (14.00) (14.43)
Election year -5.329 -4.249 -4.530 -2.203
(16.38) (16.57) (17.01) (16.71)
Post-election year -30.87∗ -30.89∗ -20.69 -24.46∗
(16.68) (16.89) (14.58) (14.78)
Error(-1) 0.415∗∗∗ 0.403∗∗∗ 0.282∗∗∗ 0.383∗∗∗
( 0.0386) ( 0.0394) (0.100) (0.0929)
Minister controls Yes Yes Yes Yes
Canton FE Yes Yes Yes Yes
Canton controls Yes Yes Yes Yes
Time FE Yes Yes Yes Yes
Observations 603 603 653 629
Standard errors in parentheses∗ p < .10, ∗∗ p < .05, ∗∗∗ p < .01
(1) and (2) are estimated through system GMM. (3) and (4) esti-mated using GLS with panel corrected standard errors.
Table .12: Model Including the Ideological Gap
(1) (2) (3) (4) (5)
Ideology 197.3∗∗∗ 167.6∗∗∗ 112.8∗∗∗ 137.5∗∗∗ 196.6∗∗∗
(25.14) (24.65) (22.68) (22.97) (24.52)
Rule 61.22 54.77 25.23∗ 75.69∗∗ 79.08∗
(44.53) (40.67) (14.35) (34.33) (42.10)
Ideology x Rule -10.84∗ -9.601 -0.742 -12.18∗∗∗ -13.46∗∗
(6.495) (6.249) (3.430) (4.108) (5.529)
Gap 125.0∗∗∗ 98.05∗∗∗ 74.39∗∗∗ 60.79∗∗∗ 127.5∗∗∗
(21.85) (20.24) (23.24) (16.63) (20.02)
Minister controls Yes Yes Yes Yes No
Canton controls Yes Yes Yes No Yes
Canton FE Yes Yes No Yes Yes
Time FE Yes No Yes Yes Yes
Observations 653 653 653 709 669
Standard errors in parentheses∗ p < .10, ∗∗ p < .05, ∗∗∗ p < .01
The variable called ”Gap” measures the difference between the ideology of thefinance minister and the average ideology of the spending ministers.
29