frbny blackbook research and statistics group · frbny blackbook research and statistics group ......
TRANSCRIPT

CONFIDENTIAL(FR) Class II FOMC
FRBNY Blackbook
RESEARCH AND STATISTICS GROUP
FOMC Background Material
September 2005
FRBNY - cleared for release


FRBNY: Blackbook, September 19, 2005 Confidential(FR) Class II FOMC 5
low; however, the 12-month change in this index was a rather high 2½%. The core PCE
index rose slightly in July. The 12-month gain in this index stayed at 1.8%, but 3- and 6-
month growth rates fell to 1½% or less after being well above 2% earlier in the year
(“market-based” core PCE behaved similarly). Finally, even with the run-up in energy
and other commodity prices, our underlying inflation gauge changed little on net during
the period, indicating little change in the assessment of inflationary pressures from the
data [see Exhibit A-7].
Of course, the rise in energy prices since July boosted the headline price numbers.
However, the actual outcomes have not been that poor: the 3-month change of the
finished goods PPI through August was 6.7% (annual rate), well under last November’s
recent peak of 10.1%; and that for the CPI was 4.2%. In general, prices outside of energy
have decelerated recently, apparently only partly due to special factors such as auto
“employee pricing” discounts.
Real activity. Revisions to Q2 GDP were minor: the overall growth rate was 3.3%
(annual rate), compared to the initial 3.4% estimate. Prior to Hurricane Katrina the
notable developments were, first, continued strength in household spending: motor
vehicle sales averaged about 18¾ million (annual rate) in July and August, non-auto,
non-gas retail sales rose 0.5% in August, and July starts and sales of single-family homes
set or remained near record highs.
In contrast, business spending was lackluster: July orders and shipments of nondefense
capital goods less aircraft were both lower than they were in June, maintaining a basically
flat path from the first half of the year. Private nonresidential construction spending in
July also was little changed. Finally, the anticipated turnaround in inventories has not yet
emerged. Manufacturers inventories rose in July, but inventories declined at the
wholesale and retail levels (the latter heavily influenced by the surge in car sales). Partly
as a result of the fairly tepid inventory reversal, manufacturing output rose only
moderately in August. Though the disruption caused by Katrina depressed production
some, taking a longer perspective recent factory production has been trending up about
FRBNY - cleared for release

FRBNY: Blackbook, September 19, 2005 Confidential(FR) Class II FOMC 6
3½% (annual rate), a fairly sluggish recovery after the declines in the spring. In contrast,
our Tech Pulse index continues to show robust growth similar to that of the past year.
Labor market. The pre-Katrina labor market continued to show sustained improvement.
Nonfarm payroll employment rose 169,000 in August, with upward revisions to June and
July. The household survey continued to show even stronger growth, with overall
employment rising robustly and the unemployment rate slipping a notch to 4.9%. The
labor force participation rate rose to 66.2%, its highest since late 2003 and 0.4 percentage
point above its Q1 low. In some of the early data affected by Katrina, new claims for
unemployment insurance shot up 71,000 in the second week of September: the Labor
Department estimated 68,000 new claims were related to the hurricane.
Despite the gains in employment and drop in the unemployment rate, hourly wage
increases were basically stable with the 12-month change remaining near 2¾%. In
contrast, recent data on labor costs from the productivity report have been less favorable
than anticipated. Growth in nonfarm business productivity in Q2 was marked down to a
1.8% annual rate. With an upward revision to compensation in Q2, unit labor costs now
show a 2.5% rate of growth in Q2, and their four-quarter growth rate was a high 4.2%.
The somewhat more elevated profile for labor costs creates the potential for some
combination of firmer trend inflation or lower profits.
Surveys. Survey evidence from business and consumers suggests some impact, possibly
sharp, from Katrina. Manufacturing surveys generally, but not universally, stayed at a
level suggesting continued expansion. The ISM index slipped in August, reversing July’s
increase, but remained at a level consistent with some growth. Our September Empire
State index, which in principle reflects conditions after Katrina’s arrival, fell, but its level
was consistent with further growth. The prices paid index rose sharply and there was
some retreat in six-month expectations. In contrast, the Philadelphia Fed index (compiled
over a similar period as the Empire State), fell to a level that typically signals minimal
growth; the expectations index also fell sharply. The Chicago Purchasing Managers
index also skidded in August to a level indicating no growth. Outside of manufacturing,
FRBNY - cleared for release
FRBNY: Blackbook, September 19, 2005 Confidential(FR) Class II FOMC 7
the ISM service index rose in August to its highest value in almost one year. The
University of Michigan’s Index of Consumer Sentiment fell sharply in August and in
early September, reflecting a combination of higher energy prices and the impact of
Katrina. If the early September reading holds, the monthly decline would match the
largest monthly drop ever seen in the index, and the two-month drop would be the largest
such decline. Consumer’s assessment of price increases over the next 12 months soared
1.5 percentage points to 4.6%; the long-term (five-year) expectations increased from
2.8% to 3.1%, the last time they were higher was January 1997.
Global
Foreign GDP is projected to increase 2.6 percent (Q4/Q4) in 2005, essentially matching
last year’s growth rate. Growth in the first half of 2005 turned out to be stronger than we
expected in August, largely because of revisions to Japanese GDP data for Q2. For the
second half of 2005, the outlook has Japanese economy slowing as a payback for the
unsustainable growth in 2005H1, while the euro area continues to grow at slightly below
its potential rate. China is expected to slow to closer to its potential rate, while Mexico
looks to rebound after its output fell in Q2.
Industrial Countries. Based on mixed recent data, we project growth in both the euro area
and Japan to be fairly modest in Q3. Euro area production in June was weak, but June
industrial orders, June exports, and July unemployment were all fairly encouraging. The
index of industrial confidence was unchanged in August after two months of
improvement. Data for Japanese production and shipments suggest payback for the rapid
GDP growth in the first half of the year. Employment, though, remains on its recent
positive trend. Recent data show that the UK economy may be stabilizing after a year-
long slowdown.
Emerging Economies. The growth forecast for China remains at 8.9 percent (Q4/Q4) in
2005. Growth is expected to slow towards 8 percent (annual rate) in the second half of
2005 and in 2006, which is near the country’s potential pace. Recent monthly data
FRBNY - cleared for release

FRBNY: Blackbook, September 19, 2005 Confidential(FR) Class II FOMC 8
suggest that the risks to the forecast may be tilted to the upside. Industrial production,
imports, money, and loan growth have accelerated in recent months after a slowdown in
the first quarter. Recent monthly data show generally solid gains in exports and
production in Korea, while data for Taiwan suggest that the economy continues to lag.
Mexican GDP disappointed in Q2, shrinking 1.7 percent (annual rate) because of weak
domestic demand and a large drop in auto exports. Significant improvement is expected
during the second half of 2005, in part from a rebound in exports. Brazil’s growth was
stronger than expected in Q2, helped by a snapback in investment. The ongoing political
scandal does not appear to be adversely affecting confidence and growth.
Trade
The U.S. trade deficit narrowed to $57.9 billion in July from $59.6 billion in June due to
a fall in imports. The monthly deficit readings have been relatively stable since
November 2004. Over this period, import growth has been surprisingly soft given the
overall strength of the U.S. economy. In July, a decline in capital and consumer goods
imports accounted for the bulk of the fall-off in total imports. Oil imports were up
roughly $1 billion because of another rise in oil prices; oil import volume was flat.
Exports were unchanged in July but were still up at a healthy rate over year-ago levels.
Exports sales to Canada and Europe continued to be strong, while those to Asia outside of
China remained soft.
Going forward, the outlook is for a 0.2 percentage point drag on GDP in Q3 as non-oil
imports rebound in line with the underlying strength of the U.S. economy. This
represents only a modest payback, which we expect to continue into Q4, after net exports
contributed 1.2 percentage points to GDP growth in Q2.
FRBNY - cleared for release

FRBNY: Blackbook, September 19, 2005 Confidential(FR) Class II FOMC 9
Financial
Domestic markets
The market appeared to convince itself during the inter-meeting period that the FOMC
would tighten at a slower pace for the rest of 2005, and that it would stop raising rates at
a point 25 bp lower in 2006 than was previously expected. Calculations by the Cleveland
Fed indicate that following the August 5 FOMC meeting, the Fed funds futures market
was putting an 80 percent probability that the FOMC would raise rates to 4.00 percent by
the November meeting. Katrina sharply reduced that probability to around 25 percent.
Market expectations subsequently reversed themselves to put roughly equal odds on rates
rising to either 3.75 or 4.00 percent by the time of the November meeting.
A similar swing in sentiment characterized bond and stock markets. Prior to Katrina,
yields on the 10-year Treasury had fallen over 25 bp on weakening growth expectations
and benign inflation reports. They fell another 10 bp following Katrina, apparently on
expectations that higher oil prices would weigh more heavily on aggregate demand than
on supply. Since Katrina, however, long-term yields have regained about 20 bp to end at
4.30 on Sept 15, as worst-case scenarios have failed to materialize. The yield curve is
now lower across board – by 16, 27, 28, and 19 bp at the one, two, five, and 10-year
horizons. The S&P 500 had fallen about one percent before Katrina, but has since made
that up to end flat over the period.
The post-Katrina rebound in expectations about both near-term Fed policy and forward
nominal rates undoubtedly reflects the fact that Katrina’s worst-case scenarios have not
appeared to come to pass. It may also reflect in part the robust fiscal response that is
expected from the federal government. But trends over the last few weeks reflect the
“rebound” from Katrina and therefore should not be allowed to obscure the inter-meeting
shift in bond market sentiment that was emerging pre-Katrina. Namely, markets are now
expecting a substantially more benign interest rate environment over the near-term
horizon. Specifically, the “U-shaped” drop in yields across the curve reflects a 40 bp
drop in the (one-year) forward rate one year out and a 20 bp drop in the forward rate five
FRBNY - cleared for release

FRBNY: Blackbook, September 19, 2005 Confidential(FR) Class II FOMC 10
years out. Such a revision in expectations could reflect a more benign appraisal of recent
inflation due to previously unrecognized productivity gains, but given recent events, a
weaker aggregate demand environment seems the more likely interpretation of the
market’s view.
The drop in forward rates has been largely real rather than nominal. Yields on 5 and 10-
year TIPS, in particular, reveal stable or slightly higher expected inflation. This evidence
further supports the interpretation that markets have revised downward their expectations
of future aggregate demand conditions.
Market indicators of expected volatility and default risk were essentially unchanged over
the inter-meeting period.
Oil Markets
During the inter-meeting period global asset markets were scarred by the effects of
developments in energy markets, which exposed the global economy’s vulnerability to
shocks to both demand and supply of energy products. After trending up through most of
August, the WTI spot price peaked at $69.82/barrel on August 30, when Katrina
exacerbated pre-existing rigidities in both oil extraction and refinery capacity. On
impact, Katrina is estimated to have reduced global oil production by 1.5 mb/day, a gap
falling to 0.8 mb/d on September 15; the Department of Energy also estimated about 5
percent of U.S. refining capacity has been lost for an “extended” period of time. Oil
prices have since retreated, but the September 15 price of WTI, at $64.75/barrel, is still
8.5 percent above its average in the three months preceding Katrina.
Although much of the damage inflicted by Katrina to oil production is temporary, spare
production capacity remains limited. For 2005 as a whole, global oil production is
expected to grow at half the rate of the previous year, contributing to persistent tight
conditions in oil markets. Refinery capacity also is emerging as a key bottleneck for the
availability of final oil products. FRBNY assumptions, based on recent behavior of
FRBNY - cleared for release

FRBNY: Blackbook, September 19, 2005 Confidential(FR) Class II FOMC 11
futures prices, are that WTI prices will be $65.00 in Q4 2005 and $66.00 in Q4 2006. (At
the time of the last FOMC meeting, the prices assumed for Q4 2005 and 2006 were
$61.00 and $61.50, respectively.)
Global Equity and Bond Markets
During the last FOMC cycle, most sovereign yields moved to offset the rise experienced
during the previous cycle, bolstered by expectations of less aggressive U.S. monetary
tightening ahead. The yield on the 10-year German bund fell to new lows in the
aftermath of Hurricane Katrina, lifting the spread between long-dated U.S. and European
yields to multi-year highs. Japanese yields also declined sharply in the aftermath of
Hurricane Katrina, although they were supported by news about the country’s
strengthening recovery and by PM Koizumi’s convincing electoral victory. Yields on
emerging markets’ debt fell disproportionately, in accord with historical experience: the
spread of the EMBI+ index over U.S. treasuries narrowed by more than 20 basis points
by early September, pushing emerging debt prices to near record levels.
The decline in bond yields sustained equity markets. Euro area stocks were essentially
unchanged over the inter-meeting period, showing resilience to the impact of mixed
economic news and higher energy prices, and benefiting from strong corporate profits
and gains in U.S. and Japanese equities. European financial markets are drawing
uncertainty from the upcoming German elections (scheduled for September 18): the
expected win by Angela Merkel is supporting equity prices, but the possibility of a post-
election grand coalition, which may dilute some of the structural reforms advocated by
Merkel, is weighing against further gains. The Nikkei performed strongly, gaining 8
percent over the period, in part because of continued sizable foreign purchases of
Japanese equities. Investor appetite for other Emerging Market stocks remains strong,
with the MSCI local-currency Emerging Asia index rising over 1 percent, and shares of
Mexican companies likely to benefit from the reconstruction efforts in the Southern
United States gaining substantially.
FRBNY - cleared for release

FRBNY: Blackbook, September 19, 2005 Confidential(FR) Class II FOMC 12
Monetary Policy. Euro area interest rate developments mostly reflect waning optimism
about a brisk economic rebound in the euro area. Despite fear that higher oil prices might
eventually spur inflation, mixed data releases and the negative demand impact of higher
energy prices have pushed expectations of policy tightening in the euro area back towards
the second half of 2006. After cutting rates in August, the Bank of England stayed on
hold at its September meeting, and may not cut rates again before end-2005. The Bank of
Japan is keeping quantitative easing in place for the time being. Upbeat comments from
the Bank of Japan, and its September forecast that consumer price inflation may turn
positive around year-end, have strengthened markets’ beliefs that the Bank might shift
away from quantitative easing in 2006. The Bank of Canada raised its target overnight
rate to 2.75 percent in September, aiming for a stance more consistent with potential
inflationary pressures in the pipeline. Policy in Brazil and Mexico has emerged from a
tightening cycle and is currently on hold. Policy tightening may be needed in Argentina
to forestall double-digit inflation, but is unlikely before mid-term elections this fall.
Exchange Rates and Capital Flows. The dollar weakened slightly (about 1 percent
against major currencies) over the inter-meeting period, with expected future volatility
little changed since the last FOMC meeting. The dollar/euro rate traded aimlessly within
the $1.21 - $1.25 range. The euro was supported by weakening expectations of U.S.
policy tightening ahead, especially in the aftermath of Hurricane Katrina, but later
weakened, in response to mixed euro area data and uncertainty over political
developments in Germany. The yen traded near the 110 level for much of the inter-
meeting period, pressured down by the rise in oil prices, but appreciating in response to
political developments and favorable economic data. Emerging Asia’s currencies mostly
weakened, as concern grew that elevated oil prices might affect disproportionately the
region’s net fuel importers and expose their vulnerability to global growth. The Brazilian
real depreciated sharply in response to domestic political concerns but later recovered.
Markets are growing increasingly comfortable with China’s reform of its exchange rate
regime on July 21. The People’s Bank of China has made little use of the flexibility
offered by the new regime, and kept the yuan/dollar rate close to its post-reform level of
FRBNY - cleared for release

FRBNY: Blackbook, September 19, 2005 Confidential(FR) Class II FOMC 13
8.11. This stance has dampened expectations of further RMB appreciation, and kept the
prices of near-dated Chinese NDF contracts closer to those prevailing before July 21.
Foreign capital continues to flow smoothly to the United States. By year’s end, the
United States is expected to borrow in excess of $800 billion, half of which is expected to
be provided by Japan and the ten major developing Asian economies, and a third of
which should be provided by Russia and other oil-producing countries. Flows from
emerging Asia continue to take mostly an “official” form, with regional central banks
increasing foreign currency reserves by $160 billion in the first half of 2005. (China
alone increased its holdings by $110 billion.) Most of these purchases likely were of U.S.
official assets.
Second District
Our Indexes of Coincident Economic Indicators for July signal a slight downturn in
activity in New Jersey and New York City, and a modest deceleration in New York State
[Exhibit E-1]. Looking ahead to the next 9 months, our leading indexes predict that all
three economies will show little or no growth: New Jersey’s economy is projected to
expand slightly over 1%, but activity is expected to decline roughly 1% in New York
State and New York City [Exhibit E-2]. Inflation in metropolitan New York City
increased in August as the Consumer Price Index (CPI) rose 4.1% from a year earlier, led
by surging energy prices. The core CPI rose 3.2%—up from 2.6% in July and over a
point above the U.S. rate. Part of the recent re-acceleration reflects the end of a
temporary (two-month) reduction in cable TV charges. Over the past year, most
categories of goods and services have registered somewhat larger price rises locally than
nationally, particularly apparel prices, which were virtually unchanged nationally but
were up 8% in the New York City metro area. This was partly offset by medical costs,
which have risen less locally than nationally.
Labor Markets. In August, private-sector employment in the region grew at a moderate
0.8% annual rate, about the same as in July but well below the second-quarter pace. Job
growth was faster in New York and in New York City, but barely positive in New Jersey.
FRBNY - cleared for release

FRBNY: Blackbook, September 19, 2005 Confidential(FR) Class II FOMC 14
Year-over-year, private-sector employment was up 1.2% in the New York-New Jersey
region and 1.4% in New York City, somewhat less than the 1.9% national increase
[Exhibit E-3]. In August, New York State’s jobless rate fell 0.4 points to 4.7%, while
New York City’s tumbled 0.6 points to 5.1%, its lowest level in 17 years; however, New
Jersey’s rate edged up to 4.2% from 4.1% in July and 4.0% in June [Exhibit E-4].
Although district job growth has been running about ½ percentage point below the U.S.
rate, population and labor force growth also have been slower. Thus, regional
unemployment rates have been below the U.S. average for several months for the first
time since the late 1980s.
Real Estate. Construction activity across the district dipped in July, led by a substantial
pullback in the multi-family sector. Compared with a year earlier, single-family housing
permits were still slightly ahead, but multi-family permits, which had been robust in the
first half of the year, were down about 6%. Much of the recent drop reflects a pullback in
permits in New York City area—especially Long Island and northern New Jersey—
where apartment construction had been exceptionally strong. Home prices across most of
the region remain well ahead of a year ago, but the number of transactions has ebbed.
Office markets in metropolitan New York City continued to strengthen in August, though
there have been scattered signs of softening in industrial markets in both the Albany area
and parts of metropolitan New York City.
Surveys and Other Business Activity. Recent surveys of businesses and consumers
suggest some softening in the regional economy. Our September Empire State
Manufacturing Survey [one of the first post-Katrina indicators available] indicates that
activity continued to expand in recent weeks, though at a somewhat slower pace than in
July and August; shipments accelerated but both new and unfilled orders weakened
noticeably, and expectations weakened across the board. Survey results also indicated an
upturn in prices received and prices paid, and widespread expectations of further
increases. Just prior to Katrina, consumer confidence in the region fell sharply in August,
based on two separate surveys. The Conference Board’s index, covering New York, New
FRBNY - cleared for release


FRBNY: Blackbook, September 19, 2005 Confidential(FR) Class II FOMC 16
flexibility in labor and product markets along with maintained Federal Reserve
credibility, energy price increases need not systematically spread to other goods and
services (aside from energy-intensive items such as air fares). The upshot is that we think
that core PCE inflation will remain near its recent rate of around 2% through 2006. In
2007, we see the slightly softer path for the economy and continued monetary policy
action if necessary, moving core PCE inflation downward towards 1.75%.
Comparison with Greenbook Forecasts
GDP and Inflation Forecast. [See Exhibit A-2.] The forecast profiles for output across
the two models are similar in 2005 and 2006, but the Greenbook (GB) has a weaker
outlook for 2007. Given the GB estimate of potential of 3.1% and our estimate of 3.3%,
we are predicting the economy to grow roughly at potential for the next three years, while
the GB has it above potential in 2005 and 2006 and below in 2007. Our forecast for core
PCE inflation matches the GB in 2005, but is lower in 2006 and 2007—we have core
falling in 2007 from 2.0% to 1.8%, while the GB has it falling from 2.1% to 2.0%. At the
same time our forecast for overall PCE is lower than the GB in 2005, but higher in 2006
and 2007. The GB text describes the assumption regarding pass through from energy
prices as follows: 0.2% in 2006 and little effect in 2007. Thus the forecast of 2.0% for
core in 2007 in the GB is not a function of higher energy prices. An important
assumption for the difference between the GB and our path for inflation (both core and
overall) seems to be the amount of slack in the labor market and the (assumed) pressure
on output prices coming from rising compensation growth and unit labor costs. In
particular, the GB has the labor market operating closer to trend over this period. With
roughly similar aggregate demand conditions and productivity assumptions through 2006,
this leads to stronger growth in compensation per hour in the GB and higher unit labor
costs. This appears to be the mechanism by which the GB has higher core inflation
through 2006. In 2007, the GB has demand conditions deteriorate absolutely and relative
to our forecast, while growth in output per hour rises absolutely and relative to our
forecast. Along with the increase in productivity and the weakening of demand
conditions, however, there is a drop in the participation rate and a further acceleration in
compensation per hour. The GB assumption for unit labor costs is about half a percent
FRBNY - cleared for release

FRBNY: Blackbook, September 19, 2005 Confidential(FR) Class II FOMC 17
higher than ours in 2007, and compensation per hour is nearly a full percentage point
higher. The GB assumption for the unemployment rate remains fixed at 5.0% over all
three years, our forecast is 4.8% in 2006 and 2007, and 4.9% in 2005. The assumed path
for the FF rate is the same in both forecasts (4.25% in 2006 and 2007).
Alternative Board Scenarios. The GB considers four alternative scenarios for the
outlook: for each scenario, one simulation is done assuming no change in the policy path
and one assumes a policy response based on a standard Taylor rule formula. The
sentiment slump scenario generates a near-term softening in output and then little effect
thereafter. The two scenarios that alter the assumption about underlying inflation
expectations seem the most interesting. In the case in which inflation expectations are
high relative to the baseline, core inflation runs at about 2.7 in 06 and 2.4 in 07.
Alternatively, in the “low inflation” scenario, inflation runs above what might be
considered the implicit inflation target through the end of 06, and then reaches that 1.5
target in 07. Thus “low inflation” is the case that in which inflation doesn’t meet the
implicit inflation target until 07.
Scenario 1: Sentiment slump
Assumptions: The GB assumes that Michigan confidence falls about ten points in
September and stays low through November, at which time it bounces back. The
alternative assumes a larger drop (14 points on quarterly average) that lingers longer.
Because confidence does not influence consumption in FBR/US, a reduced form
specification is used to calculate the consumption response. This response is then added
exogenously to FRB/US to determine aggregate responses. In addition, some drop in
residential investment is implied by the fall in confidence as well.
Summary: This scenario produces a modest slowdown in output and increase in
unemployment relative to the baseline in the second half of 2005 and through 2006 (even
with the policy response). The scenario has little effect on core inflation, thus implying it
would still run above 2.0% in 2006 and only fall modestly below that in 2007.
FRBNY - cleared for release

FRBNY: Blackbook, September 19, 2005 Confidential(FR) Class II FOMC 18
Scenarios 2: Deteriorating inflation expectations
Assumptions: The current surge in energy prices and past elevated rates of headline
inflation cause expectations to rise 0.5 percentage points relative to the baseline
assumption (in which case they rise 0.5 percentage points though the end of the forecast
period). Thus agents in this economy are gradually raising their estimate of “trend”
inflation over this period.
Summary: This scenario has little effect on output and unemployment, but pushes core
inflation up to 2.7% in the first half of 2006, and to 2.5% in 2007. The monetary policy
response has very little impact on inflation, only shaving a little off in 2007 to leave it at
2.4% rather than 2.5%, but it pushes output below potential and unemployment above the
baseline.
Scenario 3: Buoyant households
Assumptions: Housing market continues to “sizzle” in the absence of any rise in
mortgage rates, and the broader pace of household spending is less restrained.
Specifically, the rate of increase of real estate values slow only to 10% by 2007, pushing
the level of home prices 16% above the baseline late that year. The personal saving rate
edges up to only 1% by 2007, which is 0.75% below the baseline.
Summary: This scenario generates growth well above the baseline and the Board’s
assumed rate of potential. The unemployment rate drops below the baseline. This
scenario generates no effect on inflation relative to the baseline, a result that makes it
difficult to find this a very convincing/useful scenario.
Scenarios 4: Low inflation
Assumptions: Here is it assumed that instead of the 0.5% deterioration in inflation
expectations assumed in the baseline, inflation expectations have been stable since 2003
and continue to be through the end of the forecast period.
FRBNY - cleared for release

FRBNY: Blackbook, September 19, 2005 Confidential(FR) Class II FOMC 19
Summary: This scenario generates output growth slightly above potential in early 2006,
but then below potential and below the baseline in 2007 either with or without a policy
response. Unemployment doesn’t change until 2007, when it is above the baseline in the
case of no policy response and below in the case in which policy responds. Inflation
grows less robustly than in the baseline or any of the other scenarios, but is only at 1.5%
in 2007.
Foreign Outlook. The major differences with the Board’s global outlook for the second
half of 2005 are largely offsetting. For Japan, both forecasts have a slowdown from the
4.5 percent (saar) growth rate achieved in 2005H1. Our slowdown is marginally steeper,
with growth expecting to average 0.75 percent (saar) in H2, while the Board expects
growth to average 1.35 percent. Our outlooks for China and Mexico are more optimistic.
The Board has China growing 8.1 percent (Q4/Q4) in 2005, while we have 8.9 percent
growth. A key difference is that the Board estimates a much lower seasonally adjusted
growth rate in Q2, which we do not see as justified given other output indicators. Both
forecasts expect Mexico to recover from a very weak performance in 2005H1. We
project growth significantly above potential in H2, bringing growth for the year back to
near potential. The Board has growth returning to near potential in H2, with the economy
not making up for lost output in H1.
U.S. Trade. The difference between our forecast and the Board’s is largely limited to
projections for Q3. We have net exports being a 0.2 percentage-point drag on GDP while
the Board has them as a 0.3 percentage-point contribution. The difference is in the size of
the rebound in imports following unusually weak data for Q2 as well as in the projected
growth in exports. The Board has real non-oil imports growing at a 1.0 percent rate in
Q3, while we have a 4.5 percent increase. Our forecast is based on the assumption of
relatively robust domestic demand in the quarter. In addition, the Board forecasts another
decline in the volume of oil imports while we have a small increase. For the year as a
whole, the Board has oil imports unchanged, while we have oil imports up 3 percent, in
line with recent trends and the strength of the economy. For real non-agricultural
exports, the Board forecasts a Q3 growth rate of 4.1 percent while we anticipate a growth
FRBNY - cleared for release

FRBNY: Blackbook, September 19, 2005 Confidential(FR) Class II FOMC 20
rate of 8.3 percent. One difference is that the Board makes a major adjustment to exports
because of the Boeing strike, while we did not. A second is that the Board assumes the
rapid Q2 growth in computer and semiconductor exports will fall off in Q3, while we
assume it will remain on trend.
Comparison with Other Forecasts
[see Exhibit A-5.] There is general agreement across the forecasts on output through the
end of 2005. One notable exception to this is the PSI model, which is the forecast
generated on the basis of lagged GDP growth and business sentiment indices. This
model is calling for considerably weaker growth in Q3 and Q4 of this year. Much of this
weakness seems to be driven by the Goldman Sachs Surprise Index, though we have not
investigated precisely what is causing the weakness in that index (the data used to
produce the index was updated to include the Michigan confidence release on 9/16, but
this release alone cannot explain the negative influence of the Surprise index on the PSI
forecast). The large discrepancy between the PSI forecast and the others suggests the
potential for downside risks to the forecasts made using more judgmental or structural
model based approaches.
The FRBNY forecast for overall PCE inflation is the lowest, though both the Blue Chip
and Macro Advisors forecasts were made in early September when the situation with
energy prices seemed worse than it currently appears. Our forecast of core PCE inflation
agrees with Macro Advisors.
Alternative Scenarios and Risks
Alternative 1: Global Deflation. The scenario is related to changes in the world
economy, particularly the growth of the Chinese economy and the stagnation of the
economies of Europe and Japan. The Chinese growth represents a shift in the aggregate
supply curve, leading to higher growth and lower inflation in the US; while the European
and Japanese stagnation represent a shift in the aggregate demand curve, leading to lower
inflation and lower growth in the US. The net effect of these shifts has been unambiguous
FRBNY - cleared for release

FRBNY: Blackbook, September 19, 2005 Confidential(FR) Class II FOMC 21
in terms of lowering inflation and lowering long-term yields. These developments have
been supportive of recent growth in the US but the downside risk in this scenario comes
from an abrupt slowdown in Chinese growth without a compensating increase in Europe
or Japan, thus generating a bad deflationary shock to the world economy.
Alternative 2: Productivity. In the post-war era, the United States has experienced three
productivity epochs (pre-1973, High I; 1973 to mid-1990s, Low I; and mid-1990s on,
High II). Our current central projection for productivity in the medium term assumes a
growth rate similar to the pre-1973 epoch. There are two alternatives to this projection.
2a. Continued Surge
The developments in the labor market and continued strength of labor productivity over
the longer term—despite the recent short-term moderation—suggest that firms have
become more efficient in using labor. As such, strong productivity growth could persist.
This would imply that the potential growth rate is higher than our current estimates. In
addition, strong productivity growth would limit labor cost pressures, and inflation thus
would remain subdued. Incoming data have given reduced support for this scenario: the
four-quarter average of productivity growth has fallen well below 3% and unit labor costs
have increased. Further, business investment continues to be weaker than expected.
2.b Slower Productivity Growth
Recent productivity revisions provide more evidence of a slowdown in productivity
growth. Our central projection continues to assume that this is only a temporary cyclical
moderation in productivity growth, but there is downside risk to this assessment. Further,
the persistent increase in the level and volatility of energy prices also could be associated
with a fall in labor productivity.
Alternative 3: Overheating. The extremely accommodative policy followed in the US
and other countries since the global slowdown of 2000-2003 may produce a persistent
move in inflation above implicit targets with an abrupt slowdown in real output growth
starting in late 2005/early 2006. There are two potential connected channels at work
here. The first is a continued underestimate of the equilibrium real rate (i.e., an
overestimate of slack in the economy) and the second is higher energy prices. Sustaining
FRBNY - cleared for release

FRBNY: Blackbook, September 19, 2005 Confidential(FR) Class II FOMC 22
the real policy rate below the equilibrium rate for a long time will tend to switch the
impact of monetary policy from increasing real output to raising inflation as inflation
expectations increase. The evidence from core inflation reports recently has not been
supportive of this viewpoint, although total inflation is still high. TIPS implied inflation
rates give no indication that markets are pricing in a large increase in underlying
inflation. However, long-term household inflation expectations have moved up as retail
gasoline prices spiked.
Alternative 4: Hurricane. This scenario captures the increased uncertainty associated
with the hurricane. This scenario assumes that the hurricane causes an abrupt slowdown
in real activity, followed by a sharp snapback. It is agnostic on the inflation implications.
Exhibits C-2 and C-3 show the path of inflation and output under the alternative scenarios
compared to the Bank’s central scenario forecast.
Additional Uncertainties
Foreign Outlook. The ability of foreign economies to cope with high energy prices
remains the key risk to the foreign outlook. The downside risk is that the recent jump in
energy prices, evident before Katrina, will begin to have a more tangible impact on
output and core inflation than has been evident so far. There are, though, some upside
risks to the foreign outlook. In the euro area, low long-term rates matched by
accelerating growth in loans to non-financial firms may be a precursor of greater-than-
expected growth. Japan’s economy was remarkably strong in the first half of 2005. The
forecast is for a significant amount of payback in 2005H2, but the recent GDP data and
higher equity values may indicate that Japan finally has turned the corner and thus
economy is set to slow less than expected. In support of this view, the Japanese labor
market continues to improve and investment spending is being supported by rising
profits. In Asia, a major downside risk is that investment in China continues to grow at
an unsustainable pace. As a consequence, China remains vulnerable to an abrupt
slowdown with unwelcome spillover effects for the rest of Asia. Another unknown is
how long countries such as Japan, China, and others in the region can continue to shield
FRBNY - cleared for release

FRBNY: Blackbook, September 19, 2005 Confidential(FR) Class II FOMC 23
consumers from higher energy prices. In Latin America, mid-term elections this fall in
Argentina and presidential elections next year in Brazil and Mexico may be disruptive
and damage confidence.
U.S. Trade Forecast. The near-term impact of Hurricane Katrina on net exports is
difficult to estimate. In Q3 and Q4, both exports and imports are likely to decline because
of the destruction of ports on the Gulf Coast, which would have ambiguous effects on the
trade deficit. At the same time, rebuilding efforts may lead to a surge in imports of
building materials and the like, causing the trade deficit to deteriorate. More generally,
the unusually soft import numbers in Q2 are viewed as a temporary phenomenon, but it is
possible they represent a more lasting trend in U.S. demand for imported goods.
Quantifying the Risks. The incoming data, except for the large persistent increase in
energy prices, were generally consistent with our central scenario before Katrina. Katrina
adds considerable short-run uncertainty to the outlook but does not affect the long-run
balance of the risks. We are lowering the current probability assessment of the central
scenario to 64% (it was 67% for the August FOMC). We are changing the balance of
risks by placing less weight on the overheating and productivity surge scenarios and
more weight on the productivity slowdown. The global deflation scenario is also
increased slightly because of the possible effects of higher energy prices on China and the
signal from the drop in real rates in financial markets before Katrina. The combination of
these changes produces more downside risk to the output forecast in 2006 and 2007.
For inflation although the probability of exceeding implicit target ranges has not
changed, the size of the possible excess continues to increase (see Exhibit C-4).
We assume that the most likely alternative scenario is now the productivity slowdown at
12% (8% in August), next is overheating at 8% (12% in August), then the new hurricane
scenario at 5%, followed by continued productivity surge at 4% (6% in August), and
global deflation at 4% (3% in August). The remaining 3% covering the additional
uncertainties is all on the upside. The implied dynamic balance of risks is shown in
Exhibit C-1.
FRBNY - cleared for release


FRBNY: Blackbook, September 19, 2005 Confidential(FR) Class II FOMC 25
At the same time the fundamentals of our outlook have not changed sufficiently to alter
our medium-term assessment. This assessment is consistent with the small reaction of
risk spreads and equity markets to the disruption caused by Katrina. This conclusion is
further supported by the analysis provided in Box A: monetary policy should not react to
large supply disruptions unless there are additional spillovers to demand not warranted by
the initial shock. Of course it is difficult at the present to assess whether such spillovers
might occur, thus the change in our confidence concerning the precision of short-term
signal. Ultimately, any clear signal of short-run sensitivity of monetary policy to
unwarranted weaknesses in demand caused by the supply disruption must also re-
emphasize the importance of price stability and that measures will be taken to ensure it if
necessary.
We consider three possible signals in our policy alternative exercises:
1. Pause and respond (Below short-run market expectation, above expectation by end of 2006). No increase in September and a very data dependent signal until the hurricane uncertainty is resolved. Signal some possibility of a rate cut in Q4. A continued signal of aggressive future response to higher inflation/inflation expectations in 2006; in particular, a 50 bp increase might be required in 2006.
2. Raise and wait (At short-run market expectation, above expectation in 2006). Increase 25 bp in September and a data dependent signal with no hint of the possibility of a cut in Q4 unless conditions substantially deteriorate. Continued signal of aggressive future response to higher inflation/inflation expectations in 2006.
3. Inflation Hawk (Above short run market expectation, above expectation in 2006). Increase 25 bp with a signal of little sensitivity to the noisy activity data and more sensitivity to inflation data and expectations. This comes closest to the old signal of “measured ends past neutral.”
Exhibit D-1 contains the results of implementing these three different signals by
amending the behavior of our gradual policy rule in the short-run. It shows the implied
(quarterly average path) of FFR through the end of 2006 compared to that currently
priced into markets.
All three policy rules produce a higher level for the FFR at the end of 2006 than presently
is priced into financial markets. This is similar to the situation in the last cycle but the gap
FRBNY - cleared for release

FRBNY: Blackbook, September 19, 2005 Confidential(FR) Class II FOMC 26
is less significant given the greater uncertainty in our forecast. Box B discusses some
methods of quantifying the differences between our assessment and that priced into
markets. Using metric 1 given in Box B the Pause and Respond signal is at the 62nd
percentile, the Raise and Wait signal at 67th percentile, the Inflation Hawk signal is at the
72nd percentile of the of the market distribution respectively. Using metric 2 the market
expectation at the end of 2006Q1 is at the 90th percentile of the Pause and Respond
signal distribution, the 60th percentile of the Raise and Wait signal distribution and the
53th percentile of the Inflation Hawk signal distribution. Note that this indicates some
positive skewness in the distribution of FFR implied by our rules (that is, the expected
value is above the median). There is no evidence that such positive skewness is priced
into markets [see Exhibit B-5].
If we focus on the signal that appears to be most consistent with market expectations for
the next few meetings, Raise and Wait, then the alternative scenarios of overheating and
global deflation continue to have very different implications for policy in 2006 and 2007.
Exhibit D-2 contains the path of the nominal FFR and Exhibit D-3 that of the real FFR
for the alternative scenarios.
As seen in Exhibit D-2, the projected path of the FFR is much higher under the
overheating scenario in 2006 than in either our central projection or the market implied
path. The path of the FFR under the global deflation scenario is very different from the
other paths as the Fed reacts quickly to signs of deflationary pressures. These two
scenarios are very easy to distinguish because they move output and inflation in opposite
directions in the short run [see Exhibits C-2 and C-3]. However, the new hurricane
scenario complicates the situation, since in the short run it would produce a drop in
output similar to the global deflation and productivity slowdown scenarios but its effects
on inflation are less striking. Its policy implications are quite different from the other
scenarios as seen in Exhibit D-2.
One explanation of the difference between the market-implied path and the path that we
view as consistent with FOMC objectives is differing views of the (implicit) inflation
FRBNY - cleared for release

FRBNY: Blackbook, September 19, 2005 Confidential(FR) Class II FOMC 27
target. The new Exhibit D-4 shows the result of running our standard policy rule (setting
the initial FFR at its value in 2004Q4) with a 1.5% inflation target and with a 1.75%
inflation target. The path derived from the 1.5% target follows quite closely the actual
FFR increases in 2005 albeit with less steepness to its slope. The endpoint is very similar
to our three policy rules discussed above. In contrast, the path of the FFR in 2005 under
the higher inflation target is considerably lower than the actual path but the endpoint is
similar to that priced into markets. One tentative conclusion from this analysis is that the
markets either have a more sanguine view of inflation than currently embedded in our
forecast and/or we have a more sanguine view of real activity going forward than priced
into markets.
FRBNY - cleared for release


FRBNY: Blackbook, September 19, 2005 Confidential(FR) Class II FOMC 31
Advisors, and the forecast from a small model (PSI model) that uses business activity and
sentiment as the primary independent variables.
Source: MMS Function, FRBNY; Blue Chip Economic Indicators; FRB Philadelphia
Survey of Professional Forecasters; Macroeconomic Advisors
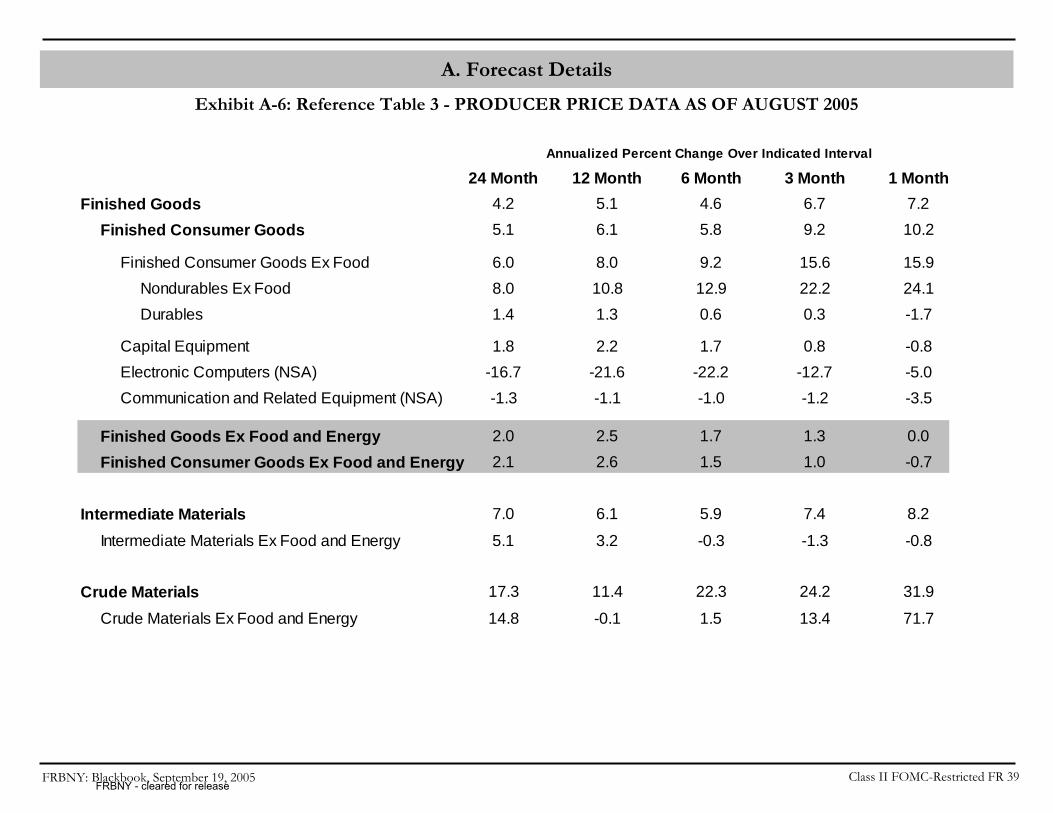
Exhibit A-6 (1, 2, & 3). Recent Behavior of Inflation
The three tables in this exhibit are included as reference: they show the actual changes in
inflation over 3, 6, 12, and 24 months.
Source: Bureau of Economic Analysis, Bureau of Labor Statistics
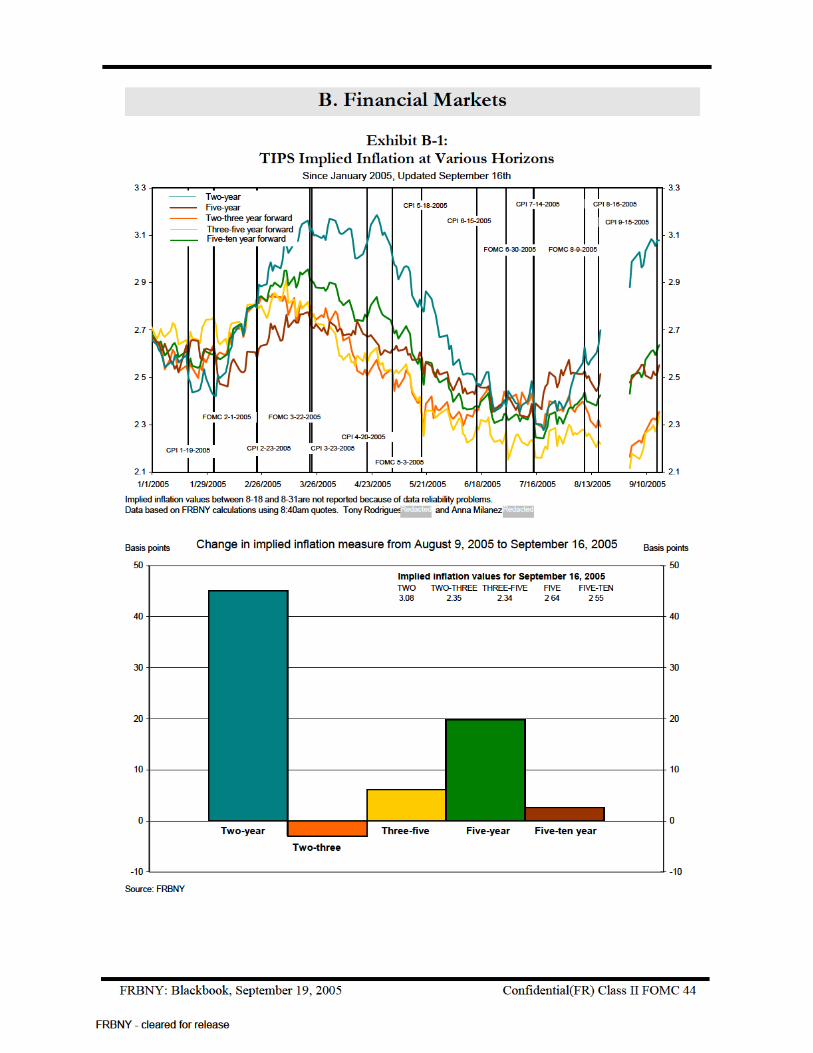
Exhibit A-7. Underlying Inflation Gauge (UIG) and Implied Inflation from the TIPS
The chart displays measures of inflation expectations from the UIG, and compares them
to the TIPS measure over the same horizon (a non –technical description of the
construction of this measure is in Appendix to Exhibit A-7 below. A non –technical
description of the construction of inflation expectations from the TIPS is in Appendix to
Exhibit B-1).
Source: MMS Function, FRBNY and Swiss National Bank.
Appendix to Exhibit A-7. Construction of UIG (Underlying Inflation Gauge)
The Underlying Inflation Gauge is a measure of underlying inflation that incorporates
information from a very broad set of nominal and real variables. It is constructed using a
dynamic factor model to extract a common component from the chosen set of variables,
and then removes the high frequency movements (fluctuations whose frequency is up to
one year) from this component. This filtering reflects our view that monetary policy is
primarily interested in shocks with a medium-term impact on inflation. In terms of units,
the UIG maps into a measure of consumer price index.
We use this factor model to determine the oscillations of the UIG about its long-
term level. Assuming that long-term expectations are well anchored, we set the long-term
level of the UIG to 2.25%, the average inflation rate since 1994, which can be interpreted
as an implicit inflation target.
FRBNY - cleared for release

A. Forecast Details
Class II FOMC-Restricted FR 32FRBNY: Blackbook, September 19, 2005
Exhibit A-1: Actual and Projected Percentage Changes of GDP, Prices, and the Unemployment Rate
Chain TypeReal GDP GDP Price Index Core PCE Unemployment Rate
Jun05 Aug05 Sep05 Jun05 Aug05 Sep05 Jun05 Aug05 Sep05 Jun05 Aug05 Sep05 Jun05 Aug05 Sep05
2005 Q1 3.5 3.8 3.8 3.2 3.1 3.1 2.1 2.3 2.3 2.2 2.4 2.4 5.3 5.3 5.32005 Q2 3.2 3.4 3.3 1.6 2.4 2.4 3.7 3.3 3.2 2.0 1.7 1.6 5.2 5.1 5.12005 Q3 4.1 4.0 3.5 1.9 1.6 2.6 2.1 2.4 3.6 1.9 1.8 1.4 5.1 5.0 4.92005 Q4 3.5 3.9 3.3 2.3 1.6 1.4 2.2 2.2 1.7 1.9 1.9 1.8 5.1 5.0 4.9
2006 Q1 3.4 3.5 3.4 2.6 2.6 2.5 2.2 2.2 2.2 1.9 2.0 1.9 5.1 4.9 4.82006 Q2 3.6 3.5 3.3 2.2 2.2 2.2 2.2 2.2 2.2 1.9 2.0 2.0 5.1 4.8 4.82006 Q3 3.6 3.5 3.2 2.2 2.3 2.2 2.2 2.3 2.3 1.9 2.1 2.1 5.0 4.8 4.82006 Q4 3.7 3.5 3.2 2.3 2.2 2.2 2.2 2.3 2.3 1.9 2.1 2.1 5.0 4.7 4.8
2007 Q1 N/A 3.3 3.3 N/A 2.6 2.2 N/A 2.2 2.2 N/A 2.0 2.0 N/A 4.7 4.82007 Q2 N/A 3.3 3.4 N/A 2.1 2.1 N/A 2.1 2.1 N/A 2.0 1.9 N/A 4.7 4.82007 Q3 N/A 3.3 3.3 N/A 2.0 2.0 N/A 2.0 2.0 N/A 1.7 1.8 N/A 4.7 4.82007 Q4 N/A 3.3 3.3 N/A 1.9 2.0 N/A 1.9 1.9 N/A 1.7 1.7 N/A 4.7 4.8
2003 Q4 to 3.9 3.8 3.8 2.4 2.9 2.9 2.6 3.1 3.1 1.6 2.2 2.2 -0.4 -0.4 -0.4 *2004 Q4
2004 Q4 to 3.6 3.8 3.5 2.2 2.2 2.4 2.5 2.5 2.7 2.0 2.0 1.8 -0.3 -0.4 -0.5 *
2005 Q4
2005 Q4 to 3.6 3.5 3.3 2.3 2.3 2.3 2.2 2.3 2.2 1.9 2.0 2.0 -0.1 -0.3 -0.1 *
2006 Q4
2006 Q4 to N/A 3.3 3.3 N/A 2.2 2.1 N/A 2.0 2.0 N/A 1.8 1.8 N/A 0.0 0.02007 Q4
* Q4 to Q4 absolute change Notes: Columns reflect the date of a forecast. Italics indicate a data release prior to date of a forecast
PCE Deflator
FRBNY - cleared for release

A. Forecast Details
Class II FOMC-Restricted FR 33FRBNY: Blackbook, September 19, 2005
Exhibit A-2: Detailed Comparison of FRBNY and Greenbook Forecasts
2007AUG SEP AUG SEP AUG SEP AUG SEP AUG SEP SEP
REAL GDP (Q4/Q4) 3.8 3.5 3.5 3.3 3.3 3.3 3.9 3.5 3.1 3.4 2.9
GROWTH CONTRIBUTIONS(Q4/Q4)
FINAL SALES TO DOMESTIC PURCHASERS 3.9 3.6 3.9 3.6 3.4 3.6 3.8 3.5 3.5 3.9 3.0CONSUMPTION 2.4 2.3 2.3 2.3 2.1 2.2 2.4 2.1 2.3 2.5 2.2BFI 1.0 0.7 1.1 0.9 1.0 1.0 0.6 0.5 0.8 0.9 0.6 STRUCTURES 0.0 0.0 0.1 0.1 0.1 0.1 0.1 0.1 0.1 0.2 0.1 EQUIPMENT & SOFTWARE 1.0 0.7 1.0 0.8 0.9 0.8 0.6 0.5 0.7 0.7 0.5RESIDENTIAL INVESTMENT 0.1 0.2 -0.1 -0.1 -0.1 -0.1 0.3 0.4 0.0 0.1 -0.1GOVERNMENT 0.5 0.4 0.6 0.5 0.4 0.5 0.5 0.5 0.4 0.4 0.3 FEDERAL 0.2 0.2 0.2 0.2 0.1 0.2 0.2 0.3 0.1 0.1 0.0 STATE & LOCAL 0.3 0.3 0.4 0.4 0.3 0.4 0.2 0.3 0.3 0.3 0.3
INVENTORY INVESTMENT 0.0 -0.1 0.0 0.1 -0.1 0.1 0.0 -0.1 -0.1 -0.1 0.3
NET EXPORTS -0.1 0.0 -0.3 -0.5 0.0 -0.4 0.1 0.1 -0.4 -0.4 -0.4
INFLATION/PRODUCTIVITY/WAGES (Q4/Q4)
GDP DEFLATOR 2.2 2.4 2.3 2.3 2.2 2.1 2.3 2.7 2.1 2.0 2.1PCE 2.5 2.7 2.3 2.2 2.0 2.0 2.6 3.2 2.1 1.9 1.8CORE PCE 2.0 1.8 2.0 2.0 1.8 1.8 2.0 1.9 2.1 2.3 2.0
COMPENSATION PER HOUR 5.2 4.8 4.4 4.4 4.1 4.2 4.6 4.7 5.2 5.4 5.1OUTPUT PER HOUR 2.4 2.4 2.2 2.2 2.2 2.2 2.9 2.8 2.1 2.2 2.5UNIT LABOR COSTS 2.8 2.4 2.2 2.2 1.9 2.0 1.6 1.8 3.1 3.1 2.5
EMPLOYMENT VARIABLESUNEMPLOYMENT RATE (Q4 LEVEL) 5.0 4.9 4.7 4.8 4.7 4.8 5.0 5.0 5.0 5.0 5.0PARTICIPATION RATE (Q4 LEVEL) 66.1 66.2 66.1 66.2 66.1 66.2 66.0 66.1 66.0 66.0 65.9
NONFARM PAYROLL EMPLOYMENT (Q4/Q4 CHANGE) TOTAL, IN THOUSANDS 2038 2107 2018 1741 1788 1765 2200 2000 1800 2000 1100 AVERAGE PER MONTH, IN THOUSANDS 170 176 168 145 149 147 183 167 150 167 92
FINANCIAL MARKET VARIABLESFED FUNDS RATE (PERCENT) 3.92 3.92 4.25 4.25 4.25 4.25 4.00 4.00 4.25 4.25 4.25BAA BOND YIELD (PERCENT) 6.2 6.1 6.5 6.5 6.5 6.5 6.0 6.0 6.0 6.0 6.1EFFECTIVE EXCHANGE RATE (Q4/Q4 % CHANGE) -1.2 -2.5 -3.0 -1.5 N/A N/A 0.8 1.3 -1.3 -1.7 N/A
Board2005 20062005 2006
FRBNY2007
FRBNY - cleared for release
A. Forecast Details
Class II FOMC-Restricted FR 34FRBNY: Blackbook, September 19, 2005
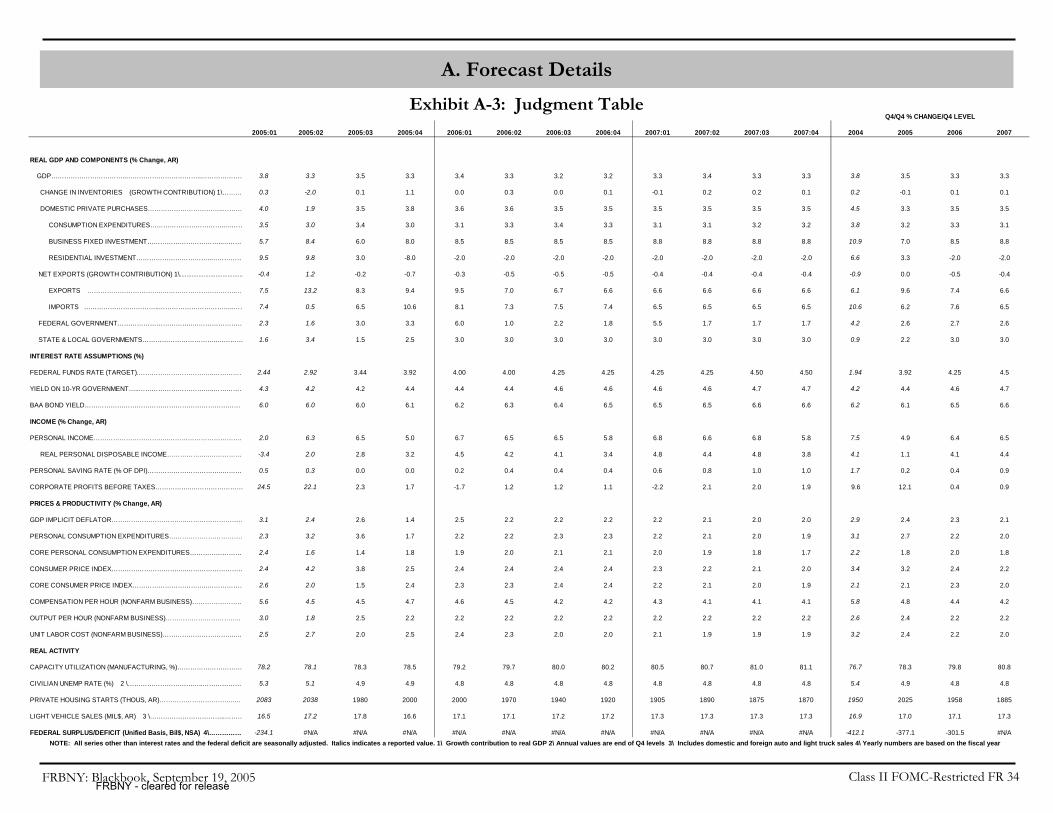
Exhibit A-3: Judgment Table
NOTE: All series other than interest rates and the federal deficit are seasonally adjusted. Italics indicates a reported value. 1\ Growth contribution to real GDP 2\ Annual values are end of Q4 levels 3\ Includes domestic and foreign auto and light truck sales 4\ Yearly numbers are based on the fiscal year
2005:01 2005:02 2005:03 2005:04 2006:01 2006:02 2006:03 2006:04 2007:01 2007:02 2007:03 2007:04 2004 2005 2006 2007
REAL GDP AND COMPONENTS (% Change, AR)
GDP……………………………..……………………………..………………… 3.8 3.3 3.5 3.3 3.4 3.3 3.2 3.2 3.3 3.4 3.3 3.3 3.8 3.5 3.3 3.3
CHANGE IN INVENTORIES (GROWTH CONTRIBUTION) 1\……… 0.3 -2.0 0.1 1.1 0.0 0.3 0.0 0.1 -0.1 0.2 0.2 0.1 0.2 -0.1 0.1 0.1
DOMESTIC PRIVATE PURCHASES……………………………..……… 4.0 1.9 3.5 3.8 3.6 3.6 3.5 3.5 3.5 3.5 3.5 3.5 4.5 3.3 3.5 3.5
CONSUMPTION EXPENDITURES……………………………..……… 3.5 3.0 3.4 3.0 3.1 3.3 3.4 3.3 3.1 3.1 3.2 3.2 3.8 3.2 3.3 3.1
BUSINESS FIXED INVESTMENT……………………………..……… 5.7 8.4 6.0 8.0 8.5 8.5 8.5 8.5 8.8 8.8 8.8 8.8 10.9 7.0 8.5 8.8
RESIDENTIAL INVESTMENT……………………………..…………… 9.5 9.8 3.0 -8.0 -2.0 -2.0 -2.0 -2.0 -2.0 -2.0 -2.0 -2.0 6.6 3.3 -2.0 -2.0
NET EXPORTS (GROWTH CONTRIBUTION) 1\..................................... -0.4 1.2 -0.2 -0.7 -0.3 -0.5 -0.5 -0.5 -0.4 -0.4 -0.4 -0.4 -0.9 0.0 -0.5 -0.4
EXPORTS ……………………………..……………………………..… 7.5 13.2 8.3 9.4 9.5 7.0 6.7 6.6 6.6 6.6 6.6 6.6 6.1 9.6 7.4 6.6
IMPORTS ……………………………..……………………………..…… 7.4 0.5 6.5 10.6 8.1 7.3 7.5 7.4 6.5 6.5 6.5 6.5 10.6 6.2 7.6 6.5
FEDERAL GOVERNMENT……………………………..…………………… 2.3 1.6 3.0 3.3 6.0 1.0 2.2 1.8 5.5 1.7 1.7 1.7 4.2 2.6 2.7 2.6
STATE & LOCAL GOVERNMENTS……………………………..………… 1.6 3.4 1.5 2.5 3.0 3.0 3.0 3.0 3.0 3.0 3.0 3.0 0.9 2.2 3.0 3.0
INTEREST RATE ASSUMPTIONS (%)
FEDERAL FUNDS RATE (TARGET).……………………………..…………… 2.44 2.92 3.44 3.92 4.00 4.00 4.25 4.25 4.25 4.25 4.50 4.50 1.94 3.92 4.25 4.5
YIELD ON 10-YR GOVERNMENT…..……………………………..…………… 4.3 4.2 4.2 4.4 4.4 4.4 4.6 4.6 4.6 4.6 4.7 4.7 4.2 4.4 4.6 4.7
BAA BOND YIELD……………………………………………………………… 6.0 6.0 6.0 6.1 6.2 6.3 6.4 6.5 6.5 6.5 6.6 6.6 6.2 6.1 6.5 6.6
INCOME (% Change, AR)
PERSONAL INCOME……………………………..…………………………….. 2.0 6.3 6.5 5.0 6.7 6.5 6.5 5.8 6.8 6.6 6.8 5.8 7.5 4.9 6.4 6.5
REAL PERSONAL DISPOSABLE INCOME………………..…………… -3.4 2.0 2.8 3.2 4.5 4.2 4.1 3.4 4.8 4.4 4.8 3.8 4.1 1.1 4.1 4.4
PERSONAL SAVING RATE (% OF DPI)……………………………..……… 0.5 0.3 0.0 0.0 0.2 0.4 0.4 0.4 0.6 0.8 1.0 1.0 1.7 0.2 0.4 0.9
CORPORATE PROFITS BEFORE TAXES……………..…………………… 24.5 22.1 2.3 1.7 -1.7 1.2 1.2 1.1 -2.2 2.1 2.0 1.9 9.6 12.1 0.4 0.9
PRICES & PRODUCTIVITY (% Change, AR)
GDP IMPLICIT DEFLATOR……………………………..……………………… 3.1 2.4 2.6 1.4 2.5 2.2 2.2 2.2 2.2 2.1 2.0 2.0 2.9 2.4 2.3 2.1
PERSONAL CONSUMPTION EXPENDITURES……………………………. 2.3 3.2 3.6 1.7 2.2 2.2 2.3 2.3 2.2 2.1 2.0 1.9 3.1 2.7 2.2 2.0
CORE PERSONAL CONSUMPTION EXPENDITURES…………………… 2.4 1.6 1.4 1.8 1.9 2.0 2.1 2.1 2.0 1.9 1.8 1.7 2.2 1.8 2.0 1.8
CONSUMER PRICE INDEX……………………………..……………………… 2.4 4.2 3.8 2.5 2.4 2.4 2.4 2.4 2.3 2.2 2.1 2.0 3.4 3.2 2.4 2.2
CORE CONSUMER PRICE INDEX……………………………..……………… 2.6 2.0 1.5 2.4 2.3 2.3 2.4 2.4 2.2 2.1 2.0 1.9 2.1 2.1 2.3 2.0
COMPENSATION PER HOUR (NONFARM BUSINESS)…………………… 5.6 4.5 4.5 4.7 4.6 4.5 4.2 4.2 4.3 4.1 4.1 4.1 5.8 4.8 4.4 4.2
OUTPUT PER HOUR (NONFARM BUSINESS)…………………………….. 3.0 1.8 2.5 2.2 2.2 2.2 2.2 2.2 2.2 2.2 2.2 2.2 2.6 2.4 2.2 2.2
UNIT LABOR COST (NONFARM BUSINESS)……………………………..… 2.5 2.7 2.0 2.5 2.4 2.3 2.0 2.0 2.1 1.9 1.9 1.9 3.2 2.4 2.2 2.0
REAL ACTIVITY
CAPACITY UTILIZATION (MANUFACTURING, %)………………………… 78.2 78.1 78.3 78.5 79.2 79.7 80.0 80.2 80.5 80.7 81.0 81.1 76.7 78.3 79.8 80.8
CIVILIAN UNEMP RATE (%) 2 \……………………………..……………… 5.3 5.1 4.9 4.9 4.8 4.8 4.8 4.8 4.8 4.8 4.8 4.8 5.4 4.9 4.8 4.8
PRIVATE HOUSING STARTS (THOUS, AR)……………………………..… 2083 2038 1980 2000 2000 1970 1940 1920 1905 1890 1875 1870 1950 2025 1958 1885
LIGHT VEHICLE SALES (MIL$, AR) 3 \……………………………..……… 16.5 17.2 17.8 16.6 17.1 17.1 17.2 17.2 17.3 17.3 17.3 17.3 16.9 17.0 17.1 17.3
FEDERAL SURPLUS/DEFICIT (Unified Basis, Bil$, NSA) 4\……………… -234.1 #N/A #N/A #N/A #N/A #N/A #N/A #N/A #N/A #N/A #N/A #N/A -412.1 -377.1 -301.5 #N/A
Q4/Q4 % CHANGE/Q4 LEVEL
FRBNY - cleared for release
A. Forecast Details
Class II FOMC-Restricted FR 35FRBNY: Blackbook, September 19, 2005
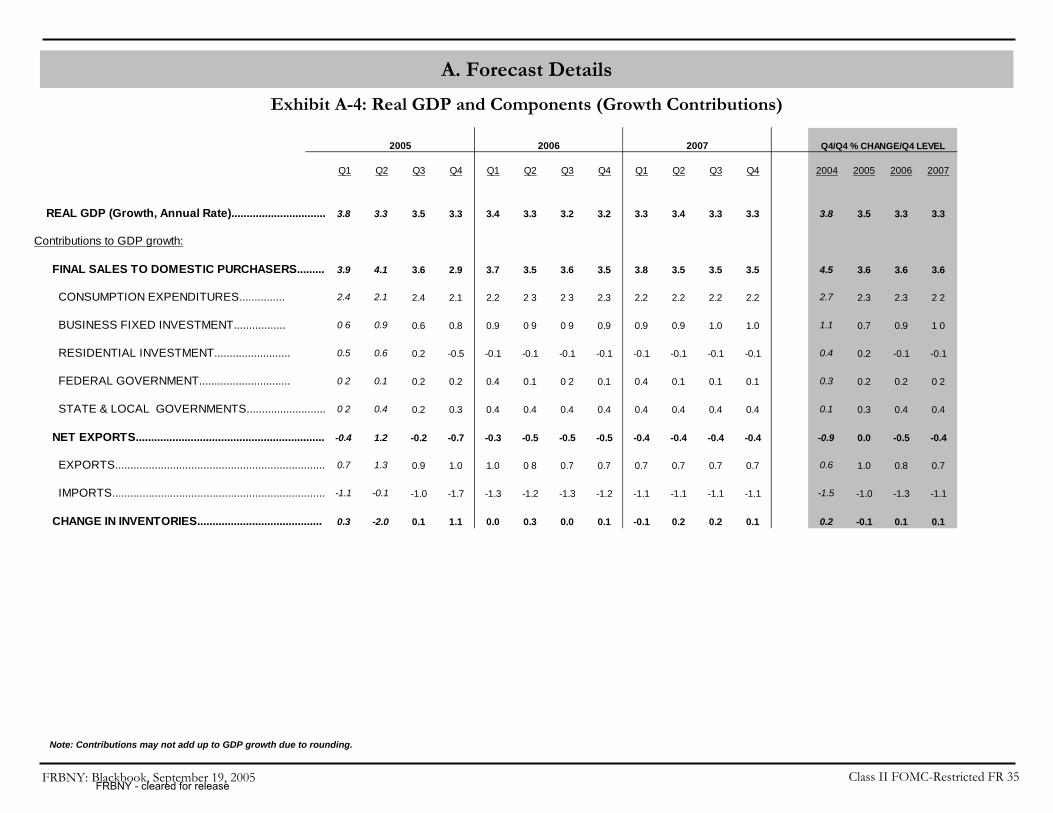
Exhibit A-4: Real GDP and Components (Growth Contributions)
Note: Contributions may not add up to GDP growth due to rounding.
Q1 Q2 Q3 Q4 Q1 Q2 Q3 Q4 Q1 Q2 Q3 Q4 2004 2005 2006 2007
REAL GDP (Growth, Annual Rate)............................... 3.8 3.3 3.5 3.3 3.4 3.3 3.2 3.2 3.3 3.4 3.3 3.3 3.8 3.5 3.3 3.3
Contributions to GDP growth:
FINAL SALES TO DOMESTIC PURCHASERS......... 3.9 4.1 3.6 2.9 3.7 3.5 3.6 3.5 3.8 3.5 3.5 3.5 4.5 3.6 3.6 3.6
CONSUMPTION EXPENDITURES............... 2.4 2.1 2.4 2.1 2.2 2 3 2 3 2.3 2.2 2.2 2.2 2.2 2.7 2.3 2.3 2 2
BUSINESS FIXED INVESTMENT................. 0 6 0.9 0.6 0.8 0.9 0 9 0 9 0.9 0.9 0.9 1.0 1.0 1.1 0.7 0.9 1 0
RESIDENTIAL INVESTMENT......................... 0.5 0.6 0.2 -0.5 -0.1 -0.1 -0.1 -0.1 -0.1 -0.1 -0.1 -0.1 0.4 0.2 -0.1 -0.1
FEDERAL GOVERNMENT.............................. 0 2 0.1 0.2 0.2 0.4 0.1 0 2 0.1 0.4 0.1 0.1 0.1 0.3 0.2 0.2 0 2
STATE & LOCAL GOVERNMENTS.......................... 0 2 0.4 0.2 0.3 0.4 0.4 0.4 0.4 0.4 0.4 0.4 0.4 0.1 0.3 0.4 0.4
NET EXPORTS.............................................................. -0.4 1.2 -0.2 -0.7 -0.3 -0.5 -0.5 -0.5 -0.4 -0.4 -0.4 -0.4 -0.9 0.0 -0.5 -0.4
EXPORTS..................................................................... 0.7 1.3 0.9 1.0 1.0 0 8 0.7 0.7 0.7 0.7 0.7 0.7 0.6 1.0 0.8 0.7
IMPORTS...................................................................... -1.1 -0.1 -1.0 -1.7 -1.3 -1.2 -1.3 -1.2 -1.1 -1.1 -1.1 -1.1 -1.5 -1.0 -1.3 -1.1
CHANGE IN INVENTORIES......................................... 0.3 -2.0 0.1 1.1 0.0 0.3 0.0 0.1 -0.1 0.2 0.2 0.1 0.2 -0.1 0.1 0.1
20062005 2007 Q4/Q4 % CHANGE/Q4 LEVEL
FRBNY - cleared for release

A. Forecast Details
Class II FOMC-Restricted FR 36FRBNY: Blackbook, September 19, 2005
Exhibit A-5: Alternative GDP and Inflation Forecasts
Note: Previous release for all forecasts except Median SPF is August; Median SPF is May. Macro Advisers Q3 GDP forecast is as of 9/14.
Release Date Prev* Sep Prev* Sep Prev* Sep
FRBNY 9/15/2005 3.4 3.3 4.0 3.5 3.9 3.3
PSI Model 9/15/2005 -- -- 3.4 2.7 3.2 2.7
Blue Chip 9/10/2005 3.4 3.3 3.9 3.6 3.3 3.0
Median SPF 8/15/2005 3.0 3.0 3.5 4.2 3.4 3.6
Macro Advisers 9/6/2005 3.4 3.3 4.6 4.0 3.6 3.3
Release Date Prev* Sep Prev* Sep Prev* Sep
FRBNY 9/15/2005 -- -- 2.4 3.8 2.5 2.5
Blue Chip 9/10/2005 -- -- 2.5 3.4 2.4 2.8
Median SPF 8/15/2005 -- -- 2.3 2.8 2.4 2.4
Macro Advisers 9/6/2005 -- -- 2.5 5.9 1.9 2.7
Release Date Prev* Sep Prev* Sep Prev* Sep
FRBNY 9/15/2005 -- -- 1.8 1.5 2.3 2.4
Macro Advisers 9/6/2005 -- -- 2.0 1.9 1.9 2.3
2005-Q2 2005-Q3 2005-Q4GDP
CPI
Core CPI2005-Q2 2005-Q3 2005-Q4
2005-Q2 2005-Q3 2005-Q4
FRBNY - cleared for release

A. Forecast Details
Class II FOMC-Restricted FR 37FRBNY: Blackbook, September 19, 2005
Exhibit A-6: Reference Table 1 - CONSUMER PRICE INDEX DATA AS OF AUGUST 2005
24 Month 12 Month 6 Month 3 Month 1 MonthTotal Core
Consumer Price Index 3.1 3.6 4.3 4.2 6.3 100.00 Energy 15.2 20.3 33.4 38.2 79.6 7.08
All Items Ex Energy 2.1 2.2 1.9 1.2 1.2 Food 2.9 2.2 2.5 1.1 0.0 14.38 Food Away From Home 3.1 3.1 2.9 3.4 3.8 6.13
All Items Ex Food and Energy 1.9 2.2 1.8 1.4 1.2 78.54 100.00 Core Chain-Weight CPI (NSA) 1.6 1.8 1.3 0.0 2.2
Core Goods -0.2 0.7 -0.4 -1.4 1.7 22.25 28.34 Apparel -0.5 -0.6 -1.0 -2.6 12.9 3.98 5.06 Medical Care Commodities 4.2 4.0 3.4 2.6 0.4 1.50 1.91 Durable Goods -1.0 0.6 -1.5 -2.4 -2.1 11.28 14.36 New Vehicles -0.6 0.1 -3.7 -5.9 -6.0 4.82 6.13 Used Vehicles -0.5 6.1 6.5 9.5 8.9 2.01 2.56
Core Services 2.8 2.7 2.7 2.4 1.0 56.28 71.66 Rent of Primary Residence 2.9 3.0 3.3 3.6 3.4 6.16 7.84 Owners' Equivalent Rent 2.4 2.3 2.5 2.3 2.1 23.38 29.77 Lodging Away from Home 3.6 2.9 -0.5 -1.8 -17.6 2.95 3.76 Medical Care Services 4.8 4.5 3.8 2.6 -0.4 4.58 5.83 Transportation Services 2.3 2.8 4.4 4.5 4.9 6.32 8.05
(December 2003)Annualized Percent Change Over Indicated Interval Weights
FRBNY - cleared for release

A. Forecast Details
Class II FOMC-Restricted FR 38FRBNY: Blackbook, September 19, 2005
Exhibit A-6: Reference Table 2 - PCE DEFLATOR DATA AS OF JULY 2005
24 Month 12 Month 6 Month 3 Month 1 Month
PCE Deflator 2.7 2.5 2.8 1.3 3.6Market Based PCE Deflator 2.5 2.5 3.0 1.4 4.0
Durable Goods -1.2 -0.6 -1.8 -2.6 -5.6
Motor Vehicles and Parts 0.3 2.0 -0.9 -2.3 -8.9
Nondurable Goods 3.6 3.3 5.0 0.3 9.0
Clothing and Shoes -1.1 -2.1 -3.4 -6.8 -11.7
Services 3.0 2.8 2.8 2.7 3.0
Housing 2.6 2.5 2.9 2.4 3.5 Transportation 2.8 3.4 5.8 6.6 7.8 Medical Care 3.2 2.9 2.5 3.4 2.3
PCE Deflator Ex Food and Energy 1.9 1.8 1.5 1.2 0.7 Market Based Core PCE Deflator 1.5 1.6 1.4 1.3 0.5
Personal Business Services-Market Based 3.1 2.7 2.1 2.4 1.1 Personal Business Services-Not Market Based 3.0 1.5 0.8 0.8 1.3
Annualized Percent Change Over Indicated Interval
FRBNY - cleared for release
A. Forecast Details
Class II FOMC-Restricted FR 39FRBNY: Blackbook, September 19, 2005
Exhibit A-6: Reference Table 3 - PRODUCER PRICE DATA AS OF AUGUST 2005
24 Month 12 Month 6 Month 3 Month 1 MonthFinished Goods 4.2 5.1 4.6 6.7 7.2 Finished Consumer Goods 5.1 6.1 5.8 9.2 10.2
Finished Consumer Goods Ex Food 6.0 8.0 9.2 15.6 15.9 Nondurables Ex Food 8.0 10.8 12.9 22.2 24.1 Durables 1.4 1.3 0.6 0.3 -1.7
Capital Equipment 1.8 2.2 1.7 0.8 -0.8 Electronic Computers (NSA) -16.7 -21.6 -22.2 -12.7 -5.0 Communication and Related Equipment (NSA) -1.3 -1.1 -1.0 -1.2 -3.5
Finished Goods Ex Food and Energy 2.0 2.5 1.7 1.3 0.0 Finished Consumer Goods Ex Food and Energy 2.1 2.6 1.5 1.0 -0.7
Intermediate Materials 7.0 6.1 5.9 7.4 8.2
Intermediate Materials Ex Food and Energy 5.1 3.2 -0.3 -1.3 -0.8
Crude Materials 17.3 11.4 22.3 24.2 31.9
Crude Materials Ex Food and Energy 14.8 -0.1 1.5 13.4 71.7
Annualized Percent Change Over Indicated Interval
FRBNY - cleared for release


FRBNY: Blackbook, September 19, 2005 Confidential(FR) Class II FOMC 42
(tightening) surprise. In addition implied volatility in percentages is plotted. Both
measures are averages of 3-, 6- and 9-month values. No risk adjustment is made.
Source: Capital Markets, FRBNY
Exhibit B-6. Implied Volatility on Eurodollar Options (Basis Points)
The charts in this exhibit show the current and historical behavior of the 90% confidence
interval (i.e., financial markets expect 90% of the time the actual FFR at the specified
date will be in this interval) for the Fed Funds Target implied from financial markets
options. The first two charts show how the 90% confidence interval has changed since
the last FOMC meeting. The next chart shows the current confidence interval around the
expected path. The final two charts show a long history of the behavior of the confidence
interval at the 6 and 12 month horizon. No risk adjustment is made.
Source: Monetary Affairs, BofG
Exhibit B-7. Dollar Exchange rates
This exhibit contains 4 charts showing the behavior of the dollar in the last 10 years. All
series are defined so that a decline in the index represents a depreciation of the dollar.
Effective rates are computed by the Board of Governors using a “narrow” set of weights,
for 16 major exchange rates.
Source: BofG, BIS, International Research Function FRBNY
Exhibit B-8. Implied volatility on Yen/Dollar and Euro/Dollar Exchange Rates
The first set of charts in this exhibit contains the one month ahead implied volatility on
Yen/Dollar and Euro/Dollar exchange rates normalized to the width of a 90 percent
confidence interval. The second set of charts show the change in the expected implied
volatility over the next six months.
Source: Markets Group, FRBNY, Reuters
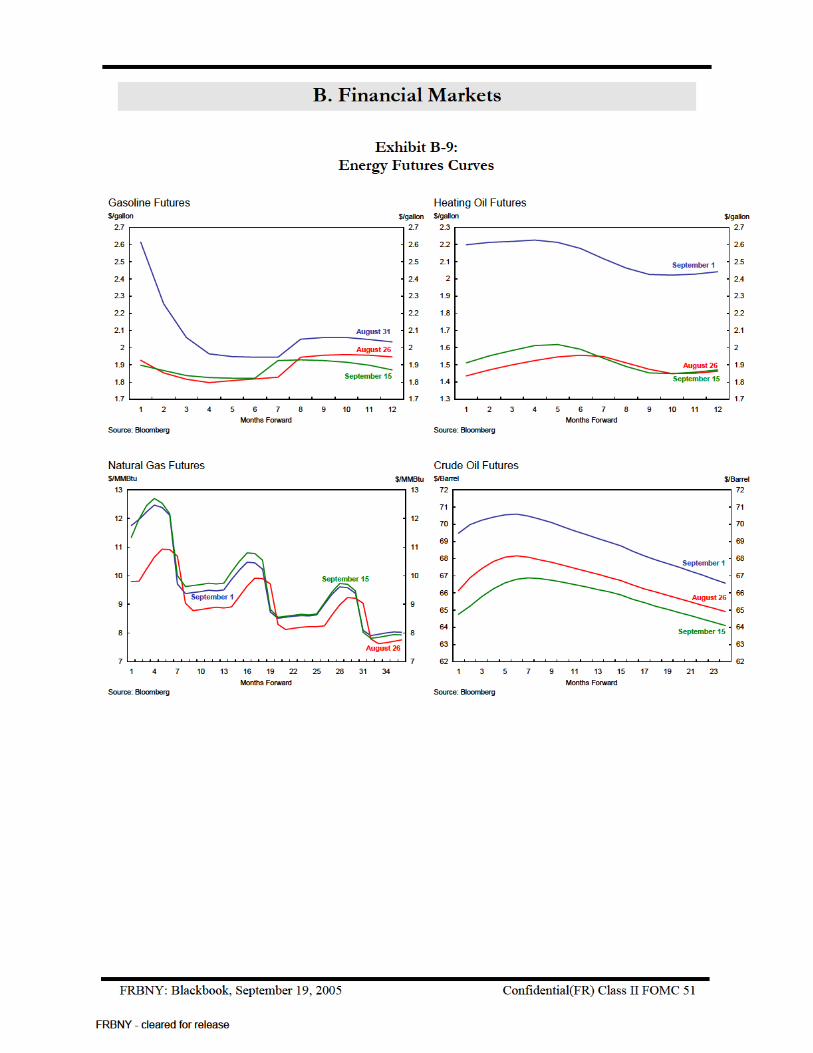
Exhibit B-9. Energy Futures Curves
This exhibit contains charts showing futures curves for gasoline, heating oil, natural gas,
and crude oil. August 26 represents the state of the futures markets just before Hurricane
FRBNY - cleared for release

FRBNY: Blackbook, September 19, 2005 Confidential(FR) Class II FOMC 43
Katrina. The next date represents the post-Katrina peak in energy markets. September 15
represents current data.
Source: Bloomberg.
Appendix to Exhibit B-1. Construction of Implied Inflation from TIPS
The implied inflation series are estimates of the inflation expectations derived from TIPS
and nominal Treasury securities, not accounting for risk premia or other technical factors.
They differ from the simpler breakeven inflation rates which just subtract the real yield
on TIPS securities from the on-the-run treasury yield with the same maturity. For each
individual TIPS, we solve for the inflation rate that equates the discounted payments of
the TIPS to its price, where the discount rates are derived from off-the-run nominal
Treasury securities. We then calculate two-, three-, and five-year inflation rates as the
inflation rate corresponding to a TIPS with duration of two, three or five years
respectively. Finally, we compute approximate forward rates from the rates at the shorter
and longer dated durations. For example, the two-to-three year forward rate is computed
from the two-year and three-year implied inflation values. The five-to-ten year forward
rate uses the five-year implied inflation value and the implied inflation rate on the most
recently issued ten-year TIPS.
FRBNY - cleared for release


FRBNY: Blackbook, September 19, 2005 Confidential(FR) Class II FOMC 53
Exhibit C-2 & C-3: Alternative Scenarios
These exhibits take the balance of risks for each scenario and show their implications for
GDP growth and core PCE inflation. They plot the expected path (calculated by
averaging all paths that have at least one quarter in that scenario) of 4-quarter changes in
the core PCE deflator and real GDP under the central scenario and the alternative
scenarios.
The global deflation scenario assumes that output is slower than the central scenario and
inflation is dramatically lower. The overheating scenario assumes that for 2 quarters the
economy grows quicker than expected under the central scenario, with both inflation and
output higher than our central forecast. Then the real economy slows dramatically but
inflation continues to be above the central forecast. The hurricane scenario assumes an
initial large fall in output followed by a bounceback.
Exhibit C-4 & C-5: Fan Charts
Fan charts are shown for the core PCE deflator (Exhibit C-4) and real GDP (Exhibit C-5).
These charts are constructed to represent the overall uncertainty contained in our main
scenario and our alternative scenarios. They combine the information contained in the
previous exhibits with the additional uncertainty that we cannot predict perfectly the path
of the economy, even if we knew which scenario were true. The amount of total
uncertainty in the forecast distributions is now calibrated to imply fundamental interest
rate volatility lower than that given by the implied Eurodollar forward volatility curve
averaged across possible policy rules from a market perspective (see the text for Exhibit
D-4 ). In addition the expected value for each of the two forecast distributions is included
in the fan chart. These expected values are computed as averages over the realizations
across all possible scenarios considered in Exhibit C-1.The difference between this
profile and the central bank scenario is another measure of the balance of risks. If they
are equal the risks are balanced; if the expected value is above the central bank scenario,
there is upside risk; if it is below, there is downside risk.
Source: MMS Function, FRBNY
FRBNY - cleared for release


FRBNY: Blackbook, September 19, 2005 Confidential(FR) Class II FOMC 58
Exhibit D-4: Implications of Different Inflation Targets
This exhibit shows the effect of different inflation targets and gives a measure of how the
recent actual path of the FFR has differed from the prescription of our policy rule. The
policy rule paths are calculated using the actual FFR at the end of 2004. It also plots an
average over the three rules evaluated this cycle, with weights of 0.1, 0.7 and 0.2
respectively.
Exhibit D-5: FFR Distributions
In this exhibit we examine the distribution of the FFR under the 3 different policy rules
through the end of 2006. We also include the market distribution by assuming it has a
normal distribution centered at the market path from Exhibit B-5 with a standard
deviation derived from Exhibit B-6. The distribution is represented by a boxplot because
this allows more direct comparison of the implications of different policy rules. It
replaces the previous exhibits that showed the market volatility term structure compared
to one derived from the combination of our policy rules with the forecast distribution.
Source: MMS Function, FRBNY
FRBNY - cleared for release

FRBNY: Blackbook, September 19, 2005 Confidential(FR) Class II FOMC 59
Policy Rule: Baseline Specification
( ) ( )[ ]
GapOutput :xy/y PCE Core :π
0.51.5
5.1πy/y) PCE (Core 1.5π
0.4i
2.91i0.8
xππi1ii
t
t
x
π
*
*
2005Q2
tx*
tπ*
1tt
===
==
==
+−+−+= −
ϕϕ
ρϕϕρρ
Source: MMS function, FRBNY
FRBNY - cleared for release


FRBNY: Blackbook, September 19, 2005 Confidential(FR) Class II FOMC 64
Exhibit E-4. Unemployment Rates
This chart shows the monthly unemployment rate for New York State, New Jersey, New
York City, and the U.S. from 1992 to present.
Source: U.S. Bureau of Labor Statistics, New York State Dept. of Labor and the New
Jersey Department of Labor.
Data can be found at:
http://www.labor.state.ny.us/agency/pressrel/pruistat.htm
http://www.wnjpin.net/OneStopCareerCenter/LaborMarketInformation/lmi16/release1.ht
m
FRBNY - cleared for release
