fraud bribery and corruption survey 2012 - the new zealand...
TRANSCRIPT

FORENSIC
Fraud, Bribery and Corruption Survey
2012A report on the key findings
kpmg.com/nz
With contributions from

Acknowledgements
KPMG would like to take this opportunity to thank Dr Trevor Bradley and Dr Charles Sedgwick at the Institute of Criminology, Victoria University of Wellington, for analysing the survey results and providing their insights. We also gratefully acknowledge those people and organisations that took the time to respond to the 2012 survey. Without their support and participation this report would not have been possible.

CONTENTS
1 Foreword page 02
2 Executive summary page 04
3 They stole how much? page 08
4 The big jobs: cases of major fraud page 14
5 ‘Gotcha’: detection of major fraud page 18
6 Managing the risk of fraud page 28
7 Bribery and corruption page 36
8 About the survey page 40
9 Appendix A: page 43 Summary of all fraud incidents by type and perpetrator
Appendix B: page 43 Fraud prevention strategies
Appendix C: page 44 Fraud detection strategies
Appendix D: page 44 Fraud response strategies
KPMG NZ Forensic | Fraud, Bribery and Corruption Survey 2012 | 01

1 FOREWORD
Welcome to KPMG’s report on our 2012 Fraud Survey
Over the past 20 years, the biennial KPMG Fraud Survey has developed into one of the most credible and widely-quoted analyses of fraud among Australian and New Zealand organisations.
For the first time, the 2012 survey has separated the New Zealand-specific responses in order to provide a unique analysis of the New Zealand experience. (Previously, Australian and New Zealand responses have been aggregated and the combined results presented as an analysis of the Australasian experience).
The intention is to provide specific insight into fraud in New Zealand - at a time of growing national concern about both its extent and our ongoing ability to respond effectively to it.
02 | KPMG NZ Forensic | Fraud, Bribery and Corruption Survey 2012 | Foreword

A multi-billion dollar problem
In a recent speech to the New Zealand Institute of Directors, the former head of the Serious Fraud Office (SFO), Adam Feeley, estimated that New Zealand could expect an annual loss from fraud of between $2 and $8 billion. The seventh edition of the KPMG Fraud Barometer, based on fraud cases prosecuted between January 2012 and June 2012, reports that the value of large-scale fraud cases reached a record total of $1.7 billion. When one considers that this is a partial measure (in that it excludes unreported fraud, undetected fraud and frauds less than $100,000), the SFO’s projection of annual fraud losses appears on track.
Our ability to respond to and effectively manage fraud has also recently come under question. Adam Feeley stated that “enforcement and regulatory agencies had made the mistake of mopping up after… failed finance companies… it’s incredibly important that we act now, we act in a very coordinated fashion, and we act in respect of what we know to be the problem.”
A similar exhortation was issued in September 2012 by a visiting Canadian fraud expert. He warned of ‘the potential for huge amounts of fraud’ as the systems in place for the Christchurch rebuild following the 2010 earthquake ‘get stretched to the limit’. Adam Feeley concurred: “We have every reason to believe, unless New Zealand is some unique anomaly in the world, that post natural disaster you have fraud, and you have fraud on quite a big scale.1”
A new focus on bribery and corruption
Another key theme for 2012, seen in the light of the increasing dependence of New Zealand companies on international trade, is that organisations need to be ever more vigilant in the face of growing threats from bribery and corruption. In the 2012 KPMG New Zealand Fraud Survey, thirty-eight percent (38%) of respondent organisations did not have clear anti-bribery and corruption policies and procedures in place. The message from experts, well supported by the results of this survey, is clear. To mitigate the risks of fraud, bribery and corruption, all New Zealand organisations need to plan for, implement and/or improve their prevention, detection and response strategies. Seen in this light, the opportunity to offer a dedicated analysis of the New Zealand experience is thus timely and important.
Insights from the Survey findings
With over 140 New Zealand respondents, the 2012 survey has captured a good cross-section of organisations. While the results of the survey cannot be described as ‘representative’ of all incidents of fraud that occurred during the survey period, it does provide a unique and reliable insight into fraud as experienced by participating New Zealand organisations.
In brief, the results of this New Zealand- specific survey supplies detailed insight into contemporary fraud issues, including:
> The extent and the types of fraud affecting both private and public sectors
> The financial consequences of fraud
> The perpetrators of fraud and their motives
> Respondents’ perceptions of fraud
> How organisations respond to the discovery of fraud
> The strategies employed to prevent, control and mitigate the risks of fraud.
Due to the increased focus on bribery and corruption, both in New Zealand and around the world, a range of specific questions on these issues were incorporated into the 2012 survey.
We believe this report is essential reading for business leaders. We trust you will find it a useful tool in helping your organisation better manage the risk of fraud, bribery and corruption.
1 ‘Stamp out Christchurch fraud early’, New Zealand Herald, Sunday September 23, 2012.
KPMG NZ Forensic | Fraud, Bribery and Corruption Survey 2012 | Foreword | 03

2 EXECUTIVE SUMMARY
KPMG’s 2012 Fraud, Bribery and Corruption Survey reveals that fraud continues to be a growing problem in New Zealand. In the context of our previous surveys, the long-term trend of growing financial losses generated by fraud continues.
Furthermore, a range of indicators suggests the problem of fraud is one that will continue to escalate.
This latest survey analyses total reported losses from fraud that occurred between 1 February 2010 and January 31 2012.
04 | KPMG NZ Forensic | Fraud, Bribery and Corruption Survey 2012 | Executive summary
How big is the problem?
> The total amount reported as having been lost to fraud within the survey period was $18.26 million.
> This represents an increase of more than seven percent (7%) or $1.26 million since 2008.
> The average loss among those organisations that had experienced at least one incident of fraud was $433,721.
> Just over forty-eight percent (48%) of respondents experienced at least one incident of fraud.
> Of those organisations with more than 500 employees, almost two thirds (62%) experienced at least one incident of fraud. Of those organisations with 1000 or more employees, nearly eighty-six percent (86%) experienced at least one incident of fraud.
> Five respondents each experienced fraud losses exceeding $1 million during the survey period.
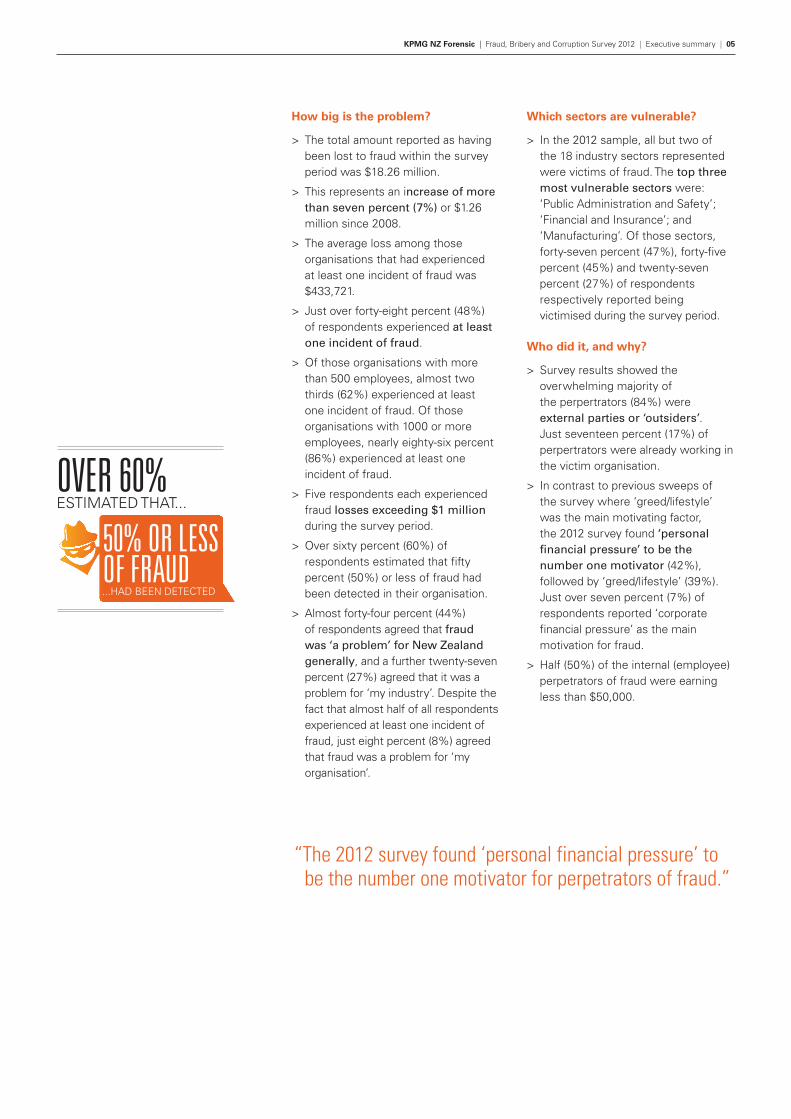
> Over sixty percent (60%) of respondents estimated that fifty percent (50%) or less of fraud had been detected in their organisation.
> Almost forty-four percent (44%) of respondents agreed that fraud was ‘a problem’ for New Zealand generally, and a further twenty-seven percent (27%) agreed that it was a problem for ‘my industry’. Despite the fact that almost half of all respondents experienced at least one incident of fraud, just eight percent (8%) agreed that fraud was a problem for ‘my organisation’.
Which sectors are vulnerable?
> In the 2012 sample, all but two of the 18 industry sectors represented were victims of fraud. The top three most vulnerable sectors were: ‘Public Administration and Safety’; ‘Financial and Insurance’; and ‘Manufacturing’. Of those sectors, forty-seven percent (47%), forty-five percent (45%) and twenty-seven percent (27%) of respondents respectively reported being victimised during the survey period.
Who did it, and why?
> Survey results showed the overwhelming majority of the perpertrators (84%) were external parties or ‘outsiders’. Just seventeen percent (17%) of perpertrators were already working in the victim organisation.
> In contrast to previous sweeps of the survey where ‘greed/lifestyle’ was the main motivating factor, the 2012 survey found ‘personal financial pressure’ to be the number one motivator (42%), followed by ‘greed/lifestyle’ (39%). Just over seven percent (7%) of respondents reported ‘corporate financial pressure’ as the main motivation for fraud.
> Half (50%) of the internal (employee) perpetrators of fraud were earning less than $50,000.
“The 2012 survey found ‘personal financial pressure’ to be the number one motivator for perpetrators of fraud.”
OVER 60%ESTIMATED THAT...
50% OR LESSOF FRAUD ...HAD BEEN DETECTED
KPMG NZ Forensic | Fraud, Bribery and Corruption Survey 2012 | Executive summary | 05

How was it discovered?
> Almost fifty percent (50%) of frauds were detected through the operation of internal controls. A further thirty-two percent (32%) of frauds were detected through reports received from internal and external sources.
> Fraud ‘red flags’ or warning signals were overlooked or ignored in almost twenty-one percent (21%) of major frauds.
> The average period of time taken to detect a major fraud was 202 days.
What do we know about bribery?
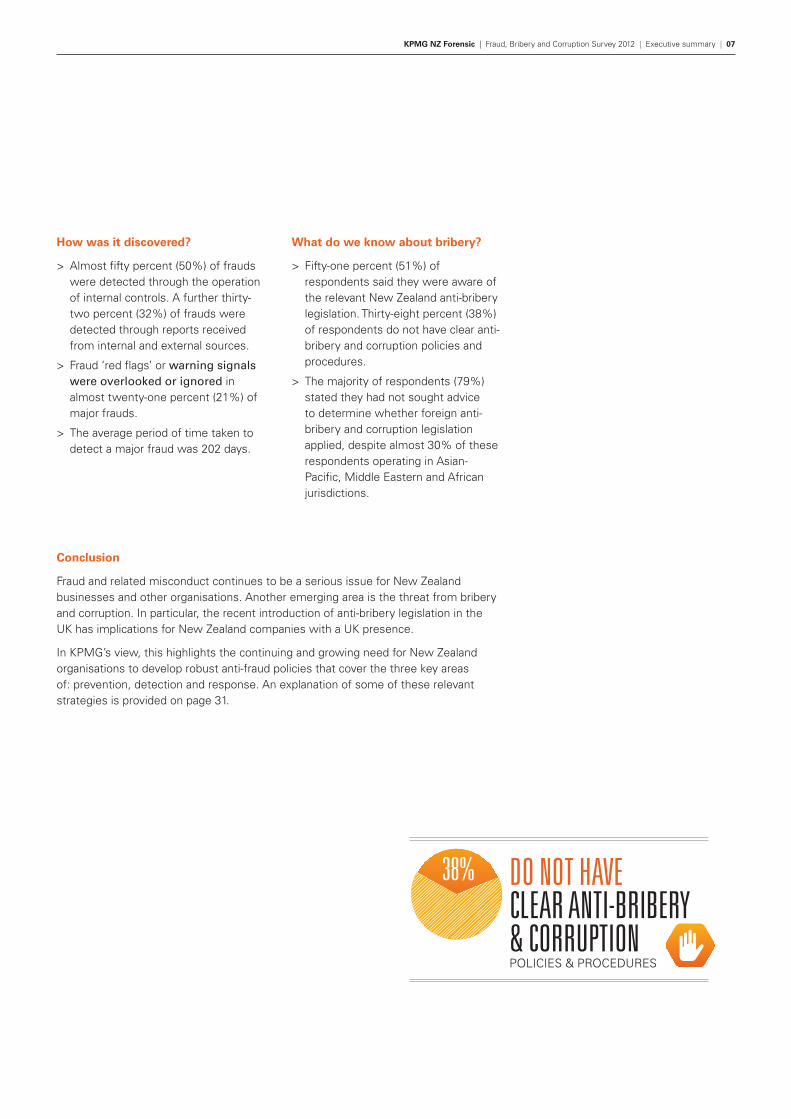
> Fifty-one percent (51%) of respondents said they were aware of the relevant New Zealand anti-bribery legislation. Thirty-eight percent (38%) of respondents do not have clear anti-bribery and corruption policies and procedures.
> The majority of respondents (79%) stated they had not sought advice to determine whether foreign anti-bribery and corruption legislation applied, despite almost 30% of these respondents operating in Asian-Pacific, Middle Eastern and African jurisdictions.
Conclusion
Fraud and related misconduct continues to be a serious issue for New Zealand businesses and other organisations. Another emerging area is the threat from bribery and corruption. In particular, the recent introduction of anti-bribery legislation in the UK has implications for New Zealand companies with a UK presence.
In KPMG’s view, this highlights the continuing and growing need for New Zealand organisations to develop robust anti-fraud policies that cover the three key areas of: prevention, detection and response. An explanation of some of these relevant strategies is provided on page 31.
DO NOT HAVE CLEAR ANTI-BRIBERY & CORRUPTION POLICIES & PROCEDURES
38%
KPMG NZ Forensic | Fraud, Bribery and Corruption Survey 2012 | Executive summary | 07

3THEY STOLE HOW MUCH?
The results of this survey clearly show that the financial losses associated with fraud are significant. Moreover, the effects of fraud are seldom confined to the victim organisation and often impose costs on the wider community. The victims of fraud include individuals, businesses, government and its agencies.
08 | KPMG NZ Forensic | Fraud, Bribery and Corruption Survey | They stole how much?
The size of the problem
Respondents to the 2012 survey reported a total of 1911 separate incidents of fraud for the survey period. The total value of these frauds amounted to $18.26 million. Set against the 2008 figure of $17 million, the total losses have increased by $1.26 million, or more than seven percent (7%). This shows the long term trend of growing financial losses generated by fraud continues.
The average loss per organisation experiencing at least one incident of fraud was $433,721. The average number of fraud incidents per organisation, including credit card fraud, was 46. Excluding credit card frauds, the average becomes 34 incidents per organisation. Whether one includes or excludes separate incidents of credit card fraud, this is a frequency rate that is unacceptably high.
Over a third of respondents (36%) did not have adequate fidelity insurance to cover the total cost of fraud detected.
Respondents experiencing fraud
Just over forty-eight percent (48%) of survey respondents reported experiencing at least one incident of fraud over the survey period. This compares to the forty-nine percent (49%) of respondents that reported at least one incident of fraud in the 2008 survey. Among private entities responding to the survey, forty-six percent (46%) reported at least one fraud; among public sector respondents sixty-one percent (61%) had experienced fraud.
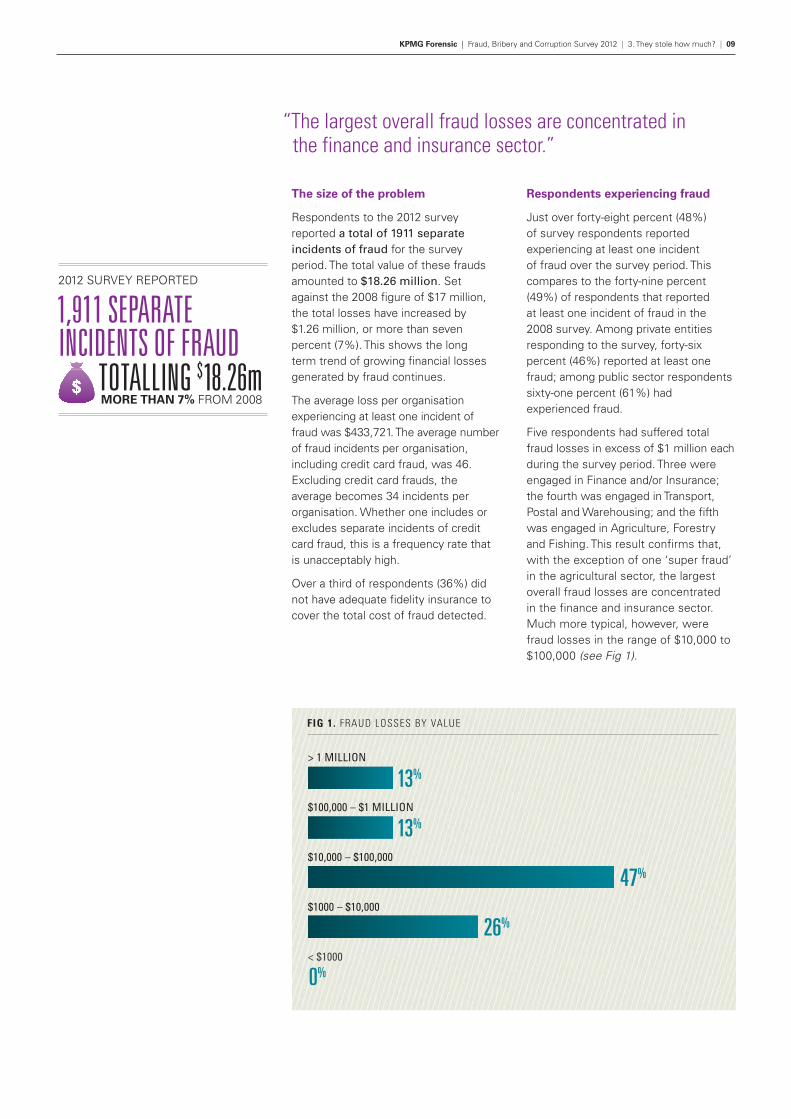
Five respondents had suffered total fraud losses in excess of $1 million each during the survey period. Three were engaged in Finance and/or Insurance; the fourth was engaged in Transport, Postal and Warehousing; and the fifth was engaged in Agriculture, Forestry and Fishing. This result confirms that, with the exception of one ‘super fraud’ in the agricultural sector, the largest overall fraud losses are concentrated in the finance and insurance sector. Much more typical, however, were fraud losses in the range of $10,000 to $100,000 (see Fig 1).
“The largest overall fraud losses are concentrated in the finance and insurance sector.”
13%
13%
47%
26%
0%
> 1 MILLION
$100,000 – $1 MILLION
$10,000 – $100,000
$1000 – $10,000
< $1000
FIG 1. FRAUD LOSSES BY VALUE
2012 SURVEY REPORTED
1,911 SEPARATE INCIDENTS OF FRAUD
TOTALLING $18.26m MORE THAN 7% FROM 2008
KPMG Forensic | Fraud, Bribery and Corruption Survey 2012 | 3. They stole how much? | 09
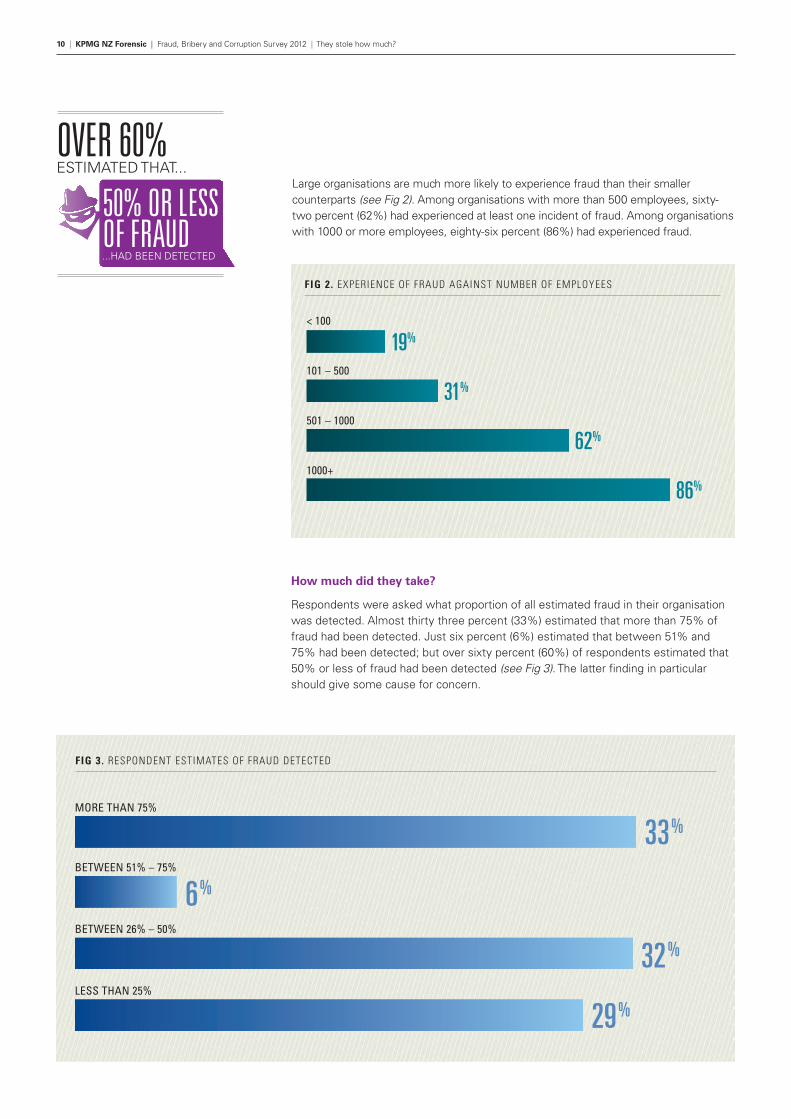
Large organisations are much more likely to experience fraud than their smaller counterparts (see Fig 2). Among organisations with more than 500 employees, sixty-two percent (62%) had experienced at least one incident of fraud. Among organisations with 1000 or more employees, eighty-six percent (86%) had experienced fraud.
How much did they take?
Respondents were asked what proportion of all estimated fraud in their organisation was detected. Almost thirty three percent (33%) estimated that more than 75% of fraud had been detected. Just six percent (6%) estimated that between 51% and 75% had been detected; but over sixty percent (60%) of respondents estimated that 50% or less of fraud had been detected (see Fig 3). The latter finding in particular should give some cause for concern.
19%
31%
62%
86%
< 100
101 – 500
501 – 1000
1000+
FIG 2. EXPERIENCE OF FRAUD AGAINST NUMBER OF EMPLOYEES
FIG 3. RESPONDENT ESTIMATES OF FRAUD DETECTED
33%
6%
32%
29%
MORE THAN 75%
BETWEEN 51% – 75%
BETWEEN 26% – 50%
LESS THAN 25%
OVER 60%ESTIMATED THAT...
50% OR LESSOF FRAUD ...HAD BEEN DETECTED
10 | KPMG NZ Forensic | Fraud, Bribery and Corruption Survey 2012 | They stole how much?

How do organisations perceive fraud?
Almost forty-four percent (44%) of respondents to the 2012 survey agreed that ‘fraud is a problem for New Zealand’. A further twenty-seven percent (27%) of respondents agreed that ‘fraud is a problem for my industry.’ However, just eight percent (8%) agreed that ‘fraud is a problem for my organisation’ and this represents a drop of nine percent (9%) on the 2008 figure.
Fraud is clearly perceived to be less of a problem ‘for my organisation’ than it is for ‘my industry’. The interesting point here is that the aggregate incidence of fraud has increased since 2008 – therefore casting doubt on the accuracy or reliability of these perceptions.
44% AGREED THAT
FRAUD IS A PROBLEM FOR NZ
PROBLEM FOR NEW ZEALAND
PROBLEM FOR MY INDUSTRY
PROBLEM FOR MY ORGANISATION
INEVITABLE COST OF DOING BUSINESS
FIG 4. RESPONDENT PERCEPTIONS OF FRAUD
26%
37%
67%
47%
30%
36%
25%
23%
44%
27%
8%
30%
Neither agree nor disagree AgreeDisagree
KPMG NZ Forensic | Fraud, Bribery and Corruption Survey 2012 | They stole how much? | 11


Who were the perpetrators?
The survey divided perpetrators of fraud into three separate categories: i) managers, (including senior executives and directors) ii) non-management and iii) external parties. Echoing earlier survey results, the 2012 results reveal that external parties are responsible for the overwhelming majority of total fraud losses experienced by the respondents in dollar terms. Management employees were responsible for less than five percent (5%) of the total losses attributable to fraud (see Fig 5).
“…external parties are responsible for the overwhelming majority of total fraud losses experienced by the respondents in dollar terms.”
Similarly, in terms of the number of incidents of fraud, external parties were responsible for the overwhelming majority; while management employees were responsible for a small minority (see Fig 5).
What type of fraud is being committed?
Appendix A (page 43) provides a summary of all fraud incidents, by type and perpetrator.
Measured by value, the main category of fraud committed by all three perpetrator types was Asset Misappropriation (theft of Cash and Non Cash). Measured by number of incidents, however, credit card fraud exceeded all other fraud types. Credit card fraud is categorised as Asset Misappropriation (Financial).
EXTERNAL PARTIES
NON-MANAGEMENT
MANAGEMENT
FIG 5. FRAUD LOSSES AND INCIDENTS BY PERPETRATOR
84%
12%
4%
75%
17%
8%
Fraud incidentsFraud losses
KPMG NZ Forensic | Fraud, Bribery and Corruption Survey 2012 | They stole how much? | 13
4THE BIG JOBS: CASES OF MAJOR FRAUD
To better understand the consequences of fraud, the factors that contribute to it and the ways in which it is detected and dealt with, we asked respondents to tell us more about the most significant fraud they had experienced. We refer to these frauds as ‘major fraud’ i.e. the single largest individual incident of fraud (measured by value) that had been detected in an organisation during the survey period.
14 | KPMG NZ Forensic | Fraud, Bribery and Corruption Survey 2012 | The big jobs: cases of major fraud

Major frauds by type
At a total value of $4,367,000, Asset Misappropriation (Theft of Cash) was the major fraud type that generated the greatest loss. The average loss incurred was $363,916.
Corruption generated the second greatest loss by fraud type, due to one incident being valued at $1.5 million.2
Who are the big-time fraudsters?
As outlined earlier in this report, New Zealand businesses are most vulnerable to external fraud committed by third or external parties. However the picture is different when it comes to major fraud. Figure 6 clearly illustrates that the perpetrators of major frauds are much more likely to come from within the organisation. In the period covered by the 2012 survey over eighty-nine percent (89%) of major frauds were committed by either non-management or management employees; in other words ‘insiders’.
2 This incident was reported by the respondent as the largest incident of fraud. However, on closer inspection of the respondent’s description (‘Inappropriate selection of third party distributors’) it was actually an example of corruption.
EXTERNAL PARTIES
NON-MANAGEMENT
MANAGEMENT
FIG 6. MAJOR FRAUD LOSSES AND INCIDENTS BY PERPETRATOR
10%
11%
63%
64%
26%
26%
Major fraud incidentsMajor fraud losses
KPMG NZ Forensic | Fraud, Bribery and Corruption Survey 2012 | The big jobs: cases of major fraud | 15

3 KPMG – Forensic (2008) ‘Fraud Survey, 2008: A New Zealand Perspective’. Whenever New Zealand specific data is presented from 2006 and/or 2008, this is the source of the data. No percentage figures were available for 2008 so motivating factors are ranked in order.
PERSONAL FINANCIAL PRESSURE
GREED / LIFESTYLE
OTHER
CORPORATE FINANCIAL PRESSURE
FIG 7. VALUE OF MAJOR FRAUD BY MOTIVATION
80%
12%
7%
1%
PERSONAL FINANCIAL PRESSURE
OTHER
GREED / LIFESTYLE
CORPORATE FINANCIAL PRESSURE
GAMBLING
SUBSTANCE ABUSE
FIG 8. AVERAGE VALUE OF MAJOR FRAUD BY MOTIVATION
$309,346
$83,008
$52,561
$40,000
$0
$0
TABLE 1: RANKING OF MOTIVATING FACTORS (BY PERCENTAGE OF FRAUD INCIDENTS)
SINGLE MOST IMPORTANT MOTIVATING FACTOR
2012 (NEW ZEALAND) 2012 (NEW ZEALAND & AUSTRALIA) 2008 (NEW ZEALAND)
FREQUENCY RANKING FREQUENCY RANKING RANKING3
PERSONAL FINANCIAL PRESSURE 42% #1 30% #2 #4
GREED/LIFESTYLE 39% #2 31% #1 #1
OTHER 12% #3 30% #2 #5
CORPORATE FINANCIAL PRESSURE 7% #4 6% #3 #3
GAMBLING - - 2% #4 #2
SUBSTANCE ABUSE - - 1% #5 -
16 | KPMG NZ Forensic | Fraud, Bribery and Corruption Survey 2012 | The big jobs: cases of major fraud

The motive for fraud
As can be seen in Table 1, when the results of the 2012 and 2008 New Zealand surveys are compared, ‘greed/lifestyle’ has been replaced by ‘personal financial pressure’ as the number one ranked motivating factor for committing fraud.
A number of explanations for the rise of ‘personal financial pressure’ have been suggested and include the impact of the general recessionary economic environment.
In the 2012 survey, ‘greed/lifestyle’ replaced ‘gambling’ as the second most important motivating factor. Between 2008 and 2012 ‘corporate financial pressure’ dropped one place in the ranking.
Among the motivations included under the category of ‘other’ were: ‘unknown’, ‘employee thought they were getting insufficient remuneration’ and ‘personal sense of importance’.
In 2008 frauds involving personal financial pressure had a higher incident rate but were generally of a lower value. In contrast, the results of the 2012 survey reveal that the incidence of personal financial pressure and greed/lifestyle were similar but the value of incidents motivated by personal financial pressure were, on average, substantially higher in value.
Collusion
In line with the results of previous surveys, the 2012 results reveal that in three quarters of the reported cases, employees who committed fraud acted alone. The results lend themselves to the suggestion that individual employees ought not to be invested with multiple duties that facilitate greater opportunities for fraud. Segregation of duties would, at the same time, allow for greater transparency but would be dependent upon sufficient scrutiny being applied to those who do work alone.
FIG 9. MAJOR FRAUD INVOLVING COLLUSION
75%
ACTED ALONE
2%
7%
16% TWO PEOPLE INVOLVED
THREE PEOPLE INVOLVED
FOUR OR MORE PEOPLE INVOLVED
KPMG NZ Forensic | Fraud, Bribery and Corruption Survey 2012 | The big jobs: cases of major fraud | 17

5‘GOTCHA’: DETECTION OF MAJOR FRAUD
The predominant method of fraud detection was the application of internal controls. The results of the 2012 survey show that when compared to 2008, this method of detection has increased markedly from 29% to almost 50% of cases. This suggests either a significant improvement in such controls and/or an increase in their effective application (see Fig 10).
18 | KPMG NZ Forensic | Fraud, Bribery and Corruption Survey 2012 | ‘Gotcha’: detection of major fraud

How was major fraud detected
In the 2012 New Zealand sample, it is interesting to note just twenty-five percent (25%) of fraud cases were detected through a combination of notification by employee and/or anonymous letter/call. This may be linked to the low level of understanding of fraud reporting arrangements among employees. Or it may reflect the fact that twenty-six percent (26%) of respondent organisations do not have a clear definition of fraud. The results of the 2012 survey reveal that seventy-nine percent (79%) of respondents either
had no understanding of the reporting arrangements or were unsure of them.
Since 2008 there has been a significant decrease, from 26% to just 6%, in the number of fraud cases detected via notification by external parties. Finally, internal audit, a method of detection that one might have expected to reveal a large volume of incidents of fraud, was in fact responsible for the detection of just eleven percent (11%) of all fraud cases in 2012, down from twelve percent (12%) in 2008.
“…the predominant method of fraud detection was the application of internal controls.”
FIG 10. MAJOR FRAUD: METHODS OF DETECTION
2008 NZ 2012 NZ and Australia 2012 NZ
OTHER
EXTERNAL AUDIT
FRAUD DETECTION PROCEDURE
ANONYMOUS LETTER / CALL
NOTIFICATION BY EXTERNAL PARTY
INTERNAL AUDIT
NOTIFICATION BY EMPLOYEE
INTERNAL CONTROLS
7%
9%
0%0%0%
10%
2%
4%
0%
8%
6%4%
6%
26%
10%
11%
12%
6%
20%
21%
22%
49%
29%
40%
KPMG NZ Forensic | Fraud, Bribery and Corruption Survey 2012 | ‘Gotcha’: detection of major fraud | 19

Finding them takes time
Respondents to the 2012 survey report that, on average, major frauds continued for 202 days before being detected. When broken down into internal and external perpetrators, frauds committed by the former continued for an average of 201 days before being detected and 206 days for the latter.
Ignore red flags at your peril
Early warnings or indicators of fraud can be thought of as ‘red flags’. Within the 2012 New Zealand sample almost twenty-one percent (21%) of respondents reported that early warning signals or ‘red flags’ were overlooked or ignored; while a further thirty percent (30%) of respondents were not sure.
When combined with the relatively low number of frauds detected by employees, the two findings suggest that organisations should review the delivery and content of fraud awareness training in an attempt to improve the capacity of staff to identify and respond effectively to ‘red flags’.
The most common or early warning flags not acted upon included:
> Anomalies in sales transactions
> An employee being protective of their area of the business
> Incomplete or late progress in work activity and reporting
> Inventory discrepancies
> Dissatisfaction from restructuring
> Complaints ignored about a contractor
> Lack of authentication of normal business practice
> Contractors inflating contract requirements beyond what was already provided for
> Unverified use of customer account.
What about getting the money back
As illustrated in Figure 12, over fifty percent (50%) of respondents recovered none of the fraud losses and a further nineteen percent (19%) achieved partial. Clearly, then, the chances of recovering monies lost to fraud are poor. This issue is further highlighted by the finding that a significant minority of respondents (36%) reported having no fidelity insurance to cover those fraud losses.
20 | KPMG NZ Forensic | Fraud, Bribery and Corruption Survey 2012 | ‘Gotcha’: detection of major fraud

FIG 11. WERE RED FLAGS IGNORED?
FIG 13. SOURCES OF RECOVERED FUNDS (FULL AND PARTIAL)
INSURANCE
PERPETRATOR
THIRD PARTY
17%
0%
60%
17%
67%
40%
Partial recoveryFull recovery
FIG 12. WHAT FRAUD LOSSES WERE RECOVERED?
FULL RECOVERY
PARTIAL RECOVERY
NIL RECOVERY
26%
19%
55%
YES
NO
UNSURE
21%
21%
51%
30%
49%
28%
2012 NZ and Australia2012 NZ
KPMG NZ Forensic | Fraud, Bribery and Corruption Survey 2012 | ‘Gotcha’: detection of major fraud | 21
POOR INTERNAL CONTROLS AND THE OVERRIDING OF THESE CONTROLS WERE THE TWO MAIN FACTORS THAT
ALLOWED FRAUD TO OCCUR
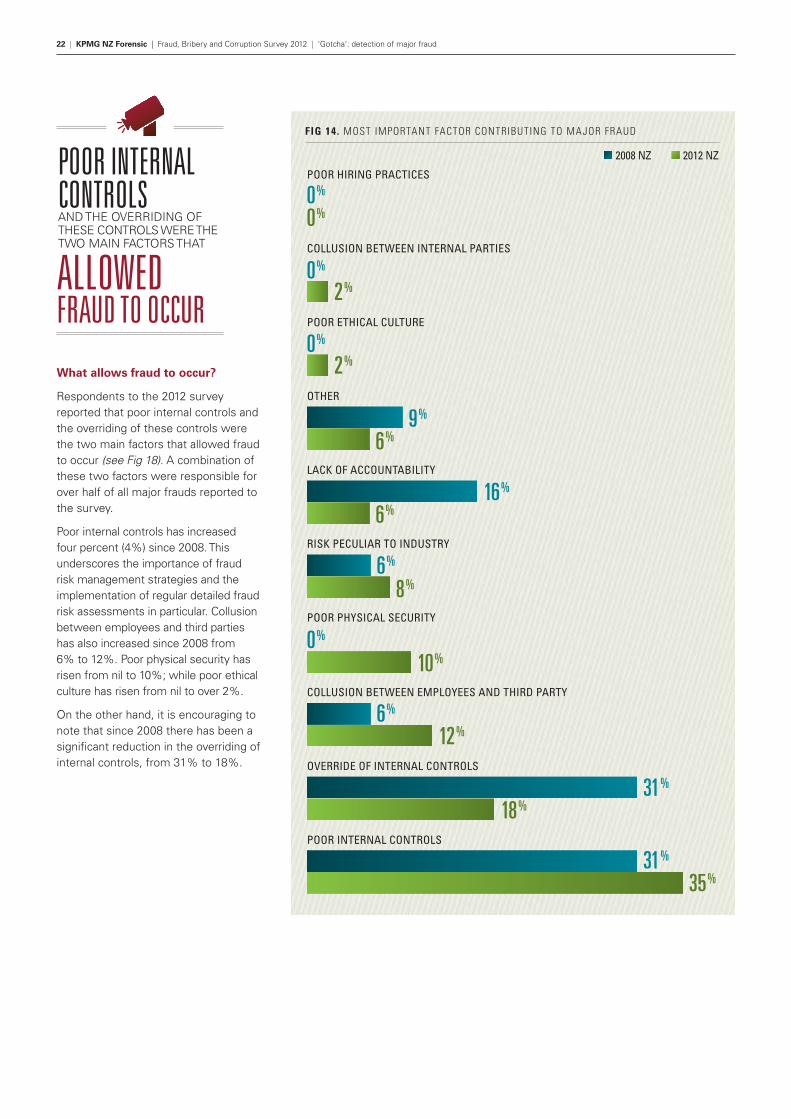
What allows fraud to occur?
Respondents to the 2012 survey reported that poor internal controls and the overriding of these controls were the two main factors that allowed fraud to occur (see Fig 18). A combination of these two factors were responsible for over half of all major frauds reported to the survey.
Poor internal controls has increased four percent (4%) since 2008. This underscores the importance of fraud risk management strategies and the implementation of regular detailed fraud risk assessments in particular. Collusion between employees and third parties has also increased since 2008 from 6% to 12%. Poor physical security has risen from nil to 10%; while poor ethical culture has risen from nil to over 2%.
On the other hand, it is encouraging to note that since 2008 there has been a significant reduction in the overriding of internal controls, from 31% to 18%.
COLLUSION BETWEEN INTERNAL PARTIES
POOR HIRING PRACTICES
POOR ETHICAL CULTURE
OTHER
LACK OF ACCOUNTABILITY
RISK PECULIAR TO INDUSTRY
POOR PHYSICAL SECURITY
COLLUSION BETWEEN EMPLOYEES AND THIRD PARTY
OVERRIDE OF INTERNAL CONTROLS
POOR INTERNAL CONTROLS
FIG 14. MOST IMPORTANT FACTOR CONTRIBUTING TO MAJOR FRAUD
2%
2%
0%
0%
0%
0%
0%
9%
16%
6%
6%
31%
31%
6%
6%
8%
12%
18%
35%
10%
2012 NZ2008 NZ
22 | KPMG NZ Forensic | Fraud, Bribery and Corruption Survey 2012 | ‘Gotcha’: detection of major fraud
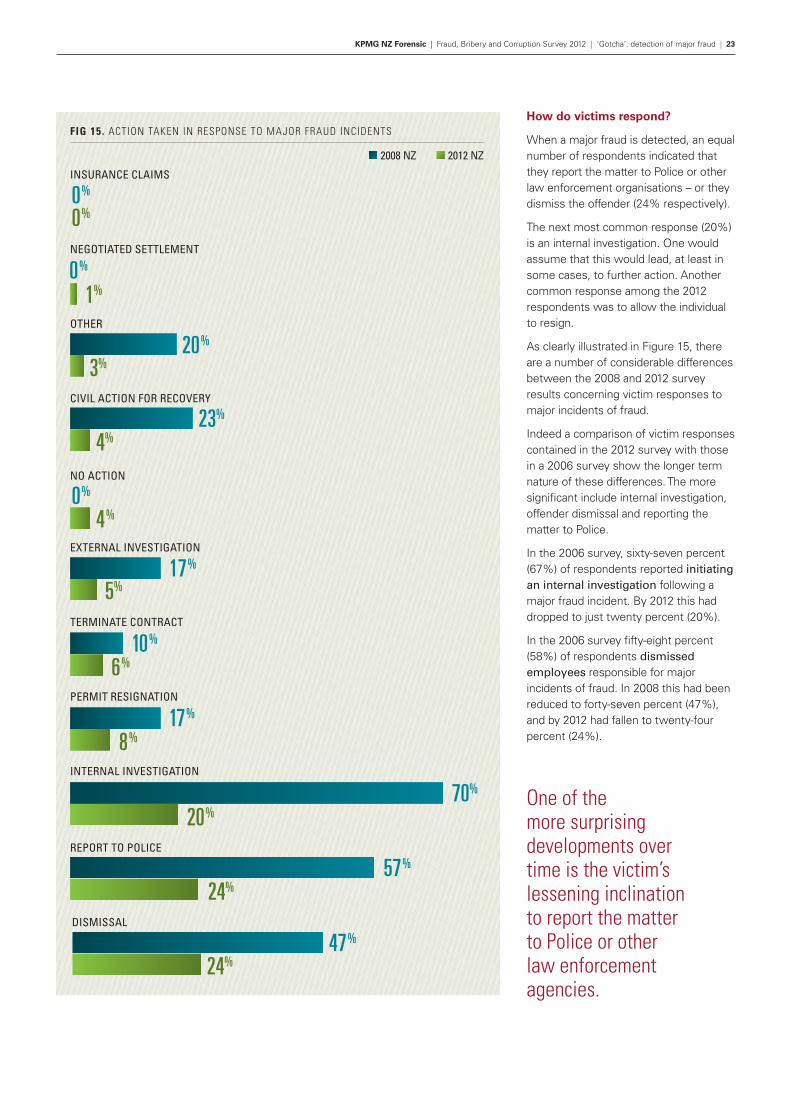
How do victims respond?
When a major fraud is detected, an equal number of respondents indicated that they report the matter to Police or other law enforcement organisations – or they dismiss the offender (24% respectively).
The next most common response (20%) is an internal investigation. One would assume that this would lead, at least in some cases, to further action. Another common response among the 2012 respondents was to allow the individual to resign.
As clearly illustrated in Figure 15, there are a number of considerable differences between the 2008 and 2012 survey results concerning victim responses to major incidents of fraud.
Indeed a comparison of victim responses contained in the 2012 survey with those in a 2006 survey show the longer term nature of these differences. The more significant include internal investigation, offender dismissal and reporting the matter to Police.
In the 2006 survey, sixty-seven percent (67%) of respondents reported initiating an internal investigation following a major fraud incident. By 2012 this had dropped to just twenty percent (20%).
In the 2006 survey fifty-eight percent (58%) of respondents dismissed employees responsible for major incidents of fraud. In 2008 this had been reduced to forty-seven percent (47%), and by 2012 had fallen to twenty-four percent (24%).
One of the more surprising developments over time is the victim’s lessening inclination to report the matter to Police or other law enforcement agencies.
NEGOTIATED SETTLEMENT
INSURANCE CLAIMS
OTHER
CIVIL ACTION FOR RECOVERY
NO ACTION
EXTERNAL INVESTIGATION
TERMINATE CONTRACT
PERMIT RESIGNATION
INTERNAL INVESTIGATION
REPORT TO POLICE
DISMISSAL
FIG 15. ACTION TAKEN IN RESPONSE TO MAJOR FRAUD INCIDENTS
1%
3%
0%
20%
0%
0%
0%
23%
17%
10%
17%
70%
57%
47%
4%
4%
5%
8%
20%
24%
24%
6%
2012 NZ2008 NZ
KPMG NZ Forensic | Fraud, Bribery and Corruption Survey 2012 | ‘Gotcha’: detection of major fraud | 23

In 2006 eighty-three percent (83%) of respondents reported major fraud incidents to Police. By 2008 this had fallen to fifty-seven percent (57%), and by 2012 was just twenty-four percent (24%).
When the 2012 respondents were asked why they did not report the matter to Police, forty-one percent (41%) cited ‘minor incident’ as the reason. Other reasons which accounted for almost a third were ‘lack of evidence’, and ‘belief that no action would be taken if reported’.
When the fraud involved sums of $50,000 or above, however, forty-seven percent (47%) of victim organisations reported the matter to Police. Yet it is still something of a surprise to discover that less than half of all victims adopted this course of action.
There are also differences in the inclination to report to Police, depending on who the perpetrator is. Only a third of management employee perpetrators are reported; while the figure is even lower for external parties, at seventeen percent (17%). Non-management employees have a 50/50 chance of being reported to the Police.
Regardless of whether or not the Police can resolve the matter, or recover the monies lost to fraud, it is nonetheless important to report such incidents. This has the benefit of: increasing public awareness of the problem; avoiding underestimation of both the frequency and extent of fraud losses; and to ensure organisations do not employ individuals that have defrauded previous employers.
MINOR INCIDENT
LACK OF EVIDENCE
INVESTIGATION IN PROGRESS
OTHER
MONEY / PROPERTY RETURNED / RECOVERED
BELIEF NO ACTION WOULD BE TAKEN IF REPORTED / PROCESS TOO LONG
CONCERN ABOUT RESOURCES REQUIRED
CONCERN ABOUT ADVERSE PUBLICITY
FIG 16. REASONS FOR NOT REPORTING A MAJOR FRAUD INCIDENT TO POLICE
26%
23%
5%
23%
0%
9%
0%
0%
41%
24 | KPMG NZ Forensic | Fraud, Bribery and Corruption Survey 2012 | ‘Gotcha’: detection of major fraud

Known prior conduct
How much does it cost to investigate fraud?
Among the largest reported frauds, victim organisations spent an average of $66,000 investigating the fraud. This represents just under one percent (1%) of the amount lost. On average, respondent organisations spent 61 internal working hours investigating each major fraud.
Damage to reputations
Reputational damage is an often-overlooked consequence of fraud. In the 2012 survey, respondents were asked whether any major incidents of fraud had damaged the organisation’s reputation. While the overwhelming majority of respondents reported that there had been no significant reputational damage; seven percent (7%) did report that damage had been caused, with half of these respondents reporting major reputational damage.
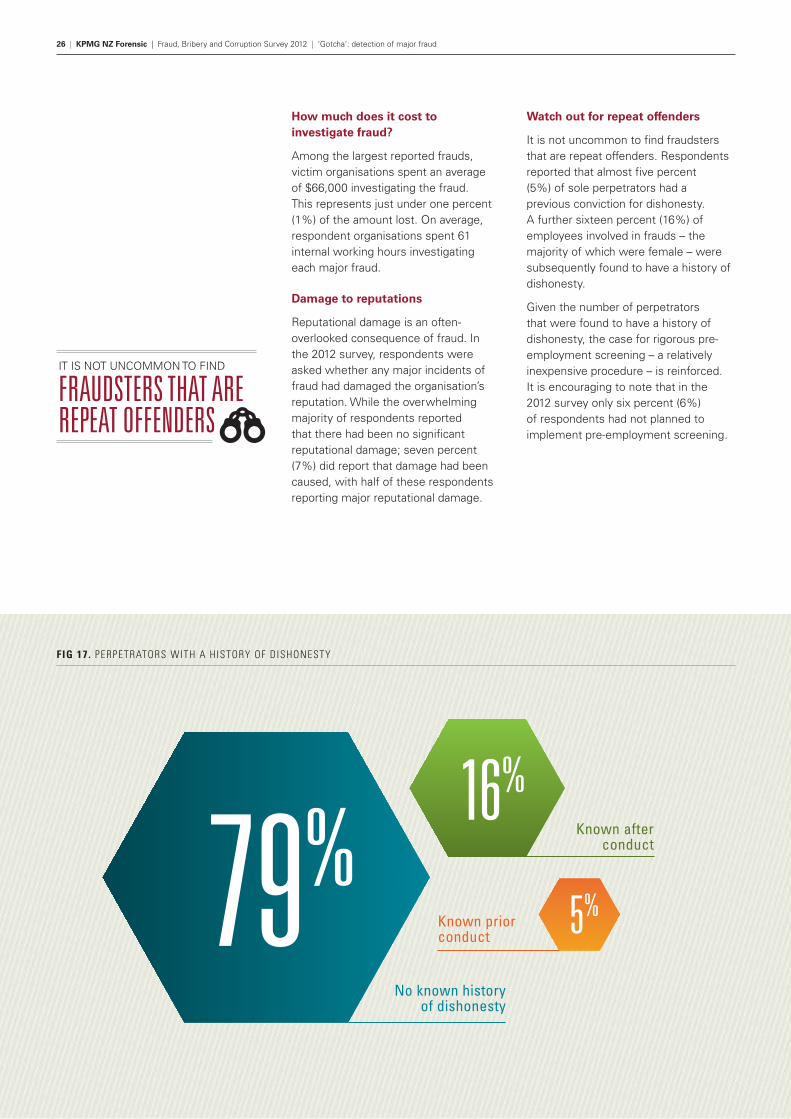
Watch out for repeat offenders
It is not uncommon to find fraudsters that are repeat offenders. Respondents reported that almost five percent (5%) of sole perpetrators had a previous conviction for dishonesty. A further sixteen percent (16%) of employees involved in frauds – the majority of which were female – were subsequently found to have a history of dishonesty.
Given the number of perpetrators that were found to have a history of dishonesty, the case for rigorous pre-employment screening – a relatively inexpensive procedure – is reinforced. It is encouraging to note that in the 2012 survey only six percent (6%) of respondents had not planned to implement pre-employment screening.
IT IS NOT UNCOMMON TO FIND
FRAUDSTERS THAT ARE REPEAT OFFENDERS
FIG 17. PERPETRATORS WITH A HISTORY OF DISHONESTY
16%Known after
conduct
79%5%
No known history of dishonesty
26 | KPMG NZ Forensic | Fraud, Bribery and Corruption Survey 2012 | ‘Gotcha’: detection of major fraud
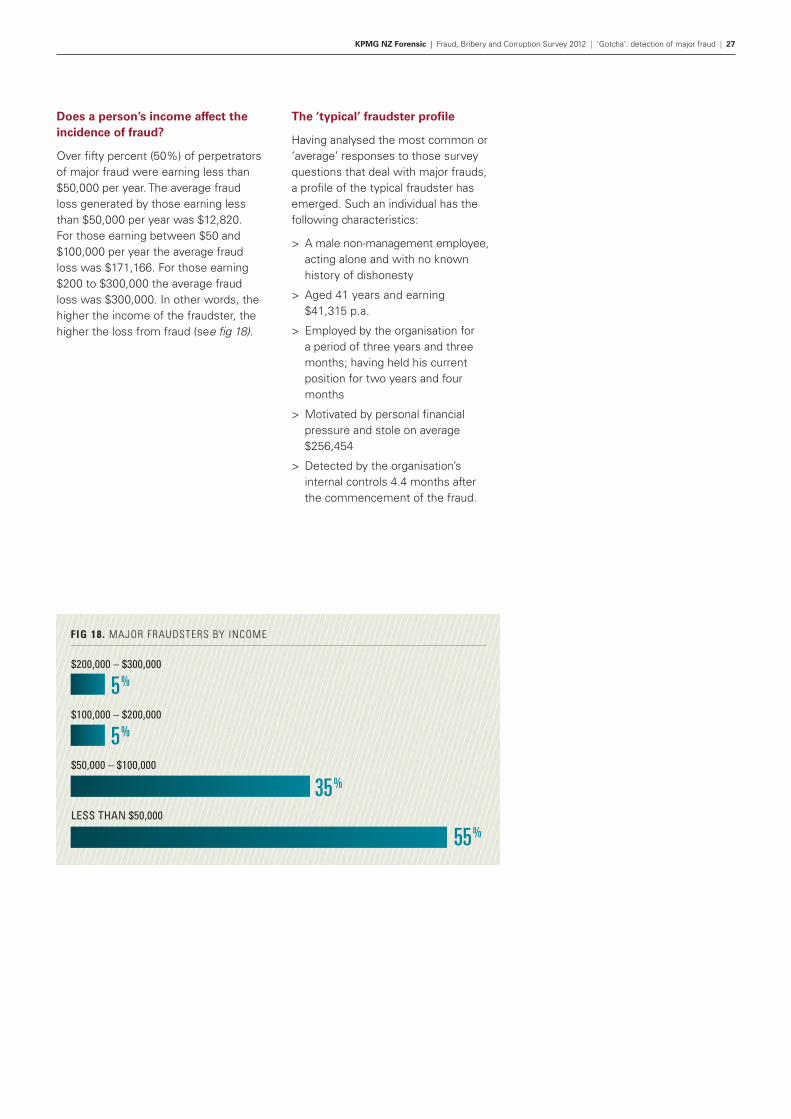
Does a person’s income affect the incidence of fraud?
Over fifty percent (50%) of perpetrators of major fraud were earning less than $50,000 per year. The average fraud loss generated by those earning less than $50,000 per year was $12,820. For those earning between $50 and $100,000 per year the average fraud loss was $171,166. For those earning $200 to $300,000 the average fraud loss was $300,000. In other words, the higher the income of the fraudster, the higher the loss from fraud (see fig 18).
The ‘typical’ fraudster profile
Having analysed the most common or ‘average’ responses to those survey questions that deal with major frauds, a profile of the typical fraudster has emerged. Such an individual has the following characteristics:
> A male non-management employee, acting alone and with no known history of dishonesty
> Aged 41 years and earning $41,315 p.a.
> Employed by the organisation for a period of three years and three months; having held his current position for two years and four months
> Motivated by personal financial pressure and stole on average $256,454
> Detected by the organisation’s internal controls 4.4 months after the commencement of the fraud.
FIG 18. MAJOR FRAUDSTERS BY INCOME
$200,000 – $300,000
$50,000 – $100,000
$100,000 – $200,000
LESS THAN $50,000
5%
5%
35%
55%
KPMG NZ Forensic | Fraud, Bribery and Corruption Survey 2012 | ‘Gotcha’: detection of major fraud | 27

6MANAGING THE RISK OF FRAUD
Awareness of potential fraud is only the starting point. Responsible and well-managed organisations will implement robust and effective policies and procedures to prevent, detect and respond to both internal and external incidents of fraud.
In this context, we asked respondents: who managed the risk of fraud; in which business unit this took place; and how they responded to actual and suspected frauds.
28 | KPMG NZ Forensic | Fraud, Bribery and Corruption Survey 2012 | Managing the risk of fraud

Who is responsible for managing fraud risk?
As shown in Figure 19, typically senior management are responsible for managing fraud risk. Over fifty percent (50%) of respondents reported that the responsibility resides with the Chief Financial Officer and/or Finance Director. The second most common response (20%) was Head of Internal Audit.
FIG 19. RESPONSIBIL ITY FOR FRAUD RISK MANAGEMENT BY POSITION (TOTAL DOES NOT ADD UP TO 100% DUE TO THE POSSIBIL ITY OF MULTIPLE SELECTIONS)
53%
20%
16%
7%
5%
2%
2%
2%
Chief Financial Officer / Finance Director
C.E.O / Managing Director
Other
Chief Security Officer
Head of Internal Audit
Risk Officer
Compliance Manager
Accountant
KPMG Forensic | Fraud, Bribery and Corruption Survey 2012 | 6. Managing the risk of fraud | 29

Figure 20 shows the business units/divisions within organisations that respondents nominated as being primarily responsible for managing the risk of fraud and responding to it. Overwhelmingly, these responsibilities reside with finance units/divisions.
Respondents were also asked whether the person responsible for managing fraud risk had a formal fraud management or investigation qualification. Just one in ten has such a qualification. In recognition of such low numbers of suitably qualified managers and/or investigators, organisations need to think about either up-skilling those staff responsible for fraud management or bring in suitably qualified employees.
FIG 20. BUSINESS UNIT RESPONSIBLE FOR FRAUD
57%
13%
Finance
Management
9% Internal Audit
1%
3%Other
Legal
16% Risk / Compliance
30 | KPMG NZ Forensic | Fraud, Bribery and Corruption Survey 2012 | Managing the risk of fraud

What can organisations do to mitigate fraud risk?
In KPMG’s view, an effective approach to fraud risk management should focus on controls with three key objectives:
> Prevention: controls designed to reduce the risk of fraud
> Detection: controls designed to uncover fraud when it occurs
> Response: controls designed to facilitate corrective action and harm minimisation.
Organisations will generally require a range of strategies to meet these objectives and mitigate the risk of fraud. Responsible and well-managed organisations will have a dynamic approach to fraud risk management which will be ‘built in’ to their overall approach to governance, risk and compliance.
Increasingly, organisations are leveraging IT to analyse data collected in the ordinary course of business to identify indicators of fraud, and have an appropriate response mechanism to analyse and confirm these suspicions. ‘Fraud stress testing’ (a controlled attempt to perpetrate fraud) is an emerging strategy used to test the operating effectiveness of fraud controls, particularly for those organisations where manual controls are key to the prevention and detection of fraud.
These strategies, combined with traditional strategies such as fraud awareness training and the implementation of anonymous reporting channels, can substantially assist with managing the risk of fraud.
Respondent organisations have adopted a range of strategies for preventing fraud (Appendix B, page 43). In only three of the identified strategies – ‘enforced job rotation’, ‘perform screening of employees on promotion/transfer’ and ‘conduct fraud awareness training’ – are there a significant number of respondent organisations that are yet to implement the measures concerned. Of some concern is the fact that between 2008 and 2012 the percentage of respondent organisations that have implemented a ‘fraud control strategy’ has decreased from seventy-eight percent (78%) to fifty-one percent (51%). Similarly, the percentage of respondent organisations that had ‘fraud risk assessments’ has decreased from eighty-two percent (82%) in 2008 to sixty-eight percent (68%) in 2012.
‘FRAUD STRESS TESTING’ IS AN EMERGING STRATEGY USED TO
TEST THE OPERATING EFFECTIVENESS OF FRAUD CONTROLS
KPMG NZ Forensic | Fraud, Bribery and Corruption Survey 2012 | Managing the risk of fraud | 31

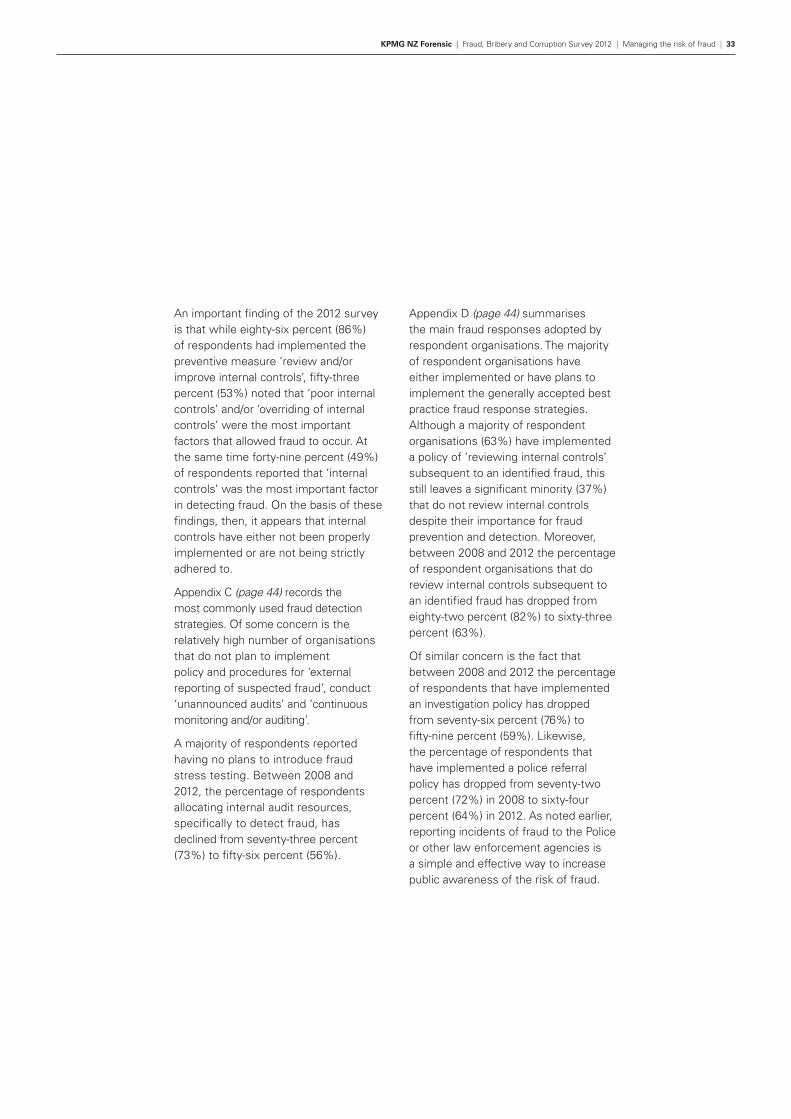
An important finding of the 2012 survey is that while eighty-six percent (86%) of respondents had implemented the preventive measure ‘review and/or improve internal controls’, fifty-three percent (53%) noted that ‘poor internal controls’ and/or ‘overriding of internal controls’ were the most important factors that allowed fraud to occur. At the same time forty-nine percent (49%) of respondents reported that ‘internal controls’ was the most important factor in detecting fraud. On the basis of these findings, then, it appears that internal controls have either not been properly implemented or are not being strictly adhered to.
Appendix C (page 44) records the most commonly used fraud detection strategies. Of some concern is the relatively high number of organisations that do not plan to implement policy and procedures for ‘external reporting of suspected fraud’, conduct ‘unannounced audits’ and ‘continuous monitoring and/or auditing’.
A majority of respondents reported having no plans to introduce fraud stress testing. Between 2008 and 2012, the percentage of respondents allocating internal audit resources, specifically to detect fraud, has declined from seventy-three percent (73%) to fifty-six percent (56%).
Appendix D (page 44) summarises the main fraud responses adopted by respondent organisations. The majority of respondent organisations have either implemented or have plans to implement the generally accepted best practice fraud response strategies. Although a majority of respondent organisations (63%) have implemented a policy of ‘reviewing internal controls’ subsequent to an identified fraud, this still leaves a significant minority (37%) that do not review internal controls despite their importance for fraud prevention and detection. Moreover, between 2008 and 2012 the percentage of respondent organisations that do review internal controls subsequent to an identified fraud has dropped from eighty-two percent (82%) to sixty-three percent (63%).
Of similar concern is the fact that between 2008 and 2012 the percentage of respondents that have implemented an investigation policy has dropped from seventy-six percent (76%) to fifty-nine percent (59%). Likewise, the percentage of respondents that have implemented a police referral policy has dropped from seventy-two percent (72%) in 2008 to sixty-four percent (64%) in 2012. As noted earlier, reporting incidents of fraud to the Police or other law enforcement agencies is a simple and effective way to increase public awareness of the risk of fraud.
KPMG NZ Forensic | Fraud, Bribery and Corruption Survey 2012 | Managing the risk of fraud | 33

36% 36% 25%4%
53% 17%20% 10%
83%
75% 11% 11% 4%
65%
NUMBER OF EMPLOYEES: <100
NUMBER OF EMPLOYEES: <101-500
NUMBER OF EMPLOYEES: <501-1000
NUMBER OF EMPLOYEES: <1001-10000
NUMBER OF EMPLOYEES: +10000
FIG 22. DOES YOUR ORGANISATION HAVE A FORMAL POLICY/PROCEDURE FOR REPORTING FRAUD?
Yes No Unsure N/A
NUMBER OF EMPLOYEES: <100
NUMBER OF EMPLOYEES: 101-500
NUMBER OF EMPLOYEES: 501-1000
NUMBER OF EMPLOYEES: 1001-10000
NUMBER OF EMPLOYEES: 10000+
FIG 23. FORMAL POLICY FOR PROTECTION OF WHISTLEBLOWERS AGAINST SIZE OF ORGANISATION
36%
58%
73%
83%
96%
24%
17%
42%
64%
NoYes
4%
17%
4% 26% 4%
FIG 21. MOST FAVOURED FRAUD REPORTING CHANNELS (TOTAL DOES NOT ADD UP TO 100% DUE TO THE POSSIBIL ITY OF MULTIPLE SELECTIONS)
14% Other
38%Mail
14% FaxTelephone50%
50% E-mail
6% Web
34 | KPMG NZ Forensic | Fraud, Bribery and Corruption Survey 2012 | Managing the risk of fraud

Fraud reporting channels
In the 2012 survey, the telephone (50%) and e-mail (50%) were the most favoured channels for reporting suspected fraud, bribery and misconduct. Interestingly, thirty-eight percent (38%) of respondents still favour mail as a reporting channel. A majority of those respondents that indicated ‘Other’ favoured face-to-face communication (see Fig 21).
Consistent with the findings of previous surveys, the existence of formal fraud reporting policies and procedures is positively correlated with the size of the workforce (see Fig 22).
In common with the trend for formal fraud reporting policies and procedures, larger organisations are also much more likely to have formal policies for the protection of whistleblowers. If smaller organisations are to take advantage of employee information regarding the occurrence of fraud, they should be encouraged to adopt similar policies for the protection of whistleblowers (see Fig 23).

7BRIBERY AND CORRUPTION
In the 2011 KPMG Global Anti-Bribery and Corruption Survey, corruption was described as ‘a global problem that plagues developing and mature countries alike.’ The 2011 Transparency International Annual Report provides an illustration of the growing extent of the problem when it cites US research which found that, in the 12 months between 2009 and 2010, the number of cases where organisations faced losses due to corrupt practices quadrupled.
36 | KPMG NZ Forensic | Fraud, Bribery and Corruption Survey | Bribery and corruption

While previous Fraud surveys have contained some questions regarding bribery and corruption, the growing extent and importance of the problem warranted a more detailed treatment in the 2012 survey.
Respondents to this survey reported relatively few incidents of bribery and corruption within their organisations; just one external incident by an employee and three separate incidents by third parties. This relatively low incident rate suggests that bribery and corruption are not major issues for New Zealand.
However, responses to other questions posed by the survey do give cause for concern, particularly regarding the possibility of complacency. When respondents were asked whether or not they were aware of anti-bribery legislation in countries within which their organisations operated, over half said “no”. Similarly, when respondent organisations were asked whether or not they had sought advice to determine whether or not foreign anti-bribery and corruption legislation applied to their organisation, an even larger percentage of respondents (79%) said “no”. Moreover, thirty-eight percent (38%) of respondents do not have clear anti-bribery and corruption policies and procedures. Of those that do, only seven percent (7%) are stand-alone policies and procedures. Finally, respondents were asked whether they had surveyed staff within the last five years about the prevalence of bribery and corruption and whether they reported any suspicions: ninety-two percent (92%) reported that they had not.
KPMG NZ Forensic | Fraud, Bribery and Corruption Survey 2012 | Bribery and corruption | 37
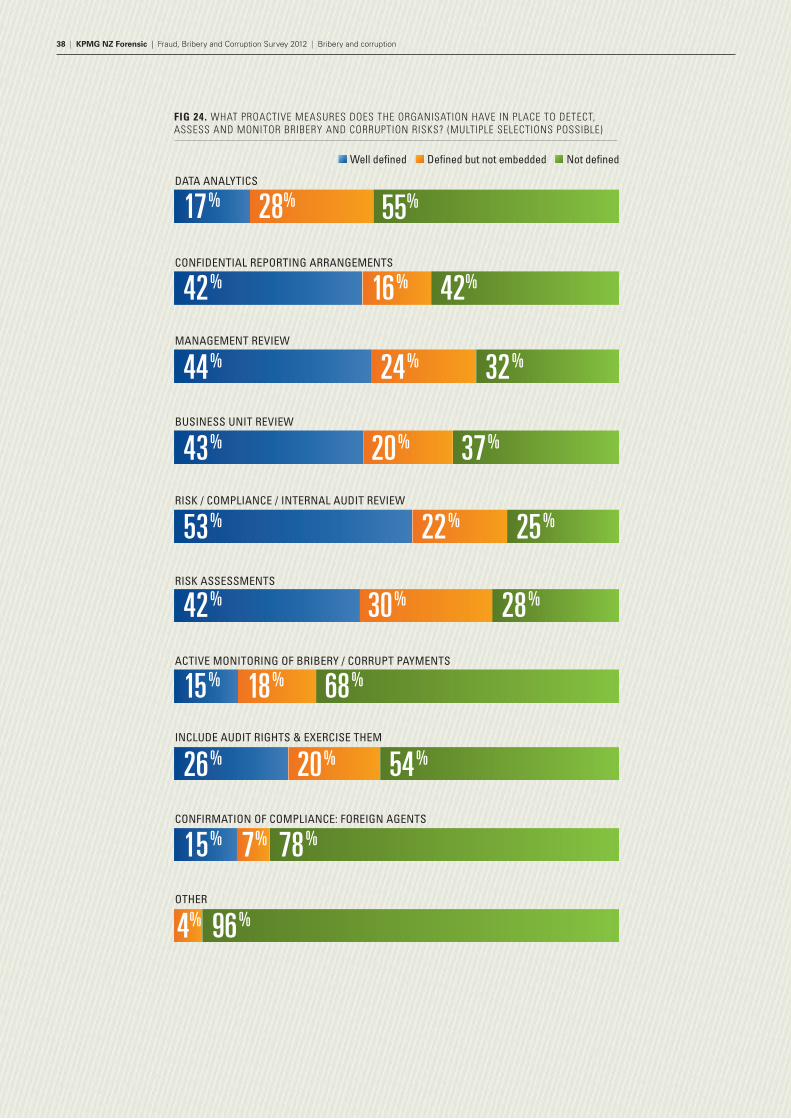
FIG 24. WHAT PROACTIVE MEASURES DOES THE ORGANISATION HAVE IN PLACE TO DETECT, ASSESS AND MONITOR BRIBERY AND CORRUPTION RISKS? (MULTIPLE SELECTIONS POSSIBLE)
DATA ANALYTICS
CONFIDENTIAL REPORTING ARRANGEMENTS
MANAGEMENT REVIEW
BUSINESS UNIT REVIEW
RISK / COMPLIANCE / INTERNAL AUDIT REVIEW
RISK ASSESSMENTS
OTHER
ACTIVE MONITORING OF BRIBERY / CORRUPT PAYMENTS
INCLUDE AUDIT RIGHTS & EXERCISE THEM
CONFIRMATION OF COMPLIANCE: FOREIGN AGENTS
17%
42%
44%
43%
53%
42%
15%
26%
15% 7%
4%
78%
96%
20% 54%
18% 68%
30% 28%
22% 25%
20% 37%
24% 32%
42%16%
28% 55%
Not definedDefined but not embeddedWell defined
38 | KPMG NZ Forensic | Fraud, Bribery and Corruption Survey 2012 | Bribery and corruption

Detecting, assessing and monitoring the risk of bribery and corruption
As shown in Figure 24, of all the proactive measures available, only one (risk/compliance/internal audit review) was ‘well defined’ by a majority of respondents (53%). While every one of the nine proactive measures had been ‘well defined’ by at least some respondent organisations, eight of these were in the minority. In particular ‘data analytics’, ‘active monitoring of bribery/corruption payments’ and ‘confirmation of compliance by foreign agent’ were ‘well defined’ by just seventeen percent (17%), fifteen percent (15%) and fifteen percent (15%) of respondent organisations respectively (see Fig 24).
Who is responsible for embedding a culture of integrity and ethics in your organisation?
Almost half of all respondents to the 2012 survey looked to the peak of the hierarchy (C.E.O/Managing Director) when identifying the person(s) ultimately responsible for embedding a culture of organisational integrity and ethics. This is not surprising as leadership often flows down from the top. However, as one respondent pointed out, the responsibility for ensuring organisational integrity and ethics does in fact lie with everyone in the organisation.
The importance of all employees being bound by such a culture is reinforced by the survey findings that non-management accounted for almost two thirds of all incidents of fraud, while management accounted for a quarter of the largest incidents of fraud. In other words, with perpetrators spread throughout the organisational hierarchy, the responsibility for ensuring a culture of organisational integrity and ethics should be equally widespread.
C.E.O / MANAGING DIRECTOR
THE BOARD
LINE MANAGEMENT
HR DIRECTOR / MANAGER
OTHER
45%
30%
16%
11%
1%
FIG 25. PERSON/UNIT RESPONSIBLE FOR EMBEDDING ORGANISATIONAL INTEGRITY AND ETHICS
KPMG NZ Forensic | Fraud, Bribery and Corruption Survey 2012 | Bribery and corruption | 39
8ABOUT THE SURVEY
In 2012 KMPG (New Zealand) and the Institute of Criminology, Victoria University of Wellington, invited a sample of New Zealand organisations in the private and public sectors to complete a questionnaire on their perceptions of, experiences with and attitudes towards fraud. Respondents were asked to consider fraud that occurred in their organisation during the period 1 February 2010 to 31 January 2012.
40 | KPMG NZ Forensic | Fraud, Bribery and Corruption Survey 2012 | About the survey

FIGURE 26. RANKED ORDER OF RESPONDENT ORGANISATIONS BY INDUSTRY SECTOR
MANUFACTURING
15.2%
FINANCIAL AND INSURANCE SERVICES
14.5%
PUBLIC ADMINISTRATION AND SAFETY
11.6%
AGRICULTURE, FORESTRY, FISHING
9.4%
HEALTHCARE AND SOCIAL ASSISTANCE
8.7%
WHOLESALE TRADE
7.2%
PROFESSIONAL, SCIENTIFIC AND TECHNICAL SERVICES
7.2%
EDUCATION AND TRAINING
5.8%
RETAIL TRADE
4.3%
CONSTRUCTION
3.6%
TRANSPORT, POSTAL AND WAREHOUSING
2.9%
RENTAL, HIRING AND REAL ESTATE SERVICES
2.9%
INFORMATION, MEDIA AND TELECOMMUNICATIONS
2.2%
ARTS AND RECREATION
1.4%
ELECTRICITY, GAS, WATER AND WASTE SERVICES
1.4%
MINING
0.7%
ACCOMMODATION AND FOOD SERVICES
0.7%
For the purposes of this survey, fraud was defined as ‘any dishonest activity causing actual or potential financial loss to any persons or entity including theft of monies or other property by employees or persons external to the entity and where deception is used at any time immediately before or immediately following the activity’ (AS8001 – 2008).
Completed questionnaires were received from 143 organisations. The survey achieved a response rate of twenty-nine percent (29%). This compares with the ten percent (10%) response rate achieved by the 2010 combined Australian and New Zealand survey.
Figure 26 sets out the percentage of respondents that indicated the nature of their business activities in accordance with the Australian and New Zealand Standard Industrial Classification.
KPMG NZ Forensic | Fraud, Bribery and Corruption Survey 2012 | About the survey | 41

9APPENDIX
42 | KPMG NZ Forensic | Fraud, Bribery and Corruption Survey 2012 | Appendix

Fraud Type Management Non-Management External Parties
No. $ No. $ No. $
Asset Misappropriation – Cash 26 330,000 71 1,009,250 185 11,048,600
Asset Misappropriation – Non-Cash 45 278,000 75 219,793 7 103,500
Asset Misappropriation – Fraudulent Disbursements - - 13 727,500 1 550,000
Asset Misappropriation – Insurance - - - - - -
Asset Misappropriation – Financial 1 80,000 - - 495 2,340,657
Asset Misappropriation – Government - - - - - -
Asset Misappropriation – Other - - 2 35,200 - -
Corruption 1 20,000 0 - - -
Fraudulent Statements – Financial - - 0 - - -
Fraudulent Statements – Non-Financial - - - - - -
Total 72 $708,000 161 $1,987,743 689 $14,042,757
Appendix A: Summary of all fraud incidents by type and perpetrator
Appendix B: Fraud Prevention Strategies
4 This is a summary of the dollar value lost to all the major categories of fraud broken down by the three main categories of perpetrator. A number of respondents did not tell us how much was lost to particular fraud types and this explains the variance between the total fraud losses reported by respondents ($18.26M) and the fraud losses reported by fraud type ($16,738,500).
Strategy Implemented Planned Not Applicable
Perform fraud risk assessments (n=120) 82 68% 18 15% 20 17%
Develop a fraud control strategy (n=116) 59 51% 26 22% 31 27%
Require management to identify, assess and manage risk (n=116) 92 79% 13 11% 11 10%
Develop a corporate code of conduct (n=122) 100 82% 11 9% 11 9%
Unequivocal statement of organisation’s attitude (n = 117) 91 78% 12 10% 14 12%
Conduct fraud awareness training (n = 113) 44 39% 31 27% 38 34%
Review and/or improve internal controls (n=124) 106 86% 18 14% 0 0%
Conduct pre-employment screening (n=124) 112 90% 7 6% 5 4%
Perform screening of employees on promotion/transfer (n=108) 34 31% 15 14% 59 55%
Perform due diligence on suppliers/business partners (n=112) 58 52% 15 13% 39 35%
Enforce compulsory annual leave (n=115) 62 54% 12 10% 41 36%
Enforce job rotation (n=105) 5 5% 15 14% 85 81%
Provide employee support programs (n=114) 72 63% 5 4% 37 33%
Implement an independent audit committee (n=117) 82 70% 10 9% 25 21%
Other (n = 41) 11 27% 0 0% 30 73%
KPMG NZ Forensic | Fraud, Bribery and Corruption Survey 2012 | Appendix | 43

Appendix C: Fraud Detection Strategies
Appendix D: Fraud Response Strategies
Strategy Implemented Planned Not Applicable
Perform continuous monitoring/auditing (n=108) 48 44% 27 25% 33 31%
Perform proactive data analysis (n=113) 80 71% 15 13% 18 16%
Implement policy & procedures for internal reporting of suspected fraud (n=115) 89 77% 11 10% 15 13%
Implement policy & procedures for external reporting of suspected fraud (n=109) 63 58% 9 8% 37 34%
Allocate internal audit resources (n=109) 61 56% 15 14% 33 30%
Conduct unannounced audits (n=107) 44 41% 19 18% 44 41%
Perform stress testing (n=96) 8 8% 18 19% 70 73%
Other (n=42) 5 12% 0 0% 37 88%
Strategy Implemented Planned Not Applicable
Implement an investigation policy (n=108) 64 59% 18 17% 26 24%
Implement a disciplinary policy (n=111) 92 83% 5 4% 14 13%
Establish an internal investigation unit (n=101) 35 35% 8 8% 58 57%
Implement a policy of reviewing internal controls and policies subsequent to an identified fraud (n=105)
66 63% 16 15% 23 22%
Implement a police referral policy (n=106) 68 64% 5 5% 33 31%
Other (n=35) 2 6% 0 0% 33 94%
44 | KPMG NZ Forensic | Fraud, Bribery and Corruption Survey 2012 | Appendix

KPMG New Zealand’s Forensics team can help you reduce commercial loss and the risk to your reputation from fraud and corporate crime. We provide investigations, fraud risk management, dispute advisory, anti-money-laundering and forensic technology services.
KPMG Forensic in New Zealand is part of an international network of over 2000 forensic professionals working in 28 accredited practices within KPMG member firms around the world.
By applying accounting, investigation, intelligence, technology and industry skills we can help prevent and resolve:
> Fraud
> Corruption
> Misconduct
> Commercial disputes
> Breaches of rules and regulations
For a confidential discussion, please contact one of our team.
Our thought leadershipIf you’d like to receive a copy of any of these publications, please email Blair Bulloch at [email protected]
Alternatively, you can download these and many more publications from kpmg.com/nz Why good people sometimes
do bad things: 52 reflections on ethics at work.
Why do even the most conscientious and honest employees sometimes go off the rails? This book, published by KPMG Global Forensics, provides key insights into ethics at work.
Fraud Barometer / Forensic / Edition 7
SUMMARY • Valueoflargefraudcasestotalled$1.7billion
–arecordforaperiod(comparedto$279.7millionlastperiod).
• Therewere33casesintotal(comparedto24casesinthelastperiod).
• Therewerefour‘super-frauds’:fraudsgreaterthan$3million(comparedtofivesuper-fraudsinthelastperiod).
• TherecordtotaloffraudforthisperiodisattributabletotheSeriousFraudOffice(SFO)chargingfiveindividualsinrelationtoSouthCanterburyFinanceLtd(SCF).Theallegedtotalfraudinthiscaseis$1.7billion,whichisNewZealand’slargestfraudcaseever.Thetotalamountoffraudforthisperiod,excludingSCF,was$30.8million.
About the Fraud Barometer TheFraudBarometerisreleasedeverysixmonths.ThedataforthisreportlooksspecificallyatthesixmonthstoJune2012.ItalsoincludesanalysisofsomeofthetrendstodatefromwhentheFraudBarometerfirstlaunched(in2008).
Methodology TheobjectiveoftheFraudBarometeristomonitor(primarilythroughmedia)thelevelofreportedfraudscomingbeforethecriminalcourtsinNewZealand,andprovidecommentarysurroundingthetypesofvictim,thetypesofperpetratorandtheirgender,andthetypesoffraudoccurring.InorderforacasetobeincludedintheBarometer,thefraudmustexceed$100,000(usuallyreferredtoasa‘largefraud’),andtheindividualsmustatleasthavebeencharged.
AswithpreviouseditionsoftheFraudBarometer,welookspecificallyatcasesover$100,000,thatareinNewZealandbeforethecourts.
ForensicKPMGNewZealand
Victims • ThemostcommonvictimistheGovernment(12cases).
Allcasesinvolvedexternalfraud.
• Themostprominentvictim,byvalue,wasalsotheGovernment($1.7billion).Thenextmostprominentvictimswereinvestors($12million).Themajorityoftheamountdefraudedfrominvestorsrelatestoa$9millionPonzischeme.
Fraud BarometerEdition 7
Perpetrators • Theperpetratorwasmorelikelytobeinternaltothe
organisationthanexternal.Employeesandmanagementaccountfor16ofthe33cases(employees–eightcases;management–eightcases).Customersandtaxpayersaccountfor13ofthe33cases(customers–fourcases;taxpayer–ninecases).
• Taxpayerswereinvolvedinthehighestnumberofcases(ninecases).Thefraudscommittedbytaxpayersconsistedoftaxevasion,benefitfraudandACCfraud.
KPMG NZ Fraud Barometer
The KPMG Fraud Barometer is a six-monthly update based on the reported frauds before the New Zealand courts. It compares the level and type of fraudulent activity, and provides insight into fraudsters’ latest tricks of the tradtrade.
Who is the typical fraudster?
KPMG’s global analysis of fraud trends can help you to draw inferences. We have narrowed down the profile of a typical fraudster, based on scrutiny of actual instances of fraud, to help organisations like yours become more alert and responsive to fraud.
KPMG NZ Forensic | Fraud, Bribery and Corruption Survey 2012 | 45
© 2013 KPMG, a New Zealand partnership and a member firm of the KPMG network of independent member firms affiliated with KPMG International Cooperative (“KPMG International”), a Swiss entity. All rights reserved. The KPMG name, logo and “cutting through complexity” are registered trademarks or trademarks of KPMG International Cooperative (“KPMG International”). 3387
Contact us
Stephen Bell Lead Partner – Forensics KPMG Auckland officeT: +64 9 367 5834 E: [email protected]
Chris BudgeAssociate Director – Forensic TechnologyKPMG Wellington officeT: +64 4 816 4832E: [email protected]
Blair BullochSenior Manager – Forensics KPMG Auckland officeT: +64 9 363 3506 E: [email protected]
kpmg.com/nz
Visit: KPMG Forensics online