fraser surrey docks direct coal transfer facility air ... · (pmv). an air dispersion modelling...
TRANSCRIPT
FRASER SURREY DOCKS DIRECT COAL TRANSFER FACILITY:
AIR DISPERSION MODELLING ASSESSMENT
Prepared for:
11060 Elevator Road Surrey, BC V6P 3Y7
Prepared by:
Levelton Consultants Ltd. 150-12791 Clarke Place
Richmond, BC Canada, V6V 2H9
Date: October 30th, 2012 File: EE12-1611-00

File: EE12-1611-00 Fraser Surrey Docks Direct Coal Transfer Facility Air Dispersion Modelling Assessment
i
TABLE OF CONTENTS
1.0 INTRODUCTION ........................................................................................................ 6
2.0 PROJECT DESCRIPTION ............................................................................................ 6
2.1 SCOPE OF DISPERSION MODELLING STUDY ............................................................................ 8
3.0 REGULATORY FRAMEWORK ...................................................................................... 9
3.1 AMBIENT AIR QUALITY OBJECTIVES (AAQO) .......................................................................... 9
4.0 BACKGROUND AMBIENT AIR QUALITY ...................................................................... 11
5.0 SOURCE EMISSIONS ESTIMATION ............................................................................ 14
5.1 TUGBOATS ......................................................................................................................... 14
5.2 RAIL .................................................................................................................................. 17
5.3 FRONT END LOADER EMISSIONS .......................................................................................... 20
5.4 COAL STOCKPILE................................................................................................................ 22
5.5 MATERIAL HANDLING & TRANSFERS ..................................................................................... 23
6.0 CALMET AND CALPUFF MODELLING METHODOLOGY ............................................ 28
6.1 DOMAIN AND RECEPTORS ................................................................................................... 28
6.2 CALPUFF MODELLING OPTIONS ......................................................................................... 29
6.3 SOURCE PARAMETERS........................................................................................................ 30
6.4 CONVERSION FROM NOX TO NO2 ......................................................................................... 40
7.0 DISPERSION MODELLING RESULTS .......................................................................... 42
7.1 ALL EMISSION SOURCES ..................................................................................................... 42
7.1.1 PREDICTED SOURCE CONTRIBUTION TO NO2 ANNUAL AAQO EXCEEDANCES ...................... 56
7.2 FUGITIVE EMISSIONS FROM BARGE ...................................................................................... 61
8.0 BEST MANAGEMENT PRACTICES ............................................................................. 63
9.0 CONCLUSIONS ....................................................................................................... 68
APPENDIX A: CALMET QA/QC ....................................................................................... 70
A-1. LOCAL CLIMATE AND METEOROLOGY ................................................................................... 71
A-1.1 TEMPERATURE ............................................................................................................... 71
A-1.2 WIND ............................................................................................................................. 74
A-1.3 CONCLUSION FROM COMPARISON OF METEOROLOGICAL DATA TO CLIMATE NORMALS ......... 79
A-2. MODELLING METHODOLOGY ................................................................................ 80
File: EE12-1611-00 Fraser Surrey Docks Direct Coal Transfer Facility Air Dispersion Modelling Assessment
ii
A-2.1 MODEL SELECTION ......................................................................................................... 80
A-2.2 CALMET ....................................................................................................................... 80
A-2.2.1 CALMET Modelling Domain ...................................................................................... 80
A-2.2.2 Terrain Elevation and Land Use Data ........................................................................ 82
A-2.2.3 Meteorological Data .................................................................................................. 82
A-2.2.4 CALMET Model Options ............................................................................................ 83
A-2.2.5 CALMET Quality Assurance and Control ................................................................... 84
A-3. REFERENCES ..................................................................................................... 93
APPENDIX B: EXAMPLE VISUAL SITE INSPECTION FORM ..................................................... 94
File: EE12-1611-00 Fraser Surrey Docks Direct Coal Transfer Facility Air Dispersion Modelling Assessment
iii
LIST OF TABLES
Table 3-1 Summary of Relevant Air Quality Objectives .................................................................10
Table 4-1 Summary of CO Data from Ambient Monitoring Stations...............................................12
Table 4-2 Summary of NO2 Data from Ambient Monitoring Stations .............................................12
Table 4-3 Summary of SO2 Data from Ambient Monitoring Stations .............................................12
Table 4-4 Summary of PM10 Data from Ambient Monitoring Stations ............................................13
Table 4-5 Summary of PM2.5 Data from Ambient Monitoring Stations ...........................................13
Table 4-6 Summary of Background Ambient Air Quality Concentrations for Air Quality Assessment ..................................................................................................................14
Table 5-1 Tugboat Diesel Engine Data .........................................................................................15
Table 5-2 SOx and PM Emission Factors for Harbour Tugboats ...................................................15
Table 5-3 Emission Factors for Tugboats .....................................................................................16
Table 5-4 Marine Emission Rates by Facility Operation Scenarios for the Single Tow Tug ...............................................................................................................................16
Table 5-5 Available SW900 Yard Locomotive HP and Fuel Consumption Data ............................17
Table 5-6 HP Distribution for the SW900, MP15DC and EMD GP9 Yard Locomotives .................18
Table 5-7 Yard Switching Locomotive Diesel Engine Data ............................................................19
Table 5-8 Locomotive Emission Factors ......................................................................................20
Table 5-9 Rail Emission Rates by Facility Operation .....................................................................20
Table 5-10 Peak Front End Loader Emission Rates (Used for 1-Hour Averaging Periods) .............21
Table 5-11 Steady-State Front End Loader Emission Rates (Used for 24-hour and Annual Averaging Periods) ...........................................................................................21
Table 5-12 Fugitive Particulate Parameters and Emissions from Stockpiles ...................................23
Table 5-13 Material Transfer Points and Fugitive Particulate Emissions .........................................24
Table 6-1 Selected Dispersion Options used in CALPUFF Modelling ...........................................30
Table 6-2 Modelling Source Parameters and Emission Rates.......................................................33
Table 6-3 Assumptions Used to Establish Realistic Worst-Case Scenario Emission Rates for Each Averaging Period ..................................................................................35
Table 7-1 Model Predicted Pollutant Concentrations from All Sources ..........................................43
Table 7-2 Model Predicted Pollutant Concentrations from All Sources with Background Concentrations .............................................................................................................45
Table 7-3 Predicted concentrations at sensitive receptors near FSD for Scenario 3 .....................54
Table 8-1 Common Dust Generating Activities at Aggregate Operations and Suggested Control Measures .........................................................................................................64
Table 8-2 Sample BMP effectiveness monitoring tracking sheet ...................................................66
Table A–0-1 Heights of CALMET Model Layers. ...............................................................................82
Table A–0-2 Surface Meteorological Stations Used for CALMET Input. ............................................83
Table A–0-3 Selected CALMET Wind Field Model Options ...............................................................84
File: EE12-1611-00 Fraser Surrey Docks Direct Coal Transfer Facility Air Dispersion Modelling Assessment
iv
LIST OF FIGURES
Figure 4-1 Metro Vancouver Ambient Air Quality Monitoring Network ............................................11
Figure 6-1 CALMET and CALPUFF Modelling Domain with Receptor Locations ...........................29
Figure 6-2 Area Sources and Material Transfer Point Modelled .....................................................31
Figure 6-3 Closer View of Area Sources Modelled .........................................................................32
Figure 6-4 NO2/NOx Ratio versus 1-hour Average NOx Observations from Metro Vancouver Station T18 (Burnaby South) .......................................................................40
Figure 6-5 NO2/NOx Ratio versus 24-hour Average NOx Observations from Metro Vancouver Station T18 (Burnaby South) .......................................................................41
Figure 7-1 Contour Plot of NO2 Maximum 1-hour Predicted Concentrations from All Emission Sources (Scenario 3) .....................................................................................46
Figure 7-2 Contour Plot of NO2 Maximum 24-hour Predicted Concentrations from All Emission Sources (Scenario 3) .....................................................................................47
Figure 7-3 Contour Plot of NO2 Maximum Annual Predicted Concentrations from All Emission Sources (Scenario 1) .....................................................................................48
Figure 7-4 Contour Plot of NO2 Maximum Annual Predicted Concentrations from All Emission Sources (Scenario 2) .....................................................................................49
Figure 7-5 Contour Plot of NO2 Maximum Annual Predicted Concentrations from All Emission Sources (Scenario 3) .....................................................................................50
Figure 7-6 Contour Plot of PM2.5 Maximum 24-hour 98th Percentile Predicted Concentrations from All Emission Sources (Scenario 3) ...............................................51
Figure 7-7 Contour Plot of PM2.5 Maximum Annual Predicted Concentrations from All Emission Sources (Scenario 3) .....................................................................................52
Figure 7-8 Location of sensitive receptors near FSD......................................................................53
Figure 7-9 Location of sensitive receptors along the rail corridor from the Canada / USA border ...........................................................................................................................55
Figure 7-10 Location of sensitive receptors along the Fraser River marine corridor .........................56
Figure 7-11 Receptors Analyzed for Source Contribution to NO2 Annual Exceedances ...................58
Figure 7-12 Annual NO2 Source Contributions at Selected Receptors .............................................59
Figure 7-13 Source Contributions to the Maximum Predicted Annual NO2 Concentrations at Selected Receptors with Background Concentrations ...............................................60
Figure 7-14 Contour Plot of PM10 Maximum 1-hour Predicted Concentrations from the Loaded Coal Barge Source in the Middle of the Fraser River. .......................................62
Figure 8-1 BNSF Lower Mainland operating area ..........................................................................68
Figure A-1 Temperature Normals for T13 North Delta (1992-2011) ................................................72
Figure A-2 2000-2001 Temperature Observations for T13 North Delta ...........................................73
Figure A-3 2000-2001 Temperatures Near the FSD Site (Extracted from CALMET Output) .........................................................................................................................74
Figure A-4 1987- 2011 Wind Rose for T13 North Delta ..................................................................75
Figure A-5 2002 - 2011 Wind Rose for T38 Annacis Island ............................................................76

File: EE12-1611-00 Fraser Surrey Docks Direct Coal Transfer Facility Air Dispersion Modelling Assessment
v
Figure A-6 2000-2001 Wind Rose Near the T13 North Delta Station (Extracted from CALMET Output) ..........................................................................................................77
Figure A-7 2000-2001 Wind Rose Near the T38 Annacis Island Station (Extracted from CALMET Output) ..........................................................................................................78
Figure A-8 2000-2001 Wind Rose Near FSD Site (Extracted from CALMET Output) ......................79
Figure A-9 Map Displaying the CALMET and CALPUFF Modelling Domain. ..................................81
Figure A-10 Example wind field generated by CALMET for the 10 m level for the hour ending at 11:00 on November 10, 2000. (The wind speed is denoted by the length of the arrows). ....................................................................................................85
Figure A-11 Frequency distribution of surface (10 m level) winds for surface stations and the near the FSD site (CALMET). .................................................................................86
Figure A-12 Average monthly wind speeds at surface (10 m level) for surface stations and the FSD site (CALMET). ...............................................................................................87
Figure A-13 Diurnal wind speed distribution of surface (10 m level) winds for surface stations and the FSD site (CALMET). ...........................................................................88
Figure A-14 Monthly temperatures at surface stations and FSD site (CALMET). ..............................89
Figure A-15 Hourly temperatures at surface stations and the FSD site (CALMET). ..........................90
Figure A-16 Frequency distribution of stability classes calculated for Vancouver Airport (YVR) and the FSD site (CALMET) for the modelling period. ........................................91
Figure A-17 Hourly predicted mixing heights for the FSD site (CALMET). ........................................92

File: EE12-1611-00 Fraser Surrey Docks Direct Coal Transfer Facility Air Dispersion Modelling Assessment
6
1.0 INTRODUCTION
Fraser Surrey Docks (FSD) retained Levelton Consultants Ltd. (Levelton) to conduct an air dispersion modelling assessment of emissions from the proposed FSD Direct Transfer Coal Facility in Surrey, BC. The dispersion modelling analysis considers emission sources related to the facility which will operate on industrial lands leased from the Port of Metro Vancouver (PMV). An air dispersion modelling plan was developed by Levelton through consultation with PMV. The plan was approved by PMV prior to commencing the assessment.
This report summarizes the air dispersion modelling methodology and results for the proposed facility, and provides recommended best management practices to minimize potential air quality impacts.
2.0 PROJECT DESCRIPTION
FSD is seeking PMV approval for the construction of a Direct Transfer Coal Facility at FSD in Surrey, BC. The facility is to accommodate the receipt and unloading of full unit trains of coal at FSD for transfer onto barges. The barges will be transported by a third party partner to the west coast of Texada Island where the coal will be stored for further conveyance onto deep sea vessels. With the requested improvements (additional rail, two dumper pits, and a conveyance system), the terminal handling capacity is anticipated to be as follows:
• 8 Million Metric Tonnes (MT) of coal per annum at full capacity with FSD seeking to handle a minimum of 4 Million MT on an annual basis.
• The facility has been designed to unload and release a full 135-car unit train in less than eight hours, allowing for the unloading of a unit train onto two 8,000 DWT barges in one regular shift.
In general terms, the anticipated marine operations implications are as follows:
• For an annual throughput of 2 Million MT in year 1 (expected to commence in March 2013), 4 Million MT in years 2-5 and 8 million MT in years 6+, the expected number of barge deliveries per year is 320, 640, and 1280, respectively.
• It is expected that total transit time from FSD to Texada, towing loaded barges, will be approximately 12 to 14 hours of which 3 hours will be towage in the Fraser River.
• It is expected that total transit time from Texada Island to FSD, towing empty barges, will be approximately 10 to 12 hours.
• It is expected that the barge movements will be “single tow” between FSD and the mouth of the Fraser River, with each tug towing a single barge, and barge movements will be “tandem tow” between the mouth of the Fraser River and the west coast of Texada Island, with each tug towing two barges.
• It is expected that each barge will be towed with a 1200hp tug while tandem tows will be assumed by a 1600hp tug.
File: EE12-1611-00 Fraser Surrey Docks Direct Coal Transfer Facility Air Dispersion Modelling Assessment
7
• Use of Berth 2 at FSD for berthing, loading and departing. o Marine operator will deliver two 8,000 DWT barge and tie up both to Berth 2. o At the start of shift FSD Operations commence filling one barge, warping the
barge utilizing a cable warping system, and once the barge is filled, proceed to fill the second barge. Total time to fill both barges is six to eight hours.
o Once a single barge is completely filled, the Marine Operator will remove the barge from Berth 2 and commence travel to Texada.
In general terms, the anticipated rail implications are as follows:
• For an annual throughput of 2 Million MT in year 1, 4 Million MT in years 2-5 and 8 million MT in years 6+, the expected number of unit train deliveries per year is 160, 320 and 640, respectively.
• Each 53-foot bottom dump rail car will hold approximately 100 MT of coal, providing 12,500 MT per unit train.
• Estimated length of a unit train is 7,000 feet, including four 4,500hp diesel road engines; two located at the front and two located at the rear of the unit train.
• Use of the Port Authority Rail Yard (PARY) for train disassembly, shunting and assembly.
o BNSF will deliver one unit train between 1200 AM and 0600 AM into the PARY where it will be stored in two sections and the four road engines will be parked.
o At start of shift, FSD Operations will further break the train into five sections utilizing a 900hp diesel yard engine.
o Once unloading of all six 24-car spot is completed; the train is again assembled in the PARY into two strings using the same 900 hp diesel yard engine. BNSF will then arrive approximately 10 to 12 hours later, reassemble the unit train again placing the two road engines in the front and two in the rear and depart. The re-assembly process will take approximately two hours.
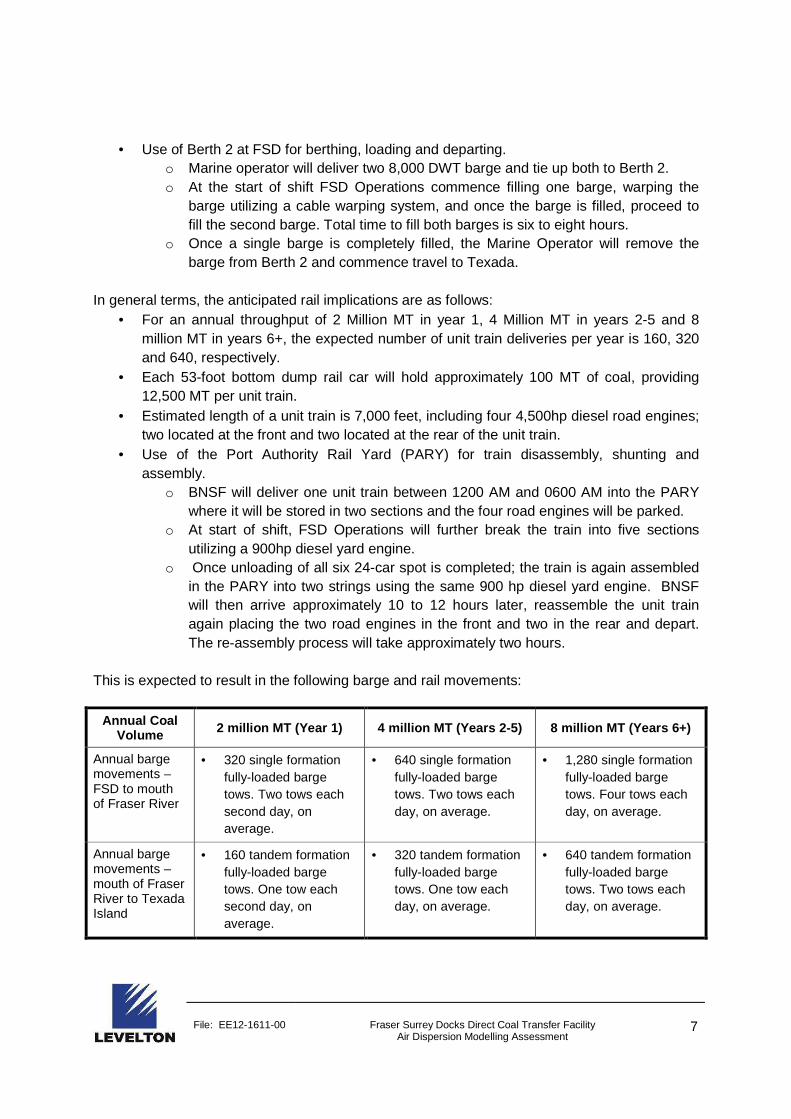
This is expected to result in the following barge and rail movements:
Annual Coal Volume 2 million MT (Year 1) 4 million MT (Years 2-5) 8 mi llion MT (Years 6+)
Annual barge movements – FSD to mouth of Fraser River
• 320 single formation fully-loaded barge tows. Two tows each second day, on average.
• 640 single formation fully-loaded barge tows. Two tows each day, on average.
• 1,280 single formation fully-loaded barge tows. Four tows each day, on average.
Annual barge movements – mouth of Fraser River to Texada Island
• 160 tandem formation fully-loaded barge tows. One tow each second day, on average.
• 320 tandem formation fully-loaded barge tows. One tow each day, on average.
• 640 tandem formation fully-loaded barge tows. Two tows each day, on average.
File: EE12-1611-00 Fraser Surrey Docks Direct Coal Transfer Facility Air Dispersion Modelling Assessment
8
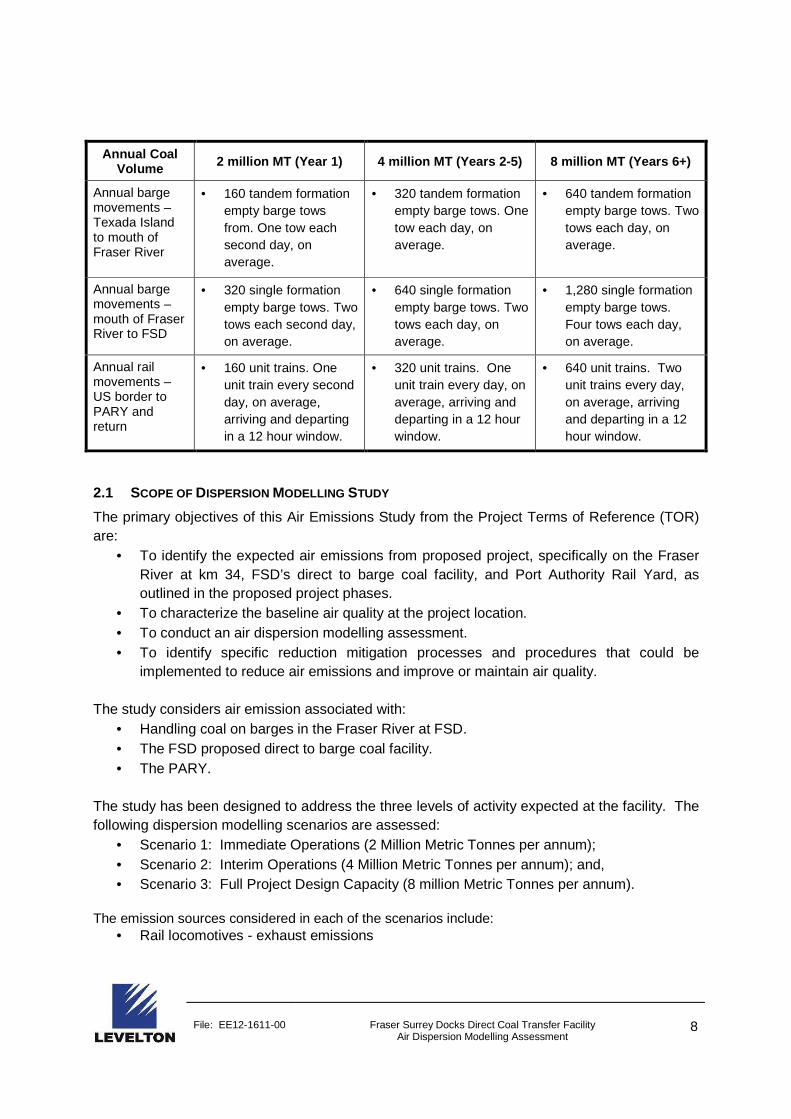
Annual Coal Volume 2 million MT (Year 1) 4 million MT (Years 2-5) 8 mi llion MT (Years 6+)
Annual barge movements – Texada Island to mouth of Fraser River
• 160 tandem formation empty barge tows from. One tow each second day, on average.
• 320 tandem formation empty barge tows. One tow each day, on average.
• 640 tandem formation empty barge tows. Two tows each day, on average.
Annual barge movements – mouth of Fraser River to FSD
• 320 single formation empty barge tows. Two tows each second day, on average.
• 640 single formation empty barge tows. Two tows each day, on average.
• 1,280 single formation empty barge tows. Four tows each day, on average.
Annual rail movements – US border to PARY and return
• 160 unit trains. One unit train every second day, on average, arriving and departing in a 12 hour window.
• 320 unit trains. One unit train every day, on average, arriving and departing in a 12 hour window.
• 640 unit trains. Two unit trains every day, on average, arriving and departing in a 12 hour window.
2.1 SCOPE OF DISPERSION MODELLING STUDY
The primary objectives of this Air Emissions Study from the Project Terms of Reference (TOR) are:
• To identify the expected air emissions from proposed project, specifically on the Fraser River at km 34, FSD’s direct to barge coal facility, and Port Authority Rail Yard, as outlined in the proposed project phases.
• To characterize the baseline air quality at the project location. • To conduct an air dispersion modelling assessment. • To identify specific reduction mitigation processes and procedures that could be
implemented to reduce air emissions and improve or maintain air quality. The study considers air emission associated with:
• Handling coal on barges in the Fraser River at FSD. • The FSD proposed direct to barge coal facility. • The PARY.
The study has been designed to address the three levels of activity expected at the facility. The following dispersion modelling scenarios are assessed:
• Scenario 1: Immediate Operations (2 Million Metric Tonnes per annum); • Scenario 2: Interim Operations (4 Million Metric Tonnes per annum); and, • Scenario 3: Full Project Design Capacity (8 million Metric Tonnes per annum).
The emission sources considered in each of the scenarios include:
• Rail locomotives - exhaust emissions
File: EE12-1611-00 Fraser Surrey Docks Direct Coal Transfer Facility Air Dispersion Modelling Assessment
9
• Tugboats - exhaust emissions • Front End Loaders – exhaust emissions • Material Transfer Points – fugitive dust • Coal storage pile - fugitive dust
The study also provides screening level assessment of potential impacts from:
• Fugitive dust from transportation of material to and from FSD.
3.0 REGULATORY FRAMEWORK
As part of the project review process, FSD is required to assess the impacts to air quality and has chosen to use a modelling approach to assess the potential impacts of the proposed project. A modelling plan was submitted to and approved by PMV prior to commencing the assessment. Jurisdictional ambient air quality objectives used for comparison in the assessment are outlined below.
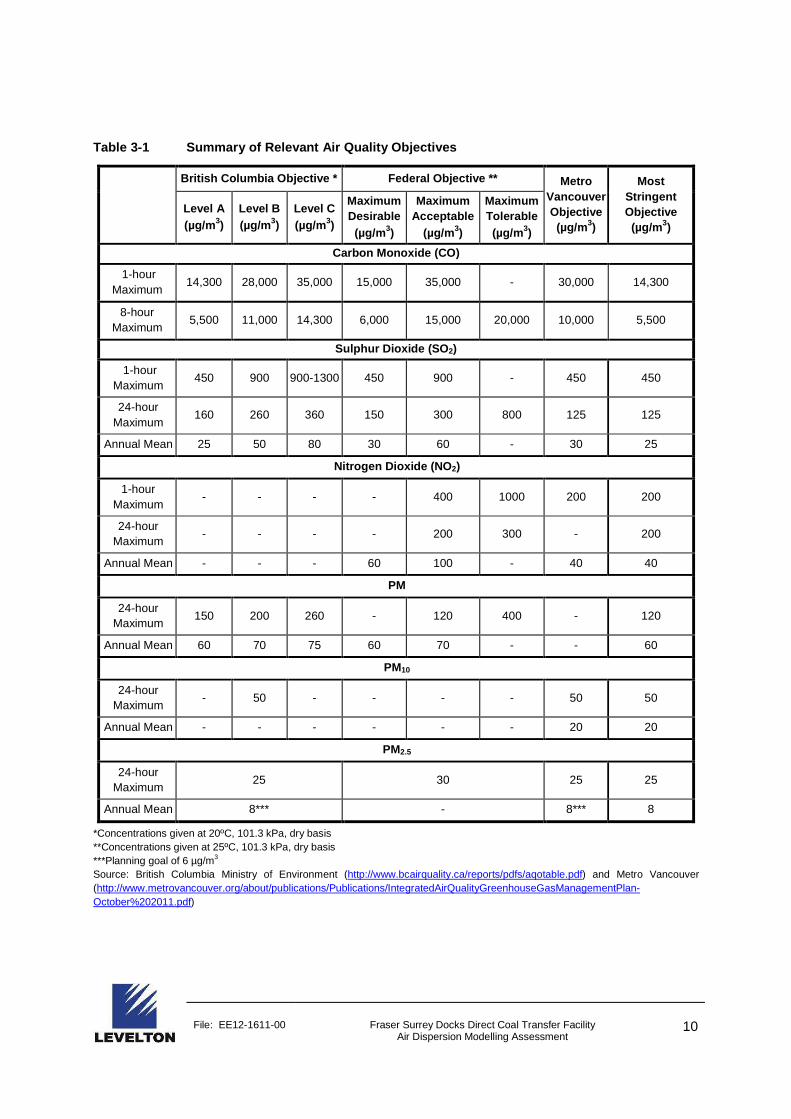
3.1 AMBIENT AIR QUALITY OBJECTIVES (AAQO) The federal and provincial governments, as well as Metro Vancouver, have developed ambient air quality objectives (AAQO) to promote long-term protection of public health and the environment. Federally, up to three objective values have been recommended using the categories "maximum desirable", "maximum acceptable", and "maximum tolerable". The "maximum desirable” objective is the most stringent standard. British Columbia has established similar sets of objective values, designated as levels A, B and C, with level A being the most stringent. Level A is typically applied to new and proposed discharges to the environment, and is usually the same as the federal "maximum desirable" objective. Metro Vancouver’s regional ambient air quality objectives are medium-term, health-based objectives.
Table 3-1 summarizes the AAQO for the species modelled in this study as well as the ambient background concentrations, discussed in Section 4.0.
File: EE12-1611-00 Fraser Surrey Docks Direct Coal Transfer Facility Air Dispersion Modelling Assessment
10
Table 3-1 Summary of Relevant Air Quality Objectiv es
British Columbia Objective * Federal Objective ** Metro Vancouver Objective (µg/m 3)
Most Stringent Objective (µg/m 3)
Level A (µg/m 3)
Level B (µg/m 3)
Level C (µg/m 3)
Maximum Desirable
(µg/m 3)
Maximum Acceptable
(µg/m 3)
Maximum Tolerable (µg/m 3)
Carbon Monoxide (CO)
1-hour Maximum
14,300 28,000 35,000 15,000 35,000 - 30,000 14,300
8-hour Maximum
5,500 11,000 14,300 6,000 15,000 20,000 10,000 5,500
Sulphur Dioxide (SO 2)
1-hour Maximum
450 900 900-1300 450 900 - 450 450
24-hour Maximum
160 260 360 150 300 800 125 125
Annual Mean 25 50 80 30 60 - 30 25
Nitrogen Dioxide (NO 2)
1-hour Maximum
- - - - 400 1000 200 200
24-hour Maximum
- - - - 200 300 - 200
Annual Mean - - - 60 100 - 40 40
PM
24-hour Maximum
150 200 260 - 120 400 - 120
Annual Mean 60 70 75 60 70 - - 60
PM10
24-hour Maximum
- 50 - - - - 50 50
Annual Mean - - - - - - 20 20
PM2.5
24-hour Maximum
25 30 25 25
Annual Mean 8*** - 8*** 8
*Concentrations given at 20ºC, 101.3 kPa, dry basis **Concentrations given at 25ºC, 101.3 kPa, dry basis ***Planning goal of 6 µg/m3
Source: British Columbia Ministry of Environment (http://www.bcairquality.ca/reports/pdfs/aqotable.pdf) and Metro Vancouver (http://www.metrovancouver.org/about/publications/Publications/IntegratedAirQualityGreenhouseGasManagementPlan-October%202011.pdf)

File: EE12-1611-00 Fraser Surrey Docks Direct Coal Transfer Facility Air Dispersion Modelling Assessment
11
4.0 BACKGROUND AMBIENT AIR QUALITY
Metro Vancouver operates an extensive network of ambient air quality monitoring stations (Figure 4-1). Data from two monitoring stations (T13 North Delta and T18 Burnaby South) were used for characterizing the background air quality in the area surrounding FSD location (Figure 4-1). The red triangles identify the stations and the white star indentifies the approximate location of the proposed FSD facility. The monitoring stations were chosen based on their proximity to the FSD site and the air quality parameters monitored.
Figure 4-1 Metro Vancouver Ambient Air Quality Moni toring Network
Four years of recent data (2008-2011) were analysed for each station and are summarized in Table 4-1 through Table 4-5. For each station, year, averaging period, and maximum observed concentrations are presented as well as 98th percentile observed concentrations. The 98th percentile is the value at or below which 98 percent of the values in the data fall.

File: EE12-1611-00 Fraser Surrey Docks Direct Coal Transfer Facility Air Dispersion Modelling Assessment
12
Table 4-1 Summary of CO Data from Ambient Monitorin g Stations
Table 4-2 Summary of NO 2 Data from Ambient Monitoring Stations
Table 4-3 Summary of SO 2 Data from Ambient Monitoring Stations
Annual
Max 98th %ile Max 98th %ile Average 1-hr 8-hr
2008 Burnaby South (T18) 1,480 734 1,021 642 329 98% 99%
2009 Burnaby South (T18) 2,097 897 1,557 827 332 98% 99%
2010 Burnaby South (T18) 1,549 606 801 564 280 97% 99%
2011 Burnaby South (T18) 1,258 571 1,120 532 274 95% 97%
1,596 702 1,125 641 303
Ambient Monitoring Station
Summary of Measured CO Concentrations (µg/m 3)
Average 2008-2011
% Data Recovery1-hour 8-hourYear
Annual
Max 98th %ile Max 98th %ile Average 1-hr 24-hr
2008 North Delta (T13) 94 70 69 59 28 98% 99%
2008 Burnaby South (T18) 107 65 71 54 29 97% 100%
2009 North Delta (T13) 121 73 79 60 28 98% 100%
2009 Burnaby South (T18) 96 69 71 59 30 95% 100%
2010 North Delta (T13) 94 63 63 51 24 97% 98%
2010 Burnaby South (T18) 86 63 70 52 26 96% 100%
2011 North Delta (T13) 89 64 64 53 26 98% 99%
2011 Burnaby South (T18) 88 62 67 51 27 94% 100%
97 66 69 55 27
% Data RecoveryYear Ambient Monitoring Station
Summary of Measured NO 2 Concentrations (µg/m 3)
1-hour 24-hour
Average 2008-2011
Annual
Max 98th %ile Max 98th %ile Average 1-hr 24-hr
2008 Burnaby South (T18) 26.6 8.0 10.5 5.8 1.3 98% 100%
2009 Burnaby South (T18) 29.3 8.0 10.2 6.5 1.6 98% 100%
2010 Burnaby South (T18) 28.2 8.0 8.2 5.0 1.5 98% 100%
2011 Burnaby South (T18) 31.7 8.8 10.6 6.2 1.8 98% 100%
29.0 8.2 9.9 5.9 1.6
% Data RecoveryYear Ambient Monitoring Station
Summary of Measured SO 2 Concentrations (µg/m 3)
1-hour 24-hour
Average 2008-2011
File: EE12-1611-00 Fraser Surrey Docks Direct Coal Transfer Facility Air Dispersion Modelling Assessment
13
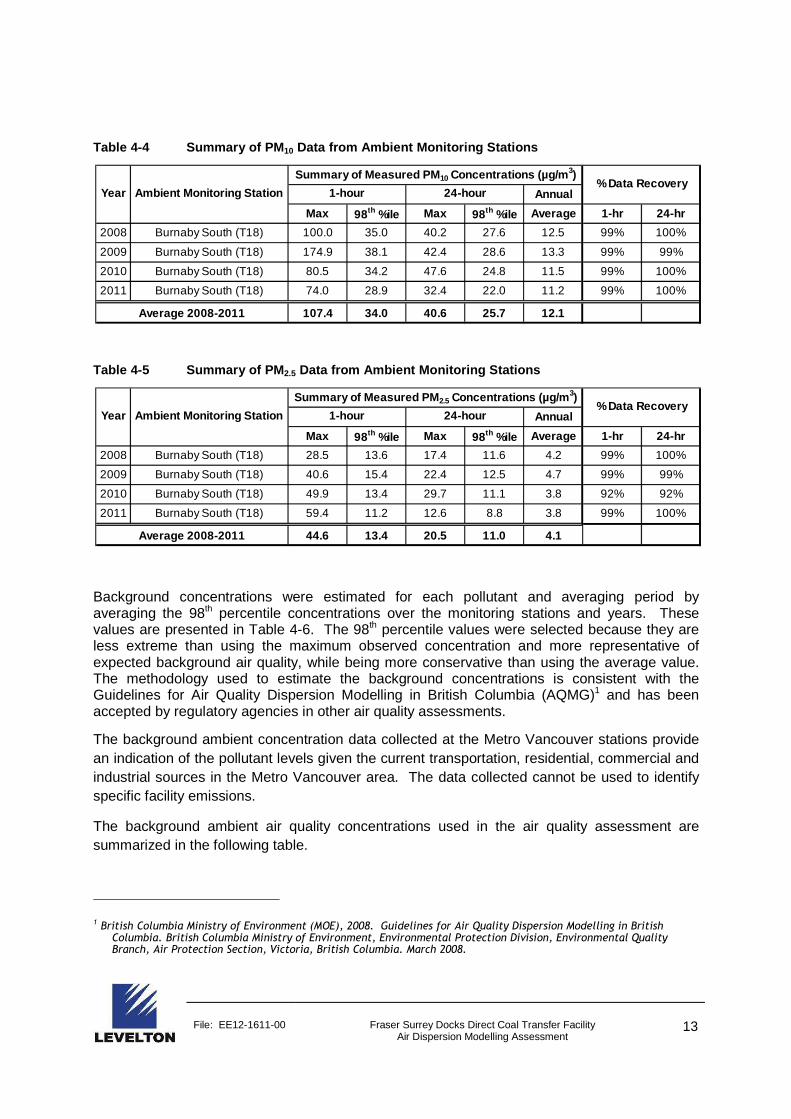
Table 4-4 Summary of PM 10 Data from Ambient Monitoring Stations
Table 4-5 Summary of PM 2.5 Data from Ambient Monitoring Stations
Background concentrations were estimated for each pollutant and averaging period by averaging the 98th percentile concentrations over the monitoring stations and years. These values are presented in Table 4-6. The 98th percentile values were selected because they are less extreme than using the maximum observed concentration and more representative of expected background air quality, while being more conservative than using the average value. The methodology used to estimate the background concentrations is consistent with the Guidelines for Air Quality Dispersion Modelling in British Columbia (AQMG)1 and has been accepted by regulatory agencies in other air quality assessments.
The background ambient concentration data collected at the Metro Vancouver stations provide an indication of the pollutant levels given the current transportation, residential, commercial and industrial sources in the Metro Vancouver area. The data collected cannot be used to identify specific facility emissions.
The background ambient air quality concentrations used in the air quality assessment are summarized in the following table.
1 British Columbia Ministry of Environment (MOE), 2008. Guidelines for Air Quality Dispersion Modelling in British Columbia. British Columbia Ministry of Environment, Environmental Protection Division, Environmental Quality Branch, Air Protection Section, Victoria, British Columbia. March 2008.
Annual
Max 98th %ile Max 98th %ile Average 1-hr 24-hr
2008 Burnaby South (T18) 100.0 35.0 40.2 27.6 12.5 99% 100%
2009 Burnaby South (T18) 174.9 38.1 42.4 28.6 13.3 99% 99%
2010 Burnaby South (T18) 80.5 34.2 47.6 24.8 11.5 99% 100%
2011 Burnaby South (T18) 74.0 28.9 32.4 22.0 11.2 99% 100%
107.4 34.0 40.6 25.7 12.1
Summary of Measured PM 10 Concentrations (µg/m 3)% Data Recovery
1-hour 24-hour
Average 2008-2011
Year Ambient Monitoring Station
Annual
Max 98th %ile Max 98th %ile Average 1-hr 24-hr
2008 Burnaby South (T18) 28.5 13.6 17.4 11.6 4.2 99% 100%
2009 Burnaby South (T18) 40.6 15.4 22.4 12.5 4.7 99% 99%
2010 Burnaby South (T18) 49.9 13.4 29.7 11.1 3.8 92% 92%
2011 Burnaby South (T18) 59.4 11.2 12.6 8.8 3.8 99% 100%
44.6 13.4 20.5 11.0 4.1Average 2008-2011
Year Ambient Monitoring Station
Summary of Measured PM 2.5 Concentrations (µg/m 3)% Data Recovery
1-hour 24-hour
File: EE12-1611-00 Fraser Surrey Docks Direct Coal Transfer Facility Air Dispersion Modelling Assessment
14
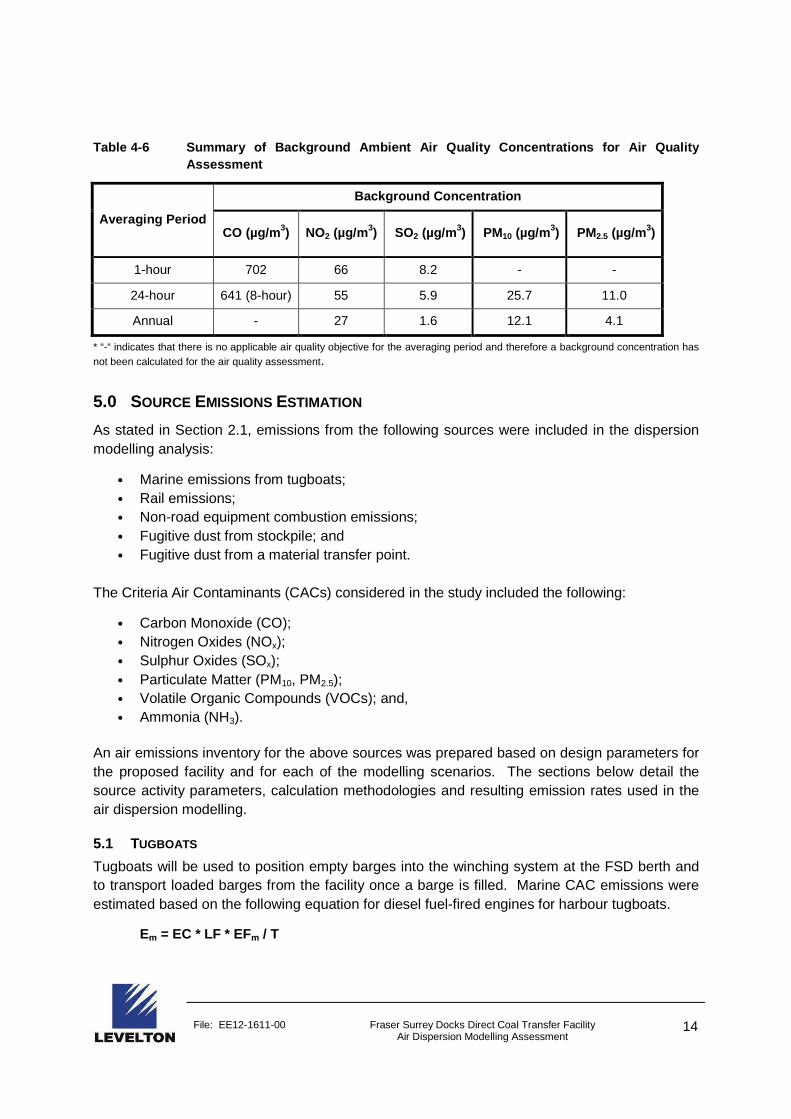
Table 4-6 Summary of Background Ambient Air Quality Concentrations for Air Quality Assessment
Averaging Period
Background Concentration
CO (µg/m 3) NO2 (µg/m 3) SO2 (µg/m 3) PM10 (µg/m 3) PM2.5 (µg/m 3)
1-hour 702 66 8.2 - -
24-hour 641 (8-hour) 55 5.9 25.7 11.0
Annual - 27 1.6 12.1 4.1
* “-“ indicates that there is no applicable air quality objective for the averaging period and therefore a background concentration has not been calculated for the air quality assessment.
5.0 SOURCE EMISSIONS ESTIMATION
As stated in Section 2.1, emissions from the following sources were included in the dispersion modelling analysis:
• Marine emissions from tugboats; • Rail emissions; • Non-road equipment combustion emissions; • Fugitive dust from stockpile; and • Fugitive dust from a material transfer point.
The Criteria Air Contaminants (CACs) considered in the study included the following:
• Carbon Monoxide (CO); • Nitrogen Oxides (NOx); • Sulphur Oxides (SOx); • Particulate Matter (PM10, PM2.5); • Volatile Organic Compounds (VOCs); and, • Ammonia (NH3).
An air emissions inventory for the above sources was prepared based on design parameters for the proposed facility and for each of the modelling scenarios. The sections below detail the source activity parameters, calculation methodologies and resulting emission rates used in the air dispersion modelling.
5.1 TUGBOATS
Tugboats will be used to position empty barges into the winching system at the FSD berth and to transport loaded barges from the facility once a barge is filled. Marine CAC emissions were estimated based on the following equation for diesel fuel-fired engines for harbour tugboats.
Em = EC * LF * EFm / T

File: EE12-1611-00 Fraser Surrey Docks Direct Coal Transfer Facility Air Dispersion Modelling Assessment
15
where:
Em = emission rate of a given pollutant from a tugboat engine (g/s)
EC = engine capacity (kW)
LF = engine load factor (fraction)
EFm = activity-based emission factors for a given pollutant (g/kWh)
T = operating time (seconds/hour)
Engine information for tugboats, supplied by the tug operator, is summarized in Table 5-1. Table 5-1 Tugboat Diesel Engine Data
Parameters
Tier Level Tier 1
Power Rating 1,400 HP (1,044 KW)
Load Factor 0.552
No. of Single-Tow Tug 1
No. of Tandem-Tow Tug 1
Tugboat combustion emission factors from the recent Environment Canada (EC) Canadian 2010 National Marine Emissions Inventory3 were adopted for this study. For SOx and PM emission factors, which are dependent on the fuel sulphur content, the correlations from the 2010 EC Inventory were applied. The SOx and PM emission factor correlations, along with the particulate size distribution, are shown in Table 5-2. For this study, a fuel sulphur content of 15 ppmw (mg/kg) was used in the corresponding correlations according to the level stipulated in the Regulations Amending the Sulphur in Diesel Fuel Regulations4 (2012) for diesel fuel produced, imported or sold for use in vessel engines after May 31, 2014. Table 5-2 SO x and PM Emission Factors for Harbour Tugboats
Source Emission Factor (g/kWh) Particulate Fractions
SOX PM PM10/PM Ratio PM 2.5/PM10 Ratio
Auxiliary Engine 4.2*S 0.4653*S + 0.25 0.96 0.92
S = sulphur content of fuel (%)
2 Metro Vancouver, 2010, “2005 LFV Air Emissions Inventory & Forecast and Backcast” for General Towing & Barging. 3 SNC-Lavalin, 2012, “Canadian 2010 National Marine Emissions Inventory”, Draft Final, April 17. 4 www.gazette.gc.ca/rp-pr/p2/2012/2012-07-04/html/sor-dors135-eng.html
File: EE12-1611-00 Fraser Surrey Docks Direct Coal Transfer Facility Air Dispersion Modelling Assessment
16
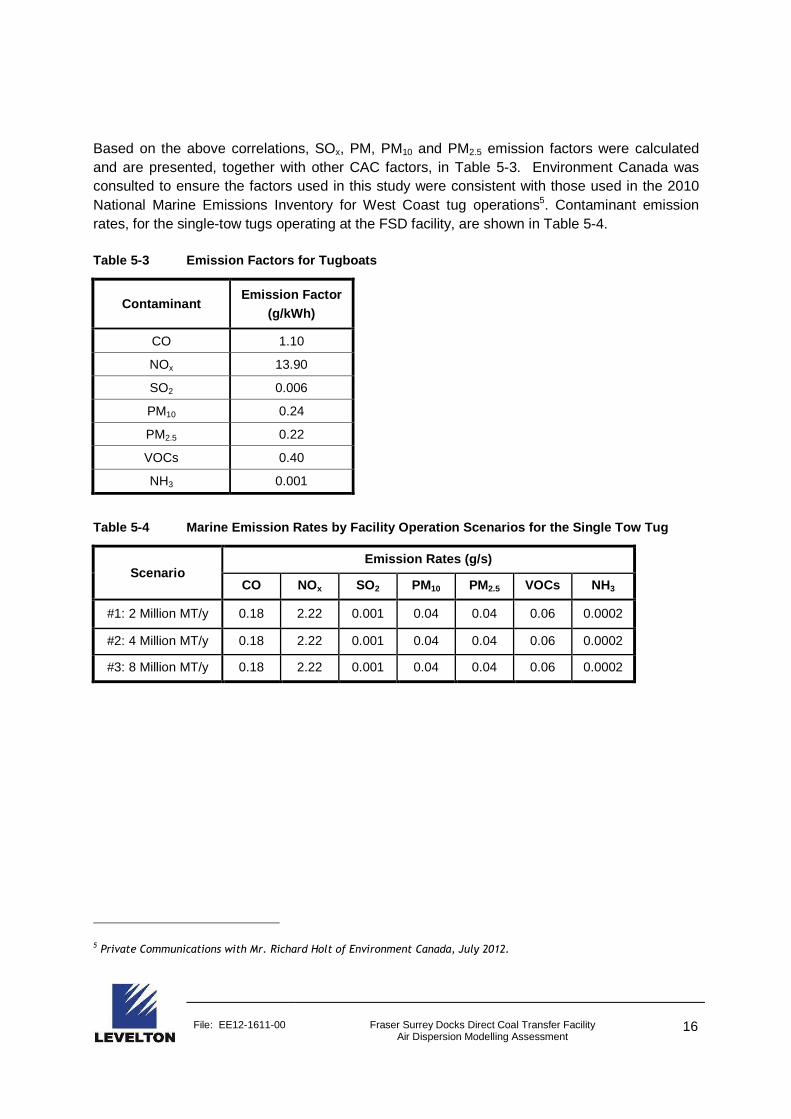
Based on the above correlations, SOx, PM, PM10 and PM2.5 emission factors were calculated and are presented, together with other CAC factors, in Table 5-3. Environment Canada was consulted to ensure the factors used in this study were consistent with those used in the 2010 National Marine Emissions Inventory for West Coast tug operations5. Contaminant emission rates, for the single-tow tugs operating at the FSD facility, are shown in Table 5-4. Table 5-3 Emission Factors for Tugboats
Contaminant Emission Factor
(g/kWh)
CO 1.10
NOx 13.90
SO2 0.006
PM10 0.24
PM2.5 0.22
VOCs 0.40
NH3 0.001
Table 5-4 Marine Emission Rates by Facility Operati on Scenarios for the Single Tow Tug
Scenario Emission Rates (g/s)
CO NOx SO2 PM10 PM2.5 VOCs NH3
#1: 2 Million MT/y 0.18 2.22 0.001 0.04 0.04 0.06 0.0002
#2: 4 Million MT/y 0.18 2.22 0.001 0.04 0.04 0.06 0.0002
#3: 8 Million MT/y 0.18 2.22 0.001 0.04 0.04 0.06 0.0002
5 Private Communications with Mr. Richard Holt of Environment Canada, July 2012.

File: EE12-1611-00 Fraser Surrey Docks Direct Coal Transfer Facility Air Dispersion Modelling Assessment
17
5.2 RAIL
For the proposed facility, CACs are emitted from the combustion of diesel fuel from incoming unit trains as well as by on-site yard locomotives used to assemble and disassemble rail cars. The general equation below is used to calculate rail engine emissions.
Er = FC * EFr / T
where:
Er = emissions of a given pollutant from a locomotive engine (g/s)
FC = fuel consumption rate (L/h)
EFr = fuel-based locomotive emission factors for a given pollutant (g/L fuel)
T = operating time (seconds/hour)
In order to apply the above emission factor method, fuel consumption data for the unit and yard engines was requested from FSD. The unit train engine and associated fuel consumption rate of 3 US gallons per hour during idling was subsequently provided for this study from BNSF (through FSD6). The unit train has 4 diesel engines at 4,500 HP each. For the single SW900 yard switching engine, HP output and corresponding fuel consumption data at each notch setting (N1 to N8) was provided by Southern Railway (through FSD7), except for idling and dynamic brake (DB) modes. The yard engine data provided is shown in Table 5-5. Table 5-5 Available SW900 Yard Locomotive HP and Fu el Consumption Data
Engine Mode HP Fuel Use at Each
Notch Setting (US gal/h)
N1 25 1.71
N2 120 8.22
N3 220 15.07
N4 375 25.68
N5 500 34.25
N6 750 51.37
N7 900 61.64
N8 1000 68.49
To estimate the missing HP output and fuel consumption for the idling and DB settings, the engine profiles from a MP15DC and an EMD GP9 facility locomotive engine, which are
6 Jurgen Franke, FSD (personal communication, September 5, 2012) 7 Jurgen Franke, FSD (personal communication, September 5, 2012)
File: EE12-1611-00 Fraser Surrey Docks Direct Coal Transfer Facility Air Dispersion Modelling Assessment
18
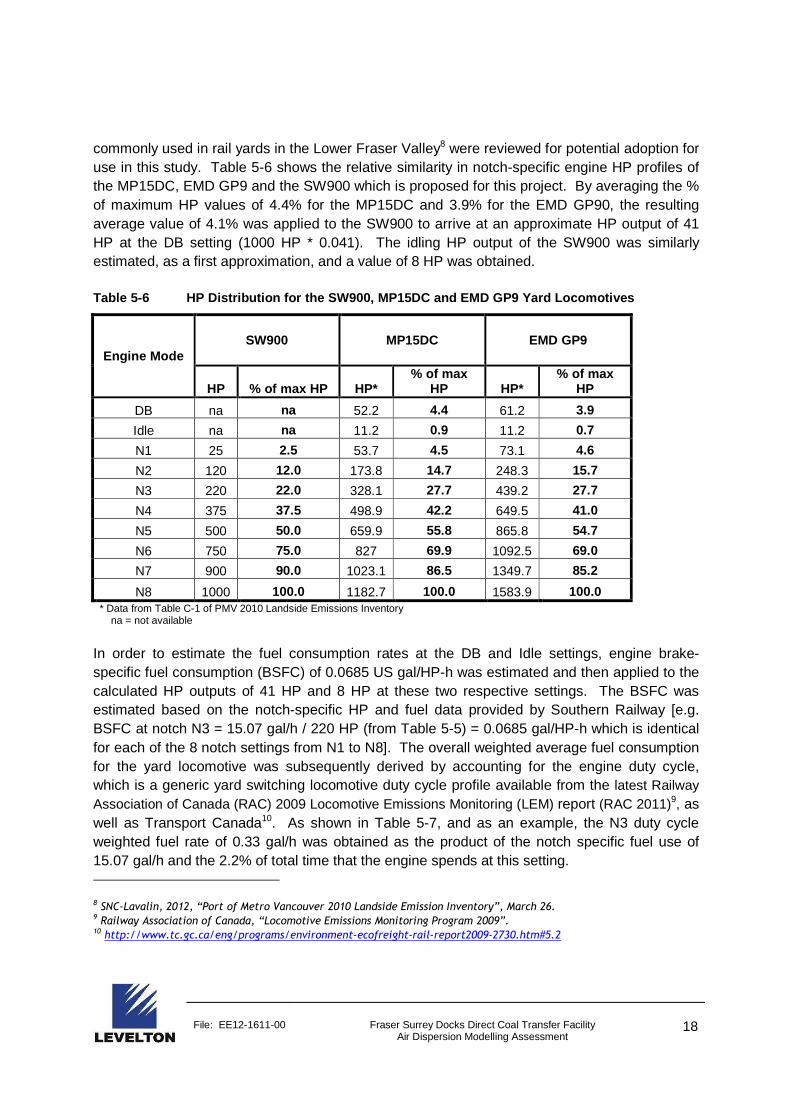
commonly used in rail yards in the Lower Fraser Valley8 were reviewed for potential adoption for use in this study. Table 5-6 shows the relative similarity in notch-specific engine HP profiles of the MP15DC, EMD GP9 and the SW900 which is proposed for this project. By averaging the % of maximum HP values of 4.4% for the MP15DC and 3.9% for the EMD GP90, the resulting average value of 4.1% was applied to the SW900 to arrive at an approximate HP output of 41 HP at the DB setting (1000 HP * 0.041). The idling HP output of the SW900 was similarly estimated, as a first approximation, and a value of 8 HP was obtained. Table 5-6 HP Distribution for the SW900, MP15DC and EMD GP9 Yard Locomotives
Engine Mode SW900 MP15DC EMD GP9
HP % of max HP HP* % of max
HP HP* % of max
HP
DB na na 52.2 4.4 61.2 3.9
Idle na na 11.2 0.9 11.2 0.7
N1 25 2.5 53.7 4.5 73.1 4.6
N2 120 12.0 173.8 14.7 248.3 15.7
N3 220 22.0 328.1 27.7 439.2 27.7
N4 375 37.5 498.9 42.2 649.5 41.0
N5 500 50.0 659.9 55.8 865.8 54.7
N6 750 75.0 827 69.9 1092.5 69.0
N7 900 90.0 1023.1 86.5 1349.7 85.2
N8 1000 100.0 1182.7 100.0 1583.9 100.0 * Data from Table C-1 of PMV 2010 Landside Emissions Inventory na = not available
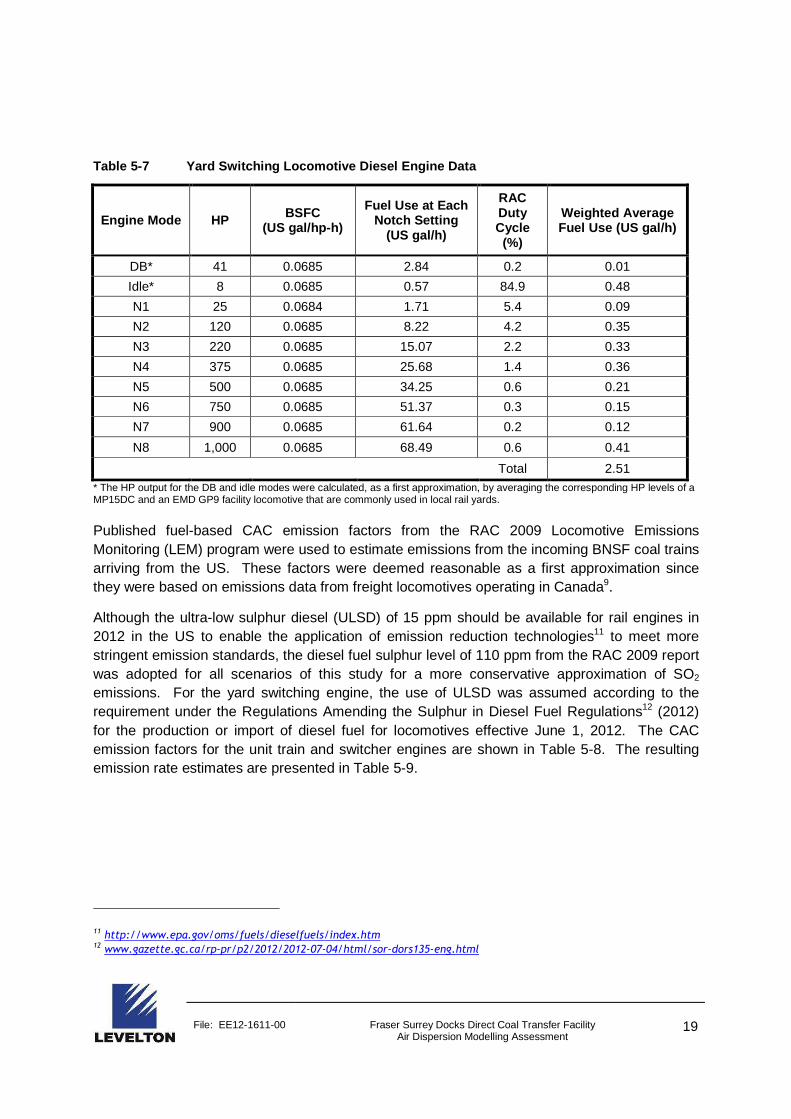
In order to estimate the fuel consumption rates at the DB and Idle settings, engine brake-specific fuel consumption (BSFC) of 0.0685 US gal/HP-h was estimated and then applied to the calculated HP outputs of 41 HP and 8 HP at these two respective settings. The BSFC was estimated based on the notch-specific HP and fuel data provided by Southern Railway [e.g. BSFC at notch N3 = 15.07 gal/h / 220 HP (from Table 5-5) = 0.0685 gal/HP-h which is identical for each of the 8 notch settings from N1 to N8]. The overall weighted average fuel consumption for the yard locomotive was subsequently derived by accounting for the engine duty cycle, which is a generic yard switching locomotive duty cycle profile available from the latest Railway Association of Canada (RAC) 2009 Locomotive Emissions Monitoring (LEM) report (RAC 2011)9, as well as Transport Canada10. As shown in Table 5-7, and as an example, the N3 duty cycle weighted fuel rate of 0.33 gal/h was obtained as the product of the notch specific fuel use of 15.07 gal/h and the 2.2% of total time that the engine spends at this setting.
8 SNC-Lavalin, 2012, “Port of Metro Vancouver 2010 Landside Emission Inventory”, March 26. 9 Railway Association of Canada, “Locomotive Emissions Monitoring Program 2009”. 10 http://www.tc.gc.ca/eng/programs/environment-ecofreight-rail-report2009-2730.htm#5.2
File: EE12-1611-00 Fraser Surrey Docks Direct Coal Transfer Facility Air Dispersion Modelling Assessment
19
Table 5-7 Yard Switching Locomotive Diesel Engine D ata
Engine Mode HP BSFC (US gal/hp-h)
Fuel Use at Each Notch Setting
(US gal/h)
RAC Duty Cycle
(%)
Weighted Average Fuel Use (US gal/h)
DB* 41 0.0685 2.84 0.2 0.01
Idle* 8 0.0685 0.57 84.9 0.48
N1 25 0.0684 1.71 5.4 0.09
N2 120 0.0685 8.22 4.2 0.35
N3 220 0.0685 15.07 2.2 0.33
N4 375 0.0685 25.68 1.4 0.36
N5 500 0.0685 34.25 0.6 0.21
N6 750 0.0685 51.37 0.3 0.15
N7 900 0.0685 61.64 0.2 0.12
N8 1,000 0.0685 68.49 0.6 0.41
Total 2.51 * The HP output for the DB and idle modes were calculated, as a first approximation, by averaging the corresponding HP levels of a MP15DC and an EMD GP9 facility locomotive that are commonly used in local rail yards.
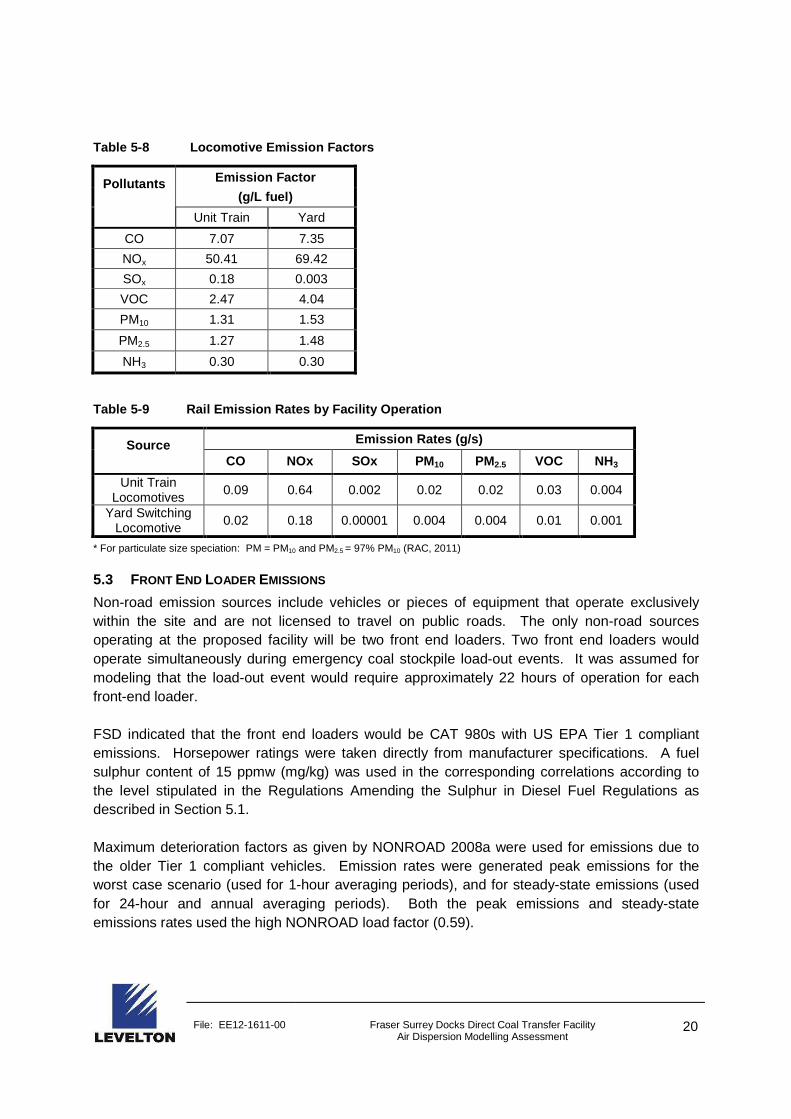
Published fuel-based CAC emission factors from the RAC 2009 Locomotive Emissions Monitoring (LEM) program were used to estimate emissions from the incoming BNSF coal trains arriving from the US. These factors were deemed reasonable as a first approximation since they were based on emissions data from freight locomotives operating in Canada9.
Although the ultra-low sulphur diesel (ULSD) of 15 ppm should be available for rail engines in 2012 in the US to enable the application of emission reduction technologies11 to meet more stringent emission standards, the diesel fuel sulphur level of 110 ppm from the RAC 2009 report was adopted for all scenarios of this study for a more conservative approximation of SO2 emissions. For the yard switching engine, the use of ULSD was assumed according to the requirement under the Regulations Amending the Sulphur in Diesel Fuel Regulations12 (2012) for the production or import of diesel fuel for locomotives effective June 1, 2012. The CAC emission factors for the unit train and switcher engines are shown in Table 5-8. The resulting emission rate estimates are presented in Table 5-9.
11 http://www.epa.gov/oms/fuels/dieselfuels/index.htm 12 www.gazette.gc.ca/rp-pr/p2/2012/2012-07-04/html/sor-dors135-eng.html
File: EE12-1611-00 Fraser Surrey Docks Direct Coal Transfer Facility Air Dispersion Modelling Assessment
20
Table 5-8 Locomotive Emission Factors
Pollutants
Emission Factor
(g/L fuel)
Unit Train Yard
CO 7.07 7.35
NOx 50.41 69.42
SOx 0.18 0.003
VOC 2.47 4.04
PM10 1.31 1.53
PM2.5 1.27 1.48
NH3 0.30 0.30
Table 5-9 Rail Emission Rates by Facility Operation
Source Emission Rates (g/s)
CO NOx SOx PM 10 PM2.5 VOC NH3
Unit Train Locomotives
0.09 0.64 0.002 0.02 0.02 0.03 0.004
Yard Switching Locomotive
0.02 0.18 0.00001 0.004 0.004 0.01 0.001
* For particulate size speciation: PM = PM10 and PM2.5 = 97% PM10 (RAC, 2011)
5.3 FRONT END LOADER EMISSIONS
Non-road emission sources include vehicles or pieces of equipment that operate exclusively within the site and are not licensed to travel on public roads. The only non-road sources operating at the proposed facility will be two front end loaders. Two front end loaders would operate simultaneously during emergency coal stockpile load-out events. It was assumed for modeling that the load-out event would require approximately 22 hours of operation for each front-end loader. FSD indicated that the front end loaders would be CAT 980s with US EPA Tier 1 compliant emissions. Horsepower ratings were taken directly from manufacturer specifications. A fuel sulphur content of 15 ppmw (mg/kg) was used in the corresponding correlations according to the level stipulated in the Regulations Amending the Sulphur in Diesel Fuel Regulations as described in Section 5.1. Maximum deterioration factors as given by NONROAD 2008a were used for emissions due to the older Tier 1 compliant vehicles. Emission rates were generated peak emissions for the worst case scenario (used for 1-hour averaging periods), and for steady-state emissions (used for 24-hour and annual averaging periods). Both the peak emissions and steady-state emissions rates used the high NONROAD load factor (0.59).
File: EE12-1611-00 Fraser Surrey Docks Direct Coal Transfer Facility Air Dispersion Modelling Assessment
21
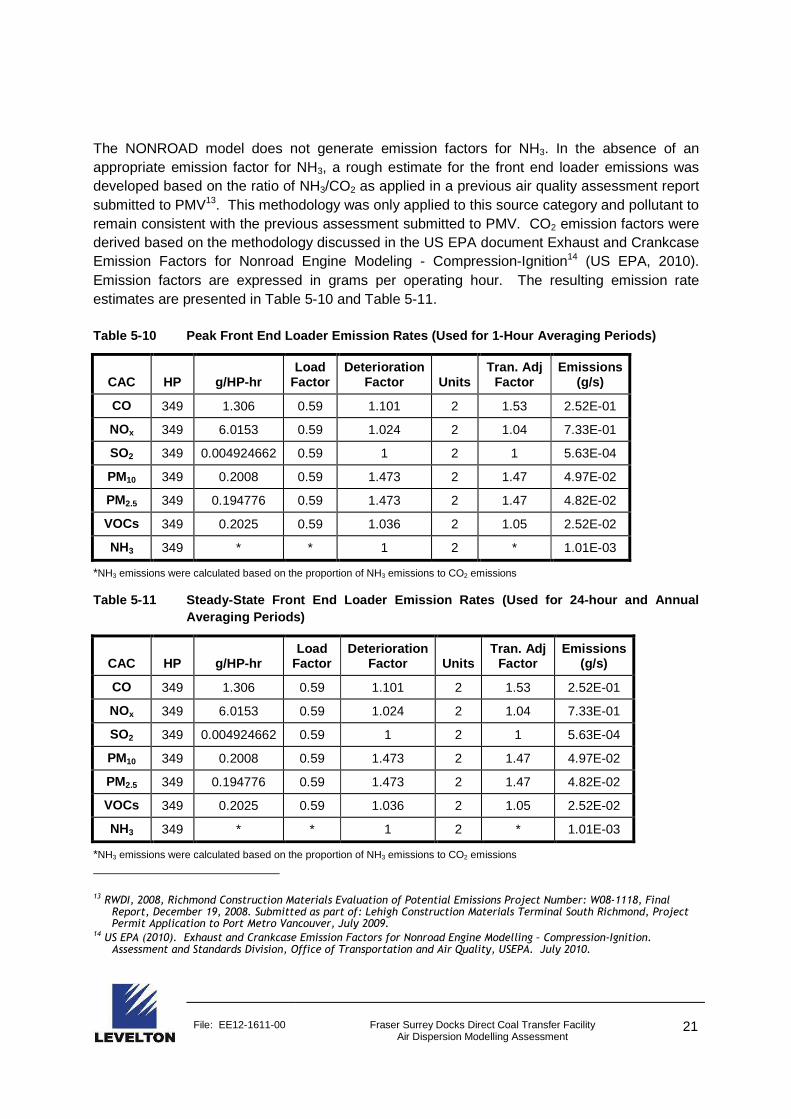
The NONROAD model does not generate emission factors for NH3. In the absence of an appropriate emission factor for NH3, a rough estimate for the front end loader emissions was developed based on the ratio of NH3/CO2 as applied in a previous air quality assessment report submitted to PMV13. This methodology was only applied to this source category and pollutant to remain consistent with the previous assessment submitted to PMV. CO2 emission factors were derived based on the methodology discussed in the US EPA document Exhaust and Crankcase Emission Factors for Nonroad Engine Modeling - Compression-Ignition14 (US EPA, 2010). Emission factors are expressed in grams per operating hour. The resulting emission rate estimates are presented in Table 5-10 and Table 5-11. Table 5-10 Peak Front End Loader Emission Rates (Us ed for 1-Hour Averaging Periods)
CAC HP g/HP-hr Load
Factor Deterioration
Factor Units Tran. Adj
Factor Emissions
(g/s)
CO 349 1.306 0.59 1.101 2 1.53 2.52E-01
NOx 349 6.0153 0.59 1.024 2 1.04 7.33E-01
SO2 349 0.004924662 0.59 1 2 1 5.63E-04
PM10 349 0.2008 0.59 1.473 2 1.47 4.97E-02
PM2.5 349 0.194776 0.59 1.473 2 1.47 4.82E-02
VOCs 349 0.2025 0.59 1.036 2 1.05 2.52E-02
NH3 349 * * 1 2 * 1.01E-03
*NH3 emissions were calculated based on the proportion of NH3 emissions to CO2 emissions Table 5-11 Steady-State Front End Loader Emission R ates (Used for 24-hour and Annual
Averaging Periods)
CAC HP g/HP-hr Load
Factor Deterioration
Factor Units Tran. Adj
Factor Emissions
(g/s)
CO 349 1.306 0.59 1.101 2 1.53 2.52E-01
NOx 349 6.0153 0.59 1.024 2 1.04 7.33E-01
SO2 349 0.004924662 0.59 1 2 1 5.63E-04
PM10 349 0.2008 0.59 1.473 2 1.47 4.97E-02
PM2.5 349 0.194776 0.59 1.473 2 1.47 4.82E-02
VOCs 349 0.2025 0.59 1.036 2 1.05 2.52E-02
NH3 349 * * 1 2 * 1.01E-03
*NH3 emissions were calculated based on the proportion of NH3 emissions to CO2 emissions
13 RWDI, 2008, Richmond Construction Materials Evaluation of Potential Emissions Project Number: W08-1118, Final Report, December 19, 2008. Submitted as part of: Lehigh Construction Materials Terminal South Richmond, Project Permit Application to Port Metro Vancouver, July 2009.
14 US EPA (2010). Exhaust and Crankcase Emission Factors for Nonroad Engine Modelling – Compression-Ignition. Assessment and Standards Division, Office of Transportation and Air Quality, USEPA. July 2010.
File: EE12-1611-00 Fraser Surrey Docks Direct Coal Transfer Facility Air Dispersion Modelling Assessment
22
5.4 COAL STOCKPILE
Fugitive dust from the emergency coal stockpile at FSD would be generated by the surface erosion of active storage piles exposed to the wind. The method selected for determining fugitive emissions from wind erosion was from the AWMA Air Pollution Engineering Manual15.
The following equation was used to estimate the particulate emissions from the storage piles:
Emission Rate = (Emission Factor) x (Area/Source) x (1-Control Efficiency)
ER = EF x AS x (1-CE)
The emission factor equation is shown below:
EF = γ0[s/1.5] [(365 – p)/235] [f/15]
where:
EF = total particulate emissions [kg/day]
γ0 = conversion factor of 1.9 [kg/day/hectare)
s = silt content [%]
p = number of days with >= 0.25mm of precipitation per year
f = percentage of time that the wind speed exceeds 5.4 m/s
The exposed surface area was estimated based on drawings provided FSD. The silt content of each stockpile was adopted from a sieve analysis spreadsheet provided by FSD. Unbound (sorbed) moisture content data of the coal was not available; therefore averages of Western Surface Mining Coal (Table 13.2.4-1) from the USEPA AP-4216 were used for this analysis.
Meteorological statistics were determined from two different sources: precipitation data from 1992 – 2011 T13 North Delta meteorological station, and wind data from 2002 - 2011 Metro Vancouver T38 Annacis Island meteorological station. Emissions from the emergency coal stockpile were conservatively calculated as if the full stockpile capacity was maintained year-round.
Guidance from the Environment Canada NPRI Toolbox17 indicates that stockpile wind erosion control efficiencies of 50 to 95% are achievable with water suppression alone. An average control efficiency of 70% was applied as FSD indicated in their Construction Permit Application18
15 Air and Waste Management Association (AWMA), 2000. Air Pollution Engineering Manual, Second Edition, Wiley-Interscience Publication, edited by Wayne T. Davis.
16 USEPA (2006) AP42, Fifth Edition, Volume I. Chapter 13: Miscellaneous Sources. Aggregate Handling and Storage Piles 17 NPRI (2009) Environment Canada – Pollution and Waste – Pits and Quarries Guidance. NPRI Toolbox. http://www.ec.gc.ca/inrp-npri/default.asp?lang=En&n=A9C1EE34-1. Last accessed September 20th, 2012 18 FSD (2012) Direct Transfer Coal Facility, Construction Permit Application. Detailed Facility Information – June 15,
2012.
File: EE12-1611-00 Fraser Surrey Docks Direct Coal Transfer Facility Air Dispersion Modelling Assessment
23
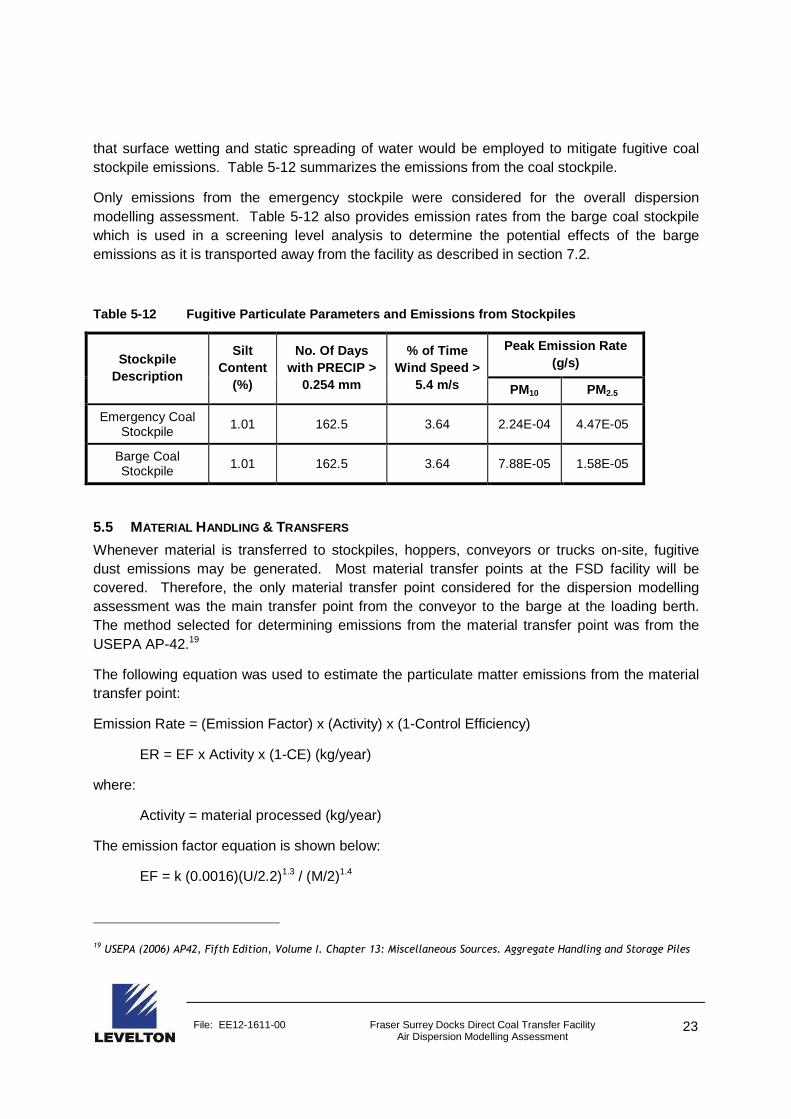
that surface wetting and static spreading of water would be employed to mitigate fugitive coal stockpile emissions. Table 5-12 summarizes the emissions from the coal stockpile.
Only emissions from the emergency stockpile were considered for the overall dispersion modelling assessment. Table 5-12 also provides emission rates from the barge coal stockpile which is used in a screening level analysis to determine the potential effects of the barge emissions as it is transported away from the facility as described in section 7.2.
Table 5-12 Fugitive Particulate Parameters and Emis sions from Stockpiles
Stockpile Description
Silt Content
(%)
No. Of Days with PRECIP >
0.254 mm
% of Time Wind Speed >
5.4 m/s
Peak Emission Rate (g/s)
PM10 PM2.5
Emergency Coal Stockpile
1.01 162.5 3.64 2.24E-04 4.47E-05
Barge Coal Stockpile 1.01 162.5 3.64 7.88E-05 1.58E-05
5.5 MATERIAL HANDLING & TRANSFERS
Whenever material is transferred to stockpiles, hoppers, conveyors or trucks on-site, fugitive dust emissions may be generated. Most material transfer points at the FSD facility will be covered. Therefore, the only material transfer point considered for the dispersion modelling assessment was the main transfer point from the conveyor to the barge at the loading berth. The method selected for determining emissions from the material transfer point was from the USEPA AP-42.19
The following equation was used to estimate the particulate matter emissions from the material transfer point:
Emission Rate = (Emission Factor) x (Activity) x (1-Control Efficiency)
ER = EF x Activity x (1-CE) (kg/year)
where:
Activity = material processed (kg/year)
The emission factor equation is shown below:
EF = k (0.0016)(U/2.2)1.3 / (M/2)1.4
19 USEPA (2006) AP42, Fifth Edition, Volume I. Chapter 13: Miscellaneous Sources. Aggregate Handling and Storage Piles
File: EE12-1611-00 Fraser Surrey Docks Direct Coal Transfer Facility Air Dispersion Modelling Assessment
24
where:
EF = particulate emissions (kg/Mg)
U = mean wind speed (m/s)
M = material moisture content (%)
k = particle size multiplier constant for PM10 and PM2.5
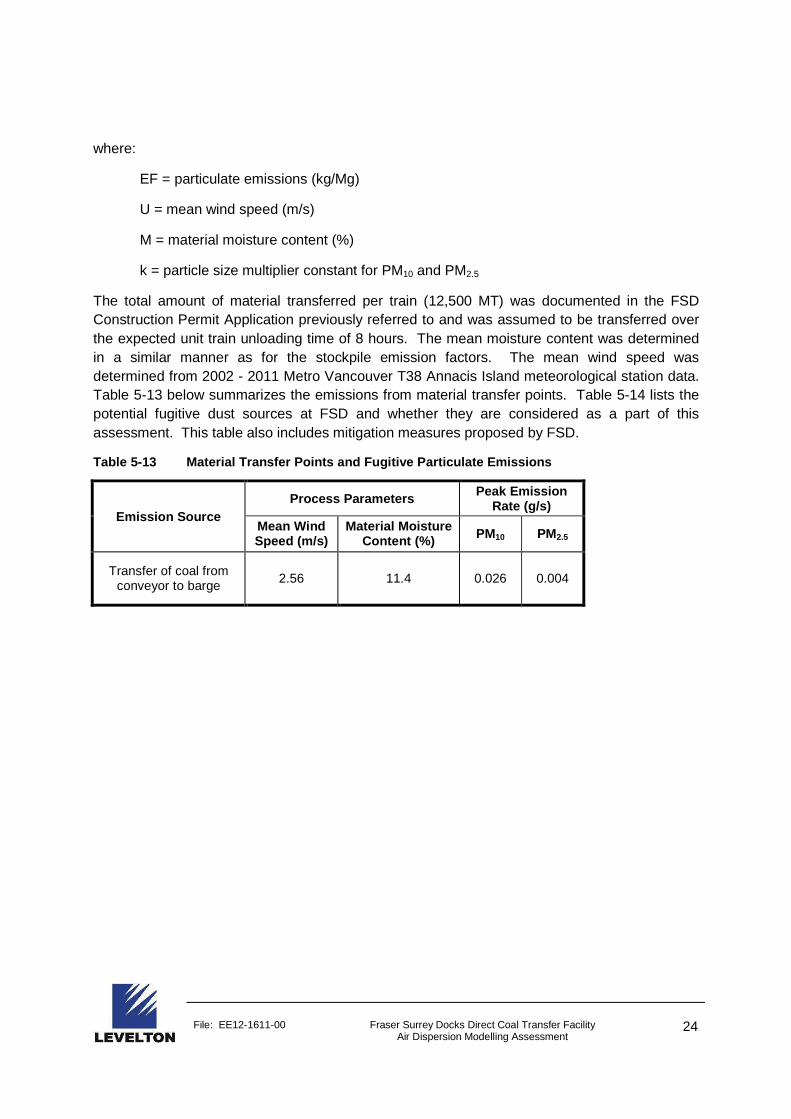
The total amount of material transferred per train (12,500 MT) was documented in the FSD Construction Permit Application previously referred to and was assumed to be transferred over the expected unit train unloading time of 8 hours. The mean moisture content was determined in a similar manner as for the stockpile emission factors. The mean wind speed was determined from 2002 - 2011 Metro Vancouver T38 Annacis Island meteorological station data. Table 5-13 below summarizes the emissions from material transfer points. Table 5-14 lists the potential fugitive dust sources at FSD and whether they are considered as a part of this assessment. This table also includes mitigation measures proposed by FSD.
Table 5-13 Material Transfer Points and Fugitive Pa rticulate Emissions
Emission Source Process Parameters Peak Emission
Rate (g/s)
Mean Wind Speed (m/s)
Material Moisture Content (%) PM10 PM2.5
Transfer of coal from conveyor to barge 2.56 11.4 0.026 0.004

File: EE12-1611-00 Fraser Surrey Docks Direct Coal Transfer Facility Air Dispersion Modelling Assessment
25
Table 5-14 Fugitive dust sources as defined in FSD 's Construction Permit Application
Fugitive Dust Emission Source Proposed Mitigation Measures Assessed Source in Modelling(Yes/No)
Loaded rail cars in PARY
Best Practices at point of loading: Possible veneer suppressant applied (binds the surface particles together to provide a membrane that is resistant to dust lift off, car sill brushes to remove excess coal on wagon sills, best car loading practices and profiles. Trains to be received and spotted via industry and FSD SOP and SWP (i.e. smoother braking functionality).
No
Loaded rail cars on Terminal Rail
Best Practices at point of loading: Possible veneer suppressant applied (binds the surface particles together to provide a membrane that is resistant to dust lift off, car sill brushes to remove excess coal on wagon sills, best car loading practices and profiles. Trains to be received and spotted via industry and FSD SOP and SWP (i.e. smoother braking functionality, slower speeds).
No
Rail car transfer at dual dump pit
Best Practices at point of loading: Possible veneer suppressant applied (binds the surface particles together to provide a membrane that is resistant to dust lift off, car sill brushes to remove excess coal on wagon sills, best car loading practices and profiles. Trains to be received and spotted via industry and FSD SOP and SWP (i.e. smoother braking functionality, slower speeds).
No
Empty rail cars on terminal rail Negligible, none required. No
Empty rail cars on in PARY Negligible, none required. No
Dual dumper pit operation
Atomized water mist/fog system projected directly at both sides and tops of both bottom dump rail car unloading pits. Covered building. Operations completed using industry best practice techniques for bottom dump cars. Increased pit wall height and grate height to reduce/eliminate coal ploughing and spillage and turbulence
No
Quad conveyors existing dual dumper pit
Conveyor with spill tray. Profiling of coal onto conveyor not to exceed belt height to limit exposure to air flow.
No
Transfer point #1 Passive technology: “Stilling Enclosure”, baffles, belt skirting, shrouds, and curved chutes.
No

File: EE12-1611-00 Fraser Surrey Docks Direct Coal Transfer Facility Air Dispersion Modelling Assessment
26
Fugitive Dust Emission Source Proposed Mitigation Measures Assessed Source in Modelling(Yes/No)
60" transfer conveyor #1 Conveyor with spill tray. Profiling of coal onto conveyor not to exceed belt height to limit exposure to air flow.
No
Transfer point #2 Passive technology: “Stilling Enclosure”, baffles, belt skirting, shrouds, and curved chutes.
No
60" Transfer Conveyor #2 Conveyor with spill tray. Profiling of coal onto conveyor not to exceed belt height to limit exposure to air flow.
No
Transfer point #3 Passive technology: “Stilling Enclosure”, baffles, belt skirting, shrouds, and curved chutes.
No
Barge loader Conveyor with spill tray. Profiling of coal onto conveyor not to exceed belt height to limit exposure to air flow.
No
Transfer Point #4/#5 - barge/stockpile loading
Barges and stockpile to be loaded via industry and FSD SOP and SWP. Limiting drop heights. Extended side walls on barges to reduce air flow. Short directional snorkel off of barge loader to reduce turbulence. Spray bar/misting when required, i.e. dry environments. Anemometer and dust monitor real time data logger on the tip of the barge loader to govern operations per SOP’s. Best Practices barge loading to minimize dust and spillage i.e. load plan.
Yes
Empty barges typing up at Berth 2
Negligible, none required. No
Warping of barges Negligible, none required. No
Full barge tied up at Berth 2 Best Practices barge loading to minimize dust and spillage i.e. load plan. Spray/misting when required, i.e. dry environments.
No*
Full barge transit to Texada Best Practices barge loading to minimize dust and spillage i.e. load plan. Spray/misting when required, i.e. dry environments.
No
Stockpile Surface wetting/static spreading of water, i.e. rain birds. Yes
File: EE12-1611-00 Fraser Surrey Docks Direct Coal Transfer Facility Air Dispersion Modelling Assessment
27
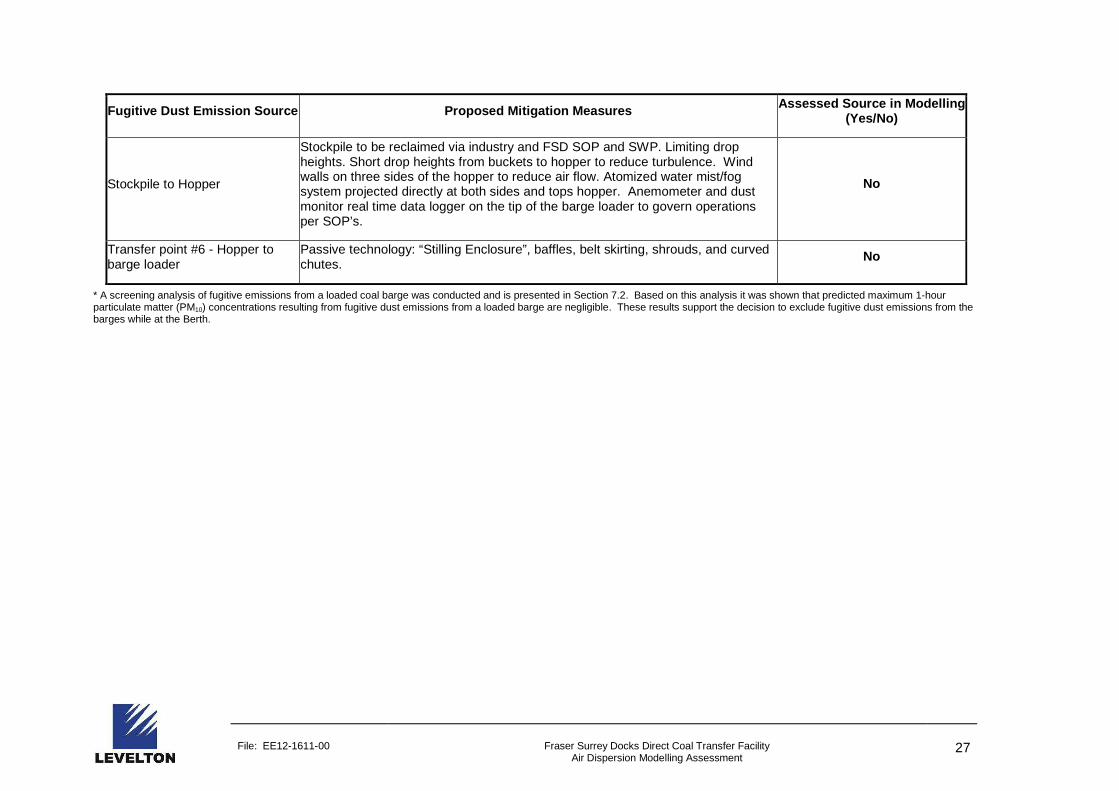
Fugitive Dust Emission Source Proposed Mitigation Measures Assessed Source in Modelling(Yes/No)
Stockpile to Hopper
Stockpile to be reclaimed via industry and FSD SOP and SWP. Limiting drop heights. Short drop heights from buckets to hopper to reduce turbulence. Wind walls on three sides of the hopper to reduce air flow. Atomized water mist/fog system projected directly at both sides and tops hopper. Anemometer and dust monitor real time data logger on the tip of the barge loader to govern operations per SOP’s.
No
Transfer point #6 - Hopper to barge loader
Passive technology: “Stilling Enclosure”, baffles, belt skirting, shrouds, and curved chutes.
No
* A screening analysis of fugitive emissions from a loaded coal barge was conducted and is presented in Section 7.2. Based on this analysis it was shown that predicted maximum 1-hour particulate matter (PM10) concentrations resulting from fugitive dust emissions from a loaded barge are negligible. These results support the decision to exclude fugitive dust emissions from the barges while at the Berth.
File: EE12-1611-00 Fraser Surrey Docks Direct Coal Transfer Facility Air Dispersion Modelling Assessment
28
6.0 CALMET AND CALPUFF MODELLING METHODOLOGY
Air dispersion modelling was conducted following the methods recommended in the AQMG with guidance from PMV and Metro Vancouver. This section presents a summary of the modelling methods.
The CALPUFF model suite was used for this analysis. CALPUFF is a suite of numerical models (CALMET, CALPUFF, and CALPOST) that are used in series to determine the impact of emissions in the vicinity of a source or group of sources. Detailed three-dimensional meteorological fields were produced by the diagnostic computer model CALMET (version 5.8, BC Ministry of Environment (MOE) and US EPA approved version), based on surface and upper air weather data, digital land use data, terrain data, and prognostic meteorological data. The three-dimensional fields produced by CALMET were used by CALPUFF (version 5.8, MOE and US EPA approved version), a three-dimensional, multi-species, non-steady-state Gaussian puff dispersion model that can simulate the effects of time and space varying meteorological conditions on pollutant transport. Finally CALPOST, a statistical processing program, was used to summarize and tabulate the pollutant concentrations calculated by CALPUFF.
The three-dimensional CALMET meteorological fields were generated using meteorological data from numerous surface stations and upper air stations, prognostic meteorological data from the Mesoscale Compressible Community (MC2) model, and digital terrain and land use data.
6.1 DOMAIN AND RECEPTORS
The CALMET modelling domain is a 35 km by 35 km area centered on the FSD facility. The CALMET domain was characterized using 250 m grid resolution and nine vertical layers. Details of the CALMET modelling methodology are provided in the Appendix A.
The CALPUFF modelling domain is a 20 km by 20 km area centered on the facility. Within the domain, a nested sampling grid of receptors was created with the following spatial distribution:
• 20 m spacing along the terminal boundary;
• 50 m spacing within 500 metres of the terminal;
• 250 m spacing within 2 km of the centre of the terminal;
• 500 m spacing within 5 km of the centre of the terminal; and
• 1000 m beyond 5 km of the terminal.
Receptors were not included within the FSD facility boundary, where the AAQO are not applicable. A 1.5 m receptor height was used to simulate the average height of human air intake. Figure 6-1 shows the CALPUFF domain including the receptors.

File: EE12-1611-00 Fraser Surrey Docks Direct Coal Transfer Facility Air Dispersion Modelling Assessment
29
Figure 6-1 CALMET and CALPUFF Modelling Domain with Receptor Locations
6.2 CALPUFF MODELLING OPTIONS
The CALPUFF dispersion model was used to model ambient concentrations of pollutants from the sources described in Section 5. The model used 9,336 hours of CALMET data which is equivalent to 389 days. The total number of modelled hours was used to determine the maximum hourly and daily concentrations. The annual concentrations were determined from the entire run time dataset.
CALPUFF model options chosen were consistent with those outlined for CALMET/CALPUFF in the AQMG.
File: EE12-1611-00 Fraser Surrey Docks Direct Coal Transfer Facility Air Dispersion Modelling Assessment
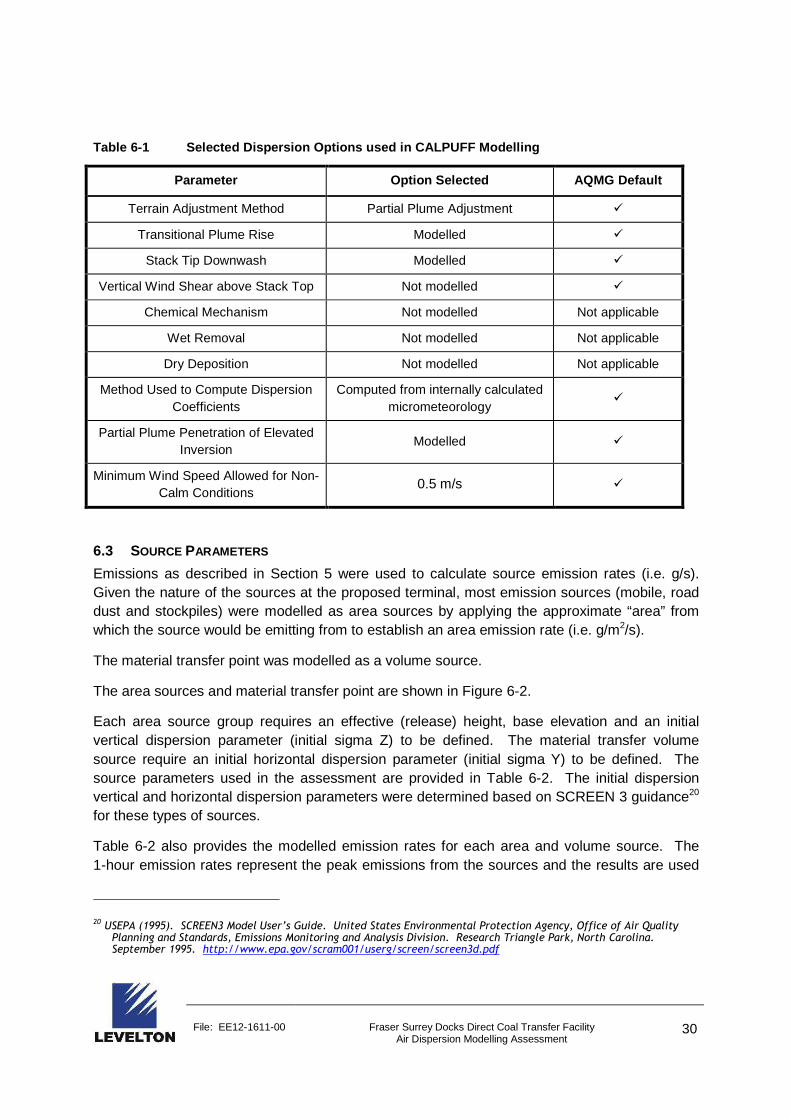
30
Table 6-1 Selected Dispersion Options used in CALP UFF Modelling
Parameter Option Selected AQMG Default
Terrain Adjustment Method Partial Plume Adjustment �
Transitional Plume Rise Modelled �
Stack Tip Downwash Modelled �
Vertical Wind Shear above Stack Top Not modelled �
Chemical Mechanism Not modelled Not applicable
Wet Removal Not modelled Not applicable
Dry Deposition Not modelled Not applicable
Method Used to Compute Dispersion Coefficients
Computed from internally calculated micrometeorology
�
Partial Plume Penetration of Elevated Inversion
Modelled �
Minimum Wind Speed Allowed for Non-Calm Conditions
0.5 m/s �
6.3 SOURCE PARAMETERS
Emissions as described in Section 5 were used to calculate source emission rates (i.e. g/s). Given the nature of the sources at the proposed terminal, most emission sources (mobile, road dust and stockpiles) were modelled as area sources by applying the approximate “area” from which the source would be emitting from to establish an area emission rate (i.e. g/m2/s).
The material transfer point was modelled as a volume source.
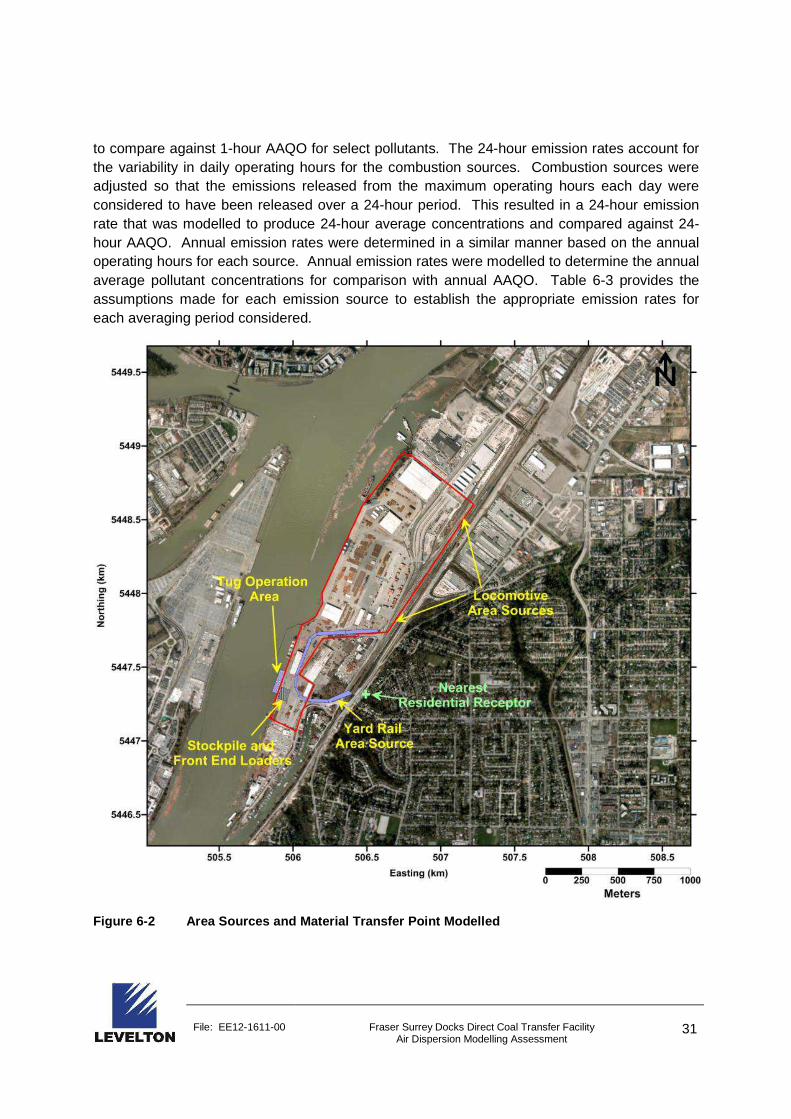
The area sources and material transfer point are shown in Figure 6-2.
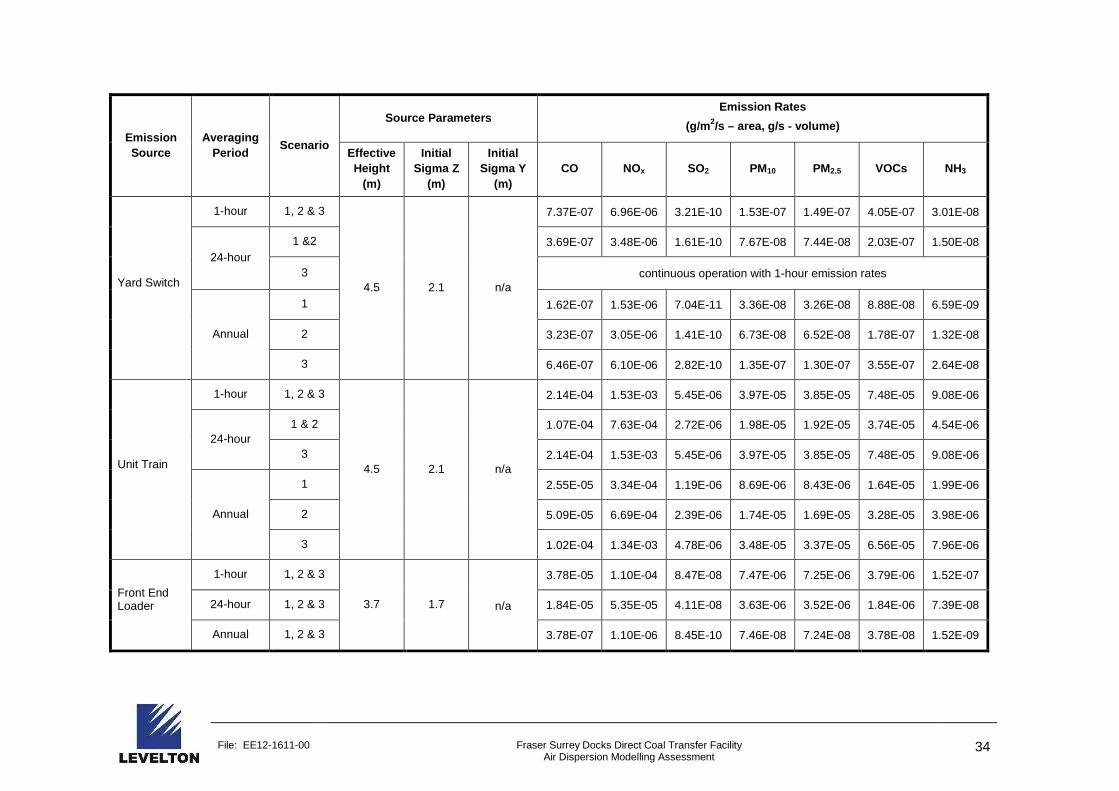
Each area source group requires an effective (release) height, base elevation and an initial vertical dispersion parameter (initial sigma Z) to be defined. The material transfer volume source require an initial horizontal dispersion parameter (initial sigma Y) to be defined. The source parameters used in the assessment are provided in Table 6-2. The initial dispersion vertical and horizontal dispersion parameters were determined based on SCREEN 3 guidance20 for these types of sources.
Table 6-2 also provides the modelled emission rates for each area and volume source. The 1-hour emission rates represent the peak emissions from the sources and the results are used
20 USEPA (1995). SCREEN3 Model User’s Guide. United States Environmental Protection Agency, Office of Air Quality
Planning and Standards, Emissions Monitoring and Analysis Division. Research Triangle Park, North Carolina. September 1995. http://www.epa.gov/scram001/userg/screen/screen3d.pdf
File: EE12-1611-00 Fraser Surrey Docks Direct Coal Transfer Facility Air Dispersion Modelling Assessment
31
to compare against 1-hour AAQO for select pollutants. The 24-hour emission rates account for the variability in daily operating hours for the combustion sources. Combustion sources were adjusted so that the emissions released from the maximum operating hours each day were considered to have been released over a 24-hour period. This resulted in a 24-hour emission rate that was modelled to produce 24-hour average concentrations and compared against 24-hour AAQO. Annual emission rates were determined in a similar manner based on the annual operating hours for each source. Annual emission rates were modelled to determine the annual average pollutant concentrations for comparison with annual AAQO. Table 6-3 provides the assumptions made for each emission source to establish the appropriate emission rates for each averaging period considered.
Figure 6-2 Area Sources and Material Transfer Point Modelled

File: EE12-1611-00 Fraser Surrey Docks Direct Coal Transfer Facility Air Dispersion Modelling Assessment
32
Figure 6-3 Closer View of Area Sources Modelled

File: EE12-1611-00 Fraser Surrey Docks Direct Coal Transfer Facility Air Dispersion Modelling Assessment
33
Table 6-2 Modelling Source Parameters and Emission Rates
Emission Source
Averaging Period
Scenario
Source Parameters Emission Rates
(g/m 2/s – area, g/s - volume)
Effective Height
(m)
Initial Sigma Z
(m)
Initial Sigma Y
(m) CO NOx SO2 PM10 PM2.5 VOCs NH3
Coal Stockpile
All 1,2 & 3 5.0 2.3 n/a - - - 4.42E-08 8.85E-09 - -
MT to Barge
1-hour 1,2 & 3
15.0 7.0 0.35
- - - 2.59E-02 3.92E-03 - -
24-hour 1&2 - - - 8.62E-03 1.31E-03 - -
3 - - - 1.72E-02 2.61E-03 - -
Annual
1 - - - 3.78E-03 5.72E-04 - -
2 - - - 7.56E-03 1.14E-03 - -
3 - - - 1.51E-02 2.29E-03 - -
Tugboats
1-hour 1,2 & 3
4.0 1.9 n/a
2.80E-05 3.54E-04 1.60E-07 6.12E-06 5.63E-06 1.02E-05 2.54E-08
24-hour 1&2 2.33E-06 2.95E-05 1.34E-08 5.10E-07 4.70E-07 8.48E-07 2.12E-09
3 4.67E-06 5.90E-05 2.67E-08 1.02E-06 9.39E-07 1.70E-06 4.24E-09
Annual
1 1.02E-06 1.29E-05 5.86E-09 2.24E-07 2.06E-07 3.72E-07 9.30E-10
2 2.05E-06 2.58E-05 1.17E-08 4.47E-07 4.12E-07 7.44E-07 1.86E-09
3 4.09E-06 5.17E-05 2.34E-08 8.95E-07 8.23E-07 1.49E-06 3.72E-09
File: EE12-1611-00 Fraser Surrey Docks Direct Coal Transfer Facility Air Dispersion Modelling Assessment
34
Emission Source
Averaging Period
Scenario
Source Parameters Emission Rates
(g/m 2/s – area, g/s - volume)
Effective Height
(m)
Initial Sigma Z
(m)
Initial Sigma Y
(m) CO NOx SO2 PM10 PM2.5 VOCs NH3
Yard Switch
1-hour 1, 2 & 3
4.5 2.1 n/a
7.37E-07 6.96E-06 3.21E-10 1.53E-07 1.49E-07 4.05E-07 3.01E-08
24-hour 1 &2 3.69E-07 3.48E-06 1.61E-10 7.67E-08 7.44E-08 2.03E-07 1.50E-08
3 continuous operation with 1-hour emission rates
Annual
1 1.62E-07 1.53E-06 7.04E-11 3.36E-08 3.26E-08 8.88E-08 6.59E-09
2 3.23E-07 3.05E-06 1.41E-10 6.73E-08 6.52E-08 1.78E-07 1.32E-08
3 6.46E-07 6.10E-06 2.82E-10 1.35E-07 1.30E-07 3.55E-07 2.64E-08
Unit Train
1-hour 1, 2 & 3
4.5 2.1 n/a
2.14E-04 1.53E-03 5.45E-06 3.97E-05 3.85E-05 7.48E-05 9.08E-06
24-hour 1 & 2 1.07E-04 7.63E-04 2.72E-06 1.98E-05 1.92E-05 3.74E-05 4.54E-06
3 2.14E-04 1.53E-03 5.45E-06 3.97E-05 3.85E-05 7.48E-05 9.08E-06
Annual
1 2.55E-05 3.34E-04 1.19E-06 8.69E-06 8.43E-06 1.64E-05 1.99E-06
2 5.09E-05 6.69E-04 2.39E-06 1.74E-05 1.69E-05 3.28E-05 3.98E-06
3 1.02E-04 1.34E-03 4.78E-06 3.48E-05 3.37E-05 6.56E-05 7.96E-06
Front End Loader
1-hour 1, 2 & 3
3.7 1.7 n/a
3.78E-05 1.10E-04 8.47E-08 7.47E-06 7.25E-06 3.79E-06 1.52E-07
24-hour 1, 2 & 3 1.84E-05 5.35E-05 4.11E-08 3.63E-06 3.52E-06 1.84E-06 7.39E-08
Annual 1, 2 & 3 3.78E-07 1.10E-06 8.45E-10 7.46E-08 7.24E-08 3.78E-08 1.52E-09

File: EE12-1611-00 Fraser Surrey Docks Direct Coal Transfer Facility Air Dispersion Modelling Assessment
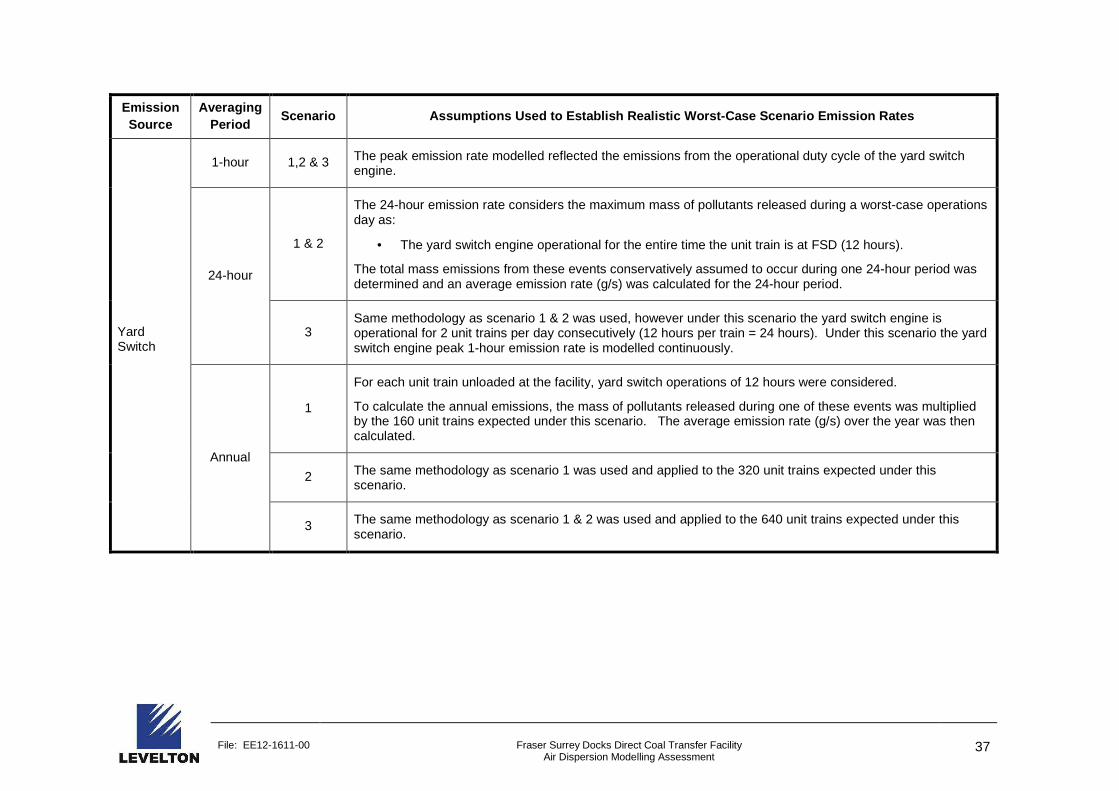
35
Table 6-3 Assumptions Used to Establish Realistic W orst-Case Scenario Emission Rates for Each Averagin g Period
Emission Source
Averaging Period
Scenario Assumptions Used to Establish Realistic Wo rst-Case Scenario Emission Rates
Coal Stockpile
All All The coal stockpile was conservatively assumed to release at a constant emission rate (24 hours per day, 7 days per week) as defined in Section 5.4.
MT to Barge
1-hour 1, 2 & 3 The peak emission rate for the material transfer point was determined from the amount of material transferred per unit train (12,500 MT) over the expected unloading duration (8-hours) as defined in Section 5.4.
24-hour
1 & 2
The 24-hour emission rate considered the maximum mass of pollutants released during a worst-case operations day defined as:
• One unit train unloaded over an 8-hour shift.
The total mass emissions were assumed to occur during one 24-hour period and an average emission rate (g/s) was calculated for the 24-hour period.
3
The same methodology as scenarios 1 & 2 was applied, however the worst-case operations day was defined as:
• Two unit trains unloaded over consecutive 8-hour shifts (total daily operation time = 16 hours).
Annual
1
For each unit train unloaded at the facility, material transfer operations of 8 hours were considered.
To calculate the annual emissions, the mass of pollutants released during one of these events was multiplied by the 160 unit trains expected under this scenario. The average emission rate (g/s) over the year was then calculated.
2 The same methodology as scenario 1 was used and applied to the 320 unit trains expected under this scenario.
3 The same methodology as scenario 1 & 2 was used and applied to the 640 unit trains expected under this scenario.

File: EE12-1611-00 Fraser Surrey Docks Direct Coal Transfer Facility Air Dispersion Modelling Assessment
36
Emission Source
Averaging Period
Scenario Assumptions Used to Establish Realistic Wo rst-Case Scenario Emission Rates
Tugboats
1-hour 1,2 & 3 The peak emission rate modelled includes emissions from 2 tugboats operating simultaneously for a half an hour to position barges into place (or tow away loaded barges).
24-hour
1 & 2
The 24-hour emission rate considers the maximum mass of pollutants released during a worst-case operations day defined as:
• 2 tugboats operating simultaneously for a half an hour to position barges into place; • 2 tugboats operating simultaneously for a half an hour to tow away loaded barges.
The total mass emissions from these events assumed to occur during one 24-hour period was determined and an average emission rate (g/s) was calculated for the 24-hour period.
3
The 24-hour emission rate considers the maximum mass of pollutants released during a worst-case operations day defined as:
• 2 tugboats operating simultaneously for a half an hour to position barges into place (2 events per day); • 2 tugboats operating simultaneously for a half an hour to tow away loaded barges (2 events per day).
The total mass emissions from these events assumed to occur during one 24-hour period was determined and an average emission rate (g/s) was calculated for the 24-hour period.
Annual
1
For each unit train unloaded at the facility, tugboat operations were defined as:
• 2 tugboats operating simultaneously for a half an hour to position barges into place; • 2 tugboats operating simultaneously for a half an hour to tow away loaded barges.
To calculate the annual emissions, the mass of pollutants released during one of these events was multiplied by the 160 unit trains expected under this scenario. The average emission rate (g/s) over the year was then calculated.
2 The same methodology as scenario 1 was used and applied to the 320 unit trains expected under this scenario.
3 The same methodology as scenario 1 & 2 was used and applied to the 640 unit trains expected under this scenario.
File: EE12-1611-00 Fraser Surrey Docks Direct Coal Transfer Facility Air Dispersion Modelling Assessment
37
Emission Source
Averaging Period
Scenario Assumptions Used to Establish Realistic Wo rst-Case Scenario Emission Rates
Yard Switch
1-hour 1,2 & 3 The peak emission rate modelled reflected the emissions from the operational duty cycle of the yard switch engine.
24-hour
1 & 2
The 24-hour emission rate considers the maximum mass of pollutants released during a worst-case operations day as:
• The yard switch engine operational for the entire time the unit train is at FSD (12 hours).
The total mass emissions from these events conservatively assumed to occur during one 24-hour period was determined and an average emission rate (g/s) was calculated for the 24-hour period.
3 Same methodology as scenario 1 & 2 was used, however under this scenario the yard switch engine is operational for 2 unit trains per day consecutively (12 hours per train = 24 hours). Under this scenario the yard switch engine peak 1-hour emission rate is modelled continuously.
Annual
1
For each unit train unloaded at the facility, yard switch operations of 12 hours were considered.
To calculate the annual emissions, the mass of pollutants released during one of these events was multiplied by the 160 unit trains expected under this scenario. The average emission rate (g/s) over the year was then calculated.
2 The same methodology as scenario 1 was used and applied to the 320 unit trains expected under this scenario.
3 The same methodology as scenario 1 & 2 was used and applied to the 640 unit trains expected under this scenario.

File: EE12-1611-00 Fraser Surrey Docks Direct Coal Transfer Facility Air Dispersion Modelling Assessment
38
Emission Source
Averaging Period
Scenario Assumptions Used to Establish Realistic Wo rst-Case Scenario Emission Rates
Unit Train
1-hour 1,2 & 3 The peak emission rate modelled includes two idling locomotives operating continuously for the hour.
24-hour
1 & 2
The 24-hour emission rate considered the maximum mass of pollutants released during a worst-case operations day defined as:
• 2 locomotive idling in each area source (4 locomotives total) for the 12-hour duration of the unit train unloading.
The total mass emissions from the locomotives were assumed to occur during one 24-hour period and an average emission rate (g/s) was calculated for the 24-hour period.
3 Under this scenario, 2 trains per day are expected. Therefore, the peak emission rates were modelled for the entire 24 hour period.
Annual
1
For each unit train unloaded at the facility, the four locomotives were conservatively considered to idle for 4 hours on “warm days” (above 40 degrees Fahrenheit = 250 days/yr) and the entire 12 hours period the units are at the facility on “cold days” (below 40 degrees Fahrenheit = 115 days/yr).
To calculate the annual emissions, the mass of pollutants released during each of these events was multiplied by the appropriate “warm” and “cold” percentages of the 160 unit trains expected under this scenario. The average emission rate (g/s) over the year was then calculated.
2 The same methodology as scenario 1 was used and applied to the 320 unit trains expected under this scenario.
3 The same methodology as scenario 1 & 2 was used and applied to the 640 unit trains expected under this scenario.

File: EE12-1611-00 Fraser Surrey Docks Direct Coal Transfer Facility Air Dispersion Modelling Assessment
39
Emission Source
Averaging Period
Scenario Assumptions Used to Establish Realistic Wo rst-Case Scenario Emission Rates
Front End Loaders
1-hour 1,2 & 3 The peak emission rate modelled includes maximum emissions (load factor = 0.59) from two front end loaders operating simultaneously.
24-hour 1,2 & 3
The 24-hour emission rate considered the maximum mass of pollutants released during a worst-case operations day defined as:
• 2 front end loaders operating simultaneously for two consecutive shifts (approximately 12 hours of operation, load factor = 0.59) during emergency stockpile load-out events.
The total mass emissions from the front end loaders were assumed to occur during one 24-hour period and an average emission rate (g/s) was calculated for the 24-hour period.
Annual 1, 2 & 3
The total mass of pollutants released by front end loaders onsite per year was determined based on the total annual operating hours estimated by FSD:
• 4 emergency stockpile load-out events per year (approximately 22 hours of operation per event, load factor = 0.59).
The average emission rate (g/s) over the year was then calculated.
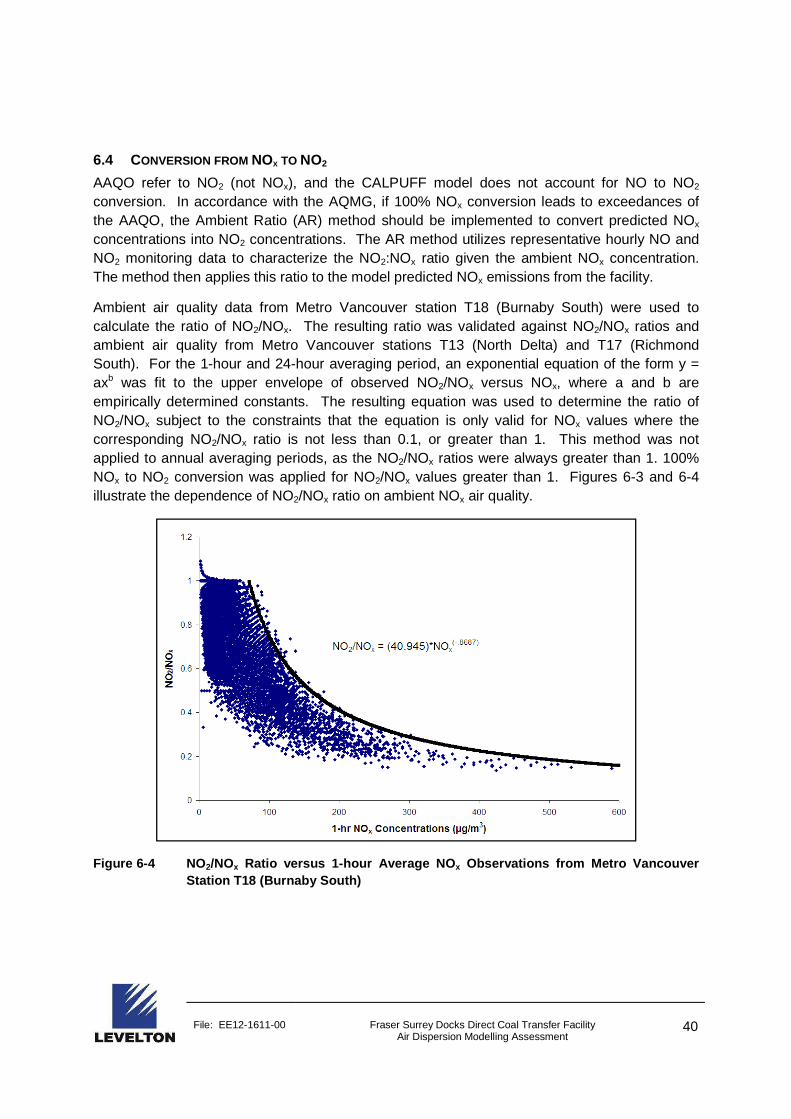
File: EE12-1611-00 Fraser Surrey Docks Direct Coal Transfer Facility Air Dispersion Modelling Assessment
40
6.4 CONVERSION FROM NOX TO NO2
AAQO refer to NO2 (not NOx), and the CALPUFF model does not account for NO to NO2 conversion. In accordance with the AQMG, if 100% NOx conversion leads to exceedances of the AAQO, the Ambient Ratio (AR) method should be implemented to convert predicted NOx concentrations into NO2 concentrations. The AR method utilizes representative hourly NO and NO2 monitoring data to characterize the NO2:NOx ratio given the ambient NOx concentration. The method then applies this ratio to the model predicted NOx emissions from the facility.
Ambient air quality data from Metro Vancouver station T18 (Burnaby South) were used to calculate the ratio of NO2/NOx. The resulting ratio was validated against NO2/NOx ratios and ambient air quality from Metro Vancouver stations T13 (North Delta) and T17 (Richmond South). For the 1-hour and 24-hour averaging period, an exponential equation of the form y = axb was fit to the upper envelope of observed NO2/NOx versus NOx, where a and b are empirically determined constants. The resulting equation was used to determine the ratio of NO2/NOx subject to the constraints that the equation is only valid for NOx values where the corresponding NO2/NOx ratio is not less than 0.1, or greater than 1. This method was not applied to annual averaging periods, as the NO2/NOx ratios were always greater than 1. 100% NOx to NO2 conversion was applied for NO2/NOx values greater than 1. Figures 6-3 and 6-4 illustrate the dependence of NO2/NOx ratio on ambient NOx air quality.
Figure 6-4 NO 2/NOx Ratio versus 1-hour Average NO x Observations from Metro Vancouver Station T18 (Burnaby South)
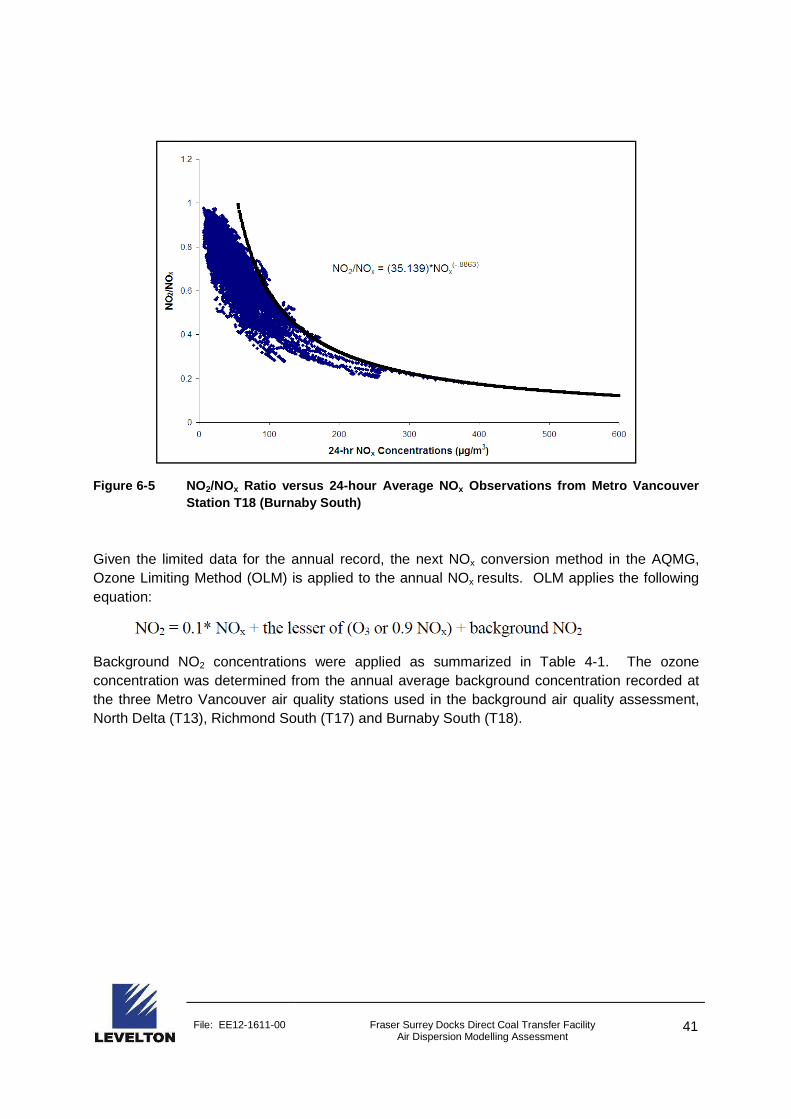
File: EE12-1611-00 Fraser Surrey Docks Direct Coal Transfer Facility Air Dispersion Modelling Assessment
41
Figure 6-5 NO 2/NOx Ratio versus 24-hour Average NO x Observations from Metro Vancouver Station T18 (Burnaby South)
Given the limited data for the annual record, the next NOx conversion method in the AQMG, Ozone Limiting Method (OLM) is applied to the annual NOx results. OLM applies the following equation:
Background NO2 concentrations were applied as summarized in Table 4-1. The ozone concentration was determined from the annual average background concentration recorded at the three Metro Vancouver air quality stations used in the background air quality assessment, North Delta (T13), Richmond South (T17) and Burnaby South (T18).

File: EE12-1611-00 Fraser Surrey Docks Direct Coal Transfer Facility Air Dispersion Modelling Assessment
42
7.0 DISPERSION MODELLING RESULTS
7.1 ALL EMISSION SOURCES
A summary of model results for the emission sources at the proposed FSD facility are presented in Table 7-1. Emission sources at the facility included emissions from stockpiles, material transfer points, tugboats, yard and unit trains and the front-end loaders. Table 7-1 shows the maximum model predicted concentrations from all sources for the averaging periods of interest under each scenario without ambient background added. The table also provides the maximum predicted concentrations at the nearest resident receptor identified in Figure 6-2 and the appropriate AAQO for comparison with model predicted results.
Table 7-2 shows the maximum model predicted concentrations from all sources for the averaging periods of interest under each scenario with ambient background added.
With the exception of the predicted annual NO2 maximum concentration during scenario 1,2 and 3, all predicted pollutant concentrations remain below AAQOs with background pollutant concentrations added. At the nearest residential receptor, predicted concentrations are much lower than the maximum predicted concentrations and no exceedances of AAQOs are predicted in the residential neighbourhoods in the vicinity of FSD.
The predicted NO2 annual exceedances occurs at receptors immediately adjacent to the marine sources on the Fraser River, fenceline receptors and receptors within the rail yard immediately adjacent to the unit train area sources (Figure 7-3, 7-4, 7-5). The exceedances nearer to and on the Fraser River are primarily due to tugboat emissions. The exceedances predicted in the rail yard are caused by the emissions from the idling locomotives of the unit trains. Further information on sources contributing to the predicted NO2 annual exceedances is provided in section 7.1.1.
Contour plots of NO2, and PM2.5 predicted are provided in Figure 7-1 through Figure 7-7. The receptors exceeding the NO2 annual AAQO are highlighted in the annual NO2 plots. The PM2.5 contour plot is provided to display the predicted particulate matter impacts near the facility, however all particulate matter concentrations predicted remain below the AAQOs. For all pollutants, the highest concentrations of pollutants occur along the facility fenceline. The predicted pollutant concentrations quickly diminish as emissions disperse further away from the FSD facility.
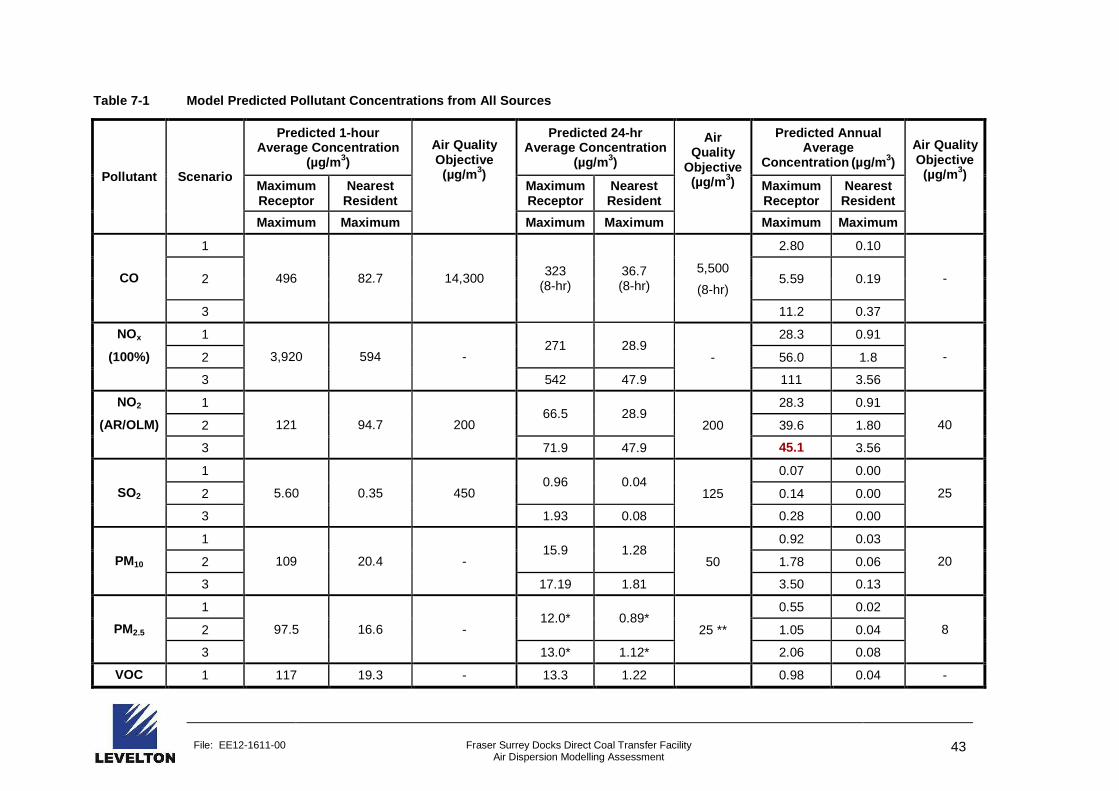
File: EE12-1611-00 Fraser Surrey Docks Direct Coal Transfer Facility Air Dispersion Modelling Assessment
43
Table 7-1 Model Predicted Pollutant Concentrations from All Sources
Pollutant Scenario
Predicted 1-hour Average Concentration
(µg/m 3) Air Quality Objective
(µg/m 3)
Predicted 24-hr Average Concentration
(µg/m 3)
Air Quality
Objective (µg/m 3)
Predicted Annual Average
Concentration (µg/m 3) Air Quality Objective
(µg/m 3) Maximum Receptor
Nearest Resident
Maximum Receptor
Nearest Resident
Maximum Receptor
Nearest Resident
Maximum Maximum Maximum Maximum Maximum Maximum
CO
1
496 82.7 14,300 323 (8-hr)
36.7 (8-hr)
2.80 0.10
- 2 5,500
5.59 0.19 (8-hr)
3 11.2 0.37
NOx 1
3,920 594 - 271 28.9
28.3 0.91
- (100%) 2 - 56.0 1.8
3 542 47.9 111 3.56
NO2 1
121 94.7 200 66.5 28.9
28.3 0.91
40 (AR/OLM) 2 200 39.6 1.80
3 71.9 47.9 45.1 3.56
SO2
1
5.60 0.35 450 0.96 0.04
0.07 0.00
25 2 125 0.14 0.00
3 1.93 0.08 0.28 0.00
PM10
1
109 20.4 - 15.9 1.28
0.92 0.03
20 2 50 1.78 0.06
3 17.19 1.81 3.50 0.13
PM2.5
1
97.5 16.6 - 12.0* 0.89*
0.55 0.02
8 2 25 ** 1.05 0.04
3 13.0* 1.12* 2.06 0.08
VOC 1 117 19.3 - 13.3 1.22 0.98 0.04 -

File: EE12-1611-00 Fraser Surrey Docks Direct Coal Transfer Facility Air Dispersion Modelling Assessment
44
Pollutant Scenario
Predicted 1-hour Average Concentration
(µg/m 3) Air Quality Objective
(µg/m 3)
Predicted 24-hr Average Concentration
(µg/m 3)
Air Quality
Objective (µg/m 3)
Predicted Annual Average
Concentration (µg/m 3) Air Quality Objective
(µg/m 3) Maximum Receptor
Nearest Resident
Maximum Receptor
Nearest Resident
Maximum Receptor
Nearest Resident
Maximum Maximum Maximum Maximum Maximum Maximum
2 - 1.96 0.08
3 26.5 2.10 3.92 0.16
NH3
1
9.33 0.57 - 1.61 0.09
0.12 0.00
- 2 - 0.24 0.01
3 3.22 0.16 0.47 0.01 * Based on the maximum 24-hour 98th percentile value. ** The 24-hour PM2.5 BC Ambient Air Quality Objective is based on the annual 98th percentile 24-hour value.
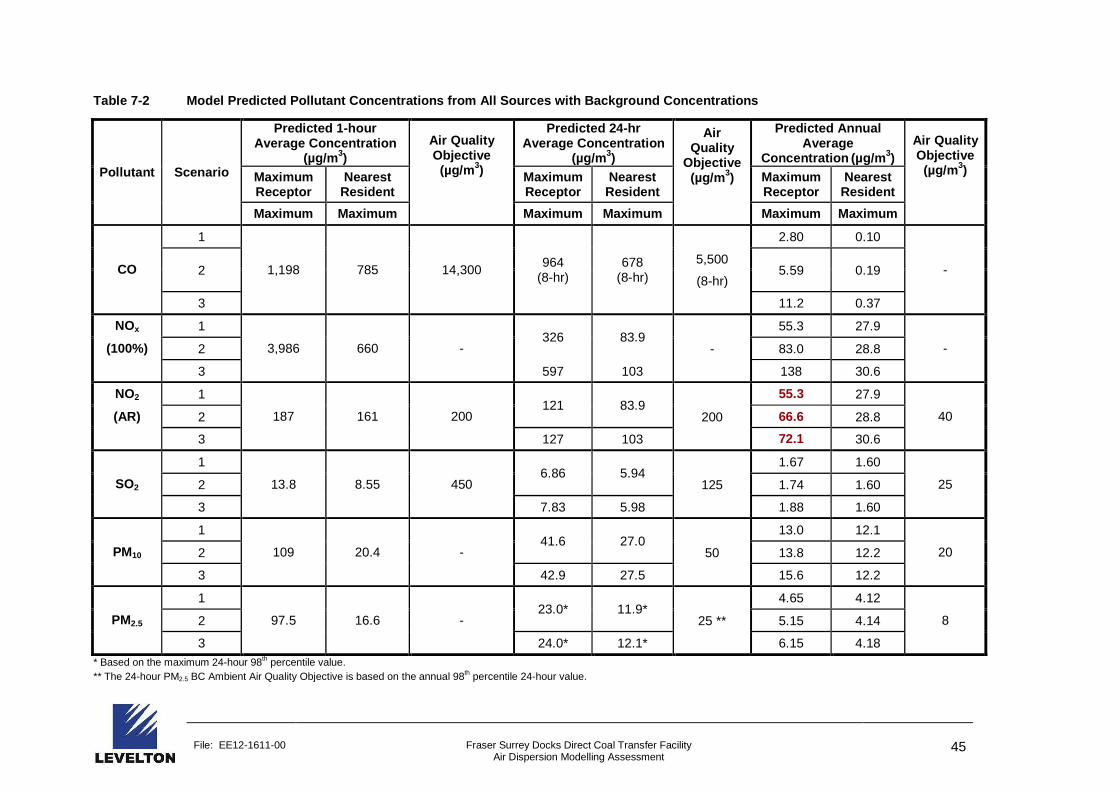
File: EE12-1611-00 Fraser Surrey Docks Direct Coal Transfer Facility Air Dispersion Modelling Assessment
45
Table 7-2 Model Predicted Pollutant Concentrations from All Sources with Background Concentrations
Pollutant Scenario
Predicted 1 -hour Average Concentration
(µg/m 3) Air Quality Objective
(µg/m 3)
Predicted 24 -hr Average Concentration
(µg/m 3)
Air Quality
Objective (µg/m 3)
Predicted Annual Average
Concentration (µg/m 3) Air Quality Objective
(µg/m 3) Maximum Receptor
Nearest Resident
Maximum Receptor
Nearest Resident
Maximum Receptor
Nearest Resident
Maximum Maximum Maximum Maximum Maximum Maximum
CO
1
1,198 785 14,300 964
(8-hr) 678
(8-hr)
2.80 0.10
- 2 5,500
5.59 0.19 (8-hr)
3 11.2 0.37
NOx 1
3,986 660 - 326 83.9
55.3 27.9
- (100%) 2 - 83.0 28.8
3 597 103 138 30.6
NO2 1
187 161 200 121 83.9
55.3 27.9
40 (AR) 2 200 66.6 28.8
3 127 103 72.1 30.6
SO2
1
13.8 8.55 450 6.86 5.94
1.67 1.60
25 2 125 1.74 1.60
3 7.83 5.98 1.88 1.60
PM10
1
109 20.4 - 41.6 27.0
13.0 12.1
20 2 50 13.8 12.2
3 42.9 27.5 15.6 12.2
PM2.5
1
97.5 16.6 - 23.0* 11.9*
4.65 4.12
8 2 25 ** 5.15 4.14
3 24.0* 12.1* 6.15 4.18 * Based on the maximum 24-hour 98th percentile value. ** The 24-hour PM2.5 BC Ambient Air Quality Objective is based on the annual 98th percentile 24-hour value.

File: EE12-1611-00 Fraser Surrey Docks Direct Coal Transfer Facility Air Dispersion Modelling Assessment
46
Figure 7-1 Contour Plot of NO 2 Maximum 1-hour Predicted Concentrations from All E mission Sources (Scenario 3)

File: EE12-1611-00 Fraser Surrey Docks Direct Coal Transfer Facility Air Dispersion Modelling Assessment
47
Figure 7-2 Contour Plot of NO 2 Maximum 24-hour Predicted Concentrations from All Emission Sources (Scenario 3)

File: EE12-1611-00 Fraser Surrey Docks Direct Coal Transfer Facility Air Dispersion Modelling Assessment
48
* NO2 exceedance receptors marked are with background co ncentrations
Figure 7-3 Contour Plot of NO 2 Maximum Annual Predicted Concentrations from All E mission Sources (Scenario 1)
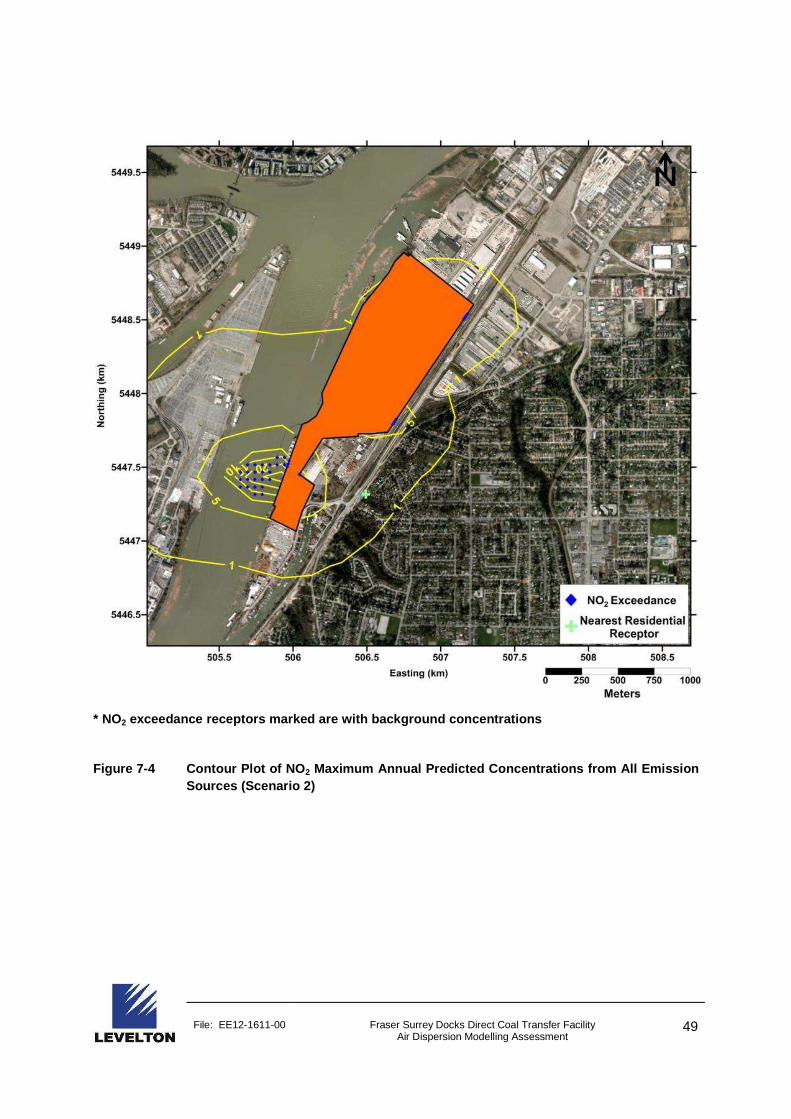
File: EE12-1611-00 Fraser Surrey Docks Direct Coal Transfer Facility Air Dispersion Modelling Assessment
49
* NO2 exceedance receptors marked are with background co ncentrations
Figure 7-4 Contour Plot of NO 2 Maximum Annual Predicted Concentrations from All E mission Sources (Scenario 2)
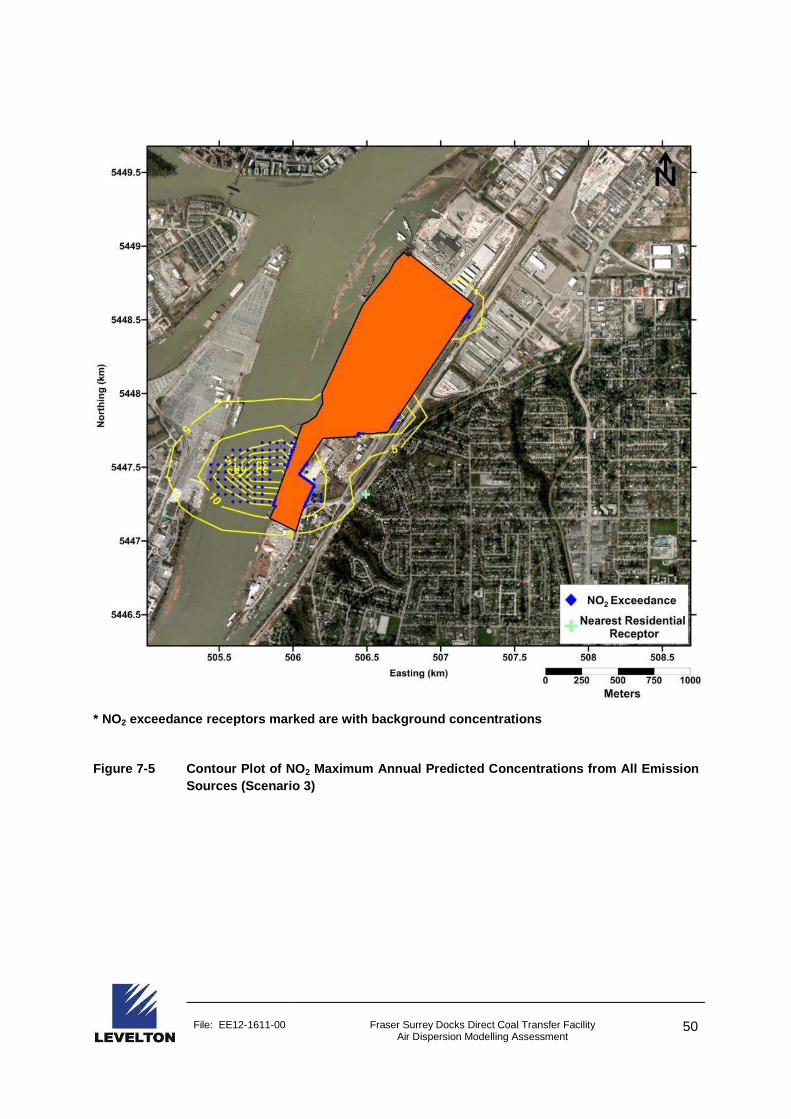
File: EE12-1611-00 Fraser Surrey Docks Direct Coal Transfer Facility Air Dispersion Modelling Assessment
50
* NO2 exceedance receptors marked are with background co ncentrations
Figure 7-5 Contour Plot of NO 2 Maximum Annual Predicted Concentrations from All E mission Sources (Scenario 3)
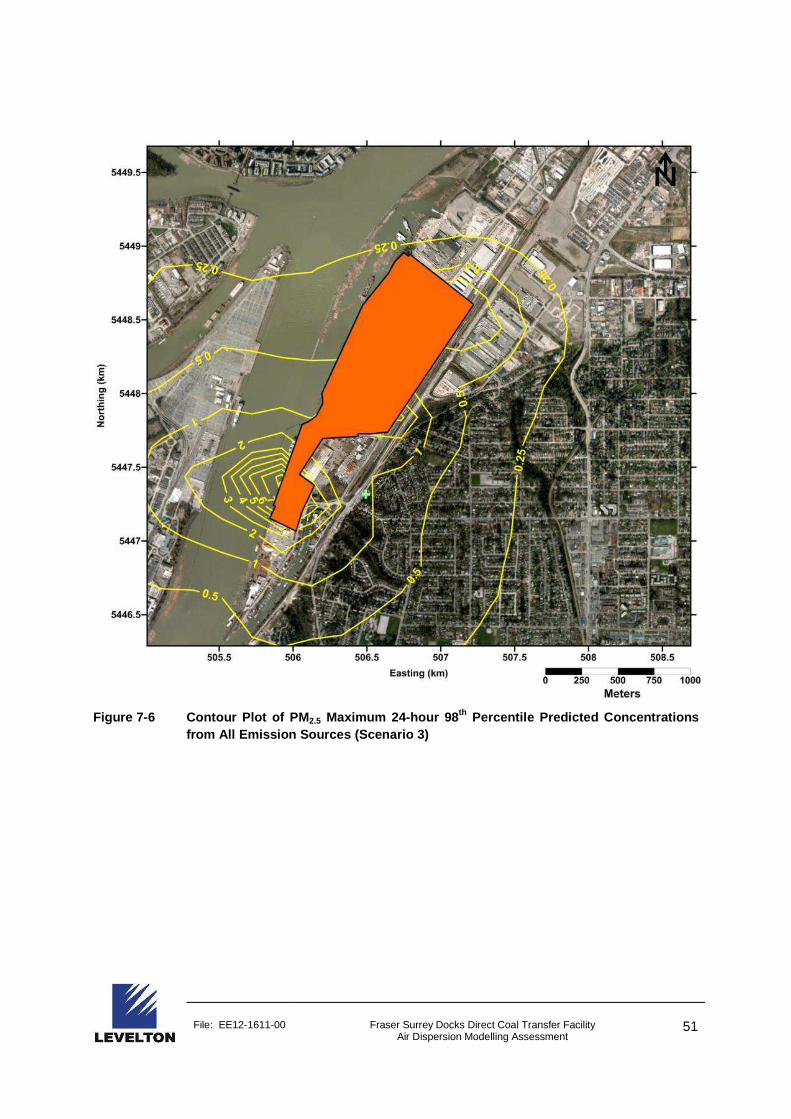
File: EE12-1611-00 Fraser Surrey Docks Direct Coal Transfer Facility Air Dispersion Modelling Assessment
51
Figure 7-6 Contour Plot of PM 2.5 Maximum 24-hour 98 th Percentile Predicted Concentrations from All Emission Sources (Scenario 3)
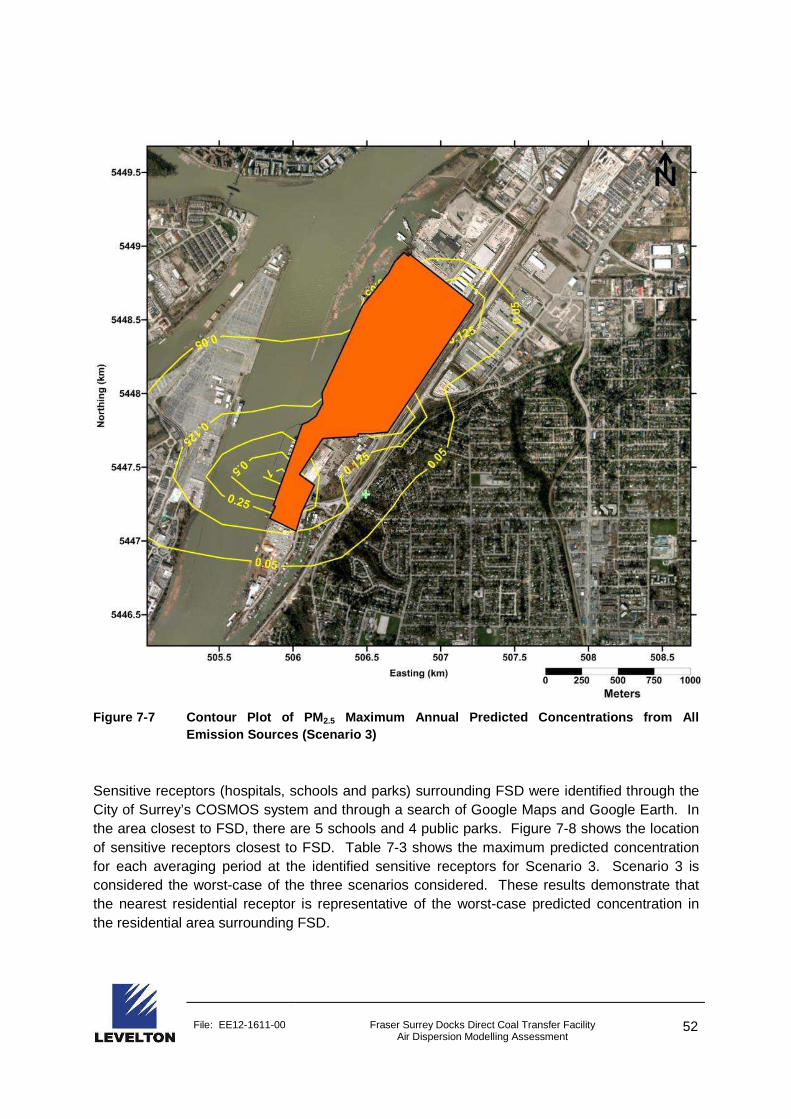
File: EE12-1611-00 Fraser Surrey Docks Direct Coal Transfer Facility Air Dispersion Modelling Assessment
52
Figure 7-7 Contour Plot of PM 2.5 Maximum Annual Predicted Concentrations from All Emission Sources (Scenario 3)
Sensitive receptors (hospitals, schools and parks) surrounding FSD were identified through the City of Surrey’s COSMOS system and through a search of Google Maps and Google Earth. In the area closest to FSD, there are 5 schools and 4 public parks. Figure 7-8 shows the location of sensitive receptors closest to FSD. Table 7-3 shows the maximum predicted concentration for each averaging period at the identified sensitive receptors for Scenario 3. Scenario 3 is considered the worst-case of the three scenarios considered. These results demonstrate that the nearest residential receptor is representative of the worst-case predicted concentration in the residential area surrounding FSD.
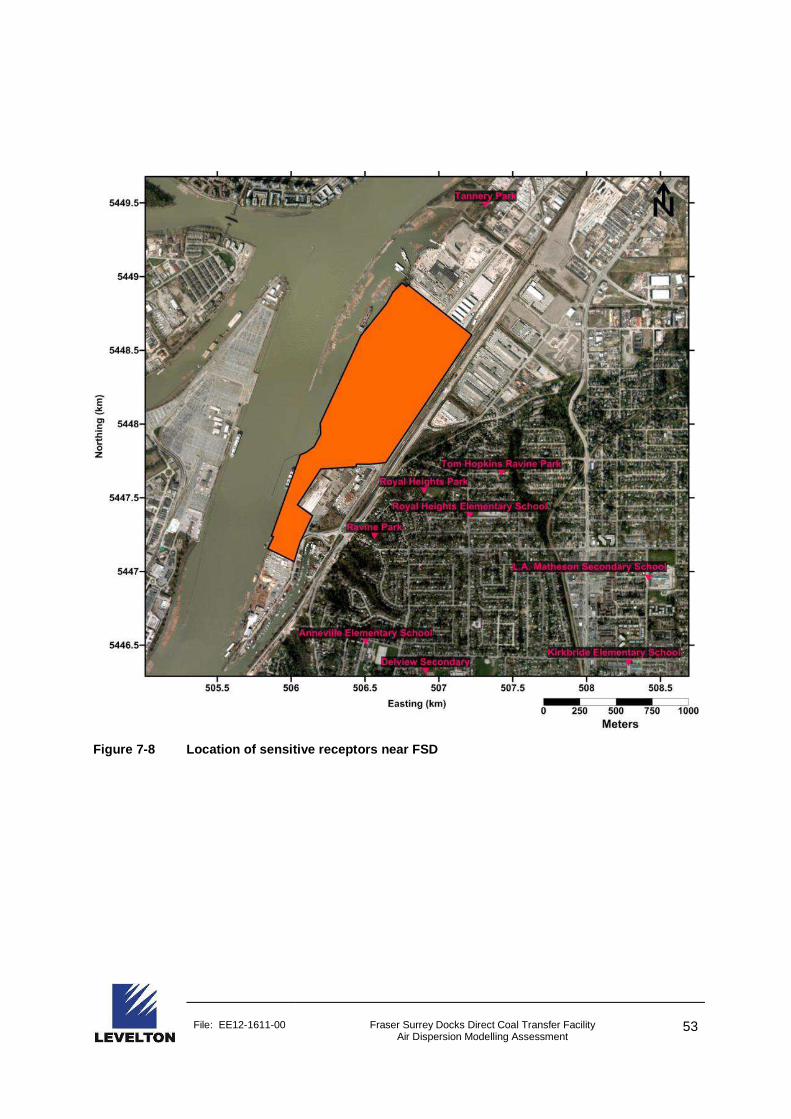
File: EE12-1611-00 Fraser Surrey Docks Direct Coal Transfer Facility Air Dispersion Modelling Assessment
53
Figure 7-8 Location of sensitive receptors near FSD
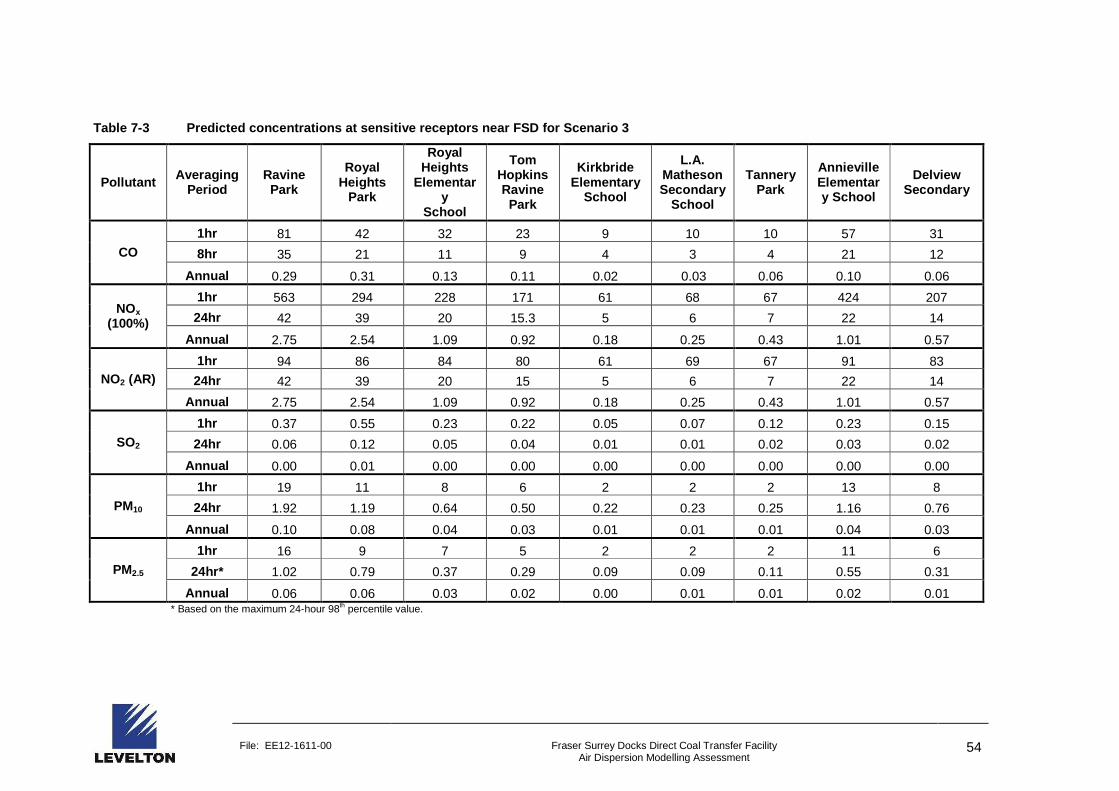
File: EE12-1611-00 Fraser Surrey Docks Direct Coal Transfer Facility Air Dispersion Modelling Assessment
54
Table 7-3 Predicted concentrations at sensitive re ceptors near FSD for Scenario 3
Pollutant Averaging Period
Ravine Park
Royal Heights
Park
Royal Heights
Elementary
School
Tom Hopkins Ravine
Park
Kirkbride Elementary
School
L.A. Matheson Secondary
School
Tannery Park
Annieville Elementary School
Delview Secondary
CO 1hr 81 42 32 23 9 10 10 57 31
8hr 35 21 11 9 4 3 4 21 12
Annual 0.29 0.31 0.13 0.11 0.02 0.06 0.10 0.06
NOx (100%)
1hr 563 294 228 171 61 68 67 424 207
24hr 42 39 20 15.3 5 6 7 22 14
Annual 2.75 2.54 1.09 0.92 0.18 0.25 0.43 1.01 0.57
NO2 (AR) 1hr 94 86 84 80 61 69 67 91 83
24hr 42 39 20 15 5 6 7 22 14
Annual 2.75 2.54 1.09 0.92 0.18 0.25 0.43 1.01 0.57
SO2 1hr 0.37 0.55 0.23 0.22 0.05 0.07 0.12 0.23 0.15
24hr 0.06 0.12 0.05 0.04 0.01 0.01 0.02 0.03 0.02
Annual 0.00 0.01 0.00 0.00 0.00 0.00 0.00 0.00 0.00
PM10 1hr 19 11 8 6 2 2 2 13 8
24hr 1.92 1.19 0.64 0.50 0.22 0.23 0.25 1.16 0.76
Annual 0.10 0.08 0.04 0.03 0.01 0.01 0.01 0.04 0.03
PM2.5 1hr 16 9 7 5 2 2 2 11 6
24hr* 1.02 0.79 0.37 0.29 0.09 0.09 0.11 0.55 0.31
Annual 0.06 0.06 0.03 0.02 0.00 0.01 0.01 0.02 0.01 * Based on the maximum 24-hour 98th percentile value.
0.03

File: EE12-1611-00
Additionally, sensitive receptorsRiver between FSD and the Georgia Straight were identified (see Figure 7metres of the rail line between the Canada / USA border (see Figure 7receptors were identified with the(http://www.data.gov.bc.ca/dbc/index.pagehttp://www.vch.ca/locations_and_services/find_locations/find_locations?currentPage=2Richmond’s website, the City of White Rock’s website, the(http://www.surrey.ca/city-services/665.aspxEarth. Along both the marine and rail corridor only parks were found to be within 100 metres and are indicated by a tree icon in Figure 7
Figure 7-9 Location of sensitive receptors along the rail corr idor from the Canada / USA border
00 Fraser Surrey Docks Direct Coal Transfer Facility Air Dispersion Modelling Assessment
sensitive receptors (hospitals, schools and parks) within 100 metres of the Fraser River between FSD and the Georgia Straight were identified (see Figure 7metres of the rail line between the Canada / USA border (see Figure 7receptors were identified with the Government of BC’s Data BC website http://www.data.gov.bc.ca/dbc/index.page), Vancouver Coastal Health’s website
http://www.vch.ca/locations_and_services/find_locations/find_locations?currentPage=2Richmond’s website, the City of White Rock’s website, the City of Surrey’s COSMOS system
services/665.aspx) and through a search of Google Maps and Google Along both the marine and rail corridor only parks were found to be within 100 metres
tree icon in Figure 7-9 and Figure 7-10.
Location of sensitive receptors along the rail corr idor from the Canada / USA
Fraser Surrey Docks Direct Coal Transfer Facility Air Dispersion Modelling Assessment
55
within 100 metres of the Fraser River between FSD and the Georgia Straight were identified (see Figure 7-9), and within 100 metres of the rail line between the Canada / USA border (see Figure 7-10). The sensitive
Government of BC’s Data BC website Vancouver Coastal Health’s website
http://www.vch.ca/locations_and_services/find_locations/find_locations?currentPage=2, the City of City of Surrey’s COSMOS system
and through a search of Google Maps and Google Along both the marine and rail corridor only parks were found to be within 100 metres
Location of sensitive receptors along the rail corr idor from the Canada / USA
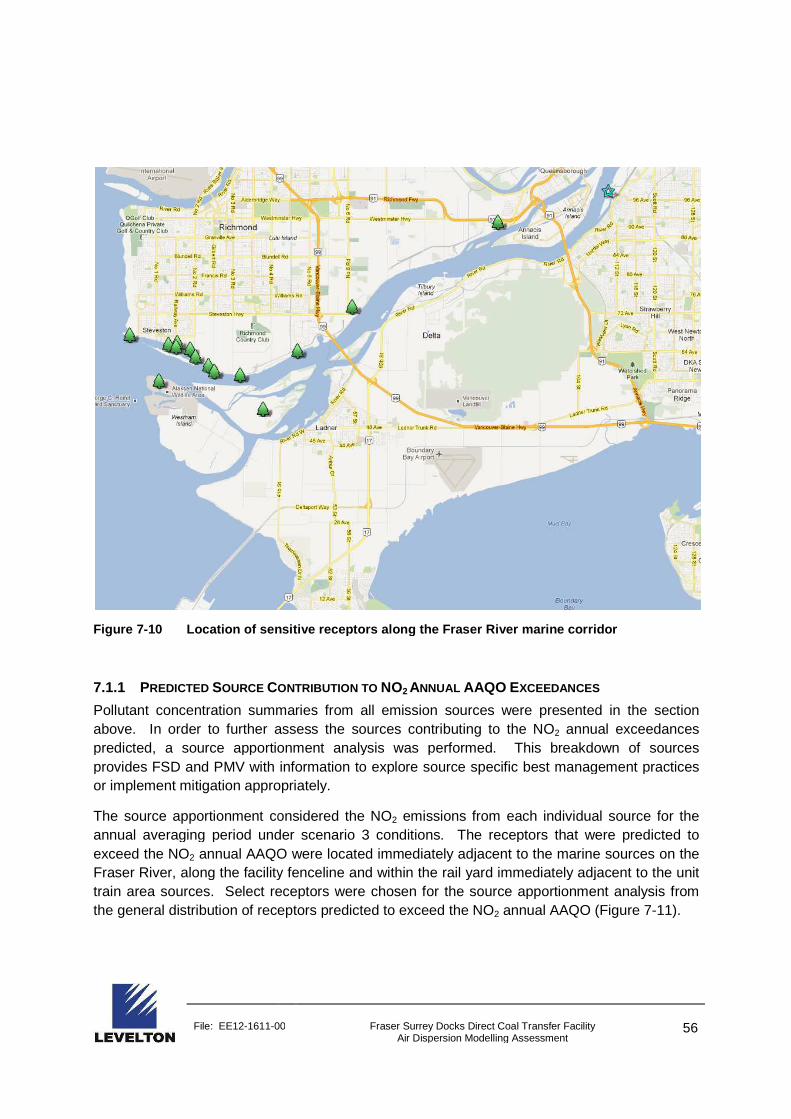
File: EE12-1611-00
Figure 7-10 Location of sensitive receptors along the Fraser Ri ver
7.1.1 PREDICTED SOURCE CONTRIBUTION TO
Pollutant concentration summaries from all emission sources were presented in the section above. In order to further assespredicted, a source apportionment analysis was performed. This breakdown of sources provides FSD and PMV with information to explore or implement mitigation appropriately.
The source apportionment considered the NOannual averaging period under scenario 3 conditions. The receptors that exceed the NO2 annual AAQO were Fraser River, along the facility fenceline and within the rail yard immediately adjacent to the unit train area sources. Select receptors were chosen for the source the general distribution of receptors predicted to exceed the NO
00 Fraser Surrey Docks Direct Coal Transfer Facility Air Dispersion Modelling Assessment
Location of sensitive receptors along the Fraser Ri ver marine corridor
ONTRIBUTION TO NO2 ANNUAL AAQO EXCEEDANCES
Pollutant concentration summaries from all emission sources were presented in the section above. In order to further assess the sources contributing to the NO2
predicted, a source apportionment analysis was performed. This breakdown of sources provides FSD and PMV with information to explore source specific best management practices
appropriately.
The source apportionment considered the NO2 emissions from each individual source for the annual averaging period under scenario 3 conditions. The receptors that
annual AAQO were located immediately adjacent to the marine sources on the Fraser River, along the facility fenceline and within the rail yard immediately adjacent to the unit train area sources. Select receptors were chosen for the source apportionment analysis from
ceptors predicted to exceed the NO2 annual AAQO (Figure 7
Fraser Surrey Docks Direct Coal Transfer Facility Air Dispersion Modelling Assessment
56
marine corridor
XCEEDANCES
Pollutant concentration summaries from all emission sources were presented in the section
2 annual exceedances predicted, a source apportionment analysis was performed. This breakdown of sources
best management practices
emissions from each individual source for the annual averaging period under scenario 3 conditions. The receptors that were predicted to
nt to the marine sources on the Fraser River, along the facility fenceline and within the rail yard immediately adjacent to the unit
apportionment analysis from annual AAQO (Figure 7-11).
File: EE12-1611-00 Fraser Surrey Docks Direct Coal Transfer Facility Air Dispersion Modelling Assessment
57
The annual source contributions to each receptor analyzed is provided in Figure 7-12. Predicted NO2 concentrations exceeding the annual AAQO over the Fraser River (receptors 1-3), at berth 2 (receptors 4-5) and along the facility fenceline near berth 2 (receptors 7-8) are primarily due to emission from the tugboats operating at the FSD facility. Receptor 6 near the fenceline along the yard rail line is primarily affected by emissions from the yard switch locomotive and the receptors near the unit train idling areas (receptors 9-10) are primarily affected by unit train emissions.
The majority of receptors predicted to exceed the NO2 annual AAQO are heavily influenced by emissions from tugboats. The tugboat annual emissions were modelled as an area source with a continuous adjusted emission rate based on the total estimated operating hours per year. This characterization of the tugboat emissions in the model may lead to over-estimation on an annual basis at receptors near the facility. During actual operations, the tugboats will be operating at the FSD facility for short durations (less than an hour) positioning barges in place at the berth. Given that the tugboat emissions were not predicted to exceed during the shorter averaging periods, it is unlikely the operations will result in the predicted annual air quality impacts.
Figure 7-13 presents the source contributions in the context of the assumed background concentrations. Background concentrations are based on annual average NO2 concentrations from air quality monitoring stations near FSD.

File: EE12-1611-00 Fraser Surrey Docks Direct Coal Transfer Facility Air Dispersion Modelling Assessment
58
Figure 7-11 Receptors Analyzed for Source Contribut ion to NO 2 Annual Exceedances
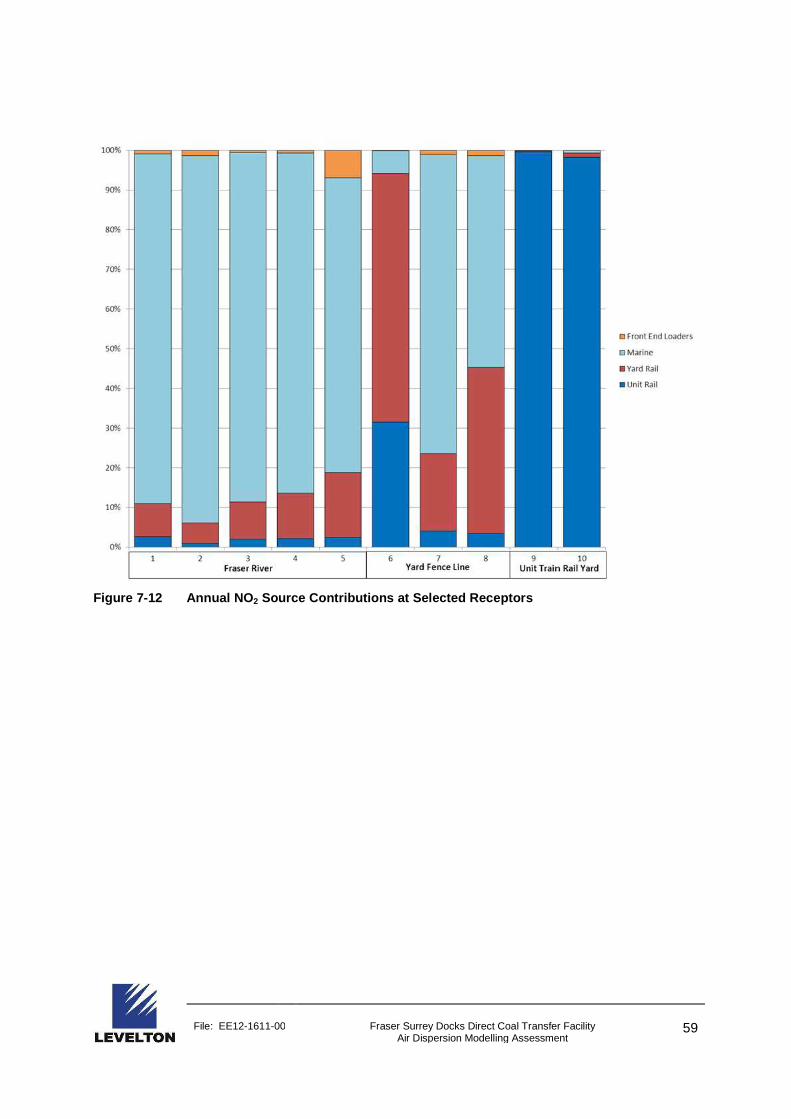
File: EE12-1611-00
Figure 7-12 Annual NO 2 Source Contributions at Selected Receptors
00 Fraser Surrey Docks Direct Coal Transfer Facility Air Dispersion Modelling Assessment
Source Contributions at Selected Receptors
Fraser Surrey Docks Direct Coal Transfer Facility Air Dispersion Modelling Assessment
59
File: EE12-1611-00
Figure 7-13 Source Contributions to the Maximum Predicted Annua l NOSelected Receptors with Background Concentrations
00 Fraser Surrey Docks Direct Coal Transfer Facility Air Dispersion Modelling Assessment
Source Contributions to the Maximum Predicted Annua l NOSelected Receptors with Background Concentrations
Fraser Surrey Docks Direct Coal Transfer Facility Air Dispersion Modelling Assessment
60
Source Contributions to the Maximum Predicted Annua l NO2 Concentrations at

File: EE12-1611-00 Fraser Surrey Docks Direct Coal Transfer Facility Air Dispersion Modelling Assessment
61
7.2 FUGITIVE EMISSIONS FROM BARGE
The terms of reference for the air quality assessment required a screening level analysis of the potential windblown dust from a loaded coal barge in transit from the FSD facility. In order to provide a screening analysis of these potential air quality impacts an area source representing the barge was modelled near the middle of the Fraser River near FSD. The emission rates as defined in Section 5.4 were used to model potential emissions from this area source.
The meteorological data is identical to the meteorology used in the other portion of this assessment. This data set is meant to include representative worst-case meteorology for the lower mainland over the course of one year. In order to capture the typical operating of a barge in the Fraser River, the 1-hour rate was chosen to be the worst-case scenario, where a barge would remain stationary at a single point for an entire hour. Barge traffic is highly transient in nature and it is unlikely a barge would remain stationary in the middle of the Fraser River for this amount of time.
Figure 7-14 provides the contour plot for PM10 resulting from this analysis. Predicted 1-hour concentrations of PM10 are between 0.04 µg/m3 and 0.02 µg/m3 at the shore. There are no 1-hour guidelines for particulate matter, but these concentrations will be even smaller for the worst-case 24-hour period. The air quality impacts from the barges traveling along the Fraser River are predicted to be negligible.
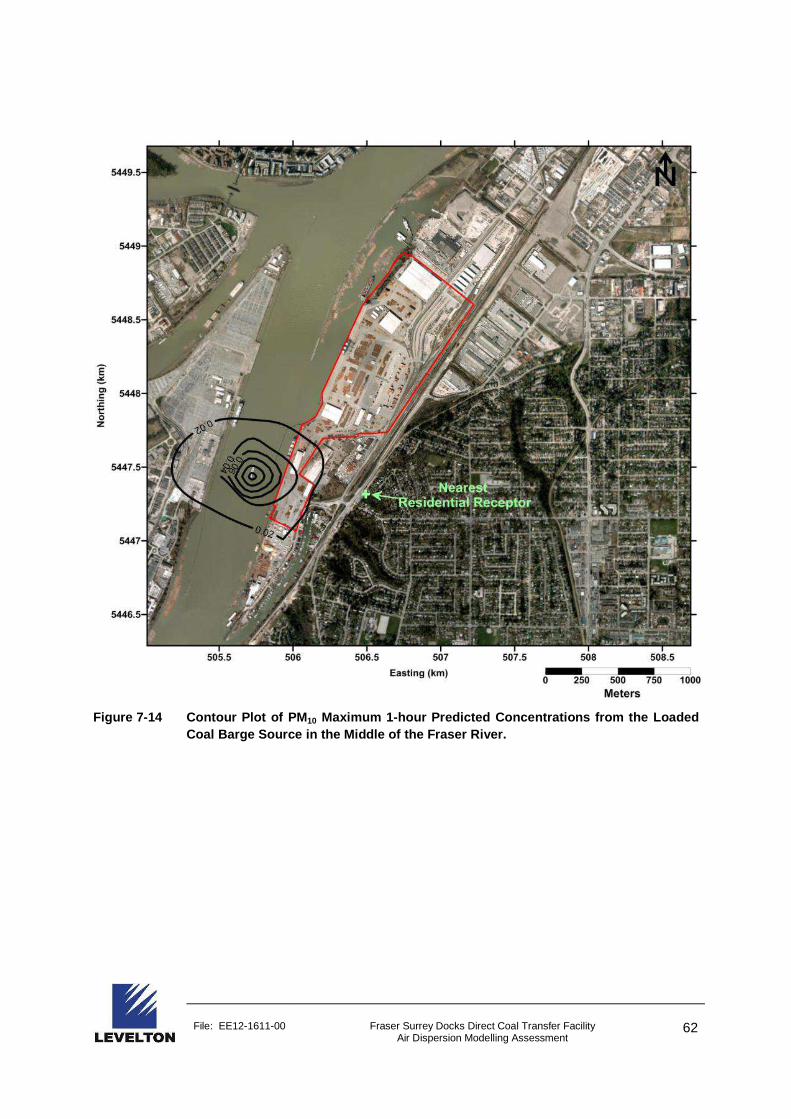
File: EE12-1611-00 Fraser Surrey Docks Direct Coal Transfer Facility Air Dispersion Modelling Assessment
62
Figure 7-14 Contour Plot of PM 10 Maximum 1-hour Predicted Concentrations from the L oaded Coal Barge Source in the Middle of the Fraser River .
File: EE12-1611-00 Fraser Surrey Docks Direct Coal Transfer Facility Air Dispersion Modelling Assessment
63
8.0 BEST MANAGEMENT PRACTICES
General Recommendations
• Keep the stockpile size to a minimum and if necessary use wind-break fencing for wind protection
• Minimize the drop heights when handling • Implement low vehicle speed limits and minimize required travel distances. • Implement an anti-idling policy for front end loaders and the switch locomotive. • Implement a site specific designed water sprinkler system at key areas, such as the
stockpile • Water sprinkler design would be based on wind direction, frequency and duration of
material movement and necessary coverage. • Driving surfaces will be kept clean or anti-dust products applied. • FSD will also stay current with new technologies and practices to mitigate dust
emissions. • Monitor wind and weather conditions and adjust activities and mitigation measures
accordingly
The British Columbia Ministry of Energy and Mines has published a Best Management Practices Handbook21 (Handbook) targeting aggregate operations which are also applicable for coal handling. A full list of potential BMPs and mitigation measures for various dust generating activities associated with aggregate operations is provided in Table 8-1. The recommended mitigation and emission reduction measures outlined at the start of this section are consistent with procedures described in the Handbook, including:
• drop height control for material transfers; • water spray for stockpiles and material transfers; • street cleaning and vehicle speed limits for road dust emissions.
Guidance on the implementation of each mitigation measure described in Table 8-1 is provided in the Handbook. The Handbook can also be used as a reference for implementing new or additional BMPs as identified through the BMP Monitoring Module described below.
The Handbook describes a BMP Monitoring Module that can be adapted to address the specific BMPs presented by FSD and the program/procedures required by PMV. The BMP Monitoring Module along with a visual site inspection procedure for air quality events/issues will provide the basis of the program.
21 BC Ministry of Energy and Mines, 2002. Aggregate Operators Best Management Practices Handbook for British Columbia. Volume II – Best Management Practices. April 2002. http://www.empr.gov.bc.ca/Mining/Aggregate/BMP/Pages/default.aspx

File: EE12-1611-00 Fraser Surrey Docks Direct Coal Transfer Facility Air Dispersion Modelling Assessment
64
Table 8-1 Common Dust Generating Activities at Agg regate Operations and Suggested Control Measures 22
22 22 BC Ministry of Energy and Mines, 2002. Aggregate Operators Best Management Practices Handbook for British Columbia. Volume II – Best Management Practices. April 2002. http://www.empr.gov.bc.ca/Mining/Aggregate/BMP/Pages/default.aspx

File: EE12-1611-00 Fraser Surrey Docks Direct Coal Transfer Facility Air Dispersion Modelling Assessment
65
The visual site inspection is designed to identify areas of potential compliance / non-compliance with dust mitigation goals and BMPs. Appendix B contains an example Visual Site Inspection Form which would be completed during site inspections. Potential fugitive dust sources (eg. stockpiles, material transfer points, road dust, etc.) would be visually identified. It would be recommended that a visual site inspection be completed by an on-site inspector weekly while the site is active. It is recommended that visual observations of emissions with an opacity > 20% characterize an air quality issue.
For identified issues:
• The on-site inspector will advise the on-site supervisor of any issues and make recommendations to remedy potential air quality issues;
• The on-site inspector will advise the on-site supervisor on further mitigation measures aimed at preventing potential fugitive dust issues; and,
• The on-site supervisor will respond to these recommendations and mitigation measures which the on-site inspector will include in interim reports.
In the event of observed air quality events/issues, recommendations for mitigation will be made based on those provided in the Handbook. The on-site supervisor will be responsible for implementing mitigation measures as they deem appropriate.
If air quality issues beyond the facility fenceline are repeatedly observed, additional monitoring using handheld particulate monitors or permanent continuous air quality monitors at or within close proximity to the facility would be recommended. Monitoring can then be compared with appropriate thresholds to identify potential air quality issues.
In addition to the visual site inspections, the BMP Monitoring Module suggests that operators implement a BMP effectiveness monitoring tracking sheet. Tracking allows the on-site supervisor to monitor if the mitigation measures are appropriately mitigating the dust source as intended. If BMPs and mitigation measures are observed to be ineffective, the on-site supervisor would be responsible for implementing modifications or new measures based on the Handbook. An example BMP effectiveness monitoring tracking sheet for air quality is provided in Table 8-2.

File: EE12-1611-00 Fraser Surrey Docks Direct Coal Transfer Facility Air Dispersion Modelling Assessment
66
Table 8-2 Sample BMP effectiveness monitoring trac king sheet 23
23 BC Ministry of Energy and Mines, 2002. Aggregate Operators Best Management Practices Handbook for British Columbia. Volume II – Best Management Practices. April 2002. http://www.empr.gov.bc.ca/Mining/Aggregate/BMP/Pages/default.aspx

File: EE12-1611-00 Fraser Surrey Docks Direct Coal Transfer Facility Air Dispersion Modelling Assessment
67
BNSF Railway will operate the locomotives and rail cars which are used to deliver coal to FSD. BNSF has implemented various best practices to mitigate fugitive dust from rail cars and combustion emissions from locomotives, but FSD has no control over these best practices.
Where feasible, these practices include:
• Fugitive dust control product(s): o Dust suppressant - potentially including Soil-Sement, DusTreat DC9148 or
DC6109 o Modified loading chutes
• Low sulphur fuel to reduce combustion related emissions (if fuel is purchased in Canada or if low sulphur fuel is chosen when fueling in the States).
• As part of current US EPA and future Transport Canada regulations, new locomotives or most remanufactured locomotives are required to have anti-idling technology. For this project, it has been indicated by BNSF that locomotives will only idle at FSD when the ambient temperature falls below 40ºF (~4.4ºC).
Figure 8-1 outlines the areas of BNSF operations in the Lower Mainland.
Marine emissions from combustion are not within FSD’s control, but reduced combustion emissions could be realized through the use of Tier 2 or Tier 3 engine technology in tugboats where feasible.
.
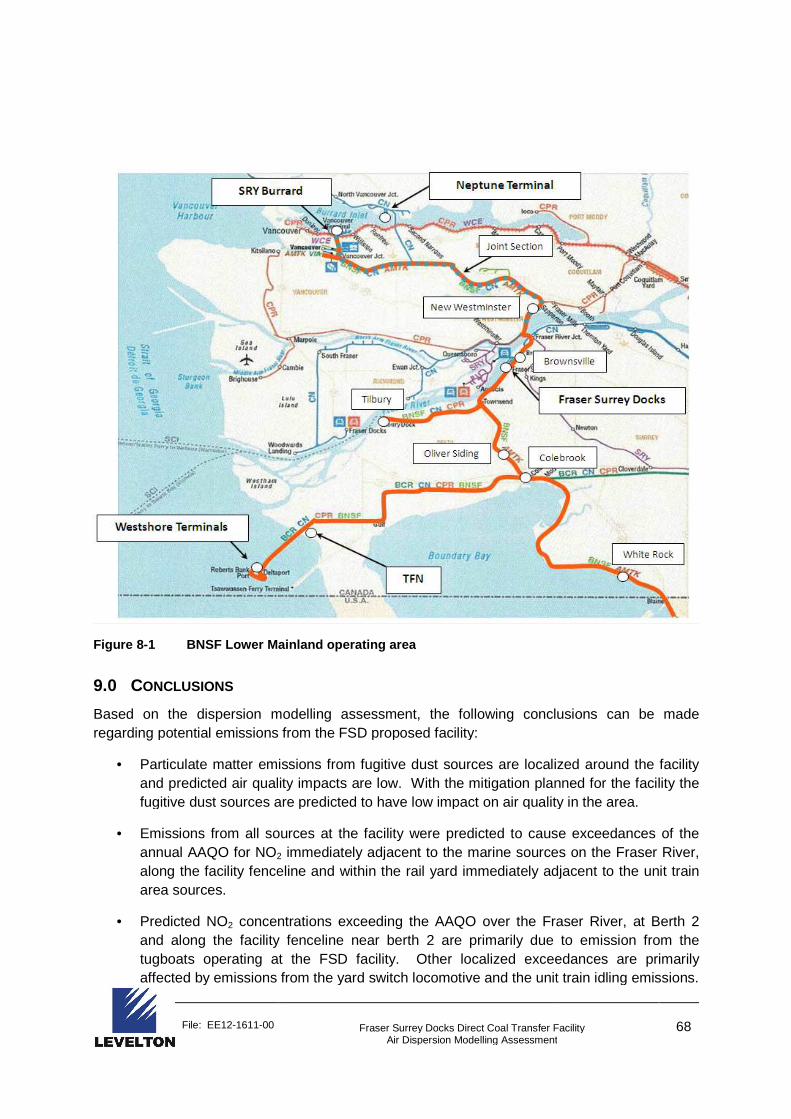
File: EE12-1611-00
Figure 8-1 BNSF Lower Mainland operating area
9.0 CONCLUSIONS
Based on the dispersion modelling assessment, tregarding potential emissions from the FSD proposed facility
• Particulate matter emissions from fugitive dust sources are loand predicted air qualityfugitive dust sources are predicted to have low impact on air quality in the area
• Emissions from all sources at the facility annual AAQO for NO2
along the facility fenceline andarea sources.
• Predicted NO2 concenand along the facility fenceline near berth 2tugboats operating at the FSD facility. affected by emissions from
Fraser Surrey Docks Direct Coal Transfer Facility Air Dispersion Modelling Assessment
BNSF Lower Mainland operating area
Based on the dispersion modelling assessment, the following conclusions can be made potential emissions from the FSD proposed facility:
missions from fugitive dust sources are localized around the facility air quality impacts are low. With the mitigation planned for the facility the
fugitive dust sources are predicted to have low impact on air quality in the area
Emissions from all sources at the facility were predicted to cause exceedances of
2 immediately adjacent to the marine sources on the Fraser River, along the facility fenceline and within the rail yard immediately adjacent to the unit train
concentrations exceeding the AAQO over the Fraser Riverand along the facility fenceline near berth 2 are primarily due to emission from the tugboats operating at the FSD facility. Other localized exceedances areaffected by emissions from the yard switch locomotive and the unit train idling
Fraser Surrey Docks Direct Coal Transfer Facility Air Dispersion Modelling Assessment
68
he following conclusions can be made
calized around the facility impacts are low. With the mitigation planned for the facility the
fugitive dust sources are predicted to have low impact on air quality in the area.
cause exceedances of the immediately adjacent to the marine sources on the Fraser River,
within the rail yard immediately adjacent to the unit train
trations exceeding the AAQO over the Fraser River, at Berth 2 are primarily due to emission from the
Other localized exceedances are primarily the yard switch locomotive and the unit train idling emissions.

File: EE12-1611-00 Fraser Surrey Docks Direct Coal Transfer Facility Air Dispersion Modelling Assessment
69
• Predicted air quality impacts at the residential neighbourhoods in the vicinity of FSD are very low. Predicted pollutant concentrations with background concentrations added remain below all AAQOs.
File: EE12-1611-00 Fraser Surrey Docks Direct Coal Transfer Facility Air Dispersion Modelling Assessment
70
APPENDIX A: CALMET QA/QC

File: EE12-1611-00 Fraser Surrey Docks Direct Coal Transfer Facility Air Dispersion Modelling Assessment
71
A-1. LOCAL CLIMATE AND METEOROLOGY
To assess the local climate in the area of the FSD site, 30-year climate normals were obtained from the Meteorological Service of Canada (MSC) for Vancouver International Airport (YVR). The meteorological fields generated by the CALMET model were compared to these climate normals and to observed YVR meteorological data for the June 13, 2000 – July 7, 2001 modelling period, in order to determine the suitability of the CALMET data for the dispersion modelling.
A-1.1 TEMPERATURE
Ambient temperatures recorded at T13 North Delta from 1992 - 2011, and for the 2000-2001 modelling period are shown in Figure A-1 and Figure A-2. The temperatures extracted from the CALMET output near the FSD site are shown in Figure A-3. The mean daily temperatures listed in the figures were calculated by averaging the daily mean temperature over the entire monitoring period for each month. The mean daily maximum and minimum temperatures were calculated by averaging daily maximum and minimum temperatures for the month. The extreme maximum and minimum temperatures are the maximum and minimum temperatures for the monthly period.
The mean, maximum and minimum extracted CALMET temperatures are within the climate normals for the area as outlined by the data from T13 North Delta, and are in good agreement with the observed temperatures for the 2000-2001 modelling period. Thus, the temperature data set employed in this analysis is a good representation of statistically normal conditions for the air shed.

File: EE12-1611-00 Fraser Surrey Docks Direct Coal Transfer Facility Air Dispersion Modelling Assessment
72
Figure A-1 Temperature Normals for T13 North Delta (1992-2011)
-30
-20
-10
0
10
20
30
40
Jan Feb Mar Apr May Jun Jul Aug Sep Oct Nov Dec
Te
mp
era
ture
( C
)
Extreme Maximum
Average Daily Maximum
Average Daily
Average Daily Minimum
Extreme Minimum
0C

File: EE12-1611-00 Fraser Surrey Docks Direct Coal Transfer Facility Air Dispersion Modelling Assessment
73
Figure A-2 2000-2001 Temperature Observations for T 13 North Delta
-30
-20
-10
0
10
20
30
40
Jan Feb Mar Apr May Jun Jul Aug Sep Oct Nov Dec
Te
mp
era
ture
( C
)
Extreme Maximum
Average Daily Maximum
Average Daily
Average Daily Minimum
Extreme Minimum
0C
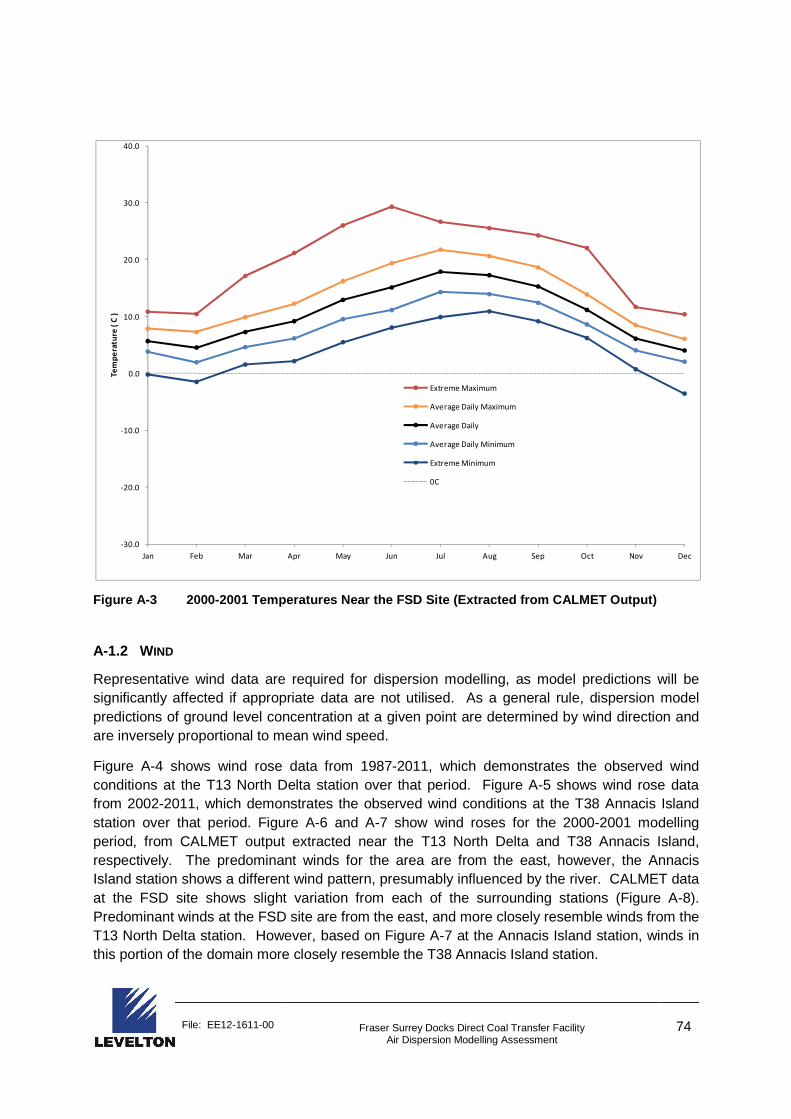
File: EE12-1611-00 Fraser Surrey Docks Direct Coal Transfer Facility Air Dispersion Modelling Assessment
74
Figure A-3 2000-2001 Temperatures Near the FSD Site (Extracted from CALMET Output)
A-1.2 WIND
Representative wind data are required for dispersion modelling, as model predictions will be significantly affected if appropriate data are not utilised. As a general rule, dispersion model predictions of ground level concentration at a given point are determined by wind direction and are inversely proportional to mean wind speed.
Figure A-4 shows wind rose data from 1987-2011, which demonstrates the observed wind conditions at the T13 North Delta station over that period. Figure A-5 shows wind rose data from 2002-2011, which demonstrates the observed wind conditions at the T38 Annacis Island station over that period. Figure A-6 and A-7 show wind roses for the 2000-2001 modelling period, from CALMET output extracted near the T13 North Delta and T38 Annacis Island, respectively. The predominant winds for the area are from the east, however, the Annacis Island station shows a different wind pattern, presumably influenced by the river. CALMET data at the FSD site shows slight variation from each of the surrounding stations (Figure A-8). Predominant winds at the FSD site are from the east, and more closely resemble winds from the T13 North Delta station. However, based on Figure A-7 at the Annacis Island station, winds in this portion of the domain more closely resemble the T38 Annacis Island station.
-30.0
-20.0
-10.0
0.0
10.0
20.0
30.0
40.0
Jan Feb Mar Apr May Jun Jul Aug Sep Oct Nov Dec
Te
mp
era
ture
( C
)
Extreme Maximum
Average Daily Maximum
Average Daily
Average Daily Minimum
Extreme Minimum
0C
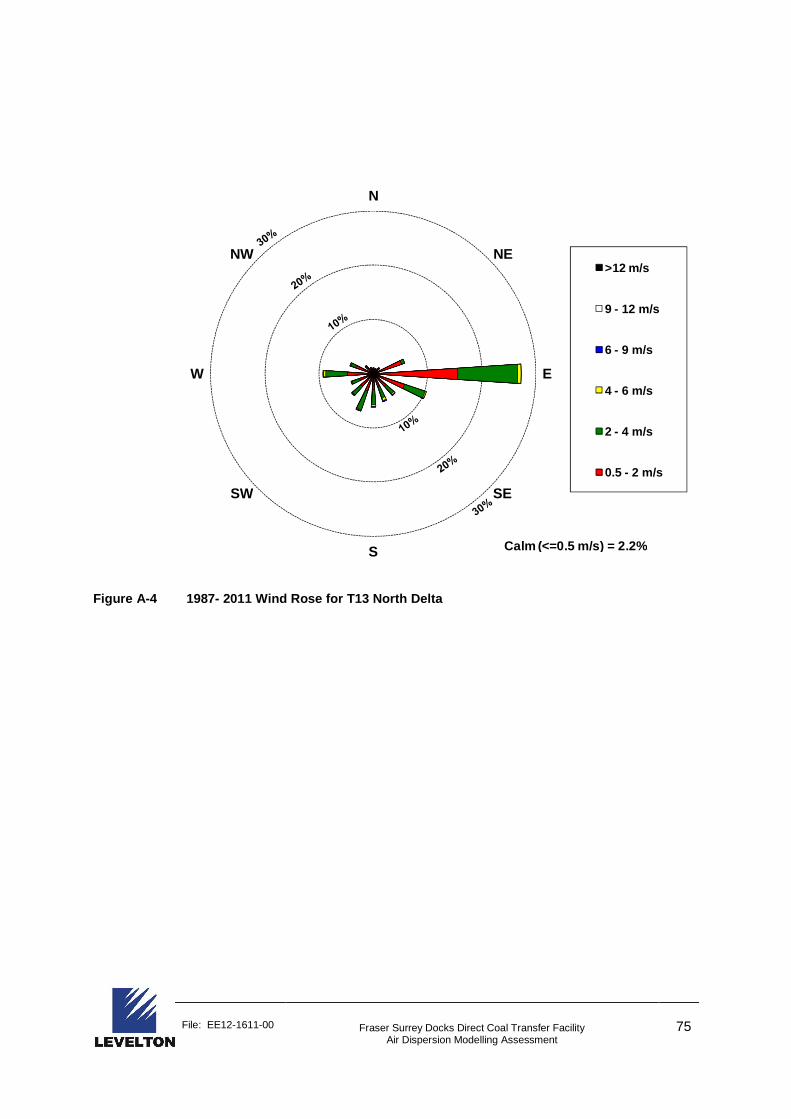
File: EE12-1611-00 Fraser Surrey Docks Direct Coal Transfer Facility Air Dispersion Modelling Assessment
75
Figure A-4 1987- 2011 Wind Rose for T13 North Delt a
N
NE
E
SE
S
SW
W
NW>12 m/s
9 - 12 m/s
6 - 9 m/s
4 - 6 m/s
2 - 4 m/s
0.5 - 2 m/s
Calm (<=0.5 m/s) = 2.2%
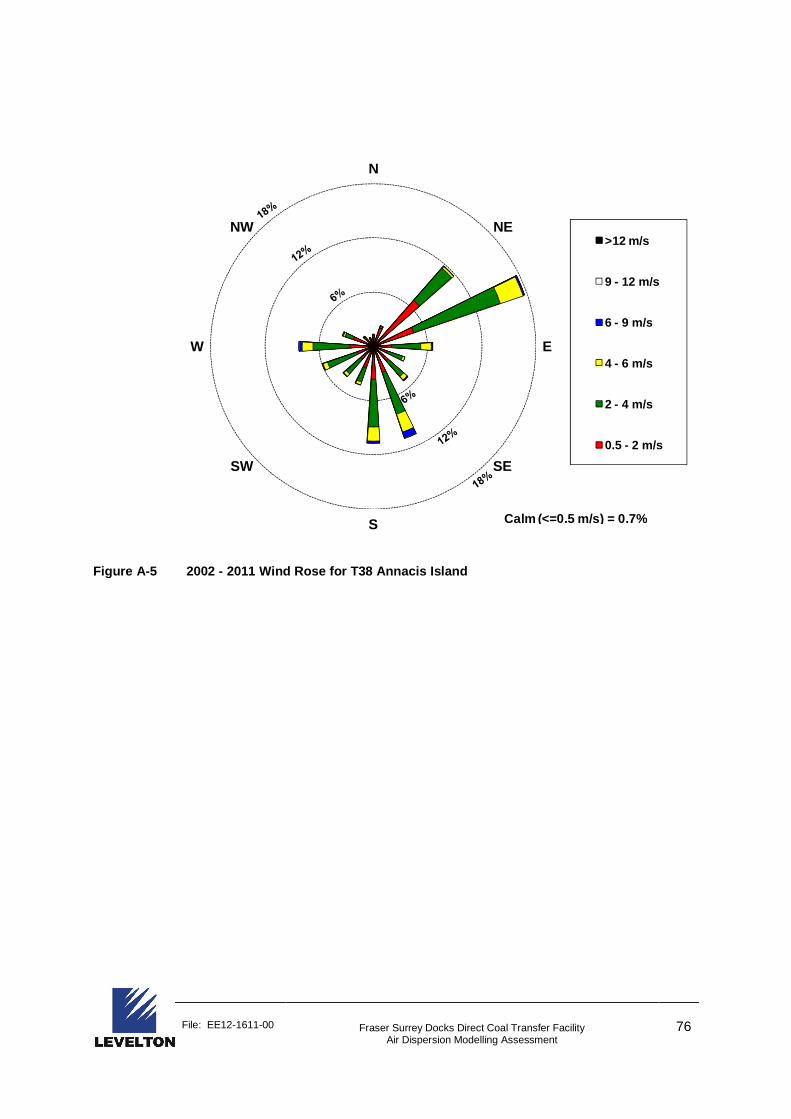
File: EE12-1611-00 Fraser Surrey Docks Direct Coal Transfer Facility Air Dispersion Modelling Assessment
76
Figure A-5 2002 - 2011 Wind Rose for T38 Annacis Is land
N
NE
E
SE
S
SW
W
NW>12 m/s
9 - 12 m/s
6 - 9 m/s
4 - 6 m/s
2 - 4 m/s
0.5 - 2 m/s
Calm (<=0.5 m/s) = 0.7%
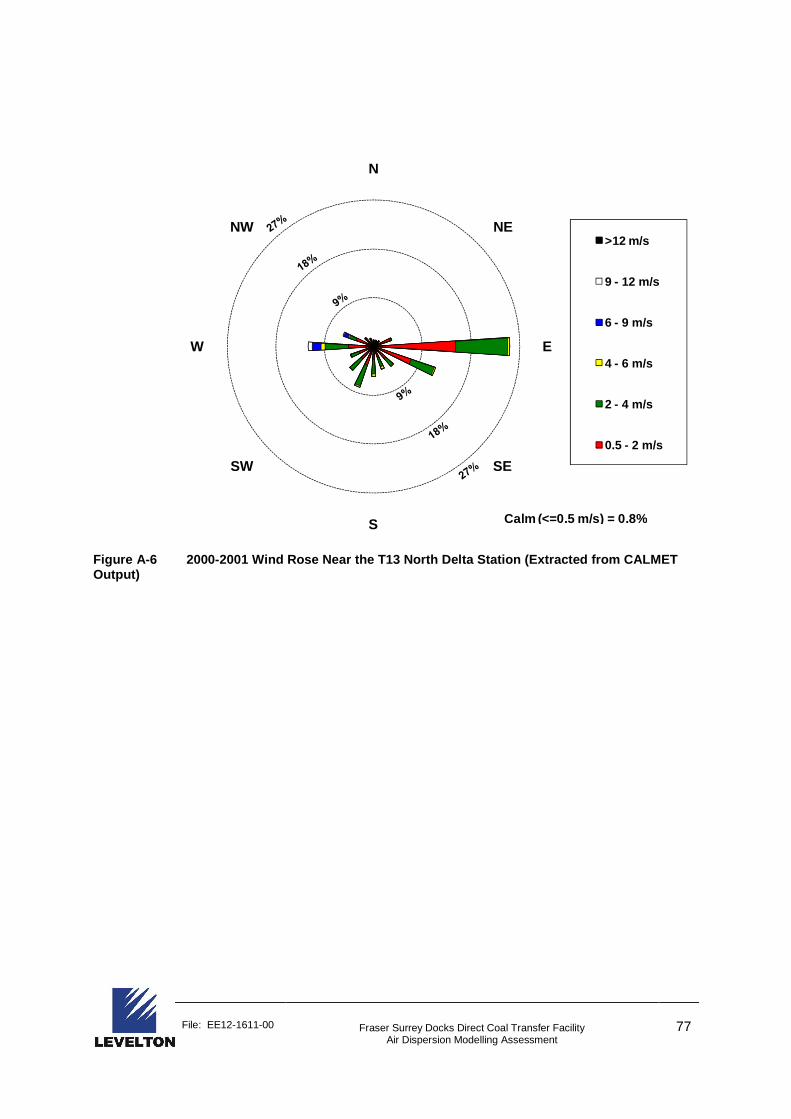
File: EE12-1611-00 Fraser Surrey Docks Direct Coal Transfer Facility Air Dispersion Modelling Assessment
77
Figure A-6 2000-2001 Wind Rose Near the T13 North D elta Station (Extracted from CALMET Output)
N
NE
E
SE
S
SW
W
NW>12 m/s
9 - 12 m/s
6 - 9 m/s
4 - 6 m/s
2 - 4 m/s
0.5 - 2 m/s
Calm (<=0.5 m/s) = 0.8%

File: EE12-1611-00 Fraser Surrey Docks Direct Coal Transfer Facility Air Dispersion Modelling Assessment
78
Figure A-7 2000-2001 Wind Rose Near the T38 Annacis Island Station (Extracted from CALMET Output)
N
NE
E
SE
S
SW
W
NW>12 m/s
9 - 12 m/s
6 - 9 m/s
4 - 6 m/s
2 - 4 m/s
0.5 - 2 m/s
Calm (<=0.5 m/s) = 10.6%

File: EE12-1611-00 Fraser Surrey Docks Direct Coal Transfer Facility Air Dispersion Modelling Assessment
79
Figure A-8 2000-2001 Wind Rose Near FSD Site (Extra cted from CALMET Output)
A-1.3 CONCLUSION FROM COMPARISON OF METEOROLOGICAL DATA TO CLIMATE NORMALS
A comparison of the CALMET extracted wind rose for the FSD site shows agreement with the wind patterns typically observed at the T13 North Delta station. The discrepancy in wind speeds between the FSD extracted point and the T38 Annacis Island station is due to the mid river siting of the T38 stations, which leads to stronger winds influenced by the river channel. The other meteorological parameters are in good agreement with the observed data. Hence modelling using 2000-2001 observations is sufficient to assess the potential impacts of the FSD emissions on ground level pollutant concentrations in the area. Utilising more meteorological data or subsequent years of meteorology would likely not provide greater insight into the maximum predicted pollutant concentrations and their frequency of occurrence.
N
NE
E
SE
S
SW
W
NW>12 m/s
9 - 12 m/s
6 - 9 m/s
4 - 6 m/s
2 - 4 m/s
0.5 - 2 m/s
Calm (<=0.5 m/s) = 6.0%

File: EE12-1611-00 Fraser Surrey Docks Direct Coal Transfer Facility Air Dispersion Modelling Assessment
80
A-2. MODELLING METHODOLOGY
A-2.1 MODEL SELECTION
CALPUFF is a suite of numerical models (CALMET, CALPUFF, and CALPOST) that are used in series to determine the impact of emissions in the vicinity of a source or group of sources. Detailed three-dimensional meteorological fields are produced by the diagnostic computer model CALMET, based on surface, marine (optional) and upper air weather data, digital land use data, terrain data, and prognostic meteorological data (optional). The three-dimensional fields produced by CALMET are used by CALPUFF, a three-dimensional, multi-species, non-steady-state Gaussian puff dispersion model that can simulate the effects of time and space varying meteorological conditions on pollutant transport. Finally CALPOST, a statistical processing program, is used to summarize and tabulate the pollutant concentrations calculated by CALPUFF.
A-2.2 CALMET
The CALMET (version 5.8, EPA approved) model was executed to calculate meteorological fields for the period from June 13, 2000 to July 7, 2001. This modelling period was chosen in order to utilize available three-dimensional prognostic meteorological data from the Mesoscale Compressible Community (MC2) model, provided by the University of British Columbia, to improve the performance of the CALMET model. Meteorological input data was used from 17 surface stations and two upper air stations. The meteorological data and CALMET output for this modelling period were analysed and compared with climate normals to ensure that this modelling period is climatologically representative, as discussed in Section B-1. A description of the CALMET methods and data sets follows. This methodology presented in this section applies to the original modelling domain. Identical methodology applies to the larger domain used for NO2 modelling.
A-2.2.1 CALMET Modelling Domain
The Universal Transverse Mercator (UTM, NAD 83) co-ordinate system was used for this model application. The CALMET domain was a 35 km by 35 km area, as shown in Figure A-9. The extracted MC2 domain encompassed a slightly larger area around the CALMET domain. Within the CALMET modelling domain a 250 m grid resolution was used. The CALMET modelling domain and grid resolution were chosen to encompass the main topographical features for generating the CALMET three-dimensional diagnostic meteorological fields. On the vertical axis, nine atmospheric layers were included in order to capture the expected paths of the plumes from the modelled source. The heights of these layers are given in Table A-1.
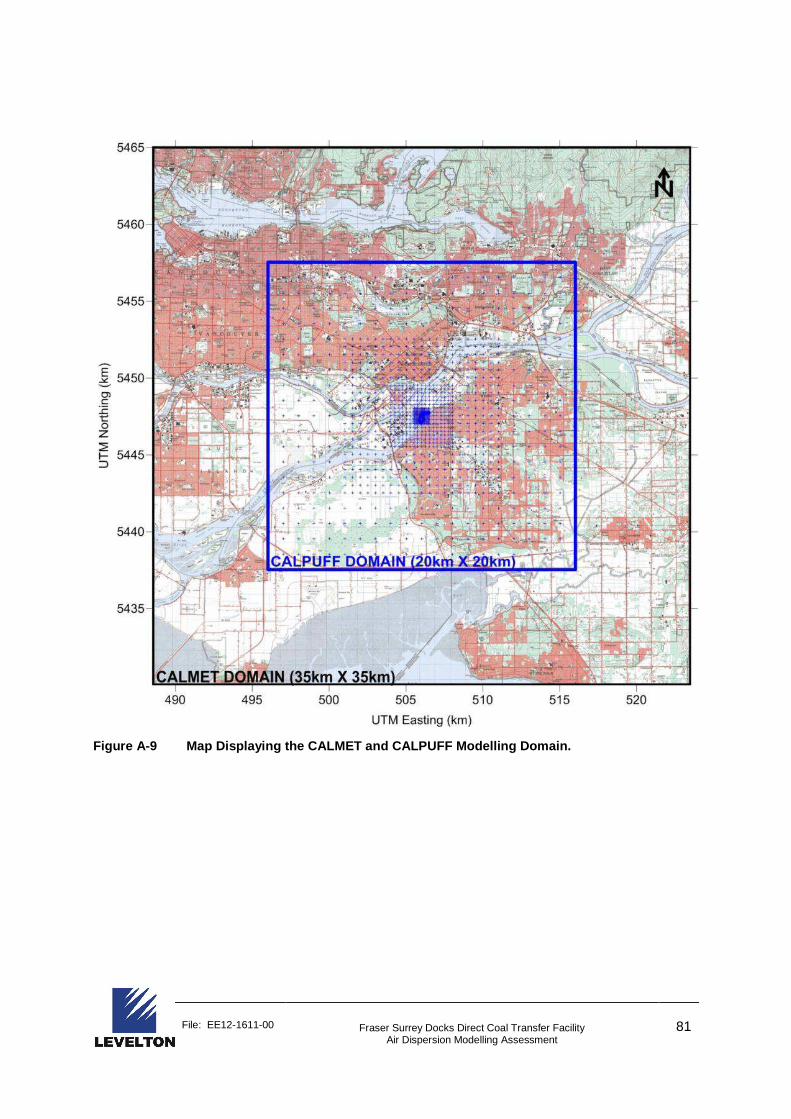
File: EE12-1611-00 Fraser Surrey Docks Direct Coal Transfer Facility Air Dispersion Modelling Assessment
81
Figure A-9 Map Displaying the CALMET and CALPUFF Mo delling Domain.
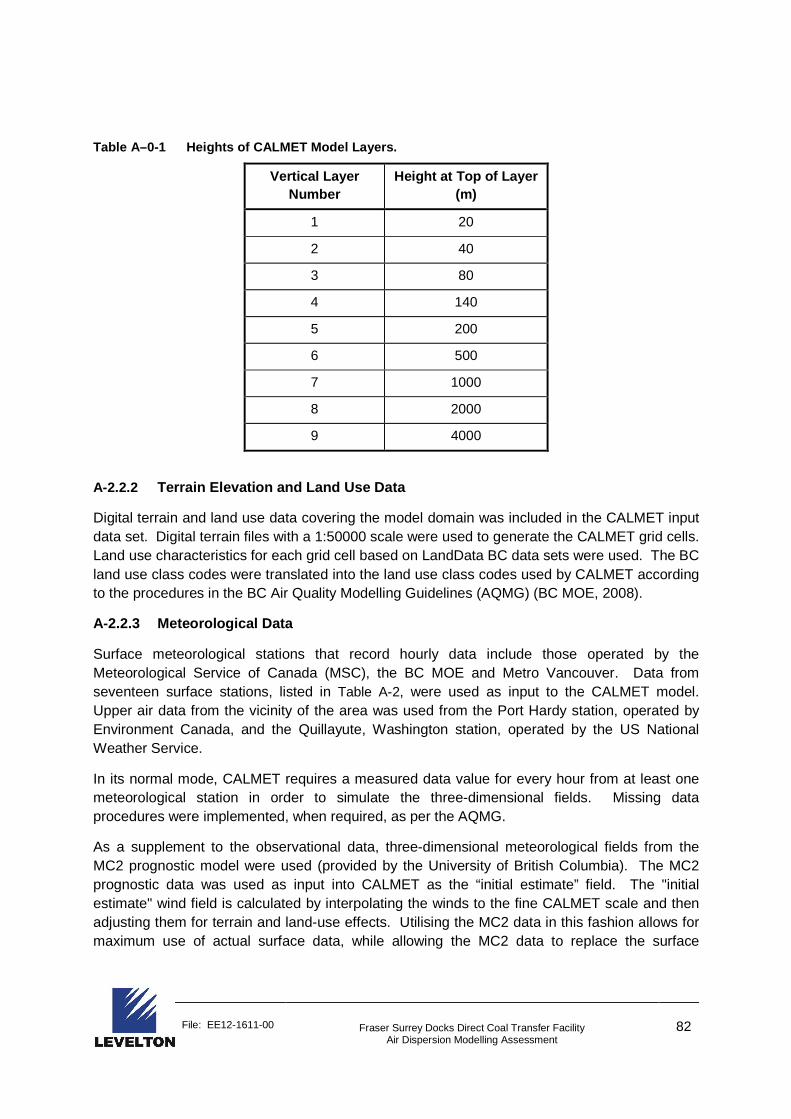
File: EE12-1611-00 Fraser Surrey Docks Direct Coal Transfer Facility Air Dispersion Modelling Assessment
82
Table A–0-1 Heights of CALMET Model Layers.
Vertical Layer Number
Height at Top of Layer (m)
1 20
2 40
3 80
4 140
5 200
6 500
7 1000
8 2000
9 4000
A-2.2.2 Terrain Elevation and Land Use Data
Digital terrain and land use data covering the model domain was included in the CALMET input data set. Digital terrain files with a 1:50000 scale were used to generate the CALMET grid cells. Land use characteristics for each grid cell based on LandData BC data sets were used. The BC land use class codes were translated into the land use class codes used by CALMET according to the procedures in the BC Air Quality Modelling Guidelines (AQMG) (BC MOE, 2008).
A-2.2.3 Meteorological Data
Surface meteorological stations that record hourly data include those operated by the Meteorological Service of Canada (MSC), the BC MOE and Metro Vancouver. Data from seventeen surface stations, listed in Table A-2, were used as input to the CALMET model. Upper air data from the vicinity of the area was used from the Port Hardy station, operated by Environment Canada, and the Quillayute, Washington station, operated by the US National Weather Service.
In its normal mode, CALMET requires a measured data value for every hour from at least one meteorological station in order to simulate the three-dimensional fields. Missing data procedures were implemented, when required, as per the AQMG.
As a supplement to the observational data, three-dimensional meteorological fields from the MC2 prognostic model were used (provided by the University of British Columbia). The MC2 prognostic data was used as input into CALMET as the “initial estimate” field. The "initial estimate" wind field is calculated by interpolating the winds to the fine CALMET scale and then adjusting them for terrain and land-use effects. Utilising the MC2 data in this fashion allows for maximum use of actual surface data, while allowing the MC2 data to replace the surface
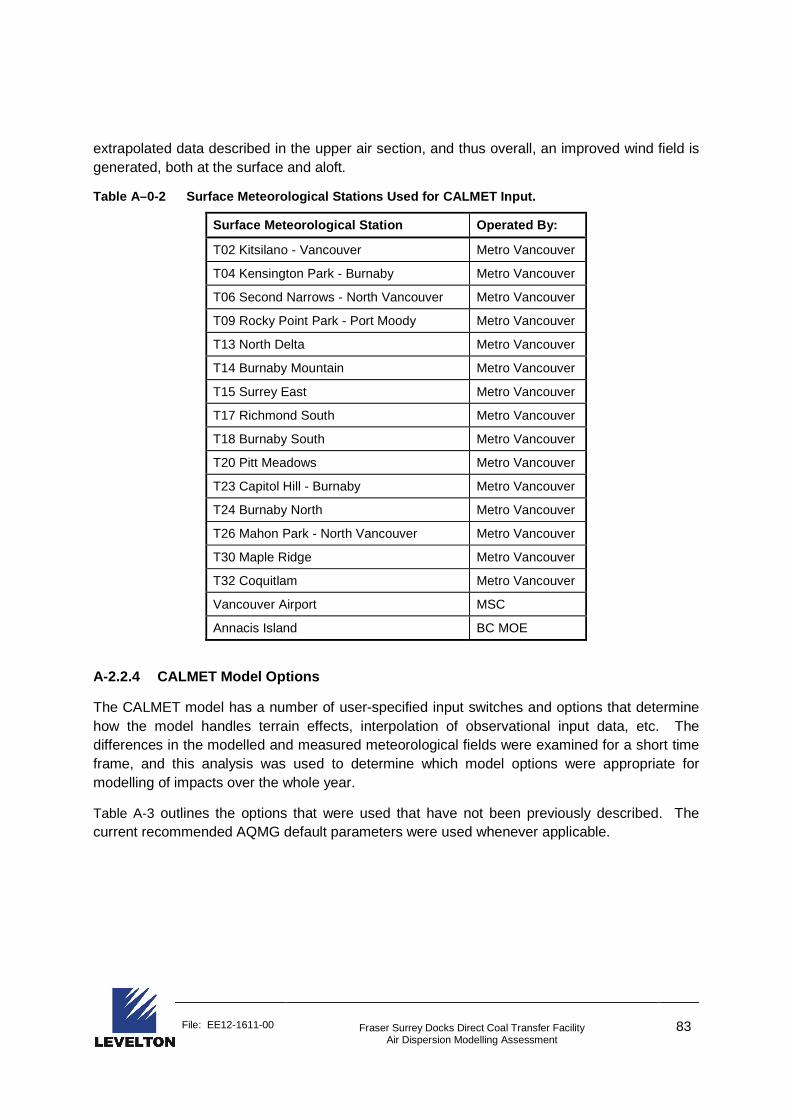
File: EE12-1611-00 Fraser Surrey Docks Direct Coal Transfer Facility Air Dispersion Modelling Assessment
83
extrapolated data described in the upper air section, and thus overall, an improved wind field is generated, both at the surface and aloft.
Table A–0-2 Surface Meteorological Stations Used fo r CALMET Input.
Surface Meteorological Station Operated By:
T02 Kitsilano - Vancouver Metro Vancouver
T04 Kensington Park - Burnaby Metro Vancouver
T06 Second Narrows - North Vancouver Metro Vancouver
T09 Rocky Point Park - Port Moody Metro Vancouver
T13 North Delta Metro Vancouver
T14 Burnaby Mountain Metro Vancouver
T15 Surrey East Metro Vancouver
T17 Richmond South Metro Vancouver
T18 Burnaby South Metro Vancouver
T20 Pitt Meadows Metro Vancouver
T23 Capitol Hill - Burnaby Metro Vancouver
T24 Burnaby North Metro Vancouver
T26 Mahon Park - North Vancouver Metro Vancouver
T30 Maple Ridge Metro Vancouver
T32 Coquitlam Metro Vancouver
Vancouver Airport MSC
Annacis Island BC MOE
A-2.2.4 CALMET Model Options
The CALMET model has a number of user-specified input switches and options that determine how the model handles terrain effects, interpolation of observational input data, etc. The differences in the modelled and measured meteorological fields were examined for a short time frame, and this analysis was used to determine which model options were appropriate for modelling of impacts over the whole year.
Table A-3 outlines the options that were used that have not been previously described. The current recommended AQMG default parameters were used whenever applicable.
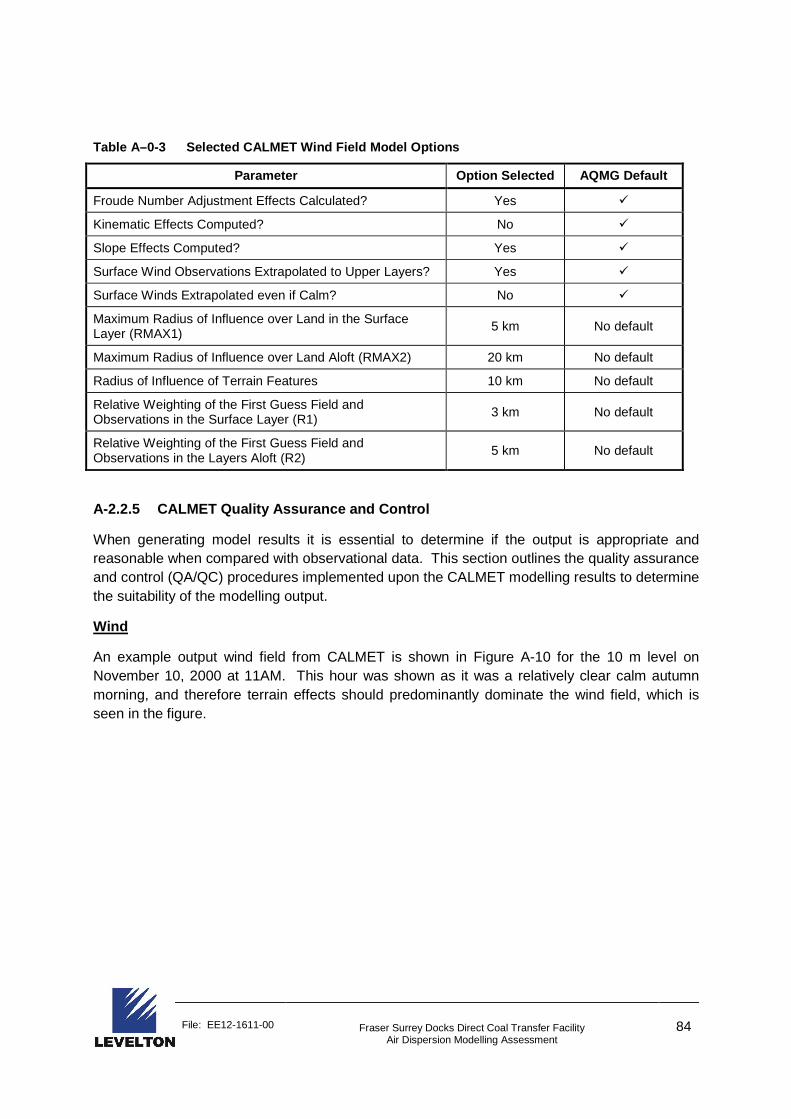
File: EE12-1611-00 Fraser Surrey Docks Direct Coal Transfer Facility Air Dispersion Modelling Assessment
84
Table A–0-3 Selected CALMET Wind Field Model Option s
Parameter Option Selected AQMG Default
Froude Number Adjustment Effects Calculated? Yes �
Kinematic Effects Computed? No �
Slope Effects Computed? Yes �
Surface Wind Observations Extrapolated to Upper Layers? Yes �
Surface Winds Extrapolated even if Calm? No �
Maximum Radius of Influence over Land in the Surface Layer (RMAX1)
5 km No default
Maximum Radius of Influence over Land Aloft (RMAX2) 20 km No default
Radius of Influence of Terrain Features 10 km No default
Relative Weighting of the First Guess Field and Observations in the Surface Layer (R1) 3 km No default
Relative Weighting of the First Guess Field and Observations in the Layers Aloft (R2)
5 km No default
A-2.2.5 CALMET Quality Assurance and Control
When generating model results it is essential to determine if the output is appropriate and reasonable when compared with observational data. This section outlines the quality assurance and control (QA/QC) procedures implemented upon the CALMET modelling results to determine the suitability of the modelling output.
Wind
An example output wind field from CALMET is shown in Figure A-10 for the 10 m level on November 10, 2000 at 11AM. This hour was shown as it was a relatively clear calm autumn morning, and therefore terrain effects should predominantly dominate the wind field, which is seen in the figure.
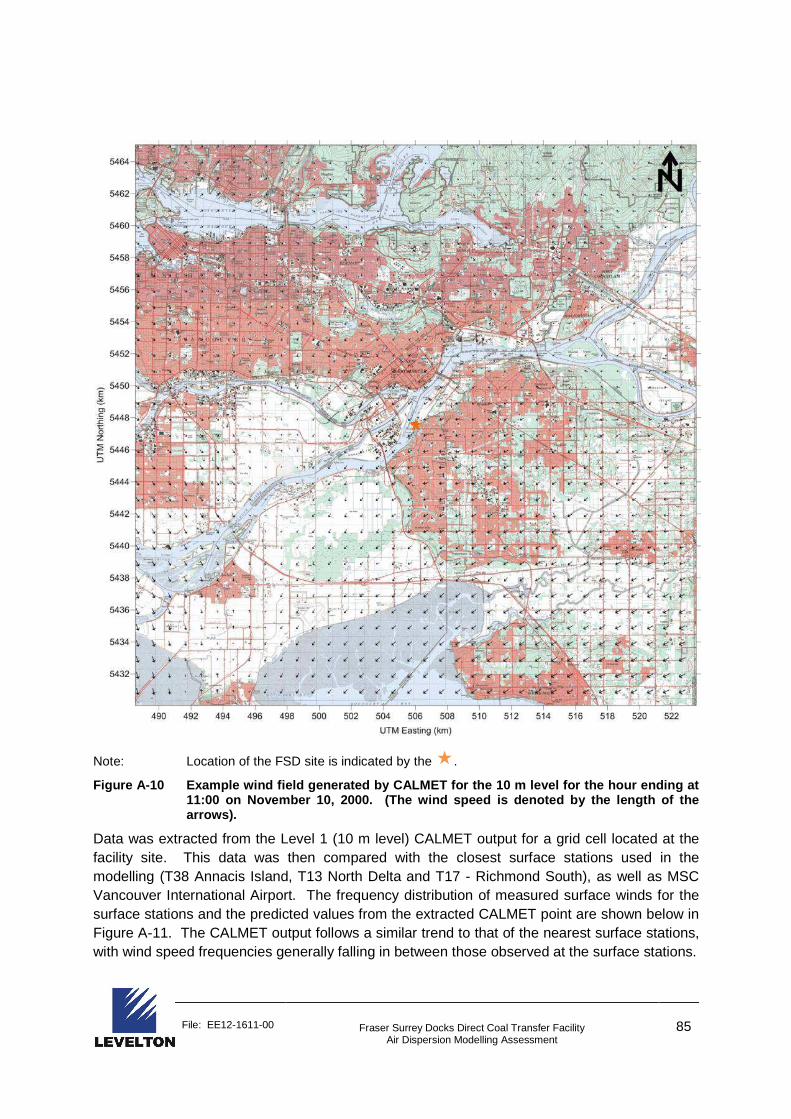
File: EE12-1611-00 Fraser Surrey Docks Direct Coal Transfer Facility Air Dispersion Modelling Assessment
85
Note: Location of the FSD site is indicated by the �.
Figure A-10 Example wind field generated by CALMET for the 10 m level for the hour ending at 11:00 on November 10, 2000. (The wind speed is den oted by the length of the arrows).
Data was extracted from the Level 1 (10 m level) CALMET output for a grid cell located at the facility site. This data was then compared with the closest surface stations used in the modelling (T38 Annacis Island, T13 North Delta and T17 - Richmond South), as well as MSC Vancouver International Airport. The frequency distribution of measured surface winds for the surface stations and the predicted values from the extracted CALMET point are shown below in Figure A-11. The CALMET output follows a similar trend to that of the nearest surface stations, with wind speed frequencies generally falling in between those observed at the surface stations.

File: EE12-1611-00 Fraser Surrey Docks Direct Coal Transfer Facility Air Dispersion Modelling Assessment
86
Figure A-11 Frequency distribution of surface (10 m level) winds for surface stations and the near the FSD site (CALMET).
Figure A-12 and Figure A-13 below show monthly and diurnal variations respectively for the surface stations and the extracted CALMET point. The extracted point falls between the values measured at the surface stations, and follows similar trends to the nearby Richmond South station.
0%
10%
20%
30%
40%
50%
60%
0 - 1.5 1.5 - 3 3 - 4 4 - 5 5 - 7 7 - 10 10 - 15 > 15
Fre
quen
cy (
%)
Wind Speed Class (m/s)
T38 Annacis Island
T17 Richmond South
YVR Vancouver Airport
Calmet Extracted (Fraser Surrey Docks)
T13 North Delta

File: EE12-1611-00 Fraser Surrey Docks Direct Coal Transfer Facility Air Dispersion Modelling Assessment
87
Figure A-12 Average monthly wind speeds at surface (10 m level) for surface stations and the FSD site (CALMET).
0.0
1.0
2.0
3.0
4.0
5.0
6.0
Jun Jul Aug Sep Oct Nov Dec Jan Feb Mar Apr May All
Ave
rage
Win
d S
peed
(m
/s)
Month
T38 Annacis Island
T17 Richmond South
T13 North Delta
YVR Vancouver Airport
Calmet Extracted (Fraser Surrey Docks)
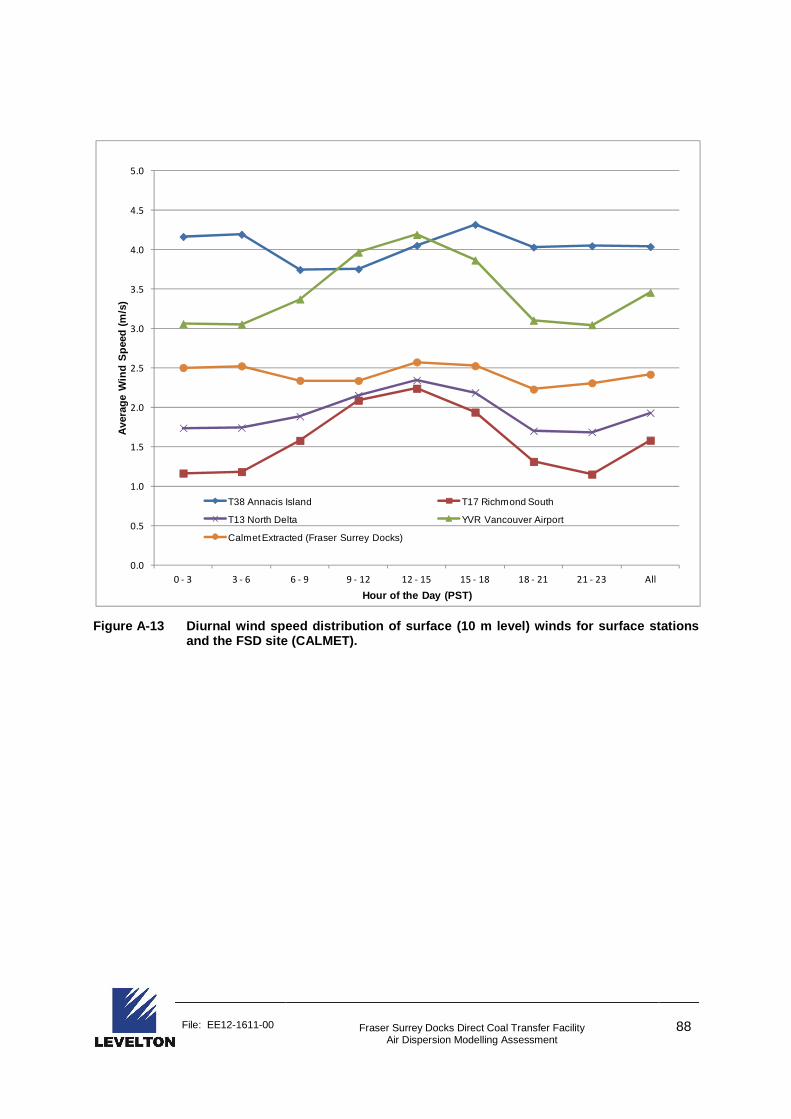
File: EE12-1611-00 Fraser Surrey Docks Direct Coal Transfer Facility Air Dispersion Modelling Assessment
88
Figure A-13 Diurnal wind speed distribution of surf ace (10 m level) winds for surface stations and the FSD site (CALMET).
0.0
0.5
1.0
1.5
2.0
2.5
3.0
3.5
4.0
4.5
5.0
0 - 3 3 - 6 6 - 9 9 - 12 12 - 15 15 - 18 18 - 21 21 - 23 All
Ave
rage
Win
d S
peed
(m
/s)
Hour of the Day (PST)
T38 Annacis Island T17 Richmond South
T13 North Delta YVR Vancouver Airport
Calmet Extracted (Fraser Surrey Docks)
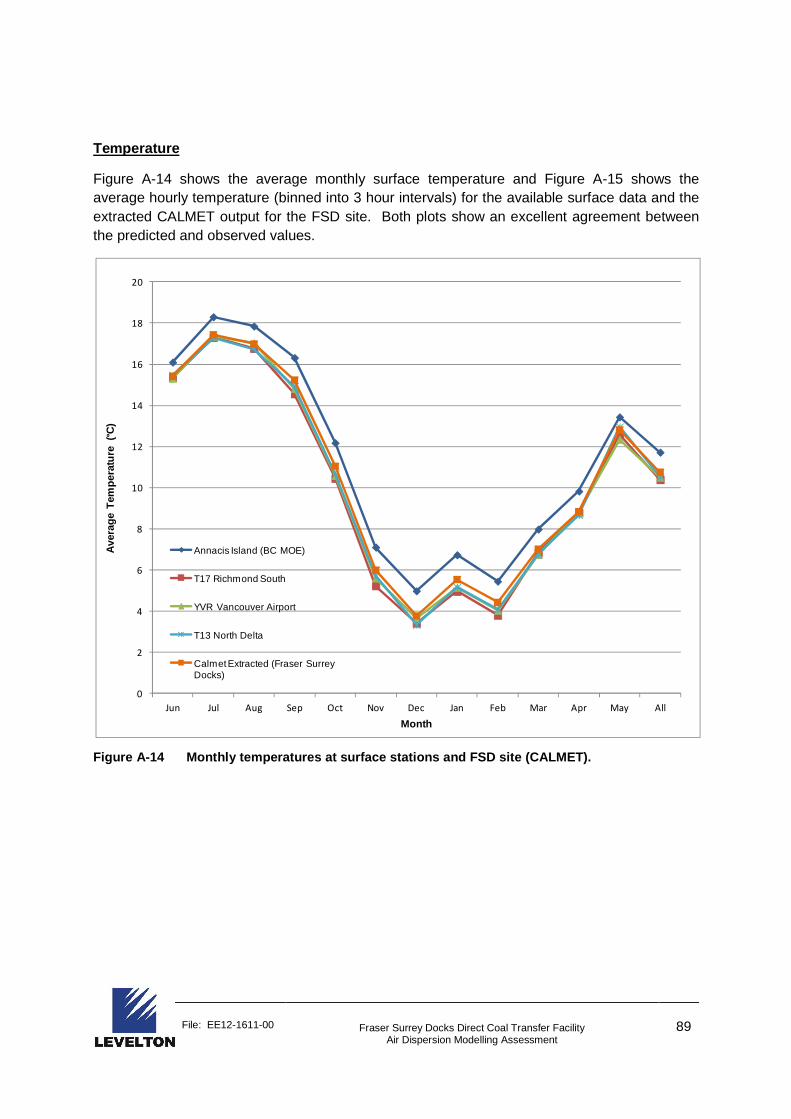
File: EE12-1611-00 Fraser Surrey Docks Direct Coal Transfer Facility Air Dispersion Modelling Assessment
89
Temperature
Figure A-14 shows the average monthly surface temperature and Figure A-15 shows the average hourly temperature (binned into 3 hour intervals) for the available surface data and the extracted CALMET output for the FSD site. Both plots show an excellent agreement between the predicted and observed values.
Figure A-14 Monthly temperatures at surface station s and FSD site (CALMET).
0
2
4
6
8
10
12
14
16
18
20
Jun Jul Aug Sep Oct Nov Dec Jan Feb Mar Apr May All
Ave
rage
Tem
pera
ture
(°C
)
Month
Annacis Island (BC MOE)
T17 Richmond South
YVR Vancouver Airport
T13 North Delta
Calmet Extracted (Fraser Surrey Docks)

File: EE12-1611-00 Fraser Surrey Docks Direct Coal Transfer Facility Air Dispersion Modelling Assessment
90
Figure A-15 Hourly temperatures at surface stations and the FSD site (CALMET).
0
2
4
6
8
10
12
14
0 - 3 3 - 6 6 - 9 9 - 12 12 - 15 15 - 18 18 - 21 21 - 23 All
Ave
rage
Tem
pera
ture
(°C
)
Hour of the Day (PST)
Annacis Island (BC MOE)
T17 Richmond South
YVR Vancouver Airport
Calmet Extracted (Fraser Surrey Docks)
T13 North Delta

File: EE12-1611-00 Fraser Surrey Docks Direct Coal Transfer Facility Air Dispersion Modelling Assessment
91
Stability Class
The frequency distribution of predicted stability for the FSD site was compared with the calculated stability for Vancouver Airport (YVR). YVR was used as the other surface stations used in the modelling did not have the required parameters to determine stability. As seen in Figure A-16, the extracted CALMET data is in good agreement with the calculated stability from YVR.
Figure A-16 Frequency distribution of stability cla sses calculated for Vancouver Airport (YVR) and the FSD site (CALMET) for the modelling period.
0%
10%
20%
30%
40%
50%
60%
1 2 3 4 5 6
Fre
quen
cy (
%)
Stability Class
YVR Vancouver Airport (Calculated)
Calmet Extracted (Fraser Surrey Docks)
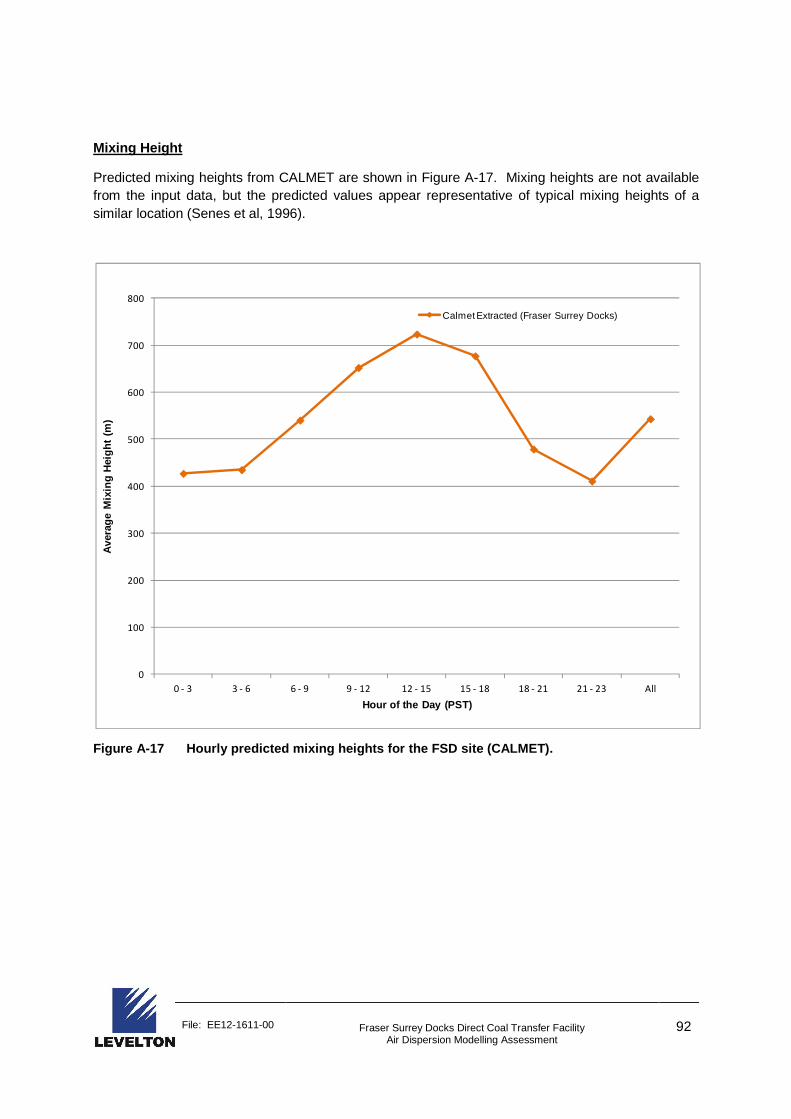
File: EE12-1611-00 Fraser Surrey Docks Direct Coal Transfer Facility Air Dispersion Modelling Assessment
92
Mixing Height
Predicted mixing heights from CALMET are shown in Figure A-17. Mixing heights are not available from the input data, but the predicted values appear representative of typical mixing heights of a similar location (Senes et al, 1996).
Figure A-17 Hourly predicted mixing heights for the FSD site (CALMET).
0
100
200
300
400
500
600
700
800
0 - 3 3 - 6 6 - 9 9 - 12 12 - 15 15 - 18 18 - 21 21 - 23 All
Ave
rage
Mix
ing
Hei
ght
(m)
Hour of the Day (PST)
Calmet Extracted (Fraser Surrey Docks)

File: EE12-1611-00 Fraser Surrey Docks Direct Coal Transfer Facility Air Dispersion Modelling Assessment
93
A-3. REFERENCES
BC Ministry of Environment (Environmental Protection Division, Water Air Climate Change Branch, Air Protection Section), 2008, “Guidelines for Air Quality Dispersion Modelling in British Columbia".
Scire, Joseph S. et al., 2000a, “A User’s Guide for the CALMET Meteorological Model (Version 5)”, Earth Tech Inc.
Senes et al, 1996, “A Mixing Height Study for North America (1987 – 1991)”
File: EE12-1611-00 Fraser Surrey Docks Direct Coal Transfer Facility Air Dispersion Modelling Assessment
94
APPENDIX B: EXAMPLE VISUAL SITE INSPECTION FORM
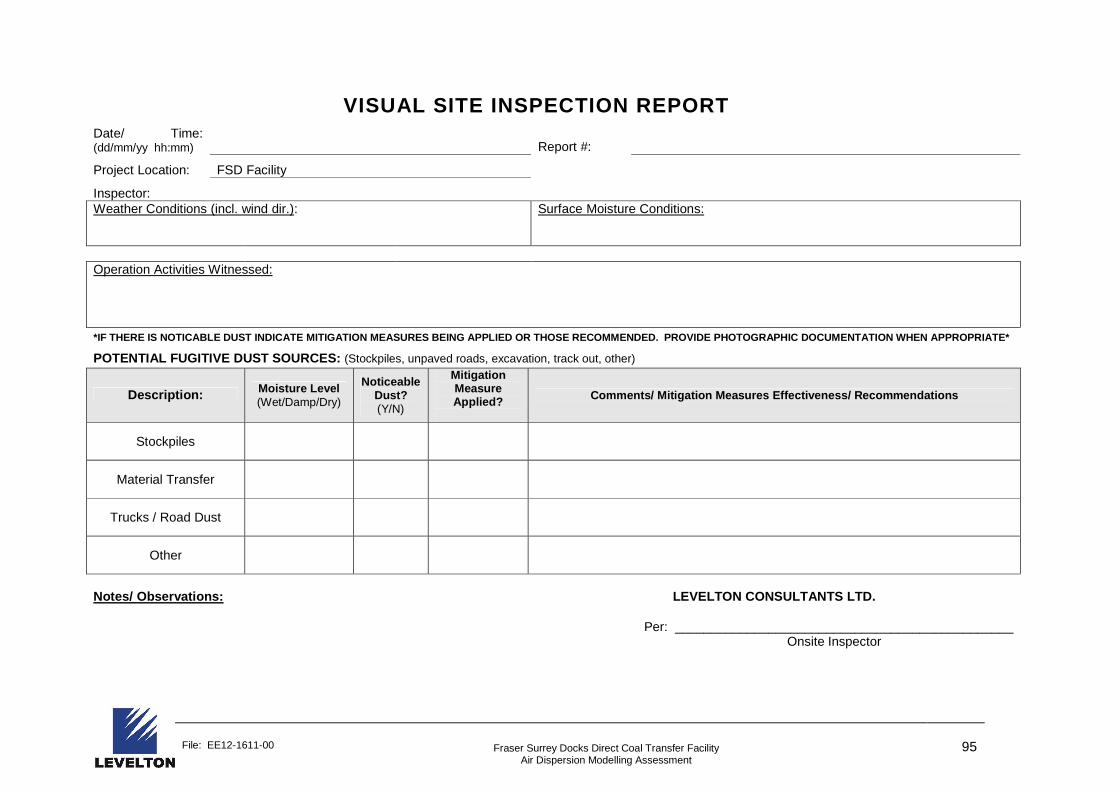
File: EE12-1611-00 Fraser Surrey Docks Direct Coal Transfer Facility Air Dispersion Modelling Assessment
95
VISUAL SITE INSPECTION REPORT Date/ Time: (dd/mm/yy hh:mm) Report #:
Project Location: FSD Facility
Inspector: Weather Conditions (incl. wind dir.): Surface Moisture Conditions:
Operation Activities Witnessed:
*IF THERE IS NOTICABLE DUST INDICATE MITIGATION MEA SURES BEING APPLIED OR THOSE RECOMMENDED. PROVIDE PHOTOGRAPHIC DOCUMENTATION WHEN APPROPRIATE*
POTENTIAL FUGITIVE DUST SOURCES: (Stockpiles, unpaved roads, excavation, track out, other)
Description: Moisture Level (Wet/Damp/Dry)
Noticeable Dust? (Y/N)
Mitigation Measure Applied?
Comments/ Mitigation Measures Effectiveness/ Recomm endations
Stockpiles
Material Transfer
Trucks / Road Dust
Other
Notes/ Observations:
LEVELTON CONSULTANTS LTD.
Per: _______________________________________________
Onsite Inspector